structure-based enzyme inhibition mechanism studies of … · 2017-10-02 · - 1 - structure-based...
TRANSCRIPT

- 1 -
Structure-based enzyme inhibition mechanism studies
of kaempferol and its prenylated derivatives as aldose
reductase inhibitors using kinetics and molecular
docking modeling
Hyun Ah Jung1*, Hye Eun Moon
2, Sang Ho Oh
3, Byung-Woo Kim
4, Hee Sook
Sohn1, Sook-Bae Kim
1, Jae Sue Choi
2,4*
1Department of Food Science and Human Nutrition, Chonbuk National University;
Jeonju 561-756, Republic of Korea
2Department of Food Science and Nutrition, Pukyong National University 608-737,
Republic of Korea
3Korean BioInformation Center (KOBIC), Daejeon 305-806, Republic of Korea
4Blue-Bio Industry RIC, Dongeui University; Busan 614-714, Republic of Korea
*Correspondence : [email protected]; [email protected]
*These authors contributed equally to this work
Email addresses:
HAJ: [email protected]; HEM: [email protected];
SHO: [email protected]; BWK: [email protected];
HSS: [email protected]; SBK: [email protected];
JSC: [email protected]

- 2 -
Abstract
Background: Aldose reductase inhibitors (ARIs) suppressing the hyperglycemia-
induced polyol pathway have been provided as potential therapeutic candidates in the
treatment and prevention of diabetic complications. It was previously reported that
prenylated flavonols such as desmethylanhydroicaritin (1) and sophoflavescenol (2)
from Sophora flavescens are promising inhibitors of rat lens aldose reductase (RLAR)
and human recombinant aldose reductase (HRAR). Based upon structure–activity
relationships, 3,4′-dihydroxy flavonols with a prenyl or lavandulyl group at the C-8
position and a hydroxyl or methoxy group at the C-5 position are important for AR
inhibition. In order to prove the above results, a combination of computational
prediction and enzyme kinetics has begun to emerge as an effective screening
technique for the potential.
Results: In the present study, we predicted the 3D structure of AR in human using a
docking algorithm to simulate binding between AR and prenylated flavonoids (1 and
2) and kaempferol (3) and scrutinized the reversible inhibition of AR by these
proteins. Docking simulation results of 1 ~ 3 demonstrated negative binding energies
(Autodock 4.0 = –9.11 to –7.64 kcal/mol; Fred 2.0 = –79.54 to –51.84 kcal/mol) and
an additional hydrogen bond through Phe122 and Trp219, in addition to the
previously proposed interaction of AR and phenolics through Trp20, Tyr48, His110,
and Trp111 residues, indicating that the presence of 8-prenyl and 5-methyl groups
might potentiate tighter binding to the active site of the enzyme and more effective
AR inhibitors. Moreover, types of RLAR inhibition were different depending on the
presence or absence of the 8-prenyl group, in that 1 and 2 are mixed inhibitors with

- 3 -
respective Ki values of 0.69 μM and 0.94 μM, while 3 showed noncompetitive
inhibition with a Ki value of 4.65 μM when analyzed with Dixon plots.
Conclusion: The present study suggests that an effective strategy for screening
potential AR inhibitors could be established by predicting 3D structural conformation
of prenyl flavonoids and the orientation within the enzyme as well as by
simultaneously determining the mode of enzyme inhibition.
- 4 -
Background
Long-term hyperglycemia in diabetes mellitus is considered to be the primary
instigator of the pathogenesis of long term diabetic complications, including
retinopathy, cataractogenesis, nephropathy, and neuropathy. To date, the pathogenesis
of diabetic complication has been explained by several possible mechanisms,
including increased aldose reductase (ALR2; EC 1.1.1.21)-related polyol pathway,
increased advanced glycation endproduct (AGE) formation, and excessive oxidative
stress [1]. ALR2 and aldehyde reductase (ALR1; EC 1.1.1.2), members of the aldo-
keto reductase superfamily, are NADPH-dependent oxidoreductases that catalyze the
reduction of a wide variety of aldehydes and ketones to their corresponding alcohols.
In particular, ALR2 is a key enzyme in the polyol pathway that catalyzes the
conversion of glucose to sorbitol in a hyperglycemic state [2]. ALR2 is found in
almost all mammalian cells and at high levels in some organs, such as the lens, retina,
and sciatic nerves, which are easily damaged by increased polyol pathway flux-related
diabetic complications and can cause cataract [3]. Cataractogenesis is the leading
cause of blindness in worldwide diabetic patients [4, 5]. Moreover, sorbitol and its
metabolites accumulate in the nerves, retina, and kidneys due to their poor penetration
across membranes and inefficient metabolism, resulting in the development of
diabetic complications, including retinopathy, neuropathy, and nephropathy [6]. Thus,
suppression of the hyperglycemia-induced polyol pathway flux by ALR2 inhibitors
(ARIs) may be a potential therapeutic opportunity in the treatment and prevention of
diabetic complications [7,8]. Additionally, ALR1 belongs to aldo-keto superfamily
that closely resemble to ALR2 but significantly different in the C-terminal loop (297-
315, 306-313) responsible for substrate and inhibitor specificity. ALR1 preferentially

- 5 -
metabolizes 3-deoxyglucosone and methylglyoxal, which are both reactive
intermediates for AGE formation and may account for some undesirable side effects
[9]. Therefore, it is necessary to exploit the specificity and selectivity of these two
homologues. In particular, the ability of ALR2 to reduce excess glucose to sorbitol in
diabetes mellitus has implicated the enzyme in the pathogenesis of diabetic
complications affecting the eyes, kidneys, and nervous system [10].
Structure-based enzyme mechanism studies have been prominently used to
elucidate the mechanism of inhibition. With respect to structural information of
enzymes and inhibitors, various 3D-molecular docking programs have been
developed in recent years. However, limitations have been imposed on the
explanation of the enzyme/inhibitor complex, including the binding affinity of
enzyme-inhibitors and enzyme-substrates, as well as reaction velocity. Therefore,
kinetic studies will take advantage of supporting evidence for the predicted
mechanism from molecular docking models. Two kinetic methods have been widely
used to determine the type of inhibition: Lineweaver–Burk plot and the Dixon plot.
The former is the double reciprocal plot [plot of 1/enzyme velocity (1/V) against
1/substrate concentration (1/[S])] drawn to distinguish the inhibition pattern, including
competitive, non-competitive, and uncompetitive inhibition and the enzyme kinetic
parameters, including Km and Vmax values according to the Michaelis–Menten kinetics
equation. The y-intercept of such a graph is equivalent to 1/Vmax; the x-intercept of the
graph represents −1/Km. Competitive inhibitors have the same y-intercept (1/Vmax) but
different slopes (Km/Vmax) and x-intercepts (Km) with increasing concentrations of
inhibitors. In the case of mixed inhibition, the inhibitor is capable of binding to both
the free enzyme and to the enzyme-substrate complex. This inhibition type is different
from noncompetitive inhibition in that the dissociation constant (Kia) for binding the

- 6 -
free enzyme may differ from the dissociation constant (Kib) for binding the enzyme-
substrate complex. Since the mixed inhibitor binds to the enzyme at a distinguished
location from the substrate binding site, the binding of the inhibitor will either alter
Km or Vmax or both. In other words, the apparent Km may decrease, depending on the
relative values of Kia and Kib. In a situation where the two Ki values are the same, the
apparent Km will be unchanged. This is called non-competitive inhibition and shows
the point on the x-intercept representing −1/Km [11]. Compared with the Lineweaver-
Burk plot, the Dixon plot is a single reciprocal graphical method (plot of 1/enzyme
velocity (1/V) against inhibitor concentration [I]) used to determine the type of
enzyme inhibition and is used to easily calculate the dissociation or inhibition
constant (Ki) of the enzyme/inhibitor complex [12,13]. The Ki value is an indication
of inhibitor potency and how tightly an inhibitor binds to enzymes; it is the
concentration required to produce half of the maximum inhibition as well as the
affinity between enzymes and inhibitors. Plotting 1/V against concentration of
inhibitor [I] at various concentrations of substrate produces a group of intersecting
lines. The corresponding concentration at the intersection point on the x-y plane (x-
axis value) is equal to –Ki value in mixed inhibition, while the value of the x-intercept
implies –Ki in noncompetitive inhibition.
In order to confirm RLAR inhibitory activity, prediction of the protein-ligand
confirmation was carried out with two predicting programs, Autodock 4.0 and Fast
Rigid Exhaustive Docking (Fred) 2.0. The programs were used to dock the inhibitors
into the binding sites of the crystallographic structures of enzymes defined with all
residues located 5~6 Å from the original enzyme/inhibitor complex. Currently,
automated docking is widely used as an effective means of quickly and accurately
predicting biomolecular conformations and binding energies of protein-ligands
- 7 -
complexes in molecular design. In particular, Autodock 4.0 uses a semi-empirical free
energy force field to predict binding free energies of protein–ligand complexes of a
known structure and binding energy for both the bound and unbound states [14].
Apart from Autodock 4.0, Fred 2.0 was also employed due to consolidated evidence
including the rigid rotations and translations of each conformer within the binding site.
The approach of the Fred software is to thoroughly dock the scores of all possible
positions of each ligand in the binding site, exhaustively test all poses of the ligand
within the defined binding site, and maintain the protein-ligand complex as rigid
during most of the docking process, leading to compensation for target flexibility [15].
The highly hydrophobic active site pocket of ALR2 is formed by aromatic residues
(Trp20, Tyr48, Trp79, Trp111, Phe121, Phe122 and Trp219); nonpolar residues
(Val47, Pro218, Leu300 and Leu301) and polar residues (Gln49, Cys298 and His110)
[1,9]. ARIs generally make use of both polar and nonpolar interactions to establish
complementarity with the extended enzyme binding pocket, which is best described as
comprising two regions: (1) a polar site with residues Trp20, Tyr48 (the proton donor),
and His110 and the positively-charged nicotinamide moiety of NADP+ and (2) a
nonpolar site with residues Trp111, Thr113, Phe115, Phe122, Leu300 [8].
Prenyl-substituted kaempferols, including desmethylanhydroicaritin (1) and
sophoflavescenol (2), were isolated from dried roots of Sophora flavescens AIT
(Leguminosae, Sophorae Radix), which are well known in traditional Chinese
medicine (TCM). In our previous study, Sophora flavescens and its prenylated
flavonoids were reported to possess antioxidant [16,17], anti-diabetic, and anti-
diabetic complication activities [18,19]. In particular, two prenylated flavonoids 1 and
2 exhibited RLAR inhibitory activities; however, there is no detailed information on
the mode of inhibition or the enzyme-inhibitor molecular interactions. Therefore, the
- 8 -
aims of this study were to identify an approach to develop potent anti-diabetic
complication drugs by scrutinizing molecular docking predictions and enzyme
kinetics of prenylated flavonoids 1 and 2.
Results
Enzyme kinetics in RLAR inhibition
The RLAR inhibitory activity of test flavonoids 1 ~ 3 was evaluated. Among them,
sophoflavescenol (2) ranked with the most potent inhibitory activity with an IC50
value of 0.76 ± 0.04 μM, and desmethylanhydroicaritin (1) came in second with an
IC50 value of 1.03 ± 0.13 μM, followed by kaempferol (3) with an IC50 value of 5.13 ±
0.05 μM. Considering individual structures of 1 ~ 3, compound 1 harbors a prenyl
group at the 8 position of the A-ring in the kaempferol skeleton; 2 possesses the
additional 5-methoxy group in the A-ring of 1 (Figure 1). Under interpretation using
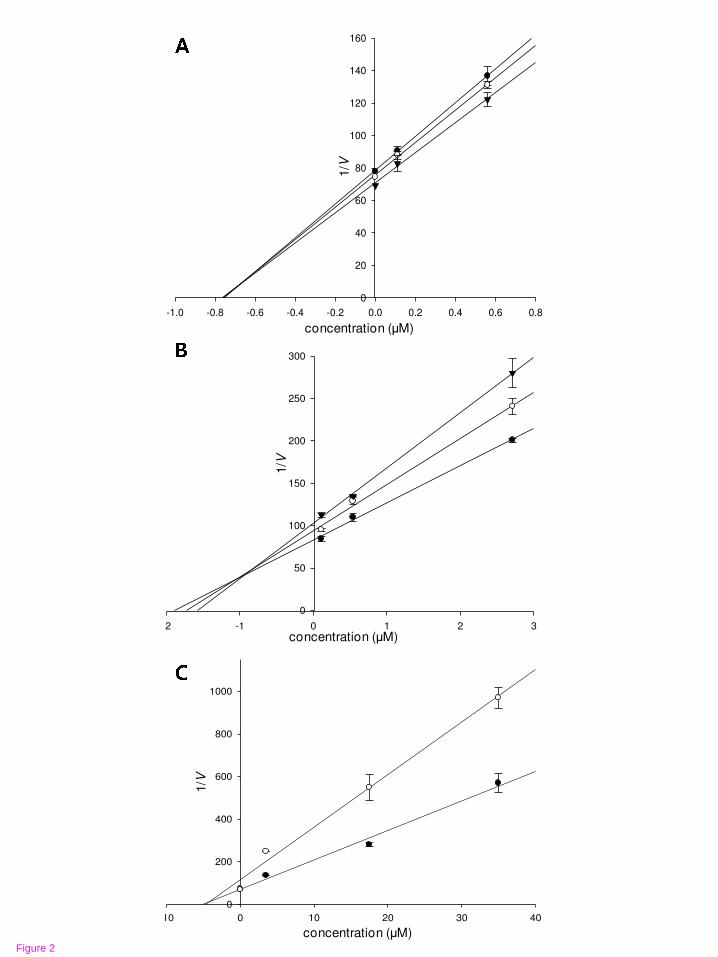
Dixon plotting, compounds 1 and 2 showed mixed type inhibition with respective Ki
values of 0.94 μM and 0.69 μM, and 3 showed noncompetitive inhibition with a Ki
value of 4.65 μM (Table 1; Figure 2). Similar to the results of the Dixon plots, the
lines of both 1 and 2 intersected in the left side, indicating mixed type inhibitors,
while the lines of 3 show the same point on the x-intercept representing
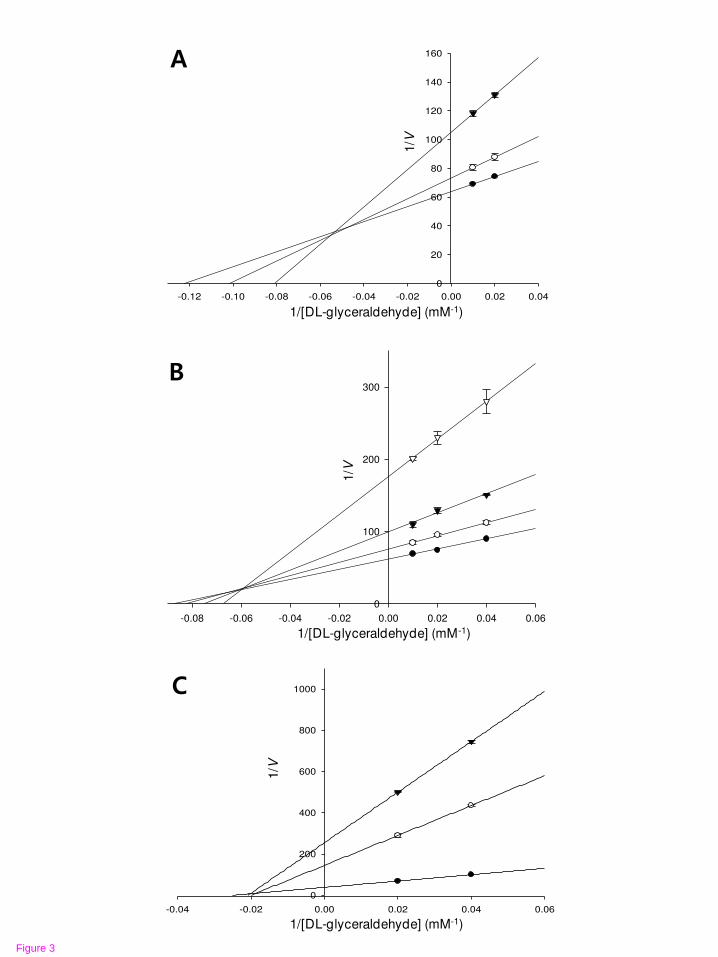
noncompetitive inhibitors in Lineweaver-Burk plots (Figure 3). The respective kinetic
parameters of 1 ~ 3 were also calculated using the Lineweaver-Burk equation:
and an altered equation: Vmax app = . The Km
and Vmax values of 1~3 depending on the concentrations of inhibitors are presented in
Table 2. In the presence of different concentrations of 1~3, respective Vmax values
were decreased, but the Km values between prenylated flavonoids (1 and 2) were

- 9 -
distinguished from those of non-prenylated flavonoid (3). There was no change in the
Km (40.11 mM) or Ki value (6.30 and 6.20 μM) of 3 with different concentrations of
substrate, a characteristic of noncompetitive RLAR inhibition. On the other hand, the
respective Km values of 2 and 3 increased with higher substrate concentrations. As for
1, the Km value changed from 9.85 mM at a concentration of 0.11 μM to 12.32 mM at
a concentration of 0.56 μM and the Vmax value also decreased from 0.016
µmole/mL/min to 0.010 µmole/mL/min, depending on the inhibitor concentration.
The similar enzymatic parameter mode was also detected in 2, showing the increasing
Km values from 12.14 mM to 13.38 mM and the decreasing Vmax values from 0.016
µmole/mL/min to 0.010 µmole/mL/min with increasing inhibitor concentrations. The
above enzymatic parameters for 2 and 3 confirm a mixed RLAR inhibition. In the
case of mixed type inhibition, two kinds of Ki values representing the affinity between
the enzyme and inhibitor can be calculated if the inhibitors bind to enzyme alone (Kia)
or enzyme-substrate complexes (Kib). Interestingly, the Kia and Kib of 1 were 0.29 and
0.74 µM, respectively, and those of 2 were 0.35 and 0.46 µM at a concentration of
0.11 μM, indicating that 2 has much greater potential for binding to not only enzyme
but also enzyme/substrate complexes than does 1.
Molecular docking model of 1~3 in RLAR inhibition
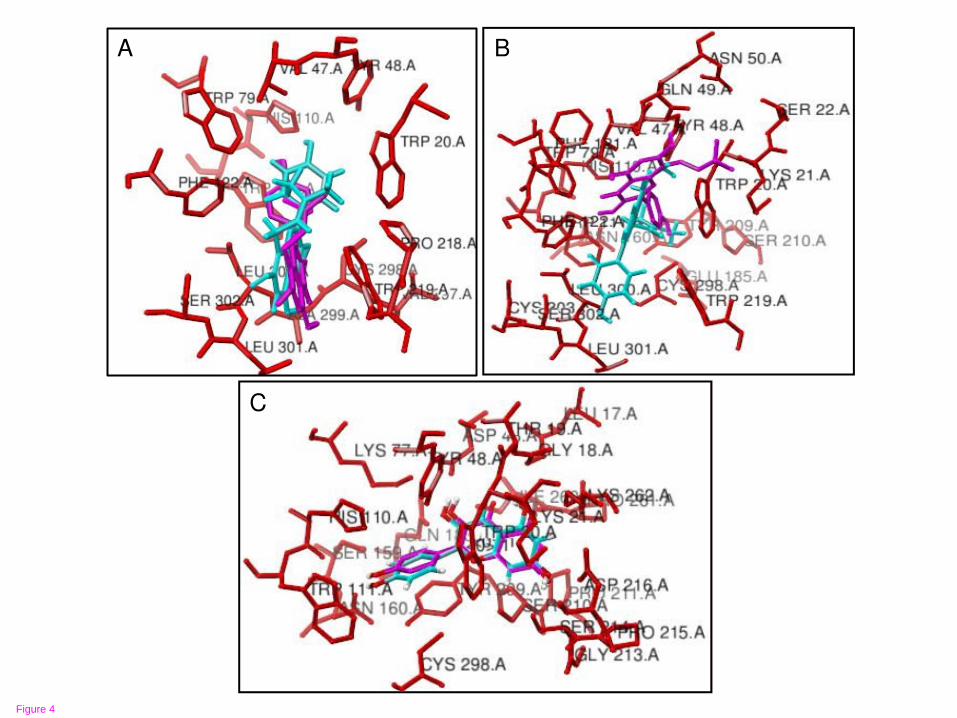
As illustrated in Figure 4, the AR-inhibitor complexes were formed with compounds
1~3 stably posed in the pocket of the AR in Autodock 4.0 (pink) and Fred 2.0 (blue).
As for 1, the binding site predicted by Autodock 4.0 was formed by residues Leu30;
Leu301; Trp20; His110; Cys298; Phe122; Val297; Ala299; Trp111; Trp219; Val47;
Pro218; Trp79, while that predicted by Fred 2.0 was formed by residues Leu300;
Leu301; Trp20; His110; Ser302; Cys298; Phe122; Val297; Ala299; Trp111; Trp219;
Pro218; Val47; Tyr48; Trp79. For 2, the binding site predicted by Autodock 4.0 was

- 10 -
formed by residues Ser210; Cys298; Trp20; Tyr209; Phe121; Trp79; Lys21; Phe122;
Gln49; Trp111; Trp219; His110; Val47; Tyr48; Ser22; Asn50, while that predicted by
Fred 2.0 was formed by residues Leu300; Ser210; Cys298; Trp20; Tyr209; His110;
Ser302; Asn160; Phe122; Cys303; Glu185; Gln49; Leu301; Trp111; Trp219; Val47;
Tyr48; Trp79. In the case of 3, the binding site predicted by Autodock 4.0 was formed
by residues Leu17; Ser210; Cys298; Asp43; His110; Asp216; Thr19; Trp111; Lys77;
Ser214; Trp20; Tyr209; Gly18; Asn160; Pro261; Gln183; Lys262; Pro211; Pro215;
Ser159; Tyr48; Ile260; Gly213; Lys21, while that predicted by Fred 2.0 was formed
by residues Leu17; Ser210; Cys298; Asp43; His110; Asp216; Thr19; Trp111; Lys77;
Ser214; Trp20; Tyr209; Gly18; Asn160; Pro261; Gln183; Lys262; Pro211; Pro215;
Ser159; Tyr48; Ile260; Lys21. Due to the similarity in flavonoid structure, it was
observed that test compounds 1~3 interacted with AR through well-known active sites,
such as hydrophobic and polar residues [1,8]. Due to the presence of a prenyl group, 1
and 2 might interact with ALR2 via a specific and additional nonpolar site, including
that of the Leu300 and Phe122 residues which are not present in 3 (Figure 4). In
addition to the active site residue, the docking analysis also showed that the respective
docking energies of 1~3 were –7.94, –7.64, –9.11 kcal/mol according to Autodock 4.0
and –51.84, –57.27, –79.50 kcal/mol according to Fred 2.0, when accounting for the
lowest energy conformation of the most predicted complex. This result indicated that
1~3 bound tightly at the active site.
Discussion
The International Diabetes Federation has recently noted that a staggering 366 million
people around the world are struggling with either type I or II diabetes. In particular,

- 11 -
type II diabetes is a leading health concern due to its escalating prevalence rate
throughout the world and its associated serious diabetic complications. Moreover,
high morbidity and mortality rates associated with chronic diabetic complications
make the disease the third largest killer after cancer and cardiovascular disease [20].
The disease is taking a deadly toll, causing 4.6 million deaths each year. There has
been a growing demand for the treatment and prevention of diabetes and diabetic
complications. In particular, ALR2, a key enzyme in the polyol pathway is reported to
be highly implicated in the pathogenesis of diabetic complications. Thus, AR
reduction of the hyperglycemia-induced polyol pathway flux by AR inhibitors (ARIs)
could be a potential therapeutic opportunity [7,8]. In order to select and develop
therapeutic drugs for diabetes and diabetic complications, structure-based enzyme
mechanism studies have been undertaken as an effective approach. Considering
enzymes and inhibitors, mutual studies of molecular docking and enzyme kinetic
mechanism of RLAR can predict the potentials of ARIs as anti-diabetic complication
agents.
Flavonoids are secondary metabolites that are distributed in member of the high
plant kingdom such as fruits and vegetables. Due to relatively lower toxicity and a
stronger bioactive potential for increase human health, especially antioxidants, there
have been numerous studies based on the development of pharmaceutical drugs.
Starting from the basic structure (C6-C3-C6) which is present in chalcones, flavones,
flavanones, flavonols, and aurones, the structures of flavonoids are diverse and are
determined by the number and arrangement of the substituents and glycosylations
[21,22]. Since many flavonoids have been implicated in the alleviation of diabetic
complications, many researchers have scrutinized their relevance in AR inhibition
[7,23-25]. In particular, prenylated flavonoids possess additional hydrophobic and

- 12 -
anionic characteristic moieties (prenyl groups) on their flavonoid skeletons which
may play important roles in enzyme inhibition [18]. In our previous study, the
inhibitory activity of 3, lacking a prenyl group at the C-8 position, was drastically
decreased compared to those of prenylated flavonols 1 and 2, indicating that the
hydrophobic aliphatic groups may, at least in part, be associated with increased
inhibitory activity [18,19]. Furthermore, the type of RLAR inhibition depended on the
absence or presence of prenyl groups, in that 3 showed noncompetitive inhibition,
whereas 1 and 2 are mixed inhibitors to RLAR in the present study (Figures 2 and 3).
In other words, 2 and 3 can bind to both the allostatic site of the free enzyme and to
the enzyme/substrate complex; 3 binds to the free enzyme and inhibits the formation
of the enzyme/substrate complex. Depending on the relative values of the Ki (the
dissociation constant of inhibitors), the Vmax results of 2 and 3 possessing an
additional prenyl group increased regardless of whether the substrate was bound to the
enzyme.
Based on molecular docking studies, flavonoids have been shown to be widely
disseminated as naturally occurring ALR2 inhibitors. Recently, there has been
staggering supporting research on structure-activity relationship of flavonoids,
including enzyme kinetics and molecular docking studies [26,27]. With respect to the
docking modeling, the findings have unveiled that the dissociated anionic hydroxyl
group at C-7 interacts with Tyr48, His110, Trp111, and the positively-charged
nicotinamide ring of the NADP+ cofactor in the active site cavity of ALR2. Moreover,
the additional hydrophobic pocket located in the active site (Leu300 and Trp111)
interacts with the C-2 benzyl substituent. The presence of a 4′-hydroxyl group on the
B-ring can also increase the affinity and inhibitory potency against ALR2 via
interaction with Thr113 at the active site [23,28]. Through modeling studies, the
- 13 -
phenoxy group has been shown to provide a good structural replacement for the
carboxylate group (the most well known ARIs are tolrestat, sorbinil), which can
account for the possibility of flavonoids as potent ALR2 inhibitors [8]. In fact, the
specificity and selectivity of ALRs are closely related to the hydrophobic pocket of
ALRs, including Leu300 and Trp111. In particular, Leu300 is the short segment of the
enzyme susceptible to conformational changes, followed by the determination of the
ligand specificity toward ALR2 compared to that of ALR1 [28]. Comparative
molecular modeling studies of 1~3 revealed that all three compounds can bind tightly
to the active site through Trp20, Tyr48, His110, and Trp111 residues. Unlike
compound 3, the two prenylated kaempferols 1 and 2 interact with Leu300 and
Phe122 residues at a specific nonpolar site of ALR2 (Figure 4). Considering this
result, the presence of the 8-prenyl group might have an important role in the
selectivity and potency of ALR inhibition via strong anionic tendency at the adjacent
7-hydroxyl group as well as the 4′-hydroxyl group.
Conclusions
The docking simulation results of 1 ~ 3 demonstrating the negative binding energies
(Autodock 4.0 = 9.11 to 7.64 kcal/mol; Fred 2.0 = 79.54 to 51.84 kcal/mol) and
the additional hydrogen bonds through Phe122 and Trp219, in addition to the
previously proposed interaction of AR and phenolics through Trp20, Tyr48, His110,
and Trp111 residues, have highlighted that the presence of 8-prenyl and 5-methyl
groups might potentiate tighter binding to the active site of an enzyme, making them
much more effective as AR inhibitors. The present study suggested that an effective
strategy for screening the potential of AR inhibitors could be established by predicting

- 14 -
the 3D structural conformation of prenylated flavonoids and the orientation within the
enzyme, as well as by simultaneously determining the mode of enzyme inhibition.
This simultaneous approach might be underlined as a potential guideline for the
design of AR-selective inhibitors
Methods
General
The 1H- and
13C-NMR spectra were determined using a JEOL JNM ECP-400
spectrometer (Tokyo, Japan) at 400 MHz for 1H and 100 MHz for
13C in deuterated
dimethylsulfoxide (DMSO)-d6. Column chromatography was conducted using silica
(Si) gel 60 (70230 mesh, Merck, Darmstadt, Germany) and Sephadex LH-20
(20~100 μm, Sigma, St. Louis, MO, USA). All TLC was conducted on pre-coated
Merck Kieselgel 60 F254 plates (20 20 cm, 0.25 mm, Merck) or RP-18 F254s plates (5
10 cm, Merck), using 50% H2SO4 as a spray reagent.
Chemicals and reagents
β-Nicotinamide adenine dinucleotide phosphate (NADPH), DL-glyceraldehyde dimer,
kaempferol, and quercetin were purchased from Sigma Chemical Co. (St. Louis, MO,
USA). All solvents were purchased from Merck, Fluka, Duksan Pure Chemical Co.,
or Sigma Aldrich Co., unless stated otherwise.

- 15 -
Isolation of desmethylanhydroicaritin and sophoflavescenol
The dried roots of S. flavescens (10 kg) were refluxed with methanol (MeOH) for 3 h
(3 10 L). The total filtrate was then concentrated to dryness in vacuo at 40 ºC in
order to render the MeOH extract (2.2 kg). This extract was successively partitioned
with methylene chloride (CH2Cl2), ethyl acetate, n-butanol and water. The CH2Cl2-
soluble fraction was chromatographed over a Si gel column with a CH2Cl2–MeOH
mixture (gradient) and further separated by Sephadex LH-20 (solvent: MeOH) to
yield desmethylanhydroicaritin (1, 45 mg) and sophoflavescenol (2, 600 mg). These
compounds were characterized and identified by spectroscopic methods, including
1H- and
13C-NMR, as well as through comparison with published data [16,19]. The
structures are shown in Figure 1, and their spectral data are as follows.
Desmethylanhydroicaritin (1) 1
H-NMR (400 MHz, DMSO-d6) δ : 12.40 (1H, s,
OH-5), 10.73 (1H, s, OH-7), 10.12 (1H, s, OH-4'), 9.36 (1H, s, OH-3), 8.03 (2H, d, J
= 8.87 Hz, H-2', 6'), 6.93 (2H, d, J = 8.87 Hz, H- 3', 5'), 6.29 (1H, s, OH-6), 5.17 (1H,
t, J = 6.85 Hz, H-2"), 3.42 (2H, d, J = 6.45 Hz, H-1"), 1.74 (3H, br s, H-4") 1.62 (3H,
br s, H-5"); 13
C-NMR (100 MHz, DMSO-d6) δ : 176.11 (C-4), 161.13 (C-7), 159.14
(C-4'), 158.25 (C-5), 153.44 (C-9), 146.72 (C-2), 135.49 (C-3), 130.91 (C-3"), 129.34
(C-2', 6'), 122.54 (C-2"), 121.96 (C-1'), 115.44 (C-3', 5'), 105.56 (C-8), 102.98 (C-10),
97.76 (C-6), 25.42 (C-5"), 21.19 (C-1"), 17.80 (C-4").
Sophoflavescenol (2) 1H-NMR (400 MHz, DMSO-d6) δ: 10.58 (1H, s, 7-OH), 9.99
(1H, s, 4′-OH), 7.98 (2H, d, J = 8.8 Hz, H-2′/H-6′), 6.91 (2H, d, J = 8.8 Hz, H-3′/H-5′),
6.44 (1H, s, H-6), 5.15 (1H, t-like, H-2″), 3.80 (3H, s, 5-OCH3), 3.46 (2H, brd, J = 6.7
Hz, H-1″), 1.75 (3H, s, H-5″), 1.62 (3H, s, H-4″). 13
C-NMR (100 MHz, DMSO-d6) δ:
171.2 (C-4), 159.5 (C-7), 158.5 (C-4′), 157.9 (C-5), 155.4 (C-9), 141.8 (C-2), 136.8
(C-3), 130.9 (C-3″), 128.6 (C-2′/ C-6′), 122.7 (C-2″), 122.3 (C-1′), 115.4 (C-3′/C-5′),

- 16 -
106.8 (C-8), 105.2 (C-10), 95.4 (C-6), 55.7 (5-OCH3), 25.4 (C-4″), 21.5 (C-1″), 17.8
(C-5″).
Assay for RLAR inhibitory activity
Rat lens homogenates were used as AR sources. In the experiment, we followed the
Guidelines for Care and Use of Laboratory Animals as approved by Pukyong National
University (Busan, Republic of Korea). Rat lens homogenate was prepared according
to the modified method of Hayman and Kinoshita [29]. Briefly, the lenses were
removed from the eyes of Sprague-Dawley rats weighing 250 ~ 280 g (Samtako
BioKorea, Inc.) and homogenized in sodium phosphate buffer (pH 6.2). The
supernatant was obtained by centrifugation of the homogenate at 10,000 rpm at 4 C
for 20 min and was frozen until use. A crude AR, with a specific activity of 6.5 U/mg,
was used in the evaluations of enzyme inhibition. The partially purified material was
separated into 1.0 ml aliquots, and stored at 80 C. Each 1.0 ml cuvette contained
equal units of enzyme, 100 mM sodium phosphate buffer (pH 6.2), and 1.6 mM
NADPH, both with and without 50 mM of the substrate, DL-glyceraldehyde, and an
inhibitor (f.c. 100 M for the isolated compounds, dissolved in 100% DMSO) with a
final concentration of 1% DMSO. The AR activity was determined by measuring the
decrease in NADPH absorption at 340 nm over a 4 min period on a
Ultrospec
2100pro UV/Visible spectrophotometer with SWIFT II Applications
software (Amersham Biosciences, New Jersey, USA). The inhibition percentage (%)
was calculated as [(1 (A sample/min A blank/min) (A control/min A
blank/min)) 100], where A sample/min represents the reduction of absorbance for

- 17 -
4 min with the test sample and substrate, respectively, and A control/min represents
the same but with 100% DMSO instead of a sample.
Kinetic parameters in RLAR inhibition – Dixon and Lineweaver–Burk plots
In order to determine the kinetic mechanism, two kinetic methods using Lineweaver–
Burk plots and the Dixon plots were complementarily used [11-13]. Each enzymatic
inhibition at various concentrations of three test compounds was evaluated by
monitoring the effects of different concentrations of the substrates in Dixon plots
(single reciprocal plot). Dixon plots for inhibition of RLAR were obtained in the
presence of different concentrations of DL-glyceraldehyde substrate: 25 mM (●); 50
mM (○); and 100 mM (▼). The test concentrations of test flavonoids in the RLAR
kinetic analysis were as follows: 0.56 and 0.11 μM for 1; 2.78, 2.71, 0.54, and 0.11
μM for 2; and 34.94, 17.47, and 3.49 μM for 3. The enzymatic procedures consisted
of the same, aforementioned RLAR assay methods. The inhibition constants (Ki) were
determined by interpretation of the Dixon plots. By means of Lineweaver–Burk
double reciprocal plots, Km and Vmax values of RLAR were determined at various
concentrations of DL-glyceraldehyde (25, 50, and 100 mM) substrate in the absence
and presence of different concentrations of test compounds (0.56 and 0.11 μM for 1;
2.78, 2.71, 0.54, and 0.11 μM for 2; and 34.94, 17.47, and 3.49 μM for 3). The Ki
value was also derived by plotting slopes obtained from Lineweaver–Burk plots and
Dixon plots.

- 18 -
Molecular docking simulation in RLAR inhibition – Autodock 4.0 and Fred 2.0
In order to estimate the conformation of the protein-ligand complex and to increase
accuracy, repeatability, and reliability of the docking results, two programs: Autodock
4.0 (AutoDock4 and AutoDockTools4) and Fred 2.0 (OpenEye Scientific Software,
Santa Fe, NM, USA) were utilized. Twelve ligand structures were constructed and
minimized using Chemsketch 3.5 and Omega 2.0 software (OpenEye Scientific
Software, USA), for 2D and 3D conformation, respectively [30]. For docking studies,
the crystal structures of the protein targets (NCBI protein ID : NP_001619.1) were
allocated from the protein sequence alignment [Brookhaven Protein Data Bank (PDB
ID: 2acr chain A)]. The 3D structures of test compounds are as follows:
desmethylanhydroicaritin (PUBCHEM ID: 5318624); sophoflavescenol (PUBCHEM
ID : 9929189); and kaempferol (PUBCHEM ID: 5280863). The predicted protein
ligand complexes were optimized and ranked according to the empirical scoring
function, ScreenScore, which estimates the binding free energy of the ligand receptor
complex. The docking of the aldose reductase-flavonoid molecule was successful, as
indicated by statistically significant scores.
Statistics
Statistical significance was analyzed by one-way ANOVA and Student’s t-test (Systat
Inc., Evanston, IL, USA) and considered significant at p < 0.01. All results are
presented as mean SEM.
Acknowledgements
This work was financially supported by the Blue-Bio Industry RIC at Dong-Eui
University as an RIC program of ITEP under MKE and Busan City and by a National
- 19 -
Research Foundation of Korea grant funded by the Korean government (E00755).
This research was also partially assisted by the Korean Bioinformation Center
(KOBIC) Research Support Program.
Authors' contributions
HAJ and JSC carried out the design, coordination, and analysis of overall bioactive
assays, enzyme kinetics, and molecular docking studies, and drafted and corrected the
manuscript. HEM and SHO participated in the performance and analysis of the
individual study. BWK, HSS, SBK conceived of the study, and participated in its
coordination and helped to review the manuscript. All authors read and approved the
final manuscript.
References
1. El-Kabbani O, Ruiz F, Darmanin C, Chung RP: Aldose reductase structures:
implications for mechanism and inhibition. Cell Mol Life Sci 2004, 61: 750-
762.
2. Brownlee M: Biochemistry and molecular cell biology of diabetic
complications. Nature 2001, 414: 813-820.
3. Nishimura C, Yamaoka T, Mizutani M, Yamashita K, Akera T, Tanimoto T:
Purification and characterization of the recombinant human aldose
reductase expressed in baculovirus system. Biochim Biophys Acta 1991,
1078: 171-178.

- 20 -
4. Kubo E, Miyoshi N, Fukuda M, Akagi Y: Cataract formation through the
polyol pathway is associated with free radical production. Exp Eye Res
1999, 68: 457-464.
5. Lee AY, Chung SS: Contributions of polyol pathway to oxidative stress in
diabetic cataract. FASEB J 1999, 13: 23-30.
6. Kador PF, Kinoshita JH, Tung WH, Chylack LT Jr: Differences in the
susceptibility of various aldose reductases to inhibition. II. Invest
Ophthalmol Vis Sci 1980, 19: -982.
7. Kawanishi K, Ueda H, Moriyasu M: Aldose reductase inhibitors from the
nature. Curr Med Chem 2003, 10: 1353-1374.
8. de la Fuente JA, Manzanaro S, Martín MJ, de Quesada TG, Reymundo I,
Luengo SM, Gago F: Synthesis, activity, and molecular modeling studies of
novel human aldose reductase inhibitors based on a marine natural
product. J Med Chem 2003, 46: 5208-5221.
9. El-Kabbani O, Podjarny A: Selectivity determinants of the aldose and
aldehyde reductase inhibitor-binding sites. Cell Mol Life Sci 2007, 64:
1970-1978.
10. El-Kabbani O, Old SE, Ginell SL, Carper DA: Aldose and aldehyde
reductases: structure-function studies on the coenzyme and inhibitor-
binding sites. Mol Vis 1999, 5: 20.
11. Lineweaver H, Burk D: The determination of enzyme dissociation
constants. J Am Chem Soc 1934, 56: 658-666.
12. Cornish-Bowden A: A simple graphical method for determining the
inhibition constants of mixed, uncompetitive and non-competitive
inhibitors. Biochem J 1974, 137: 143-144.

- 21 -
13. Dixon M: The determination of enzyme inhibitor constants. Biochem J
1953, 55: 170-171.
14. Morris GM, Huey R, Lindstrom W, Sanner MF, Belew RK, Goodsell DS,
Olson AJJ: AutoDock4 and AutoDockTools4: Automated docking with
selective receptor flexibility. J Comput Chem 2009, 30: 2785-2791.
15. Bustanji Y, Al-Masri IM, Qasem A, Al-Bakri AG, Taha MO: In silico
screening for non-nucleoside HIV-1 reverse transcriptase inhibitors using
physicochemical filters and high-throughput docking followed by in vitro
evaluation. Chem Biol Drug Des 2009, 74: 258-265.
16. Jung HJ, Kang SS, Hyun SK, Choi JS: In vitro free radical and ONOO−
scavengers from Sophora flavescens. Arch Pharm Res 2005, 28: 534-540.
17. Jung HA, Jeong DM, Chung HY, Lim HA, Kim JY, Yoon NY, Choi JS: Re-
evaluation of the antioxidant prenylated flavonoids from the roots of
Sophora flavescens. Biol Pharm Bull 2008, 31: 908-915.
18. Jung HA, Yoon NY, Kang SS, Kim YS, Choi JS: Inhibitory activities of
prenylated flavonoids from Sophora flavescens against aldose reductase
and generation of advanced glycation endproducts. J Pharm Pharmacol
2008, 60: 1227-1236.
19. Jung HA, Jin SE, Park JS, Choi JS: Antidiabetic complications and anti-
Alzheimer activities of sophoflavescenol, a prenylated flavonol from
Sophora flavescens, and its structure-activity relationship. Phytother Res
2011, 25: 709-715.
20. de Groot M, Anderson R, Freedland KE, Clouse RE, Lustman PJ: Association
of depression and diabetes complications: a meta-analysis. Psychosom Med
2001, 63: 619-630.

- 22 -
21. Rice-Evans CA, Miller N, Paganga G: Structure-antioxidant activity
relationships of flavonoids and phenolic acids. Free Radic Biol Med 1996,
20: 933-
22. Harborne FB, Williams CA: Advances in flavonoid research since 1992.
Phytochemistry 2000, 55: -504.
23. Nicolle E, Souard F, Faure P, Boumendjel A: Flavonoids as promising lead
compounds in type 2 diabetes mellitus: molecules of interest and
structure-activity relationship. Curr Med Chem 2011, 18: 2661-2672.
24. Matsuda H, Morikawa T, Toguchida I, Yoshikawa M: Structural
requirements of flavonoids and related compounds for aldose reductase
inhibitory activity. Chem Pharm Bull 2002, 50: 788-795.
25. Lim SS, Jung YJ, Hyun SK, Lee YS, Choi JS: Rat lens aldose reductase
inhibitory constituents of Nelumbo nucifera stamens. Phytother Res 2006,
20: 825-830.
26. Fernández M, Caballero J, Helguera AM, Castro EA, González MP:
Quantitative structure-activity relationship to predict differential
inhibition of aldose reductase by flavonoid compounds. Bioorg Med Chem
2005, 13: 3269-3277.
27. Mercader AG, Duchowicz PR, Fernández FM, Castro EA, Bennardi DO,
Autino JC, Romanelli GP: QSAR prediction of inhibition of aldose
reductase for flavonoids. Bioorg Med Chem 2008, 16: 7470-7476.
28. Miyamoto S: Molecular modelling and structure-based drug discovery
studies of aldose reductase inhibitors. Chem-Bio Informatics Journal 2002,
2: 74-85.
- 23 -
29. Hayman S, Kinoshita J H: Isolation and properties of lens aldose reductase.
J Biol Chem 1965, 240: 877-882.
30. Harrison DH, Bohren KM, Ringe D, Petsko GA, Gabbay KH: An anion
binding site in human aldose reductase: mechanistic implications for the
binding of citrate, cacodylate, and glucose 6-phosphate. Biochemistry 1994,
33: 2011-2020.

- 24 -
Figure legends
Figure 1 Structures of test compounds 1~3
Figure 2 Dixon plots for RLAR inhibition of compounds 1~3
Desmethylanhydroicaritin (A), sophoflavescenol (B), and kaempferol (C) were
tested in the presence of different concentrations of substrate (DL-
glyceradehyde): 25 mM (●); 50 mM (○); and 100 mM (▼).
Figure 3 Lineweaver-Burk plots for RLAR inhibition of compounds 1~3
RLAR inhibition was analyzed in the presence of different concentrations of
sample as follows: 0 µM (●), 0.11 µM (○), and 0.56 µM (▼) for
desmethylanhydroicaritin (A); 0 µM (●), 0.108 µM (○), 0.54 µM (▼), and 2.71
µM (▽) for sophoflavescenol (B); 0 µM (●), 17.47 µM (○), and 34.94 µM (▼)
for kaempferol (C).
Figure 4 Molecular docking models for RLAR inhibition of compounds 1~3
desmethylanhydroicaritin (A), sophoflavescenol (B), and kaempferol (C)

- 25 -
Table 1 IC50 values and dissociation constants (Ki) of compounds 1~3 for
RLAR activity using the Dixon plot
Test compound
IC50 (μM)
Ki
(µM) Inhibition type
1 1.03 ± 0.13 0.94 mixed
2 0.76 ± 0.04 0.69 mixed
3 5.13 ± 0.05 4.65 noncompetitive
Table 2 Kinetic parameters of compounds 1~3 regarding RLAR activity
according to the Lineweaver-Burk plot
Test compound
Conc. (µM)
Ki
(µM) Km
(mM) Vmax
(µmole/mL/min) Inhibition type
1 0.00 8.20 ± 0.04 0.016 ± 0.002 mixed
0.11 0.52 9.84 ± 0.05 0.014 ± 0.002
0.56 0.63 12.32 ± 0.08 0.010 ± 0.001
2 0.00 11.48 ± 0.07 0.016 ± 0.002 mixed
0.11 0.41 12.14 ± 0.05 0.013 ± 0.001
0.54 0.37 13.38 ± 0.08 0.010 ± 0.000
3 0.00 40.10 ± 0.12 0.026 ± 0.001 noncompetitive
17.47 6.30 40.11 ± 0.15 0.007 ± 0.000
34.94 6.20 40.11 ± 0.14 0.004 ± 0.000

desmethylanhydroicaritin sophoflavescenol
kaempferol
Figure 1
-10 0 10 20 30 40
0
200
400
600
800
1000
-2 -1 0 1 2 3
0
50
100
150
200
250
300
1/V
concentration (たM)
B-1.0 -0.8 -0.6 -0.4 -0.2 0.0 0.2 0.4 0.6 0.8
0
20
40
60
80
100
120
140
160
1/V
concentration (たM)
A1/V
concentration (たM)
C
Figure 2
-0.08 -0.06 -0.04 -0.02 0.00 0.02 0.04 0.06
0
100
200
300
-0.12 -0.10 -0.08 -0.06 -0.04 -0.02 0.00 0.02 0.04
0
20
40
60
80
100
120
140
160
-0.04 -0.02 0.00 0.02 0.04 0.06
0
200
400
600
800
1000
1/[DL-glyceraldehyde] (mM-1)
1/V
1/V
1/V
1/[DL-glyceraldehyde] (mM-1)
1/[DL-glyceraldehyde] (mM-1)
Figure 3
C
A B
Figure 4