structure and economic impact of utah's coal industry - governor
TRANSCRIPT

THE STRUCTURE AND
ECONOMIC IMPACT
OF UTAH’S COAL
INDUSTRY Prepared for: Prepared by: Public Lands Policy Coordination Office Bureau of Economic and Business Research Office of the Governor David Eccles School of Business 5110 State Office Building University of Utah P.O. Box 141107 1645 East Campus Center Drive, Room 401 Salt Lake City, Utah 84114 Salt Lake City, Utah 84112

CO V E R PH OT O: Hiawatha Mine, Carbon County, Utah, 1924. Used by permission, Utah State Historical Society, all rights reserved.

T H E S T R U C T U R E A N D E C O N O M I C I M P A C T
O F U T A H ’ S C O A L I N D U S T R Y
Produced and Written by:
Pamela S. Perlich Michael T. Hogue John C. Downen
Bureau of Economic and Business Research
David Eccles School of Business University of Utah
1645 East Campus Center Drive, Room 401 Salt Lake City, UT 84112
801.581.6333
May 2010
© 2010 Bureau of Economic and Business Research, University of Utah


The Structure and Economic Impact of Utah’s Coal Industry
B U R E A U O F E C O N O M I C A N D B U S I N E S S R E S E A R C H i
CO N T E N T S
List of Tables ..............................................................................................................................................iii List of Figures.............................................................................................................................................vi List of Exhibits .........................................................................................................................................viii
1 Executive Summary.................................................................................................................................1 1.1 Overview ...........................................................................................................................................1
1.1.1 Coal Reserves and Production................................................................................................3 1.1.2 Markets.......................................................................................................................................5 1.1.3 Challenges..................................................................................................................................6 1.1.4 Options for Coal-Based Electricity Generation...................................................................6
1.2 Economic Impacts ...........................................................................................................................7 1.3 Production Scenarios.......................................................................................................................8 1.4 Impacts of Production Scenarios.................................................................................................14
1.4.1 Carbon County Scenario Impacts ........................................................................................14 1.4.2 Emery County Scenario Impacts .........................................................................................15 1.4.3 Sevier County Scenario Impacts...........................................................................................17
1.5 Power Plant Impacts......................................................................................................................20 1.5.1 State-Level Scenario Impacts................................................................................................21
1.6 Additional Fiscal Impacts .............................................................................................................22
2 Utah’s Coal Industry..............................................................................................................................25 2.1 Introduction ....................................................................................................................................25 2.2 Overview of Coal Reserves and Production ..............................................................................28
2.2.1 Reserves ...................................................................................................................................28 2.2.2 Production ...............................................................................................................................30
2.3 Markets ............................................................................................................................................33 2.4 Challenges........................................................................................................................................37 2.5 Options for Coal-Based Electricity Generation ........................................................................40
3 Coal Production Impacts......................................................................................................................45 3.1 Estimated 2007 Impacts................................................................................................................45
4 Utah Coal Production Scenarios: 2008–2030 ....................................................................................49
5 Impacts of Coal Production Scenarios ...............................................................................................59 5.1 Overview .........................................................................................................................................59 5.2 State-Level Scenario Impacts........................................................................................................60 5.3 Carbon County Scenario Impacts................................................................................................72 5.4 Emery County Scenario Impacts .................................................................................................84 5.5 Sevier County Scenario Impacts ..................................................................................................96 5.6 Coal Counties Scenario Impacts ............................................................................................... 108 5.7 Non–coal Counties Scenario Impacts...................................................................................... 120
6 Power Plant Impacts .......................................................................................................................... 137 6.1 Middle Scenario Impacts............................................................................................................ 138
6.1.1 State-Level Scenario Impacts............................................................................................. 139
7 Additional Fiscal Impacts .................................................................................................................. 142

The Structure and Economic Impact of Utah’s Coal Industry
ii B U R E A U O F E C O N O M I C A N D B U S I N E S S R E S E A R C H
8 Socioeconomic Profiles ......................................................................................................................145 8.1 Demographic Overview..............................................................................................................145
8.1.1 Carbon County .....................................................................................................................145 8.1.2 Emery County.......................................................................................................................149 8.1.3 Sevier County........................................................................................................................153
8.2 Economic Profiles .......................................................................................................................157 8.2.1 Carbon County .....................................................................................................................157 8.2.2 Emery County.......................................................................................................................175 8.2.3 Sevier County........................................................................................................................192
9 Technical Notes and Methodology...................................................................................................209 9.1 NAICS Codes for Coal Production and Coal-Fired Power Plants ......................................209 9.2 Economic Impacts.......................................................................................................................210
9.2.1 REMI .....................................................................................................................................211 9.3 Fiscal Impacts ...............................................................................................................................211 9.4 Projected Impact Scenarios ........................................................................................................212

The Structure and Economic Impact of Utah’s Coal Industry
B U R E A U O F E C O N O M I C A N D B U S I N E S S R E S E A R C H iii
L I S T O F TA B L E S Table 1.1 Coal Production Summary Impacts, 2007 ...................................................................8 Table 1.2a Utah Coal Production, 2000–2030: Low Scenario......................................................9 Table 1.2b Utah Coal Production, 2000–2030: Middle Scenario ...............................................10 Table 1.2c Utah Coal Production, 2000–2030: High Scenario...................................................10 Table 1.3a Summary Impacts: Low Scenario ................................................................................18 Table 1.3b Summary Impacts—Changes from 2007 to 2030: Low Scenario ..........................18 Table 1.4a Summary Impacts: Middle Scenario............................................................................19 Table 1.4b Summary Impacts—Changes from 2007 to 2030: Middle Scenario ......................19 Table 1.5a Summary Impacts: High Scenario ...............................................................................20 Table 1.5b Summary Impacts—Changes from 2007 to 2030: High Scenario..........................20 Table 1.6 2007 Employment in Coal-Fired Power Plants by County .....................................21 Table 1.7 Power Plants, Middle Scenario: Summary Impacts .................................................22 Table 1.8 Federal Coal Royalty Payments and Disbursements to Utah, 2001–2008 ............23 Table 1.9 Rents and Royalties Paid for Coal Production on SITLA Lands, 2000–2008.....23 Table 1.10 Property Taxes Charged Against Coal Mines, 2000–2008.......................................24 Table 1.11 Property Taxes Charged Against Coal-Fired Power Plants, 2000–2008 ..............24
Table 2.1 Estimates of Performance and Cost of Coal-Based Electric Power Technologies...................................................................................................................42
Table 3.1 Coal Production Summary Impacts, 2007 .................................................................46 Table 3.2 Utah Coal Production: Detailed Employment Impacts, 2007 ................................47 Table 3.3 Utah Coal Production: Detailed Occupational Impacts, 2007................................48
Table 4.1a Utah Coal Production, 2000–2030: Low Scenario....................................................49 Table 4.1b Utah Coal Production, 2000–2030: Middle Scenario ...............................................50 Table 4.1c Utah Coal Production, 2000–2030: High Scenario...................................................51 Table 4.2a Value of Utah Coal Production, 2000–2030: Low Scenario ...................................56 Table 4.2b Value of Utah Coal Production, 2000–2030: Middle Scenario ...............................57 Table 4.2c Value of Utah Coal Production, 2000–2030: High Scenario...................................58
Table 5.1a Summary Impacts State of Utah: Low Scenario........................................................61 Table 5.1b Detailed Employment Impacts State of Utah: Low Scenario .................................62 Table 5.1c Detailed Occupational Impacts State of Utah: Low Scenario.................................63 Table 5.2a Summary Impacts State of Utah: Middle Scenario ...................................................64 Table 5.2b Detailed Employment Impacts State of Utah: Middle Scenario.............................65 Table 5.2c Detailed Occupational Impacts State of Utah: Middle Scenario ............................66 Table 5.3a Summary Impacts State of Utah: High Scenario.......................................................67 Table 5.3b Detailed Employment Impacts State of Utah: High Scenario ................................68 Table 5.3c Detailed Occupational Impacts State of Utah: High Scenario................................69 Table 5.4a Summary Impacts Carbon County: Low Scenario....................................................73 Table 5.4b Detailed Employment Impacts Carbon County: Low Scenario .............................74 Table 5.4c Detailed Occupational Impacts Carbon County: Low Scenario.............................75 Table 5.5a Summary Impacts Carbon County: Middle Scenario ...............................................76 Table 5.5b Detailed Employment Impacts Carbon County: Middle Scenario.........................77 Table 5.5c Detailed Occupational Impacts Carbon County: Middle Scenario ........................78 Table 5.6a Summary Impacts Carbon County: High Scenario...................................................79

The Structure and Economic Impact of Utah’s Coal Industry
iv B U R E A U O F E C O N O M I C A N D B U S I N E S S R E S E A R C H
Table 5.6b Detailed Employment Impacts Carbon County: High Scenario ............................80 Table 5.6c Detailed Occupational Impacts Carbon County: High Scenario............................81 Table 5.7a Summary Impacts Emery County: Low Scenario.....................................................85 Table 5.7b Detailed Employment Impacts Emery County: Low Scenario ..............................86 Table 5.7c Detailed Occupational Impacts Emery County: Low Scenario..............................87 Table 5.8a Summary Impacts Emery County: Middle Scenario ................................................88 Table 5.8b Detailed Employment Impacts Emery County: Middle Scenario ..........................89 Table 5.8c Detailed Occupational Impacts Emery County: Middle Scenario .........................90 Table 5.9a Summary Impacts Emery County: High Scenario....................................................91 Table 5.9b Detailed Employment Impacts Emery County: High Scenario .............................92 Table 5.9c Detailed Occupational Impacts Emery County: High Scenario .............................93 Table 5.10a Summary Impacts Sevier County: Low Scenario......................................................97 Table 5.10b Detailed Employment Impacts Sevier County: Low Scenario................................98 Table 5.10c Detailed Occupational Impacts Sevier County: Low Scenario ...............................99 Table 5.11a Summary Impacts Sevier County: Middle Scenario................................................100 Table 5.11b Detailed Employment Impacts Sevier County: Middle Scenario .........................101 Table 5.11c Detailed Occupational Impacts Sevier County: Middle Scenario.........................102 Table 5.12a Summary Impacts Sevier County: High Scenario ...................................................103 Table 5.12b Detailed Employment Impacts Sevier County: High Scenario.............................104 Table 5.12c Detailed Occupational Impacts Sevier County: High Scenario ............................105 Table 5.13a Summary Impacts Coal Counties: Low Scenario....................................................109 Table 5.13b Detailed Employment Impacts Coal Counties: Low Scenario .............................110 Table 5.13c Detailed Occupational Impacts Coal Counties: Low Scenario.............................111 Table 5.14a Summary Impacts Coal Counties: Middle Scenario ...............................................112 Table 5.14b Detailed Employment Impacts Coal Counties: Middle Scenario .........................113 Table 5.14c Detailed Occupational Impacts Coal Counties: Middle Scenario ........................114 Table 5.15a Summary Impacts Coal Counties: High Scenario...................................................115 Table 5.15b Detailed Employment Impacts Coal Counties: High Scenario ............................116 Table 5.15c Detailed Occupational Impacts Coal Counties: High Scenario ............................117 Table 5.16a Summary Impacts Non-Coal Counties: Low Scenario ..........................................121 Table 5.16b Detailed Employment Impacts Non-Coal Counties: Low Scenario....................122 Table 5.16c Detailed Occupational Impacts Non-Coal Counties: Low Scenario ...................123 Table 5.17a Summary Impacts Non-Coal Counties: Middle Scenario......................................124 Table 5.17b Detailed Employment Impacts Non-Coal Counties: Middle Scenario ...............125 Table 5.17c Detailed Occupational Impacts Non-Coal Counties: Middle Scenario...............126 Table 5.18a Summary Impacts Non-Coal Counties: High Scenario .........................................127 Table 5.18b Detailed Employment Impacts Non-Coal Counties: High Scenario...................128 Table 5.18c Detailed Occupational Impacts Non-Coal Counties: High Scenario ..................129 Table 5.19a Summary Impacts: Low Scenario..............................................................................132 Table 5.19b Summary Impacts—Changes from 2007 to 2030: Low Scenario ........................132 Table 5.20a Summary Impacts: Middle Scenario .........................................................................133 Table 5.20b Summary Impacts—Changes from 2007 to 2030: Middle Scenario....................133 Table 5.21a Summary Impacts: High Scenario.............................................................................134 Table 5.21b Summary Impacts—Changes from 2007 to 2030: High Scenario .......................134
Table 6.1 2007 Employment in Utah’s Coal-Fired Power Plants ..........................................138 Table 6.2 2007Employment in Coal-Fired Power Plants by County ....................................138 Table 6.3a Power Plants, Middle Scenario: Summary Impacts ................................................139

The Structure and Economic Impact of Utah’s Coal Industry
B U R E A U O F E C O N O M I C A N D B U S I N E S S R E S E A R C H v
Table 6.3b Power Plants, Middle Scenario: Detailed Employment Impacts..........................140 Table 6.3c Power Plants, Middle Scenario: Detailed Occupational Impacts .........................141
Table 7.1 Federal Coal Royalty Payments and Disbursements to Utah, 2001–2008 ..........142 Table 7.2 Distribution of Federal Mineral Royalties in Utah..................................................142 Table 7.3 Rents and Royalties Paid for Coal Production on SITLA Lands, 2000–2008....143 Table 7.4 Property Taxes Charged Against Coal Mines, 2000–2008.....................................143 Table 7.5 Property Taxes Charged Against Coal-Fired Power Plants, 2000–2008 .............144
Table 8.1 Carbon County Population by Race and Ethnicity: 2000 Census and 2006 Estimates .............................................................................................................148
Table 8.2 Emery County Population by Race and Ethnicity: 2000 Census and 2006 Estimates .............................................................................................................152
Table 8.3 Sevier County Population by Race and Ethnicity: 2000 Census and 2006 Estimates .............................................................................................................156
Table 8.4 Carbon County Nonfarm Employment by Industry, 1970–2007 ........................159 Table 8.5 Carbon County Nonfarm Employment Shares by Industry, 1970–2007............161 Table 8.6 Carbon County Income Summary, 1970–2007.......................................................164 Table 8.7 Carbon County Nonfarm Earnings by Industry, 1970–2007................................166 Table 8.8 Carbon County Nonfarm Earnings Shares by Industry, 1970–2007 ...................168 Table 8.9 Carbon County Nonfarm Earnings Location Quotients by Industry,
1970–2007.....................................................................................................................170 Table 8.10 Carbon County Retail Sales by Category, 1978–2008 ............................................172 Table 8.11 2008 Retail Sales in Carbon County..........................................................................172 Table 8.12 Emery County Nonfarm Employment by Industry, 1970–2007..........................177 Table 8.13 Emery County Nonfarm Employment Shares by Industry, 1970–2007 .............179 Table 8.14 Emery County Income Summary, 1970–2007 ........................................................182 Table 8.15 Emery County Nonfarm Earnings by Industry, 1970–2007 .................................184 Table 8.16 Emery County Nonfarm Earnings Shares by Industry, 1970–2007 ....................186 Table 8.17 Emery County Nonfarm Earnings Location Quotients by Industry,
1970–2007.....................................................................................................................187 Table 8.18 Emery County Retail Sales by Category, 1978–2008..............................................189 Table 8.19 2008 Retail Sales in Emery County ...........................................................................189 Table 8.20 Sevier County Nonfarm Employment by Industry, 1970–2007...........................194 Table 8.21 Sevier County Nonfarm Employment Shares by Industry, 1970–2007 ..............195 Table 8.22 Sevier County Income Summary, 1970–2007 .........................................................198 Table 8.23 Sevier County Nonfarm Earnings by Industry, 1970–2007 ..................................200 Table 8.24 Sevier County Nonfarm Earnings Shares by Industry, 1970–2007......................202 Table 8.25 Sevier County Nonfarm Earnings Location Quotients by Industry,
1970–2007.....................................................................................................................204 Table 8.26 Sevier County Retail Sales by Category, 1978–2008...............................................206 Table 8.27 2008 Retail Sales in Sevier County ............................................................................206

The Structure and Economic Impact of Utah’s Coal Industry
vi B U R E A U O F E C O N O M I C A N D B U S I N E S S R E S E A R C H
L I S T O F F I G U R E S Figure 1.1 Productivity of Utah Coal Mining.................................................................................2 Figure 1.2 Utah Coal Seams and Active Mines..............................................................................4 Figure 1.3 Utah Coal Production Since 1870.................................................................................5 Figure 1.4 Fuel Source Composition of Utah Electric Power Generation................................6 Figure 1.5 Utah Coal Production, 2000–2030..............................................................................10 Figure 1.6a Utah Coal Production, 2000–2030: Low Scenario ...................................................11 Figure 1.6b Utah Coal Production, 2000–2030: Middle Scenario ...............................................11 Figure 1.6c Utah Coal Production, 2000–2030: High Scenario...................................................12 Figure 1.7 Carbon County Coal Production, 2000–2030 ...........................................................12 Figure 1.8 Emery County Coal Production, 2000–2030 ............................................................13 Figure 1.9 Sevier County Coal Production, 2000–2030..............................................................13 Figure 1.10 State Employment Impacts, 2007–2030 ....................................................................14 Figure 1.11 Carbon County Employment Impacts, 2007–2030..................................................15 Figure 1.12 Emery County Employment Impacts, 2007–2030 ...................................................16 Figure 1.13 Sevier County Employment Impacts, 2007–2030 ....................................................17 Figure 1.14 Utah Coal Production and Power Plant Employment, 2000–2008 .......................21
Figure 2.1 Productivity of Utah Coal Mining...............................................................................27 Figure 2.2 U.S. Coal Resources and Reserves ..............................................................................29 Figure 2.3 Utah Coal Seams and Active Mines............................................................................30 Figure 2.4 U.S. Coal Production Since 1949 ................................................................................31 Figure 2.5 Distribution of World Coal Production in 2008.......................................................32 Figure 2.6 Utah Coal Production Since 1870...............................................................................33 Figure 2.7 Composition of U.S. Coal Consumption Since 1949...............................................34 Figure 2.8 Fuel Source Composition of U.S. Electric Power Generation ...............................35 Figure 2.9 Composition of Utah Coal Consumption Since 1960 .............................................36 Figure 2.10 Fuel Source Composition of Utah Electric Power Generation..............................36
Figure 4.1 Utah Coal Production, 2000–2030..............................................................................52 Figure 4.2a Utah Coal Production, 2000–2030: Low Scenario ...................................................52 Figure 4.2b Utah Coal Production, 2000–2030: Middle Scenario ...............................................53 Figure 4.2c Utah Coal Production, 2000–2030: High Scenario...................................................53 Figure 4.3a Carbon County Coal Production, 2000–2030 ...........................................................54 Figure 4.3b Emery County Coal Production, 2000–2030 ............................................................54 Figure 4.3c Sevier County Coal Production, 2000–2030..............................................................55 Figure 4.4 Rocky Mountain Low-Sulfur Bituminous Coal Projected Price per Ton .............56
Figure 5.1a State Employment Impacts, 2007–2030 ....................................................................69 Figure 5.1b State Population Impacts, 2007–2030 ........................................................................70 Figure 5.1c State Earnings Impacts, 2007–2030............................................................................70 Figure 5.1d Statewide Local Tax Revenue Impacts, 2007–2030 .................................................71 Figure 5.1e Statewide State Tax Revenue Impacts, 2007–2030...................................................71 Figure 5.2a Carbon County Employment Impacts, 2007–2030..................................................81 Figure 5.2b Carbon County Population Impacts, 2007–2030 .....................................................82 Figure 5.2c Carbon County Earnings Impacts, 2007–2030 .........................................................82 Figure 5.2d Carbon County Local Tax Revenue Impacts, 2007–2030.......................................83

The Structure and Economic Impact of Utah’s Coal Industry
B U R E A U O F E C O N O M I C A N D B U S I N E S S R E S E A R C H vii
Figure 5.2e Carbon County State Tax Revenue Impacts, 2007–2030 ........................................83 Figure 5.3a Emery County Employment Impacts, 2007–2030 ...................................................93 Figure 5.3b Emery County Population Impacts, 2007–2030 .......................................................94 Figure 5.3c Emery County Earnings Impacts, 2007–2030...........................................................94 Figure 5.3d Emery County Local Tax Revenue Impacts, 2007–2030 ........................................95 Figure 5.3e Emery County State Tax Revenue Impacts, 2007–2030..........................................95 Figure 5.4a Sevier County Employment Impacts, 2007–2030 ................................................. 105 Figure 5.4b Sevier County Population Impacts, 2007–2030 ..................................................... 106 Figure 5.4c Sevier County Earnings Impacts, 2007–2030......................................................... 106 Figure 5.4d Sevier County Local Tax Revenue Impacts, 2007–2030....................................... 107 Figure 5.4e Sevier County State Tax Revenue Impacts, 2007–2030........................................ 107 Figure 5.5a Coal Counties Employment Impacts, 2007–2030 ................................................. 117 Figure 5.5b Coal Counties Population Impacts, 2007–2030 ..................................................... 118 Figure 5.5c Coal Counties Earnings Impacts, 2007–2030......................................................... 118 Figure 5.5d Coal Counties Local Tax Revenue Impacts, 2007–2030 ...................................... 119 Figure 5.5e Coal Counties State Tax Revenue Impacts, 2007–2030........................................ 119 Figure 5.6a Non-Coal Counties Employment Impacts, 2007–2030........................................ 129 Figure 5.6b Non-Coal Counties Population Impacts, 2007–2030............................................ 130 Figure 5.6c Non-Coal Counties Earnings Impacts, 2007–2030 ............................................... 130 Figure 5.6d Non-Coal Counties Local Tax Revenue Impacts, 2007–2030............................. 131 Figure 5.6e Non-Coal Counties State Tax Revenue Impacts, 2007–2030 .............................. 131 Figure 5.7a Low Scenario Employment Impacts........................................................................ 135 Figure 5.7b Middle Scenario Employment Impacts ................................................................... 135 Figure 5.7c High Scenario Employment Impacts....................................................................... 136
Figure 6.1 Utah Coal Production and Power Plant Employment, 2000–2008 .................... 137
Figure 8.1a Carbon County Nonfarm Employment by SIC Industry, 1970–2000 ............... 160 Figure 8.1b Carbon County Nonfarm Employment by NAICS Industry, 2001–2007......... 160 Figure 8.2 Carbon County Components of Personal Income, 1970–2007 .......................... 165 Figure 8.3a Carbon County Nonfarm Earnings by SIC Industry, 1970–2000....................... 167 Figure 8.3b Carbon County Nonfarm Earnings by NAICS Industry, 2001–2007 ................ 167 Figure 8.4 Carbon County Basic Industries’ Location Quotients, 2001–2007..................... 171 Figure 8.5a Emery County Nonfarm Employment by SIC Industry, 1970–2000................. 177 Figure 8.5b Emery County Nonfarm Employment by NAICS Industry, 2001–2007 .......... 178 Figure 8.6 Emery County Components of Personal Income, 1970–2007............................ 183 Figure 8.7a Emery County Nonfarm Earnings by SIC Industry, 1970–2000 ........................ 185 Figure 8.7b Emery County Nonfarm Earnings by NAICS Industry, 2001–2007.................. 185 Figure 8.8 Emery County Basic Industries’ Location Quotients, 2001–2007 ...................... 188 Figure 8.9a Sevier County Nonfarm Employment by SIC Industry, 1970–2000.................. 194 Figure 8.9b Sevier County Nonfarm Employment by NAICS Industry, 2001–2007 ........... 195 Figure 8.10 Sevier County Components of Personal Income, 1970–2007 ............................. 199 Figure 8.11a Sevier County Nonfarm Earnings by SIC Industry, 1970–2000 ......................... 201 Figure 8.11b Sevier County Nonfarm Earnings by NAICS Industry, 2001–2007................... 201 Figure 8.12 Sevier County Basic Industries’ Location Quotients, 2001–2007 ....................... 205

The Structure and Economic Impact of Utah’s Coal Industry
viii B U R E A U O F E C O N O M I C A N D B U S I N E S S R E S E A R C H
L I S T O F E X H I B I T S Exhibit 8.1 Carbon County Population Estimates and Components of Population
Change, 1940–2008 .....................................................................................................146 Exhibit 8.2 Carbon County Population by Age and Sex, Race, and Ethnicity: 2000.............147 Exhibit 8.3 Emery County Population Estimates and Components of Population
Change, 1940–2008 .....................................................................................................150 Exhibit 8.4 Emery County Population by Age and Sex, Race, and Ethnicity: 2000 ..............151 Exhibit 8.5 Sevier County Population Estimates and Components of Population
Change, 1940–2008 .....................................................................................................154 Exhibit 8.6 Sevier County Population by Age and Sex, Race, and Ethnicity: 2000 ...............155 Exhibit 8.7 Carbon County Employment Summary, 1970–2007 .............................................158 Exhibit 8.8 Carbon County Nonfarm Employment Location Quotients by Industry,
1970–2007.....................................................................................................................162 Exhibit 8.9 Permit-Authorized New Dwelling Units and Value of Residential
Construction in Carbon County, 1975–2008 ..........................................................173 Exhibit 8.10 Value of Nonresidential Construction in Carbon County, 1975–2008 ...............174 Exhibit 8.11 Emery County Employment Summary, 1970–2007...............................................176 Exhibit 8.12 Emery County Nonfarm Employment Location Quotients by Industry,
1970–2007.....................................................................................................................180 Exhibit 8.13 Permit-Authorized New Dwelling Units and Value of Residential
Construction in Emery County, 1975–2008............................................................190 Exhibit 8.14 Value of Nonresidential Construction in Emery County, 1975–2008.................191 Exhibit 8.15 Sevier County Employment Summary, 1970–2007................................................193 Exhibit 8.16 Sevier County Nonfarm Employment Location Quotients by Industry,
1970–2007.....................................................................................................................196 Exhibit 8.17 Permit-Authorized New Dwelling Units and Value of Residential
Construction in Sevier County, 1975–2008.............................................................207 Exhibit 8.18 Value of Nonresidential Construction in Sevier County, 1975–2008..................208

The Structure and Economic Impact of Utah’s Coal Industry
B U R E A U O F E C O N O M I C A N D B U S I N E S S R E S E A R C H 1
E X E C U T I V E S U M M A RY
Utah’s coal industry has played a significant role in the economic development of the state for well over a century. The future of the industry is dependent upon a constellation of economic, technical, and policy developments. This study of Utah’s coal industry is composed of the fol-lowing sections:
1.) Executive Summary; 2.) Utah’s Coal Industry: An overview of the coal industry in Utah, examining characteristics,
trends, and policy context over time, as well as future prospects; 3.) Coal Production Impacts: The 2007 economic and demographic impacts of coal produc-
tion on the coal mining counties of Carbon, Emery, and Sevier, as well as the rest of the state;
4.) Coal Production Scenarios: Specifies the three county-level coal production scenarios for 2008 through 2030;
5.) Impacts of Coal Production Scenarios: Detailed economic, population, and selected gov-ernment revenue impacts of three future coal production scenarios from 2008 through 2030 for coal counties and the entire state;
6.) County Profiles: Detailed analysis of the economic and demographic characteristics of Utah’s coal counties;
7.) Additional Fiscal Impacts: Royalties and property taxes from coal production and coal-fired power plants; and
8.) Methodology: A detailed description of data and methods in the study. 1.1 Overview
By the time Mormon settlers discovered coal near Cedar City in 1850, the “rock that burns” was already well on its way to becoming king in the eastern United States. Though still a few decades shy of overtaking wood as the nation’s leading source of energy, coal was rapidly replacing it as the fuel of choice for steam locomotives. In cities like Baltimore, street lamps were burning coal-based gas. Pennsylvania’s anthracite coal, having been dismissed as a fuel earlier in the century and once famously relegated to sidewalk gravel in Philadelphia, was beginning to challenge—and would eventually overcome—charcoal as a heat source in iron making. But Utah’s coal boom would have to wait until 1882, when the arrival of the Rio Grande West-ern Railroad opened the Carbon County coal fields. The immediate and pronounced impact of the railroad is apparent from the fourfold increase in production from 52,000 tons in 1881 to 200,000 tons in 1883—the first full year after the railroad’s completion. By 1900, annual produc-tion had surpassed 1 million tons and coal mining employed nearly 1,000 persons. Though annual coal production by the end of the 20th century was about 20 times greater than in 1900, the number of those employed in coal mining had only approximately doubled. The increasing productivity of labor—the average amount of coal produced per worker over some given amount of time (typically, one day)—due to the displacement of labor by machinery is an ongoing feature of Utah coal production, with implications for the future contribution of the coal mining industry to Utah’s broader economy. In the earliest days, coal mining was highly la-bor intensive—typically involving only a miner, hand tools, and a cart. It was soon discovered
1

The Structure and Economic Impact of Utah’s Coal Industry
2 B U R E A U O F E C O N O M I C A N D B U S I N E S S R E S E A R C H
that much of the work of chipping at the coal with a pickaxe could be saved with the use of ex-plosives. Production became increasingly capital intensive through the turn of the century, as pneumatic drills, trams, railways, and cutting machines were introduced and quickly deployed. Though 90 percent of Utah coal was hand-mined in 1911, by 1915 hand-mined coal had fallen to 48 percent of total coal produced, with the percent cut by machine rising from 3 percent to 50 percent.1 Labor productivity naturally paralleled this trend. In 1890, labor productivity was 2.57 tons per employee per day, but by the 1920s this had more than doubled. The trend of in-creasing capitalization generally continued through the 20th century, with the deployment of continuous and longwall mining machines being particularly important. In spite of productivity declines in recent years, the average amount of coal produced per employee per day had risen to 46 tons by 2008. Figure 1.1 shows the labor productivity of Utah’s coal industry since 1963.
Three features of Utah’s coal are particularly important for understanding its past and possible future development. First is its low sulfur content. When coal is burned in an electric power plant, the sulfur it contains combines with oxygen to produce sulfur dioxide. Sulfur dioxide is “considered harmful to public health and the environment” and is regulated by the Environ-mental Protection Agency pursuant to the Clean Air Act. New coal plants, being subject to more stringent emission standards than plants built decades ago, are required to remove a large frac-tion of the sulfur dioxide from their exhaust gas before it exits the stack and enters the atmos-phere. Removing sulfur dioxide is costly both in that it entails additional capital costs and its operation consumes a part of the power generated (termed “parasitic energy loss”). The more sulfur present in the coal or the larger the fraction that must be removed from the exhaust gas, the higher the equipment costs and the greater the parasitic energy loss. This means that, all else being equal, as low-sulfur coals—like those typically found in Utah and Wyoming—can generate
1 “Measures of Economic Changes in Utah: 1847–1947,” Utah Economic and Business Review, Vol. 7 No. 1, December 1947, p. 78.
Figure 1.1 Productivity of Utah Coal Mining
0
500
1,000
1,500
2,000
2,500
3,000
3,500
4,000
4,500
5,000
1963
1966
1969
1972
1975
1978
1981
1984
1987
1990
1993
1996
1999
2002
2005
2008
Nu
mb
er
of
Em
plo
yees
0
10
20
30
40
50
60
70
80
To
ns p
er
Em
plo
yee p
er
Day
Employees (left scale) Productivity (right scale)
Source: Utah Geological Survey, Utah Energy and Mineral Statistics.

The Structure and Economic Impact of Utah’s Coal Industry
B U R E A U O F E C O N O M I C A N D B U S I N E S S R E S E A R C H 3
power at lower costs, they are also able to command a higher price. If national air quality stan-dards for sulfur dioxide tighten—as EPA has recently proposed—Utah’s coal industry would fare better relative to its counterparts mining high-sulfur eastern coals. Another distinguishing feature of Utah’s coal is its “heating value,” an expression of the energy released when coal is burned. Coal is a bulky fuel compared with its heating value. Whereas the heating value of a typical ton of oil (about 280 gallons)—a once-popular fuel in electric power generation—is about 38 million British thermal units (BTU), the heating value of a typical ton of coal ranges from approximately 13,000 BTU (about the same as for a ton of firewood) for lignite and the subbituminous coals to 26,000 BTU for bituminous and anthracite coals. For two oth-erwise equal coals, the one with the higher heating value will ordinarily fetch a higher price. A typical Utah coal is bituminous, with a heating value of 24,000 BTU—about 50 percent higher than that of Wyoming’s subbituminous coal. Thus, low sulfur but high energy content are two advantages Utah’s coal has relative to most of the country’s other coals. The most conspicuous and important difference between Utah and Wyoming coal is how the deposits at operating mines are situated in the ground. Whereas all of Utah’s present coal pro-duction takes place in deep underground mines, almost all of Wyoming’s coal reserve is close enough to the surface (within a few hundred feet) to make less expensive surface mining tech-niques applicable. Prior to the early 1970s most of the coal mined in the U.S. was produced in underground mines. That situation began to reverse in the mid-1970s when production from Wyoming’s Powder River Basin began in earnest. In 2008, surface-mined coal accounted for 70 percent of U.S. production. Labor productivity from surface-mining operations like those of the Powder River Basin is three times higher than that of Utah’s underground mining operations—though a ton of Powder River Basin coal at the mine is worth less (heating value and market value) than a ton of Utah coal. Other factors held fixed, expensive underground mining tech-niques put Utah coal at a commercial disadvantage compared with surface-mined coal. 1.1.1 Coal Reserves and Production
1.1.1.1 Reserves As of 2009, Utah’s estimated recoverable reserves of coal amounted to 2.7 billion tons (1 per-cent of U.S.), of which 212 million tons are located in mines that are currently producing. An-other 212 million tons of coal suited to surface mining are counted among Utah’s total estimated recoverable reserves, though all of Utah’s producing reserves are in underground mines. Because the Energy Information Administration’s measure of Utah’s estimated recoverable reserves in-cludes only resources economically mineable and also located on land that is not off-limits to mining, it does not include the very rich Kaiparowits Plateau field located in Kane and Garfield counties. Before deducting that part of the resource that would be uneconomical to mine at pre-sent, the Kaiparowits field contains about 9 billion tons of coal. But the field was effectively put off-limits for development in 1996 when then-President Clinton designated over 1.7 million acres of southern Utah as the Grand Staircase–Escalante National Monument. Figure 1.2 shows the state’s major coal seams and active mines.

The Structure and Economic Impact of Utah’s Coal Industry
4 B U R E A U O F E C O N O M I C A N D B U S I N E S S R E S E A R C H
Figure 1.2 Utah Coal Seams and Active Mines
Source: Bureau of Economic and Business Research and Utah Automated Geographic Reference Center.
1.1.1.2 Production By the end of 2008 cumulative coal production in Utah had surpassed 1 billion tons.2 To put this in perspective, consider that in 2008 alone the U.S. produced almost 20 percent more than Utah’s entire historical production through 2008, while Wyoming produced an amount equal to almost half of Utah’s cumulative production. The distribution of Utah’s coal production is historically and presently concentrated in Carbon, Emery, and Sevier counties. Between 1870 and 1959, 78 percent of the coal produced in Utah came from Carbon County. Carbon County’s share of total coal production since 1960 fell to 27
2 “Cumulative coal production” is the sum of all coal produced in Utah since 1870.

The Structure and Economic Impact of Utah’s Coal Industry
B U R E A U O F E C O N O M I C A N D B U S I N E S S R E S E A R C H 5
percent as production greatly increased in Emery and Sevier counties. There is presently no coal production outside of these three counties, which collectively account for 99 percent of all the coal ever mined in Utah. Figure 1.3 shows Utah coal production since 1870. A rapid increase in production is seen just prior to World War I, with production levels peaking near the end of the conflict. The subse-quent slowdown during the 1920s, given the rapid economic growth taking place in the U.S. at the time, might best be described as a return to peacetime market conditions. Production was tempered during the 1930s by the Great Depression, but strongly spurred on just before and during World War II. In the succeeding 25 years, coal lost ground in every major market except electric power generation. Between the early 1970s and the early 1990s, production growth was interrupted only by national recessions. Production in 2008 was 24.3 million tons—near the most recent 15-year average of 25.3 million tons and well above the most productive year of the 1980s (17.1 million tons in 1989). The rapid growth during this time period has leveled off in recent years.
Figure 1.3 Utah Coal Production Since 1870
0.0
5.0
10.0
15.0
20.0
25.0
30.0
1870
1877
1884
1891
1898
1905
1912
1919
1926
1933
1940
1947
1954
1961
1968
1975
1982
1989
1996
2003
Mil
lio
ns o
f T
on
s
$0
$10
$20
$30
$40
$50
$60
$70
$80
$90
$100
Co
nsta
nt
20
08
Do
llars
per
To
n
Production (left scale)Mine Price (right scale)
Note: Production figures prior to 1940 are decadal. “Mine Price” is the price of coal at the mine and excludes transportation charges. Sources: Bureau of Economic and Business Research, A Brief History of the Utah Coal Industry, 1977 (for data through 1960); Utah Geological Survey, Utah Energy and Mineral Statistics (for data since 1960).
1.1.2 Markets
Coal-fired generation now accounts for 50 percent of U.S. net electricity generation. If coal-fired electricity generation is important nationally, it is much more so in Utah. In 2008, coal-fired gen-eration originating in Utah produced 38 out of a total 46.6 BKWH of net electricity—82 percent of net generation. Though this is well above the U.S. average, it’s actually a step down from the period of 1980–2005, when coal averaged 94 percent of generation. This recent departure is not because coal-based generation has decreased, but because the share of gas-fired generation has increased faster than total generation. Between 2005 and 2008, gas-fired generation increased its share from 3 percent (1.2 BKWH) to 16 percent (7.4 BKWH). Figure 1.4 shows the shares by energy source of Utah’s electric power generation since 1960.

The Structure and Economic Impact of Utah’s Coal Industry
6 B U R E A U O F E C O N O M I C A N D B U S I N E S S R E S E A R C H
Figure 1.4 Fuel Source Composition of Utah Electric Power Generation
0%
20%
40%
60%
80%
100%
1960
1963
1966
1969
1972
1975
1978
1981
1984
1987
1990
1993
1996
1999
2002
2005
2008
Sh
are
of
Gen
era
tio
n
RestNatural GasPetroleumCoal
Note: Includes power generated by electric utilities and by non-utilities. Source: Utah Geological Survey, Utah Energy and Mineral Statistics.
1.1.3 Challenges
Apart from any hidden costs (“negative externalities”) arising, for example, from the pollutants emitted as a combustion byproduct, coal-fired generation is among the least expensive means for producing electricity. Of critical importance to Utah’s coal industry in the future is the extent to which efforts to internalize some of coal’s negative externalities are successful. Within the last several years there were four new coal-fired power units still planned for con-struction in Utah: An 86-megawatt addition to Deseret Power’s 500 MW Bonanza power plant near Vernal, a 900 MW addition to two existing 900 MW units at the Intermountain Power Agency’s (IPA) Intermountain Power Project (IPP) near Delta, a 400 MW addition to Pacifi-Corp’s three-unit Hunter Plant near Castle Dale, and a 270 MW unit at a new plant in Sigurd. These four proposals have been intensely challenged on the basis of their potential environ-mental impacts—mainly greenhouse gas emissions and traditional air pollution—and the eco-nomic uncertainty arising out of a looming but highly unsettled regime for regulating CO2. 1.1.4 Options for Coal-Based Electricity Generation
The most important barrier to further growth in coal-fired generation is the cost of reducing emissions of those pollutants traditionally regulated by the Clean Air Act and those that might be, under a looming but as yet unknown regime for limiting emissions of greenhouse gases like CO2. As the challenges to current proposals show, even the possibility of such limits can hold up new coal-fired generation. Provided the demand for coal stays closely tied to the demand for electricity, the prospects for coal mining will be linked to how readily coal-based power genera-tion can adapt, if necessary, to accommodate more stringent emissions requirements. While a substantial charge for CO2 would decrease the competitiveness of coal-fired electricity generation, provided carbon capture and sequestration turns out to be a viable process there ap-

The Structure and Economic Impact of Utah’s Coal Industry
B U R E A U O F E C O N O M I C A N D B U S I N E S S R E S E A R C H 7
pear to be several options available that would allow Utah to continue to lean on coal for a sub-stantial portion of its energy needs. 1.2 Economic Impacts
Coal production in Utah generates economic impacts because it is classified as either export base or import substitution production. Most Utah coal is used by power plants that in turn sell elec-tricity to customers in Utah and other states. Because Utah has coal-fired power plants, it does not have to purchase electricity from out-of-state producers. This means that coal production in Carbon, Emery, and Sevier counties generates economic impacts for the producing counties as well as for the state as a whole. In addition to the jobs and income generated by the coal opera-tors (termed “direct impacts”), other firms supply equipment and services to the coal producers. Some of these firms employ people who reside in the coal counties or elsewhere in Utah, and these are categorized as “indirect impacts.” Then, all of the jobs (direct and indirect) generate incomes that support households which in turn demand goods and services, some of which are produced in the coal-producing counties or elsewhere in Utah (termed “induced impacts”). All of these economic impacts generate tax revenues and support a larger population than would otherwise be possible. Of course, a larger population demands more services (police, sanitation, education, etc.) as well as infrastructure (roads, water, sewer, etc.), and these are generally pro-vided by state and local government. The economic and demographic impacts of coal production for 2007 and for scenarios of pro-duction from 2008 through 2030 have been evaluated here using the REMI 29-region, 23-sector model built for Utah. The population and economy of each county in Utah are represented in the model. The sum of the impacts of all counties is equivalent to the state impact. Direct eco-nomic activity for 2007 and beyond was imputed to the coal-producing counties according to actual production levels in 2007 and scenarios into the future. For this study, the RIMS II and IMPLAN models were also used to calibrate state-level parameters. The detailed 2007 employment, population, earnings, and local and state government revenue impacts are shown in the scenario analysis tables, presented later in this document. Note that 2007 impacts are identical in each scenario. This is because they are based on historical data. The 2007 summary impacts of coal production are shown in Table 1.1. In 2007, 24.3 million tons of coal were produced in Utah. The county distribution, in millions of tons, was 11.8 in Carbon, 5.8 from Emery, and 6.7 from Sevier. Estimated direct employment at the mines and their facilities was 1,888, with employment of 770 in Carbon, 753 in Emery, and 360 in Sevier. Total employment impacts (direct plus all others) of 2007 coal production are estimated to be 4,703, which includes the above-mentioned 1,888 in direct employment plus 2,815 additional jobs, a ratio of 2.5-to-1. Not surprisingly, most of these employment impacts (4,017, or 85 per-cent of the total) are concentrated in the coal counties, with 686 in the rest of the state. About half of the employment impacts in the coal counties are estimated to have occurred in Carbon County. On a statewide basis, 42 percent of employment impacts were in Carbon County, 28 percent in Emery County, 16 percent in Sevier County, and 15 percent in the rest of the state.

The Structure and Economic Impact of Utah’s Coal Industry
8 B U R E A U O F E C O N O M I C A N D B U S I N E S S R E S E A R C H
Table 1.1 Coal Production Summary Impacts, 2007
(Dollar Amounts in Millions of Current Dollars)
Employment Population Earnings Local
Revenue State
Revenue Carbon County 1,957 2,936 $62.6 $0.3 $4.8 Emery County 1,309 1,964 $47.4 $0.1 $3.5 Sevier County 751 1,127 $18.2 $0.1 $1.4 Coal Counties 4,017 6,026 $128.2 $0.5 $9.8 Rest of State 686 1,029 $68.1 $0.3 $5.3 Total State 4,703 7,055 $196.3 $0.8 $15.0
Share of Total
Employment Population Earnings Local
Revenue State
Revenue Carbon County 41.6% 41.6% 31.9% 40.6% 31.9% Emery County 27.8% 27.8% 24.1% 12.3% 23.5% Sevier County 16.0% 16.0% 9.3% 11.8% 9.4% Coal Counties 85.4% 85.4% 65.3% 64.7% 64.8% Rest of State 14.6% 14.6% 34.7% 35.3% 35.2% Total State 100% 100% 100% 100% 100% Notes: Earnings is by place of work, not place of residence. Employment is a jobs count consistent with the Bureau of Economic Analysis definition and measured at the place of work. State revenue impacts are income taxes, sales taxes, and other taxes. Local revenue impacts are total general sales and use taxes and restaurant taxes. Sources: Economic and demographic impacts generated using the REMI model. Revenue impacts generated by BEBR using methods documented in this report.
Population impacts associated with this additional economic activity totaled 7,055 persons in 2007. This is the additional population supported by the economic impact of coal mining in 2007. This includes population impacts of 2,936 in Carbon County, 1,964 in Emery County, 1,127 in Sevier County, and 1,029 in the rest of the state. Nominal earnings impacts for 2007 are estimated to be $196.3 million for the state. These were distributed within the state as follows: $62.6 million in Carbon County, $47.4 million in Emery County, $18.2 million in Sevier County, and $68.1 million in the rest of the state. An estimated $0.8 million in local tax revenue in 2007 is associated with these earnings impacts. They are estimated to have been distributed as follows: $0.3 million for Carbon County, $0.1 million for both Emery and Sevier counties, and $0.3 million for the rest of the state. State tax revenues generated by these earnings impacts are an estimated $15.0 million; $4.8 million gener-ated in Carbon County, $3.5 million in Emery County, $1.4 million in Sevier County, and $5.3 million for the rest of the state.
1.3 Production Scenarios
The future of coal mining in Utah is dependent on a complex set of economic, geological, tech-nical, and political factors. Electric utilities consume the largest share of coal produced in Utah, and this should continue to be the case into the foreseeable future. According to the Energy In-formation Administration, coal will continue to provide the largest share of energy for U.S. elec-tricity generation, even as alternative energy sources are developed.3 Assuming that Utah mining 3 Energy Information Administration. 2009. “Electricity Demand,” from Annual Energy Outlook 2009 with Projections to 2030, available at http://www.eia.doe.gov/oiaf/aeo/electricity.html.

The Structure and Economic Impact of Utah’s Coal Industry
B U R E A U O F E C O N O M I C A N D B U S I N E S S R E S E A R C H 9
operations remain competitive rela-tive to other potential coal and al-ternative energy sources, mines should continue to produce to at least 2030, although there is some uncertainty. The Utah Geological Survey (UGS) prepared a set of coal projection scenarios to be used in this study: Low, Middle, and High production (Tables 1.2a–1.2c). In all three sce-narios, the UGS assumed that there is a continued depletion at existing mines. In the Low Scenario, new mines have difficulty with permit-ting, and demand declines due to the development of affordable al-ternative fuels and increased green-house gas regulation. Growth is further restricted in this scenario as export markets do not develop. In the Middle Scenario, new mines are permitted and begin to produce coal, but demand growth is slow as older electric generation plants are shut down and not replaced. The High Scenario also assumes the de-velopment of new reserves, but, in addition, increasing demand. This
increase in demand is from three sources: 1) successful carbon-capture technology and, in con-sequence, new power plants; 2) successful implementation of coal-to-liquids and coal-to-gas plants; and 3) increasing exports to the Pacific Rim. All three scenarios follow the same assumed production path from 2008 through 2014, with an-nual production declining from 24.0 million tons in 2008 to 23.5 million tons each year from 2009 through 2011. Production increases to 25.5 million tons in both 2012 and 2013, and then increases further to 27.5 million tons in 2014. All three scenarios decline from 2015 through 2019, with the Middle and High scenarios taking the same path to reach 23.5 million tons and the Low Scenario declining to 19.5 million tons. From 2020 to 2030, the growth paths diverge, with the Low Scenario continuing to decline to reach 14.5 million tons annually for each year from 2027 through 2030 and the Middle Scenario declining to 20.5 million tons annually over the same period. In the High Scenario, production also declines from 2014 to a level of 22.5 mil-lion tons in 2018, but then increases to a constant annual production of 30.5 million tons from 2022 to 2026. In this scenario, annual production drops to 29.5 million tons for the remainder of the projection period (2027–2030) (Figure 1.5).
Table 1.2a Utah Coal Production, 2000–2030:
Low Scenario (Thousands of Tons)
Year Carbon Emery Sevier Subtotal Other Total 2000 4,615 16,399 5,906 26,920 0 26,920 2001 5,689 14,334 7,001 27,024 0 27,024 2002 6,007 11,692 7,600 25,299 0 25,299 2003 7,091 8,852 7,126 23,069 0 23,069 2004 8,772 5,477 7,568 21,817 0 21,817 2005 9,618 7,372 7,567 24,556 0 24,556 2006 11,560 6,662 7,908 26,131 0 26,131 2007 11,811 5,765 6,712 24,288 0 24,288 2008 11,400 5,700 6,900 24,000 0 24,000 2009 10,500 6,000 7,000 23,500 0 23,500 2010 10,500 6,000 7,000 23,500 0 23,500 2011 10,500 6,000 7,000 23,500 0 23,500 2012 10,500 7,000 7,000 24,500 1,000 25,500 2013 10,500 7,000 7,000 24,500 1,000 25,500 2014 10,500 8,000 7,000 25,500 2,000 27,500 2015 8,500 9,000 6,000 23,500 2,000 25,500 2016 6,500 9,000 6,000 21,500 2,000 23,500 2017 4,500 10,000 6,000 20,500 2,000 22,500 2018 2,500 9,000 6,000 17,500 2,000 19,500 2019 2,500 9,000 6,000 17,500 2,000 19,500 2020 1,500 9,000 6,000 16,500 2,000 18,500 2021 500 8,000 6,000 14,500 2,000 16,500 2022 500 8,000 6,000 14,500 2,000 16,500 2023 500 8,000 5,000 13,500 2,000 15,500 2024 500 8,000 5,000 13,500 2,000 15,500 2025 500 8,000 5,000 13,500 2,000 15,500 2026 500 8,000 5,000 13,500 2,000 15,500 2027 500 7,000 5,000 12,500 2,000 14,500 2028 500 7,000 5,000 12,500 2,000 14,500 2029 500 7,000 5,000 12,500 2,000 14,500 2030 500 7,000 5,000 12,500 2,000 14,500
Note: Historical data through 2007, projections from 2008 through 2030. Source: Utah Geological Survey.

The Structure and Economic Impact of Utah’s Coal Industry
10 B U R E A U O F E C O N O M I C A N D B U S I N E S S R E S E A R C H
Figure 1.5 Utah Coal Production, 2000–2030
10.0
15.0
20.0
25.0
30.0
35.0
2000
2002
2004
2006
2008
2010
2012
2014
2016
2018
2020
2022
2024
2026
2028
2030
Mil
lio
ns o
f T
on
s
HighMiddleLow
Note: Historical data through 2007, projections from 2008 through 2030. Source: Utah Geological Survey.
Table 1.2b Utah Coal Production, 2000–2030:
Middle Scenario (Thousands of Tons)
Year Carbon Emery Sevier Subtotal Other Total 2000 4,615 16,399 5,906 26,920 0 26,920 2001 5,689 14,334 7,001 27,024 0 27,024 2002 6,007 11,692 7,600 25,299 0 25,299 2003 7,091 8,852 7,126 23,069 0 23,069 2004 8,772 5,477 7,568 21,817 0 21,817 2005 9,618 7,372 7,567 24,556 0 24,556 2006 11,560 6,662 7,908 26,131 0 26,131 2007 11,811 5,765 6,712 24,288 0 24,288 2008 11,400 5,700 6,900 24,000 0 24,000 2009 10,500 6,000 7,000 23,500 0 23,500 2010 10,500 6,000 7,000 23,500 0 23,500 2011 10,500 6,000 7,000 23,500 0 23,500 2012 10,500 7,000 7,000 24,500 1,000 25,500 2013 10,500 7,000 7,000 24,500 1,000 25,500 2014 10,500 8,000 7,000 25,500 2,000 27,500 2015 9,500 9,000 6,000 24,500 2,000 26,500 2016 8,500 9,000 6,000 23,500 2,000 25,500 2017 6,500 10,000 6,000 22,500 2,000 24,500 2018 4,500 10,000 6,000 20,500 2,000 22,500 2019 4,500 11,000 6,000 21,500 2,000 23,500 2020 3,500 12,000 6,000 21,500 2,000 23,500 2021 2,500 12,000 6,000 20,500 2,000 22,500 2022 2,500 12,000 6,000 20,500 2,000 22,500 2023 2,500 12,000 5,000 19,500 2,000 21,500 2024 2,500 12,000 5,000 19,500 2,000 21,500 2025 2,500 12,000 5,000 19,500 2,000 21,500 2026 2,500 12,000 5,000 19,500 2,000 21,500 2027 2,500 11,000 5,000 18,500 2,000 20,500 2028 2,500 11,000 5,000 18,500 2,000 20,500 2029 2,500 11,000 5,000 18,500 2,000 20,500 2030 2,500 11,000 5,000 18,500 2,000 20,500
Note: Historical data through 2007, projections from 2008 through 2030. Source: Utah Geological Survey.
Table 1.2c Utah Coal Production, 2000–2030:
High Scenario (Thousands of Tons)
Year Carbon Emery Sevier Subtotal Other Total 2000 4,615 16,399 5,906 26,920 0 26,920 2001 5,689 14,334 7,001 27,024 0 27,024 2002 6,007 11,692 7,600 25,299 0 25,299 2003 7,091 8,852 7,126 23,069 0 23,069 2004 8,772 5,477 7,568 21,817 0 21,817 2005 9,618 7,372 7,567 24,556 0 24,556 2006 11,560 6,662 7,908 26,131 0 26,131 2007 11,811 5,765 6,712 24,288 0 24,288 2008 11,400 5,700 6,900 24,000 0 24,000 2009 10,500 6,000 7,000 23,500 0 23,500 2010 10,500 6,000 7,000 23,500 0 23,500 2011 10,500 6,000 7,000 23,500 0 23,500 2012 10,500 7,000 7,000 24,500 1,000 25,500 2013 10,500 7,000 7,000 24,500 1,000 25,500 2014 10,500 8,000 7,000 25,500 2,000 27,500 2015 9,500 9,000 6,000 24,500 2,000 26,500 2016 8,500 9,000 6,000 23,500 2,000 25,500 2017 6,500 10,000 6,000 22,500 2,000 24,500 2018 4,500 10,000 6,000 20,500 2,000 22,500 2019 4,500 11,000 6,000 21,500 2,000 23,500 2020 4,500 15,000 6,000 25,500 2,000 27,500 2021 3,500 15,000 6,000 24,500 2,000 26,500 2022 4,500 18,000 6,000 28,500 2,000 30,500 2023 5,500 18,000 5,000 28,500 2,000 30,500 2024 5,500 18,000 5,000 28,500 2,000 30,500 2025 5,500 18,000 5,000 28,500 2,000 30,500 2026 5,500 18,000 5,000 28,500 2,000 30,500 2027 5,500 17,000 5,000 27,500 2,000 29,500 2028 5,500 17,000 5,000 27,500 2,000 29,500 2029 5,500 17,000 5,000 27,500 2,000 29,500 2030 5,500 17,000 5,000 27,500 2,000 29,500
Note: Historical data through 2007, projections from 2008 through 2030. Source: Utah Geological Survey.

The Structure and Economic Impact of Utah’s Coal Industry
B U R E A U O F E C O N O M I C A N D B U S I N E S S R E S E A R C H 11
In the last year of historical data (2007), Carbon County accounted for nearly half (49 percent) of the coal produced in the state, with Sevier County accounting for 28 percent and Emery County accounting for 24 percent. In all three scenarios, Carbon County production falls beneath that of Emery and, in two out of three, also below Sevier. In all scenarios, Emery becomes the largest coal-producing county in the state, and a smaller amount of coal production (2.0 million tons annually) is developed outside the current three-county coal region (Figures 1.6a–1.6c).
Figure 1.6a
Utah Coal Production, 2000–2030: Low Scenario
0.0
2.0
4.0
6.0
8.0
10.0
12.0
14.0
16.0
18.02000
2002
2004
2006
2008
2010
2012
2014
2016
2018
2020
2022
2024
2026
2028
2030
Mil
lio
ns o
f T
on
s
CarbonEmerySevierOther
Note: Historical data through 2007, projections from 2008 through 2030. Source: Utah Geological Survey.
Figure 1.6b
Utah Coal Production, 2000–2030: Middle Scenario
0.0
2.0
4.0
6.0
8.0
10.0
12.0
14.0
16.0
18.0
2000
2002
2004
2006
2008
2010
2012
2014
2016
2018
2020
2022
2024
2026
2028
2030
Mil
lio
ns o
f T
on
s
CarbonEmerySevierOther
Note: Historical data through 2007, projections from 2008 through 2030. Source: Utah Geological Survey.

The Structure and Economic Impact of Utah’s Coal Industry
12 B U R E A U O F E C O N O M I C A N D B U S I N E S S R E S E A R C H
Figure 1.6c Utah Coal Production, 2000–2030: High Scenario
0.0
2.0
4.0
6.0
8.0
10.0
12.0
14.0
16.0
18.0
20.0
2000
2002
2004
2006
2008
2010
2012
2014
2016
2018
2020
2022
2024
2026
2028
2030
Mil
lio
ns o
f T
on
s
CarbonEmerySevierOther
Note: Historical data through 2007, projections from 2008 through 2030. Source: Utah Geological Survey.
In all three scenarios, Carbon County coal production is constant at an annual rate of 10.5 mil-lion tons from 2009 through 2014. In the Low Scenario, production collapses to 0.5 million tons by 2021 and remains there throughout the rest of the projection period. In the Middle Scenario, Carbon County production also declines, but maintains a steady output at 2.5 million tons annu-ally from 2021 through 2030. In the High Scenario, coal production declines to 3.5 million tons in Carbon County in 2021, then rebounds to a steady annual output of 5.5 million tons from 2023 through 2030 (Figure 1.7).
Figure 1.7
Carbon County Coal Production, 2000–2030
0.0
2.0
4.0
6.0
8.0
10.0
12.0
14.0
2000
2002
2004
2006
2008
2010
2012
2014
2016
2018
2020
2022
2024
2026
2028
2030
Mil
lio
ns o
f T
on
s
HighMiddleLow
Note: Historical data through 2007, projections from 2008 through 2030. Source: Utah Geological Survey.

The Structure and Economic Impact of Utah’s Coal Industry
B U R E A U O F E C O N O M I C A N D B U S I N E S S R E S E A R C H 13
For Emery County, all scenarios follow the same path through 2017 to increase steadily to an-nual production of 10.0 million tons. In the Low Scenario, production declines to reach 7.0 mil-lion tons for each year from 2027 through 2030. The Middle Scenario increases to plateau at 12.0 million tons from 2020 through 2026, then declines to a steady annual production of 11.0 million tons for the duration of the projection. In the High Scenario, Emery County coal pro-duction rises to 18.0 million tons in the years 2022 through 2026, then declines to an annual rate of 17.0 million tons from 2027 through 2030 (Figure 1.8).
Figure 1.8
Emery County Coal Production, 2000–2030
0.0
2.0
4.0
6.0
8.0
10.0
12.0
14.0
16.0
18.0
20.02000
2002
2004
2006
2008
2010
2012
2014
2016
2018
2020
2022
2024
2026
2028
2030
Mil
lio
ns o
f T
on
s
HighMiddleLow
Note: Historical data through 2007, projections from 2008 through 2030. Source: Utah Geological Survey.
Sevier County has an identical coal production projection in all three scenarios. Production de-clines in three steps, from 7.0 million tons annually in the years 2009 through 2014, then 6.0 mil-lion tons annually from 2015 through 2022, and finally to 5.0 million tons annually from 2023 through the end of the projection period (Figure 1.9).
Figure 1.9
Sevier County Coal Production, 2000–2030
0.0
1.0
2.0
3.0
4.0
5.0
6.0
7.0
8.0
9.0
2000
2002
2004
2006
2008
2010
2012
2014
2016
2018
2020
2022
2024
2026
2028
2030
Mil
lio
ns o
f T
on
s
HighMiddleLow
Note: Historical data through 2007, projections from 2008 through 2030. Source: Utah Geological Survey.
The Structure and Economic Impact of Utah’s Coal Industry
14 B U R E A U O F E C O N O M I C A N D B U S I N E S S R E S E A R C H
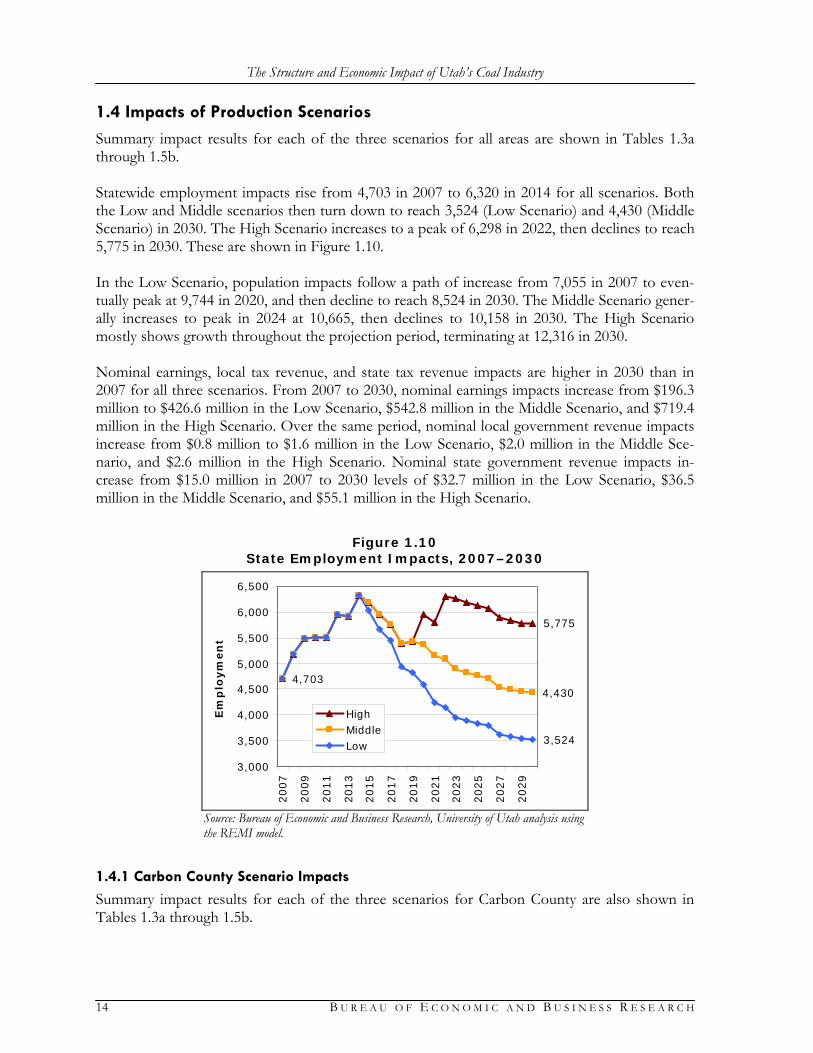
1.4 Impacts of Production Scenarios
Summary impact results for each of the three scenarios for all areas are shown in Tables 1.3a through 1.5b. Statewide employment impacts rise from 4,703 in 2007 to 6,320 in 2014 for all scenarios. Both the Low and Middle scenarios then turn down to reach 3,524 (Low Scenario) and 4,430 (Middle Scenario) in 2030. The High Scenario increases to a peak of 6,298 in 2022, then declines to reach 5,775 in 2030. These are shown in Figure 1.10. In the Low Scenario, population impacts follow a path of increase from 7,055 in 2007 to even-tually peak at 9,744 in 2020, and then decline to reach 8,524 in 2030. The Middle Scenario gener-ally increases to peak in 2024 at 10,665, then declines to 10,158 in 2030. The High Scenario mostly shows growth throughout the projection period, terminating at 12,316 in 2030. Nominal earnings, local tax revenue, and state tax revenue impacts are higher in 2030 than in 2007 for all three scenarios. From 2007 to 2030, nominal earnings impacts increase from $196.3 million to $426.6 million in the Low Scenario, $542.8 million in the Middle Scenario, and $719.4 million in the High Scenario. Over the same period, nominal local government revenue impacts increase from $0.8 million to $1.6 million in the Low Scenario, $2.0 million in the Middle Sce-nario, and $2.6 million in the High Scenario. Nominal state government revenue impacts in-crease from $15.0 million in 2007 to 2030 levels of $32.7 million in the Low Scenario, $36.5 million in the Middle Scenario, and $55.1 million in the High Scenario.
Figure 1.10
State Employment Impacts, 2007–2030
5,775
4,430
3,524
4,703
3,000
3,500
4,000
4,500
5,000
5,500
6,000
6,500
2007
2009
2011
2013
2015
2017
2019
2021
2023
2025
2027
2029
Em
plo
ym
en
t
HighMiddleLow
Source: Bureau of Economic and Business Research, University of Utah analysis using the REMI model.
1.4.1 Carbon County Scenario Impacts
Summary impact results for each of the three scenarios for Carbon County are also shown in Tables 1.3a through 1.5b.

The Structure and Economic Impact of Utah’s Coal Industry
B U R E A U O F E C O N O M I C A N D B U S I N E S S R E S E A R C H 15
Impacts follow the general path of the coal production scenarios. In all scenarios, coal produc-tion in Carbon County declines from 2007 to 2030. In 2007, Carbon County accounted for nearly half of the coal produced in the state, with Sevier County accounting for 28 percent and Emery County accounting for 24 percent. In all three scenarios, Carbon County production falls beneath that of Emery and, in two out of three, also below Sevier. In all scenarios, Emery be-comes the largest coal-producing county in the state, and a smaller amount of coal production is developed outside the current three-county coal region. Carbon County employment impacts, shown in Figure 1.11, fall from 1,957 in 2007 to reach 701 in the Low Scenario, 977 in the Middle Scenario, and 1,378 in the High Scenario in 2030. In the Low Scenario, population impacts follow a path of increase from 2,936 in 2007 to even-tually peak in 2017 at 3,368, and then decline to 2,344 in 2030. The Middle Scenario generally increases to peak in 2019 at 3,515, then declines to 2,967 in 2030. The High Scenario mostly shows slow growth throughout the projection period, terminating at 3,758 in 2030. Nominal earnings, local tax revenue, and state tax revenue impacts are higher in 2030 than 2007 for all three scenarios. There is a similar pattern of increasing until 2014, then declining until 2021, then again increasing until 2030. From 2007 to 2030, nominal earnings impacts increase from $62.6 million to $65.5 million in the Low Scenario, $91.9 million in the Middle Scenario, and $130.7 million in the High Scenario. Over the same period, nominal local government reve-nue impacts remain flat at $0.3 million in the Low Scenario, while increasing to $0.5 million in the Middle Scenario and $0.7 million in the High Scenario. Nominal state government revenue impacts increase from $4.8 million in 2007 to 2030 levels of $5.0 million in the Low Scenario, $7.0 million in the Middle Scenario, and $10.0 million in the High Scenario.
Figure 1.11
Carbon County Employment Impacts, 2007–2030
1,378
977
701
1,957
500
700
900
1,100
1,300
1,500
1,700
1,900
2,100
2,300
2007
2009
2011
2013
2015
2017
2019
2021
2023
2025
2027
2029
Em
plo
ym
en
t
HighMiddleLow
Source: Bureau of Economic and Business Research, University of Utah analysis using the REMI model.
1.4.2 Emery County Scenario Impacts
Summary impact results for each of the three scenarios for Emery County are also shown in Ta-bles 1.3a through 1.5b.

The Structure and Economic Impact of Utah’s Coal Industry
16 B U R E A U O F E C O N O M I C A N D B U S I N E S S R E S E A R C H
The impacts measured here follow the general path of the coal production scenarios. Coal pro-duction in Emery County declines from 2007 to 2030 in the Low Scenario, increases somewhat in the Middle Scenario, and increases in the High Scenario. In all scenarios, Emery becomes the largest coal-producing county in the state. Emery County employment impacts follow a pattern of increasing to a peak and then declining in all scenarios, as shown in Figure 1.12. From an initial employment impact of 1,309 in 2007, employment peaks in 2017 in the Low Scenario at 1,812, in 2020 in the Middle Scenario at 1,940, and in 2022 in the High Scenario at 2,501. While all scenarios decline from these peaks, both the Middle and High Scenarios result in higher employment impacts in 2030 than in 2007. Employ-ment impacts for 2030 are 1,220 in the Low Scenario, 1,616 in the Middle Scenario, and 2,214 in the High Scenario.
Figure 1.12
Emery County Employment Impacts, 2007–2030
2,214
1,616
1,2201,309
1,000
1,200
1,400
1,600
1,800
2,000
2,200
2,400
2,600
2007
2009
2011
2013
2015
2017
2019
2021
2023
2025
2027
2029
Em
plo
ym
en
t
HighMiddleLow
Source: Bureau of Economic and Business Research, University of Utah analysis using the REMI model.
Population impacts for Emery County are higher in 2030 than in 2007 for all three scenarios. These population impacts generally increase from 2007 to 2019 in all three scenarios, growing from 1,964 in 2007 to 2,475 in the Low Scenario and to 2,804 in both the Middle and High Sce-narios. From 2019 to 2030, population impacts decline to reach 2,186 in the Low Scenario, stay mostly flat to reach 2,720 in the Middle Scenario, and increase to 3,457 in the High Scenario. Nominal earnings, local tax revenue, and state tax revenue impacts are higher in 2030 than 2007 for all three scenarios for Emery County. From 2007 to 2030, nominal earnings impacts increase from $47.4 million to $132.1 million in the Low Scenario, $175.1 million in the Middle Scenario, and $240.2 million in the High Scenario. Over the same period, nominal local government reve-nue impacts increase from $0.1 million to $0.3 million in the Low Scenario, $0.4 million in the Middle Scenario, and $0.5 million in the High Scenario. Nominal state government revenue im-pacts increase from $3.5 million in 2007 to 2030 levels of $9.9 million in the Low Scenario, $13.1 million in the Middle Scenario, and $17.9 million in the High Scenario.

The Structure and Economic Impact of Utah’s Coal Industry
B U R E A U O F E C O N O M I C A N D B U S I N E S S R E S E A R C H 17
1.4.3 Sevier County Scenario Impacts
Summary impact results for each of the three scenarios for Sevier County are also shown in Ta-bles 1.3a through 1.5b. Coal production drives the impacts measured here. All three scenarios are nearly identical for Sevier County, with coal production declining from 2007 to 2030. Employment impacts rise from 751 in 2007 to 1,006 in 2009, then decline to reach roughly 552 in 2030, as shown in Figure 1.13. Population impacts follow the same general path, increasing from 1,127 in 2007 to 1,509 in 2009, then declining to about 1,208 in 2030. Nominal earnings, local tax revenue, and state tax revenue impacts are all higher in 2030 than in 2007 for all three scenarios, following an uneven path through time. Nominal earnings impacts increase from $18.2 million in 2007 to approxi-mately $43.0 million in 2030. Nominal local government revenue impacts increase from $0.1 million in 2007 to $0.2 million in 2030. Nominal state government revenue impacts increase from $1.4 million in 2007 to about $3.3 million in 2030.
Figure 1.13
Sevier County Employment Impacts, 2007–2030
558552548
751
500
600
700
800
900
1,000
1,100
2007
2009
2011
2013
2015
2017
2019
2021
2023
2025
2027
2029
Em
plo
ym
en
t
HighMiddleLow
Source: Bureau of Economic and Business Research, University of Utah analysis using the REMI model.

The Structure and Economic Impact of Utah’s Coal Industry
18 B U R E A U O F E C O N O M I C A N D B U S I N E S S R E S E A R C H
Table 1.3a Summary Impacts: Low Scenario
(Dollar Amounts are Millions of Current Dollars)
2007 2030
Employment Population Earnings Local
Revenue State
Revenue Employment Population Earnings Local
Revenue State
Revenue
Carbon County 1,957 2,936 $62.6 $0.31 $4.8 701 2,344 $65.5 $0.33 $5.0 Emery County 1,309 1,964 $47.4 $0.09 $3.5 1,220 2,186 $132.1 $0.26 $9.9 Sevier County 751 1,127 $18.2 $0.09 $1.4 548 1,200 $42.7 $0.21 $3.3 Coal Counties 4,017 6,026 $128.2 $0.50 $9.8 2,469 5,730 $240.3 $0.81 $18.2 Rest of State 686 1,029 $68.1 $0.27 $5.3 1,055 2,794 $186.3 $0.75 $14.5 Total State 4,703 7,055 $196.3 $0.77 $15.0 3,524 8,524 $426.6 $1.55 $32.7
Share of Total Employment Population Earnings Local
Revenue State
Revenue Employment Population Earnings Local
Revenue State
Revenue
Carbon County 41.6% 41.6% 31.9% 40.6% 31.9% 19.9% 27.5% 15.4% 21.1% 15.3% Emery County 27.8% 27.8% 24.1% 12.3% 23.5% 34.6% 25.6% 31.0% 17.0% 30.2% Sevier County 16.0% 16.0% 9.3% 11.8% 9.4% 15.6% 14.1% 10.0% 13.8% 10.2% Coal Counties 85.4% 85.4% 65.3% 64.7% 64.8% 70.1% 67.2% 56.3% 51.9% 55.7% Rest of State 14.6% 14.6% 34.7% 35.3% 35.2% 29.9% 32.8% 43.7% 48.1% 44.3% Total State 100% 100% 100% 100% 100% 100% 100% 100% 100% 100% Note: Pink shading indicates the area’s share of the category is projected to be smaller in 2030 than in 2007; green shading indicates it is projected to be larger. Sources: Economic and demographic impacts generated using the REMI model. Revenue impacts generated by BEBR using methods documented in this report.
Table 1.3b Summary Impacts—Changes from 2007 to 2030: Low Scenario
(Dollar Amounts are Millions of Current Dollars)
Levels Percentages
Employment Population Earnings Local
Revenue State
Revenue Employment Population Earnings Local
Revenue State
Revenue
Carbon County –1,256 –592 $2.9 $0.01 $0.2 –64.2% –20.1% 4.6% 4.6% 4.6% Emery County –89 223 $84.7 $0.17 $6.3 –6.8% 11.3% 178.6% 178.6% 178.6% Sevier County –203 74 $24.5 $0.12 $1.9 –27.0% 6.5% 134.3% 134.3% 134.3% Coal Counties –1,548 –296 $112.0 $0.31 $8.4 –38.5% –4.9% 87.4% 61.4% 86.6% Rest of State 369 1,765 $118.2 $0.47 $9.2 53.8% 171.5% 173.7% 173.7% 173.7% Total State –1,179 1,470 $230.2 $0.78 $17.6 –25.1% 20.8% 117.3% 101.0% 117.2% Sources: Economic and demographic impacts generated using the REMI model. Revenue impacts generated by BEBR using methods documented in this report.

The Structure and Economic Impact of Utah’s Coal Industry
B U R E A U O F E C O N O M I C A N D B U S I N E S S R E S E A R C H 19
Table 1.4a Summary Impacts: Middle Scenario (Dollar Amounts are Millions of Current Dollars)
2007 2030
Employment Population Earnings Local
Revenue State
Revenue Employment Population Earnings Local
Revenue State
Revenue
Carbon County 1,957 2,936 $62.6 $0.31 $4.8 977 2,967 $91.9 $0.46 $7.0 Emery County 1,309 1,964 $47.4 $0.09 $3.5 1,616 2,720 $175.1 $0.35 $13.1 Sevier County 751 1,127 $18.2 $0.09 $1.4 552 1,208 $43.0 $0.21 $3.3 Coal Counties 4,017 6,026 $128.2 $0.50 $9.8 3,145 6,895 $310.0 $1.02 $23.5 Rest of State 686 1,029 $68.1 $0.27 $5.3 1,285 3,263 $232.9 $0.93 $18.1 Total State 4,703 7,055 $196.3 $0.77 $15.0 4,430 10,158 $542.8 $1.96 $41.6
Share of Total Employment Population Earnings Local
Revenue State
Revenue Employment Population Earnings Local
Revenue State
Revenue
Carbon County 41.6% 41.6% 31.9% 40.6% 31.9% 22.1% 29.2% 16.9% 23.5% 16.9% Emery County 27.8% 27.8% 24.1% 12.3% 23.5% 36.5% 26.8% 32.3% 17.9% 31.5% Sevier County 16.0% 16.0% 9.3% 11.8% 9.4% 12.5% 11.9% 7.9% 11.0% 8.0% Coal Counties 85.4% 85.4% 65.3% 64.7% 64.8% 71.0% 67.9% 57.1% 52.4% 56.4% Rest of State 14.6% 14.6% 34.7% 35.3% 35.2% 29.0% 32.1% 42.9% 47.6% 43.6% Total State 100% 100% 100% 100% 100% 100% 100% 100% 100% 100% Note: Pink shading indicates the area’s share of the category is projected to be smaller in 2030 than in 2007; green shading indicates it is projected to be larger. Sources: Economic and demographic impacts generated using the REMI model. Revenue impacts generated by BEBR using methods documented in this report.
Table 1.4b Summary Impacts—Changes from 2007 to 2030: Middle Scenario
(Dollar Amounts are Millions of Current Dollars)
Levels Percentages
Employment Population Earnings Local
Revenue State
Revenue Employment Population Earnings Local
Revenue State
Revenue
Carbon County –980 32 $29.3 $0.15 $2.2 –50.1% 1.1% 46.7% 46.7% 46.7% Emery County 307 757 $127.7 $0.26 $9.5 23.5% 38.5% 269.3% 269.3% 269.3% Sevier County –199 82 $24.8 $0.12 $1.9 –26.5% 7.2% 135.7% 135.7% 135.7% Coal Counties –872 870 $181.7 $0.53 $13.7 –21.7% 14.4% 141.7% 105.3% 140.5% Rest of State 599 2,234 $164.8 $0.66 $12.8 87.3% 217.1% 242.1% 242.1% 242.1% Total State –273 3,104 $346.5 $1.18 $26.5 –5.8% 44.0% 176.5% 153.6% 176.2% Sources: Economic and demographic impacts generated using the REMI model. Revenue impacts generated by BEBR using methods documented in this report.

The Structure and Economic Impact of Utah’s Coal Industry
20 B U R E A U O F E C O N O M I C A N D B U S I N E S S R E S E A R C H
Table 1.5a Summary Impacts: High Scenario (Dollar Amounts are Millions of Current Dollars)
2007 2030
Employment Population Earnings Local
Revenue State
Revenue Employment Population Earnings Local
Revenue State
Revenue
Carbon County 1,957 2,936 $62.6 $0.31 $4.8 1,378 3,758 $130.7 $0.65 $10.0 Emery County 1,309 1,964 $47.4 $0.09 $3.5 2,214 3,457 $240.2 $0.48 $17.9 Sevier County 751 1,127 $18.2 $0.09 $1.4 558 1,218 $43.4 $0.22 $3.4 Coal Counties 4,017 6,026 $128.2 $0.50 $9.8 4,150 8,433 $414.3 $1.35 $31.3 Rest of State 686 1,029 $68.1 $0.27 $5.3 1,625 3,883 $305.1 $1.22 $23.7 Total State 4,703 7,055 $196.3 $0.77 $15.0 5,775 12,316 $719.4 $2.57 $55.1
Share of Total Employment Population Earnings Local
Revenue State
Revenue Employment Population Earnings Local
Revenue State
Revenue
Carbon County 41.6% 41.6% 31.9% 40.6% 31.9% 23.9% 30.5% 18.2% 25.4% 18.2% Emery County 27.8% 27.8% 24.1% 12.3% 23.5% 38.3% 28.1% 33.4% 18.7% 32.6% Sevier County 16.0% 16.0% 9.3% 11.8% 9.4% 9.7% 9.9% 6.0% 8.4% 6.1% Coal Counties 85.4% 85.4% 65.3% 64.7% 64.8% 71.9% 68.5% 57.6% 52.5% 56.9% Rest of State 14.6% 14.6% 34.7% 35.3% 35.2% 28.1% 31.5% 42.4% 47.5% 43.1% Total State 100% 100% 100% 100% 100% 100% 100% 100% 100% 100% Note: Pink shading indicates the area’s share of the category is projected to be smaller in 2030 than in 2007; green shading indicates it is projected to be larger. Sources: Economic and demographic impacts generated using the REMI model. Revenue impacts generated by BEBR using methods documented in this report.
Table 1.5b Summary Impacts—Changes from 2007 to 2030: High Scenario
(Dollar Amounts are Millions of Current Dollars)
Levels Percentages
Employment Population Earnings Local
Revenue State
Revenue Employment Population Earnings Local
Revenue State
Revenue
Carbon County –579 823 $68.1 $0.34 $5.2 –29.6% 28.0% 108.7% 108.7% 108.7% Emery County 905 1,494 $192.8 $0.39 $14.4 69.1% 76.1% 406.7% 406.7% 406.7% Sevier County –193 92 $25.1 $0.13 $2.0 –25.7% 8.1% 137.9% 137.9% 137.9% Coal Counties 133 2,408 $286.0 $0.85 $21.6 3.3% 40.0% 223.0% 170.7% 221.1% Rest of State 939 2,854 $237.0 $0.95 $18.4 136.9% 277.4% 348.2% 348.2% 348.2% Total State 1,072 5,262 $523.0 $1.80 $40.0 22.8% 74.6% 266.4% 233.3% 265.9% Sources: Economic and demographic impacts generated using the REMI model. Revenue impacts generated by BEBR using methods documented in this report.
1.5 Power Plant Impacts
No discussion of the economic impacts of Utah coal production would be complete without consideration of electricity generation from coal plants. Certainly these plants are, at present, the greatest source of demand for Utah coal. In 2007, a record volume of coal was delivered to elec-tric utilities located in Utah. According to Michael Vanden Berg of the Utah Geological Survey, no new plants are expected to be built for the foreseeable future, so the demand should remain relatively flat.4 Employment in Utah’s coal-fired power plants (NAICS 221112) and annual coal production (in millions of tons) are shown in Figure 1.14. Employment in these power plants has remained around 1,100 recently.
4 Michael D. Vanden Berg, Annual Review and Forecast of Utah Coal Production and Distribution—2007, Circular 107, Utah Geological Survey, 2008.

The Structure and Economic Impact of Utah’s Coal Industry
B U R E A U O F E C O N O M I C A N D B U S I N E S S R E S E A R C H 21
Figure 1.14 Utah Coal Production and Power Plant Employment,
2000–2008
1,102
1,000
1,020
1,040
1,060
1,080
1,100
1,120
2000
2001
2002
2003
2004
2005
2006
2007
2008
Po
wer
Pla
nt
Em
plo
ym
en
t
20.0
21.0
22.0
23.0
24.0
25.0
26.0
27.0
28.0
Co
al
Pro
du
cti
on
(Mill
ions
of
Tons)
EmploymentProduction
Sources: Utah Department of Workforce Services and Utah Geological Survey.
Average annual employment in 2007 was 1,100. The distribution of employment that was as-sumed for this analysis is shown in Table 1.6. 1.5.1 State-Level Scenario Impacts
Summary impact results for the middle scenario for the state of Utah are shown in Table 1.7. Statewide employment impacts rise from 8,368 in 2007 to 10,387 in 2030. Given the power plant’s direct employment of 1,100, these are very high total employment impacts, a ratio of 7.6 to 1. This is because of the high wages of the industry in combination with the in-state purchases required by the plants. Importantly, the coal purchases are not included in these impacts. They are in addition. In the middle scenario population impacts follow a path of increase from 12,552 in 2007 to reach 28,510 in 2030. Nominal earnings, local tax reve-nue, and state tax revenue impacts are all higher in 2030 than in 2007. From 2007 to 2030, nominal earnings impacts increase from $346.4 mil-lion to $1,179.7 million in 2030. Over the same period, nominal local gov-ernment revenue impacts increase from $1.4 million to $4.6 million. Nominal state government revenue impacts increase from $24.5 million in 2007 to $83.3 million in 2030.
Table 1.6 2007
Employment in Coal-Fired
Power Plants by County
County Jobs Carbon 70 Davis 3 Emery 354 Millard 380 Salt Lake 86 Uintah 177 Utah 30 Total 1,100 Source: BEBR estimates from DWS data.

The Structure and Economic Impact of Utah’s Coal Industry
22 B U R E A U O F E C O N O M I C A N D B U S I N E S S R E S E A R C H
Table 1.7 Power Plants, Middle Scenario:
Summary Impacts (Dollar Amounts are Millions of Current Dollars)
Year Employment Population Earnings Local
Revenue State
Revenue 2007 8,368 12,552 $346.4 $1.4 $24.5 2008 8,804 13,206 $375.1 $1.5 $26.5 2009 9,120 13,680 $398.7 $1.6 $28.2 2010 9,232 13,848 $410.7 $1.6 $29.0 2011 9,293 13,940 $431.5 $1.7 $30.5 2012 9,333 14,000 $452.7 $1.8 $32.0 2013 9,344 15,256 $474.7 $1.9 $33.5 2014 9,363 16,767 $497.8 $2.0 $35.2 2015 9,386 18,139 $523.6 $2.1 $37.0 2016 9,402 19,367 $548.9 $2.2 $38.8 2017 9,428 20,481 $575.1 $2.3 $40.6 2018 9,489 21,480 $605.6 $2.4 $42.8 2019 9,559 22,410 $638.8 $2.5 $45.1 2020 9,636 23,267 $674.5 $2.7 $47.7 2021 9,738 24,068 $714.1 $2.8 $50.4 2022 9,827 24,797 $755.6 $3.0 $53.4 2023 9,919 25,465 $800.4 $3.1 $56.5 2024 10,010 26,072 $847.4 $3.3 $59.9 2025 10,089 26,616 $896.7 $3.5 $63.4 2026 10,166 27,086 $948.8 $3.7 $67.0 2027 10,236 27,515 $1,003.0 $3.9 $70.9 2028 10,295 27,897 $1,059.6 $4.2 $74.9 2029 10,345 28,227 $1,118.4 $4.4 $79.0 2030 10,387 28,510 $1,179.7 $4.6 $83.3
Notes: Historical data for 2007, projections from 2008 through 2030. Earnings is by place of work, not place of residence. Employment is a jobs count consistent with the Bureau of Economic Analysis definition and also measured at the place of work. State revenue impacts are income taxes, sales taxes, and other taxes. Local revenue impacts are total general sales and use taxes and restaurant taxes. Sources: Economic and demographic impacts generated using the REMI model. Revenue impacts generated by BEBR using methods documented in this report.
Because of the speculative nature of the specific location and type of power plant construction and closure, the high and low scenarios were not modeled for this part of the study. 1.6 Additional Fiscal Impacts
In addition to employment and wage impacts, the coal industry also has fiscal impacts on the local areas in which it operates. Fiscal impacts refer to impacts on government finances and tax collections. The coal industry is subject to the tax laws common to all businesses; there are also impacts unique to the industry. Production on federal land is subject to a royalty payment under the Mineral Lands Leasing Act of 1920. This royalty is paid to the Minerals Management Service, an agency within the U.S. De-partment of Interior. A portion of the federal mineral royalties is returned to the state of origin, generally one-half. Royalties from production on Indian lands are returned to the appropriate tribe, not to the state government. The states have full discretion as to the distribution of federal mineral royalties as long as priority is given to areas with economic and/or social impacts from

The Structure and Economic Impact of Utah’s Coal Industry
B U R E A U O F E C O N O M I C A N D B U S I N E S S R E S E A R C H 23
leasing activities. The Minerals Management Service does not release federal mineral royalty data at the county level, but statewide data are available. Federal mineral royalties due to coal production in Utah have decreased in recent years, from $33.2 million in fiscal year 2001 to less than $23.0 million in 2008 (Table 1.8). Coal production accounted for just 5 percent of the royal-ties paid for mineral production on federal land in Utah in 2008. There was also an additional $905,500 paid in bo-nuses and rents on federal mineral leases. These are fees associated with awarding federal mineral leases and main-taining the leases until production is initiated. Table 1.8 in-cludes royalties due to coal production, but does not include bonus or rent payments for federal coal leases. Of the $23.0 million paid in federal mineral royalties by the coal industry in Utah, $12.0 million was returned to the state government. The School and Institutional Trust Lands Administration (SITLA) controls mineral rights on approximately 4.4 mil-lion acres in Utah. These lands are held in trust for Utah’s public schools and 11 other benefici-aries. They were established at statehood and through land exchanges with the federal govern-ment. During fiscal year 2008, royalties paid for coal mining on SITLA lands totaled $10.5 million (Table 1.9). This was 7 percent of total SITLA revenue for the year. These funds are not returned to the county of origin, but are placed in a permanent fund managed by the state treas-
urer on behalf of the public schools or distrib-uted to the appropriate beneficiary as mandated. Dividends and interest from the Public School Fund are distributed annually to all Utah public schools based on an established formula. The individual counties levy property taxes on natural resources developed within their borders, including coal, metallic minerals, and oil and gas. The Utah State Tax Commission centrally as-sesses coal properties based on the discounted cash flow of expected future production. The local county treasurers bill and collect the taxes. Property taxes are levied by numerous units of local government, including county and city gov-ernments, school districts, and special service districts. Table 1.10 shows property taxes charged against coal mines in Carbon, Emery, and Sevier counties from 2000 to 2008. These
three counties account for more than 99 percent of coal property taxes in the state. Over the period, total taxes paid to the three counties were fairly constant, fluctuating between $4.1 mil-lion and $4.6 million, with a spike to $5.6 million in 2006 (all amounts are in constant 2008 dol-lars). Coal property taxes in Carbon County were only slightly higher in 2008 ($2.1 million) than
Table 1.8 Federal Coal Royalty
Payments and Disbursements to Utah,
2001–2008 (Constant 2008 Dollars)
Year Royalties
Paid to U.S. Disbursed
to Utah 2001 $33,205,069 $17,594,615 2002 $25,599,536 $12,957,504 2003 $25,034,853 $10,534,127 2004 $28,196,683 $15,044,196 2005 $30,681,304 $15,347,252 2006 $29,037,311 $14,247,010 2007 $25,595,118 $12,752,867 2008 $22,955,578 $12,006,072
Years are federal fiscal years. Source: U.S. Department of the Interior, Minerals Management Service.
Table 1.9 Rents and Royalties Paid for Coal
Production on SITLA Lands, 2000–2008
(Constant 2008 Dollars)
Year Revenues Garfield Co. Total 2000 $5,269,226 $30,917 $5,300,143 2001 $7,421,084 $181,948 $7,603,032 2002 $7,598,359 $118,340 $7,716,699 2003 $4,750,554 $109,505 $4,860,059 2004 $3,988,161 $113,029 $4,101,189 2005 $1,666,740 $1,666,740 2006 $5,084,333 $5,084,333 2007 $7,069,694 $7,069,694 2008 $10,546,508 $10,546,508
Years are fiscal years, July 1 to June 30. Revenues consist of lease rentals, royalties, and bonus payments from coal mines on trust lands in Carbon, Emery, and Sevier counties. The Garfield County lease was a special business arrangement that terminated in 2004 without any coal production. Source: School and Institutional Trust Lands Administration.

The Structure and Economic Impact of Utah’s Coal Industry
24 B U R E A U O F E C O N O M I C A N D B U S I N E S S R E S E A R C H
they were in 2000 ($1.9 million). In Sevier County, coal taxes were essen-tially unchanged in 2008 compared with 2000, at roughly $1.2 million. However, Emery County saw coal property taxes decline from $1.3 million in 2000 to $824,000 in 2008. Counties also levy property taxes on power plants, based on their fair market value (Table 1.11). Carbon, Emery, Millard, and Uintah are the only coun-ties in the state with coal-fired power plants according to the U.S. Depart-ment of Energy. Emery County cur-rently receives the most property taxes from coal-fired plants, charging $13.4 million in 2008. There are two plants in the county, the three-generator Hunter plant and the two-generator Huntington plant. Both are operated by PacifiCorp and have a combined nameplate capacity of 2,468 MW. Millard County charged $10.4 million in taxes in 2008 on the two-generator Inter-mountain Power Project plant, which is operated by the City of Los Angeles with a total name-plate capacity of 1,640 MW. Uintah County’s single-generator Bonanza plant paid almost $1.5 million in taxes in 2008. It is operated by the Deseret Generation and Transmission Co-op and has a nameplate capacity of 500 MW. There are two coal-fired power plants in Carbon County: PacifiCorp’s two-generator Carbon plant, with a total capacity of 189 MW, and Sunnyside Co-generation Associates’ single-generator plant burning waste coal, with a maximum capacity of 58 MW. The county charged $831,000 in property taxes against the two plants in 2008. All told, Utah’s coal-fired power plants paid almost $26.2 million in property taxes in 2008.
Table 1.11
Property Taxes Charged Against Coal-Fired Power Plants, 2000–2008
(Constant 2008 Dollars)
Year Carbon Emery Millard Uintah Total 2000 $905,623 $17,366,626 $17,758,666 $3,941,820 $39,972,736 2001 $899,785 $17,230,299 $17,333,522 $3,724,173 $39,187,779 2002 $782,137 $14,978,350 $16,357,297 $3,678,422 $35,796,206 2003 $923,649 $13,910,567 $15,433,344 $3,696,689 $33,964,250 2004 $864,711 $13,096,201 $14,582,382 $3,498,665 $32,041,959 2005 $854,149 $12,369,513 $13,541,690 $3,437,457 $30,202,808 2006 $861,243 $13,133,879 $12,243,164 $1,894,125 $28,132,411 2007 $810,946 $13,227,529 $11,419,130 $1,663,557 $27,121,161 2008 $831,042 $13,427,356 $10,443,781 $1,484,168 $26,186,347
Source: Utah State Tax Commission, Property Tax Division Annual Reports.
Table 1.10 Property Taxes Charged Against Coal Mines,
2000–2008 (Constant 2008 Dollars)
Year Carbon Emery Sevier Total 2000 $1,919,753 $1,341,346 $1,207,865 $4,468,964 2001 $1,984,907 $1,112,081 $1,214,826 $4,311,814 2002 $1,916,019 $1,107,510 $1,088,523 $4,112,052 2003 $2,319,574 $1,041,682 $1,052,776 $4,414,032 2004 $2,176,454 $1,306,930 $1,131,553 $4,614,936 2005 $1,719,635 $1,018,394 $1,636,483 $4,374,512 2006 $2,690,528 $1,024,162 $1,885,720 $5,600,411 2007 $2,449,053 $605,127 $1,336,949 $4,391,130 2008 $2,121,553 $824,366 $1,241,458 $4,187,377
Source: Utah State Tax Commission, Property Tax Division Annual Reports.

The Structure and Economic Impact of Utah’s Coal Industry
B U R E A U O F E C O N O M I C A N D B U S I N E S S R E S E A R C H 25
U TA H ’ S C OA L I N D U S T RY 2.1 Introduction
By the time Mormon settlers discovered coal near Cedar City5 in 1850, the “rock that burns” was already well on its way to becoming king in the eastern United States. Though still a few decades shy of overtaking wood as the nation’s leading source of energy, coal was rapidly replacing it as the fuel of choice for steam locomotives. In cities like Baltimore, street lamps were burning coal-based gas. Pennsylvania’s anthracite coal, having been dismissed as a fuel earlier in the century and once famously relegated to sidewalk gravel in Philadelphia, was beginning to challenge—and would eventually overcome—charcoal as a heat source in iron making.6 Production from Utah coal fields did not immediately assume the rapid pace of its eastern coun-terparts. Lacking viable transportation and a ready market, large-scale production in Utah faced obstacles similar to those which the eastern coal fields were only beginning to overcome. The surge in immigration to Utah after 1850 increased the need for space heating and fuel for rapidly expanding smelting operations. Producing coal coke7 adequate to the task of iron smelting from the available local coal proved technically difficult initially.8 There also appears to have been some reluctance among the population to adopt coal in place of wood for space heating.9 But the growing need for heat of some kind meant that the makings of a market for coal were in place. In 1854, the Utah legislature offered $1,000 “to any resident who would open a vein of coal not less than 18 inches thick within 40 miles of Salt Lake City and where it could be prof-itably worked.”10 Mormon settlers claimed the reward five years later upon discovering coal in what would become Coalville in Summit County.11 But Utah’s coal boom would have to wait until 1882, when the arrival of the Rio Grande West-ern Railroad opened the Carbon County coal fields. The immediate and pronounced impact of the railroad is apparent from the fourfold increase in production from 52,000 tons in 1881 to 200,000 tons in 1883—the first full year after the railroad’s completion. By 1900, annual produc-tion had surpassed 1 million tons and coal mining employed nearly 1,000 persons. 5 See Klaus D. Gurgel, “Utah ‘Coal’ Place Names,” Utah Geological and Mineral Survey, 1982. 6 See Alfred D. Chandler Jr., “Anthracite Coal and the Beginnings of the Industrial Revolution in the United States,” The Business History Review, 1972. 7 Coal coke is obtained from coal by baking coal in an oxygen-deprived environment at temperatures up to 2,000 degrees Fahrenheit. This process purges the more volatile compounds, leaving a largely purified, carbon-rich mate-rial (because oxygen is withheld, the carbon in the coal does not have the opportunity to react with oxygen to form carbon monoxide) that is practically smokeless upon burning. The advantage coal coke has over coal for smelting iron is that it has few impurities to impart to the iron ore, and its higher carbon content allows it to draw more oxy-gen out of the ore during heating. The process and objective of making coke from coal is very similar to the process of making charcoal from wood. 8 The historian Hubert Howe Bancroft, writing around 1889, noted that Utah imported 70,000 tons of coal coke and 50,000 tons of coal from Wyoming at an expense of $1.8 million and $4 million (nominal, i.e. “then-dollars”). Up to the time of Bancroft’s writing, coke produced from Utah coal had been more successfully used for lead smelting than for iron smelting. See Hubert Howe Bancroft, History of Utah, 1540–1886, 1889. 9 In an 1855 speech at the Salt Lake Tabernacle, Brigham Young—having recently visited the Sanpete County coal fields—endorsed coal as a replacement for wood in residential heating. Though residents seemed to be put off by its dust, Young argued that this was to him not a worse annoyance than the insect infestations often attending woodpiles. See Gurgel, p. 27. 10 See Bancroft, p. 319. 11 See Gurgel, p. 27.
2

The Structure and Economic Impact of Utah’s Coal Industry
26 B U R E A U O F E C O N O M I C A N D B U S I N E S S R E S E A R C H
Though annual coal production by the end of the 20th century was about 20 times greater than in 1900, the number of those employed in coal mining had only approximately doubled. The increasing productivity of labor—the average amount of coal produced per worker over some given amount of time (typically, one day)—due to the displacement of labor by machinery is an ongoing feature of Utah coal production, with implications for the future contribution of the coal mining industry to Utah’s broader economy. In the earliest days, coal mining was highly la-bor intensive—typically involving only a miner, hand tools, and a cart. It was soon discovered that much of the work of chipping at the coal with a pickaxe could be saved with the use of ex-plosives. Production became increasingly capital intensive through the turn of the century, as pneumatic drills, trams, railways, and cutting machines were introduced and quickly deployed. Though 90 percent of Utah coal was hand-mined in 1911, by 1915 hand-mined coal had fallen to 48 percent of total coal produced, with the percent cut by machine rising from 3 percent to 50 percent.12 Labor productivity naturally paralleled this trend. In 1890, labor productivity was 2.57 tons per employee per day, but by the 1920s this had more than doubled. The trend of in-creasing capitalization generally continued through the 20th century, with the deployment of continuous and longwall mining machines being particularly important. In spite of productivity declines in recent years, the average amount of coal produced per employee per day had risen to 46 tons by 2008. Figure 2.1 shows the labor productivity of Utah’s coal industry since 1963.13 Three features of Utah’s coal are particularly important for understanding its past and possible future development. First is its low sulfur content. When coal is burned in an electric power plant, the sulfur it contains combines with oxygen to produce sulfur dioxide. Sulfur dioxide is “considered harmful to public health and the environment” and is regulated by the Environ-mental Protection Agency pursuant to the Clean Air Act.14,15 New coal plants, being subject to more stringent emission standards than plants built decades ago, are required to remove a large fraction of the sulfur dioxide from their exhaust gas before it exits the stack and enters the at-mosphere. Removing sulfur dioxide is costly both in that it entails additional capital costs and its operation consumes a part of the power generated (termed “parasitic energy loss”). The more sulfur present in the coal or the larger the fraction that must be removed from the exhaust gas, the higher the equipment costs and the greater the parasitic energy loss. This means that, all else being equal, as low-sulfur coals—like those typically found in Utah and Wyoming—can generate
12 “Measures of Economic Changes in Utah: 1847–1947,” Utah Economic and Business Review, Vol. 7 No. 1, December 1947, p. 78. 13 In 1963 the definition of “employee” as used in mining productivity statistics changed, with the definition in use before 1963 being more inclusive. See Bureau of Economic and Business Research, A Brief History of the Utah Coal Industry, 1977, p. 11. This means that productivity as measured post-1963 is somewhat overstated compared with that measured pre-1963. On the other hand, the overstatement may be at least partially offset if the number of hours in a typical workday has decreased. 14 Sulfur dioxide is one of six such “criteria pollutants” established by the EPA. The other five are carbon monox-ide, lead, nitrogen dioxide, ozone, and particulate matter. In accordance with the Clean Air Act, the maximum den-sity of criteria pollutants in “ambient air” is established for each pollutant by the EPA in consideration of the pollutant’s potential impact on human health and welfare. These standards are known as the National Ambient Air Quality Standards. See http://www.epa.gov/air/criteria.html. 15 These regulations do not directly limit a particular power plant’s sulfur dioxide emissions. Instead, they set the maximum allowable concentration of sulfur dioxide, and in most cases leave it to the states to implement a plan to comply with the EPA standard. Subject to their implementation plan, the state issues (or not) operating licenses to power plants that directly set permissible emissions levels for the plant. Typically the states are charged with ensur-ing that their air quality meets or exceeds the standards issued by EPA. The state issues permits for major emitters whose emissions must collectively satisfy federal air quality standards.

The Structure and Economic Impact of Utah’s Coal Industry
B U R E A U O F E C O N O M I C A N D B U S I N E S S R E S E A R C H 27
power at lower costs, they are also able to command a higher price.16,17 If national air quality standards for sulfur dioxide tighten—as EPA has recently proposed—Utah’s coal industry would fare better relative to its counterparts mining high-sulfur eastern coals.18 Another distinguishing feature of Utah’s coal is its “heating value,” an expression of the energy released when coal is burned. Coal is a bulky fuel compared with its heating value. Whereas the heating value of a typical ton of oil (about 280 gallons)—a once-popular fuel in electric power generation—is about 38 million British thermal units (BTU), the heating value of a typical ton of coal ranges from approximately 13,000 BTU (about the same as for a ton of firewood) for lignite and the subbituminous coals to 26,000 BTU for bituminous and anthracite coals. For two oth-erwise equal coals, the one with the higher heating value will ordinarily fetch a higher price. A typical Utah coal is bituminous, with a heating value of 24,000 BTU—about 50 percent higher than that of Wyoming’s subbituminous coal. Thus, low sulfur but high energy content are two advantages Utah’s coal has relative to most of the country’s other coals. The most conspicuous and important difference between Utah and Wyoming coal is how the deposits at operating mines are situated in the ground. Whereas all of Utah’s present coal pro-duction takes place in deep underground mines, almost all of Wyoming’s coal reserve is close
16 Typical coal from the eastern U.S. has approximately three to five times the sulfur content of Utah coal, which consists of between 0.3 and 1 percent sulfur by weight. See Table 2.24 of Chapter 2: “Coal” in Utah Geological Survey’s Utah Energy and Mineral Statistics, at http://geology.utah.gov/emp/energydata/coaldata.htm. 17 As will be discussed later, between Wyoming coal and Utah coal not all—other than sulfur content—is equal. 18 On EPA’s proposal, see http://www.epa.gov/air/sulfurdioxide/actions.html#nov09. EPA claims the newly pro-posed standards—reducing the ambient air density from an allowed maximum 140 parts per billion over a 24-hour period to between 50 and 100 parts per billion—would yield public health benefits valued between 16 billion and 100 billion dollars. “Those benefits would include reduced hospital admissions, emergency room visits, work days lost, cases of aggravated asthma and chronic bronchitis, among others.”
Figure 2.1 Productivity of Utah Coal Mining
Source: Utah Geological Survey, Utah Energy and Mineral Statistics.
0
500
1,000
1,500
2,000
2,500
3,000
3,500
4,000
4,500
5,000
1963
1966
1969
1972
1975
1978
1981
1984
1987
1990
1993
1996
1999
2002
2005
2008
Nu
mb
er
of
Em
plo
yees
0
10
20
30
40
50
60
70
80
To
ns p
er
Em
plo
yee p
er
Day
Employees (left scale) Productivity (right scale)

The Structure and Economic Impact of Utah’s Coal Industry
28 B U R E A U O F E C O N O M I C A N D B U S I N E S S R E S E A R C H
enough to the surface (within a few hundred feet) to make less expensive surface mining tech-niques applicable. Prior to the early 1970s most of the coal mined in the U.S. was produced in underground mines. That situation began to reverse in the mid-1970s when production from Wyoming’s Powder River Basin began in earnest. In 2008, surface-mined coal accounted for 70 percent of U.S. production.19 Labor productivity from surface-mining operations like those of the Powder River Basin is three times higher than that of Utah’s underground mining opera-tions—though a ton of Powder River Basin coal at the mine is worth less (heating value and market value) than a ton of Utah coal. Other factors held fixed, expensive underground mining techniques put Utah coal at a commercial disadvantage compared with surface-mined coal. 2.2 Overview of Coal Reserves and Production
2.2.1 Reserves
As of 2005, U.S. coal estimated recoverable reserves stood at 264 billion tons, accounting for 28 percent of the total world reserves and exceeding those of any other country.20,21,22 Since its founding in 1977, the Energy Information Administration (EIA) has had the responsi-bility of publicizing data on reserves, and has been considered the authoritative source of such information.23 Although 2005 is the most recent year for which worldwide coal reserve data are available from EIA, data on U.S. reserves are current through the end of 2008. As of January 1, 2009, estimated recoverable reserves totaled 262 billion tons. This amount is much larger than the 17.9 billion tons of remaining recoverable coal in currently producing mines (termed recoverable reserves at active mines), but only a small fraction of the estimated 4 trillion tons of coal in the ground (total resources or in-place resources). The part of total resources which are either in measured or indicated re-source categories of reliability are termed the demonstrated reserve base. According to the EIA, the demonstrated reserve base represents “100% of the in-place coal that could be mined commercially at a given time considered.”24 As of January 1, 2009, the U.S. coal demonstrated reserve base was 487.7 billion tons. Taking the part of demonstrated reserve base “that can be mined with today’s mining technology, after accessibility constraints and recovery factors are considered,” one arrives at 261.6 billion tons of estimated recoverable reserves. Figure 2.2 illustrates the foregoing concepts of resource availability.
19 See Table 7.2 of the coal section in EIA’s Annual Energy Review. 20 A short ton equals 2,000 pounds and in the U.S. this unit is what is usually referred to by the abbreviated term ton. The long ton is a unit whose present-day use is widespread only in shipping, where it originated (then called tun) as the weight in pounds of a standardized cask of wine. The metric unit tonne equals 1,000 kilograms (about 2,205 lbs.). In this report, whenever the term ton is used, it refers to short ton, and whenever the term tonne is used, it refers to 1,000 kilograms. 21 Comparing reserves across countries can be problematic since definitions of “reserves” as well as reporting stan-dards may vary across countries (as well as over time within countries). See Gene Whitney, Carl E. Behrens, and Carol Glover, U.S. Fossil Fuel Resources: Terminology, Reporting, and Summary, Congressional Research Service, 2009. 22 International Energy Administration, “Coal Reserves,” at http://www.eia.doe.gov/emeu/international/contents .html. 23 See Whitney, Behrens and Glover, 2009. Note that the data EIA publicizes often originates from state agencies or other federal agencies such as the U.S. Geological Survey and the Minerals Management Service. 24 EIA, Coal Explained—How Much Coal Is Left? at http://tonto.eia.doe.gov/energyexplained/index.cfm?page= coal_reserves.

The Structure and Economic Impact of Utah’s Coal Industry
B U R E A U O F E C O N O M I C A N D B U S I N E S S R E S E A R C H 29
Figure 2.2 U.S. Coal Resources and Reserves
(Billions of Tons as of January 1, 2009)
Source: Energy Information Administration, Coal Explained—How Much Coal Is Left?
Of 17.9 billion tons of recoverable reserves at active mines in the U.S., 5.8 billion tons are situated in underground mines, with surface mines accounting for the remaining 12.1 billion tons. As pro-ducing reserves account for a mere 9 percent of total estimated recoverable reserves, it is appar-ent that there remain vast coal resources in the U.S. that are economic though not yet mined. Of the total 262 billion tons of estimated recoverable reserves, 149 billion tons are amenable to un-derground mining, with the remainder (112.5 billion tons) suited to surface mining. As of 2009, Utah’s estimated recoverable reserves of coal amounted to 2.7 billion tons (1 per-cent of U.S.), of which 212 million tons are located in mines that are currently producing.25 An-other 212 million tons of coal suited to surface mining are counted among Utah’s total estimated recoverable reserves, though all of Utah’s producing reserves are in underground mines. Because the EIA’s measure of Utah’s estimated recoverable reserves includes only resources economi-cally mineable and also located on land that is not off-limits to mining, it does not include the very rich Kaiparowits Plateau field located in Kane and Garfield counties. Before deducting that part of the resource that would be uneconomical to mine at present, the Kaiparowits field con-tains about 9 billion tons of coal.26 But the field was effectively put off-limits for development in 25 See Table 15 of EIA’s “U.S. Coal Reserves Tables” at http://www.eia.doe.gov/cneaf/coal/reserves/reserves.html. 26 See Table 2.3 of Utah Geological Survey’s Utah Energy and Mineral Statistics at http://geology.utah.gov/emp/en-ergydata/coaldata.htm. Note that Utah Geological Survey’s (UGS) “estimated recoverable resource” is a considera-bly more inclusive measure than that of a similar name used by EIA (“estimated recoverable reserves”), or of EIA’s “demonstrated reserve base.” The UGS measure does not account for land-use or economic constraints. Without these constraints, UGS puts Utah’s estimated recoverable resource at 15 billion tons. The EIA measure, which does account for land-use restrictions and economic viability, gives Utah estimated recoverable reserves of 2.4 billion tons from a demonstrated reserve base of 5.2 billion tons.
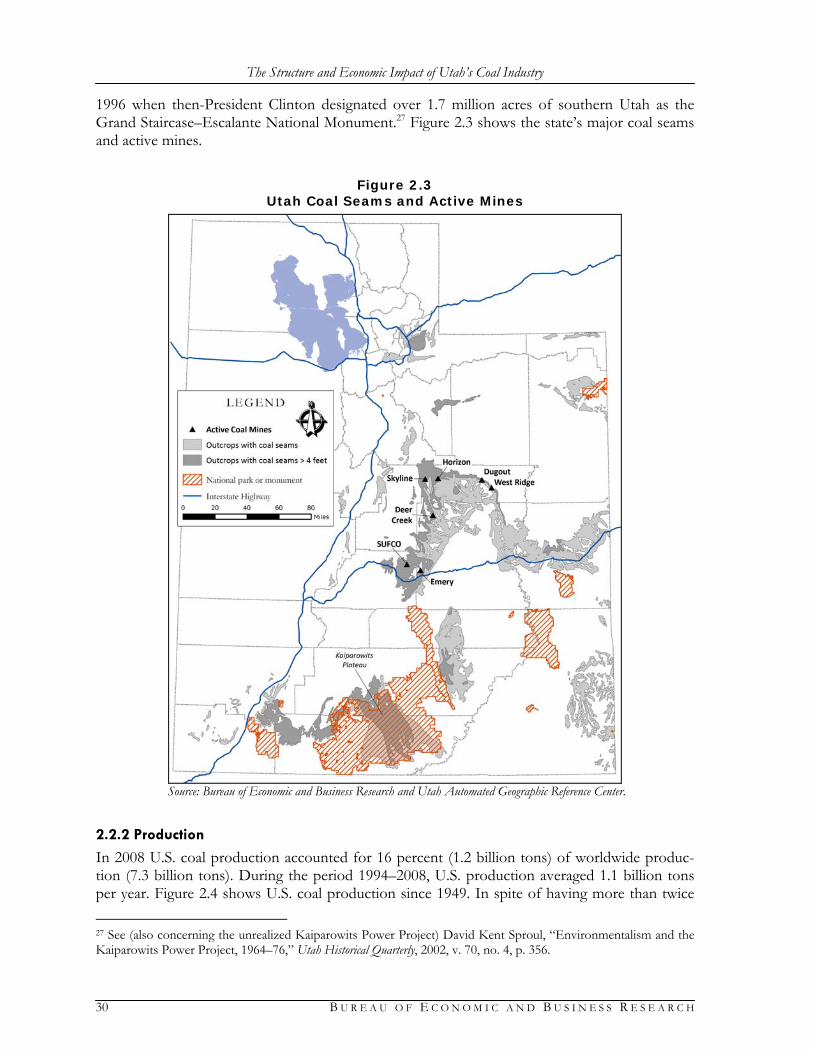
The Structure and Economic Impact of Utah’s Coal Industry
30 B U R E A U O F E C O N O M I C A N D B U S I N E S S R E S E A R C H
1996 when then-President Clinton designated over 1.7 million acres of southern Utah as the Grand Staircase–Escalante National Monument.27 Figure 2.3 shows the state’s major coal seams and active mines.
Figure 2.3
Utah Coal Seams and Active Mines
Source: Bureau of Economic and Business Research and Utah Automated Geographic Reference Center.
2.2.2 Production
In 2008 U.S. coal production accounted for 16 percent (1.2 billion tons) of worldwide produc-tion (7.3 billion tons). During the period 1994–2008, U.S. production averaged 1.1 billion tons per year. Figure 2.4 shows U.S. coal production since 1949. In spite of having more than twice
27 See (also concerning the unrealized Kaiparowits Power Project) David Kent Sproul, “Environmentalism and the Kaiparowits Power Project, 1964–76,” Utah Historical Quarterly, 2002, v. 70, no. 4, p. 356.

The Structure and Economic Impact of Utah’s Coal Industry
B U R E A U O F E C O N O M I C A N D B U S I N E S S R E S E A R C H 31
the official coal reserves of the next best-endowed country (China), the U.S. is not the leading producer. The world’s leading coal producer in 2008 was China, which produced just over 2.8 billion tons. India and Australia were the third and fourth largest producers, with 568 and 439 million tons, respectively. Figure 2.5 shows the distribution of coal production among the world’s top ten producers in 2008.
Figure 2.4
U.S. Coal Production Since 1949
0
200
400
600
800
1,000
1,200
1,400
1949
1952
1955
1958
1961
1964
1967
1970
1973
1976
1979
1982
1985
1988
1991
1994
1997
2000
2003
2006
Mil
lio
ns o
f T
on
s
Source: Energy Information Administration, Annual Energy Review 2008.
By the end of 2008 cumulative coal production in Utah had surpassed 1 billion tons.28,29 To put this in perspective, consider that in 2008 alone the U.S. produced almost 20 percent more than Utah’s entire historical production through 2008, while Wyoming produced an amount equal to almost half of Utah’s cumulative production.30 The distribution of Utah’s coal production is historically and presently concentrated in Carbon, Emery, and Sevier counties. Between 1870 and 1959, 78 percent of the coal produced in Utah came from Carbon County. Carbon County’s share of total coal production since 1960 fell to 27 percent as production greatly increased in Emery and Sevier counties. There is presently no coal production outside of these three counties, which collectively account for 99 percent of all the coal ever mined in Utah.31
28 “Cumulative coal production” is the sum of all coal produced in Utah since 1870. 29 See Table 2.3 at http://geology.utah.gov/emp/energydata/coaldata.htm. 30 U.S. production in 2008 equaled 1.17 billion tons; hence Utah’s 2008 production of 24.3 million tons equaled a little over 2 percent of U.S. production. Wyoming’s 2008 production measured 467.6 million tons. See 2008 Annual Review and Forecast at http://geology.utah.gov/utahgeo/energy/coal/index.htm, which was in preliminary form as of March 2010. 31 For county-level production statistics see Table 2.10 of Chapter 2: “Coal” in Utah Geological Survey’s Utah Energy and Mineral Statistics; available at http://geology.utah.gov/emp/energydata/coaldata.htm.

The Structure and Economic Impact of Utah’s Coal Industry
32 B U R E A U O F E C O N O M I C A N D B U S I N E S S R E S E A R C H
Figure 2.5 Distribution of World Coal Production in 2008
0.0
0.5
1.0
1.5
2.0
2.5
3.0
Chin
a
United S
tate
s
India
Aust
ralia
Russ
ia
Indonesi
a
South
Afr
ica
Germ
any
Pola
nd
Kaza
khst
an
Bil
lio
ns o
f T
on
s
Source: Energy Information Administration.
Figure 2.6 shows Utah coal production since 1870. A rapid increase in production is seen just prior to World War I, with production levels peaking near the end of the conflict. The subse-quent slowdown during the 1920s, given the rapid economic growth taking place in the U.S. at the time, might best be described as a return to peacetime market conditions. Production was tempered during the 1930s by the Great Depression, but strongly spurred on just before and during World War II. In the succeeding 25 years, coal lost ground in every major market except electric power generation. Between the early 1970s and the early 1990s, production growth was interrupted only by national recessions. Production in 2008 was 24.3 million tons—near the most recent 15-year average of 25.3 million tons and well above the most productive year of the 1980s (17.1 million tons in 1989). The rapid growth during this time period has leveled off in recent years.

The Structure and Economic Impact of Utah’s Coal Industry
B U R E A U O F E C O N O M I C A N D B U S I N E S S R E S E A R C H 33
Figure 2.6 Utah Coal Production Since 1870
0.0
5.0
10.0
15.0
20.0
25.0
30.0
1870
1877
1884
1891
1898
1905
1912
1919
1926
1933
1940
1947
1954
1961
1968
1975
1982
1989
1996
2003
Mil
lio
ns o
f T
on
s
$0
$10
$20
$30
$40
$50
$60
$70
$80
$90
$100
Co
nsta
nt
20
08
Do
llars
per
To
n
Production (left scale)Mine Price (right scale)
Note: Production figures prior to 1940 are decadal. “Mine Price” is the price of coal at the mine and excludes transportation charges. Sources: Bureau of Economic and Business Research, A Brief History of the Utah Coal Industry, 1977 (for production and prices through 1960); Utah Geological Survey, Utah Energy and Mineral Statistics (for production and prices since 1960).
2.3 Markets
U.S. coal consumption was 1.12 billion tons in 2008, second only to China’s 2.83 billion tons.32 Even under the highly conservative assumption that no further additions would be made to its reserve base, the U.S. has enough coal to meet its current level of consumption for about 235 years. If the rate of annual coal consumption continues to grow rather than remain at its present level, then the date is nearer at which cumulative consumption exhausts reserves. For example, if consumption grows in the future as it did between 1949 and 2008, then the U.S. could supply its own consumption for about 100 years.33 By way of comparison, if the U.S. had to provide for all of its oil consumption with domestic production (again under the clearly false assumption that reserves will not increase in the future), then U.S. oil supplies would be exhausted in about three years.34 Though such measures of “plenty” are limited, they should nevertheless provide a useful
32 See “Coal Consumption” at http://www.eia.doe.gov/emeu/international/contents.html. 33 What “if consumption grows in the future as it had between 1949 and 2008” means is that the geometric-mean growth rate that prevails in the future is the same as the geometric-mean of the growth rates observed for the pe-riod 1949–2008. To determine the time of exhaustion (T) under this assumed pattern of consumption growth, note that the sum of future consumption would be a geometric series, with constant rate of growth g equal to the ob-served geometric-mean growth, starting-year (2008) cumulative consumption S0, and terminal-year cumulative con-sumption ST, which by assumption of no-reserve-growth has to equal the reserves:
g
)g(S=S
+T
T
1
1 10 . Solving this
expression for T, one gets: 1ln
∕11ln 0
(g)
)Sg)(S(=T T . From the 1949–2008 consumption data, we find g=1.015 (geo-
metric average growth was about 1.5 percent), from 2008 consumption data S0=1.172 billion tons, and from reserve data ST=265 billion tons. Plugging these in, we find T=97.4 years. 34 In recent years U.S. proved oil reserves averaged about 21 billion barrels while annual consumption has been about 7.5 billion barrels. See http://tonto. eia.doe.gov/dnav/pet/pet_sum_top.asp.

The Structure and Economic Impact of Utah’s Coal Industry
34 B U R E A U O F E C O N O M I C A N D B U S I N E S S R E S E A R C H
gauge for how important scarcity itself may become as a constraint on the future production of the resource. Coal became the leading source of energy in the U.S. in about 1885, lost this title during the third quarter of the 20th century, then regained it in the early 1980s as coal became the dominant source of electric power generation. Coal is still the leading source of energy in the U.S. and elec-tric power is by far its most important market. In 2008 about 91 percent of coal consumed in the U.S. was for electricity generation. As Figure 2.7 shows, this contrasts with earlier times in which the market for coal was more diverse. In 1970, coal coke accounted for, on average, 20 of every 100 tons of coal consumed and electric power generation consumed 60 of every 100 tons. Most of the rest was consumed in commercial and residential heating applications. By 2008 the share of coking coal had fallen by an order of magnitude—accounting for only 2 of every 100 tons of coal consumed. Similar declines are observed for residential and commercial heating. Well be-fore 1970, coal was an important transportation fuel, supplying heat for steam locomotives and military ships. By the middle of the 20th century, coal had largely lost this market to diesel and fuel oil. While there is potential to resurrect coal as a transportation fuel through various coal-to-liquids technologies, it appears unlikely that such fuels will become a major driver of coal de-mand during the horizon considered in the present report.35 The short- and medium-term pros-pects for coal are tied to those for coal-based electricity generation, to which we now turn.
Figure 2.7
Composition of U.S. Coal Consumption Since 1949
0
200
400
600
800
1,000
1,200
1949
1953
1957
1961
1965
1969
1973
1977
1981
1985
1989
1993
1997
2001
2005
Mil
lio
ns o
f T
on
s
TransportationResidential & CommercialCoke Plants
Other IndustrialElectricity
Source: Energy Information Administration, Annual Energy Review 2008.
U.S. net electricity production has increased over tenfold in the last 60 years, from 334 billion kilowatt-hours (BKWH) in 1950 to 4,100 BKWH in 2008.36 And, as shown in Figure 2.8, the distribution of the shares of generation by fuel source has changed dramatically. The shift was
35 For a discussion of coal-to-liquids technologies, see James T. Bartis, Frank Camm, and David S. Ortiz, Producing Liquid Fuels from Coal: Prospects and Policy Issues, The RAND Corporation, 2008. 36 Net electric generation is the amount of electricity a power plant delivers to the grid—the difference between the total amount of electricity generated and the amount which is consumed at the plant-site.

The Structure and Economic Impact of Utah’s Coal Industry
B U R E A U O F E C O N O M I C A N D B U S I N E S S R E S E A R C H 35
influenced by a combination of policy and economic factors. Hydroelectric power, which had accounted for nearly a third of net electricity generated in 1950, contributed only 5 percent by 2008, owing to declining economic attractiveness of remaining targets and strong public opposi-tion to new projects—whether economic or not.37 Following the energy shock of 1973, Con-gress passed the Energy Supply and Environmental Coordination Act (ESECA) of 1974 in which the authority was given to the Federal Energy Administration (FEA) to prohibit combustion of either petroleum or natural gas as the primary fuel in power plants that could viably burn coal instead.38,39 The idea behind ESECA, and the following Powerplant and Industrial Fuel Use Act of 1978, was to subdue demand for crude oil in order to lessen domestic vulnerability to disrup-tions in the supply of imported crude. Especially because this regulatory shift occurred at a time of rising and volatile oil prices, it is unclear how important ESECA was in the observed switch to coal from petroleum-fired generation. Whatever the reason, whereas the share of oil-fired gen-eration in total net electricity generation was about 15 percent in the mid-1970s, by 2008 it had fallen to about 1 percent. Coal-fired generation now accounts for 50 percent of U.S. net electric-ity generation.40
Figure 2.8
Fuel Source Composition of U.S. Electric Power Generation
0%
20%
40%
60%
80%
100%
1949
1952
1955
1958
1961
1964
1967
1970
1973
1976
1979
1982
1985
1988
1991
1994
1997
2000
2003
2006
Sh
are
of
Gen
era
tio
n
RestNatural Gas PetroleumCoal
Source: Energy Information Administration, Annual Energy Review 2008.
If coal-fired electricity generation is important nationally, it is much more so in Utah. In 2008, coal-fired generation originating in Utah produced 38 out of a total 46.6 BKWH of net electric-ity—82 percent of net generation. Though this is well above the U.S. average, it’s actually a step down from the period of 1980–2005, when coal averaged 94 percent of generation. This recent 37 Hydroelectric net generation decreased only in share, not level: generation was 101 BKWH and 248 BKWH in 1950 and 2008, respectively. 38 The Federal Energy Administration (FEA) is now known as the Energy Information Administration (EIA). 39 See Daryl Robertson, “The Powerplant and Industrial Fuel Use Act of 1978: Fuel Replacement,” Harvard Envi-ronmental Law Review, 1979, v. 3, no. 214, for a discussion of the conditions under which FEA could act to restrain the use of petroleum and natural gas in power plants. 40 The share of coal-fired generating capacity is substantially less than 50 percent, reflecting the choice to utilize coal for base-load generation.

The Structure and Economic Impact of Utah’s Coal Industry
36 B U R E A U O F E C O N O M I C A N D B U S I N E S S R E S E A R C H
departure is not because coal-based generation has decreased, but because the share of gas-fired generation has increased faster than total generation. Between 2005 and 2008, gas-fired genera-tion increased its share from 3 percent (1.2 BKWH) to 16 percent (7.4 BKWH). Figures 2.9 and 2.10 show the composition of Utah’s coal consumption and the shares by energy source of its electric power generation since 1960.
Figure 2.9
Composition of Utah Coal Consumption Since 1960
0
2
4
6
8
10
12
14
16
18
20
1960
1963
1966
1969
1972
1975
1978
1981
1984
1987
1990
1993
1996
1999
2002
2005
2008
Mil
lio
ns o
f T
on
s
TransportationResidential & CommercialOther IndustrialCoke PlantElectric Utilities
Source: Utah Geological Survey, Utah Energy and Mineral Statistics.
Figure 2.10
Fuel Source Composition of Utah Electric Power Generation
0%
20%
40%
60%
80%
100%
1960
1963
1966
1969
1972
1975
1978
1981
1984
1987
1990
1993
1996
1999
2002
2005
2008
Sh
are
of
Gen
era
tio
n
RestNatural GasPetroleumCoal
Note: Includes power generated by electric utilities and by non-utilities. Source: Utah Geological Survey, Utah Energy and Mineral Statistics.

The Structure and Economic Impact of Utah’s Coal Industry
B U R E A U O F E C O N O M I C A N D B U S I N E S S R E S E A R C H 37
2.4 Challenges
Apart from any hidden costs (“negative externalities”) arising, for example, from the pollutants emitted as a combustion byproduct, coal-fired generation is among the least expensive means for producing electricity.41 Of critical importance to Utah’s coal industry in the future is the extent to which efforts to internalize some of coal’s negative externalities are successful. Many current challenges to coal-fired power plant construction are based on recent legal and policy developments concerning CO2. In April 2007 the U.S. Supreme Court (Massachusetts v. EPA) determined that greenhouse gases (GHG)—such as carbon dioxide—are pollutants as defined by the Clean Air Act. Although this ruling did not obligate EPA to regulate CO2, it did limit the justifications EPA could provide as the basis for a decision not to regulate CO2. In par-ticular, EPA had to decide whether GHG present a harm either to public health or public wel-fare, with an affirmative answer likely leading to some form of regulation. An affirmative answer came in December 2009, with EPA announcing that “six greenhouse gases taken in combination endanger both the public health and the public welfare of current and future generations.” The EPA is now deliberating possible regulatory regimes, though it’s possible the EPA will be pre-empted by a federal plan for dealing with CO2 emissions. The challenges, discussed below, to proposed Utah power plants based on CO2 emissions spring from the April 2007 Supreme Court decision. Within the last several years there were four new coal-fired power units still planned for con-struction in Utah: An 86-megawatt addition to Deseret Power’s 500 MW Bonanza power plant near Vernal, a 900 MW addition to two existing 900 MW units at the Intermountain Power Agency’s (IPA) Intermountain Power Project (IPP) near Delta, a 400 MW addition to Pacifi-Corp’s three-unit Hunter Plant near Castle Dale, and a 270 MW unit at a new plant in Sigurd. These four proposals have been intensely challenged on the basis of their potential environ-mental impacts—mainly greenhouse gas emissions and traditional air pollution—and the eco-nomic uncertainty arising out of a looming but highly unsettled regime for regulating CO2. As they are the focal point of many challenges to new coal-fired plants, a brief review of CO2 emis-sions follows. The EIA reports that in 2007 the U.S. emitted 20 percent of global CO2 emissions attributed to energy consumption—6 billion of a global 30 billion metric tonnes. This level of global emis-sions represents a 62 percent increase since 1980. Though perhaps driven in part from a shift of energy-intensive manufacturing industries out of the U.S. and into Asia, U.S. emissions meas-ured in this way have increased by only 26 percent since 1980. Both then and now the transpor-tation and electric power–generation sectors were the source of a majority of U.S. CO2 emissions—29 and 32 percent in 1980 and 34 and 42 percent in 2007.42 It is no surprise then that these two sectors are the most heavily targeted by those seeking to curb GHG emissions. Within the electric power–generation sector, coal is by far the largest contributor, with 1,951 of a total 2,389 million tonnes (82 percent) of CO2 emissions in 2007. The next largest contributor is
41 The U.S. Department of Energy provides the following definition. “Externalities: Benefits or costs, generated as a byproduct of an economic activity, that do not accrue to the parties involved in the activity. Environmental exter-nalities are benefits or costs that manifest themselves through changes in the physical or biological environment.” See http://www.eia.doe.gov/glossary/glossary_e.htm. 42 See Table 12.2 of the EIA’s Annual Energy Review 2008 at http://www.eia.doe.gov/aer/.

The Structure and Economic Impact of Utah’s Coal Industry
38 B U R E A U O F E C O N O M I C A N D B U S I N E S S R E S E A R C H
natural gas at 371 million tonnes (16 percent). Considering that coal accounted for a net 2 billion megawatt-hours (BMWH) and natural gas a net 900 million MWH, one can see the difference in “net carbon efficiency” between the two sources: On average, each MWH of (net) electricity generated from coal combustion produces 1.2 tonnes of CO2, while the average MWH of (net) electricity generated from natural gas combustion produces 0.41 tonnes of CO2.
43,44,45 In 2007 Utah fossil fuel–based CO2 emissions totaled 70.4 million tonnes, of which electric power generation accounted for 38.2 (54 percent) and transportation 18.3 (26 percent) million tonnes. Though for the transportation sector this represents no change compared with 1980 as a percentage of total emissions, it is nearly a doubling of the share for Utah’s electric power gen-eration sector.46,47 Thus, the CO2 footprint of the current configurations for generating electricity from coal is large, and it is practically definitional that a serious effort by policymakers to cut CO2 emissions will require fairly substantial changes in coal-fired power. A cursory discussion of what some of these changes might be is given in Section 2.5. In July 2009, IPA announced that it would allow its air-quality permit to expire for a proposed third unit at its Intermountain Power Project north of Delta. The third unit would have added 900 MW to IPP’s present 1,800 MW of generation capacity. The IPP is operated by the Los An-geles Department of Water and Power (LADWP), which receives about 45 percent of the power generated by IPP’s two existing units, along with 21 percent of the 2,250 MW output of the Ari-zona-based Navajo Generating Station.48 IPA’s action follows a 2007 decision by LADWP not to purchase power from the proposed third unit of the IPP and is part of a broader effort by the city of Los Angeles to halt all purchases of coal-based generation by 2020.49,50 The 400 MW fourth unit at PacifiCorp’s Hunter plant near Castle Dale is on indefinite hold, as is PacifiCorp’s acquisition of other additional coal-powered units. In its most recent (2008) Inte-grated Resource Plan PacifiCorp links this decision to uncertainty regarding the future price of CO2 emissions:
The single most important scenario risk … facing PacifiCorp continues to be government actions related to CO2 emissions. This scenario risk relates to the uncertainty in predicting the scope, timing, and cost impact of CO2 emission compliance rules. [An earlier section of this document] frames this issue in terms of the impacts of CO2 policy and cost uncertainty on natural gas and wholesale
43 See Table 1.1 of the EIA’s Electric Power Monthly at http://www.eia.doe.gov/cneaf/electricity/epm/epm_sum .html for net generation and Table 12.7b of the EIA’s Annual Energy Review 2008 at http://www.eia.doe.gov/aer/ for CO2 emissions. 44 Details: For coal, 2.389 billion tonnes of CO2 were emitted and 2 billion MWH generated: 2.389/2=1.2. For natu-ral gas, 371 million tonnes of CO2 were emitted and 900 million MWH generated: 371/900=0.41. 45 Note that the difference in net carbon efficiency reflects both the greater heating value of methane compared with its carbon content and the generally greater efficiency of natural gas–fired power plants. 46 In 1980, Utah’s transportation sector accounted for 9 out of a total 35 million tonnes of emissions (26 percent), and the electric power sector accounted for 10.8 of the 35 million tonnes (31 percent). 47 Trade complicates comparisons across political boundaries of CO2 emissions. For example, electricity produced at IPA’s coal-fired plant near Delta is consumed in California, but the CO2 generated is credited to Utah. 48 Altogether, about 40 percent of the electricity delivered by LADWP is generated at out-of-state coal-fired power plants. See http://www.reuters.com/article/idUSTRE56165X20090702. 49 See http://www.reuters.com/article/idUSTRE5684UN20090709. 50 LADWP is under contract until 2026 to purchase 45 percent of IPP output. Its contract with the Navajo Gener-ating Station expires in 2019. See http://www.reuters.com/article/idUSTRE56165X20090702.

The Structure and Economic Impact of Utah’s Coal Industry
B U R E A U O F E C O N O M I C A N D B U S I N E S S R E S E A R C H 39
electricity prices, and consequent dramatic cost impacts to consumers. To ad-dress this risk, the Company decided in 2007 that acquiring a coal plant was not a viable resource option until regulatory clarity concerning CO2 costs and technol-ogy/fuel policies is obtained.51
Deseret Power is awaiting a decision from EPA Region 8 on the requirements that would be part of the Prevention of Significant Deterioration (PSD) license for its proposed 86 MW addi-tion to the Bonanza Power Plant.52,53 The PSD license initially issued by EPA in August 2007 was challenged by the Sierra Club, who argued to the EPA’s Environmental Appeals Board (EAB) that the already authorized monitoring and reporting of power plant CO2 emissions un-der the Acid Rain Program, qualified CO2 as a pollutant “subject to regulation,” and therefore—in accordance with the Clean Air Act (CAA)—required a Best Available Control Technology (BACT) review for CO2 emissions as part of the PSD licensing process.54 EPA Region 8 coun-tered that “subject to regulation” applied to pollutants with existing emission limits, not to those—including CO2—without established limits. In its November 2008 decision the EAB did not determine EPA Region 8 must include BACT analysis for CO2 as part of the PSD license. Rather, EAB found that Region 8 could not base their decision not to include BACT analysis on the foregoing interpretation of the CAA (which EAB regarded as a misinterpretation). Although as an isolated event the prospects for an 86 MW unit burning waste coal would not seem to be of substantial importance for the future of Utah coal mining, in fact it could be quite important both in Utah and nationally. The finding that CO2 is “subject to regulation” triggers BACT-CO2 requirements, but it is unclear what sort of technologies could be considered. The most com-monly mentioned coal-based alternative to prevailing coal-fired generation is Integrated Gasifi-cation Combined Cycle. The Sevier Power Project in Sigurd is a proposed 270 MW coal-fired plant using circulating flu-idized bed technology. The Utah Division of Air Quality (UDAQ) issued a PSD permit for the facility in 2004. When the permit was not invalidated upon reaching its 18-month expiration date, two citizens appealed the issue to the Utah Air Quality Board (UAQB). Though the appeal to UAQB failed, the two citizens along with the Utah chapter of the Sierra Club had their case heard by the Utah Supreme Court. The Supreme Court remanded the permit to UDAQ, finding that it contained incorrectly calculated nitrogen oxide emissions; but the finding of potentially greater importance was that UAQB incorrectly failed to consider integrated gasification com-bined cycle (IGCC) technology as an available method to control emissions. In order to gain the permit, a new review will have to be performed that considers IGCC among the options for controlling emissions. The lawsuit further alleged that UAQB ignored the greenhouse gas impli-
51 See PacifiCorp’s 2008 Integrated Resource Plan (http://www.pacificorp.com/content/dam/pacificorp/doc/ Environment/Environmental_Concerns/Integrated_Resource_Planning_3.pdf), page 277. 52 PSD is a set of requirements that must be satisfied for major new projects or major additions to existing projects that will occur in areas that are meeting their National Ambient Air Quality Standards (“attainment areas”). In at-tainment areas, the requirements include, among others, a determination that such a project will use Best Available Control Technology (BACT) for pollutants. A PSD license is issued only if PSD requirements are met. 53 Since the Bonanza facility would be constructed on Tribal land, EPA Region 8, rather than the Utah Division of Air Quality, is responsible for the permitting. 54 Massachusetts v. EPA had already established CO2 as a pollutant with regards to the CAA, but this alone didn’t trigger BACT requirements for CO2 because the EPA had not determined that CO2 was a pollutant which also en-dangered “the public health or the public welfare.”

The Structure and Economic Impact of Utah’s Coal Industry
40 B U R E A U O F E C O N O M I C A N D B U S I N E S S R E S E A R C H
cations of the Sevier Power Project, but the Utah Supreme Court found that UAQB correctly omitted this implication from consideration. 2.5 Options for Coal-Based Electricity Generation
The most important barrier to further growth in coal-fired generation is the cost of reducing emissions of those pollutants traditionally regulated by the Clean Air Act and those that might be, under a looming but as yet unknown regime for limiting emissions of greenhouse gases like CO2. As the challenges to current proposals show, even the possibility of such limits can hold up new coal-fired generation. Provided the demand for coal stays closely tied to the demand for electricity, the prospects for coal mining will be linked to how readily coal-based power genera-tion can adapt, if necessary, to accommodate more stringent emissions requirements. All options for generating power through coal combustion generate CO2. Significant differences between two coal-fired plants in the amount of CO2 produced reflect only differences in operat-ing efficiency (defined below). Given the limited options (apart from efficiency improvements) for reducing the CO2 produced (per unit of electricity generated) by coal-fired plants, if substan-tial enough limits on CO2 come into place then the viability of coal as an electric power source will depend on the ability to capture and sequester CO2. MIT’s 2007 report The Future of Coal therefore emphasizes the need to prove the viability of carbon capture and sequestration:
Today, and independent of whatever carbon constraints may be chosen, the pri-ority objective with respect to coal should be the successful large-scale demon-stration of the technical, economic, and environmental performance of the technologies that make up all of the major components of a large-scale integrated CCS system—capture, transportation and storage. Such demonstrations are a prerequisite for broad deployment at gigatonne scale in response to the adoption of a future carbon mitigation policy, as well as for easing the trade-off between restraining emissions from fossil resource use and meeting the world’s future en-ergy needs.55
While it is certain that adopting CCS will add to the cost of power generation, given the imma-turity of the technology and various other unknowns, cost estimates for CCS are imprecise at this date. The MIT study estimates that the charge per tonne of CO2 emitted above which CCS technology becomes economically more attractive than non-CCS generation is about $30—reflecting $25 for capture and $5 for transportation and storage. No matter the cost of CCS, capturing and storing CO2 from coal-fired plants would be a very large undertaking. Noting that the coal-fired power industry emits 1.5 billion tons of CO2 annu-ally, the MIT study states that “[i]f all of this CO2 is transported for sequestration, the quantity is equivalent to three times the weight and, under typical operating conditions, one-third of the annual volume of natural gas transported by the U.S. gas pipeline system.”56 Even the task of capturing and storing enough CO2 that coal would be competitive with natural gas in terms of
55 The Future of Coal: Options for a Carbon-Constrained World, Massachusetts Institute of Technology, 2007, p. xi; avail-able at http://web.mit.edu/coal/. 56 ibid., p. ix.

The Structure and Economic Impact of Utah’s Coal Industry
B U R E A U O F E C O N O M I C A N D B U S I N E S S R E S E A R C H 41
CO2 emissions is daunting.57 “If 60% of the CO2 produced from U.S. coal-based power genera-tion were to be captured and compressed to a liquid for geologic sequestration, its volume would about equal the total U.S. oil consumption of 20 million barrels per day.”58 Economic and technical uncertainties can be partly resolved through research and development efforts. An additional hurdle for commercial CCS deployment is the legal uncertainty due to the absence of an in-place regulatory regime for geological carbon storage (e.g. whose responsibility does the deposit become, and when?).59 The time needed to resolve CCS issues would make it difficult for the coal industry to quickly ramp down its CO2 releases in the immediate future. This section now briefly reviews technologies that may allow coal to remain competitive with other generation technologies in the event of significant future emissions constraints. Traditional coal-fired power plants generate heat by combusting finely ground coal with air. Fa-cilities of this type are often referred to as “air-blown pulverized coal plants” (abbreviated: “air-blown PC”), and make up a large majority of the country’s coal-fired plants. The heat from combustion produces steam that is passed through a turbine, which in turn powers an electric generator, producing electricity. Combustion combines oxygen from the air with carbon from the coal, sulfur from the coal, and nitrogen from the coal and air, to produce CO2, sulfur dioxide (SO2), and nitrogen dioxide (NO2), respectively. These compounds are either removed from the exhaust gas or released into the atmosphere. That removal of such compounds from the exhaust gas is done post-combustion in traditional coal-fired plants is a critical distinction between tradi-tional coal-fired plants and integrated gasification combined cycle plants (described below). The efficiency of a fuel-based power plant is the percent of energy in the fuel that is ultimately delivered to the grid in the form of electricity (“net generation”). A more efficient coal-fired plant therefore requires less coal to deliver a given amount of electricity to the grid. Because the amount of CO2 released from a given coal-fired facility is a constant proportion of the amount of coal burned, the percentage reduction in CO2 is the same as the percentage reduction in coal burned. A plant that is 25 percent more efficient, produces 25 percent less CO2. One way to classify coal-fired power plants is according to the steam pressure and temperature at which they operate. Moving from lower to higher temperature and pressure the categories are: subcritical (typically 2,400 psi and 1,000° F), supercritical (typically 3,500 psi and 1,050° F), and ultra-supercritical (above 3,500 psi and 1,050° F, with commercially deployed units reaching 4,600 psi and 1,100° F).60 All else being equal, higher efficiency results from higher steam pres-sure and temperature. Since higher efficiency means less fuel consumption, high-pressure/high-temperature power plants have lower fuel costs. But they have higher capital costs—the materi-als necessary for operation at higher pressure and temperature are more expensive. But perhaps more important than their higher capital costs is the concern for reliability, given the limited commercial experience of these systems compared with their subcritical counterparts.
57 Natural gas–fired power plants generate about half the CO2 of similar-output coal-fired plants. 58 The Future of Coal, p. ix. 59 See Larry Parker, Deborah D. Stine, and Peter Folger, Capturing CO2 from Coal-Fired Power Plants: Challenges for a Comprehensive Strategy, Congressional Research Service, 2009; available at http://www.fas.org/sgp/crs/misc/ RL34621.pdf. 60 The Future of Coal, pp. 20–21.
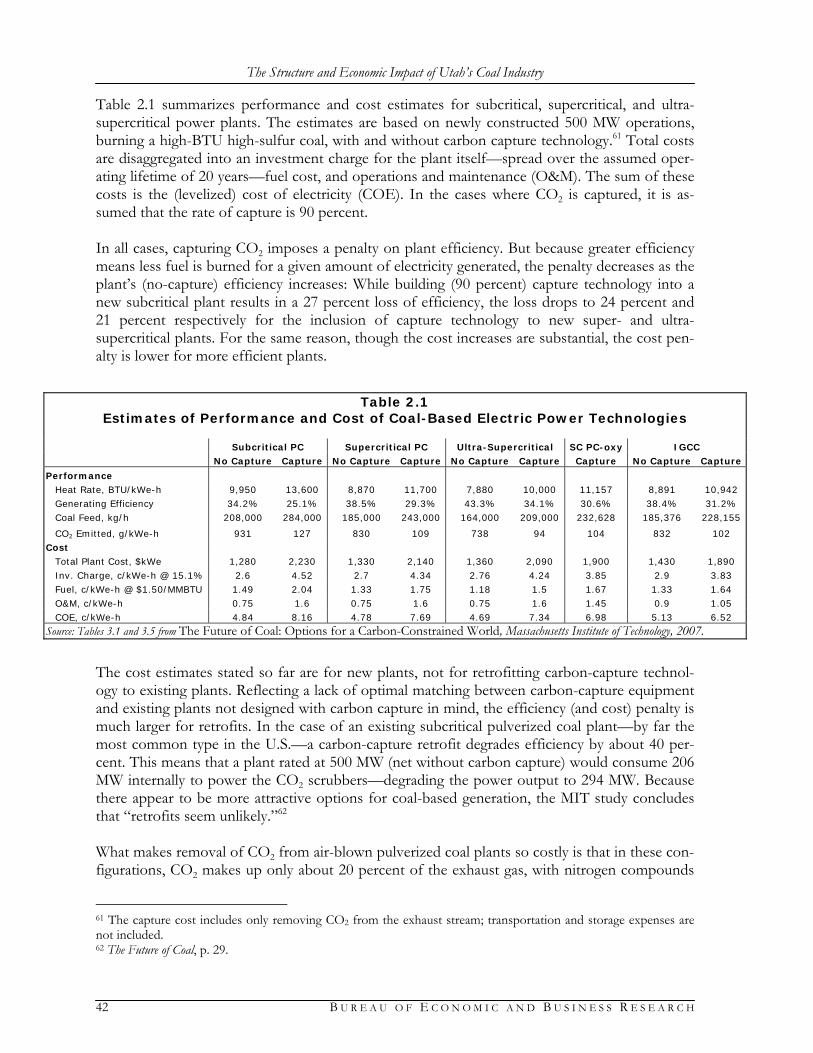
The Structure and Economic Impact of Utah’s Coal Industry
42 B U R E A U O F E C O N O M I C A N D B U S I N E S S R E S E A R C H
Table 2.1 summarizes performance and cost estimates for subcritical, supercritical, and ultra-supercritical power plants. The estimates are based on newly constructed 500 MW operations, burning a high-BTU high-sulfur coal, with and without carbon capture technology.61 Total costs are disaggregated into an investment charge for the plant itself—spread over the assumed oper-ating lifetime of 20 years—fuel cost, and operations and maintenance (O&M). The sum of these costs is the (levelized) cost of electricity (COE). In the cases where CO2 is captured, it is as-sumed that the rate of capture is 90 percent. In all cases, capturing CO2 imposes a penalty on plant efficiency. But because greater efficiency means less fuel is burned for a given amount of electricity generated, the penalty decreases as the plant’s (no-capture) efficiency increases: While building (90 percent) capture technology into a new subcritical plant results in a 27 percent loss of efficiency, the loss drops to 24 percent and 21 percent respectively for the inclusion of capture technology to new super- and ultra-supercritical plants. For the same reason, though the cost increases are substantial, the cost pen-alty is lower for more efficient plants.
The cost estimates stated so far are for new plants, not for retrofitting carbon-capture technol-ogy to existing plants. Reflecting a lack of optimal matching between carbon-capture equipment and existing plants not designed with carbon capture in mind, the efficiency (and cost) penalty is much larger for retrofits. In the case of an existing subcritical pulverized coal plant—by far the most common type in the U.S.—a carbon-capture retrofit degrades efficiency by about 40 per-cent. This means that a plant rated at 500 MW (net without carbon capture) would consume 206 MW internally to power the CO2 scrubbers—degrading the power output to 294 MW. Because there appear to be more attractive options for coal-based generation, the MIT study concludes that “retrofits seem unlikely.”62 What makes removal of CO2 from air-blown pulverized coal plants so costly is that in these con-figurations, CO2 makes up only about 20 percent of the exhaust gas, with nitrogen compounds
61 The capture cost includes only removing CO2 from the exhaust stream; transportation and storage expenses are not included. 62 The Future of Coal, p. 29.
Table 2.1 Estimates of Performance and Cost of Coal-Based Electric Power Technologies
Subcritical PC Supercritical PC Ultra-Supercritical SC PC-oxy IGCC No Capture Capture No Capture Capture No Capture Capture Capture No Capture Capture
Performance Heat Rate, BTU/kWe-h 9,950 13,600 8,870 11,700 7,880 10,000 11,157 8,891 10,942 Generating Efficiency 34.2% 25.1% 38.5% 29.3% 43.3% 34.1% 30.6% 38.4% 31.2% Coal Feed, kg/h 208,000 284,000 185,000 243,000 164,000 209,000 232,628 185,376 228,155
CO2 Emitted, g/kWe-h 931 127 830 109 738 94 104 832 102 Cost
Total Plant Cost, $kWe 1,280 2,230 1,330 2,140 1,360 2,090 1,900 1,430 1,890 Inv. Charge, c/kWe-h @ 15.1% 2.6 4.52 2.7 4.34 2.76 4.24 3.85 2.9 3.83 Fuel, c/kWe-h @ $1.50/MMBTU 1.49 2.04 1.33 1.75 1.18 1.5 1.67 1.33 1.64 O&M, c/kWe-h 0.75 1.6 0.75 1.6 0.75 1.6 1.45 0.9 1.05 COE, c/kWe-h 4.84 8.16 4.78 7.69 4.69 7.34 6.98 5.13 6.52
Source: Tables 3.1 and 3.5 from The Future of Coal: Options for a Carbon-Constrained World, Massachusetts Institute of Technology, 2007.

The Structure and Economic Impact of Utah’s Coal Industry
B U R E A U O F E C O N O M I C A N D B U S I N E S S R E S E A R C H 43
making up most of the rest of the exhaust gas. This owes to the fact that the air in which the combustion takes place is about 78 percent nitrogen. A more concentrated CO2 stream is less costly to capture. One way to retain the traditional pulverized coal combustion process—and the benefits of its long operational history—but obtain a concentrated CO2 stream post-combustion is to burn the coal in nearly pure oxygen. Since little nitrogen would be present at combustion, the exhaust stream would be mostly free of nitrogen compounds (e.g. the criteria pollutant ni-trogen oxide), consisting upwards of 90 percent CO2 (water vapor being most of the rest). Units that combust with near-pure oxygen are termed “oxy-fuel.” Table 2.1 has a column for a representative supercritical oxy-fuel pulverized coal plant with car-bon capture. In terms of operating efficiency, oxy-fuel PC is similar to supercritical PC, but with somewhat lower costs. The primary drawback of oxy-fuel PC is the high energy requirements needed to operate the equipment that separates out the oxygen from air (the “air-separation unit”). Though carbon capture is less costly with oxy-fuel PC compared with similar air-fuel PC, air-separation units of existing technology would impose a 15–20 percent efficiency penalty for oxy-fuel PC. The MIT report finds that “[t]here are no practical reasons for applying oxy-fuel except for CO2 capture.”63,64 Though there is no commercial-scale experience with this process, several pilot projects exist in various states of development. Whereas traditional coal-fired plants burn coal directly and remove unwanted byproducts after complete combustion has taken place, integrated gasification combined cycle (IGCC) power plants generate electricity through burning a coal-derived gas (referred to as a synthesis gas, or “syngas”) after the byproduct-precursors are removed (“pre-combustion removal”). The gas is produced by placing coal in a pressurized vessel (a “gasifier”) with steam, but without enough oxygen for complete combustion to take place. Under these conditions, the molecules in the coal break apart and undergo a series of chemical reactions to form hydrogen, carbon monoxide, and other gaseous compounds. The core idea behind gasification is not new. In principle this is how the coal gas was obtained that fired street lamps in Baltimore two centuries ago. With car-bon-capture-integrated-IGCC, pollutants such as sulfur, mercury, and particulate matter are then removed from the syngas and the carbon monoxide (a criteria pollutant) is converted to carbon dioxide. Since the gas is still under pressure, pre-combustion cleaning with IGCC is more effi-cient than the post-combustion cleaning of traditional plants. The “combined cycle” in IGCC means the following. The syngas is burned in a gas turbine which powers an electric generator. The exhaust heat is then employed to produce steam, which powers a steam turbine—and another generator. This incorporation of waste heat gives com-bined cycle technologies high thermal efficiencies.65 Though the commercial experience of IGCC plants is limited, forward of the step in which the coal is gasified, the operation is quite similar to that of widely deployed natural-gas power plants.66 The last two columns of Table 2.1 show important performance and cost estimates for a newly constructed IGCC plant. The 19 percent efficiency penalty imposed by carbon-capture equip-
63 The Future of Coal, p. 30. 64 A beneficial side-effect of oxy-fuel plants is their inherently low level of nitrogen oxide emissions. 65 In the sense of the fraction of energy in the fuel that is delivered to the grid (net generation). 66 PacifiCorp’s 534 MW Currant Creek plant in Juab County and 525 MW Lakeside plant in Utah County both em-ploy combined cycle technology.

The Structure and Economic Impact of Utah’s Coal Industry
44 B U R E A U O F E C O N O M I C A N D B U S I N E S S R E S E A R C H
ment is smaller than for any of the other listed technologies. Based on these estimates, if carbon capture is to take place, IGCC with carbon capture is the least-cost option.67 While a substantial charge for CO2 would decrease the competitiveness of coal-fired electricity generation, provided carbon capture and sequestration turns out to be a viable process there ap-pear to be several options available that would allow Utah to continue to lean on coal for a sub-stantial portion of its energy needs.
67 Two additional sources of information on IGCC technology and the risks to ratepayers associated with choosing the combustion technology for long-lived coal-fired plants are Western Coal at the Crossroads, Western Resource Ad-vocates, 2006, and Investment Risk of New Coal-Fired Power Plants, Western Resource Advocates, 2008; both available at http://www.westernresourceadvocates.org/media/pandp.php#energy.

The Structure and Economic Impact of Utah’s Coal Industry
B U R E A U O F E C O N O M I C A N D B U S I N E S S R E S E A R C H 45
C OA L P RO D U C T I O N I M PAC T S Standard economic impact methodology is based on the idea that the economic development and growth of a region depend on exports of local production and/or production that is import substituting. Regional exports occur when goods and services produced in a region are sold to consumers outside the region, sustaining income and jobs inside the region. Import substitution occurs when local producers are able to supply the consumers within a region with goods and services that would otherwise be imported. This keeps purchases in-region and supports jobs and incomes. Coal production in Utah generates economic impacts because it is classified as either export base or import substitution production. Most Utah coal is used by power plants that in turn sell elec-tricity to customers in Utah and other states. Because Utah has coal-fired power plants, it does not have to purchase electricity from out-of-state producers. This means that coal production in Carbon, Emery, and Sevier counties generates economic impacts for the producing counties as well as for the state as a whole. In addition to the jobs and income generated by the coal opera-tors (termed “direct impacts”), other firms supply equipment and services to the coal producers. Some of these firms employ people who reside in the coal counties or elsewhere in Utah, and these are categorized as “indirect impacts.” Then, all of the jobs (direct and indirect) generate incomes that support households which in turn demand goods and services, some of which are produced in the coal-producing counties or elsewhere in Utah (termed “induced impacts”). All of these economic impacts generate tax revenues and support a larger population than would otherwise be possible. Of course, a larger population demands more services (police, sanitation, education, etc.) as well as infrastructure (roads, water, sewer, etc.), and these are generally pro-vided by state and local government. The economic and demographic impacts of coal production for 2007 and for scenarios of pro-duction from 2008 through 2030 have been evaluated here using the REMI 29-region, 23-sector model built for Utah. The population and economy of each county in Utah are represented in the model. The sum of the impacts of all counties is equivalent to the state impact. Direct eco-nomic activity for 2007 and beyond was imputed to the coal-producing counties according to actual production levels in 2007 and scenarios into the future. For this study, the RIMS II and IMPLAN models were also used to calibrate state-level parameters. 3.1 Estimated 2007 Impacts
The detailed 2007 employment, population, earnings, and local and state government revenue impacts are shown in the scenario analysis tables, presented later in this document. Note that 2007 impacts are identical in each scenario. This is because they are based on historical data. The 2007 summary impacts of coal production are shown in Table 3.1. In 2007, 24.3 million tons of coal were produced in Utah. The county distribution, in millions of tons, was 11.8 in Carbon, 5.8 from Emery, and 6.7 from Sevier. Estimated direct employment at the mines and their facilities was 1,888, with employment of 770 in Carbon, 753 in Emery, and 360 in Sevier.
3

The Structure and Economic Impact of Utah’s Coal Industry
46 B U R E A U O F E C O N O M I C A N D B U S I N E S S R E S E A R C H
Total employment impacts (direct plus all others) of 2007 coal production are estimated to be 4,703, which includes the above-mentioned 1,888 in direct employment plus 2,815 additional jobs, a ratio of 2.5-to-1. Not surprisingly, most of these employment impacts (4,017, or 85 per-cent of the total) are concentrated in the coal counties, with 686 in the rest of the state. About half of the employment impacts in the coal counties are estimated to have occurred in Carbon County. On a statewide basis, 42 percent of employment impacts were in Carbon County, 28 percent in Emery County, 16 percent in Sevier County, and 15 percent in the rest of the state.
Table 3.1
Coal Production Summary Impacts, 2007 (Dollar Amounts in Millions of Current Dollars)
Employment Population Earnings Local
Revenue State
Revenue Carbon County 1,957 2,936 $62.6 $0.3 $4.8 Emery County 1,309 1,964 $47.4 $0.1 $3.5 Sevier County 751 1,127 $18.2 $0.1 $1.4 Coal Counties 4,017 6,026 $128.2 $0.5 $9.8 Rest of State 686 1,029 $68.1 $0.3 $5.3 Total State 4,703 7,055 $196.3 $0.8 $15.0
Share of Total
Employment Population Earnings Local
Revenue State
Revenue Carbon County 41.6% 41.6% 31.9% 40.6% 31.9% Emery County 27.8% 27.8% 24.1% 12.3% 23.5% Sevier County 16.0% 16.0% 9.3% 11.8% 9.4% Coal Counties 85.4% 85.4% 65.3% 64.7% 64.8% Rest of State 14.6% 14.6% 34.7% 35.3% 35.2% Total State 100% 100% 100% 100% 100% Notes: Earnings is by place of work, not place of residence. Employment is a jobs count consistent with the Bureau of Economic Analysis definition and measured at the place of work (rather than residence). State revenue impacts are income taxes, sales taxes, and other taxes. Local revenue impacts are total general sales and use taxes and restaurant taxes. Sources: Economic and demographic impacts generated using the REMI model. Revenue impacts generated by BEBR using methods documented in this report.
Population impacts associated with this additional economic activity totaled 7,055 persons in 2007. This is the additional population supported by the economic impact of coal mining in 2007. This includes population impacts of 2,936 in Carbon County, 1,964 in Emery County, 1,127 in Sevier County, and 1,029 in the rest of the state. Nominal earnings impacts for 2007 are estimated to be $196.3 million for the state. These were distributed within the state as follows: $62.6 million in Carbon County, $47.4 million in Emery County, $18.2 million in Sevier County, and $68.1 million in the rest of the state. An estimated $0.8 million in local revenue in 2007 is associated with these earnings impacts. They are estimated to have been distributed as follows: $0.3 million for Carbon County, $0.1 million for both Emery and Sevier counties, and $0.3 million for the rest of the state. State reve-nues generated by these earnings impacts are an estimated $15.0 million; $4.8 million generated in Carbon County, $3.5 million in Emery County, $1.4 million in Sevier County, and $5.3 million for the rest of the state.

The Structure and Economic Impact of Utah’s Coal Industry
B U R E A U O F E C O N O M I C A N D B U S I N E S S R E S E A R C H 47
Detailed employment impacts for 2007 are shown in Table 3.2. At the state level 2,245 jobs, or 48 percent of employment impacts, are estimated to be in the natural resources, mining, utilities, and construction sector, with mining accounting for most of these. In the combined coal coun-ties, this sector accounted for 54 percent of employment impacts. Services accounted for the next largest share of employment impacts: 21 percent (991 jobs) at the state level and 18 percent (720 jobs) in the coal counties. These are jobs in the sector that provides services to the local population. Next, state and local government account for a combined 549 jobs (12 percent) of employment impact at the state level and 480 jobs (12 percent) of employment impact in the coal counties. Local government accounts for 366 jobs in the state as a whole and 323 in the coal counties. The trade sector (mostly retail) accounts for an estimated 628 jobs (13 percent of em-ployment impacts) at the state level and 517 jobs (13 percent of employment impacts) in the coal counties in 2007. An estimated 269 jobs (6 percent of the total) at the state level were generated in the transportation, information, finance, and accounting sector, with 225 in the subsectors of finance, insurance, real estate, rental and leasing. In the coal counties, the transportation, infor-mation, finance, and accounting sector generated an estimated 137 jobs, representing 3 percent of the total. The remainder of employment impacts were in manufacturing.
Table 3.2 Utah Coal Production: Detailed Employment Impacts, 2007
Employment Share of Region
Employment by Industry State Carbon Emery Sevier Coal
Counties Non-Coal Counties State
Coal Counties
Natural Resources, Mining, Utilities, Construction 2,245 868 885 408 2,161 84 47.7% 53.8% Forestry, Fishing, Other 2 1 0 0 1 1 0.0% 0.0% Mining 1,948 784 801 360 1,945 3 41.4% 48.4% Utilities 10 4 1 4 9 1 0.2% 0.2% Construction 285 79 83 44 206 79 6.1% 5.1% Manufacturing 22 1 0 1 2 20 0.5% 0.0% Trade 628 293 159 65 517 111 13.4% 12.9% Wholesale Trade 55 26 5 5 36 19 1.2% 0.9% Retail Trade 573 267 154 60 481 92 12.2% 12.0% Transportation, Information, Finance, Accounting 269 83 16 38 137 132 5.7% 3.4% Transportation and Warehousing 21 2 0 2 4 17 0.4% 0.1% Information 23 4 2 1 7 16 0.5% 0.2% Finance, Insurance 100 30 6 8 44 56 2.1% 1.1% Real Estate, Rental, Leasing 125 47 8 27 82 43 2.7% 2.0% Services 991 431 183 106 720 271 21.1% 17.9% Professional and Technical Services 122 43 8 19 70 52 2.6% 1.7% Management of Companies / Enterprises 41 14 1 3 18 23 0.9% 0.4% Administrative and Waste Services 140 56 19 15 90 50 3.0% 2.2% Educational Services 19 3 1 0 4 15 0.4% 0.1% Health Care and Social Assistance 321 151 95 27 273 48 6.8% 6.8% Arts, Entertainment, Recreation 37 16 3 2 21 16 0.8% 0.5% Accommodation and Food Services 139 65 23 20 108 31 3.0% 2.7% Other Services (excl Gov) 172 83 33 20 136 36 3.7% 3.4% Public Administration 549 281 67 132 480 69 11.7% 11.9% State & Local Government 549 281 67 132 480 69 11.7% 11.9% State Government 183 117 6 34 157 26 3.9% 3.9% Local Government 366 164 61 98 323 43 7.8% 8.0% Federal Civilian 0 0 0 0 0 0 0.0% 0.0% Federal Military 0 0 0 0 0 0 0.0% 0.0% Farm 0 0 0 0 0 0 0.0% 0.0% TOTAL EMPLOYMENT 4,704 1,957 1,310 750 4,017 687 100% 100% Notes: Columns may not sum to totals due to rounding. Employment is a jobs count consistent with the Bureau of Economic Analysis definition and measured at the place of work (rather than residence). Source: Analysis generated by the Bureau of Economic and Business Research, University of Utah, using the REMI Model.

The Structure and Economic Impact of Utah’s Coal Industry
48 B U R E A U O F E C O N O M I C A N D B U S I N E S S R E S E A R C H
Detailed occupational distributions of the employment impacts for 2007 are shown in Table 3.3. Just over one in five of the total employment impacts were in construction and extraction occu-pations in both the state as a whole (21 percent) and the coal counties (23 percent). Sales, office, and administrative occupations accounted for 15 percent of employment impacts at the state level and 14 percent within the coal counties. Transportation and material-moving occupations are estimated to account for 8.5 percent of state employment impacts and 9 percent of coal county employment impacts. Management, business, and financial occupations generated an es-timated 9 percent of state employment impacts and 8.5 percent of coal county impacts.
Table 3.3
Utah Coal Production: Detailed Occupational Impacts, 2007
Employment Share of Region
Employment by Occupation State Carbon Emery Sevier Coal
Counties Non-Coal Counties State
Coal Counties
Management, Business, Financial 413 166 106 70 342 71 8.8% 8.5% Computer, Math, Architect, Engineer 179 71 47 31 149 30 3.8% 3.7% Life, Physical, Social Sciences 79 33 26 15 74 5 1.7% 1.8% Community, Social Service 69 34 13 12 59 10 1.5% 1.5% Legal 34 15 6 7 28 6 0.7% 0.7% Education, Training, Library 44 17 7 5 29 15 0.9% 0.7% Arts, Design, Entertainment, Sports, Media 25 10 3 3 16 9 0.5% 0.4% Healthcare 216 101 57 24 182 34 4.6% 4.5% Protective Service 144 71 18 32 121 23 3.1% 3.0% Food Preparation, Serving-Related 143 67 24 20 111 32 3.0% 2.8% Building, Grounds, Personal Care, Service 190 86 33 26 145 45 4.0% 3.6% Sales, Office, Administrative 722 292 155 115 562 160 15.3% 14.0% Farm, Fishing, Forestry 4 2 0 1 3 1 0.1% 0.1% Construction, Extraction 977 372 367 176 915 62 20.8% 22.8% Installation, Maintenance, Repair 260 104 81 46 231 29 5.5% 5.8% Production 228 89 77 39 205 23 4.8% 5.1% Transportation, Material Moving 402 160 135 70 365 37 8.5% 9.1% Notes: Columns may not sum to totals due to rounding. Employment is a jobs count consistent with the Bureau of Economic Analysis definition and measured at the place of work (rather than residence). Proprietors are not included in this table. Source: Analysis generated by the Bureau of Economic and Business Research, University of Utah, using the REMI Model.

The Structure and Economic Impact of Utah’s Coal Industry
B U R E A U O F E C O N O M I C A N D B U S I N E S S R E S E A R C H 49
U TA H C OA L P RO D U C T I O N S C E N A R I O S : 2008–2030 The future of coal mining in Utah is dependent on a complex set of economic, geological, tech-nical, and political factors. Electric utilities consume the largest share of coal produced in Utah, and this should continue to be the case into the foreseeable future. According to the Energy In-formation Administration, coal will continue to provide the largest share of energy for U.S. elec-tricity generation, even as alternative energy sources are developed.68 Assuming that Utah mining operations remain competitive relative to other potential coal and alternative energy sources, mines should continue to produce to at least 2030, although there is some uncertainty. The Utah Geological Survey (UGS) prepared a set of coal projection scenarios to be used in this study: Low, Middle, and High production (Tables 4.1a–4.1c). In all three scenarios, the UGS as-sumed that there is a continued depletion at existing mines. In the Low Scenario, new mines have difficulty with permitting, and demand declines due to the development of affordable alter-native fuels and increased green-house gas regulation. Growth is fur-ther restricted in this scenario as export markets do not develop. In the Middle Scenario, new mines are permitted and begin to produce coal, but demand growth is slow as older electric generation plants are shut down and not replaced. The High Scenario also assumes the de-velopment of new reserves, but, in addition, increasing demand. This increase in demand is from three sources: 1) successful carbon-capture technology and, in conse-quence, new power plants; 2) suc-cessful implementation of coal-to-liquids and coal-to-gas plants; and 3) increasing exports to the Pacific Rim. All three scenarios follow the same assumed production path from 2008 through 2014, with annual production declining from 24.0 mil-lion tons in 2008 to 23.5 million tons each year from 2009 through 2011. Production increases to 25.5 million tons in both 2012 and 2013, and then increases further to 27.5
68 Energy Information Administration. 2009. “Electricity Demand,” from Annual Energy Outlook 2009 with Projections to 2030, available at http://www.eia.doe.gov/oiaf/aeo/electricity.html.
4
Table 4.1a Utah Coal Production, 2000–2030:
Low Scenario (Thousands of Tons)
Year Carbon Emery Sevier Subtotal Other Total 2000 4,615 16,399 5,906 26,920 0 26,920 2001 5,689 14,334 7,001 27,024 0 27,024 2002 6,007 11,692 7,600 25,299 0 25,299 2003 7,091 8,852 7,126 23,069 0 23,069 2004 8,772 5,477 7,568 21,817 0 21,817 2005 9,618 7,372 7,567 24,556 0 24,556 2006 11,560 6,662 7,908 26,131 0 26,131 2007 11,811 5,765 6,712 24,288 0 24,288 2008 11,400 5,700 6,900 24,000 0 24,000 2009 10,500 6,000 7,000 23,500 0 23,500 2010 10,500 6,000 7,000 23,500 0 23,500 2011 10,500 6,000 7,000 23,500 0 23,500 2012 10,500 7,000 7,000 24,500 1,000 25,500 2013 10,500 7,000 7,000 24,500 1,000 25,500 2014 10,500 8,000 7,000 25,500 2,000 27,500 2015 8,500 9,000 6,000 23,500 2,000 25,500 2016 6,500 9,000 6,000 21,500 2,000 23,500 2017 4,500 10,000 6,000 20,500 2,000 22,500 2018 2,500 9,000 6,000 17,500 2,000 19,500 2019 2,500 9,000 6,000 17,500 2,000 19,500 2020 1,500 9,000 6,000 16,500 2,000 18,500 2021 500 8,000 6,000 14,500 2,000 16,500 2022 500 8,000 6,000 14,500 2,000 16,500 2023 500 8,000 5,000 13,500 2,000 15,500 2024 500 8,000 5,000 13,500 2,000 15,500 2025 500 8,000 5,000 13,500 2,000 15,500 2026 500 8,000 5,000 13,500 2,000 15,500 2027 500 7,000 5,000 12,500 2,000 14,500 2028 500 7,000 5,000 12,500 2,000 14,500 2029 500 7,000 5,000 12,500 2,000 14,500 2030 500 7,000 5,000 12,500 2,000 14,500
Note: Historical data through 2007, projections from 2008 through 2030. Source: Utah Geological Survey.

The Structure and Economic Impact of Utah’s Coal Industry
50 B U R E A U O F E C O N O M I C A N D B U S I N E S S R E S E A R C H
million tons in 2014. All three scenarios decline from 2015 through 2019, with the Middle and High scenarios taking the same path to reach 23.5 million tons and the Low Scenario declining to 19.5 million tons. From 2020 to 2030, the growth paths diverge, with the Low Scenario con-tinuing to decline to reach 14.5 million tons annually for each year from 2027 through 2030 and the Middle Scenario declining to 20.5 million tons annually over the same period. In the High Scenario, production also declines from 2014 to a level of 22.5 million tons in 2018, but then increases to a constant annual production of 30.5 million tons from 2022 to 2026. In this sce-nario, annual production drops to 29.5 million tons for the remainder of the projection period (2027–2030) (Figure 4.1).
Table 4.1b
Utah Coal Production, 2000–2030: Middle Scenario (Thousands of Tons)
Year Carbon Emery Sevier Subtotal Other Total 2000 4,615 16,399 5,906 26,920 0 26,920 2001 5,689 14,334 7,001 27,024 0 27,024 2002 6,007 11,692 7,600 25,299 0 25,299 2003 7,091 8,852 7,126 23,069 0 23,069 2004 8,772 5,477 7,568 21,817 0 21,817 2005 9,618 7,372 7,567 24,556 0 24,556 2006 11,560 6,662 7,908 26,131 0 26,131 2007 11,811 5,765 6,712 24,288 0 24,288 2008 11,400 5,700 6,900 24,000 0 24,000 2009 10,500 6,000 7,000 23,500 0 23,500 2010 10,500 6,000 7,000 23,500 0 23,500 2011 10,500 6,000 7,000 23,500 0 23,500 2012 10,500 7,000 7,000 24,500 1,000 25,500 2013 10,500 7,000 7,000 24,500 1,000 25,500 2014 10,500 8,000 7,000 25,500 2,000 27,500 2015 9,500 9,000 6,000 24,500 2,000 26,500 2016 8,500 9,000 6,000 23,500 2,000 25,500 2017 6,500 10,000 6,000 22,500 2,000 24,500 2018 4,500 10,000 6,000 20,500 2,000 22,500 2019 4,500 11,000 6,000 21,500 2,000 23,500 2020 3,500 12,000 6,000 21,500 2,000 23,500 2021 2,500 12,000 6,000 20,500 2,000 22,500 2022 2,500 12,000 6,000 20,500 2,000 22,500 2023 2,500 12,000 5,000 19,500 2,000 21,500 2024 2,500 12,000 5,000 19,500 2,000 21,500 2025 2,500 12,000 5,000 19,500 2,000 21,500 2026 2,500 12,000 5,000 19,500 2,000 21,500 2027 2,500 11,000 5,000 18,500 2,000 20,500 2028 2,500 11,000 5,000 18,500 2,000 20,500 2029 2,500 11,000 5,000 18,500 2,000 20,500 2030 2,500 11,000 5,000 18,500 2,000 20,500
Note: Historical data through 2007, projections from 2008 through 2030. Source: Utah Geological Survey.
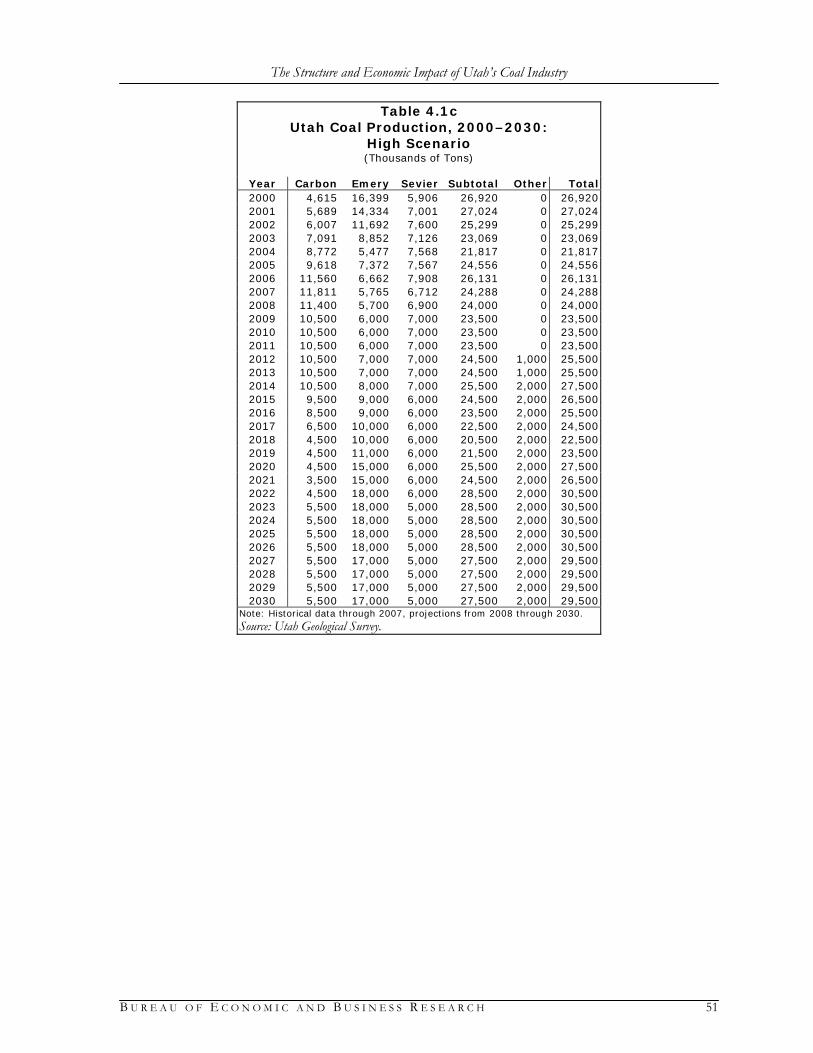
The Structure and Economic Impact of Utah’s Coal Industry
B U R E A U O F E C O N O M I C A N D B U S I N E S S R E S E A R C H 51
Table 4.1c Utah Coal Production, 2000–2030:
High Scenario (Thousands of Tons)
Year Carbon Emery Sevier Subtotal Other Total 2000 4,615 16,399 5,906 26,920 0 26,920 2001 5,689 14,334 7,001 27,024 0 27,024 2002 6,007 11,692 7,600 25,299 0 25,299 2003 7,091 8,852 7,126 23,069 0 23,069 2004 8,772 5,477 7,568 21,817 0 21,817 2005 9,618 7,372 7,567 24,556 0 24,556 2006 11,560 6,662 7,908 26,131 0 26,131 2007 11,811 5,765 6,712 24,288 0 24,288 2008 11,400 5,700 6,900 24,000 0 24,000 2009 10,500 6,000 7,000 23,500 0 23,500 2010 10,500 6,000 7,000 23,500 0 23,500 2011 10,500 6,000 7,000 23,500 0 23,500 2012 10,500 7,000 7,000 24,500 1,000 25,500 2013 10,500 7,000 7,000 24,500 1,000 25,500 2014 10,500 8,000 7,000 25,500 2,000 27,500 2015 9,500 9,000 6,000 24,500 2,000 26,500 2016 8,500 9,000 6,000 23,500 2,000 25,500 2017 6,500 10,000 6,000 22,500 2,000 24,500 2018 4,500 10,000 6,000 20,500 2,000 22,500 2019 4,500 11,000 6,000 21,500 2,000 23,500 2020 4,500 15,000 6,000 25,500 2,000 27,500 2021 3,500 15,000 6,000 24,500 2,000 26,500 2022 4,500 18,000 6,000 28,500 2,000 30,500 2023 5,500 18,000 5,000 28,500 2,000 30,500 2024 5,500 18,000 5,000 28,500 2,000 30,500 2025 5,500 18,000 5,000 28,500 2,000 30,500 2026 5,500 18,000 5,000 28,500 2,000 30,500 2027 5,500 17,000 5,000 27,500 2,000 29,500 2028 5,500 17,000 5,000 27,500 2,000 29,500 2029 5,500 17,000 5,000 27,500 2,000 29,500 2030 5,500 17,000 5,000 27,500 2,000 29,500
Note: Historical data through 2007, projections from 2008 through 2030. Source: Utah Geological Survey.

The Structure and Economic Impact of Utah’s Coal Industry
52 B U R E A U O F E C O N O M I C A N D B U S I N E S S R E S E A R C H
Figure 4.1 Utah Coal Production, 2000–2030
10.0
15.0
20.0
25.0
30.0
35.0
2000
2002
2004
2006
2008
2010
2012
2014
2016
2018
2020
2022
2024
2026
2028
2030
Mil
lio
ns o
f T
on
s
HighMiddleLow
Note: Historical data through 2007, projections from 2008 through 2030. Source: Utah Geological Survey.
In the last year of historical data (2007), Carbon County accounted for nearly half (49 percent) of the coal produced in the state, with Sevier County accounting for 28 percent and Emery County accounting for 24 percent. In all three scenarios, Carbon County production falls beneath that of Emery and, in two out of three, also below Sevier. In all scenarios, Emery becomes the largest coal-producing county in the state, and a smaller amount of coal production (2.0 million tons annually) is developed outside the current three-county coal region (Figures 4.2a–4.2c).
Figure 4.2a
Utah Coal Production, 2000–2030: Low Scenario
0.0
2.0
4.0
6.0
8.0
10.0
12.0
14.0
16.0
18.0
2000
2002
2004
2006
2008
2010
2012
2014
2016
2018
2020
2022
2024
2026
2028
2030
Mil
lio
ns o
f T
on
s
CarbonEmerySevierOther
Note: Historical data through 2007, projections from 2008 through 2030. Source: Utah Geological Survey.

The Structure and Economic Impact of Utah’s Coal Industry
B U R E A U O F E C O N O M I C A N D B U S I N E S S R E S E A R C H 53
Figure 4.2b Utah Coal Production, 2000–2030: Middle Scenario
0.0
2.0
4.0
6.0
8.0
10.0
12.0
14.0
16.0
18.0
2000
2002
2004
2006
2008
2010
2012
2014
2016
2018
2020
2022
2024
2026
2028
2030
Mil
lio
ns o
f T
on
s
CarbonEmerySevierOther
Note: Historical data through 2007, projections from 2008 through 2030. Source: Utah Geological Survey.
Figure 4.2c
Utah Coal Production, 2000–2030: High Scenario
0.0
2.0
4.0
6.0
8.0
10.0
12.0
14.0
16.0
18.0
20.0
2000
2002
2004
2006
2008
2010
2012
2014
2016
2018
2020
2022
2024
2026
2028
2030
Mil
lio
ns o
f T
on
s
CarbonEmerySevierOther
Note: Historical data through 2007, projections from 2008 through 2030. Source: Utah Geological Survey.
In all three scenarios, Carbon County coal production is constant at an annual rate of 10.5 mil-lion tons from 2009 through 2014. In the Low Scenario, production collapses to 0.5 million tons by 2021 and remains there throughout the rest of the projection period. In the Middle Scenario, Carbon County production also declines, but maintains a steady output at 2.5 million tons annu-ally from 2021 through 2030. In the High Scenario, coal production declines to 3.5 million tons in Carbon County in 2021, then rebounds to a steady annual output of 5.5 million tons from 2023 through 2030 (Figure 4.3a).

The Structure and Economic Impact of Utah’s Coal Industry
54 B U R E A U O F E C O N O M I C A N D B U S I N E S S R E S E A R C H
Figure 4.3a Carbon County Coal Production, 2000–2030
0.0
2.0
4.0
6.0
8.0
10.0
12.0
14.0
2000
2002
2004
2006
2008
2010
2012
2014
2016
2018
2020
2022
2024
2026
2028
2030
Mil
lio
ns o
f T
on
s
HighMiddleLow
Note: Historical data through 2007, projections from 2008 through 2030. Source: Utah Geological Survey.
For Emery County, all scenarios follow the same path through 2017 to increase steadily to an-nual production of 10.0 million tons. In the Low Scenario, production declines to reach 7.0 mil-lion tons for each year from 2027 through 2030. The Middle Scenario increases to plateau at 12.0 million tons from 2020 through 2026, then declines to a steady annual production of 11.0 million tons for the duration of the projection. In the High Scenario, Emery County coal pro-duction rises to 18.0 million tons in the years 2022 through 2026, then declines to an annual rate of 17.0 million tons from 2027 through 2030 (Figure 4.3b).
Figure 4.3b
Emery County Coal Production, 2000–2030
0.0
2.0
4.0
6.0
8.0
10.0
12.0
14.0
16.0
18.0
20.0
2000
2002
2004
2006
2008
2010
2012
2014
2016
2018
2020
2022
2024
2026
2028
2030
Mil
lio
ns o
f T
on
s
HighMiddleLow
Note: Historical data through 2007, projections from 2008 through 2030. Source: Utah Geological Survey.
Sevier County has an identical coal production projection in all three scenarios. Production de-clines in three steps, from 7.0 million tons annually in the years 2009 through 2014, then 6.0 mil-

The Structure and Economic Impact of Utah’s Coal Industry
B U R E A U O F E C O N O M I C A N D B U S I N E S S R E S E A R C H 55
lion tons annually from 2015 through 2022, and finally to 5.0 million tons annually from 2023 through the end of the projection period (Figure 4.3c).
Figure 4.3c
Sevier County Coal Production, 2000–2030
0.0
1.0
2.0
3.0
4.0
5.0
6.0
7.0
8.0
9.0
2000
2002
2004
2006
2008
2010
2012
2014
2016
2018
2020
2022
2024
2026
2028
2030
Mil
lio
ns o
f T
on
s
HighMiddleLow
Note: Historical data through 2007, projections from 2008 through 2030. Source: Utah Geological Survey.
The physical quantity of production is converted to dollar values using the price projections of the Energy Information Administration for Rocky Mountain low-sulfur bituminous coal.69 In constant 2008 dollars, the price fluctuates near $31.50 between 2009 and 2012. Then it begins a slow and steady decline to $29.80 in 2025, after which it again returns to $31.48 in 2030. These prices are shown in Figure 4.4 and the resulting values of Utah production for each of the sce-narios are shown in Tables 4.2a–4.2c.
69 Energy Information Administration (2009) “Supplemental Tables to the Annual Energy Outlook 2009, Updated Reference Case with ARRA,” Table 122: Coal Prices by Region and Type (2007 constant dollars), available at http://www.eia.doe.gov/oiaf/aeo/supplement/stimulus/arra/excel/sup_ogc.xls.

The Structure and Economic Impact of Utah’s Coal Industry
56 B U R E A U O F E C O N O M I C A N D B U S I N E S S R E S E A R C H
Figure 4.4 Rocky Mountain Low-Sulfur Bituminous Coal
Projected Price per Ton
$31.48
$28.86
$28.00
$28.50
$29.00
$29.50
$30.00
$30.50
$31.00
$31.50
$32.00
2008
2010
2012
2014
2016
2018
2020
2022
2024
2026
2028
2030
Co
nsta
nt
20
08
Do
llars
Source: Energy Information Administration, Annual Energy Outlook 2009 with Projections to 2030.
Table 4.2a Value of Utah Coal Production, 2000–2030:
Low Scenario (Millions of Constant 2008 Dollars)
Year Carbon Emery Sevier Subtotal Other Total 2007 $308.9 $150.8 $175.6 $635.3 $0.0 $635.3 2008 $329.1 $164.6 $199.2 $692.9 $0.0 $692.9 2009 $330.0 $188.5 $220.0 $738.5 $0.0 $738.5 2010 $329.8 $188.4 $219.8 $738.1 $0.0 $738.1 2011 $331.0 $189.1 $220.7 $740.8 $0.0 $740.8 2012 $330.6 $220.4 $220.4 $771.3 $31.5 $802.8 2013 $327.3 $218.2 $218.2 $763.6 $31.2 $794.8 2014 $325.5 $248.0 $217.0 $790.6 $62.0 $852.6 2015 $264.0 $279.5 $186.4 $729.9 $62.1 $792.0 2016 $200.8 $278.0 $185.3 $664.0 $61.8 $725.8 2017 $138.6 $308.1 $184.8 $631.5 $61.6 $693.1 2018 $77.1 $277.5 $185.0 $539.7 $61.7 $601.4 2019 $76.5 $275.3 $183.5 $535.3 $61.2 $596.5 2020 $45.6 $273.8 $182.5 $501.9 $60.8 $562.7 2021 $15.1 $242.2 $181.7 $439.0 $60.6 $499.6 2022 $15.0 $240.6 $180.4 $436.0 $60.1 $496.2 2023 $15.0 $239.2 $149.5 $403.7 $59.8 $463.5 2024 $14.9 $238.6 $149.1 $402.7 $59.7 $462.4 2025 $14.9 $238.5 $149.1 $402.5 $59.6 $462.1 2026 $15.0 $239.8 $149.9 $404.7 $60.0 $464.6 2027 $15.1 $211.9 $151.3 $378.3 $60.5 $438.9 2028 $15.3 $213.6 $152.6 $381.5 $61.0 $442.6 2029 $15.5 $217.0 $155.0 $387.4 $62.0 $449.4 2030 $15.7 $220.4 $157.4 $393.6 $63.0 $456.6
Note: Historical data for 2007, projections from 2008 through 2030. Sources: BEBR analysis of data from the Utah Geological Survey and the Energy Information Administration.

The Structure and Economic Impact of Utah’s Coal Industry
B U R E A U O F E C O N O M I C A N D B U S I N E S S R E S E A R C H 57
Table 4.2b Value of Utah Coal Production, 2000–2030:
Middle Scenario (Millions of Constant 2008 Dollars)
Year Carbon Emery Sevier Subtotal Other Total 2007 $308.9 $150.8 $175.6 $635.3 $0.0 $635.3 2008 $329.1 $164.6 $199.2 $692.9 $0.0 $692.9 2009 $330.0 $188.5 $220.0 $738.5 $0.0 $738.5 2010 $329.8 $188.4 $219.8 $738.1 $0.0 $738.1 2011 $331.0 $189.1 $220.7 $740.8 $0.0 $740.8 2012 $330.6 $220.4 $220.4 $771.3 $31.5 $802.8 2013 $327.3 $218.2 $218.2 $763.6 $31.2 $794.8 2014 $325.5 $248.0 $217.0 $790.6 $62.0 $852.6 2015 $295.1 $279.5 $186.4 $760.9 $62.1 $823.1 2016 $262.5 $278.0 $185.3 $725.8 $61.8 $787.6 2017 $200.2 $308.1 $184.8 $693.1 $61.6 $754.7 2018 $138.8 $308.4 $185.0 $632.2 $61.7 $693.9 2019 $137.7 $336.5 $183.5 $657.7 $61.2 $718.8 2020 $106.5 $365.0 $182.5 $654.0 $60.8 $714.8 2021 $75.7 $363.3 $181.7 $620.7 $60.6 $681.2 2022 $75.2 $360.8 $180.4 $616.4 $60.1 $676.6 2023 $74.8 $358.9 $149.5 $583.2 $59.8 $643.0 2024 $74.6 $358.0 $149.1 $581.7 $59.7 $641.3 2025 $74.5 $357.8 $149.1 $581.4 $59.6 $641.0 2026 $74.9 $359.7 $149.9 $584.5 $60.0 $644.5 2027 $75.7 $332.9 $151.3 $559.9 $60.5 $620.4 2028 $76.3 $335.7 $152.6 $564.6 $61.0 $625.7 2029 $77.5 $340.9 $155.0 $573.4 $62.0 $635.4 2030 $78.7 $346.4 $157.4 $582.5 $63.0 $645.5
Note: Historical data for 2007, projections from 2008 through 2030. Sources: BEBR analysis of data from the Utah Geological Survey and the Energy Information Administration.

The Structure and Economic Impact of Utah’s Coal Industry
58 B U R E A U O F E C O N O M I C A N D B U S I N E S S R E S E A R C H
Table 4.2c Value of Utah Coal Production, 2000–2030:
High Scenario (Millions of Constant 2008 Dollars)
Year Carbon Emery Sevier Subtotal Other Total 2007 $308.9 $150.8 $175.6 $635.3 $0.0 $635.3 2008 $329.1 $164.6 $199.2 $692.9 $0.0 $692.9 2009 $330.0 $188.5 $220.0 $738.5 $0.0 $738.5 2010 $329.8 $188.4 $219.8 $738.1 $0.0 $738.1 2011 $331.0 $189.1 $220.7 $740.8 $0.0 $740.8 2012 $330.6 $220.4 $220.4 $771.3 $31.5 $802.8 2013 $327.3 $218.2 $218.2 $763.6 $31.2 $794.8 2014 $325.5 $248.0 $217.0 $790.6 $62.0 $852.6 2015 $295.1 $279.5 $186.4 $760.9 $62.1 $823.1 2016 $262.5 $278.0 $185.3 $725.8 $61.8 $787.6 2017 $200.2 $308.1 $184.8 $693.1 $61.6 $754.7 2018 $138.8 $308.4 $185.0 $632.2 $61.7 $693.9 2019 $137.7 $336.5 $183.5 $657.7 $61.2 $718.8 2020 $136.9 $456.3 $182.5 $775.7 $60.8 $836.5 2021 $106.0 $454.2 $181.7 $741.8 $60.6 $802.4 2022 $135.3 $541.3 $180.4 $857.0 $60.1 $917.1 2023 $164.5 $538.3 $149.5 $852.3 $59.8 $912.1 2024 $164.1 $536.9 $149.1 $850.1 $59.7 $909.8 2025 $164.0 $536.7 $149.1 $849.7 $59.6 $909.3 2026 $164.9 $539.6 $149.9 $854.3 $60.0 $914.3 2027 $166.5 $514.5 $151.3 $832.3 $60.5 $892.8 2028 $167.9 $518.9 $152.6 $839.3 $61.0 $900.4 2029 $170.5 $526.9 $155.0 $852.4 $62.0 $914.4 2030 $173.2 $535.3 $157.4 $865.9 $63.0 $928.9
Note: Historical data for 2007, projections from 2008 through 2030. Sources: BEBR analysis of data from the Utah Geological Survey and the Energy Information Administration.

The Structure and Economic Impact of Utah’s Coal Industry
B U R E A U O F E C O N O M I C A N D B U S I N E S S R E S E A R C H 59
I M PAC T S O F C OA L P RO D U C T I O N S C E N A R I O S 5.1 Overview
The model used to evaluate impacts of coal production in Utah is the 29-county, 23-sector, REMI PI+ model built for all counties of Utah. Impacts included in this report are employment (a job count), population, earnings (compensation plus proprietors’ income), local government revenue, state government revenue, and occupations. These are reported for each of the coal counties: Carbon, Emery, and Sevier, as well as for the combined coal counties, the remainder of the state (the other 26 counties), and the entire state. The scenarios include a relatively small mining operation outside these three coal counties beginning in 2012 and continuing until 2030. This area is not included in the coal counties aggregation for reporting purposes. Rather, it is in-cluded in the state total and also the “non-coal counties” aggregation. The essence of economic impact evaluation is the identification of the magnitude and composi-tion of spending in a regional export sector, and the additional spending and income that this generates for a region. In this analysis, each county is considered a region, and all regions in the model are linked through trade flows and commuting patterns. Again, the combined counties of Carbon, Emery, and Sevier are defined as the coal counties, while the other 26 counties are the non-coal counties. The idea of impact analysis is that the export sector generates jobs and spend-ing in the region. These exports support additional business activity (i.e., purchases by the min-ing operation from in-region firms), and also support additional residential population. This additional population requires goods and services, some of which are provided locally and others that are imported into the region. In this analysis, impacts are analyzed from 2007 (historical data) through 2030 (projected data). The analytical structure of the model is explained in greater detail in Section 9. In this REMI model, there is a single “mining” sector, which includes all types of mining, includ-ing coal. The technical coefficients are based on national input-output models, last calibrated in 2007. In the ideal situation, an analyst would have access to primary data from actual mining op-erations to determine the payroll and in-region spending of the coal mining operations. This would include purchase of trucking services, rail service, mining service companies, and so forth. In this study, we made requests to firms, but were not able to acquire the primary data. Given the unique nature of Utah’s coal mines (i.e., very deep underground mines) and the industry mix of the mining sector in Carbon, Emery, and Sevier counties (i.e., heavily weighted towards coal mining) as compared with the aggregate national mining industry, it was necessary to calibrate the model to generate more accurate impact estimates. For this process, the available data in-cluded coal mine employment and associated wages and salaries (from the Utah Department of Workforce Services) for each of the three coal mining counties for 2007 as well as the physical quantity and prices of coal production by county (from the Utah Geological Survey). The REMI model uses the concept “compensation” rather than wages and salaries alone, which is a subset of the former. Both concepts are measured at the place of work, rather than the place of residence of workers. Compensation includes wages and salaries, as well as benefits and em-ployer contributions to government social insurance. For this analysis, statewide industry-level compensation plus wage and salary data generated by the Bureau of Economic Analysis were used to convert the county-level wage and salary coal mining data to compensation. Next, aver-
5

The Structure and Economic Impact of Utah’s Coal Industry
60 B U R E A U O F E C O N O M I C A N D B U S I N E S S R E S E A R C H
age compensation was computed for the known data, and these were compared with the 2007 average compensation estimates in the county-level REMI baseline. An alternative REMI base-line was generated using compensation adjustments that targeted the known average compensa-tion in mining in Carbon, Emery, and Sevier counties in 2007. The observed differences in 2007 were proportionately applied to the REMI average compensations for mining for all years in the projection period (2008–2030). Next, a series of calibration simulations were developed relative to this new compensation-adjusted baseline in REMI. Known production of coal for 2007 was inputted as final demand to the mining sector in Carbon, Emery, and Sevier. A series of adjustments to factor productivity was made until a combination was found that generated mining employment equal to the known numbers of employees in the mining sectors in 2007 in the coal mining counties. This set of productivity adjustments was applied proportionately throughout the projection period. This same procedure was used to prepare the input files for each of the three coal production scenar-ios. Local government revenues and state government impacts are based on the historical ratio of these, by county, to earnings. This is also detailed in Section 9. Results of the scenarios are summarized below. Impact results for the three scenarios are presented in a series of nine tables for these six areas: the State of Utah, Carbon County, Emery County, Sevier County, coal counties (Carbon, Emery, and Sevier combined), and non-coal counties (all counties except Carbon, Emery, and Sevier). For each area, a set of three tables presents summary impacts, detailed employment impacts, and detailed occupational distribution impacts for each of the three scenarios (a total of nine tables). These 54 tables are followed by a set of six tables that compare 2007 and 2030 summary results for all six areas. The tables present the distribution of impacts among areas as well as changes in levels and percentages from 2007 to 2030. 5.2 State-Level Scenario Impacts
Impact results for each of the three scenarios for the state of Utah are shown in nine tables. These include the Low Scenario, shown in Tables 5.1a through 5.1c; the Middle Scenario, shown in Tables 5.2a through 5.2c; and the High Scenario, shown in Tables 5.3a through 5.3c. Figures 5.1a through 5.1e show all three scenarios for each of the major impact categories for the state. Statewide employment impacts rise from 4,703 in 2007 to 6,320 in 2014 for all scenarios. Both the Low and Middle scenarios then turn down to reach 3,524 (Low Scenario) and 4,430 (Middle Scenario) in 2030. The High Scenario increases to a peak of 6,298 in 2022, then declines to reach 5,775 in 2030. In the Low Scenario, population impacts follow a path of increase from 7,055 in 2007 to even-tually peak at 9,744 in 2020, and then decline to reach 8,524 in 2030. The Middle Scenario gener-ally increases to peak in 2024 at 10,665, then declines to 10,158 in 2030. The High Scenario mostly shows growth throughout the projection period, terminating at 12,316 in 2030. Nominal earnings, local tax revenue, and state tax revenue impacts are higher in 2030 than in 2007 for all three scenarios. From 2007 to 2030, nominal earnings impacts increase from $196.3 million to $426.6 million in the Low Scenario, $542.8 million in the Middle Scenario, and $719.4

The Structure and Economic Impact of Utah’s Coal Industry
B U R E A U O F E C O N O M I C A N D B U S I N E S S R E S E A R C H 61
million in the High Scenario. Over the same period, nominal local government revenue impacts increase from $0.8 million to $1.6 million in the Low Scenario, $2.0 million in the Middle Sce-nario, and $2.6 million in the High Scenario. Nominal state government revenue impacts in-crease from $15.0 million in 2007 to 2030 levels of $32.7 million in the Low Scenario, $36.5 million in the Middle Scenario, and $55.1 million in the High Scenario.
Table 5.1a
Summary Impacts State of Utah: Low Scenario
(Dollar Amounts are Millions of Current Dollars)
Year Employment Population Earnings Local
Revenue State
Revenue 2007 4,703 7,055 $196.3 $0.8 $15.0 2008 5,192 7,788 $223.4 $0.9 $17.1 2009 5,497 8,246 $242.7 $1.0 $18.6 2010 5,519 8,279 $249.5 $1.0 $19.1 2011 5,508 8,262 $262.0 $1.0 $20.1 2012 5,950 8,925 $299.4 $1.2 $23.0 2013 5,911 8,867 $313.4 $1.2 $24.0 2014 6,320 9,480 $354.9 $1.4 $27.2 2015 6,034 9,051 $359.8 $1.4 $27.6 2016 5,663 8,981 $356.3 $1.3 $27.3 2017 5,451 9,339 $360.4 $1.3 $27.6 2018 4,931 9,514 $341.0 $1.2 $26.1 2019 4,818 9,663 $349.2 $1.3 $26.8 2020 4,586 9,744 $348.4 $1.3 $26.7 2021 4,230 9,720 $335.2 $1.2 $25.7 2022 4,138 9,680 $343.4 $1.2 $26.3 2023 3,945 9,592 $344.0 $1.2 $26.3 2024 3,880 9,497 $354.1 $1.3 $27.1 2025 3,832 9,383 $366.8 $1.3 $28.1 2026 3,791 9,253 $380.6 $1.4 $29.1 2027 3,625 9,074 $379.5 $1.4 $29.1 2028 3,582 8,892 $393.4 $1.4 $30.1 2029 3,547 8,706 $408.8 $1.5 $31.3 2030 3,524 8,524 $426.6 $1.6 $32.7
Notes: Historical data for 2007, projections from 2008 through 2030. Earnings is by place of work, not place of residence. Employment is a jobs count consistent with the Bureau of Economic Analysis definition and also measured at the place of work. State revenue impacts are income taxes, sales taxes, and other taxes. Local revenue impacts are total general sales and use taxes and restaurant taxes. Sources: Economic and demographic impacts generated using the REMI model. Revenue impacts generated by BEBR using methods documented in this report.
As was the case in the 2007 impact estimates, the natural resources, mining, utilities, and con-struction sector is the largest employment sector (dominated by mining) in all scenarios. As it fluctuates in the different scenarios, the service sectors impacted by the multiplier effect fluctu-ate in response. Similarly, among occupations, construction and extraction occupations numeri-cally dominate and drive changes in the other occupations in all scenarios.

The Structure and Economic Impact of Utah’s Coal Industry
62 B U R E A U O F E C O N O M I C A N D B U S I N E S S R E S E A R C H
Table 5.1b Detailed Employment Impacts State of Utah: Low Scenario
Change Employment by Industry 2007 2010 2015 2020 2025 2030 Level Percent Natural Resources, Mining, Utilities, Construction 2,245 2,642 2,676 1,962 1,487 1,268 –977 –43.5% Forestry, Fishing, Other 2 0 –2 0 2 4 2 100.0% Mining 1,948 2,096 2,138 1,676 1,352 1,174 –774 –39.7% Utilities 10 11 10 8 7 8 –2 –20.0% Construction 285 535 530 278 126 82 –203 –71.2% Manufacturing 22 1 6 1 6 13 –9 –40.9% Trade 628 716 818 654 563 510 –118 –18.8% Wholesale Trade 55 53 63 46 39 35 –20 –36.4% Retail Trade 573 663 755 608 524 475 –98 –17.1% Transportation, Information, Finance, Accounting 269 295 361 257 223 218 –51 –19.0% Transportation and Warehousing 21 19 26 21 24 29 8 38.1% Information 23 26 37 30 27 27 4 17.4% Finance, Insurance 100 98 120 76 62 59 –41 –41.0% Real Estate, Rental, Leasing 125 152 178 130 110 103 –22 –17.6% Services 991 1,204 1,509 1,267 1,199 1,190 199 20.1% Professional and Technical Services 122 149 187 143 127 128 6 4.9% Management of Companies / Enterprises 41 39 39 22 17 16 –25 –61.0% Administrative and Waste Services 140 163 192 138 119 113 –27 –19.3% Educational Services 19 26 43 46 49 52 33 173.7% Health Care and Social Assistance 321 382 485 424 421 435 114 35.5% Arts, Entertainment, Recreation 37 47 68 62 62 61 24 64.9% Accommodation and Food Services 139 198 269 250 237 223 84 60.4% Other Services (excl Gov) 172 200 226 182 167 162 –10 –5.8% Public Administration 549 661 663 446 355 326 –223 –40.6% State & Local Government 549 661 663 446 355 326 –223 –40.6% State Government 183 212 209 123 96 90 –93 –50.8% Local Government 366 449 454 323 259 236 –130 –35.5% Federal Civilian 0 0 0 0 0 0 0 N/A Federal Military 0 0 0 0 0 0 0 N/A Farm 0 0 0 0 0 0 0 N/A TOTAL EMPLOYMENT 4,704 5,519 6,033 4,587 3,833 3,525 –1,179 –25.1% Notes: Historical data for 2007, projections from 2008 through 2030. Columns may not sum to totals due to rounding. Employment is a jobs count consistent with the Bureau of Economic Analysis definition and measured at the place of work (rather than residence). Source: Analysis generated by the Bureau of Economic and Business Research, University of Utah, using the REMI Model.

The Structure and Economic Impact of Utah’s Coal Industry
B U R E A U O F E C O N O M I C A N D B U S I N E S S R E S E A R C H 63
Table 5.1c Detailed Occupational Impacts
State of Utah: Low Scenario
Change Employment by Occupation 2007 2010 2015 2020 2025 2030 Level Percent Management, Business, Financial 413 474 510 373 306 280 –133 –32.2% Computer, Math, Architect, Engineer 179 203 226 172 144 135 –44 –24.6% Life, Physical, Social Science 79 89 95 73 61 55 –24 –30.4% Community, Social Service 69 83 94 74 67 67 –2 –2.9% Legal 34 40 43 31 25 24 –10 –29.4% Education, Training, Library 44 55 71 63 62 64 20 45.5% Arts, Design, Entertainment, Sports, Media 25 30 37 29 26 26 1 4.0% Healthcare 216 256 312 263 254 258 42 19.4% Protective Service 144 174 183 127 104 98 –46 –31.9% Food Preparation, Serving-Related 143 197 263 240 227 217 74 51.7% Building, Grounds, Personal Care, Service 190 230 273 219 202 198 8 4.2% Sales, Office, Administrative 722 826 901 657 547 507 –215 –29.8% Farm, Fishing, Forestry 4 3 3 2 3 4 0 0.0% Construction, Extraction 977 1,208 1,223 862 629 530 –447 –45.8% Installation, Maintenance, Repair 260 306 328 247 200 181 –79 –30.4% Production 228 241 255 194 161 147 –81 –35.5% Transportation, Material Moving 402 441 460 350 287 258 –144 –35.8% Notes: Historical data for 2007, projections from 2008 through 2030. Columns may not sum to totals due to rounding. Employment is a jobs count consistent with the Bureau of Economic Analysis definition and measured at the place of work (rather than residence). Source: Analysis generated by the Bureau of Economic and Business Research, University of Utah, using the REMI Model.

The Structure and Economic Impact of Utah’s Coal Industry
64 B U R E A U O F E C O N O M I C A N D B U S I N E S S R E S E A R C H
Table 5.2a Summary Impacts
State of Utah: Middle Scenario (Dollar Amounts are Millions of Current Dollars)
Year Employment Population Earnings Local
Revenue State
Revenue 2007 4,703 7,055 $196.3 $0.8 $15.0 2008 5,192 7,788 $223.4 $0.9 $17.1 2009 5,497 8,246 $242.7 $1.0 $18.6 2010 5,519 8,279 $249.5 $1.0 $19.1 2011 5,508 8,262 $262.0 $1.0 $20.1 2012 5,950 8,925 $299.4 $1.2 $23.0 2013 5,911 8,867 $313.4 $1.2 $24.0 2014 6,320 9,480 $354.9 $1.4 $27.2 2015 6,184 9,276 $368.6 $1.4 $28.3 2016 5,964 8,946 $374.3 $1.4 $28.7 2017 5,761 9,516 $380.0 $1.4 $29.1 2018 5,397 9,792 $373.5 $1.4 $28.6 2019 5,442 10,071 $395.6 $1.4 $30.3 2020 5,370 10,311 $410.2 $1.5 $31.4 2021 5,173 10,470 $414.3 $1.5 $31.7 2022 5,087 10,590 $426.8 $1.5 $32.7 2023 4,889 10,640 $431.4 $1.5 $33.0 2024 4,813 10,665 $444.8 $1.6 $34.0 2025 4,754 10,655 $460.5 $1.6 $35.2 2026 4,704 10,616 $477.7 $1.7 $36.6 2027 4,532 10,517 $480.9 $1.7 $36.8 2028 4,484 10,406 $499.1 $1.8 $38.2 2029 4,449 10,283 $519.2 $1.9 $39.8 2030 4,430 10,158 $542.8 $2.0 $41.6
Notes: Historical data for 2007, projections from 2008 through 2030. Earnings is by place of work, not place of residence. Employment is a jobs count consistent with the Bureau of Economic Analysis definition and also measured at the place of work. State revenue impacts are income taxes, sales taxes, and other taxes. Local revenue impacts are total general sales and use taxes and restaurant taxes. Sources: Economic and demographic impacts generated using the REMI model. Revenue impacts generated by BEBR using methods documented in this report.

The Structure and Economic Impact of Utah’s Coal Industry
B U R E A U O F E C O N O M I C A N D B U S I N E S S R E S E A R C H 65
Table 5.2b Detailed Employment Impacts State of Utah: Middle Scenario
Change Employment by Industry 2007 2010 2015 2020 2025 2030 Level Percent Natural Resources, Mining, Utilities, Construction 2,245 2,642 2,730 2,288 1,866 1,618 –627 –27.9% Forestry, Fishing, Other 2 0 –2 0 2 4 2 100.0% Mining 1,948 2,096 2,183 1,929 1,644 1,465 –483 –24.8% Utilities 10 11 11 9 9 9 –1 –10.0% Construction 285 535 538 350 211 140 –145 –50.9% Manufacturing 22 1 7 6 12 19 –3 –13.6% Trade 628 716 837 759 689 636 8 1.3% Wholesale Trade 55 53 65 54 47 43 –12 –21.8% Retail Trade 573 663 772 705 642 593 20 3.5% Transportation, Information, Finance, Accounting 269 295 372 304 273 265 –4 –1.5% Transportation and Warehousing 21 19 27 25 29 34 13 61.9% Information 23 26 38 35 32 31 8 34.8% Finance, Insurance 100 98 124 91 76 71 –29 –29.0% Real Estate, Rental, Leasing 125 152 183 153 136 129 4 3.2% Services 991 1,204 1,549 1,469 1,444 1,453 462 46.6% Professional and Technical Services 122 149 193 169 159 160 38 31.1% Management of Companies / Enterprises 41 39 41 28 23 22 –19 –46.3% Administrative and Waste Services 140 163 198 167 150 143 3 2.1% Educational Services 19 26 44 50 56 61 42 221.1% Health Care and Social Assistance 321 382 497 494 508 531 210 65.4% Arts, Entertainment, Recreation 37 47 70 71 73 74 37 100.0% Accommodation and Food Services 139 198 274 278 274 265 126 90.6% Other Services (excl Gov) 172 200 232 212 201 197 25 14.5% Public Administration 549 661 688 545 468 438 –111 –20.2% State & Local Government 549 661 688 545 468 438 –111 –20.2% State Government 183 212 219 152 127 121 –62 –33.9% Local Government 366 449 469 393 341 317 –49 –13.4% Federal Civilian 0 0 0 0 0 0 0 N/A Federal Military 0 0 0 0 0 0 0 N/A Farm 0 0 0 0 0 0 0 N/A TOTAL EMPLOYMENT 4,704 5,519 6,183 5,371 4,752 4,429 –275 –5.8% Notes: Historical data for 2007, projections from 2008 through 2030. Columns may not sum to totals due to rounding. Employment is a jobs count consistent with the Bureau of Economic Analysis definition and measured at the place of work (rather than residence). Source: Analysis generated by the Bureau of Economic and Business Research, University of Utah, using the REMI Model.

The Structure and Economic Impact of Utah’s Coal Industry
66 B U R E A U O F E C O N O M I C A N D B U S I N E S S R E S E A R C H
Table 5.2c Detailed Occupational Impacts State of Utah: Middle Scenario
Change Employment by Occupation 2007 2010 2015 2020 2025 2030 Level Percent Management, Business, Financial 413 474 524 441 382 354 –59 –14.3% Computer, Math, Architect, Engineer 179 203 232 202 180 170 –9 –5.0% Life, Physical, Social Science 79 89 97 85 75 70 –9 –11.4% Community, Social Service 69 83 97 87 84 84 15 21.7% Legal 34 40 44 37 32 30 –4 –11.8% Education, Training, Library 44 55 73 73 74 78 34 77.3% Arts, Design, Entertainment, Sports, Media 25 30 38 34 32 32 7 28.0% Healthcare 216 256 321 308 308 317 101 46.8% Protective Service 144 174 190 155 136 129 –15 –10.4% Food Preparation, Serving-Related 143 197 269 269 266 259 116 81.1% Building, Grounds, Personal Care, Service 190 230 281 257 247 245 55 28.9% Sales, Office, Administrative 722 826 927 776 682 637 –85 –11.8% Farm, Fishing, Forestry 4 3 3 3 4 4 0 0.0% Construction, Extraction 977 1208 1248 1014 807 689 –288 –29.5% Installation, Maintenance, Repair 260 306 336 289 249 228 –32 –12.3% Production 228 241 261 228 200 186 –42 –18.4% Transportation, Material Moving 402 441 471 408 353 323 –79 –19.7% Notes: Historical data for 2007, projections from 2008 through 2030. Columns may not sum to totals due to rounding. Employment is a jobs count consistent with the Bureau of Economic Analysis definition and measured at the place of work (rather than residence). Source: Analysis generated by the Bureau of Economic and Business Research, University of Utah, using the REMI Model.

The Structure and Economic Impact of Utah’s Coal Industry
B U R E A U O F E C O N O M I C A N D B U S I N E S S R E S E A R C H 67
Table 5.3a Summary Impacts
State of Utah: High Scenario (Dollar Amounts are Millions of Current Dollars)
Year Employment Population Earnings Local
Revenue State
Revenue 2007 4,703 7,055 $196.3 $0.8 $15.0 2008 5,192 7,788 $223.4 $0.9 $17.1 2009 5,497 8,246 $242.7 $1.0 $18.6 2010 5,519 8,279 $249.5 $1.0 $19.1 2011 5,508 8,262 $262.0 $1.0 $20.1 2012 5,950 8,925 $299.4 $1.2 $23.0 2013 5,911 8,867 $313.4 $1.2 $24.0 2014 6,320 9,480 $354.9 $1.4 $27.2 2015 6,184 9,276 $368.6 $1.4 $28.3 2016 5,964 8,946 $374.3 $1.4 $28.7 2017 5,761 9,516 $380.0 $1.4 $29.1 2018 5,397 9,792 $373.5 $1.4 $28.6 2019 5,442 10,071 $395.6 $1.4 $30.3 2020 5,959 10,475 $457.8 $1.6 $35.0 2021 5,797 10,781 $467.4 $1.7 $35.8 2022 6,298 11,191 $535.7 $1.9 $41.0 2023 6,262 11,533 $560.4 $2.0 $42.9 2024 6,197 11,814 $582.0 $2.1 $44.5 2025 6,135 12,030 $604.2 $2.1 $46.2 2026 6,075 12,189 $627.4 $2.2 $48.0 2027 5,892 12,265 $636.5 $2.3 $48.7 2028 5,833 12,307 $660.7 $2.4 $50.6 2029 5,792 12,319 $687.7 $2.5 $52.6 2030 5,775 12,316 $719.4 $2.6 $55.1
Notes: Historical data for 2007, projections from 2008 through 2030. Earnings is by place of work, not place of residence. Employment is a jobs count consistent with the Bureau of Economic Analysis definition and also measured at the place of work. State revenue impacts are income taxes, sales taxes, and other taxes. Local revenue impacts are total general sales and use taxes and restaurant taxes. Sources: Economic and demographic impacts generated using the REMI model. Revenue impacts generated by BEBR using methods documented in this report.
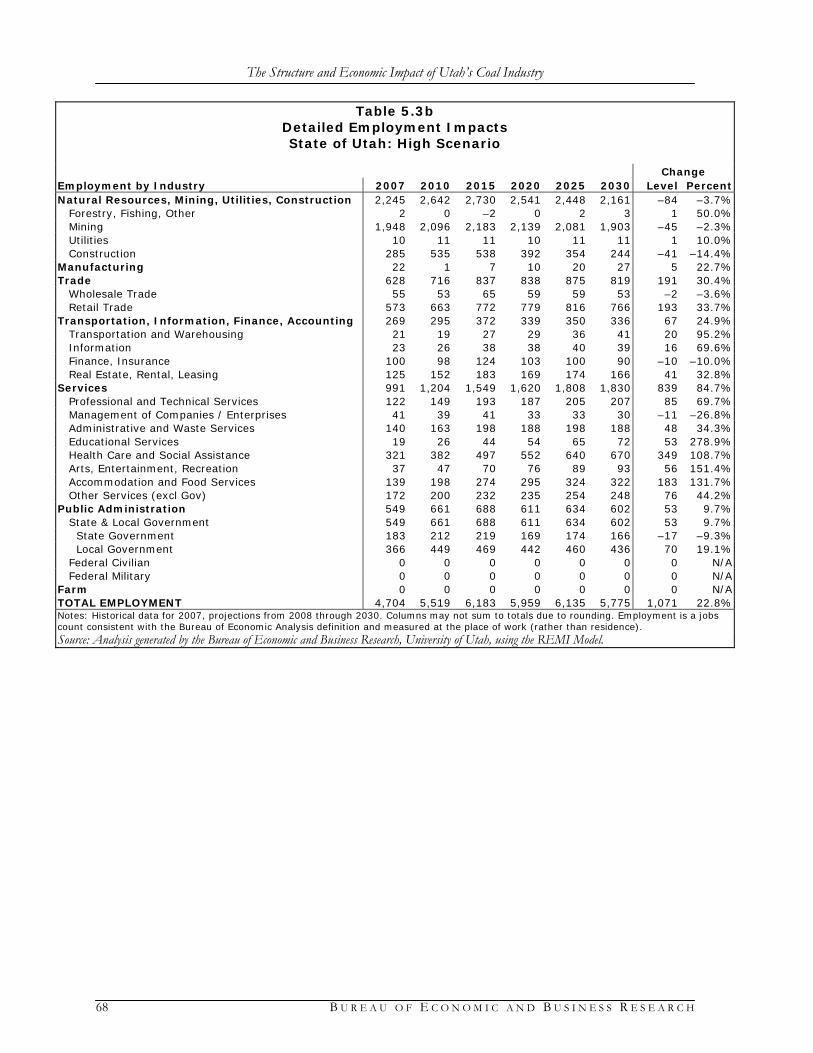
The Structure and Economic Impact of Utah’s Coal Industry
68 B U R E A U O F E C O N O M I C A N D B U S I N E S S R E S E A R C H
Table 5.3b Detailed Employment Impacts State of Utah: High Scenario
Change Employment by Industry 2007 2010 2015 2020 2025 2030 Level Percent Natural Resources, Mining, Utilities, Construction 2,245 2,642 2,730 2,541 2,448 2,161 –84 –3.7% Forestry, Fishing, Other 2 0 –2 0 2 3 1 50.0% Mining 1,948 2,096 2,183 2,139 2,081 1,903 –45 –2.3% Utilities 10 11 11 10 11 11 1 10.0% Construction 285 535 538 392 354 244 –41 –14.4% Manufacturing 22 1 7 10 20 27 5 22.7% Trade 628 716 837 838 875 819 191 30.4% Wholesale Trade 55 53 65 59 59 53 –2 –3.6% Retail Trade 573 663 772 779 816 766 193 33.7% Transportation, Information, Finance, Accounting 269 295 372 339 350 336 67 24.9% Transportation and Warehousing 21 19 27 29 36 41 20 95.2% Information 23 26 38 38 40 39 16 69.6% Finance, Insurance 100 98 124 103 100 90 –10 –10.0% Real Estate, Rental, Leasing 125 152 183 169 174 166 41 32.8% Services 991 1,204 1,549 1,620 1,808 1,830 839 84.7% Professional and Technical Services 122 149 193 187 205 207 85 69.7% Management of Companies / Enterprises 41 39 41 33 33 30 –11 –26.8% Administrative and Waste Services 140 163 198 188 198 188 48 34.3% Educational Services 19 26 44 54 65 72 53 278.9% Health Care and Social Assistance 321 382 497 552 640 670 349 108.7% Arts, Entertainment, Recreation 37 47 70 76 89 93 56 151.4% Accommodation and Food Services 139 198 274 295 324 322 183 131.7% Other Services (excl Gov) 172 200 232 235 254 248 76 44.2% Public Administration 549 661 688 611 634 602 53 9.7% State & Local Government 549 661 688 611 634 602 53 9.7% State Government 183 212 219 169 174 166 –17 –9.3% Local Government 366 449 469 442 460 436 70 19.1% Federal Civilian 0 0 0 0 0 0 0 N/A Federal Military 0 0 0 0 0 0 0 N/A Farm 0 0 0 0 0 0 0 N/A TOTAL EMPLOYMENT 4,704 5,519 6,183 5,959 6,135 5,775 1,071 22.8% Notes: Historical data for 2007, projections from 2008 through 2030. Columns may not sum to totals due to rounding. Employment is a jobs count consistent with the Bureau of Economic Analysis definition and measured at the place of work (rather than residence). Source: Analysis generated by the Bureau of Economic and Business Research, University of Utah, using the REMI Model.

The Structure and Economic Impact of Utah’s Coal Industry
B U R E A U O F E C O N O M I C A N D B U S I N E S S R E S E A R C H 69
Table 5.3c Detailed Occupational Impacts State of Utah: High Scenario
Change Employment by Occupation 2007 2010 2015 2020 2025 2030 Level Percent Management, Business, Financial 413 474 524 491 498 465 52 12.6% Computer, Math, Architect, Engineer 179 203 232 224 232 222 43 24.0% Life, Physical, Social Science 79 89 97 95 96 91 12 15.2% Community, Social Service 69 83 97 97 108 109 40 58.0% Legal 34 40 44 41 42 40 6 17.6% Education, Training, Library 44 55 73 79 92 97 53 120.5% Arts, Design, Entertainment, Sports, Media 25 30 38 38 41 40 15 60.0% Healthcare 216 256 321 344 391 404 188 87.0% Protective Service 144 174 190 173 182 175 31 21.5% Food Preparation, Serving-Related 143 197 269 288 318 318 175 122.4% Building, Grounds, Personal Care, Service 190 230 281 285 314 313 123 64.7% Sales, Office, Administrative 722 826 927 864 884 829 107 14.8% Farm, Fishing, Forestry 4 3 3 4 5 5 1 25.0% Construction, Extraction 977 1208 1248 1128 1082 938 –39 –4.0% Installation, Maintenance, Repair 260 306 336 321 324 300 40 15.4% Production 228 241 261 255 259 243 15 6.6% Transportation, Material Moving 402 441 471 453 452 420 18 4.5% Notes: Historical data for 2007, projections from 2008 through 2030. Columns may not sum to totals due to rounding. Employment is a jobs count consistent with the Bureau of Economic Analysis definition and measured at the place of work (rather than residence). Source: Analysis generated by the Bureau of Economic and Business Research, University of Utah, using the REMI Model.
Figure 5.1a State Employment Impacts, 2007–2030
5,775
4,430
3,524
4,703
3,000
3,500
4,000
4,500
5,000
5,500
6,000
6,500
2007
2009
2011
2013
2015
2017
2019
2021
2023
2025
2027
2029
Em
plo
ym
en
t
HighMiddleLow
Source: Bureau of Economic and Business Research, University of Utah analysis using the REMI model.

The Structure and Economic Impact of Utah’s Coal Industry
70 B U R E A U O F E C O N O M I C A N D B U S I N E S S R E S E A R C H
Figure 5.1b State Population Impacts, 2007–2030
12,316
10,158
7,055
8,524
6,000
7,000
8,000
9,000
10,000
11,000
12,000
13,000
2007
2009
2011
2013
2015
2017
2019
2021
2023
2025
2027
2029
Pers
on
sHighMiddleLow
Source: Bureau of Economic and Business Research, University of Utah analysis using the REMI model.
Figure 5.1c State Earnings Impacts, 2007–2030
$719.4
$542.8
$426.6
$196.3
$100
$200
$300
$400
$500
$600
$700
$800
2007
2009
2011
2013
2015
2017
2019
2021
2023
2025
2027
2029
Mil
lio
ns o
f C
urr
en
t D
oll
ars
HighMiddleLow
Source: Bureau of Economic and Business Research, University of Utah analysis using the REMI model.

The Structure and Economic Impact of Utah’s Coal Industry
B U R E A U O F E C O N O M I C A N D B U S I N E S S R E S E A R C H 71
Figure 5.1d Statewide Local Tax Revenue Impacts, 2007–2030
$2.6
$2.0
$0.8
$1.6
$0.5
$1.0
$1.5
$2.0
$2.5
$3.0
2007
2009
2011
2013
2015
2017
2019
2021
2023
2025
2027
2029
Mil
lio
ns o
f C
urr
en
t D
oll
ars
HighMiddleLow
Source: Bureau of Economic and Business Research, University of Utah analysis using the REMI model.
Figure 5.1e Statewide State Tax Revenue Impacts, 2007–2030
$55.1
$15.0
$41.6
$32.7
$10.0
$15.0
$20.0
$25.0
$30.0
$35.0
$40.0
$45.0
$50.0
$55.0
$60.0
2007
2009
2011
2013
2015
2017
2019
2021
2023
2025
2027
2029
Mil
lio
ns o
f C
urr
en
t D
oll
ars
HighMiddleLow
Source: Bureau of Economic and Business Research, University of Utah analysis using the REMI model.

The Structure and Economic Impact of Utah’s Coal Industry
72 B U R E A U O F E C O N O M I C A N D B U S I N E S S R E S E A R C H
5.3 Carbon County Scenario Impacts
Impact results for each of the three scenarios for Carbon County are also shown in nine tables. The Low Scenario is shown in Tables 5.4a through 5.4c, the Middle Scenario in Tables 5.5a through 5.5c, and the High Scenario in Tables 5.6a through 5.6c. Figures 5.2a through 5.2e show all three scenarios for each of the major impact categories for the county. Impacts follow the general path of the coal production scenarios. In all scenarios, coal produc-tion in Carbon County declines from 2007 to 2030. In 2007, Carbon County accounted for nearly half of the coal produced in the state, with Sevier County accounting for 28 percent and Emery County accounting for 24 percent. In all three scenarios, Carbon County production falls beneath that of Emery and, in two out of three, also below Sevier. In all scenarios, Emery be-comes the largest coal-producing county in the state, and a smaller amount of coal production is developed outside the current three-county coal region. Carbon County employment impacts fall from 1,957 in 2007 to reach 701 in the Low Scenario, 977 in the Middle Scenario, and 1,378 in the High Scenario in 2030. In the Low Scenario, population impacts follow a path of increase from 2,936 in 2007 to even-tually peak in 2017 at 3,368, and then decline to 2,344 in 2030. The Middle Scenario generally increases to peak in 2019 at 3,515, then declines to 2,967 in 2030. The High Scenario mostly shows slow growth throughout the projection period, terminating at 3,758 in 2030. Nominal earnings, local tax revenue, and state tax revenue impacts are higher in 2030 than 2007 for all three scenarios. There is a similar pattern of increasing until 2014, then declining until 2021, then again increasing until 2030. From 2007 to 2030, nominal earnings impacts increase from $62.6 million to $65.5 million in the Low Scenario, $91.9 million in the Middle Scenario, and $130.7 million in the High Scenario. Over the same period, nominal local government reve-nue impacts remain flat at $0.3 million in the Low Scenario, while increasing to $0.5 million in the Middle Scenario and $0.7 million in the High Scenario. Nominal state government revenue impacts increase from $4.8 million in 2007 to 2030 levels of $5.0 million in the Low Scenario, $7.0 million in the Middle Scenario, and $10.0 million in the High Scenario.

The Structure and Economic Impact of Utah’s Coal Industry
B U R E A U O F E C O N O M I C A N D B U S I N E S S R E S E A R C H 73
Table 5.4a Summary Impacts
Carbon County: Low Scenario (Dollar Amounts are Millions of Current Dollars)
Year Employment Population Earnings Local
Revenue State
Revenue 2007 1,957 2,936 $62.6 $0.31 $4.8 2008 2,106 3,159 $70.0 $0.35 $5.4 2009 2,137 3,206 $73.1 $0.37 $5.6 2010 2,133 3,200 $75.1 $0.38 $5.8 2011 2,123 3,185 $79.0 $0.39 $6.1 2012 2,119 3,179 $83.3 $0.42 $6.4 2013 2,092 3,138 $86.9 $0.43 $6.7 2014 2,081 3,122 $91.5 $0.46 $7.0 2015 1,854 3,255 $86.3 $0.43 $6.6 2016 1,597 3,339 $78.1 $0.39 $6.0 2017 1,366 3,368 $69.9 $0.35 $5.4 2018 1,106 3,325 $59.0 $0.30 $4.5 2019 1,083 3,287 $60.7 $0.30 $4.6 2020 960 3,225 $56.1 $0.28 $4.3 2021 829 3,129 $50.6 $0.25 $3.9 2022 816 3,042 $52.2 $0.26 $4.0 2023 806 2,959 $54.0 $0.27 $4.1 2024 797 2,878 $56.0 $0.28 $4.3 2025 788 2,797 $58.2 $0.29 $4.5 2026 777 2,716 $60.2 $0.30 $4.6 2027 750 2,623 $60.9 $0.30 $4.7 2028 734 2,531 $62.4 $0.31 $4.8 2029 717 2,437 $63.9 $0.32 $4.9 2030 701 2,344 $65.5 $0.33 $5.0
Notes: Historical data for 2007, projections from 2008 through 2030. Earnings is by place of work, not place of residence. Employment is a jobs count consistent with the Bureau of Economic Analysis definition and also measured at the place of work. State revenue impacts are income taxes, sales taxes, and other taxes. Local revenue impacts are total general sales and use taxes and restaurant taxes. Sources: Economic and demographic impacts generated using the REMI model. Revenue impacts generated by BEBR using methods documented in this report.

The Structure and Economic Impact of Utah’s Coal Industry
74 B U R E A U O F E C O N O M I C A N D B U S I N E S S R E S E A R C H
Table 5.4b Detailed Employment Impacts Carbon County: Low Scenario
Change Employment by Industry 2007 2010 2015 2020 2025 2030 Level Percent Natural Resources, Mining, Utilities, Construction 868 930 770 335 234 194 –674 –77.6% Forestry, Fishing, Other 1 0 –1 0 1 2 1 100.0% Mining 784 792 668 313 229 188 –596 –76.0% Utilities 4 4 3 1 1 2 –2 –50.0% Construction 79 134 100 21 3 2 –77 –97.5% Manufacturing 1 –1 –2 0 2 3 2 200.0% Trade 293 316 299 196 165 142 –151 –51.5% Wholesale Trade 26 23 18 11 10 9 –17 –65.4% Retail Trade 267 293 281 185 155 133 –134 –50.2% Transportation, Information, Finance, Accounting 83 82 60 24 25 25 –58 –69.9% Transportation and Warehousing 2 1 –1 0 3 4 2 100.0% Information 4 4 4 3 3 3 –1 –25.0% Finance, Insurance 30 25 16 6 6 6 –24 –80.0% Real Estate, Rental, Leasing 47 52 41 15 13 12 –35 –74.5% Services 431 493 477 319 301 282 –149 –34.6% Professional and Technical Services 43 47 36 13 11 11 –32 –74.4% Management of Companies / Enterprises 14 12 7 1 1 1 –13 –92.9% Administrative and Waste Services 56 60 48 22 19 18 –38 –67.9% Educational Services 3 3 4 5 6 7 4 133.3% Health Care and Social Assistance 151 170 169 119 117 114 –37 –24.5% Arts, Entertainment, Recreation 16 20 22 17 17 15 –1 –6.3% Accommodation and Food Services 65 90 106 87 79 69 4 6.2% Other Services (excl Gov) 83 91 85 55 51 47 –36 –43.4% Public Administration 281 313 249 87 60 54 –227 –80.8% State & Local Government 281 313 249 87 60 54 –227 –80.8% State Government 117 126 95 28 18 17 –100 –85.5% Local Government 164 187 154 59 42 37 –127 –77.4% Federal Civilian 0 0 0 0 0 0 0 N/A Federal Military 0 0 0 0 0 0 0 N/A Farm 0 0 0 0 0 0 0 N/A TOTAL EMPLOYMENT 1,957 2,133 1,853 961 787 700 –1,257 –64.2% Notes: Historical data for 2007, projections from 2008 through 2030. Columns may not sum to totals due to rounding. Employment is a jobs count consistent with the Bureau of Economic Analysis definition and measured at the place of work (rather than residence). Source: Analysis generated by the Bureau of Economic and Business Research, University of Utah, using the REMI Model.

The Structure and Economic Impact of Utah’s Coal Industry
B U R E A U O F E C O N O M I C A N D B U S I N E S S R E S E A R C H 75
Table 5.4c Detailed Occupational Impacts Carbon County: Low Scenario
Change Employment by Occupation 2007 2010 2015 2020 2025 2030 Level Percent Management, Business, Financial 166 176 144 64 51 45 –121 –72.9% Computer, Math, Architect, Engineer 71 74 62 27 21 19 –52 –73.2% Life, Physical, Social Science 33 34 29 13 10 9 –24 –72.7% Community, Social Service 34 38 34 19 17 16 –18 –52.9% Legal 15 16 12 5 4 3 –12 –80.0% Education, Training, Library 17 20 18 12 12 12 –5 –29.4% Arts, Design, Entertainment, Sports, Media 10 11 10 5 5 5 –5 –50.0% Healthcare 101 113 107 69 66 64 –37 –36.6% Protective Service 71 80 66 25 18 17 –54 –76.1% Food Preparation, Serving-Related 67 89 100 79 72 64 –3 –4.5% Building, Grounds, Personal Care, Service 86 97 90 54 50 47 –39 –45.3% Sales, Office, Administrative 292 308 251 117 97 88 –204 –69.9% Farm, Fishing, Forestry 2 1 1 0 1 1 –1 –50.0% Construction, Extraction 372 414 340 140 94 78 –294 –79.0% Installation, Maintenance, Repair 104 113 97 45 35 31 –73 –70.2% Production 89 91 77 37 29 25 –64 –71.9% Transportation, Material Moving 160 164 136 64 50 44 –116 –72.5% Notes: Historical data for 2007, projections from 2008 through 2030. Columns may not sum to totals due to rounding. Employment is a jobs count consistent with the Bureau of Economic Analysis definition and measured at the place of work (rather than residence). Source: Analysis generated by the Bureau of Economic and Business Research, University of Utah, using the REMI Model.

The Structure and Economic Impact of Utah’s Coal Industry
76 B U R E A U O F E C O N O M I C A N D B U S I N E S S R E S E A R C H
Table 5.5a Summary Impacts
Carbon County: Middle Scenario (Dollar Amounts are Millions of Current Dollars)
Year Employment Population Earnings Local
Revenue State
Revenue 2007 1,957 2,936 $62.6 $0.31 $4.8 2008 2,106 3,159 $70.0 $0.35 $5.4 2009 2,137 3,206 $73.1 $0.37 $5.6 2010 2,133 3,200 $75.1 $0.38 $5.8 2011 2,123 3,185 $79.0 $0.39 $6.1 2012 2,119 3,179 $83.3 $0.42 $6.4 2013 2,092 3,138 $86.9 $0.43 $6.7 2014 2,081 3,122 $91.5 $0.46 $7.0 2015 1,970 3,282 $91.6 $0.46 $7.0 2016 1,829 3,418 $89.6 $0.45 $6.9 2017 1,599 3,491 $82.1 $0.41 $6.3 2018 1,355 3,498 $72.7 $0.36 $5.6 2019 1,347 3,515 $75.7 $0.38 $5.8 2020 1,240 3,511 $72.9 $0.36 $5.6 2021 1,123 3,477 $68.9 $0.34 $5.3 2022 1,108 3,443 $71.4 $0.36 $5.5 2023 1,094 3,404 $73.9 $0.37 $5.7 2024 1,080 3,361 $76.6 $0.38 $5.9 2025 1,068 3,312 $79.4 $0.40 $6.1 2026 1,055 3,259 $82.3 $0.41 $6.3 2027 1,025 3,190 $83.8 $0.42 $6.4 2028 1,008 3,118 $86.4 $0.43 $6.6 2029 992 3,043 $89.0 $0.45 $6.8 2030 977 2,967 $91.9 $0.46 $7.0
Notes: Historical data for 2007, projections from 2008 through 2030. Earnings is by place of work, not place of residence. Employment is a jobs count consistent with the Bureau of Economic Analysis definition and also measured at the place of work. State revenue impacts are income taxes, sales taxes, and other taxes. Local revenue impacts are total general sales and use taxes and restaurant taxes. Sources: Economic and demographic impacts generated using the REMI model. Revenue impacts generated by BEBR using methods documented in this report.

The Structure and Economic Impact of Utah’s Coal Industry
B U R E A U O F E C O N O M I C A N D B U S I N E S S R E S E A R C H 77
Table 5.5b Detailed Employment Impacts
Carbon County: Middle Scenario
Change Employment by Industry 2007 2010 2015 2020 2025 2030 Level Percent Natural Resources, Mining, Utilities, Construction 868 930 820 438 329 282 –586 –67.5% Forestry, Fishing, Other 1 0 –1 0 1 2 1 100.0% Mining 784 792 713 397 307 265 –519 –66.2% Utilities 4 4 4 2 2 2 –2 –50.0% Construction 79 134 104 39 19 13 –66 –83.5% Manufacturing 1 –1 –2 0 2 3 2 200.0% Trade 293 316 313 238 211 188 –105 –35.8% Wholesale Trade 26 23 20 14 13 12 –14 –53.8% Retail Trade 267 293 293 224 198 176 –91 –34.1% Transportation, Information, Finance, Accounting 83 82 66 37 35 34 –49 –59.0% Transportation and Warehousing 2 1 0 1 3 4 2 100.0% Information 4 4 4 3 3 3 –1 –25.0% Finance, Insurance 30 25 17 9 8 7 –23 –76.7% Real Estate, Rental, Leasing 47 52 45 24 21 20 –27 –57.4% Services 431 493 502 392 382 368 –63 –14.6% Professional and Technical Services 43 47 39 21 18 18 –25 –58.1% Management of Companies / Enterprises 14 12 8 3 2 2 –12 –85.7% Administrative and Waste Services 56 60 52 31 28 26 –30 –53.6% Educational Services 3 3 4 5 7 7 4 133.3% Health Care and Social Assistance 151 170 178 145 146 147 –4 –2.6% Arts, Entertainment, Recreation 16 20 23 20 21 20 4 25.0% Accommodation and Food Services 65 90 109 99 95 87 22 33.8% Other Services (excl Gov) 83 91 89 68 65 61 –22 –26.5% Public Administration 281 313 270 135 109 101 –180 –64.1% State & Local Government 281 313 270 135 109 101 –180 –64.1% State Government 117 126 104 47 37 35 –82 –70.1% Local Government 164 187 166 88 72 66 –98 –59.8% Federal Civilian 0 0 0 0 0 0 0 N/A Federal Military 0 0 0 0 0 0 0 N/A Farm 0 0 0 0 0 0 0 N/A TOTAL EMPLOYMENT 1,957 2,133 1,969 1,240 1,068 976 –981 –50.1% Notes: Historical data for 2007, projections from 2008 through 2030. Columns may not sum to totals due to rounding. Employment is a jobs count consistent with the Bureau of Economic Analysis definition and measured at the place of work (rather than residence). Source: Analysis generated by the Bureau of Economic and Business Research, University of Utah, using the REMI Model.

The Structure and Economic Impact of Utah’s Coal Industry
78 B U R E A U O F E C O N O M I C A N D B U S I N E S S R E S E A R C H
Table 5.5c Detailed Occupational Impacts Carbon County: Middle Scenario
Change Employment by Occupation 2007 2010 2015 2020 2025 2030 Level Percent Management, Business, Financial 166 176 154 87 72 66 –100 –60.2% Computer, Math, Architect, Engineer 71 74 66 37 30 28 –43 –60.6% Life, Physical, Social Science 33 34 31 17 14 13 –20 –60.6% Community, Social Service 34 38 36 24 23 23 –11 –32.4% Legal 15 16 13 7 6 5 –10 –66.7% Education, Training, Library 17 20 20 15 15 15 –2 –11.8% Arts, Design, Entertainment, Sports, Media 10 11 10 7 7 6 –4 –40.0% Healthcare 101 113 113 86 85 84 –17 –16.8% Protective Service 71 80 71 37 31 30 –41 –57.7% Food Preparation, Serving-Related 67 89 104 92 88 82 15 22.4% Building, Grounds, Personal Care, Service 86 97 95 69 66 63 –23 –26.7% Sales, Office, Administrative 292 308 269 158 136 126 –166 –56.8% Farm, Fishing, Forestry 2 1 1 1 1 1 –1 –50.0% Construction, Extraction 372 414 361 188 138 118 –254 –68.3% Installation, Maintenance, Repair 104 113 103 60 49 45 –59 –56.7% Production 89 91 82 48 39 35 –54 –60.7% Transportation, Material Moving 160 164 146 83 68 61 –99 –61.9% Notes: Historical data for 2007, projections from 2008 through 2030. Columns may not sum to totals due to rounding. Employment is a jobs count consistent with the Bureau of Economic Analysis definition and measured at the place of work (rather than residence). Source: Analysis generated by the Bureau of Economic and Business Research, University of Utah, using the REMI Model.

The Structure and Economic Impact of Utah’s Coal Industry
B U R E A U O F E C O N O M I C A N D B U S I N E S S R E S E A R C H 79
Table 5.6a Summary Impacts
Carbon County: High Scenario (Dollar Amounts are Millions of Current Dollars)
Year Employment Population Earnings Local
Revenue State
Revenue 2007 1,957 2,936 $62.6 $0.31 $4.8 2008 2,106 3,159 $70.0 $0.35 $5.4 2009 2,137 3,206 $73.1 $0.37 $5.6 2010 2,133 3,200 $75.1 $0.38 $5.8 2011 2,123 3,185 $79.0 $0.39 $6.1 2012 2,119 3,179 $83.3 $0.42 $6.4 2013 2,092 3,138 $86.9 $0.43 $6.7 2014 2,081 3,122 $91.5 $0.46 $7.0 2015 1,970 3,282 $91.6 $0.46 $7.0 2016 1,829 3,418 $89.6 $0.45 $6.9 2017 1,599 3,491 $82.1 $0.41 $6.3 2018 1,355 3,498 $72.7 $0.36 $5.6 2019 1,347 3,515 $75.7 $0.38 $5.8 2020 1,396 3,572 $82.1 $0.41 $6.3 2021 1,286 3,591 $79.2 $0.40 $6.1 2022 1,423 3,660 $92.2 $0.46 $7.1 2023 1,513 3,735 $103.2 $0.52 $7.9 2024 1,498 3,788 $107.3 $0.54 $8.2 2025 1,482 3,824 $111.4 $0.56 $8.5 2026 1,464 3,842 $115.3 $0.58 $8.8 2027 1,430 3,836 $118.0 $0.59 $9.0 2028 1,410 3,819 $121.9 $0.61 $9.3 2029 1,392 3,792 $126.0 $0.63 $9.7 2030 1,378 3,758 $130.7 $0.65 $10.0
Notes: Historical data for 2007, projections from 2008 through 2030. Earnings is by place of work, not place of residence. Employment is a jobs count consistent with the Bureau of Economic Analysis definition and also measured at the place of work. State revenue impacts are income taxes, sales taxes, and other taxes. Local revenue impacts are total general sales and use taxes and restaurant taxes. Sources: Economic and demographic impacts generated using the REMI model. Revenue impacts generated by BEBR using methods documented in this report.

The Structure and Economic Impact of Utah’s Coal Industry
80 B U R E A U O F E C O N O M I C A N D B U S I N E S S R E S E A R C H
Table 5.6b Detailed Employment Impacts Carbon County: High Scenario
Change Employment by Industry 2007 2010 2015 2020 2025 2030 Level Percent Natural Resources, Mining, Utilities, Construction 868 930 820 488 475 417 –451 –52.0% Forestry, Fishing, Other 1 0 –1 0 1 1 0 0.0% Mining 784 792 713 439 422 378 –406 –51.8% Utilities 4 4 4 2 3 3 –1 –25.0% Construction 79 134 104 47 49 35 –44 –55.7% Manufacturing 1 –1 –2 0 2 2 1 100.0% Trade 293 316 313 264 277 252 –41 –14.0% Wholesale Trade 26 23 20 16 17 15 –11 –42.3% Retail Trade 267 293 293 248 260 237 –30 –11.2% Transportation, Information, Finance, Accounting 83 82 66 44 52 49 –34 –41.0% Transportation and Warehousing 2 1 0 1 3 4 2 100.0% Information 4 4 4 3 4 4 0 0.0% Finance, Insurance 30 25 17 11 12 10 –20 –66.7% Real Estate, Rental, Leasing 47 52 45 29 33 31 –16 –34.0% Services 431 493 502 439 498 487 56 13.0% Professional and Technical Services 43 47 39 25 28 27 –16 –37.2% Management of Companies / Enterprises 14 12 8 4 5 4 –10 –71.4% Administrative and Waste Services 56 60 52 37 41 38 –18 –32.1% Educational Services 3 3 4 5 7 8 5 166.7% Health Care and Social Assistance 151 170 178 163 191 192 41 27.2% Arts, Entertainment, Recreation 16 20 23 22 26 26 10 62.5% Accommodation and Food Services 65 90 109 106 115 111 46 70.8% Other Services (excl Gov) 83 91 89 77 85 81 –2 –2.4% Public Administration 281 313 270 159 178 170 –111 –39.5% State & Local Government 281 313 270 159 178 170 –111 –39.5% State Government 117 126 104 57 65 62 –55 –47.0% Local Government 164 187 166 102 113 108 –56 –34.1% Federal Civilian 0 0 0 0 0 0 0 N/A Federal Military 0 0 0 0 0 0 0 N/A Farm 0 0 0 0 0 0 0 N/A TOTAL EMPLOYMENT 1,957 2,133 1,969 1,394 1,482 1,377 –580 –29.6% Notes: Historical data for 2007, projections from 2008 through 2030. Columns may not sum to totals due to rounding. Employment is a jobs count consistent with the Bureau of Economic Analysis definition and measured at the place of work (rather than residence). Source: Analysis generated by the Bureau of Economic and Business Research, University of Utah, using the REMI Model.
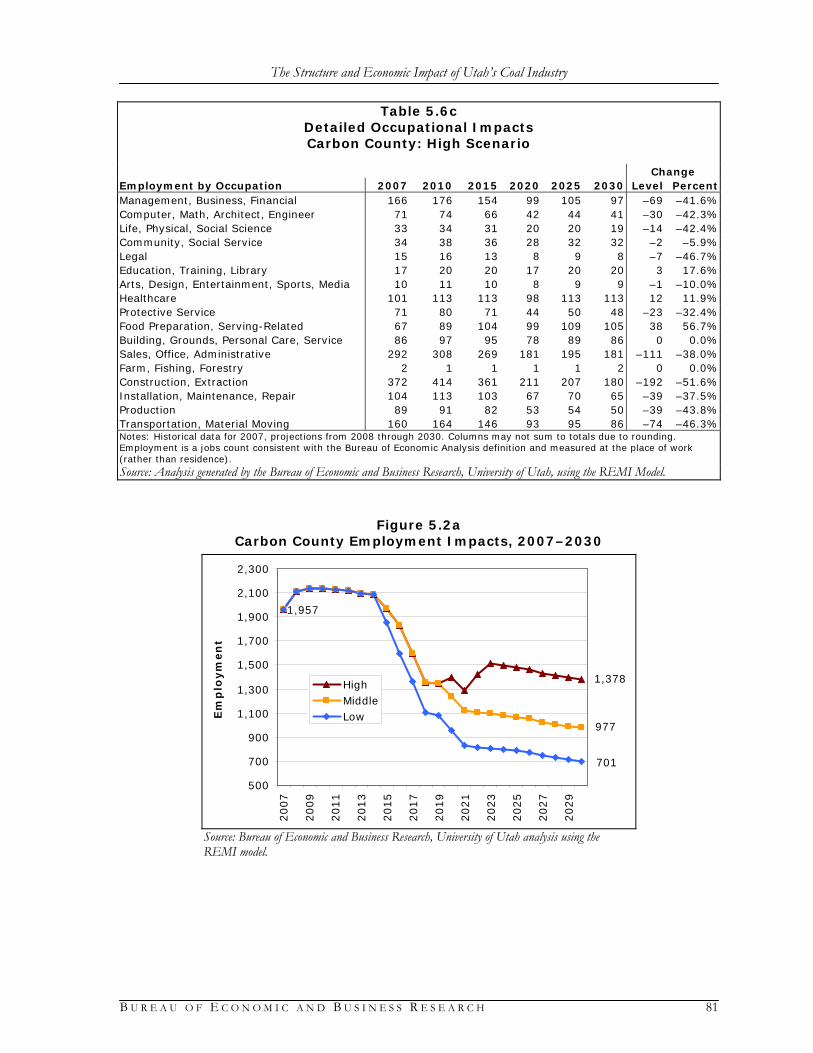
The Structure and Economic Impact of Utah’s Coal Industry
B U R E A U O F E C O N O M I C A N D B U S I N E S S R E S E A R C H 81
Table 5.6c Detailed Occupational Impacts Carbon County: High Scenario
Change Employment by Occupation 2007 2010 2015 2020 2025 2030 Level Percent Management, Business, Financial 166 176 154 99 105 97 –69 –41.6% Computer, Math, Architect, Engineer 71 74 66 42 44 41 –30 –42.3% Life, Physical, Social Science 33 34 31 20 20 19 –14 –42.4% Community, Social Service 34 38 36 28 32 32 –2 –5.9% Legal 15 16 13 8 9 8 –7 –46.7% Education, Training, Library 17 20 20 17 20 20 3 17.6% Arts, Design, Entertainment, Sports, Media 10 11 10 8 9 9 –1 –10.0% Healthcare 101 113 113 98 113 113 12 11.9% Protective Service 71 80 71 44 50 48 –23 –32.4% Food Preparation, Serving-Related 67 89 104 99 109 105 38 56.7% Building, Grounds, Personal Care, Service 86 97 95 78 89 86 0 0.0% Sales, Office, Administrative 292 308 269 181 195 181 –111 –38.0% Farm, Fishing, Forestry 2 1 1 1 1 2 0 0.0% Construction, Extraction 372 414 361 211 207 180 –192 –51.6% Installation, Maintenance, Repair 104 113 103 67 70 65 –39 –37.5% Production 89 91 82 53 54 50 –39 –43.8% Transportation, Material Moving 160 164 146 93 95 86 –74 –46.3% Notes: Historical data for 2007, projections from 2008 through 2030. Columns may not sum to totals due to rounding. Employment is a jobs count consistent with the Bureau of Economic Analysis definition and measured at the place of work (rather than residence). Source: Analysis generated by the Bureau of Economic and Business Research, University of Utah, using the REMI Model.
Figure 5.2a Carbon County Employment Impacts, 2007–2030
1,378
977
701
1,957
500
700
900
1,100
1,300
1,500
1,700
1,900
2,100
2,300
2007
2009
2011
2013
2015
2017
2019
2021
2023
2025
2027
2029
Em
plo
ym
en
t
HighMiddleLow
Source: Bureau of Economic and Business Research, University of Utah analysis using the REMI model.

The Structure and Economic Impact of Utah’s Coal Industry
82 B U R E A U O F E C O N O M I C A N D B U S I N E S S R E S E A R C H
Figure 5.2b Carbon County Population Impacts, 2007–2030
3,758
2,9672,936
2,344
2,000
2,200
2,400
2,600
2,800
3,000
3,200
3,400
3,600
3,800
4,000
2007
2009
2011
2013
2015
2017
2019
2021
2023
2025
2027
2029
Pers
on
s
HighMiddleLow
Source: Bureau of Economic and Business Research, University of Utah analysis using the REMI model.
Figure 5.2c Carbon County Earnings Impacts, 2007–2030
$130.7
$91.9
$65.5
$62.6
$50
$60
$70
$80
$90
$100
$110
$120
$130
$140
2007
2009
2011
2013
2015
2017
2019
2021
2023
2025
2027
2029
Mil
lio
ns o
f C
urr
en
t D
oll
ars
HighMiddleLow
Source: Bureau of Economic and Business Research, University of Utah analysis using the REMI model.

The Structure and Economic Impact of Utah’s Coal Industry
B U R E A U O F E C O N O M I C A N D B U S I N E S S R E S E A R C H 83
Figure 5.2d Carbon County Local Tax Revenue Impacts, 2007–2030
$0.65
$0.46
$0.31
$0.33
$0.20
$0.25
$0.30
$0.35
$0.40
$0.45
$0.50
$0.55
$0.60
$0.65
$0.70
2007
2009
2011
2013
2015
2017
2019
2021
2023
2025
2027
2029
Mil
lio
ns o
f C
urr
en
t D
oll
ars
HighMiddleLow
Source: Bureau of Economic and Business Research, University of Utah analysis using the REMI model.
Figure 5.2e Carbon County State Tax Revenue Impacts, 2007–2030
$10.0
$4.8
$7.0
$5.0
$3.0
$4.0
$5.0
$6.0
$7.0
$8.0
$9.0
$10.0
$11.0
2007
2009
2011
2013
2015
2017
2019
2021
2023
2025
2027
2029
Mil
lio
ns o
f C
urr
en
t D
oll
ars
HighMiddleLow
Source: Bureau of Economic and Business Research, University of Utah analysis using the REMI model.

The Structure and Economic Impact of Utah’s Coal Industry
84 B U R E A U O F E C O N O M I C A N D B U S I N E S S R E S E A R C H
5.4 Emery County Scenario Impacts
Impact results for each of the three scenarios for Emery County are also shown in nine tables. The Low Scenario is shown in Tables 5.7a through 5.7c, the Middle Scenario in Tables 5.8a through 5.8c, and the High Scenario in Tables 5.9a through 5.9c. Figures 5.3a through 5.3e show all three scenarios for each of the major impact categories for the county. The impacts measured here follow the general path of the coal production scenarios. Coal pro-duction in Emery County declines from 2007 to 2030 in the Low Scenario, increases somewhat in the Middle Scenario, and increases in the High Scenario. In all scenarios, Emery becomes the largest coal-producing county in the state. Emery County employment impacts follow a pattern of increasing to a peak and then declining in all scenarios. From an initial employment impact of 1,309 in 2007, employment peaks in 2017 in the Low Scenario at 1,812, in 2020 in the Middle Scenario at 1,940, and in 2022 in the High Scenario at 2,501. While all scenarios decline from these peaks, both the Middle and High Sce-narios result in higher employment impacts in 2030 than in 2007. Employment impacts for 2030 are 1,220 in the Low Scenario, 1,616 in the Middle Scenario, and 2,214 in the High Scenario. Population impacts for Emery County are higher in 2030 than in 2007 for all three scenarios. These population impacts generally increase from 2007 to 2019 in all three scenarios, growing from 1,964 in 2007 to 2,475 in the Low Scenario and to 2,804 in both the Middle and High Sce-narios. From 2019 to 2030, population impacts decline to reach 2,186 in the Low Scenario, stay mostly flat to reach 2,720 in the Middle Scenario, and increase to 3,457 in the High Scenario. Nominal earnings, local tax revenue, and state tax revenue impacts are higher in 2030 than 2007 for all three scenarios for Emery County. From 2007 to 2030, nominal earnings impacts increase from $47.4 million to $132.1 million in the Low Scenario, $175.1 million in the Middle Scenario, and $240.2 million in the High Scenario. Over the same period, nominal local government reve-nue impacts increase from $0.1 million to $0.3 million in the Low Scenario, $0.4 million in the Middle Scenario, and $0.5 million in the High Scenario. Nominal state government revenue im-pacts increase from $3.5 million in 2007 to 2030 levels of $9.9 million in the Low Scenario, $13.1 million in the Middle Scenario, and $17.9 million in the High Scenario.

The Structure and Economic Impact of Utah’s Coal Industry
B U R E A U O F E C O N O M I C A N D B U S I N E S S R E S E A R C H 85
Table 5.7a Summary Impacts
Emery County: Low Scenario (Dollar Amounts are Millions of Current Dollars)
Year Employment Population Earnings Local
Revenue State
Revenue 2007 1,309 1,964 $47.4 $0.09 $3.5 2008 1,400 2,100 $52.8 $0.11 $3.9 2009 1,461 2,192 $56.4 $0.11 $4.2 2010 1,465 2,198 $58.0 $0.12 $4.3 2011 1,467 2,201 $61.6 $0.12 $4.6 2012 1,566 2,349 $69.4 $0.14 $5.2 2013 1,561 2,342 $73.3 $0.15 $5.5 2014 1,656 2,484 $82.3 $0.16 $6.1 2015 1,754 2,631 $92.4 $0.18 $6.9 2016 1,732 2,598 $96.5 $0.19 $7.2 2017 1,812 2,718 $106.0 $0.21 $7.9 2018 1,678 2,517 $103.1 $0.21 $7.7 2019 1,650 2,475 $106.8 $0.21 $8.0 2020 1,618 2,437 $109.9 $0.22 $8.2 2021 1,490 2,449 $106.3 $0.21 $7.9 2022 1,460 2,454 $109.3 $0.22 $8.2 2023 1,436 2,454 $112.7 $0.23 $8.4 2024 1,412 2,450 $116.1 $0.23 $8.7 2025 1,392 2,435 $120.3 $0.24 $9.0 2026 1,373 2,407 $124.2 $0.25 $9.3 2027 1,265 2,353 $119.6 $0.24 $8.9 2028 1,246 2,298 $123.3 $0.25 $9.2 2029 1,230 2,241 $127.2 $0.25 $9.5 2030 1,220 2,186 $132.1 $0.26 $9.9
Notes: Historical data for 2007, projections from 2008 through 2030. Earnings is by place of work, not place of residence. Employment is a jobs count consistent with the Bureau of Economic Analysis definition and also measured at the place of work. State revenue impacts are income taxes, sales taxes, and other taxes. Local revenue impacts are total general sales and use taxes and restaurant taxes. Sources: Economic and demographic impacts generated using the REMI model. Revenue impacts generated by BEBR using methods documented in this report.
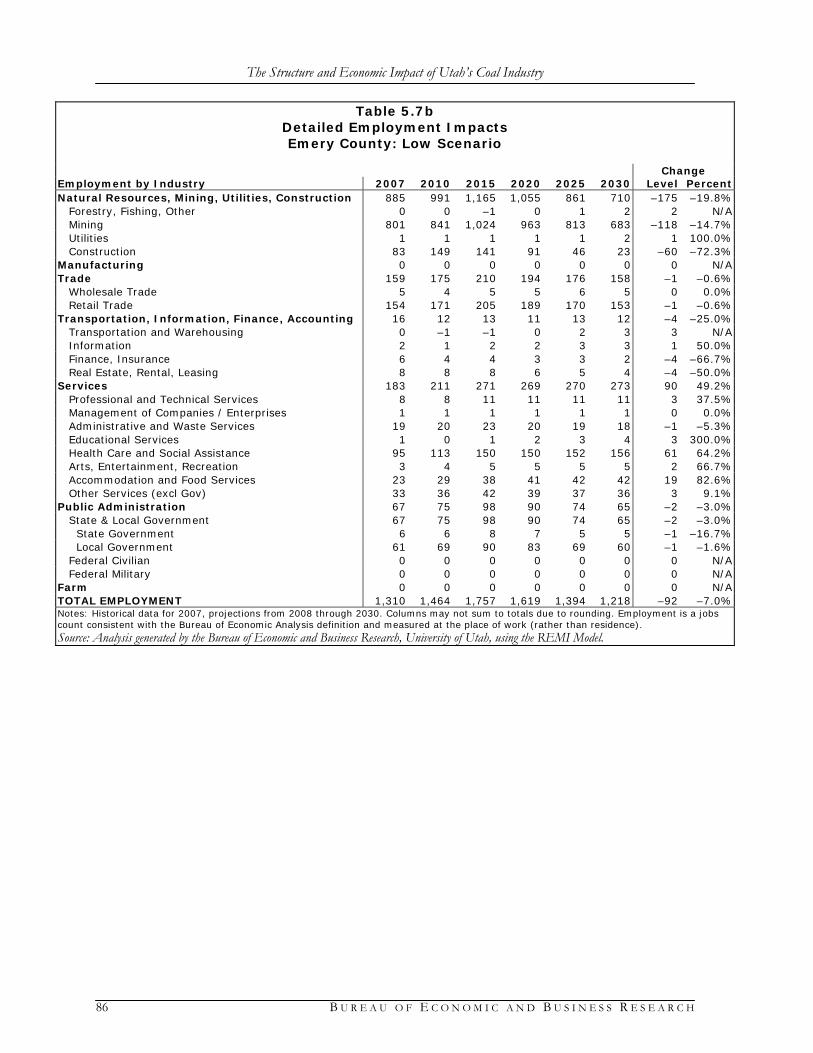
The Structure and Economic Impact of Utah’s Coal Industry
86 B U R E A U O F E C O N O M I C A N D B U S I N E S S R E S E A R C H
Table 5.7b Detailed Employment Impacts Emery County: Low Scenario
Change Employment by Industry 2007 2010 2015 2020 2025 2030 Level Percent Natural Resources, Mining, Utilities, Construction 885 991 1,165 1,055 861 710 –175 –19.8% Forestry, Fishing, Other 0 0 –1 0 1 2 2 N/A Mining 801 841 1,024 963 813 683 –118 –14.7% Utilities 1 1 1 1 1 2 1 100.0% Construction 83 149 141 91 46 23 –60 –72.3% Manufacturing 0 0 0 0 0 0 0 N/A Trade 159 175 210 194 176 158 –1 –0.6% Wholesale Trade 5 4 5 5 6 5 0 0.0% Retail Trade 154 171 205 189 170 153 –1 –0.6% Transportation, Information, Finance, Accounting 16 12 13 11 13 12 –4 –25.0% Transportation and Warehousing 0 –1 –1 0 2 3 3 N/A Information 2 1 2 2 3 3 1 50.0% Finance, Insurance 6 4 4 3 3 2 –4 –66.7% Real Estate, Rental, Leasing 8 8 8 6 5 4 –4 –50.0% Services 183 211 271 269 270 273 90 49.2% Professional and Technical Services 8 8 11 11 11 11 3 37.5% Management of Companies / Enterprises 1 1 1 1 1 1 0 0.0% Administrative and Waste Services 19 20 23 20 19 18 –1 –5.3% Educational Services 1 0 1 2 3 4 3 300.0% Health Care and Social Assistance 95 113 150 150 152 156 61 64.2% Arts, Entertainment, Recreation 3 4 5 5 5 5 2 66.7% Accommodation and Food Services 23 29 38 41 42 42 19 82.6% Other Services (excl Gov) 33 36 42 39 37 36 3 9.1% Public Administration 67 75 98 90 74 65 –2 –3.0% State & Local Government 67 75 98 90 74 65 –2 –3.0% State Government 6 6 8 7 5 5 –1 –16.7% Local Government 61 69 90 83 69 60 –1 –1.6% Federal Civilian 0 0 0 0 0 0 0 N/A Federal Military 0 0 0 0 0 0 0 N/A Farm 0 0 0 0 0 0 0 N/A TOTAL EMPLOYMENT 1,310 1,464 1,757 1,619 1,394 1,218 –92 –7.0% Notes: Historical data for 2007, projections from 2008 through 2030. Columns may not sum to totals due to rounding. Employment is a jobs count consistent with the Bureau of Economic Analysis definition and measured at the place of work (rather than residence). Source: Analysis generated by the Bureau of Economic and Business Research, University of Utah, using the REMI Model.

The Structure and Economic Impact of Utah’s Coal Industry
B U R E A U O F E C O N O M I C A N D B U S I N E S S R E S E A R C H 87
Table 5.7c Detailed Occupational Impacts Emery County: Low Scenario
Change Employment by Occupation 2007 2010 2015 2020 2025 2030 Level Percent Management, Business, Financial 106 116 138 126 106 91 –15 –14.2% Computer, Math, Architect, Engineer 47 51 63 60 52 45 –2 –4.3% Life, Physical, Social Science 26 28 35 33 29 25 –1 –3.8% Community, Social Service 13 15 19 19 18 18 5 38.5% Legal 6 6 8 7 6 5 –1 –16.7% Education, Training, Library 7 7 10 10 11 11 4 57.1% Arts, Design, Entertainment, Sports, Media 3 3 4 4 4 4 1 33.3% Healthcare 57 67 88 87 87 88 31 54.4% Protective Service 18 21 27 25 21 19 1 5.6% Food Preparation, Serving-Related 24 29 39 41 42 42 18 75.0% Building, Grounds, Personal Care, Service 33 37 47 45 44 43 10 30.3% Sales, Office, Administrative 155 169 198 180 154 136 –19 –12.3% Farm, Fishing, Forestry 0 0 0 0 1 1 1 N/A Construction, Extraction 367 427 492 435 346 281 –86 –23.4% Installation, Maintenance, Repair 81 91 111 103 87 75 –6 –7.4% Production 77 82 100 93 80 68 –9 –11.7% Transportation, Material Moving 135 143 171 159 135 115 –20 –14.8% Notes: Historical data for 2007, projections from 2008 through 2030. Columns may not sum to totals due to rounding. Employment is a jobs count consistent with the Bureau of Economic Analysis definition and measured at the place of work (rather than residence). Source: Analysis generated by the Bureau of Economic and Business Research, University of Utah, using the REMI Model.

The Structure and Economic Impact of Utah’s Coal Industry
88 B U R E A U O F E C O N O M I C A N D B U S I N E S S R E S E A R C H
Table 5.8a Summary Impacts
Emery County: Middle Scenario (Dollar Amounts are Millions of Current Dollars)
Year Employment Population Earnings Local
Revenue State
Revenue 2007 1,309 1,964 $47.4 $0.09 $3.5 2008 1,400 2,100 $52.8 $0.11 $3.9 2009 1,461 2,192 $56.4 $0.11 $4.2 2010 1,465 2,198 $58.0 $0.12 $4.3 2011 1,467 2,201 $61.6 $0.12 $4.6 2012 1,566 2,349 $69.4 $0.14 $5.2 2013 1,561 2,342 $73.3 $0.15 $5.5 2014 1,656 2,484 $82.3 $0.16 $6.1 2015 1,759 2,639 $92.7 $0.19 $6.9 2016 1,742 2,613 $97.1 $0.19 $7.2 2017 1,823 2,735 $106.6 $0.21 $8.0 2018 1,793 2,690 $110.2 $0.22 $8.2 2019 1,869 2,804 $121.0 $0.24 $9.0 2020 1,940 2,576 $131.7 $0.26 $9.8 2021 1,913 2,660 $136.5 $0.27 $10.2 2022 1,882 2,724 $140.9 $0.28 $10.5 2023 1,852 2,775 $145.5 $0.29 $10.9 2024 1,821 2,816 $149.9 $0.30 $11.2 2025 1,796 2,838 $155.3 $0.31 $11.6 2026 1,772 2,842 $160.4 $0.32 $12.0 2027 1,661 2,817 $157.2 $0.31 $11.7 2028 1,641 2,788 $162.5 $0.33 $12.1 2029 1,625 2,754 $168.1 $0.34 $12.6 2030 1,616 2,720 $175.1 $0.35 $13.1
Notes: Historical data for 2007, projections from 2008 through 2030. Earnings is by place of work, not place of residence. Employment is a jobs count consistent with the Bureau of Economic Analysis definition and also measured at the place of work. State revenue impacts are income taxes, sales taxes, and other taxes. Local revenue impacts are total general sales and use taxes and restaurant taxes. Sources: Economic and demographic impacts generated using the REMI model. Revenue impacts generated by BEBR using methods documented in this report.

The Structure and Economic Impact of Utah’s Coal Industry
B U R E A U O F E C O N O M I C A N D B U S I N E S S R E S E A R C H 89
Table 5.8b Detailed Employment Impacts Emery County: Middle Scenario
Change Employment by Industry 2007 2010 2015 2020 2025 2030 Level Percent Natural Resources, Mining, Utilities, Construction 885 991 1,165 1,251 1,111 947 62 7.0% Forestry, Fishing, Other 0 0 –1 0 1 1 1 N/A Mining 801 841 1,024 1,131 1,027 898 97 12.1% Utilities 1 1 1 1 2 2 1 100.0% Construction 83 149 141 119 81 46 –37 –44.6% Manufacturing 0 0 0 0 0 0 0 N/A Trade 159 175 211 230 220 203 44 27.7% Wholesale Trade 5 4 5 6 7 6 1 20.0% Retail Trade 154 171 206 224 213 197 43 27.9% Transportation, Information, Finance, Accounting 16 12 13 15 14 17 1 6.3% Transportation and Warehousing 0 –1 –1 0 1 3 3 N/A Information 2 1 2 2 3 4 2 100.0% Finance, Insurance 6 4 4 4 3 3 –3 –50.0% Real Estate, Rental, Leasing 8 8 8 9 7 7 –1 –12.5% Services 183 211 272 323 337 344 161 88.0% Professional and Technical Services 8 8 11 14 15 15 7 87.5% Management of Companies / Enterprises 1 1 1 1 1 1 0 0.0% Administrative and Waste Services 19 20 23 27 26 25 6 31.6% Educational Services 1 0 1 2 3 4 3 300.0% Health Care and Social Assistance 95 113 151 180 190 198 103 108.4% Arts, Entertainment, Recreation 3 4 5 6 6 6 3 100.0% Accommodation and Food Services 23 29 38 46 50 50 27 117.4% Other Services (excl Gov) 33 36 42 47 46 45 12 36.4% Public Administration 67 75 99 121 115 104 37 55.2% State & Local Government 67 75 99 121 115 104 37 55.2% State Government 6 6 8 9 9 8 2 33.3% Local Government 61 69 91 112 106 96 35 57.4% Federal Civilian 0 0 0 0 0 0 0 N/A Federal Military 0 0 0 0 0 0 0 N/A Farm 0 0 0 0 0 0 0 N/A TOTAL EMPLOYMENT 1,310 1,464 1,760 1,940 1,797 1,615 305 23.3% Notes: Historical data for 2007, projections from 2008 through 2030. Columns may not sum to totals due to rounding. Employment is a jobs count consistent with the Bureau of Economic Analysis definition and measured at the place of work (rather than residence). Source: Analysis generated by the Bureau of Economic and Business Research, University of Utah, using the REMI Model.

The Structure and Economic Impact of Utah’s Coal Industry
90 B U R E A U O F E C O N O M I C A N D B U S I N E S S R E S E A R C H
Table 5.8c Detailed Occupational Impacts Emery County: Middle Scenario
Change Employment by Occupation 2007 2010 2015 2020 2025 2030 Level Percent Management, Business, Financial 106 116 138 152 139 123 17 16.0% Computer, Math, Architect, Engineer 47 51 63 71 67 60 13 27.7% Life, Physical, Social Science 26 28 35 39 37 33 7 26.9% Community, Social Service 13 15 20 24 24 24 11 84.6% Legal 6 6 8 9 9 8 2 33.3% Education, Training, Library 7 7 10 13 14 14 7 100.0% Arts, Design, Entertainment, Sports, Media 3 3 4 5 5 5 2 66.7% Healthcare 57 67 89 106 110 113 56 98.2% Protective Service 18 21 27 33 32 30 12 66.7% Food Preparation, Serving-Related 24 29 39 47 50 51 27 112.5% Building, Grounds, Personal Care, Service 33 37 47 56 56 56 23 69.7% Sales, Office, Administrative 155 169 199 219 202 181 26 16.8% Farm, Fishing, Forestry 0 0 0 0 1 1 1 N/A Construction, Extraction 367 427 493 519 454 380 13 3.5% Installation, Maintenance, Repair 81 91 111 123 112 99 18 22.2% Production 77 82 100 111 101 90 13 16.9% Transportation, Material Moving 135 143 171 189 172 152 17 12.6% Notes: Historical data for 2007, projections from 2008 through 2030. Columns may not sum to totals due to rounding. Employment is a jobs count consistent with the Bureau of Economic Analysis definition and measured at the place of work (rather than residence). Source: Analysis generated by the Bureau of Economic and Business Research, University of Utah, using the REMI Model.

The Structure and Economic Impact of Utah’s Coal Industry
B U R E A U O F E C O N O M I C A N D B U S I N E S S R E S E A R C H 91
Table 5.9a Summary Impacts
Emery County: High Scenario (Dollar Amounts are Millions of Current Dollars)
Year Employment Population Earnings Local
Revenue State
Revenue 2007 1,309 1,964 $47.4 $0.09 $3.5 2008 1,400 2,100 $52.8 $0.11 $3.9 2009 1,461 2,192 $56.4 $0.11 $4.2 2010 1,465 2,198 $58.0 $0.12 $4.3 2011 1,467 2,201 $61.6 $0.12 $4.6 2012 1,566 2,349 $69.4 $0.14 $5.2 2013 1,561 2,342 $73.3 $0.15 $5.5 2014 1,656 2,484 $82.3 $0.16 $6.1 2015 1,759 2,639 $92.7 $0.19 $6.9 2016 1,742 2,613 $97.1 $0.19 $7.2 2017 1,823 2,735 $106.6 $0.21 $8.0 2018 1,793 2,690 $110.2 $0.22 $8.2 2019 1,869 2,804 $121.0 $0.24 $9.0 2020 2,249 2,640 $152.7 $0.31 $11.4 2021 2,231 2,779 $159.3 $0.32 $11.9 2022 2,501 2,954 $187.4 $0.37 $14.0 2023 2,479 3,102 $194.9 $0.39 $14.6 2024 2,444 3,227 $201.3 $0.40 $15.0 2025 2,412 3,323 $208.8 $0.42 $15.6 2026 2,380 3,391 $215.7 $0.43 $16.1 2027 2,264 3,422 $214.5 $0.43 $16.0 2028 2,239 3,442 $222.1 $0.44 $16.6 2029 2,220 3,452 $230.1 $0.46 $17.2 2030 2,214 3,457 $240.2 $0.48 $17.9
Notes: Historical data for 2007, projections from 2008 through 2030. Earnings is by place of work, not place of residence. Employment is a jobs count consistent with the Bureau of Economic Analysis definition and also measured at the place of work. State revenue impacts are income taxes, sales taxes, and other taxes. Local revenue impacts are total general sales and use taxes and restaurant taxes. Sources: Economic and demographic impacts generated using the REMI model. Revenue impacts generated by BEBR using methods documented in this report.

The Structure and Economic Impact of Utah’s Coal Industry
92 B U R E A U O F E C O N O M I C A N D B U S I N E S S R E S E A R C H
Table 5.9b Detailed Employment Impacts Emery County: High Scenario
Change Employment by Industry 2007 2010 2015 2020 2025 2030 Level Percent Natural Resources, Mining, Utilities, Construction 885 991 1,165 1,437 1,488 1,310 425 48.0% Forestry, Fishing, Other 0 0 –1 0 0 1 1 N/A Mining 801 841 1,024 1,298 1,347 1,221 420 52.4% Utilities 1 1 1 1 2 3 2 200.0% Construction 83 149 141 138 139 85 2 2.4% Manufacturing 0 0 0 0 0 0 0 N/A Trade 159 175 211 264 287 270 111 69.8% Wholesale Trade 5 4 5 7 8 8 3 60.0% Retail Trade 154 171 206 257 279 262 108 70.1% Transportation, Information, Finance, Accounting 16 12 13 19 22 21 5 31.3% Transportation and Warehousing 0 –1 –1 0 1 3 3 N/A Information 2 1 2 3 4 4 2 100.0% Finance, Insurance 6 4 4 5 5 4 –2 –33.3% Real Estate, Rental, Leasing 8 8 8 11 12 10 2 25.0% Services 183 211 272 376 440 449 266 145.4% Professional and Technical Services 8 8 11 17 21 21 13 162.5% Management of Companies / Enterprises 1 1 1 2 2 2 1 100.0% Administrative and Waste Services 19 20 23 33 37 35 16 84.2% Educational Services 1 0 1 2 3 4 3 300.0% Health Care and Social Assistance 95 113 151 210 249 259 164 172.6% Arts, Entertainment, Recreation 3 4 5 6 8 8 5 166.7% Accommodation and Food Services 23 29 38 51 60 62 39 169.6% Other Services (excl Gov) 33 36 42 55 60 58 25 75.8% Public Administration 67 75 99 152 175 163 96 143.3% State & Local Government 67 75 99 152 175 163 96 143.3% State Government 6 6 8 12 14 13 7 116.7% Local Government 61 69 91 140 161 150 89 145.9% Federal Civilian 0 0 0 0 0 0 0 N/A Federal Military 0 0 0 0 0 0 0 N/A Farm 0 0 0 0 0 0 0 N/A TOTAL EMPLOYMENT 1,310 1,464 1,760 2,248 2,412 2,213 903 68.9% Notes: Historical data for 2007, projections from 2008 through 2030. Columns may not sum to totals due to rounding. Employment is a jobs count consistent with the Bureau of Economic Analysis definition and measured at the place of work (rather than residence). Source: Analysis generated by the Bureau of Economic and Business Research, University of Utah, using the REMI Model.

The Structure and Economic Impact of Utah’s Coal Industry
B U R E A U O F E C O N O M I C A N D B U S I N E S S R E S E A R C H 93
Table 5.9c Detailed Occupational Impacts Emery County: High Scenario
Change Employment by Occupation 2007 2010 2015 2020 2025 2030 Level Percent Management, Business, Financial 106 116 138 177 188 170 64 60.4% Computer, Math, Architect, Engineer 47 51 63 83 89 83 36 76.6% Life, Physical, Social Science 26 28 35 46 49 45 19 73.1% Community, Social Service 13 15 20 28 33 33 20 153.8% Legal 6 6 8 11 12 11 5 83.3% Education, Training, Library 7 7 10 15 18 19 12 171.4% Arts, Design, Entertainment, Sports, Media 3 3 4 6 7 7 4 133.3% Healthcare 57 67 89 124 145 149 92 161.4% Protective Service 18 21 27 41 48 45 27 150.0% Food Preparation, Serving-Related 24 29 39 53 62 64 40 166.7% Building, Grounds, Personal Care, Service 33 37 47 66 76 76 43 130.3% Sales, Office, Administrative 155 169 199 257 274 250 95 61.3% Farm, Fishing, Forestry 0 0 0 1 1 1 1 N/A Construction, Extraction 367 427 493 598 619 534 167 45.5% Installation, Maintenance, Repair 81 91 111 142 151 137 56 69.1% Production 77 82 100 128 134 122 45 58.4% Transportation, Material Moving 135 143 171 218 228 206 71 52.6% Notes: Historical data for 2007, projections from 2008 through 2030. Columns may not sum to totals due to rounding. Employment is a jobs count consistent with the Bureau of Economic Analysis definition and measured at the place of work (rather than residence). Source: Analysis generated by the Bureau of Economic and Business Research, University of Utah, using the REMI Model.
Figure 5.3a Emery County Employment Impacts, 2007–2030
2,214
1,616
1,2201,309
1,000
1,200
1,400
1,600
1,800
2,000
2,200
2,400
2,600
2007
2009
2011
2013
2015
2017
2019
2021
2023
2025
2027
2029
Em
plo
ym
en
t
HighMiddleLow
Source: Bureau of Economic and Business Research, University of Utah analysis using the REMI model.

The Structure and Economic Impact of Utah’s Coal Industry
94 B U R E A U O F E C O N O M I C A N D B U S I N E S S R E S E A R C H
Figure 5.3b Emery County Population Impacts, 2007–2030
3,457
2,720
1,964
2,186
1,500
2,000
2,500
3,000
3,500
4,000
2007
2009
2011
2013
2015
2017
2019
2021
2023
2025
2027
2029
Pers
on
sHighMiddleLow
Source: Bureau of Economic and Business Research, University of Utah analysis using the REMI model.
Figure 5.3c Emery County Earnings Impacts, 2007–2030
$240.2
$175.1
$132.1
$47.4
$0
$50
$100
$150
$200
$250
2007
2009
2011
2013
2015
2017
2019
2021
2023
2025
2027
2029
Mil
lio
ns o
f C
urr
en
t D
oll
ars
HighMiddleLow
Source: Bureau of Economic and Business Research, University of Utah analysis using the REMI model.

The Structure and Economic Impact of Utah’s Coal Industry
B U R E A U O F E C O N O M I C A N D B U S I N E S S R E S E A R C H 95
Figure 5.3d Emery County Local Tax Revenue Impacts, 2007–2030
$0.48
$0.35
$0.09
$0.26
$0.05
$0.10
$0.15
$0.20
$0.25
$0.30
$0.35
$0.40
$0.45
$0.50
2007
2009
2011
2013
2015
2017
2019
2021
2023
2025
2027
2029
Mil
lio
ns o
f C
urr
en
t D
oll
ars
HighMiddleLow
Source: Bureau of Economic and Business Research, University of Utah analysis using the REMI model.
Figure 5.3e Emery County State Tax Revenue Impacts, 2007–2030
$17.9
$3.5
$13.1
$9.9
$2.0
$4.0
$6.0
$8.0
$10.0
$12.0
$14.0
$16.0
$18.0
2007
2009
2011
2013
2015
2017
2019
2021
2023
2025
2027
2029
Mil
lio
ns o
f C
urr
en
t D
oll
ars
HighMiddleLow
Source: Bureau of Economic and Business Research, University of Utah analysis using the REMI model.

The Structure and Economic Impact of Utah’s Coal Industry
96 B U R E A U O F E C O N O M I C A N D B U S I N E S S R E S E A R C H
5.5 Sevier County Scenario Impacts
Impact results for each of the three scenarios for Sevier County are also shown in nine tables. The Low Scenario is shown in Tables 5.10a through 5.10c, the Middle Scenario in Tables 5.11a through 5.11c, and the High Scenario in Tables 5.12a through 5.12c. Figures 5.4a through 5.4e show all three scenarios for each of the major impact categories for the county. Coal production drives the impacts measured here. All three scenarios are nearly identical for Sevier County, with coal production declining from 2007 to 2030. Employment impacts rise from 751 in 2007 to 1,006 in 2009, then decline to reach roughly 552 in 2030. Population im-pacts follow the same general path, increasing from 1,127 in 2007 to 1,509 in 2009, then declin-ing to about 1,208 in 2030. Nominal earnings, local tax revenue, and state tax revenue impacts are all higher in 2030 than in 2007 for all three scenarios, following an uneven path through time. Nominal earnings impacts increase from $18.2 million in 2007 to approximately $43.0 mil-lion in 2030. Nominal local government revenue impacts increase from $0.1 million in 2007 to $0.2 million in 2030. Nominal state government revenue impacts increase from $1.4 million in 2007 to about $3.3 million in 2030.
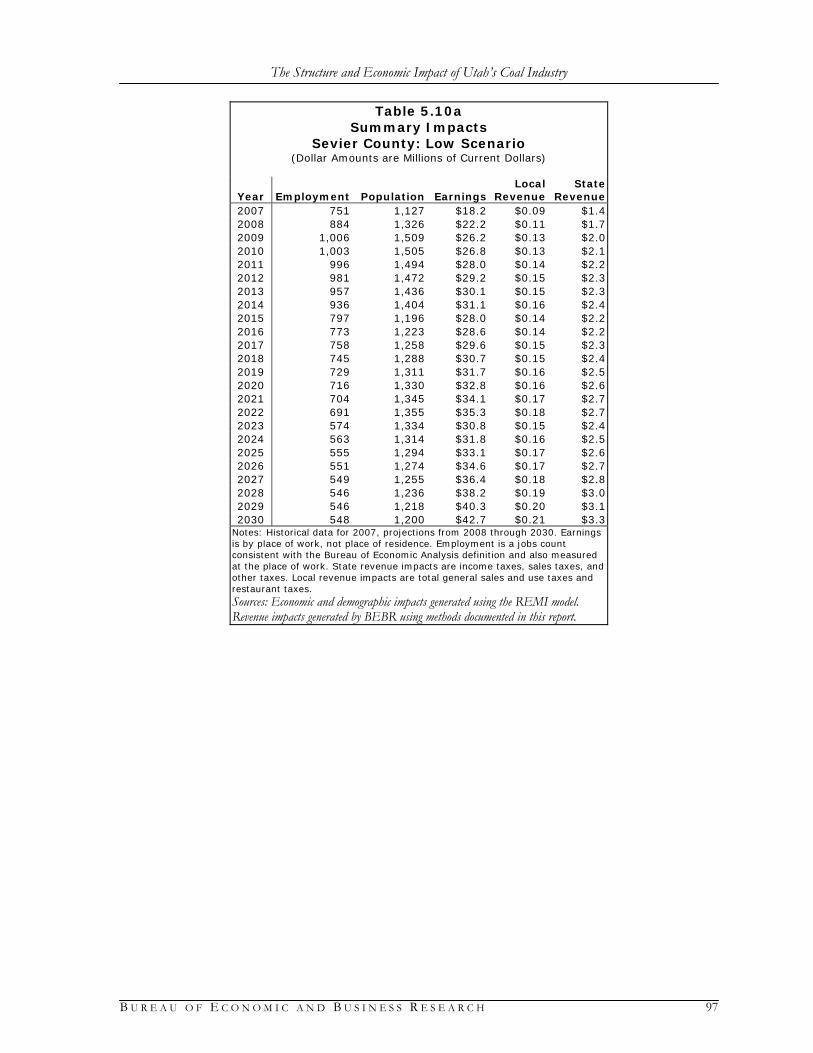
The Structure and Economic Impact of Utah’s Coal Industry
B U R E A U O F E C O N O M I C A N D B U S I N E S S R E S E A R C H 97
Table 5.10a Summary Impacts
Sevier County: Low Scenario (Dollar Amounts are Millions of Current Dollars)
Year Employment Population Earnings Local
Revenue State
Revenue 2007 751 1,127 $18.2 $0.09 $1.4 2008 884 1,326 $22.2 $0.11 $1.7 2009 1,006 1,509 $26.2 $0.13 $2.0 2010 1,003 1,505 $26.8 $0.13 $2.1 2011 996 1,494 $28.0 $0.14 $2.2 2012 981 1,472 $29.2 $0.15 $2.3 2013 957 1,436 $30.1 $0.15 $2.3 2014 936 1,404 $31.1 $0.16 $2.4 2015 797 1,196 $28.0 $0.14 $2.2 2016 773 1,223 $28.6 $0.14 $2.2 2017 758 1,258 $29.6 $0.15 $2.3 2018 745 1,288 $30.7 $0.15 $2.4 2019 729 1,311 $31.7 $0.16 $2.5 2020 716 1,330 $32.8 $0.16 $2.6 2021 704 1,345 $34.1 $0.17 $2.7 2022 691 1,355 $35.3 $0.18 $2.7 2023 574 1,334 $30.8 $0.15 $2.4 2024 563 1,314 $31.8 $0.16 $2.5 2025 555 1,294 $33.1 $0.17 $2.6 2026 551 1,274 $34.6 $0.17 $2.7 2027 549 1,255 $36.4 $0.18 $2.8 2028 546 1,236 $38.2 $0.19 $3.0 2029 546 1,218 $40.3 $0.20 $3.1 2030 548 1,200 $42.7 $0.21 $3.3
Notes: Historical data for 2007, projections from 2008 through 2030. Earnings is by place of work, not place of residence. Employment is a jobs count consistent with the Bureau of Economic Analysis definition and also measured at the place of work. State revenue impacts are income taxes, sales taxes, and other taxes. Local revenue impacts are total general sales and use taxes and restaurant taxes. Sources: Economic and demographic impacts generated using the REMI model. Revenue impacts generated by BEBR using methods documented in this report.

The Structure and Economic Impact of Utah’s Coal Industry
98 B U R E A U O F E C O N O M I C A N D B U S I N E S S R E S E A R C H
Table 5.10b Detailed Employment Impacts Sevier County: Low Scenario
Change Employment by Industry 2007 2010 2015 2020 2025 2030 Level Percent Natural Resources, Mining, Utilities, Construction 408 554 425 364 263 259 –149 –36.5% Forestry, Fishing, Other 0 0 0 0 0 0 0 N/A Mining 360 459 360 328 247 244 –116 –32.2% Utilities 4 5 4 3 3 3 –1 –25.0% Construction 44 90 61 33 13 12 –32 –72.7% Manufacturing 1 0 –1 –1 0 0 –1 –100.0% Trade 65 83 71 67 56 55 –10 –15.4% Wholesale Trade 5 5 4 3 2 2 –3 –60.0% Retail Trade 60 78 67 64 54 53 –7 –11.7% Transportation, Information, Finance, Accounting 38 46 33 29 22 21 –17 –44.7% Transportation and Warehousing 2 1 –1 0 1 2 0 0.0% Information 1 1 1 1 1 1 0 0.0% Finance, Insurance 8 9 5 4 3 3 –5 –62.5% Real Estate, Rental, Leasing 27 35 28 24 17 15 –12 –44.4% Services 106 149 130 133 119 124 18 17.0% Professional and Technical Services 19 26 22 21 17 17 –2 –10.5% Management of Companies / Enterprises 3 4 2 2 2 1 –2 –66.7% Administrative and Waste Services 15 19 15 13 10 10 –5 –33.3% Educational Services 0 1 0 1 1 1 1 N/A Health Care and Social Assistance 27 37 33 36 34 39 12 44.4% Arts, Entertainment, Recreation 2 3 3 3 3 3 1 50.0% Accommodation and Food Services 20 32 33 35 33 33 13 65.0% Other Services (excl Gov) 20 27 22 22 19 20 0 0.0% Public Administration 132 173 138 123 93 88 –44 –33.3% State & Local Government 132 173 138 123 93 88 –44 –33.3% State Government 34 44 34 30 22 21 –13 –38.2% Local Government 98 129 104 93 71 67 –31 –31.6% Federal Civilian 0 0 0 0 0 0 0 N/A Federal Military 0 0 0 0 0 0 0 N/A Farm 0 0 0 0 0 0 0 N/A TOTAL EMPLOYMENT 750 1,005 796 715 553 547 –203 –27.1% Notes: Historical data for 2007, projections from 2008 through 2030. Columns may not sum to totals due to rounding. Employment is a jobs count consistent with the Bureau of Economic Analysis definition and measured at the place of work (rather than residence). Source: Analysis generated by the Bureau of Economic and Business Research, University of Utah, using the REMI Model.

The Structure and Economic Impact of Utah’s Coal Industry
B U R E A U O F E C O N O M I C A N D B U S I N E S S R E S E A R C H 99
Table 5.10c Detailed Occupational Impacts Sevier County: Low Scenario
Change Employment by Occupation 2007 2010 2015 2020 2025 2030 Level Percent Management, Business, Financial 70 92 72 63 48 47 –23 –32.9% Computer, Math, Architect, Engineer 31 40 33 30 23 23 –8 –25.8% Life, Physical, Social Science 15 19 15 14 11 11 –4 –26.7% Community, Social Service 12 15 13 12 10 10 –2 –16.7% Legal 7 9 7 6 5 5 –2 –28.6% Education, Training, Library 5 7 6 6 5 5 0 0.0% Arts, Design, Entertainment, Sports, Media 3 4 3 3 3 3 0 0.0% Healthcare 24 32 27 27 25 26 2 8.3% Protective Service 32 42 35 31 24 23 –9 –28.1% Food Preparation, Serving-Related 20 31 31 32 30 30 10 50.0% Building, Grounds, Personal Care, Service 26 35 29 28 23 23 –3 –11.5% Sales, Office, Administrative 115 150 115 101 77 75 –40 –34.8% Farm, Fishing, Forestry 1 1 0 0 0 0 –1 –100.0% Construction, Extraction 176 247 188 156 109 107 –69 –39.2% Installation, Maintenance, Repair 46 63 50 44 33 33 –13 –28.3% Production 39 49 38 35 27 27 –12 –30.8% Transportation, Material Moving 70 90 69 62 47 47 –23 –32.9% Notes: Historical data for 2007, projections from 2008 through 2030. Columns may not sum to totals due to rounding. Employment is a jobs count consistent with the Bureau of Economic Analysis definition and measured at the place of work (rather than residence). Source: Analysis generated by the Bureau of Economic and Business Research, University of Utah, using the REMI Model.

The Structure and Economic Impact of Utah’s Coal Industry
100 B U R E A U O F E C O N O M I C A N D B U S I N E S S R E S E A R C H
Table 5.11a Summary Impacts
Sevier County: Middle Scenario (Dollar Amounts are Millions of Current Dollars)
Year Employment Population Earnings Local
Revenue State
Revenue 2007 751 1,127 $18.2 $0.09 $1.4 2008 884 1,326 $22.2 $0.11 $1.7 2009 1,006 1,509 $26.2 $0.13 $2.0 2010 1,003 1,505 $26.8 $0.13 $2.1 2011 996 1,494 $28.0 $0.14 $2.2 2012 981 1,472 $29.2 $0.15 $2.3 2013 957 1,436 $30.1 $0.15 $2.3 2014 936 1,404 $31.1 $0.16 $2.4 2015 797 1,196 $28.0 $0.14 $2.2 2016 773 1,223 $28.6 $0.14 $2.2 2017 759 1,258 $29.7 $0.15 $2.3 2018 747 1,289 $30.8 $0.15 $2.4 2019 732 1,313 $31.8 $0.16 $2.5 2020 719 1,332 $33.1 $0.17 $2.6 2021 708 1,348 $34.3 $0.17 $2.7 2022 695 1,359 $35.4 $0.18 $2.8 2023 579 1,338 $31.0 $0.16 $2.4 2024 567 1,319 $32.0 $0.16 $2.5 2025 559 1,300 $33.4 $0.17 $2.6 2026 555 1,280 $34.8 $0.17 $2.7 2027 553 1,262 $36.7 $0.18 $2.9 2028 550 1,243 $38.5 $0.19 $3.0 2029 550 1,225 $40.6 $0.20 $3.2 2030 552 1,208 $43.0 $0.21 $3.3
Notes: Historical data for 2007, projections from 2008 through 2030. Earnings is by place of work, not place of residence. Employment is a jobs count consistent with the Bureau of Economic Analysis definition and also measured at the place of work. State revenue impacts are income taxes, sales taxes, and other taxes. Local revenue impacts are total general sales and use taxes and restaurant taxes. Sources: Economic and demographic impacts generated using the REMI model. Revenue impacts generated by BEBR using methods documented in this report.

The Structure and Economic Impact of Utah’s Coal Industry
B U R E A U O F E C O N O M I C A N D B U S I N E S S R E S E A R C H 101
Table 5.11b Detailed Employment Impacts Sevier County: Middle Scenario
Change Employment by Industry 2007 2010 2015 2020 2025 2030 Level Percent Natural Resources, Mining, Utilities, Construction 408 554 425 364 264 259 –149 –36.5% Forestry, Fishing, Other 0 0 0 0 0 0 0 N/A Mining 360 459 360 328 247 244 –116 –32.2% Utilities 4 5 4 3 3 3 –1 –25.0% Construction 44 90 61 33 14 12 –32 –72.7% Manufacturing 1 0 –1 0 0 0 –1 –100.0% Trade 65 83 72 68 58 56 –9 –13.8% Wholesale Trade 5 5 4 3 3 2 –3 –60.0% Retail Trade 60 78 68 65 55 54 –6 –10.0% Transportation, Information, Finance, Accounting 38 46 33 30 24 23 –15 –39.5% Transportation and Warehousing 2 1 –1 0 1 3 1 50.0% Information 1 1 1 1 1 1 0 0.0% Finance, Insurance 8 9 5 5 4 4 –4 –50.0% Real Estate, Rental, Leasing 27 35 28 24 18 15 –12 –44.4% Services 106 149 131 134 123 125 19 17.9% Professional and Technical Services 19 26 22 21 18 18 –1 –5.3% Management of Companies / Enterprises 3 4 3 2 2 1 –2 –66.7% Administrative and Waste Services 15 19 15 13 11 10 –5 –33.3% Educational Services 0 1 0 1 1 1 1 N/A Health Care and Social Assistance 27 37 33 36 35 39 12 44.4% Arts, Entertainment, Recreation 2 3 3 3 3 3 1 50.0% Accommodation and Food Services 20 32 33 36 34 33 13 65.0% Other Services (excl Gov) 20 27 22 22 19 20 0 0.0% Public Administration 132 173 138 123 94 88 –44 –33.3% State & Local Government 132 173 138 123 94 88 –44 –33.3% State Government 34 44 34 30 22 21 –13 –38.2% Local Government 98 129 104 93 72 67 –31 –31.6% Federal Civilian 0 0 0 0 0 0 0 N/A Federal Military 0 0 0 0 0 0 0 N/A Farm 0 0 0 0 0 0 0 N/A TOTAL EMPLOYMENT 750 1,005 798 719 563 551 –199 –26.5% Notes: Historical data for 2007, projections from 2008 through 2030. Columns may not sum to totals due to rounding. Employment is a jobs count consistent with the Bureau of Economic Analysis definition and measured at the place of work (rather than residence). Source: Analysis generated by the Bureau of Economic and Business Research, University of Utah, using the REMI Model.

The Structure and Economic Impact of Utah’s Coal Industry
102 B U R E A U O F E C O N O M I C A N D B U S I N E S S R E S E A R C H
Table 5.11c Detailed Occupational Impacts Sevier County: Middle Scenario
Change Employment by Occupation 2007 2010 2015 2020 2025 2030 Level Percent Management, Business, Financial 70 92 72 64 48 47 –23 –32.9% Computer, Math, Architect, Engineer 31 40 33 30 23 23 –8 –25.8% Life, Physical, Social Science 15 19 15 14 11 11 –4 –26.7% Community, Social Service 12 15 13 12 10 10 –2 –16.7% Legal 7 9 7 6 5 5 –2 –28.6% Education, Training, Library 5 7 6 6 5 5 0 0.0% Arts, Design, Entertainment, Sports, Media 3 4 3 3 3 3 0 0.0% Healthcare 24 32 27 28 25 27 3 12.5% Protective Service 32 42 35 31 24 23 –9 –28.1% Food Preparation, Serving-Related 20 31 31 33 30 30 10 50.0% Building, Grounds, Personal Care, Service 26 35 29 28 23 23 –3 –11.5% Sales, Office, Administrative 115 150 115 102 78 75 –40 –34.8% Farm, Fishing, Forestry 1 1 0 0 0 0 –1 –100.0% Construction, Extraction 176 247 188 156 110 107 –69 –39.2% Installation, Maintenance, Repair 46 63 50 44 34 33 –13 –28.3% Production 39 49 38 35 27 27 –12 –30.8% Transportation, Material Moving 70 90 69 62 48 47 –23 –32.9% Notes: Historical data for 2007, projections from 2008 through 2030. Columns may not sum to totals due to rounding. Employment is a jobs count consistent with the Bureau of Economic Analysis definition and measured at the place of work (rather than residence). Source: Analysis generated by the Bureau of Economic and Business Research, University of Utah, using the REMI Model.

The Structure and Economic Impact of Utah’s Coal Industry
B U R E A U O F E C O N O M I C A N D B U S I N E S S R E S E A R C H 103
Table 5.12a Summary Impacts
Sevier County: High Scenario (Dollar Amounts are Millions of Current Dollars)
Year Employment Population Earnings Local
Revenue State
Revenue 2007 751 1,127 $18.2 $0.09 $1.4 2008 884 1,326 $22.2 $0.11 $1.7 2009 1,006 1,509 $26.2 $0.13 $2.0 2010 1,003 1,505 $26.8 $0.13 $2.1 2011 996 1,494 $28.0 $0.14 $2.2 2012 981 1,472 $29.2 $0.15 $2.3 2013 957 1,436 $30.1 $0.15 $2.3 2014 936 1,404 $31.1 $0.16 $2.4 2015 797 1,196 $28.0 $0.14 $2.2 2016 773 1,223 $28.6 $0.14 $2.2 2017 759 1,258 $29.7 $0.15 $2.3 2018 747 1,289 $30.8 $0.15 $2.4 2019 732 1,313 $31.8 $0.16 $2.5 2020 722 1,333 $33.2 $0.17 $2.6 2021 710 1,349 $34.4 $0.17 $2.7 2022 700 1,361 $35.8 $0.18 $2.8 2023 585 1,342 $31.4 $0.16 $2.4 2024 573 1,324 $32.4 $0.16 $2.5 2025 566 1,306 $33.7 $0.17 $2.6 2026 561 1,288 $35.3 $0.18 $2.7 2027 559 1,270 $37.1 $0.19 $2.9 2028 556 1,252 $38.8 $0.19 $3.0 2029 556 1,235 $41.0 $0.21 $3.2 2030 558 1,218 $43.4 $0.22 $3.4
Notes: Historical data for 2007, projections from 2008 through 2030. Earnings is by place of work, not place of residence. Employment is a jobs count consistent with the Bureau of Economic Analysis definition and also measured at the place of work. State revenue impacts are income taxes, sales taxes, and other taxes. Local revenue impacts are total general sales and use taxes and restaurant taxes. Sources: Economic and demographic impacts generated using the REMI model. Revenue impacts generated by BEBR using methods documented in this report.

The Structure and Economic Impact of Utah’s Coal Industry
104 B U R E A U O F E C O N O M I C A N D B U S I N E S S R E S E A R C H
Table 5.12b Detailed Employment Impacts Sevier County: High Scenario
Change Employment by Industry 2007 2010 2015 2020 2025 2030 Level Percent Natural Resources, Mining, Utilities, Construction 408 554 425 365 264 260 –148 –36.3% Forestry, Fishing, Other 0 0 0 0 0 0 0 N/A Mining 360 459 360 328 247 244 –116 –32.2% Utilities 4 5 4 3 3 3 –1 –25.0% Construction 44 90 61 34 14 13 –31 –70.5% Manufacturing 1 0 –1 0 0 1 0 0.0% Trade 65 83 72 69 60 58 –7 –10.8% Wholesale Trade 5 5 4 3 3 2 –3 –60.0% Retail Trade 60 78 68 66 57 56 –4 –6.7% Transportation, Information, Finance, Accounting 38 46 33 30 25 24 –14 –36.8% Transportation and Warehousing 2 1 –1 0 2 3 1 50.0% Information 1 1 1 1 1 1 0 0.0% Finance, Insurance 8 9 5 5 4 4 –4 –50.0% Real Estate, Rental, Leasing 27 35 28 24 18 16 –11 –40.7% Services 106 149 131 135 123 126 20 18.9% Professional and Technical Services 19 26 22 21 18 18 –1 –5.3% Management of Companies / Enterprises 3 4 3 2 2 1 –2 –66.7% Administrative and Waste Services 15 19 15 14 11 10 –5 –33.3% Educational Services 0 1 0 1 1 1 1 N/A Health Care and Social Assistance 27 37 33 36 35 39 12 44.4% Arts, Entertainment, Recreation 2 3 3 3 3 3 1 50.0% Accommodation and Food Services 20 32 33 36 34 34 14 70.0% Other Services (excl Gov) 20 27 22 22 19 20 0 0.0% Public Administration 132 173 138 123 95 89 –43 –32.6% State & Local Government 132 173 138 123 95 89 –43 –32.6% State Government 34 44 34 30 23 21 –13 –38.2% Local Government 98 129 104 93 72 68 –30 –30.6% Federal Civilian 0 0 0 0 0 0 0 N/A Federal Military 0 0 0 0 0 0 0 N/A Farm 0 0 0 0 0 0 0 N/A TOTAL EMPLOYMENT 750 1,005 798 722 567 558 –192 –25.6% Notes: Historical data for 2007, projections from 2008 through 2030. Columns may not sum to totals due to rounding. Employment is a jobs count consistent with the Bureau of Economic Analysis definition and measured at the place of work (rather than residence). Source: Analysis generated by the Bureau of Economic and Business Research, University of Utah, using the REMI Model.

The Structure and Economic Impact of Utah’s Coal Industry
B U R E A U O F E C O N O M I C A N D B U S I N E S S R E S E A R C H 105
Table 5.12c Detailed Occupational Impacts Sevier County: High Scenario
Change Employment by Occupation 2007 2010 2015 2020 2025 2030 Level Percent Management, Business, Financial 70 92 72 64 49 48 –22 –31.4% Computer, Math, Architect, Engineer 31 40 33 30 24 23 –8 –25.8% Life, Physical, Social Science 15 19 15 14 11 11 –4 –26.7% Community, Social Service 12 15 13 12 10 10 –2 –16.7% Legal 7 9 7 6 5 5 –2 –28.6% Education, Training, Library 5 7 6 6 5 5 0 0.0% Arts, Design, Entertainment, Sports, Media 3 4 3 3 3 3 0 0.0% Healthcare 24 32 27 28 25 27 3 12.5% Protective Service 32 42 35 31 24 23 –9 –28.1% Food Preparation, Serving-Related 20 31 31 33 31 31 11 55.0% Building, Grounds, Personal Care, Service 26 35 29 28 24 24 –2 –7.7% Sales, Office, Administrative 115 150 115 102 79 76 –39 –33.9% Farm, Fishing, Forestry 1 1 0 0 0 0 –1 –100.0% Construction, Extraction 176 247 188 156 111 108 –68 –38.6% Installation, Maintenance, Repair 46 63 50 45 34 33 –13 –28.3% Production 39 49 38 35 27 27 –12 –30.8% Transportation, Material Moving 70 90 69 62 48 47 –23 –32.9% Notes: Historical data for 2007, projections from 2008 through 2030. Columns may not sum to totals due to rounding. Employment is a jobs count consistent with the Bureau of Economic Analysis definition and measured at the place of work (rather than residence). Source: Analysis generated by the Bureau of Economic and Business Research, University of Utah, using the REMI Model.
Figure 5.4a Sevier County Employment Impacts, 2007–2030
558552548
751
500
600
700
800
900
1,000
1,100
2007
2009
2011
2013
2015
2017
2019
2021
2023
2025
2027
2029
Em
plo
ym
en
t
HighMiddleLow
Source: Bureau of Economic and Business Research, University of Utah analysis using the REMI model.

The Structure and Economic Impact of Utah’s Coal Industry
106 B U R E A U O F E C O N O M I C A N D B U S I N E S S R E S E A R C H
Figure 5.4b Sevier County Population Impacts, 2007–2030
1,2181,208
1,127
1,200
1,100
1,150
1,200
1,250
1,300
1,350
1,400
1,450
1,500
1,550
2007
2009
2011
2013
2015
2017
2019
2021
2023
2025
2027
2029
Pers
on
s
HighMiddleLow
Source: Bureau of Economic and Business Research, University of Utah analysis using the REMI model.
Figure 5.4c Sevier County Earnings Impacts, 2007–2030
$43.4$43.0$42.7
$18.2$18
$20
$22
$24$26
$28
$30
$32
$34
$36$38
$40
$42
$44
2007
2009
2011
2013
2015
2017
2019
2021
2023
2025
2027
2029
Mil
lio
ns o
f C
urr
en
t D
oll
ars
HighMiddleLow
Source: Bureau of Economic and Business Research, University of Utah analysis using the REMI model.

The Structure and Economic Impact of Utah’s Coal Industry
B U R E A U O F E C O N O M I C A N D B U S I N E S S R E S E A R C H 107
Figure 5.4d Sevier County Local Tax Revenue Impacts, 2007–2030
$0.22$0.21
$0.09
$0.21
$0.08
$0.10
$0.12
$0.14
$0.16
$0.18
$0.20
$0.22
2007
2009
2011
2013
2015
2017
2019
2021
2023
2025
2027
2029
Mil
lio
ns o
f C
urr
en
t D
oll
ars
HighMiddleLow
Source: Bureau of Economic and Business Research, University of Utah analysis using the REMI model.
Figure 5.4e Sevier County State Tax Revenue Impacts, 2007–2030
$3.4
$1.4
$3.3$3.3
$1.2
$1.4
$1.6
$1.8
$2.0
$2.2
$2.4
$2.6
$2.8
$3.0
$3.2
$3.4
2007
2009
2011
2013
2015
2017
2019
2021
2023
2025
2027
2029
Mil
lio
ns o
f C
urr
en
t D
oll
ars
HighMiddleLow
Source: Bureau of Economic and Business Research, University of Utah analysis using the REMI model.

The Structure and Economic Impact of Utah’s Coal Industry
108 B U R E A U O F E C O N O M I C A N D B U S I N E S S R E S E A R C H
5.6 Coal Counties Scenario Impacts
Impact results for each of the three scenarios for the coal counties as a whole (Carbon, Emery, and Sevier combined) are also shown in nine tables. The Low Scenario is shown in Tables 5.13a through 5.13c, the Middle Scenario in Tables 5.14a through 5.14c, and the High Scenario in Ta-bles 5.15a through 5.15c. Figures 5.5a through 5.5e show all three scenarios for each of the ma-jor impact categories for the coal counties. The combined coal county employment impacts rise from 4,017 in 2007 to 4,673 in 2014. Em-ployment impacts then decline and reach 2,469 in the Low Scenario and 3,145 in the Middle Sce-nario in 2030. In the High Scenario, combined employment impacts decline through 2018, then rise to reach 4,624 in 2022, then fall again to 4,150 in 2030. In the Low Scenario, the combined coal county population impacts rise from 6,026 in 2007 to reach 7,344 in 2017, then decline to 5,730 in 2030. In the Middle Scenario, population impacts rise from 6,026 in 2007 to reach 7,632 in 2019, then decline to 6,895 in 2030. Although rates of increase fluctuate, the High Scenario population impacts for the coal counties increase from 6,026 to reach 8,433 in 2030. Nominal earnings, local tax revenue, and state tax revenue impacts are all higher in 2030 than 2007 for all three scenarios for the combined coal counties. From 2007 to 2030, nominal earn-ings impacts increase from $128.2 million to $240.3 million in the Low Scenario, $310.0 million in the Middle Scenario, and $414.3 million in the High Scenario. Over the same period, nominal local government revenue impacts increase from $0.5 million to $0.8 million in the Low Sce-nario, $1.0 million in the Middle Scenario, and $1.4 million in the High Scenario. Nominal state government revenue impacts increase from $9.8 million in 2007 to 2030 levels of $18.2 million in the Low Scenario, $23.5 million in the Middle Scenario, and $31.3 million in the High Scenario.

The Structure and Economic Impact of Utah’s Coal Industry
B U R E A U O F E C O N O M I C A N D B U S I N E S S R E S E A R C H 109
Table 5.13a Summary Impacts
Coal Counties: Low Scenario (Dollar Amounts are Millions of Current Dollars)
Year Employment Population Earnings Local
Revenue State
Revenue 2007 4,017 6,026 $128.2 $0.50 $9.8 2008 4,390 6,585 $145.0 $0.57 $11.0 2009 4,604 6,906 $155.7 $0.61 $11.8 2010 4,601 6,902 $159.9 $0.63 $12.2 2011 4,586 6,879 $168.6 $0.66 $12.8 2012 4,666 6,999 $181.8 $0.70 $13.8 2013 4,610 6,915 $190.3 $0.73 $14.5 2014 4,673 7,010 $204.9 $0.78 $15.6 2015 4,405 7,082 $206.7 $0.76 $15.7 2016 4,102 7,160 $203.2 $0.73 $15.4 2017 3,936 7,344 $205.5 $0.71 $15.6 2018 3,529 7,130 $192.9 $0.66 $14.6 2019 3,462 7,073 $199.2 $0.68 $15.1 2020 3,294 6,992 $198.8 $0.66 $15.1 2021 3,023 6,923 $191.0 $0.64 $14.5 2022 2,967 6,851 $196.7 $0.66 $14.9 2023 2,816 6,747 $197.5 $0.65 $14.9 2024 2,772 6,642 $203.9 $0.67 $15.4 2025 2,735 6,526 $211.5 $0.70 $16.0 2026 2,701 6,397 $219.0 $0.72 $16.6 2027 2,564 6,231 $216.9 $0.73 $16.4 2028 2,526 6,065 $223.9 $0.75 $17.0 2029 2,493 5,896 $231.3 $0.78 $17.5 2030 2,469 5,730 $240.3 $0.81 $18.2
Notes: Historical data for 2007, projections from 2008 through 2030. Earnings is by place of work, not place of residence. Employment is a jobs count consistent with the Bureau of Economic Analysis definition and also measured at the place of work. State revenue impacts are income taxes, sales taxes, and other taxes. Local revenue impacts are total general sales and use taxes and restaurant taxes. Sources: Economic and demographic impacts generated using the REMI model. Revenue impacts generated by BEBR using methods documented in this report.

The Structure and Economic Impact of Utah’s Coal Industry
110 B U R E A U O F E C O N O M I C A N D B U S I N E S S R E S E A R C H
Table 5.13b Detailed Employment Impacts Coal Counties: Low Scenario
Change Employment by Industry 2007 2010 2015 2020 2025 2030 Level Percent Natural Resources, Mining, Utilities, Construction 2,161 2,475 2,360 1,754 1,358 1,163 –998 –46.2% Forestry, Fishing, Other 1 0 –2 0 2 4 3 300.0% Mining 1,945 2,092 2,052 1,604 1,289 1,115 –830 –42.7% Utilities 9 10 8 5 5 7 –2 –22.2% Construction 206 373 302 145 62 37 –169 –82.0% Manufacturing 2 –1 –3 –1 2 3 1 50.0% Trade 517 574 580 457 397 355 –162 –31.3% Wholesale Trade 36 32 27 19 18 16 –20 –55.6% Retail Trade 481 542 553 438 379 339 –142 –29.5% Transportation, Information, Finance, Accounting 137 140 106 64 60 58 –79 –57.7% Transportation and Warehousing 4 1 –3 0 6 9 5 125.0% Information 7 6 7 6 7 7 0 0.0% Finance, Insurance 44 38 25 13 12 11 –33 –75.0% Real Estate, Rental, Leasing 82 95 77 45 35 31 –51 –62.2% Services 720 853 878 721 690 679 –41 –5.7% Professional and Technical Services 70 81 69 45 39 39 –31 –44.3% Management of Companies / Enterprises 18 17 10 4 4 3 –15 –83.3% Administrative and Waste Services 90 99 86 55 48 46 –44 –48.9% Educational Services 4 4 5 8 10 12 8 200.0% Health Care and Social Assistance 273 320 352 305 303 309 36 13.2% Arts, Entertainment, Recreation 21 27 30 25 25 23 2 9.5% Accommodation and Food Services 108 151 177 163 154 144 36 33.3% Other Services (excl Gov) 136 154 149 116 107 103 –33 –24.3% Public Administration 480 561 485 300 227 207 –273 –56.9% State & Local Government 480 561 485 300 227 207 –273 –56.9% State Government 157 176 137 65 45 43 –114 –72.6% Local Government 323 385 348 235 182 164 –159 –49.2% Federal Civilian 0 0 0 0 0 0 0 NA Federal Military 0 0 0 0 0 0 0 NA Farm 0 0 0 0 0 0 0 NA TOTAL EMPLOYMENT 4,017 4,602 4,406 3,295 2,734 2,465 –1,552 –38.6% Notes: Historical data for 2007, projections from 2008 through 2030. Columns may not sum to totals due to rounding. Employment is a jobs count consistent with the Bureau of Economic Analysis definition and measured at the place of work (rather than residence). Source: Analysis generated by the Bureau of Economic and Business Research, University of Utah, using the REMI Model.
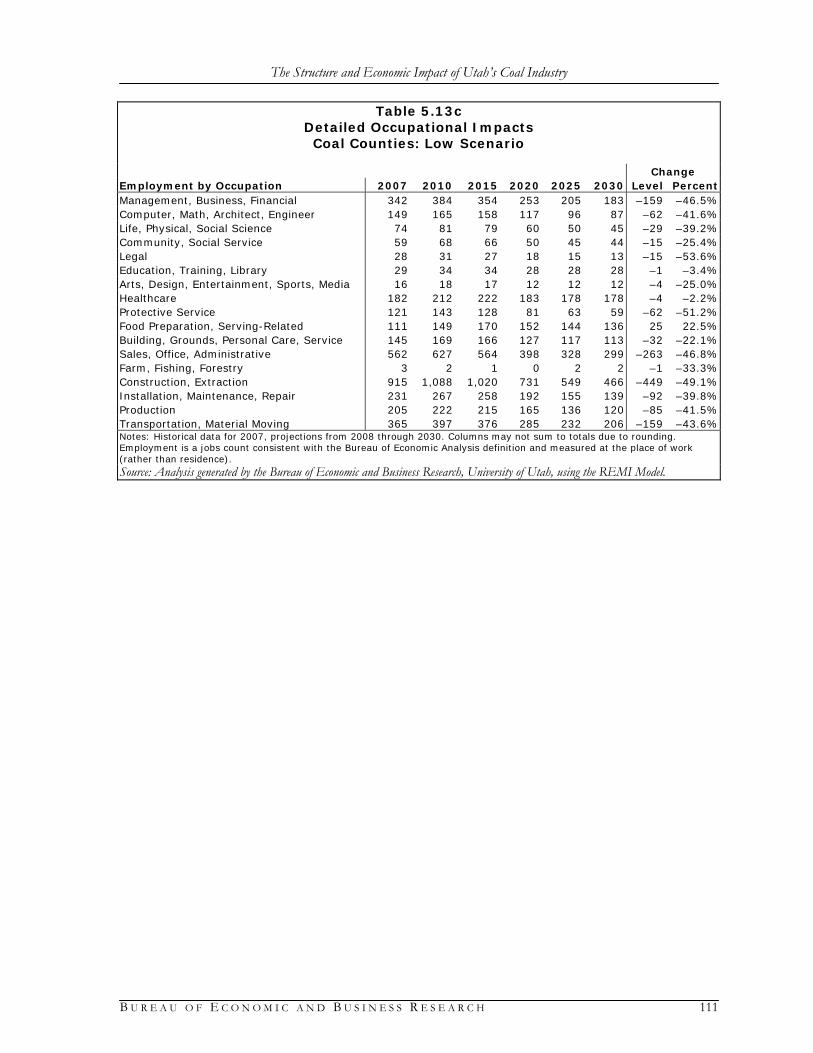
The Structure and Economic Impact of Utah’s Coal Industry
B U R E A U O F E C O N O M I C A N D B U S I N E S S R E S E A R C H 111
Table 5.13c Detailed Occupational Impacts Coal Counties: Low Scenario
Change Employment by Occupation 2007 2010 2015 2020 2025 2030 Level Percent Management, Business, Financial 342 384 354 253 205 183 –159 –46.5% Computer, Math, Architect, Engineer 149 165 158 117 96 87 –62 –41.6% Life, Physical, Social Science 74 81 79 60 50 45 –29 –39.2% Community, Social Service 59 68 66 50 45 44 –15 –25.4% Legal 28 31 27 18 15 13 –15 –53.6% Education, Training, Library 29 34 34 28 28 28 –1 –3.4% Arts, Design, Entertainment, Sports, Media 16 18 17 12 12 12 –4 –25.0% Healthcare 182 212 222 183 178 178 –4 –2.2% Protective Service 121 143 128 81 63 59 –62 –51.2% Food Preparation, Serving-Related 111 149 170 152 144 136 25 22.5% Building, Grounds, Personal Care, Service 145 169 166 127 117 113 –32 –22.1% Sales, Office, Administrative 562 627 564 398 328 299 –263 –46.8% Farm, Fishing, Forestry 3 2 1 0 2 2 –1 –33.3% Construction, Extraction 915 1,088 1,020 731 549 466 –449 –49.1% Installation, Maintenance, Repair 231 267 258 192 155 139 –92 –39.8% Production 205 222 215 165 136 120 –85 –41.5% Transportation, Material Moving 365 397 376 285 232 206 –159 –43.6% Notes: Historical data for 2007, projections from 2008 through 2030. Columns may not sum to totals due to rounding. Employment is a jobs count consistent with the Bureau of Economic Analysis definition and measured at the place of work (rather than residence). Source: Analysis generated by the Bureau of Economic and Business Research, University of Utah, using the REMI Model.

The Structure and Economic Impact of Utah’s Coal Industry
112 B U R E A U O F E C O N O M I C A N D B U S I N E S S R E S E A R C H
Table 5.14a Summary Impacts
Coal Counties: Middle Scenario (Dollar Amounts are Millions of Current Dollars)
Year Employment Population Earnings Local
Revenue State
Revenue 2007 4,017 6,026 $128.2 $0.50 $9.8 2008 4,390 6,585 $145.0 $0.57 $11.0 2009 4,604 6,906 $155.7 $0.61 $11.8 2010 4,601 6,902 $159.9 $0.63 $12.2 2011 4,586 6,879 $168.6 $0.66 $12.8 2012 4,666 6,999 $181.8 $0.70 $13.8 2013 4,610 6,915 $190.3 $0.73 $14.5 2014 4,673 7,010 $204.9 $0.78 $15.6 2015 4,526 7,116 $212.3 $0.78 $16.1 2016 4,344 7,254 $215.3 $0.79 $16.3 2017 4,181 7,484 $218.4 $0.77 $16.6 2018 3,895 7,477 $213.6 $0.74 $16.2 2019 3,948 7,632 $228.5 $0.78 $17.3 2020 3,899 7,419 $237.7 $0.79 $18.0 2021 3,744 7,485 $239.7 $0.79 $18.1 2022 3,685 7,526 $247.8 $0.82 $18.8 2023 3,525 7,517 $250.4 $0.82 $18.9 2024 3,468 7,496 $258.5 $0.84 $19.6 2025 3,423 7,450 $268.1 $0.87 $20.3 2026 3,382 7,381 $277.5 $0.91 $21.0 2027 3,239 7,269 $277.7 $0.92 $21.0 2028 3,199 7,149 $287.4 $0.95 $21.7 2029 3,167 7,022 $297.8 $0.98 $22.5 2030 3,145 6,895 $310.0 $1.02 $23.5
Notes: Historical data for 2007, projections from 2008 through 2030. Earnings is by place of work, not place of residence. Employment is a jobs count consistent with the Bureau of Economic Analysis definition and also measured at the place of work. State revenue impacts are income taxes, sales taxes, and other taxes. Local revenue impacts are total general sales and use taxes and restaurant taxes. Sources: Economic and demographic impacts generated using the REMI model. Revenue impacts generated by BEBR using methods documented in this report.

The Structure and Economic Impact of Utah’s Coal Industry
B U R E A U O F E C O N O M I C A N D B U S I N E S S R E S E A R C H 113
Table 5.14b Detailed Employment Impacts Coal Counties: Middle Scenario
Change Employment by Industry 2007 2010 2015 2020 2025 2030 Level Percent Natural Resources, Mining, Utilities, Construction 2,161 2,475 2,410 2,053 1,704 1,488 –673 –31.1% Forestry, Fishing, Other 1 0 –2 0 2 3 2 200.0% Mining 1,945 2,092 2,097 1,856 1,581 1,407 –538 –27.7% Utilities 9 10 9 6 7 7 –2 –22.2% Construction 206 373 306 191 114 71 –135 –65.5% Manufacturing 2 –1 –3 0 2 3 1 50.0% Trade 517 574 596 536 489 447 –70 –13.5% Wholesale Trade 36 32 29 23 23 20 –16 –44.4% Retail Trade 481 542 567 513 466 427 –54 –11.2% Transportation, Information, Finance, Accounting 137 140 112 82 73 74 –63 –46.0% Transportation and Warehousing 4 1 –2 1 5 10 6 150.0% Information 7 6 7 6 7 8 1 14.3% Finance, Insurance 44 38 26 18 15 14 –30 –68.2% Real Estate, Rental, Leasing 82 95 81 57 46 42 –40 –48.8% Services 720 853 905 849 842 837 117 16.3% Professional and Technical Services 70 81 72 56 51 51 –19 –27.1% Management of Companies / Enterprises 18 17 12 6 5 4 –14 –77.8% Administrative and Waste Services 90 99 90 71 65 61 –29 –32.2% Educational Services 4 4 5 8 11 12 8 200.0% Health Care and Social Assistance 273 320 362 361 371 384 111 40.7% Arts, Entertainment, Recreation 21 27 31 29 30 29 8 38.1% Accommodation and Food Services 108 151 180 181 179 170 62 57.4% Other Services (excl Gov) 136 154 153 137 130 126 –10 –7.4% Public Administration 480 561 507 379 318 293 –187 –39.0% State & Local Government 480 561 507 379 318 293 –187 –39.0% State Government 157 176 146 86 68 64 –93 –59.2% Local Government 323 385 361 293 250 229 –94 –29.1% Federal Civilian 0 0 0 0 0 0 0 NA Federal Military 0 0 0 0 0 0 0 NA Farm 0 0 0 0 0 0 0 NA TOTAL EMPLOYMENT 4,017 4,602 4,527 3,899 3,428 3,142 –875 –21.8% Notes: Historical data for 2007, projections from 2008 through 2030. Columns may not sum to totals due to rounding. Employment is a jobs count consistent with the Bureau of Economic Analysis definition and measured at the place of work (rather than residence). Source: Analysis generated by the Bureau of Economic and Business Research, University of Utah, using the REMI Model.

The Structure and Economic Impact of Utah’s Coal Industry
114 B U R E A U O F E C O N O M I C A N D B U S I N E S S R E S E A R C H
Table 5.14c Detailed Occupational Impacts Coal Counties: Middle Scenario
Change Employment by Occupation 2007 2010 2015 2020 2025 2030 Level Percent Management, Business, Financial 342 384 364 303 259 236 –106 –31.0% Computer, Math, Architect, Engineer 149 165 162 138 120 111 –38 –25.5% Life, Physical, Social Science 74 81 81 70 62 57 –17 –23.0% Community, Social Service 59 68 69 60 57 57 –2 –3.4% Legal 28 31 28 22 20 18 –10 –35.7% Education, Training, Library 29 34 36 34 34 34 5 17.2% Arts, Design, Entertainment, Sports, Media 16 18 17 15 15 14 –2 –12.5% Healthcare 182 212 229 220 220 224 42 23.1% Protective Service 121 143 133 101 87 83 –38 –31.4% Food Preparation, Serving-Related 111 149 174 172 168 163 52 46.8% Building, Grounds, Personal Care, Service 145 169 171 153 145 142 –3 –2.1% Sales, Office, Administrative 562 627 583 479 416 382 –180 –32.0% Farm, Fishing, Forestry 3 2 1 1 2 2 –1 –33.3% Construction, Extraction 915 1,088 1,042 863 702 605 –310 –33.9% Installation, Maintenance, Repair 231 267 264 227 195 177 –54 –23.4% Production 205 222 220 194 167 152 –53 –25.9% Transportation, Material Moving 365 397 386 334 288 260 –105 –28.8% Notes: Historical data for 2007, projections from 2008 through 2030. Columns may not sum to totals due to rounding. Employment is a jobs count consistent with the Bureau of Economic Analysis definition and measured at the place of work (rather than residence). Source: Analysis generated by the Bureau of Economic and Business Research, University of Utah, using the REMI Model.

The Structure and Economic Impact of Utah’s Coal Industry
B U R E A U O F E C O N O M I C A N D B U S I N E S S R E S E A R C H 115
Table 5.15a Summary Impacts
Coal Counties: High Scenario (Dollar Amounts are Millions of Current Dollars)
Year Employment Population Earnings Local
Revenue State
Revenue 2007 4,017 6,026 $128.2 $0.50 $9.8 2008 4,390 6,585 $145.0 $0.57 $11.0 2009 4,604 6,906 $155.7 $0.61 $11.8 2010 4,601 6,902 $159.9 $0.63 $12.2 2011 4,586 6,879 $168.6 $0.66 $12.8 2012 4,666 6,999 $181.8 $0.70 $13.8 2013 4,610 6,915 $190.3 $0.73 $14.5 2014 4,673 7,010 $204.9 $0.78 $15.6 2015 4,526 7,116 $212.3 $0.78 $16.1 2016 4,344 7,254 $215.3 $0.79 $16.3 2017 4,181 7,484 $218.4 $0.77 $16.6 2018 3,895 7,477 $213.6 $0.74 $16.2 2019 3,948 7,632 $228.5 $0.78 $17.3 2020 4,367 7,545 $268.0 $0.88 $20.3 2021 4,227 7,719 $272.8 $0.89 $20.6 2022 4,624 7,975 $315.3 $1.01 $23.8 2023 4,577 8,179 $329.5 $1.06 $24.9 2024 4,515 8,339 $341.0 $1.10 $25.8 2025 4,460 8,453 $353.9 $1.14 $26.7 2026 4,405 8,521 $366.2 $1.18 $27.7 2027 4,253 8,528 $369.6 $1.20 $27.9 2028 4,205 8,513 $382.8 $1.25 $28.9 2029 4,168 8,479 $397.1 $1.30 $30.0 2030 4,150 8,433 $414.3 $1.35 $31.3
Notes: Historical data for 2007, projections from 2008 through 2030. Earnings is by place of work, not place of residence. Employment is a jobs count consistent with the Bureau of Economic Analysis definition and also measured at the place of work. State revenue impacts are income taxes, sales taxes, and other taxes. Local revenue impacts are total general sales and use taxes and restaurant taxes. Sources: Economic and demographic impacts generated using the REMI model. Revenue impacts generated by BEBR using methods documented in this report.

The Structure and Economic Impact of Utah’s Coal Industry
116 B U R E A U O F E C O N O M I C A N D B U S I N E S S R E S E A R C H
Table 5.15b Detailed Employment Impacts Coal Counties: High Scenario
Change Employment by Industry 2007 2010 2015 2020 2025 2030 Level Percent Natural Resources, Mining, Utilities, Construction 2,161 2,475 2,410 2,290 2,227 1,987 –174 –8.1% Forestry, Fishing, Other 1 0 –2 0 1 2 1 100.0% Mining 1,945 2,092 2,097 2,065 2,016 1,843 –102 –5.2% Utilities 9 10 9 6 8 9 0 0.0% Construction 206 373 306 219 202 133 –73 –35.4% Manufacturing 2 –1 –3 0 2 3 1 50.0% Trade 517 574 596 597 624 580 63 12.2% Wholesale Trade 36 32 29 26 28 25 –11 –30.6% Retail Trade 481 542 567 571 596 555 74 15.4% Transportation, Information, Finance, Accounting 137 140 112 93 99 94 –43 –31.4% Transportation and Warehousing 4 1 –2 1 6 10 6 150.0% Information 7 6 7 7 9 9 2 28.6% Finance, Insurance 44 38 26 21 21 18 –26 –59.1% Real Estate, Rental, Leasing 82 95 81 64 63 57 –25 –30.5% Services 720 853 905 950 1,061 1,062 342 47.5% Professional and Technical Services 70 81 72 63 67 66 –4 –5.7% Management of Companies / Enterprises 18 17 12 8 9 7 –11 –61.1% Administrative and Waste Services 90 99 90 84 89 83 –7 –7.8% Educational Services 4 4 5 8 11 13 9 225.0% Health Care and Social Assistance 273 320 362 409 475 490 217 79.5% Arts, Entertainment, Recreation 21 27 31 31 37 37 16 76.2% Accommodation and Food Services 108 151 180 193 209 207 99 91.7% Other Services (excl Gov) 136 154 153 154 164 159 23 16.9% Public Administration 480 561 507 434 448 422 –58 –12.1% State & Local Government 480 561 507 434 448 422 –58 –12.1% State Government 157 176 146 99 102 96 –61 –38.9% Local Government 323 385 361 335 346 326 3 0.9% Federal Civilian 0 0 0 0 0 0 0 NA Federal Military 0 0 0 0 0 0 0 NA Farm 0 0 0 0 0 0 0 NA TOTAL EMPLOYMENT 4,017 4,602 4,527 4,364 4,461 4,148 131 3.3% Notes: Historical data for 2007, projections from 2008 through 2030. Columns may not sum to totals due to rounding. Employment is a jobs count consistent with the Bureau of Economic Analysis definition and measured at the place of work (rather than residence). Source: Analysis generated by the Bureau of Economic and Business Research, University of Utah, using the REMI Model.

The Structure and Economic Impact of Utah’s Coal Industry
B U R E A U O F E C O N O M I C A N D B U S I N E S S R E S E A R C H 117
Table 5.15c Detailed Occupational Impacts Coal Counties: High Scenario
Change Employment by Occupation 2007 2010 2015 2020 2025 2030 Level Percent Management, Business, Financial 342 384 364 340 342 315 –27 –7.9% Computer, Math, Architect, Engineer 149 165 162 155 157 147 –2 –1.3% Life, Physical, Social Science 74 81 81 80 80 75 1 1.4% Community, Social Service 59 68 69 68 75 75 16 27.1% Legal 28 31 28 25 26 24 –4 –14.3% Education, Training, Library 29 34 36 38 43 44 15 51.7% Arts, Design, Entertainment, Sports, Media 16 18 17 17 19 19 3 18.8% Healthcare 182 212 229 250 283 289 107 58.8% Protective Service 121 143 133 116 122 116 –5 –4.1% Food Preparation, Serving-Related 111 149 174 185 202 200 89 80.2% Building, Grounds, Personal Care, Service 145 169 171 172 189 186 41 28.3% Sales, Office, Administrative 562 627 583 540 548 507 –55 –9.8% Farm, Fishing, Forestry 3 2 1 2 2 3 0 0.0% Construction, Extraction 915 1,088 1,042 965 937 822 –93 –10.2% Installation, Maintenance, Repair 231 267 264 254 255 235 4 1.7% Production 205 222 220 216 215 199 –6 –2.9% Transportation, Material Moving 365 397 386 373 371 339 –26 –7.1% Notes: Historical data for 2007, projections from 2008 through 2030. Columns may not sum to totals due to rounding. Employment is a jobs count consistent with the Bureau of Economic Analysis definition and measured at the place of work (rather than residence). Source: Analysis generated by the Bureau of Economic and Business Research, University of Utah, using the REMI Model.
Figure 5.5a Coal Counties Employment Impacts, 2007–2030
4,150
3,145
2,469
4,017
2,000
2,500
3,000
3,500
4,000
4,500
5,000
2007
2009
2011
2013
2015
2017
2019
2021
2023
2025
2027
2029
Em
plo
ym
en
t
HighMiddleLow
Source: Bureau of Economic and Business Research, University of Utah analysis using the REMI model.

The Structure and Economic Impact of Utah’s Coal Industry
118 B U R E A U O F E C O N O M I C A N D B U S I N E S S R E S E A R C H
Figure 5.5b Coal Counties Population Impacts, 2007–2030
8,433
6,895
6,0265,730
5,000
5,500
6,000
6,500
7,000
7,500
8,000
8,500
9,000
2007
2009
2011
2013
2015
2017
2019
2021
2023
2025
2027
2029
Pers
on
s
HighMiddleLow
Source: Bureau of Economic and Business Research, University of Utah analysis using the REMI model.
Figure 5.5c Coal Counties Earnings Impacts, 2007–2030
$414.3
$310.0
$240.3
$128.2$100
$150
$200
$250
$300
$350
$400
$450
2007
2009
2011
2013
2015
2017
2019
2021
2023
2025
2027
2029
Mil
lio
ns o
f C
urr
en
t D
oll
ars
HighMiddleLow
Source: Bureau of Economic and Business Research, University of Utah analysis using the REMI model.

The Structure and Economic Impact of Utah’s Coal Industry
B U R E A U O F E C O N O M I C A N D B U S I N E S S R E S E A R C H 119
Figure 5.5d Coal Counties Local Tax Revenue Impacts, 2007–2030
$1.4
$1.0
$0.5
$0.8
$0.4
$0.5
$0.6
$0.7
$0.8
$0.9
$1.0
$1.1
$1.2
$1.3
$1.4
2007
2009
2011
2013
2015
2017
2019
2021
2023
2025
2027
2029
Mil
lio
ns o
f C
urr
en
t D
oll
ars
HighMiddleLow
Source: Bureau of Economic and Business Research, University of Utah analysis using the REMI model.
Figure 5.5e Coal Counties State Tax Revenue Impacts, 2007–2030
$31.3
$9.8
$23.5
$18.2
$5.0
$10.0
$15.0
$20.0
$25.0
$30.0
$35.0
2007
2009
2011
2013
2015
2017
2019
2021
2023
2025
2027
2029
Mil
lio
ns o
f C
urr
en
t D
oll
ars
HighMiddleLow
Source: Bureau of Economic and Business Research, University of Utah analysis using the REMI model.

The Structure and Economic Impact of Utah’s Coal Industry
120 B U R E A U O F E C O N O M I C A N D B U S I N E S S R E S E A R C H
5.7 Non-Coal Counties Scenario Impacts
Impact results for each of the three scenarios for the non-coal counties (all counties except Car-bon, Emery, and Sevier) are also shown in nine tables. The Low Scenario is shown in Tables 5.16a through 5.16c, the Middle Scenario in Tables 5.17a through 5.17c, and the High Scenario in Tables 5.18a through 5.18c. Figures 5.6a through 5.6e show all three scenarios for each of the major impact categories for the region. Finally, Tables 5.19a through 5.21b provide summary results for 2007 compared with 2030 for all areas and for all three scenarios, and Figures 5.7a through 5.7c show employment impacts by county for all three scenarios. Impacts in Utah outside the coal counties are a small but increasing share of total state impacts from 2007 to 2030. Employment impacts for the non-coal counties increase from 686 in 2007 to reach 1,647 in 2014 in the Low Scenario, and 1,658 in 2015 in both the Middle and High scenar-ios. Employment impacts decline to 1,055 in the Low Scenario and 1,285 in the Middle Scenario by 2030. While there is some fluctuation, the High Scenario employment impacts remain mostly flat, terminating at 1,625 in 2030. Population impacts increase from 1,029 in 2007 to 2,471 in 2014 in all scenarios for the non-coal counties. Population impacts decline to 1,821 in the Low Scenario and to 1,692 in the Middle and High Scenarios in 2016. Impacts then increase again in all scenarios to 2030, reaching 2,794 in the Low Scenario, 3,263 in the Middle Scenario, and 3,883 in the High Scenario. Nominal earnings, local tax revenue, and state tax revenue impacts are all higher in 2030 than in 2007 for all three scenarios for those counties not in coal country. From 2007 to 2030, nominal earnings impacts increase from $68.1 million to $186.3 million in the Low Scenario, $232.9 mil-lion in the Middle Scenario, and $305.1 million in the High Scenario. Over the same period, nominal local government revenue impacts increase from $0.3 million to $0.7 million in the Low Scenario, $0.9 million in the Middle Scenario, and $1.2 million in the High Scenario. Nominal state government revenue impacts increase from $5.3 million in 2007 to 2030 levels of $14.5 mil-lion in the Low Scenario, $18.1 million in the Middle Scenario, and $23.7 million in the High Scenario.

The Structure and Economic Impact of Utah’s Coal Industry
B U R E A U O F E C O N O M I C A N D B U S I N E S S R E S E A R C H 121
Table 5.16a Summary Impacts
Non-Coal Counties: Low Scenario (Dollar Amounts are Millions of Current Dollars)
Year Employment Population Earnings Local
Revenue State
Revenue 2007 686 1,029 $68.1 $0.27 $5.3 2008 802 1,203 $78.4 $0.31 $6.1 2009 893 1,340 $87.0 $0.35 $6.8 2010 918 1,377 $89.6 $0.36 $7.0 2011 922 1,383 $93.5 $0.37 $7.3 2012 1,284 1,926 $117.5 $0.47 $9.1 2013 1,301 1,952 $123.0 $0.49 $9.6 2014 1,647 2,471 $150.1 $0.60 $11.7 2015 1,629 1,970 $153.1 $0.61 $11.9 2016 1,561 1,821 $153.1 $0.61 $11.9 2017 1,515 1,995 $154.8 $0.62 $12.0 2018 1,402 2,384 $148.2 $0.59 $11.5 2019 1,356 2,590 $150.0 $0.60 $11.7 2020 1,292 2,752 $149.6 $0.60 $11.6 2021 1,207 2,797 $144.1 $0.58 $11.2 2022 1,171 2,829 $146.6 $0.59 $11.4 2023 1,129 2,845 $146.5 $0.59 $11.4 2024 1,108 2,855 $150.1 $0.60 $11.7 2025 1,097 2,857 $155.3 $0.62 $12.1 2026 1,090 2,856 $161.6 $0.65 $12.6 2027 1,061 2,843 $162.7 $0.65 $12.7 2028 1,056 2,827 $169.5 $0.68 $13.2 2029 1,054 2,810 $177.5 $0.71 $13.8 2030 1,055 2,794 $186.3 $0.75 $14.5
Notes: Historical data for 2007, projections from 2008 through 2030. Earnings is by place of work, not place of residence. Employment is a jobs count consistent with the Bureau of Economic Analysis definition and also measured at the place of work. State revenue impacts are income taxes, sales taxes, and other taxes. Local revenue impacts are total general sales and use taxes and restaurant taxes. Sources: Economic and demographic impacts generated using the REMI model. Revenue impacts generated by BEBR using methods documented in this report.

The Structure and Economic Impact of Utah’s Coal Industry
122 B U R E A U O F E C O N O M I C A N D B U S I N E S S R E S E A R C H
Table 5.16b Detailed Employment Impacts
Non-Coal Counties: Low Scenario
Change Employment by Industry 2007 2010 2015 2020 2025 2030 Level Percent Natural Resources, Mining, Utilities, Construction 84 167 316 208 129 105 21 25.0% Forestry, Fishing, Other 1 0 0 0 0 0 –1 –100.0% Mining 3 4 86 72 63 59 56 1866.7% Utilities 1 1 2 3 2 1 0 0.0% Construction 79 162 228 133 64 45 –34 –43.0% Manufacturing 20 2 9 2 4 10 –10 –50.0% Trade 111 142 238 197 166 155 44 39.6% Wholesale Trade 19 21 36 27 21 19 0 0.0% Retail Trade 92 121 202 170 145 136 44 47.8% Transportation, Information, Finance, Accounting 132 155 255 193 163 160 28 21.2% Transportation and Warehousing 17 18 29 21 18 20 3 17.6% Information 16 20 30 24 20 20 4 25.0% Finance, Insurance 56 60 95 63 50 48 –8 –14.3% Real Estate, Rental, Leasing 43 57 101 85 75 72 29 67.4% Services 271 351 631 546 509 511 240 88.6% Professional and Technical Services 52 68 118 98 88 89 37 71.2% Management of Companies / Enterprises 23 22 29 18 13 13 –10 –43.5% Administrative and Waste Services 50 64 106 83 71 67 17 34.0% Educational Services 15 22 38 38 39 40 25 166.7% Health Care and Social Assistance 48 62 133 119 118 126 78 162.5% Arts, Entertainment, Recreation 16 20 38 37 37 38 22 137.5% Accommodation and Food Services 31 47 92 87 83 79 48 154.8% Other Services (excl Gov) 36 46 77 66 60 59 23 63.9% Public Administration 69 100 178 146 128 119 50 72.5% State & Local Government 69 100 178 146 128 119 50 72.5% State Government 26 36 72 58 51 47 21 80.8% Local Government 43 64 106 88 77 72 29 67.4% Federal Civilian 0 0 0 0 0 0 0 N/A Federal Military 0 0 0 0 0 0 0 N/A Farm 0 0 0 0 0 0 0 N/A TOTAL EMPLOYMENT 687 917 1,627 1,292 1,099 1,060 373 54.3% Notes: Historical data for 2007, projections from 2008 through 2030. Columns may not sum to totals due to rounding. Employment is a jobs count consistent with the Bureau of Economic Analysis definition and measured at the place of work (rather than residence). Source: Analysis generated by the Bureau of Economic and Business Research, University of Utah, using the REMI Model.

The Structure and Economic Impact of Utah’s Coal Industry
B U R E A U O F E C O N O M I C A N D B U S I N E S S R E S E A R C H 123
Table 5.16c Detailed Occupational Impacts
Non-Coal Counties: Low Scenario
Change Employment by Occupation 2007 2010 2015 2020 2025 2030 Level Percent Management, Business, Financial 71 90 156 120 101 97 26 36.6% Computer, Math, Architect, Engineer 30 38 68 55 48 48 18 60.0% Life, Physical, Social Science 5 8 16 13 11 10 5 100.0% Community, Social Service 10 15 28 24 22 23 13 130.0% Legal 6 9 16 13 10 11 5 83.3% Education, Training, Library 15 21 37 35 34 36 21 140.0% Arts, Design, Entertainment, Sports, Media 9 12 20 17 14 14 5 55.6% Healthcare 34 44 90 80 76 80 46 135.3% Protective Service 23 31 55 46 41 39 16 69.6% Food Preparation, Serving-Related 32 48 93 88 83 81 49 153.1% Building, Grounds, Personal Care, Service 45 61 107 92 85 85 40 88.9% Sales, Office, Administrative 160 199 337 259 219 208 48 30.0% Farm, Fishing, Forestry 1 1 2 2 1 2 1 100.0% Construction, Extraction 62 120 203 131 80 64 2 3.2% Installation, Maintenance, Repair 29 39 70 55 45 42 13 44.8% Production 23 19 40 29 25 27 4 17.4% Transportation, Material Moving 37 44 84 65 55 52 15 40.5% Notes: Historical data for 2007, projections from 2008 through 2030. Columns may not sum to totals due to rounding. Employment is a jobs count consistent with the Bureau of Economic Analysis definition and measured at the place of work (rather than residence). Source: Analysis generated by the Bureau of Economic and Business Research, University of Utah, using the REMI Model.

The Structure and Economic Impact of Utah’s Coal Industry
124 B U R E A U O F E C O N O M I C A N D B U S I N E S S R E S E A R C H
Table 5.17a Summary Impacts
Non-Coal Counties: Middle Scenario (Dollar Amounts are Millions of Current Dollars)
Year Employment Population Earnings Local
Revenue State
Revenue 2007 686 1,029 $68.1 $0.27 $5.3 2008 802 1,203 $78.4 $0.31 $6.1 2009 893 1,340 $87.0 $0.35 $6.8 2010 918 1,377 $89.6 $0.36 $7.0 2011 922 1,383 $93.5 $0.37 $7.3 2012 1,284 1,926 $117.5 $0.47 $9.1 2013 1,301 1,952 $123.0 $0.49 $9.6 2014 1,647 2,471 $150.1 $0.60 $11.7 2015 1,658 2,160 $156.3 $0.63 $12.2 2016 1,620 1,692 $159.1 $0.64 $12.4 2017 1,580 2,033 $161.6 $0.65 $12.6 2018 1,502 2,316 $159.9 $0.64 $12.4 2019 1,494 2,440 $167.0 $0.67 $13.0 2020 1,471 2,892 $172.5 $0.69 $13.4 2021 1,429 2,985 $174.6 $0.70 $13.6 2022 1,402 3,064 $179.0 $0.72 $13.9 2023 1,364 3,123 $181.0 $0.72 $14.1 2024 1,345 3,169 $186.3 $0.75 $14.5 2025 1,331 3,205 $192.4 $0.77 $15.0 2026 1,322 3,235 $200.3 $0.80 $15.6 2027 1,293 3,248 $203.2 $0.81 $15.8 2028 1,285 3,257 $211.7 $0.85 $16.5 2029 1,282 3,261 $221.3 $0.89 $17.2 2030 1,285 3,263 $232.9 $0.93 $18.1
Notes: Historical data for 2007, projections from 2008 through 2030. Earnings is by place of work, not place of residence. Employment is a jobs count consistent with the Bureau of Economic Analysis definition and also measured at the place of work. State revenue impacts are income taxes, sales taxes, and other taxes. Local revenue impacts are total general sales and use taxes and restaurant taxes. Sources: Economic and demographic impacts generated using the REMI model. Revenue impacts generated by BEBR using methods documented in this report.

The Structure and Economic Impact of Utah’s Coal Industry
B U R E A U O F E C O N O M I C A N D B U S I N E S S R E S E A R C H 125
Table 5.17b Detailed Employment Impacts
Non-Coal Counties: Middle Scenario
Change Employment by Industry 2007 2010 2015 2020 2025 2030 Level Percent Natural Resources, Mining, Utilities, Construction 84 167 320 235 162 130 46 54.8% Forestry, Fishing, Other 1 0 0 0 0 1 0 0.0% Mining 3 4 86 73 63 58 55 1833.3% Utilities 1 1 2 3 2 2 1 100.0% Construction 79 162 232 159 97 69 –10 –12.7% Manufacturing 20 2 10 6 10 16 –4 –20.0% Trade 111 142 241 223 200 189 78 70.3% Wholesale Trade 19 21 36 31 24 23 4 21.1% Retail Trade 92 121 205 192 176 166 74 80.4% Transportation, Information, Finance, Accounting 132 155 260 222 200 191 59 44.7% Transportation and Warehousing 17 18 29 24 24 24 7 41.2% Information 16 20 31 29 25 23 7 43.8% Finance, Insurance 56 60 98 73 61 57 1 1.8% Real Estate, Rental, Leasing 43 57 102 96 90 87 44 102.3% Services 271 351 644 620 602 616 345 127.3% Professional and Technical Services 52 68 121 113 108 109 57 109.6% Management of Companies / Enterprises 23 22 29 22 18 18 –5 –21.7% Administrative and Waste Services 50 64 108 96 85 82 32 64.0% Educational Services 15 22 39 42 45 49 34 226.7% Health Care and Social Assistance 48 62 135 133 137 147 99 206.3% Arts, Entertainment, Recreation 16 20 39 42 43 45 29 181.3% Accommodation and Food Services 31 47 94 97 95 95 64 206.5% Other Services (excl Gov) 36 46 79 75 71 71 35 97.2% Public Administration 69 100 181 166 150 145 76 110.1% State & Local Government 69 100 181 166 150 145 76 110.1% State Government 26 36 73 66 59 57 31 119.2% Local Government 43 64 108 100 91 88 45 104.7% Federal Civilian 0 0 0 0 0 0 0 N/A Federal Military 0 0 0 0 0 0 0 N/A Farm 0 0 0 0 0 0 0 N/A TOTAL EMPLOYMENT 687 917 1,656 1,472 1,324 1,287 600 87.3% Notes: Historical data for 2007, projections from 2008 through 2030. Columns may not sum to totals due to rounding. Employment is a jobs count consistent with the Bureau of Economic Analysis definition and measured at the place of work (rather than residence). Source: Analysis generated by the Bureau of Economic and Business Research, University of Utah, using the REMI Model.

The Structure and Economic Impact of Utah’s Coal Industry
126 B U R E A U O F E C O N O M I C A N D B U S I N E S S R E S E A R C H
Table 5.17c Detailed Occupational Impacts
Non-Coal Counties: Middle Scenario
Change Employment by Occupation 2007 2010 2015 2020 2025 2030 Level Percent Management, Business, Financial 71 90 160 138 123 118 47 66.2% Computer, Math, Architect, Engineer 30 38 70 64 60 59 29 96.7% Life, Physical, Social Science 5 8 16 15 13 13 8 160.0% Community, Social Service 10 15 28 27 27 27 17 170.0% Legal 6 9 16 15 12 12 6 100.0% Education, Training, Library 15 21 37 39 40 44 29 193.3% Arts, Design, Entertainment, Sports, Media 9 12 21 19 17 18 9 100.0% Healthcare 34 44 92 88 88 93 59 173.5% Protective Service 23 31 57 54 49 46 23 100.0% Food Preparation, Serving-Related 32 48 95 97 98 96 64 200.0% Building, Grounds, Personal Care, Service 45 61 110 104 102 103 58 128.9% Sales, Office, Administrative 160 199 344 297 266 255 95 59.4% Farm, Fishing, Forestry 1 1 2 2 2 2 1 100.0% Construction, Extraction 62 120 206 151 105 84 22 35.5% Installation, Maintenance, Repair 29 39 72 62 54 51 22 75.9% Production 23 19 41 34 33 34 11 47.8% Transportation, Material Moving 37 44 85 74 65 63 26 70.3% Notes: Historical data for 2007, projections from 2008 through 2030. Columns may not sum to totals due to rounding. Employment is a jobs count consistent with the Bureau of Economic Analysis definition and measured at the place of work (rather than residence). Source: Analysis generated by the Bureau of Economic and Business Research, University of Utah, using the REMI Model.

The Structure and Economic Impact of Utah’s Coal Industry
B U R E A U O F E C O N O M I C A N D B U S I N E S S R E S E A R C H 127
Table 5.18a Summary Impacts
Non-Coal Counties: High Scenario (Dollar Amounts are Millions of Current Dollars)
Year Employment Population Earnings Local
Revenue State
Revenue 2007 686 1,029 $68.1 $0.27 $5.3 2008 802 1,203 $78.4 $0.31 $6.1 2009 893 1,340 $87.0 $0.35 $6.8 2010 918 1,377 $89.6 $0.36 $7.0 2011 922 1,383 $93.5 $0.37 $7.3 2012 1,284 1,926 $117.5 $0.47 $9.1 2013 1,301 1,952 $123.0 $0.49 $9.6 2014 1,647 2,471 $150.1 $0.60 $11.7 2015 1,658 2,160 $156.3 $0.63 $12.2 2016 1,620 1,692 $159.1 $0.64 $12.4 2017 1,580 2,033 $161.6 $0.65 $12.6 2018 1,502 2,316 $159.9 $0.64 $12.4 2019 1,494 2,440 $167.0 $0.67 $13.0 2020 1,592 2,930 $189.9 $0.76 $14.8 2021 1,570 3,062 $194.6 $0.78 $15.1 2022 1,674 3,216 $220.4 $0.88 $17.1 2023 1,685 3,354 $230.9 $0.92 $18.0 2024 1,682 3,475 $241.0 $0.96 $18.8 2025 1,675 3,577 $250.4 $1.00 $19.5 2026 1,670 3,668 $261.2 $1.04 $20.3 2027 1,639 3,737 $266.8 $1.07 $20.8 2028 1,628 3,794 $277.9 $1.11 $21.6 2029 1,624 3,840 $290.6 $1.16 $22.6 2030 1,625 3,883 $305.1 $1.22 $23.7
Notes: Historical data for 2007, projections from 2008 through 2030. Earnings is by place of work, not place of residence. Employment is a jobs count consistent with the Bureau of Economic Analysis definition and also measured at the place of work. State revenue impacts are income taxes, sales taxes, and other taxes. Local revenue impacts are total general sales and use taxes and restaurant taxes. Sources: Economic and demographic impacts generated using the REMI model. Revenue impacts generated by BEBR using methods documented in this report.

The Structure and Economic Impact of Utah’s Coal Industry
128 B U R E A U O F E C O N O M I C A N D B U S I N E S S R E S E A R C H
Table 5.18b Detailed Employment Impacts
Non-Coal Counties: High Scenario
Change Employment by Industry 2007 2010 2015 2020 2025 2030 Level Percent Natural Resources, Mining, Utilities, Construction 84 167 320 251 221 174 90 107.1% Forestry, Fishing, Other 1 0 0 0 1 1 0 0.0% Mining 3 4 86 74 65 60 57 1900.0% Utilities 1 1 2 4 3 2 1 100.0% Construction 79 162 232 173 152 111 32 40.5% Manufacturing 20 2 10 10 18 24 4 20.0% Trade 111 142 241 241 251 239 128 115.3% Wholesale Trade 19 21 36 33 31 28 9 47.4% Retail Trade 92 121 205 208 220 211 119 129.3% Transportation, Information, Finance, Accounting 132 155 260 246 251 242 110 83.3% Transportation and Warehousing 17 18 29 28 30 31 14 82.4% Information 16 20 31 31 31 30 14 87.5% Finance, Insurance 56 60 98 82 79 72 16 28.6% Real Estate, Rental, Leasing 43 57 102 105 111 109 66 153.5% Services 271 351 644 670 747 768 497 183.4% Professional and Technical Services 52 68 121 124 138 141 89 171.2% Management of Companies / Enterprises 23 22 29 25 24 23 0 0.0% Administrative and Waste Services 50 64 108 104 109 105 55 110.0% Educational Services 15 22 39 46 54 59 44 293.3% Health Care and Social Assistance 48 62 135 143 165 180 132 275.0% Arts, Entertainment, Recreation 16 20 39 45 52 56 40 250.0% Accommodation and Food Services 31 47 94 102 115 115 84 271.0% Other Services (excl Gov) 36 46 79 81 90 89 53 147.2% Public Administration 69 100 181 177 186 180 111 160.9% State & Local Government 69 100 181 177 186 180 111 160.9% State Government 26 36 73 70 72 70 44 169.2% Local Government 43 64 108 107 114 110 67 155.8% Federal Civilian 0 0 0 0 0 0 0 N/A Federal Military 0 0 0 0 0 0 0 N/A Farm 0 0 0 0 0 0 0 N/A TOTAL EMPLOYMENT 687 917 1,656 1,595 1,674 1,627 940 136.8% Notes: Historical data for 2007, projections from 2008 through 2030. Columns may not sum to totals due to rounding. Employment is a jobs count consistent with the Bureau of Economic Analysis definition and measured at the place of work (rather than residence). Source: Analysis generated by the Bureau of Economic and Business Research, University of Utah, using the REMI Model.

The Structure and Economic Impact of Utah’s Coal Industry
B U R E A U O F E C O N O M I C A N D B U S I N E S S R E S E A R C H 129
Table 5.18c Detailed Occupational Impacts
Non-Coal Counties: High Scenario
Change Employment by Occupation 2007 2010 2015 2020 2025 2030 Level Percent Management, Business, Financial 71 90 160 151 156 150 79 111.3% Computer, Math, Architect, Engineer 30 38 70 69 75 75 45 150.0% Life, Physical, Social Science 5 8 16 15 16 16 11 220.0% Community, Social Service 10 15 28 29 33 34 24 240.0% Legal 6 9 16 16 16 16 10 166.7% Education, Training, Library 15 21 37 41 49 53 38 253.3% Arts, Design, Entertainment, Sports, Media 9 12 21 21 22 21 12 133.3% Healthcare 34 44 92 94 108 115 81 238.2% Protective Service 23 31 57 57 60 59 36 156.5% Food Preparation, Serving-Related 32 48 95 103 116 118 86 268.8% Building, Grounds, Personal Care, Service 45 61 110 113 125 127 82 182.2% Sales, Office, Administrative 160 199 344 324 336 322 162 101.3% Farm, Fishing, Forestry 1 1 2 2 3 2 1 100.0% Construction, Extraction 62 120 206 163 145 116 54 87.1% Installation, Maintenance, Repair 29 39 72 67 69 65 36 124.1% Production 23 19 41 39 44 44 21 91.3% Transportation, Material Moving 37 44 85 80 81 81 44 118.9% Notes: Historical data for 2007, projections from 2008 through 2030. Columns may not sum to totals due to rounding. Employment is a jobs count consistent with the Bureau of Economic Analysis definition and measured at the place of work (rather than residence). Source: Analysis generated by the Bureau of Economic and Business Research, University of Utah, using the REMI Model.
Figure 5.6a Non-Coal Counties Employment Impacts, 2007–2030
1,625
1,285
1,055
686600
800
1,000
1,200
1,400
1,600
1,800
2007
2009
2011
2013
2015
2017
2019
2021
2023
2025
2027
2029
Em
plo
ym
en
t
HighMiddleLow
Source: Bureau of Economic and Business Research, University of Utah analysis using the REMI model.

The Structure and Economic Impact of Utah’s Coal Industry
130 B U R E A U O F E C O N O M I C A N D B U S I N E S S R E S E A R C H
Figure 5.6b Non-Coal Counties Population Impacts, 2007–2030
3,883
3,263
1,029
2,794
1,000
1,500
2,000
2,500
3,000
3,500
4,000
2007
2009
2011
2013
2015
2017
2019
2021
2023
2025
2027
2029
Pers
on
s
HighMiddleLow
Source: Bureau of Economic and Business Research, University of Utah analysis using the REMI model.
Figure 5.6c Non-Coal Counties Earnings Impacts, 2007–2030
$305.1
$232.9
$186.3
$68.1$50
$100
$150
$200
$250
$300
$350
2007
2009
2011
2013
2015
2017
2019
2021
2023
2025
2027
2029
Mil
lio
ns o
f C
urr
en
t D
oll
ars
HighMiddleLow
Source: Bureau of Economic and Business Research, University of Utah analysis using the REMI model.

The Structure and Economic Impact of Utah’s Coal Industry
B U R E A U O F E C O N O M I C A N D B U S I N E S S R E S E A R C H 131
Figure 5.6d Non-Coal Counties Local Tax Revenue Impacts, 2007–2030
$1.22
$0.93
$0.27
$0.75
$0.2
$0.4
$0.6
$0.8
$1.0
$1.2
$1.4
2007
2009
2011
2013
2015
2017
2019
2021
2023
2025
2027
2029
Mil
lio
ns o
f C
urr
en
t D
oll
ars
HighMiddleLow
Source: Bureau of Economic and Business Research, University of Utah analysis using the REMI model.
Figure 5.6e Non-Coal Counties State Tax Revenue Impacts, 2007–2030
$23.7
$18.1
$14.5
$5.3$5.0
$7.0
$9.0
$11.0
$13.0
$15.0
$17.0
$19.0
$21.0
$23.0
$25.0
2007
2009
2011
2013
2015
2017
2019
2021
2023
2025
2027
2029
Mil
lio
ns o
f C
urr
en
t D
oll
ars
HighMiddleLow
Source: Bureau of Economic and Business Research, University of Utah analysis using the REMI model.

The Structure and Economic Impact of Utah’s Coal Industry
132 B U R E A U O F E C O N O M I C A N D B U S I N E S S R E S E A R C H
Table 5.19a Summary Impacts: Low Scenario
(Dollar Amounts are Millions of Current Dollars)
2007 2030
Employment Population Earnings Local
Revenue State
Revenue Employment Population Earnings Local
Revenue State
Revenue
Carbon County 1,957 2,936 $62.6 $0.31 $4.8 701 2,344 $65.5 $0.33 $5.0 Emery County 1,309 1,964 $47.4 $0.09 $3.5 1,220 2,186 $132.1 $0.26 $9.9 Sevier County 751 1,127 $18.2 $0.09 $1.4 548 1,200 $42.7 $0.21 $3.3 Coal Counties 4,017 6,026 $128.2 $0.50 $9.8 2,469 5,730 $240.3 $0.81 $18.2 Rest of State 686 1,029 $68.1 $0.27 $5.3 1,055 2,794 $186.3 $0.75 $14.5 Total State 4,703 7,055 $196.3 $0.77 $15.0 3,524 8,524 $426.6 $1.55 $32.7
Share of Total Employment Population Earnings Local
Revenue State
Revenue Employment Population Earnings Local
Revenue State
Revenue
Carbon County 41.6% 41.6% 31.9% 40.6% 31.9% 19.9% 27.5% 15.4% 21.1% 15.3% Emery County 27.8% 27.8% 24.1% 12.3% 23.5% 34.6% 25.6% 31.0% 17.0% 30.2% Sevier County 16.0% 16.0% 9.3% 11.8% 9.4% 15.6% 14.1% 10.0% 13.8% 10.2% Coal Counties 85.4% 85.4% 65.3% 64.7% 64.8% 70.1% 67.2% 56.3% 51.9% 55.7% Rest of State 14.6% 14.6% 34.7% 35.3% 35.2% 29.9% 32.8% 43.7% 48.1% 44.3% Total State 100% 100% 100% 100% 100% 100% 100% 100% 100% 100% Note: Pink shading indicates the area’s share of the category is projected to be smaller in 2030 than in 2007; green shading indicates it is projected to be larger. Sources: Economic and demographic impacts generated using the REMI model. Revenue impacts generated by BEBR using methods documented in this report.
Table 5.19b Summary Impacts—Changes from 2007 to 2030: Low Scenario
(Dollar Amounts are Millions of Current Dollars)
Levels Percentages
Employment Population Earnings Local
Revenue State
Revenue Employment Population Earnings Local
Revenue State
Revenue
Carbon County –1,256 –592 $2.9 $0.01 $0.2 –64.2% –20.1% 4.6% 4.6% 4.6% Emery County –89 223 $84.7 $0.17 $6.3 –6.8% 11.3% 178.6% 178.6% 178.6% Sevier County –203 74 $24.5 $0.12 $1.9 –27.0% 6.5% 134.3% 134.3% 134.3% Coal Counties –1,548 –296 $112.0 $0.31 $8.4 –38.5% –4.9% 87.4% 61.4% 86.6% Rest of State 369 1,765 $118.2 $0.47 $9.2 53.8% 171.5% 173.7% 173.7% 173.7% Total State –1,179 1,470 $230.2 $0.78 $17.6 –25.1% 20.8% 117.3% 101.0% 117.2% Sources: Economic and demographic impacts generated using the REMI model. Revenue impacts generated by BEBR using methods documented in this report.

The Structure and Economic Impact of Utah’s Coal Industry
B U R E A U O F E C O N O M I C A N D B U S I N E S S R E S E A R C H 133
Table 5.20a Summary Impacts: Middle Scenario (Dollar Amounts are Millions of Current Dollars)
2007 2030
Employment Population Earnings Local
Revenue State
Revenue Employment Population Earnings Local
Revenue State
Revenue
Carbon County 1,957 2,936 $62.6 $0.31 $4.8 977 2,967 $91.9 $0.46 $7.0 Emery County 1,309 1,964 $47.4 $0.09 $3.5 1,616 2,720 $175.1 $0.35 $13.1 Sevier County 751 1,127 $18.2 $0.09 $1.4 552 1,208 $43.0 $0.21 $3.3 Coal Counties 4,017 6,026 $128.2 $0.50 $9.8 3,145 6,895 $310.0 $1.02 $23.5 Rest of State 686 1,029 $68.1 $0.27 $5.3 1,285 3,263 $232.9 $0.93 $18.1 Total State 4,703 7,055 $196.3 $0.77 $15.0 4,430 10,158 $542.8 $1.96 $41.6
Share of Total Employment Population Earnings Local
Revenue State
Revenue Employment Population Earnings Local
Revenue State
Revenue
Carbon County 41.6% 41.6% 31.9% 40.6% 31.9% 22.1% 29.2% 16.9% 23.5% 16.9% Emery County 27.8% 27.8% 24.1% 12.3% 23.5% 36.5% 26.8% 32.3% 17.9% 31.5% Sevier County 16.0% 16.0% 9.3% 11.8% 9.4% 12.5% 11.9% 7.9% 11.0% 8.0% Coal Counties 85.4% 85.4% 65.3% 64.7% 64.8% 71.0% 67.9% 57.1% 52.4% 56.4% Rest of State 14.6% 14.6% 34.7% 35.3% 35.2% 29.0% 32.1% 42.9% 47.6% 43.6% Total State 100% 100% 100% 100% 100% 100% 100% 100% 100% 100% Note: Pink shading indicates the area’s share of the category is projected to be smaller in 2030 than in 2007; green shading indicates it is projected to be larger. Sources: Economic and demographic impacts generated using the REMI model. Revenue impacts generated by BEBR using methods documented in this report.
Table 5.20b Summary Impacts—Changes from 2007 to 2030: Middle Scenario
(Dollar Amounts are Millions of Current Dollars)
Levels Percentages
Employment Population Earnings Local
Revenue State
Revenue Employment Population Earnings Local
Revenue State
Revenue
Carbon County –980 32 $29.3 $0.15 $2.2 –50.1% 1.1% 46.7% 46.7% 46.7% Emery County 307 757 $127.7 $0.26 $9.5 23.5% 38.5% 269.3% 269.3% 269.3% Sevier County –199 82 $24.8 $0.12 $1.9 –26.5% 7.2% 135.7% 135.7% 135.7% Coal Counties –872 870 $181.7 $0.53 $13.7 –21.7% 14.4% 141.7% 105.3% 140.5% Rest of State 599 2,234 $164.8 $0.66 $12.8 87.3% 217.1% 242.1% 242.1% 242.1% Total State –273 3,104 $346.5 $1.18 $26.5 –5.8% 44.0% 176.5% 153.6% 176.2% Sources: Economic and demographic impacts generated using the REMI model. Revenue impacts generated by BEBR using methods documented in this report.

The Structure and Economic Impact of Utah’s Coal Industry
134 B U R E A U O F E C O N O M I C A N D B U S I N E S S R E S E A R C H
Table 5.21a Summary Impacts: High Scenario (Dollar Amounts are Millions of Current Dollars)
2007 2030
Employment Population Earnings Local
Revenue State
Revenue Employment Population Earnings Local
Revenue State
Revenue
Carbon County 1,957 2,936 $62.6 $0.31 $4.8 1,378 3,758 $130.7 $0.65 $10.0 Emery County 1,309 1,964 $47.4 $0.09 $3.5 2,214 3,457 $240.2 $0.48 $17.9 Sevier County 751 1,127 $18.2 $0.09 $1.4 558 1,218 $43.4 $0.22 $3.4 Coal Counties 4,017 6,026 $128.2 $0.50 $9.8 4,150 8,433 $414.3 $1.35 $31.3 Rest of State 686 1,029 $68.1 $0.27 $5.3 1,625 3,883 $305.1 $1.22 $23.7 Total State 4,703 7,055 $196.3 $0.77 $15.0 5,775 12,316 $719.4 $2.57 $55.1
Share of Total Employment Population Earnings Local
Revenue State
Revenue Employment Population Earnings Local
Revenue State
Revenue
Carbon County 41.6% 41.6% 31.9% 40.6% 31.9% 23.9% 30.5% 18.2% 25.4% 18.2% Emery County 27.8% 27.8% 24.1% 12.3% 23.5% 38.3% 28.1% 33.4% 18.7% 32.6% Sevier County 16.0% 16.0% 9.3% 11.8% 9.4% 9.7% 9.9% 6.0% 8.4% 6.1% Coal Counties 85.4% 85.4% 65.3% 64.7% 64.8% 71.9% 68.5% 57.6% 52.5% 56.9% Rest of State 14.6% 14.6% 34.7% 35.3% 35.2% 28.1% 31.5% 42.4% 47.5% 43.1% Total State 100% 100% 100% 100% 100% 100% 100% 100% 100% 100% Note: Pink shading indicates the area’s share of the category is projected to be smaller in 2030 than in 2007; green shading indicates it is projected to be larger. Sources: Economic and demographic impacts generated using the REMI model. Revenue impacts generated by BEBR using methods documented in this report.
Table 5.21b Summary Impacts—Changes from 2007 to 2030: High Scenario
(Dollar Amounts are Millions of Current Dollars)
Levels Percentages
Employment Population Earnings Local
Revenue State
Revenue Employment Population Earnings Local
Revenue State
Revenue
Carbon County –579 823 $68.1 $0.34 $5.2 –29.6% 28.0% 108.7% 108.7% 108.7% Emery County 905 1,494 $192.8 $0.39 $14.4 69.1% 76.1% 406.7% 406.7% 406.7% Sevier County –193 92 $25.1 $0.13 $2.0 –25.7% 8.1% 137.9% 137.9% 137.9% Coal Counties 133 2,408 $286.0 $0.85 $21.6 3.3% 40.0% 223.0% 170.7% 221.1% Rest of State 939 2,854 $237.0 $0.95 $18.4 136.9% 277.4% 348.2% 348.2% 348.2% Total State 1,072 5,262 $523.0 $1.80 $40.0 22.8% 74.6% 266.4% 233.3% 265.9% Sources: Economic and demographic impacts generated using the REMI model. Revenue impacts generated by BEBR using methods documented in this report.

The Structure and Economic Impact of Utah’s Coal Industry
B U R E A U O F E C O N O M I C A N D B U S I N E S S R E S E A R C H 135
Figure 5.7a Low Scenario Employment Impacts
-
1,000
2,000
3,000
4,000
5,000
6,000
7,000
2007
2009
2011
2013
2015
2017
2019
2021
2023
2025
2027
2029
Em
plo
ym
en
t Im
pact
sNon-Coal CountiesSevierEmeryCarbon
Source: Bureau of Economic and Business Research, University of Utah analysis using the REMI model.
Figure 5.7b Middle Scenario Employment Impacts
-
1,000
2,000
3,000
4,000
5,000
6,000
7,000
2007
2009
2011
2013
2015
2017
2019
2021
2023
2025
2027
2029
Em
plo
ym
en
t Im
pact
s
Non-Coal Counties
SevierEmery
Carbon
Source: Bureau of Economic and Business Research, University of Utah analysis using the REMI model.

The Structure and Economic Impact of Utah’s Coal Industry
136 B U R E A U O F E C O N O M I C A N D B U S I N E S S R E S E A R C H
Figure 5.7c High Scenario Employment Impacts
-
1,000
2,000
3,000
4,000
5,000
6,000
7,000
2007
2009
2011
2013
2015
2017
2019
2021
2023
2025
2027
2029
Em
plo
ym
en
t Im
pact
s
Carbon EmerySevier Non-Coal Counties
Source: Bureau of Economic and Business Research, University of Utah analysis using the REMI model.

The Structure and Economic Impact of Utah’s Coal Industry
B U R E A U O F E C O N O M I C A N D B U S I N E S S R E S E A R C H 137
P O W E R P L A N T I M PAC T S No discussion of the economic impacts of Utah coal production would be complete without consideration of electricity generation from coal plants. Certainly these plants are, at present, the greatest source of demand for Utah coal. In 2007, a record volume of coal was delivered to elec-tric utilities located in Utah. According to Michael Vanden Berg of the Utah Geological Survey, no new plants are expected to be built for the foreseeable future, so the demand should remain relatively flat.70 Employment in Utah’s coal-fired power plants (NAICS 221112) and annual coal production (in millions of tons) are shown in Figure 6.1. Employment in these power plants has remained around 1,100 recently.
Figure 6.1
Utah Coal Production and Power Plant Employment, 2000–2008
1,102
1,000
1,020
1,040
1,060
1,080
1,100
1,120
2000
2001
2002
2003
2004
2005
2006
2007
2008
Po
wer
Pla
nt
Em
plo
ym
en
t
20.0
21.0
22.0
23.0
24.0
25.0
26.0
27.0
28.0
Co
al
Pro
du
cti
on
(Mill
ions
of
Tons)
EmploymentProduction
Sources: Utah Department of Workforce Services and Utah Geological Survey.
The operators, locations, 2007 employment, and names of Utah coal-fired power plants are shown in Table 6.1 below.
70 Michael D. Vanden Berg, Annual Review and Forecast of Utah Coal Production and Distribution—2007, Circular 107, Utah Geological Survey, 2008.
6

The Structure and Economic Impact of Utah’s Coal Industry
138 B U R E A U O F E C O N O M I C A N D B U S I N E S S R E S E A R C H
Table 6.1 2007 Employment in Utah’s Coal-Fired Power Plants
(NAICS 221112)
Company Place County Employment Name COSI Sunnyside Inc. Sunnyside Carbon 20–49 Sunnyside Deseret Generation and Transmission Vernal Uintah 100–249 Bonanza Downtown Plant Provo Utah 10–19 Granger III & Associates, LLC South Jordan Salt Lake 1–4 Intermountain Power Agency South Jordan Salt Lake 10–19 Intermountain Power Service Corp. Delta Millard 250–499 IPP PacifiCorp Castle Dale Emery 100–249 Hunter PacifiCorp Huntington Emery 100–249 Huntington PacifiCorp Salt Lake City Salt Lake 20–49 PacifiCorp Price Carbon 20–49 Carbon Payson City Payson Utah 10–19 Siemens Power Transmission &
Distribution Kaysville Davis 1–4 Utah Associated Municipal Power
System Salt Lake City Salt Lake 20–49 Source: Utah Department of Workforce Services.
Average annual employment in 2007 was 1,100. The distribution of employment that was as-sumed for this analysis is shown in Table 6.2. 6.1 Middle Scenario Impacts
The economic and demographic impacts of power plant employment for 2007 and for projections from 2008 through 2030 have been evaluated here using the REMI 29-region, 23-sector model built for Utah. The population and economy of each county in Utah is represented in the model. The sum of the impacts of all counties is equivalent to the state impact. Direct economic activity for 2007 and beyond were imputed to the power plant counties according to actual production employment lev-els in 2007 and a scenario into the future. Impact models like REMI are built using historical data from the areas that are modeled. Economic impacts depend upon the structure of the local economy and the specific employment and spending patterns associ-ated with the export base activity. The most accurate impact estimates are possible when the producers provide actual in-region spending patterns (including labor and purchases from in-region firms). In this REMI model, there is a single “utilities” sector, which includes all types of utilities, including coal-fired electric generation plants. The technical coefficients are based on national input-output models, last calibrated in 2007. For this analysis, power plant employment estimates by county were entered as an input. The utilities sector compensation in the REMI model was adjusted to match statewide reported wages for the industry (NAICS 221112). Wages per job in 2007 in this sector were reported to be $83,440 by the Department of Workforce Ser-vices, significantly higher than Utah average wages. For the midlevel scenario, analysts at the Utah Geological Survey indicated that no new coal plants would be built, and that employment would remain constant at existing plants. This im-
Table 6.2 2007
Employment in Coal-Fired
Power Plants by County
County Jobs Carbon 70 Davis 3 Emery 354 Millard 380 Salt Lake 86 Uintah 177 Utah 30 Total 1,100 Source: BEBR estimates from DWS data.

The Structure and Economic Impact of Utah’s Coal Industry
B U R E A U O F E C O N O M I C A N D B U S I N E S S R E S E A R C H 139
plies that labor productivity will remain constant. This assumption was made in the utilities in-dustry in the power plant counties. Employment was assumed constant from 2007 through 2030. 6.1.1 State-Level Scenario Impacts
Impact results for the midlevel scenario for the state of Utah are shown in three tables. State-wide employment impacts rise from 8,368 in 2007 to 10,387 in 2030. Given the power plant’s direct employment of 1,100, these are very high total employment impacts, a ratio of 7.6 to 1. This is because of the high wages of the industry in combination with the in-state purchases re-quired by the plants. Importantly, the coal purchases are not included in these impacts. They are in addition. In a recent study of the Intermountain Power Plant, the plant operator provided very detailed primary data on its operations to the researcher. That study showed a ratio of 9.9 to 1 between direct employment at the power plant and the total employment generated (excluding coal min-
ing). So the results are quite con-sistent with the model-based ap-proach used in this study.71 In this middle scenario, popula-tion impacts increase from 12,552 in 2007 to reach 28,510 in 2030. Nominal earnings, local tax reve-nue, and state tax revenue im-pacts are all higher in 2030 than in 2007. From 2007 to 2030, nominal earnings impacts in-crease from $346.4 million to $1,179.7 million in 2030. Over the same period, nominal local government revenue impacts in-crease from $1.4 million to $4.6 million. Nominal state govern-ment revenue impacts increase from $24.5 million in 2007 to $83.3 million in 2030 (Table 6.3a). Detailed employment impacts are shown in Table 6.3b. In 2007, services accounts for 27.5 percent of the total employment impact or 2,300 jobs. State and local government account for 25 per-cent of the employment impact or 2,074 jobs. Natural resources,
71 Jan Crispin-Little, “The Economic and Fiscal Impacts of Expanding the Intermountain Power Project,” Utah Economic and Business Review, September/October 2003.
Table 6.3a Power Plants, Middle Scenario:
Summary Impacts (Dollar Amounts are Millions of Current Dollars)
Year Employment Population Earnings Local
Revenue State
Revenue 2007 8,368 12,552 $346.4 $1.4 $24.5 2008 8,804 13,206 $375.1 $1.5 $26.5 2009 9,120 13,680 $398.7 $1.6 $28.2 2010 9,232 13,848 $410.7 $1.6 $29.0 2011 9,293 13,940 $431.5 $1.7 $30.5 2012 9,333 14,000 $452.7 $1.8 $32.0 2013 9,344 15,256 $474.7 $1.9 $33.5 2014 9,363 16,767 $497.8 $2.0 $35.2 2015 9,386 18,139 $523.6 $2.1 $37.0 2016 9,402 19,367 $548.9 $2.2 $38.8 2017 9,428 20,481 $575.1 $2.3 $40.6 2018 9,489 21,480 $605.6 $2.4 $42.8 2019 9,559 22,410 $638.8 $2.5 $45.1 2020 9,636 23,267 $674.5 $2.7 $47.7 2021 9,738 24,068 $714.1 $2.8 $50.4 2022 9,827 24,797 $755.6 $3.0 $53.4 2023 9,919 25,465 $800.4 $3.1 $56.5 2024 10,010 26,072 $847.4 $3.3 $59.9 2025 10,089 26,616 $896.7 $3.5 $63.4 2026 10,166 27,086 $948.8 $3.7 $67.0 2027 10,236 27,515 $1,003.0 $3.9 $70.9 2028 10,295 27,897 $1,059.6 $4.2 $74.9 2029 10,345 28,227 $1,118.4 $4.4 $79.0 2030 10,387 28,510 $1,179.7 $4.6 $83.3
Notes: Historical data for 2007, projections from 2008 through 2030. Earnings is by place of work, not place of residence. Employment is a jobs count consistent with the Bureau of Economic Analysis definition and also measured at the place of work. State revenue impacts are income taxes, sales taxes, and other taxes. Local revenue impacts are total general sales and use taxes and restaurant taxes. Sources: Economic and demographic impacts generated using the REMI model. Revenue impacts generated by BEBR using methods documented in this report.

The Structure and Economic Impact of Utah’s Coal Industry
140 B U R E A U O F E C O N O M I C A N D B U S I N E S S R E S E A R C H
mining, construction and utilities (especially utilities) account for 22.5 percent of the total em-ployment impacts or 1,881 jobs. The balance of the impact is in trade (16 percent), transporta-tion, finance, information, and accounting (8 percent), and manufacturing (less than 2 percent). Over the projection period, services accounts for nearly 70 percent of the 2,020-job increase in employment impacts, with 1,389 additional jobs. The projected occupational distribution of these impacts across time is shown in Table 6.3c. Because of the speculative nature of the specific location and type of power plant construction and closure, the high and low scenarios were not modeled for this part of the study.
Table 6.3b
Power Plants, Middle Scenario: Detailed Employment Impacts
Change Employment by Industry 2007 2010 2015 2020 2025 2030 Level Percent Natural Resources, Mining, Utilities, Construction 1,881 2,257 2,076 1,895 1,831 1,794 –87 –4.6% Forestry, Fishing, Other 3 1 0 1 3 5 2 66.7% Mining 39 35 34 35 34 30 –9 –23.1% Utilities 1,105 1,108 1,109 1,111 1,114 1,116 11 1.0% Construction 734 1,113 933 748 680 643 –91 –12.4% Manufacturing 110 96 83 90 101 109 –1 –0.9% Trade 1,330 1,328 1,359 1,419 1,492 1,532 202 15.2% Wholesale Trade 124 119 111 108 105 99 –25 –20.2% Retail Trade 1,206 1,209 1,248 1,311 1,387 1,433 227 18.8% Transportation, Information, Finance, Accounting 672 687 639 635 657 664 –8 –1.2% Transportation and Warehousing 137 131 118 117 124 130 –7 –5.1% Information 66 70 70 72 74 74 8 12.1% Finance, Insurance 317 287 235 216 210 201 –116 –36.6% Real Estate, Rental, Leasing 152 199 216 230 249 259 107 70.4% Services 2,300 2,557 2,788 3,082 3,429 3,689 1,389 60.4% Professional and Technical Services 336 382 392 412 441 460 124 36.9% Management of Companies / Enterprises 32 31 28 29 31 30 –2 –6.3% Administrative and Waste Services 451 474 461 453 455 445 –6 –1.3% Educational Services 58 74 92 114 137 156 98 169.0% Health Care and Social Assistance 604 633 698 808 951 1,081 477 79.0% Arts, Entertainment, Recreation 72 90 110 132 155 171 99 137.5% Accommodation and Food Services 364 477 604 699 781 836 472 129.7% Other Services (excl Gov) 383 396 403 435 478 510 127 33.2% Public Administration 2,074 2,308 2,440 2,516 2,577 2,599 525 25.3% State & Local Government 2,074 2,308 2,440 2,516 2,577 2,599 525 25.3% State Government 399 443 454 460 469 472 73 18.3% Local Government 1,675 1,865 1,986 2,056 2,108 2,127 452 27.0% Federal Civilian 0 0 0 0 0 0 0 N/A Federal Military 0 0 0 0 0 0 0 N/A Farm 0 0 0 0 0 0 0 N/A TOTAL EMPLOYMENT 8,367 9,233 9,385 9,637 10,087 10,387 2,020 24.1% Notes: Historical data for 2007, projections from 2008 through 2030. Columns may not sum to totals due to rounding. Employment is a jobs count consistent with the Bureau of Economic Analysis definition and measured at the place of work (rather than residence). Source: Analysis generated by the Bureau of Economic and Business Research, University of Utah, using the REMI Model.

The Structure and Economic Impact of Utah’s Coal Industry
B U R E A U O F E C O N O M I C A N D B U S I N E S S R E S E A R C H 141
Table 6.3c Power Plants, Middle Scenario: Detailed Occupational Impacts
Change Employment by Occupation 2007 2010 2015 2020 2025 2030 Level Percent Management, Business, Financial 761 831 826 834 860 873 112 14.7% Computer, Math, Architect, Engineer 375 403 412 424 440 450 75 20.0% Life, Physical, Social Science 89 96 100 103 107 110 21 23.6% Community, Social Service 199 218 232 248 267 282 83 41.7% Legal 85 94 98 101 105 107 22 25.9% Education, Training, Library 124 142 161 182 206 226 102 82.3% Arts, Design, Entertainment, Sports, Media 66 73 76 81 87 90 24 36.4% Healthcare 458 487 525 587 665 733 275 60.0% Protective Service 523 587 629 655 679 691 168 32.1% Food Preparation, Serving-Related 368 466 577 663 741 795 427 116.0% Building, Grounds, Personal Care, Service 488 538 573 617 670 708 220 45.1% Sales, Office, Administrative 1,618 1,728 1,692 1,699 1,745 1,760 142 8.8% Farm, Fishing, Forestry 11 11 11 12 14 15 4 36.4% Construction, Extraction 715 983 871 754 714 690 –25 –3.5% Installation, Maintenance, Repair 554 603 605 608 621 630 76 13.7% Production 350 359 357 365 378 386 36 10.3% Transportation, Material Moving 378 404 392 392 403 407 29 7.7% Notes: Historical data for 2007, projections from 2008 through 2030. Columns may not sum to totals due to rounding. Employment is a jobs count consistent with the Bureau of Economic Analysis definition and measured at the place of work (rather than residence). Source: Analysis generated by the Bureau of Economic and Business Research, University of Utah, using the REMI Model.

The Structure and Economic Impact of Utah’s Coal Industry
142 B U R E A U O F E C O N O M I C A N D B U S I N E S S R E S E A R C H
A D D I T I O N A L F I S C A L I M PAC T S In addition to employment and wage impacts, the coal industry also has fiscal impacts on the local areas in which it operates. Fiscal impacts refer to impacts on government finances and tax collections. The coal industry is subject to the tax laws common to all businesses; there are also impacts unique to the industry. Production on federal land is subject to a royalty payment under the Mineral Lands Leasing Act of 1920. This royalty is paid to the Minerals Management Service, an agency within the U.S. De-partment of Interior. A portion of the federal mineral royal-ties is returned to the state of origin, generally one-half. Royalties from production on Indian lands are returned to the appropriate tribe, not to the state government. The states have full discretion as to the distribution of federal mineral royalties as long as priority is given to areas with economic and/or social impacts from leasing activities. The Minerals Management Service does not release federal mineral roy-alty data at the county level, but statewide data are available. Federal mineral royalties due to coal production in Utah have decreased in recent years, from $33.2 million in fiscal year 2001 to less than $23.0 million in 2008 (Table 7.1). Coal production accounted for just 5 percent of the royal-ties paid for mineral production on federal land in Utah in 2008. There was also an additional $905,500 paid in bo-nuses and rents on federal mineral leases. These are fees associated with awarding federal mineral leases and maintaining the leases until production is initiated. Table 7.1 includes royalties due to coal production, but does not include bonus or rent payments for federal coal leases. Of the $23.0 million paid in federal mineral royalties by the coal industry in Utah, $12.0 million was returned to the state government. In Utah, federal mineral royalties are distributed to several different accounts according to state law (Table 7.2). The largest recipients of federal mineral royalties in Utah are the Utah Depart-
ment of Transportation and the Permanent Community Impact Fund. The funds dis-tributed to UDOT are then distributed to local governments to fund local highways in proportion to the amount of mineral lease money generated by each county. The Per-manent Community Impact Fund makes loans and grants to state agencies and sub-divisions of the state impacted by mineral resource development. Unlike the funds administered by UDOT, which are distrib-uted in proportion to royalties generated in the county, the Permanent Community Im-pact Fund is distributed by a state-appointed
7
Table 7.1 Federal Coal Royalty
Payments and Disbursements to Utah,
2001–2008 (Constant 2008 Dollars)
Year Royalties
Paid to U.S. Disbursed
to Utah 2001 $33,205,069 $17,594,615 2002 $25,599,536 $12,957,504 2003 $25,034,853 $10,534,127 2004 $28,196,683 $15,044,196 2005 $30,681,304 $15,347,252 2006 $29,037,311 $14,247,010 2007 $25,595,118 $12,752,867 2008 $22,955,578 $12,006,072
Years are federal fiscal years. Source: U.S. Department of the Interior, Minerals Management Service.
Table 7.2 Distribution of Federal Mineral Royalties
in Utah
Recipient Share Department of Transportation 40.0% Permanent Community Impact Fund 32.5% Department of Community and Culture 5.0% State Board of Education 2.25% Utah Geological Survey 2.25% Water Research Laboratory 2.25% Payments in Lieu of Taxes 52¢ per acre Permanent Community Impact Fund Remainder Note: The amount paid for Payments in Lieu of Taxes has been adjusted annually since 1994 according to the Consumer Price Index. Source: Utah State Code, Title 59, Chapter 21.

The Structure and Economic Impact of Utah’s Coal Industry
B U R E A U O F E C O N O M I C A N D B U S I N E S S R E S E A R C H 143
board in response to proposals submitted by county and municipal governments, taxing districts, and other authorities. Therefore, the distribution of funds by the Permanent Community Impact Fund to the various counties may vary from the amount of royalty generated. The payments in lieu of taxes cited in Table 7.2 are not those made by the federal government for federal land in Utah but are payments made by the state government to counties for lands controlled by the
School and Institutional Trust Lands Administra-tion, the Division of Parks and Recreation, and the Division of Wildlife Resources. The School and Institutional Trust Lands Ad-ministration (SITLA) controls mineral rights on approximately 4.4 million acres in Utah. These lands are held in trust for Utah’s public schools and 11 other beneficiaries. They were established at statehood and through land exchanges with the federal government. During fiscal year 2008, royalties paid for coal mining on SITLA lands totaled $10.5 million (Table 7.3). This was 7 per-cent of total SITLA revenue for the year. These funds are not returned to the county of origin, but are placed in a permanent fund managed by the state treasurer on behalf of the public schools or distributed to the appropriate beneficiary as mandated. Dividends and interest from the Pub-
lic School Fund are distributed annually to all Utah public schools based on an established formula. The individual counties levy property taxes on natural resources developed within their borders, including coal, metallic minerals, and oil and gas. The Utah State Tax Commission centrally as-sesses coal properties based on the discounted cash flow of expected future production. The local county treasurers bill and collect the taxes. Property taxes are levied by numerous units of local government, including county and city governments, school districts, and special service districts. Table 7.4 shows property taxes charged against coal mines in Carbon, Emery, and Sevier counties from 2000 to 2008. These three counties account for more than 99 percent of coal property taxes in the state. Over the period, total taxes paid to the three counties were fairly constant, fluctuating between $4.1 million and $4.6 million, with a spike to $5.6 million in 2006 (all amounts are in constant 2008 dollars). Coal property taxes in Carbon County were only slightly higher in 2008 ($2.1 million) than they were in 2000 ($1.9 million). In Sevier County, coal taxes were essentially unchanged in 2008 compared with 2000, at roughly $1.2 million. However, Emery County saw coal property taxes decline from $1.3 million in 2000 to $824,000 in 2008.
Table 7.3 Rents and Royalties Paid for Coal
Production on SITLA Lands, 2000–2008
(Constant 2008 Dollars)
Year Revenues Garfield Co. Total 2000 $5,269,226 $30,917 $5,300,143 2001 $7,421,084 $181,948 $7,603,032 2002 $7,598,359 $118,340 $7,716,699 2003 $4,750,554 $109,505 $4,860,059 2004 $3,988,161 $113,029 $4,101,189 2005 $1,666,740 $1,666,740 2006 $5,084,333 $5,084,333 2007 $7,069,694 $7,069,694 2008 $10,546,508 $10,546,508
Years are fiscal years, July 1 to June 30. Revenues consist of lease rentals, royalties, and bonus payments from coal mines on trust lands in Carbon, Emery, and Sevier counties. The Garfield County lease was a special business arrangement that terminated in 2004 without any coal production. Source: School and Institutional Trust Lands Administration.
Table 7.4 Property Taxes Charged Against Coal Mines,
2000–2008 (Constant 2008 Dollars)
Year Carbon Emery Sevier Total 2000 $1,919,753 $1,341,346 $1,207,865 $4,468,964 2001 $1,984,907 $1,112,081 $1,214,826 $4,311,814 2002 $1,916,019 $1,107,510 $1,088,523 $4,112,052 2003 $2,319,574 $1,041,682 $1,052,776 $4,414,032 2004 $2,176,454 $1,306,930 $1,131,553 $4,614,936 2005 $1,719,635 $1,018,394 $1,636,483 $4,374,512 2006 $2,690,528 $1,024,162 $1,885,720 $5,600,411 2007 $2,449,053 $605,127 $1,336,949 $4,391,130 2008 $2,121,553 $824,366 $1,241,458 $4,187,377
Source: Utah State Tax Commission, Property Tax Division Annual Reports.
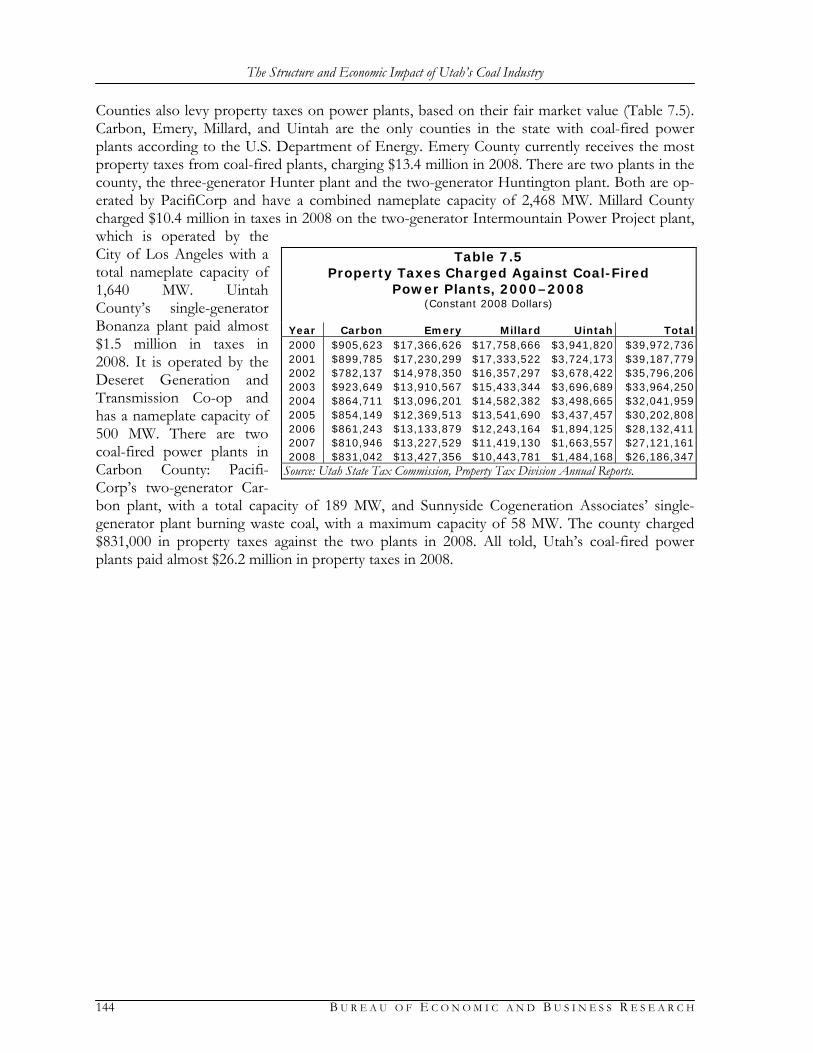
The Structure and Economic Impact of Utah’s Coal Industry
144 B U R E A U O F E C O N O M I C A N D B U S I N E S S R E S E A R C H
Counties also levy property taxes on power plants, based on their fair market value (Table 7.5). Carbon, Emery, Millard, and Uintah are the only counties in the state with coal-fired power plants according to the U.S. Department of Energy. Emery County currently receives the most property taxes from coal-fired plants, charging $13.4 million in 2008. There are two plants in the county, the three-generator Hunter plant and the two-generator Huntington plant. Both are op-erated by PacifiCorp and have a combined nameplate capacity of 2,468 MW. Millard County charged $10.4 million in taxes in 2008 on the two-generator Intermountain Power Project plant, which is operated by the City of Los Angeles with a total nameplate capacity of 1,640 MW. Uintah County’s single-generator Bonanza plant paid almost $1.5 million in taxes in 2008. It is operated by the Deseret Generation and Transmission Co-op and has a nameplate capacity of 500 MW. There are two coal-fired power plants in Carbon County: Pacifi-Corp’s two-generator Car-bon plant, with a total capacity of 189 MW, and Sunnyside Cogeneration Associates’ single-generator plant burning waste coal, with a maximum capacity of 58 MW. The county charged $831,000 in property taxes against the two plants in 2008. All told, Utah’s coal-fired power plants paid almost $26.2 million in property taxes in 2008.
Table 7.5 Property Taxes Charged Against Coal-Fired
Power Plants, 2000–2008 (Constant 2008 Dollars)
Year Carbon Emery Millard Uintah Total 2000 $905,623 $17,366,626 $17,758,666 $3,941,820 $39,972,736 2001 $899,785 $17,230,299 $17,333,522 $3,724,173 $39,187,779 2002 $782,137 $14,978,350 $16,357,297 $3,678,422 $35,796,206 2003 $923,649 $13,910,567 $15,433,344 $3,696,689 $33,964,250 2004 $864,711 $13,096,201 $14,582,382 $3,498,665 $32,041,959 2005 $854,149 $12,369,513 $13,541,690 $3,437,457 $30,202,808 2006 $861,243 $13,133,879 $12,243,164 $1,894,125 $28,132,411 2007 $810,946 $13,227,529 $11,419,130 $1,663,557 $27,121,161 2008 $831,042 $13,427,356 $10,443,781 $1,484,168 $26,186,347
Source: Utah State Tax Commission, Property Tax Division Annual Reports.

The Structure and Economic Impact of Utah’s Coal Industry
B U R E A U O F E C O N O M I C A N D B U S I N E S S R E S E A R C H 145
S O C I O E C O N O M I C P RO F I L E S 8.1 Demographic Overview
8.1.1 Carbon County
8.1.1.1 Population Growth: Trends and Components of Change The Carbon County resident population has fluctuated with the booms and busts of the coal industry (Exhibit 8.1). Considering the period since 1940, population peaked at 24,800 in 1950, declined to a low of 15,750 in 1970, again increased until it peaked at 24,300 in 1982, declined to 20,169 in 1990, and has remained essentially flat since then. Population was estimated to be 19,841 in 2008. The rate of population decline averaged a negative 0.1 percent from 1990 through 2008, while cumulative net out-migration since 1990 totaled 2,485 and cumulative natu-ral increase was 2,157. With the exception of the period of sustained net in-migration from 1971 through 1982, Carbon County has experienced nearly continuous net out-migration since 1940. From 2006 through 2008, net migration has turned slightly positive and the growth rate in the county has accelerated to average 0.9 percent annually over this most recent three-year period. 8.1.1.2 Age Structure The age structure of Carbon County is one that is common to many rural communities (Exhibit 8.2). There is a smaller share of the population in the ages after high school graduation and through the young prime working ages, as compared with the state. This is consistent with out-migration from the county for educational and economic opportunities. Unlike many rural coun-ties in Utah, the share of school-age persons in the population is lower than in the state in gen-eral. The county has a greater share of persons in all five-year age groups from 40 years old and older. In the 2000 enumeration, the median age was 33.6, which is higher than 27.1 for the state. The share of the county population 60 years and older was 16.8 percent, as compared with 11.3 percent for the state. The male-to-female ratio is particularly high for five-year age groups 40 through 54 years old. A drop in the male-to-female ratio in the 15-through-19-year-old age group is evidence of males having left the county, possibly for reasons of religious service. 8.1.1.3 Race and Ethnicity The estimated population of Carbon County for July 1, 2006 was 19,504, which was a decline of 918 persons or 4.5 percent since April 1, 2000 (versus a 17.1 percent increase for the state over the same period) (Table 8.1). The minority population (defined as Hispanics or Latinos and all non-Whites) was estimated in 2006 to be 2,846, or 14.6 percent of the population (compared with 17.4 percent for the state), ranking it fifth among all 29 counties for minority share. The 2006 estimated minority population represented an increase of 3.5 percent from 2000 to 2006, while the White Alone, Not Hispanic population declined by 5.7 percent. The largest minority group is the population of those identifying themselves as Hispanic or Latino, which was esti-mated in 2006 to be 2,079 persons, or 10.7 percent of the population. From 2000 to 2006, the Hispanic population in Carbon County is estimated to have decreased slightly.
8

The Structure and Economic Impact of Utah’s Coal Industry
146 B U R E A U O F E C O N O M I C A N D B U S I N E S S R E S E A R C H
Exhibit 8.1 Carbon County Population Estimates and Components of Population Change, 1940–2008
Population FY
Births FY
Deaths Natural
Increase Net In-
Migration 1940 18,700 437 118 319 0 1941 17,800 420 137 283 –1,183 1942 18,100 446 136 310 –10 1943 19,100 505 152 353 647 1944 21,000 560 143 417 1,483 1945 22,600 594 205 389 1,211 1946 22,100 617 142 475 –975 1947 20,700 796 167 629 –2,029 1948 22,700 784 181 603 1,397 1949 24,000 797 164 633 667 1950 24,800 835 185 650 150 1951 24,400 743 155 588 –988 1952 23,100 639 132 507 –1,807 1953 23,000 650 138 512 –612 1954 22,900 653 153 500 –600 1955 22,800 612 155 457 –557 1956 22,500 632 156 476 –776 1957 22,400 621 137 484 –584 1958 22,000 616 170 446 –846 1959 21,800 597 142 455 –655 1960 21,200 479 168 311 –911 1961 20,400 453 141 312 –1,112 1962 19,700 393 140 253 –953 1963 18,700 373 137 236 –1,236 1964 17,700 321 166 155 –1,155 1965 17,300 264 189 75 –475 1966 16,900 256 181 75 –475 1967 16,800 234 161 73 –173 1968 16,400 270 140 130 –530 1969 16,100 254 125 129 –429 1970 15,750 244 152 92 –442 1971 16,650 288 166 122 778 1972 17,200 278 156 122 428 1973 17,550 312 181 131 219 1974 17,900 359 182 177 173 1975 18,750 373 163 210 640 1976 19,450 447 177 270 430 1977 20,150 501 184 317 383 1978 20,750 522 191 331 269 1979 21,350 588 152 436 164 1980 22,400 615 188 427 623 1981 23,000 580 170 410 190 1982 24,300 595 173 422 878 1983 24,100 591 199 392 –592 1984 23,100 501 159 342 –1,342 1985 22,800 425 166 259 –559 1986 22,300 409 172 237 –737 1987 21,700 400 144 256 –856 1988 21,100 344 158 186 –786 1989 20,400 287 166 121 –821 1990 20,169 310 157 153 –384 1991 20,186 319 156 163 –146 1992 20,361 305 176 129 46 1993 19,771 292 174 118 –708 1994 20,119 291 175 116 232 1995 19,965 286 163 123 –277 1996 20,286 295 193 102 219 1997 20,654 314 183 131 237 1998 20,695 338 208 130 –89 1999 20,500 330 175 155 –350 2000 20,396 329 201 128 –232 2001 19,858 291 179 112 –650 2002 19,858 303 190 113 –113 2003 19,558 303 221 82 –382
0
5,000
10,000
15,000
20,000
25,000
30,000
1940 1950 1960 1970 1980 1990 2000
July
1 P
op
ula
tio
n
0.0%
0.5%
1.0%
1.5%
2.0%
2.5%
3.0%
3.5%
4.0%
4.5%
Sh
are
of
the S
tate
Population
County Share of the State
Population
Source: Utah Population Estimates Committee.
-2,000
-1,500
-1,000
-500
0
500
1,000
1,500
1950 1960 1970 1980 1990 2000
Net In-Migration
Natural Increase
Components of Population Change
Source: Utah Population Estimates Committee.
-6%
-4%
-2%
0%
2%
4%
6%
8%
1950 1960 1970 1980 1990 2000-1,500
-1,000
-500
0
500
1,000
1,500
Percent
Amount
Year-Over Rates and Amounts of Population Change
Source: Utah Population Estimates Committee.
2004 19,385 344 214 130 –303 2005 19,338 300 194 106 –153 2006 19,504 268 163 105 61 2007 19,730 324 202 122 104 2008 19,841 306 214 92 19
Notes: Population estimates for July 1 were produced by the Utah Population Estimates Committee (UPEC). UPEC changed its rounding convention. Estimates before 1990 are rounded while those for 1990 and beyond are not rounded. Birth and death data are from the Utah Bureau of Health Statistics.
Source: Downloaded from http://www.governor.state.ut.us/dea on August 27, 2009.

The Structure and Economic Impact of Utah’s Coal Industry
B U R E A U O F E C O N O M I C A N D B U S I N E S S R E S E A R C H 147
Exhibit 8.2 Carbon County Population by Age and Sex, Race, and Ethnicity: 2000
Age Distribution of the Carbon County Population Race and Ethnicity of the Carbon County Population
Male Female
Sex Ratio Share
Share of State Population Share
Share of State
Under 5 721 758 0.95 7.2% 0.7% Total 20,422 100% 0.9% 5–9 789 731 1.08 7.4% 0.8%
10–14 857 849 1.01 8.4% 0.9% Not Hispanic or Latino 18,325 89.7% 0.9% 15–19 1,016 1,112 0.91 10.4% 1.0% White alone 17,671 86.5% 0.9% 20–24 801 744 1.08 7.6% 0.7% Black or African American alone 52 0.3% 0.3% 25–29 538 565 0.95 5.4% 0.6% American Indian and Alaska Native alone 190 0.9% 0.7% 30–34 491 537 0.91 5.0% 0.7% Asian alone 70 0.3% 0.2% 35–39 623 665 0.94 6.3% 0.9% Native Hawaiian and Other Pacific Islander alone 6 0.0% 0.0% 40–44 803 771 1.04 7.7% 1.1% Some other race alone 24 0.1% 1.2% 45–49 799 739 1.08 7.5% 1.2% Two or more races 312 1.5% 1.0% 50–54 605 588 1.03 5.8% 1.1% Ethnicity 55–59 448 442 1.01 4.4% 1.1% Hispanic or Latino 2,097 10.3% 1.0% 60–64 337 387 0.87 3.5% 1.2% 65–69 309 390 0.79 3.4% 1.3% Minority 2,751 13.5% 0.8% 70–74 315 336 0.94 3.2% 1.4% 75–79 259 355 0.73 3.0% 1.5% 80–84 147 244 0.60 1.9% 1.4%
85 + 123 228 0.54 1.7% 1.6% Total 9,981 10,441 0.96 100% 0.9%
Share 60 years+ 16.8% 1.4% Median Age 33.6 Note: NH is Not Hispanic. If a cell is shaded yellow and has bold red type, this indicates that the county’s share of the state for the given category exceeds the county’s share of total population in the state. Blue shading indicates a male-to-female ratio greater than one. Source: Bureau of the Census, Census 2000, SF1.
Minority Population Composition
Black alone (NH)
1.9%
AIAN alone (NH)6.9%
Asian alone (NH)
2.5%
NHPI alone (NH)0.2%
Some other race alone (NH)
0.9%
Two or more races
(NH)11.3%
Hispanic76.2%
Population by 5-Year Age Groups and Sex
1,250 1,000 750 500 250 0 250 500 750 1,000 1,250
Under 5
5 - 9
10 - 14
15 - 19
20 - 24
25 - 29
30 - 34
35 - 39
40 - 44
45 - 49
50 - 54
55 - 59
60 - 64
65 - 69
70 - 74
75 - 79
80 - 84
85 +
Male Female

The Structure and Economic Impact of Utah’s Coal Industry
148 B U R E A U O F E C O N O M I C A N D B U S I N E S S R E S E A R C H
Table 8.1 Carbon County Population by Race and Ethnicity: 2000 Census and 2006 Estimates
Hispanic or Latino Not Hispanic or Latino Minority
Total
Population Total White Alone
Black or African
American Alone
American Indian
and Alaska Native Alone
Asian Alone
Native Hawaiian
and Other Pacific
Islander Alone
Some Other Race
Alone
Two or More
Races Total Share
Rank Among
Utah Counties
Population July 1, 2006 Estimate 19,504 2,079 16,658 55 219 100 7 23 363 2,846 14.6% 5 April 1, 2000 Enumeration 20,422 2,097 17,671 52 190 70 6 24 312 2,751 13.5% 6 Shares of Total Population July 1, 2006 Estimate 100% 10.7% 85.4% 0.3% 1.1% 0.5% 0.0% 0.1% 1.9% 14.6% April 1, 2000 Enumeration 100% 10.3% 86.5% 0.3% 0.9% 0.3% 0.0% 0.1% 1.5% 13.5% Share of State Population Group July 1, 2006 Estimate 0.7% 0.7% 0.8% 0.3% 0.7% 0.2% 0.0% 1.0% 0.9% 0.6% April 1, 2000 Enumeration 0.9% 1.0% 0.9% 0.3% 0.7% 0.2% 0.0% 1.2% 1.0% 0.8% Change from 2000 to 2006 Amount –918 –18 –1,013 3 29 30 1 –1 51 95 Percentage –4.5% –0.8% –5.7% 5.0% 15.1% 43.2% 20.9% –4.9% 16.5% 3.5% Share of County Population Increase N/A N/A N/A N/A N/A N/A N/A N/A N/A N/A Note: Minority is computed as total population minus White Alone, Not Hispanic. Sources: Bureau of Economic and Business Research, University of Utah analysis using data from U.S. Bureau of the Census (2000 Census and 2006 estimates) and Utah Population Estimates Committee (2006 estimates). The 2006 minority estimates are BEBR estimates controlled to UPEC totals.

The Structure and Economic Impact of Utah’s Coal Industry
B U R E A U O F E C O N O M I C A N D B U S I N E S S R E S E A R C H 149
8.1.2 Emery County
8.1.2.1 Population Growth: Trends and Components of Change Emery County’s resident population has fluctuated with the booms and busts of the energy in-dustry (Exhibit 8.3). Considering the period since 1940, population peaked at 7,000 in 1940, then declined to a low of 5,100 in 1969 (with some fluctuation in the intervening years). Beginning in 1970, Emery County experienced a 13-year run of net in-migration and population peaked at 12,700 in 1982. With few exceptions, there has been annual net out-migration since then. Popu-lation declined to reach 10,262 in 1991, and has since remained essentially flat. Population was estimated to be 10,610 in 2008. Cumulative net out-migration since 1990 totaled 1,601 and cu-mulative natural increase was 1,882. 8.1.2.2 Age Structure The age structure of Emery County is one that is common to many rural communities (Exhibit 8.4). There is a smaller share of the population in the ages after high school graduation and through the young prime working ages, as compared with the state. This is consistent with out-migration from the county for educational and economic opportunities. There are more youth and more older persons as a share of the population, versus the state. The county has a greater share of persons in all five-year age groups from 40 years old and older, as compared with the state. In the 2000 census enumeration, the median age was 30.1, which is higher than 27.1 for the state. The share of the county population 60 years and older was 13.8 percent, versus 11.3 percent for the state. A drop in the male-to-female ratio in the 15-through-19-year-old age group is evidence of males having left the county, possibly for reasons of religious service. 8.1.2.3 Race and Ethnicity The estimated population of Emery County for July 1, 2006 was 10,438, which was a decline of 422, or 3.9 percent, since April 1, 2000 (as compared with a 17.1 percent increase for the state over the same period) (Table 8.2). The minority population (defined as Hispanics or Latinos and all non-Whites) was estimated in 2006 to be 977, or 9.4 percent of the population (versus 17.4 percent for the state), ranking it 20th among all 29 counties for minority share. The 2006 esti-mated minority population represented an increase of 20.6 percent from 2000, while the White Alone, Not Hispanic population declined by 5.9 percent in Emery County. The largest minority group is the population of those identifying themselves as Hispanic or Latino, which was esti-mated in 2006 to be 668 persons, or 6.4 percent of the population. From 2000 to 2006, this population increased by 100, or 17.7 percent.

The Structure and Economic Impact of Utah’s Coal Industry
150 B U R E A U O F E C O N O M I C A N D B U S I N E S S R E S E A R C H
Exhibit 8.3 Emery County Population Estimates and Components of Population Change, 1940–2008
Population FY
Births FY
Deaths Natural
Increase Net In-
Migration 1940 7,000 189 70 119 0 1941 6,900 173 46 127 –227 1942 6,600 167 58 109 –409 1943 6,000 161 59 102 –702 1944 5,600 155 61 94 –494 1945 5,300 140 40 100 –400 1946 5,200 126 42 84 –184 1947 5,200 145 41 104 –104 1948 5,600 135 35 100 300 1949 5,800 142 49 93 107 1950 6,300 138 40 98 402 1951 6,100 149 46 103 –303 1952 5,900 141 56 85 –285 1953 5,800 159 57 102 –202 1954 5,700 153 49 104 –204 1955 5,700 160 46 114 –114 1956 5,700 148 37 111 –111 1957 5,700 128 41 87 –87 1958 5,600 151 47 104 –204 1959 5,600 147 56 91 –91 1960 5,500 139 50 89 –189 1961 5,500 124 48 76 –76 1962 5,400 119 49 70 –170 1963 5,400 97 39 58 –58 1964 5,400 120 60 60 –60 1965 5,400 104 44 60 –60 1966 5,300 111 56 55 –155 1967 5,200 93 62 31 –131 1968 5,200 79 44 35 –35 1969 5,100 84 44 40 –140 1970 5,150 82 47 35 15 1971 5,600 100 50 50 400 1972 6,100 96 61 35 465 1973 6,700 106 76 30 570 1974 6,800 115 45 70 30 1975 7,600 154 53 101 699 1976 8,850 209 56 153 1,097 1977 9,700 295 56 239 611 1978 10,300 293 54 239 361 1979 11,000 365 65 300 400 1980 11,600 401 58 343 257 1981 12,000 404 73 331 69 1982 12,700 448 74 374 326 1983 12,700 440 58 382 –382 1984 11,900 322 71 251 –1,051 1985 11,100 275 71 204 –1,004 1986 11,100 236 51 185 –185 1987 10,900 232 74 158 –358 1988 10,500 209 70 139 –539 1989 10,400 192 59 133 –233 1990 10,329 173 58 115 –186 1991 10,262 185 69 116 –183 1992 10,298 197 59 138 –102 1993 10,661 174 53 121 242 1994 10,620 142 56 86 –127 1995 10,683 169 65 104 –41 1996 11,056 154 66 88 285 1997 11,089 194 71 123 –90 1998 11,059 191 61 130 –160 1999 11,095 152 61 91 –55 2000 10,782 180 72 108 –421 2001 10,473 166 65 101 –410 2002 10,540 166 78 88 –21 2003 10,477 162 73 89 –152
0
2,000
4,000
6,000
8,000
10,000
12,000
14,000
1940 1950 1960 1970 1980 1990 2000
July
1 P
op
ula
tio
n
0.0%
0.2%
0.4%
0.6%
0.8%
1.0%
1.2%
1.4%
Sh
are
of
the S
tate
Population
County Share of the State
Population
Source: Utah Population Estimates Committee.
-1,500
-1,000
-500
0
500
1,000
1,500
1950 1960 1970 1980 1990 2000
Net In-Migration
Natural Increase
Components of Population Change
Source: Utah Population Estimates Committee.
-10%
-5%
0%
5%
10%
15%
20%
1950 1960 1970 1980 1990 2000-1,000
-500
0
500
1,000
1,500
Percent
Amount
Year-Over Rates and Amounts of Population Change
Source: Utah Population Estimates Committee.
2004 10,493 165 83 82 –66 2005 10,491 169 71 98 –100 2006 10,438 182 76 106 –159 2007 10,461 185 76 109 –86 2008 10,610 194 90 104 45
Notes: Population estimates for July 1 were produced by the Utah Population Estimates Committee (UPEC). UPEC changed its rounding convention. Estimates before 1990 are rounded while those for 1990 and beyond are not rounded. Birth and death data are from the Utah Bureau of Health Statistics.
Source: Downloaded from http://www.governor.state.ut.us/dea on August 27, 2009.

The Structure and Economic Impact of Utah’s Coal Industry
B U R E A U O F E C O N O M I C A N D B U S I N E S S R E S E A R C H 151
Exhibit 8.4 Emery County Population by Age and Sex, Race, and Ethnicity: 2000
Age Distribution of the Emery County Population Race and Ethnicity of the Emery County Population
Male Female
Sex Ratio Share
Share of State Population Share
Share of State
Under 5 460 424 1.08 8.1% 0.4% Total 10,860 100% 0.5% 5–9 519 461 1.13 9.0% 0.5%
10–14 599 566 1.06 10.7% 0.6% Not Hispanic or Latino 10,292 94.8% 0.5% 15–19 589 595 0.99 10.9% 0.5% White alone 10,050 92.5% 0.5% 20–24 352 317 1.11 6.2% 0.3% Black or African American alone 19 0.2% 0.1% 25–29 253 280 0.90 4.9% 0.3% American Indian and Alaska Native alone 63 0.6% 0.2% 30–34 264 281 0.94 5.0% 0.4% Asian alone 34 0.3% 0.1% 35–39 307 374 0.82 6.3% 0.5% Native Hawaiian and Other Pacific Islander alone 10 0.1% 0.1% 40–44 455 404 1.13 7.9% 0.6% Some other race alone 9 0.1% 0.5% 45–49 388 354 1.10 6.8% 0.6% Two or more races 107 1.0% 0.3% 50–54 322 294 1.10 5.7% 0.6% Ethnicity 55–59 257 243 1.06 4.6% 0.6% Hispanic or Latino 568 5.2% 0.3% 60–64 203 205 0.99 3.8% 0.7% 65–69 150 150 1.00 2.8% 0.6% Minority 810 7.5% 0.2% 70–74 146 154 0.95 2.8% 0.6% 75–79 91 116 0.78 1.9% 0.5% 80–84 60 84 0.71 1.3% 0.5%
85 + 37 106 0.35 1.3% 0.7% Total 5,452 5,408 1.01 100% 0.5%
Share 60 years+ 13.8% 0.6% Median Age 30.1 Note: NH is Not Hispanic. If a cell is shaded yellow and has bold red type, this indicates that the county’s share of the state for the given category exceeds the county’s share of total population in the state. Blue shading indicates a male-to-female ratio greater than one. Source: Bureau of the Census, Census 2000, SF1.
Population by 5-Year Age Groups and Sex
600 300 0 300 600
Under 5
5 - 9
10 - 14
15 - 19
20 - 24
25 - 29
30 - 34
35 - 39
40 - 44
45 - 49
50 - 54
55 - 59
60 - 64
65 - 69
70 - 74
75 - 79
80 - 84
85 +
Male Female
Minority Population Composition
Black alone (NH)
2.3%
AIAN alone (NH)7.8%
Asian alone (NH)
4.2%
NHPI alone (NH)1.2%
Some other race alone (NH)
1.1%
Two or more races
(NH)13.2%
Hispanic70.1%

The Structure and Economic Impact of Utah’s Coal Industry
152 B U R E A U O F E C O N O M I C A N D B U S I N E S S R E S E A R C H
Table 8.2 Emery County Population by Race and Ethnicity: 2000 Census and 2006 Estimates
Hispanic or Latino Not Hispanic or Latino Minority
Total
Population Total White Alone
Black or African
American Alone
American Indian
and Alaska Native Alone
Asian Alone
Native Hawaiian
and Other Pacific
Islander Alone
Some Other Race
Alone
Two or More
Races Total Share
Rank Among
Utah Counties
Population July 1, 2006 Estimate 10,438 668 9,461 31 85 39 11 10 133 977 9.4% 20 April 1, 2000 Enumeration 10,860 568 10,050 19 63 34 10 9 107 810 7.5% 19 Shares of Total Population July 1, 2006 Estimate 100.0% 6.4% 90.6% 0.3% 0.8% 0.4% 0.1% 0.1% 1.3% 9.4% April 1, 2000 Enumeration 100.0% 5.2% 92.5% 0.2% 0.6% 0.3% 0.1% 0.1% 1.0% 7.5% Share of State Population Group July 1, 2006 Estimate 0.4% 0.2% 0.4% 0.2% 0.3% 0.1% 0.1% 0.4% 0.3% 0.2% April 1, 2000 Enumeration 0.5% 0.3% 0.5% 0.1% 0.2% 0.1% 0.1% 0.5% 0.3% 0.2% Change from 2000 to 2006 Amount –422 100 –589 12 22 5 1 1 26 167 Percentage –3.9% 17.7% –5.9% 62.7% 35.3% 15.4% 8.6% 5.7% 24.1% 20.6% Share of County Population Increase N/A N/A N/A N/A N/A N/A N/A N/A N/A N/A Note: Minority is computed as total population minus White Alone, Not Hispanic. Sources: Bureau of Economic and Business Research, University of Utah analysis using data from U.S. Bureau of the Census (2000 Census and 2006 estimates) and Utah Population Estimates Committee (2006 estimates). The 2006 minority estimates are BEBR estimates controlled to UPEC totals.

The Structure and Economic Impact of Utah’s Coal Industry
B U R E A U O F E C O N O M I C A N D B U S I N E S S R E S E A R C H 153
8.1.3 Sevier County
8.1.3.1 Population Growth: Trends and Components of Change The population of Sevier County was 12,000 in 1950 and declined slowly to reach 9,600 by 1966 (Exhibit 8.5). The county experienced net out-migration over this period as well. From 1968 through 1980, net migration turned positive, and population eventually rose to a peak of 15,900 by 1985. There was a significant decline in population in 1986 (to 15,300), possibly the result of the completion of the Interstate 70 construction project. By 1990, growth was reestablished as the population grew at an average annual rate of 1.6 percent until 2008, when population reached a record 20,619. Over this 18-year period, cumulative net in-migration was 2,300 and accounted for 44.4 percent of the county’s population growth, while cumulative natural increase of 2,885 provided the rest of the growth. 8.1.3.2 Age Structure The age structure of Sevier County is one that is common to many rural communities (Exhibit 8.6). There is a smaller share of the population in the ages after high school graduation and through the young prime working ages, as compared with the state. This is consistent with out-migration from Sevier County for educational and economic opportunities. As a result, there are more young persons and more retirement-age persons per capita than in the state as a whole. In the 2000 census enumeration the median age was 30.3, which is higher than 27.1 for the state. The share of the county population 60 years and older was 17.3 percent, also higher than 11.3 percent for the state. The male-to-female ratio is particularly high for five-year age groups 15 to 30, probably because of the presence of the correctional facility population. 8.1.3.3 Race and Ethnicity The estimated population of Sevier County for July 1, 2006 was 19,984, which was an increase of 1,142 or 6.1 percent since April 1, 2000 (as compared with 17.1 percent for the state over the same period) (Table 8.3). The minority population (defined as Hispanics or Latinos and all non-Whites) was estimated in 2006 to be 1,282, or 6.4 percent of the population (compared with 17.4 percent for the state), ranking it 24th among all 29 counties for minority share. The 2006 esti-mated minority population represented an increase of 17.6 percent from 2000, and accounted for 16.8 percent of the total population increase of Sevier County to 2006. The largest minority group is the population of those identifying themselves as Hispanic or Latino, which was esti-mated in 2006 to be 622 persons, or 3.1 percent of the population. From 2000 to 2006, this population increased by 141, or 29.4 percent.

The Structure and Economic Impact of Utah’s Coal Industry
154 B U R E A U O F E C O N O M I C A N D B U S I N E S S R E S E A R C H
Exhibit 8.5 Sevier County Population Estimates and Components of Population Change, 1940–2008
Population FY
Births FY
Deaths Natural
Increase Net In-
Migration 1940 12,300 311 99 212 0 1941 11,800 316 97 219 –719 1942 11,300 289 103 186 –686 1943 10,400 287 87 200 –1,100 1944 10,000 293 101 192 –592 1945 10,300 290 85 205 95 1946 11,400 327 90 237 863 1947 11,700 378 103 275 25 1948 12,300 380 117 263 337 1949 12,300 373 78 295 –295 1950 12,000 379 109 270 –570 1951 11,700 371 100 271 –571 1952 11,500 403 92 311 –511 1953 11,300 357 108 249 –449 1954 11,100 363 111 252 –452 1955 11,200 325 86 239 –139 1956 11,100 311 76 235 –335 1957 10,700 266 90 176 –576 1958 10,600 246 93 153 –253 1959 10,500 263 97 166 –266 1960 10,600 236 97 139 –39 1961 10,500 227 83 144 –244 1962 10,400 208 107 101 –201 1963 10,100 171 86 85 –385 1964 9,900 178 107 71 –271 1965 9,800 167 97 70 –170 1966 9,600 151 98 53 –253 1967 9,600 147 91 56 –56 1968 9,800 153 111 42 158 1969 9,900 177 94 83 17 1970 10,150 178 97 81 169 1971 10,850 213 97 116 584 1972 11,350 212 96 116 384 1973 11,750 230 125 105 295 1974 11,950 272 109 163 37 1975 12,550 281 111 170 430 1976 13,050 280 107 173 327 1977 13,400 386 116 270 80 1978 14,000 394 102 292 308 1979 14,450 418 114 304 146 1980 14,900 433 128 305 145 1981 15,100 422 115 307 –107 1982 15,300 435 119 316 –116 1983 15,600 351 131 220 80 1984 15,800 367 126 241 –41 1985 15,900 339 143 196 –96 1986 15,300 308 123 185 –785 1987 15,400 286 111 175 –75 1988 15,400 264 126 138 –138 1989 15,400 276 125 151 –151 1990 15,434 262 144 118 –84 1991 15,627 256 121 135 58 1992 15,923 290 113 177 119 1993 16,292 253 133 120 249 1994 16,572 265 135 130 150 1995 16,936 261 142 119 245 1996 17,258 277 145 132 190 1997 17,902 321 144 177 467 1998 18,294 306 140 166 226 1999 18,555 334 180 154 107 2000 18,938 309 158 151 232 2001 19,180 357 157 200 42 2002 19,232 327 155 172 –120 2003 19,318 325 144 181 –95
0
5,000
10,000
15,000
20,000
25,000
1940 1950 1960 1970 1980 1990 2000
July
1 P
op
ula
tio
n
0.0%
0.5%
1.0%
1.5%
2.0%
2.5%
Sh
are
of
the S
tate
Population
County Share of the State
Population
Source: Utah Population Estimates Committee.
-1,000
-800
-600
-400
-200
0
200
400
600
800
1950 1960 1970 1980 1990 2000
Net In-Migration
Natural Increase
Components of Population Change
Source: Utah Population Estimates Committee.
-6%
-4%
-2%
0%
2%
4%
6%
8%
1950 1960 1970 1980 1990 2000-800
-600
-400
-200
0
200
400
600
800Percent
Amount
Year-Over Rates and Amounts of Population Change
Source: Utah Population Estimates Committee.
2004 19,415 360 177 183 –86 2005 19,649 330 168 162 72 2006 19,984 365 170 195 140 2007 20,442 373 197 176 282 2008 20,619 341 186 155 22
Notes: Population estimates for July 1 were produced by the Utah Population Estimates Committee (UPEC). UPEC changed its rounding convention. Estimates before 1990 are rounded while those for 1990 and beyond are not rounded. Birth and death data are from the Utah Bureau of Health Statistics.
Source: Downloaded from http://www.governor.state.ut.us/dea on August 27, 2009.

The Structure and Economic Impact of Utah’s Coal Industry
B U R E A U O F E C O N O M I C A N D B U S I N E S S R E S E A R C H 155
Exhibit 8.6 Sevier County Population by Age and Sex, Race, and Ethnicity: 2000
Age Distribution of the Sevier County Population Race and Ethnicity of the Sevier County Population
Male Female
Sex Ratio Share
Share of State Population Share
Share of State
Under 5 834 833 1.00 8.8% 0.8% Total 18,842 100% 0.8% 5–9 857 808 1.06 8.8% 0.9%
10–14 923 880 1.05 9.6% 0.9% Not Hispanic or Latino 18,361 97.4% 0.9% 15–19 1,047 982 1.07 10.8% 0.9% White alone 17,752 94.2% 0.9% 20–24 644 587 1.10 6.5% 0.5% Black or African American alone 49 0.3% 0.3% 25–29 497 475 1.05 5.2% 0.5% American Indian and Alaska Native alone 346 1.8% 1.3% 30–34 440 461 0.95 4.8% 0.6% Asian alone 48 0.3% 0.1% 35–39 548 648 0.85 6.3% 0.8% Native Hawaiian and Other Pacific Islander alone 16 0.1% 0.1% 40–44 627 612 1.02 6.6% 0.8% Some other race alone 4 0.0% 0.2% 45–49 558 566 0.99 6.0% 0.9% Two or more races 146 0.8% 0.5% 50–54 474 504 0.94 5.2% 0.9% Ethnicity 55–59 420 422 1.00 4.5% 1.1% Hispanic or Latino 481 2.6% 0.2% 60–64 403 366 1.10 4.1% 1.2% 65–69 308 330 0.93 3.4% 1.2% Minority 1,090 5.8% 0.3% 70–74 308 316 0.97 3.3% 1.3% 75–79 233 258 0.90 2.6% 1.2% 80–84 160 225 0.71 2.0% 1.4%
85 + 103 185 0.56 1.5% 1.3% Total 9,384 9,458 0.99 100% 0.8%
Share 60 years+ 17.0% 1.3% Median Age 30.3 Note: NH is Not Hispanic. If a cell is shaded yellow and has bold red type, this indicates that the county’s share of the state for the given category exceeds the county’s share of total population in the state. Blue shading indicates a male-to-female ratio greater than one. Source: Bureau of the Census, Census 2000, SF1.
Population by 5-Year Age Groups and Sex
1,200 600 0 600 1,200
Under 5
5 - 9
10 - 14
15 - 19
20 - 24
25 - 29
30 - 34
35 - 39
40 - 44
45 - 49
50 - 54
55 - 59
60 - 64
65 - 69
70 - 74
75 - 79
80 - 84
85 +
Male Female
Minority Population Composition
Black alone (NH)
4.5%
AIAN alone (NH)
31.7%
Asian alone (NH)
4.4%
NHPI alone (NH)1.5%
Some other race alone (NH)
0.4%
Two or more races
(NH)13.4%
Hispanic44.1%

The Structure and Economic Impact of Utah’s Coal Industry
156 B U R E A U O F E C O N O M I C A N D B U S I N E S S R E S E A R C H
Table 8.3 Sevier County Population by Race and Ethnicity: 2000 Census and 2006 Estimates
Hispanic or Latino Not Hispanic or Latino Minority
Total
Population Total White Alone
Black or African
American Alone
American Indian
and Alaska Native Alone
Asian Alone
Native Hawaiian
and Other Pacific
Islander Alone
Some Other Race
Alone
Two or More
Races Total Share
Rank Among
Utah Counties
Population July 1, 2006 Estimate 19,984 622 18,702 59 344 57 19 4 177 1,282 6.4% 24 April 1, 2000 Enumeration 18,842 481 17,752 49 346 48 16 4 146 1,090 5.8% 24 Shares of Total Population July 1, 2006 Estimate 100% 3.1% 93.6% 0.3% 1.7% 0.3% 0.1% 0.0% 0.9% 6.4% April 1, 2000 Enumeration 100% 2.6% 94.2% 0.3% 1.8% 0.3% 0.1% 0.0% 0.8% 5.8% Share of State Population Group July 1, 2006 Estimate 0.8% 0.2% 0.9% 0.3% 1.2% 0.1% 0.1% 0.2% 0.4% 0.3% April 1, 2000 Enumeration 0.8% 0.2% 0.9% 0.3% 1.3% 0.1% 0.1% 0.2% 0.5% 0.3% Change from 2000 to 2006 Amount 1,142 141 950 10 –2 9 3 0 31 192 Percentage 6.1% 29.4% 5.4% 19.5% –0.7% 19.5% 16.0% 3.8% 21.3% 17.6% Share of County Population Increase 100% 12.4% 83.2% 0.8% –0.2% 0.8% 0.2% 0.0% 2.7% 16.8% Note: Minority is computed as total population minus White Alone, Not Hispanic. Sources: Bureau of Economic and Business Research, University of Utah analysis using data from U.S. Bureau of the Census (2000 Census and 2006 estimates) and Utah Population Estimates Committee (2006 estimates). The 2006 minority estimates are BEBR estimates controlled to UPEC totals.
The Structure and Economic Impact of Utah’s Coal Industry
B U R E A U O F E C O N O M I C A N D B U S I N E S S R E S E A R C H 157
8.2 Economic Profiles
Over the years, the system has changed by which nonfarm businesses are classified for purposes of employment and earnings statistics. The Standard Industrial Classification (SIC) was devel-oped in the 1930s “to classify establishments by the type of activity in which they are primarily engaged.” It was revised periodically to reflect changes in the composition and organization of the economy, with the last update in 1987. Due to significant and rapid structural changes in the U.S. economy, the SIC system was replaced by the North American Industrial Classification Sys-tem (NAICS) in 1997, which was subsequently updated in 2002 and again 2007. Whereas the SIC had classified businesses into 10 major divisions with two subsequent layers of detail, NAICS uses 20 broad sectors, each with four layers of subcategories. While this complicates compari-sons of economic activity over time, the broad mining sector has remained fairly consistent. For this phase of the study, the BEBR used employment, income, and earnings data from the U.S. Department of Commerce’s Bureau of Economic Analysis. The BEA provides county-level data on employment and earnings by type, i.e. proprietors or wage and salary, and by industry, i.e. farm and nonfarm. Nonfarm figures are further classified by SIC sector from 1970 through 2000 and by NAICS sector from 2001 on. In addition, total nonfarm payrolls and average annual nonfarm wages are included from the Utah Department of Workforce Services. To compare counties’ changing economic structure to that of the country, BEBR calculated lo-cation quotients for 1970 through 2007. Location quotients are the ratio of an industry’s share of employment or earnings in a study area (in this case each county) to its share in a reference area (the United States as a whole). Therefore, values greater than 1.00 indicate relative specialization and the possible existence of a “basic” or exporting industry in the study area, where basic refers to activities that bring in money from outside the region and so drive regional growth. 8.2.1 Carbon County
8.2.1.1 Employment From 1970 through 2007, total employment72 in Carbon County grew at an average annual rate of 2.0 percent, from 5,823 to 12,246. This was the slowest growth of the three coal counties, al-though Carbon does have the largest employment base. Exhibit 8.7 shows the boom and bust cycles of an economy dependent on natural resources, particularly those related to energy. Over the study period employment peaked at 10,981 in 1982, declined to 9,002 in 1987, peaked again at 11,965 in 1999, dipped to 11,188 in 2004, then rose to 12,287 in 2006. The fastest-growing type of employment was nonfarm proprietors’ employment, which grew at an average annual rate of 3.2 percent between 1970 and 2007, from 760 to 2,421. Nonfarm pro-prietors’ share of total employment increased over the period from 13 percent to nearly 20 per-cent. Wage and salary employment grew 1.8 percent annually, almost doubling from 4,925 to 9,607. However, its share shrank from 85 percent to 78.5 percent. Proprietors’ employment has the benefit of being less subject to the vicissitude of wage and salary jobs.
72 Total employment covers farm and nonfarm employment, and proprietors’ and wage and salary employment, and counts full- and part-time jobs equally.

The Structure and Economic Impact of Utah’s Coal Industry
158 B U R E A U O F E C O N O M I C A N D B U S I N E S S R E S E A R C H
Exhibit 8.7 Carbon County Employment Summary, 1970–2007
1970 1980 1990 2000 2001 2002 2003 2004 2005 2006 2007 Change AARC
Total Employment 5,823 10,175 9,608 11,722 11,277 11,402 11,228 11,188 11,638 12,287 12,246 110.3% 2.0% Employment by Type
Wage and Salary Employment 4,925 8,822 8,027 9,188 8,975 9,223 8,911 8,866 9,212 9,736 9,607 95.1% 1.8% Proprietors’ Employment 898 1,353 1,581 2,534 2,302 2,179 2,317 2,322 2,426 2,551 2,639 193.9% 3.0%
Farm Proprietors’ Employment 138 201 195 227 226 227 222 221 222 220 218 58.0% 1.2% Nonfarm Proprietors’ Employment 760 1,152 1,386 2,307 2,076 1,952 2,095 2,101 2,204 2,331 2,421 218.6% 3.2%
Employment by Industry Farm Employment 243 233 231 251 250 247 246 244 246 243 238 –2.1% –0.1% Nonfarm Employment 5,580 9,942 9,377 11,471 11,027 11,155 10,982 10,944 11,392 12,044 12,008 115.2% 2.1%
Private Employment 4,170 8,104 7,274 9,081 8,657 8,844 8,707 8,687 9,134 9,793 9,750 133.8% 2.3% Government Employment 1,410 1,838 2,103 2,390 2,370 2,311 2,275 2,257 2,258 2,251 2,258 60.1% 1.3%
Shares by Type Wage and Salary Employment 84.6% 86.7% 83.5% 78.4% 79.6% 80.9% 79.4% 79.2% 79.2% 79.2% 78.5% Proprietors’ Employment 15.4% 13.3% 16.5% 21.6% 20.4% 19.1% 20.6% 20.8% 20.8% 20.8% 21.5%
Farm Proprietors’ Employment 2.4% 2.0% 2.0% 1.9% 2.0% 2.0% 2.0% 2.0% 1.9% 1.8% 1.8% Nonfarm Proprietors’ Employment 13.1% 11.3% 14.4% 19.7% 18.4% 17.1% 18.7% 18.8% 18.9% 19.0% 19.8%
Shares by Industry Farm Employment 4.2% 2.3% 2.4% 2.1% 2.2% 2.2% 2.2% 2.2% 2.1% 2.0% 1.9% Nonfarm Employment 95.8% 97.7% 97.6% 97.9% 97.8% 97.8% 97.8% 97.8% 97.9% 98.0% 98.1%
Private Employment 71.6% 79.6% 75.7% 77.5% 76.8% 77.6% 77.5% 77.6% 78.5% 79.7% 79.6% Government Employment 24.2% 18.1% 21.9% 20.4% 21.0% 20.3% 20.3% 20.2% 19.4% 18.3% 18.4% Location Quotients by Type
Wage and Salary Employment 0.98 1.01 0.99 0.94 0.96 0.98 0.97 0.97 0.98 0.99 0.98 0.0% 0.0% Proprietors’ Employment 1.13 0.93 1.05 1.30 1.21 1.10 1.15 1.12 1.09 1.06 1.08 –4.3% –0.1%
Farm Proprietors’ Employment 0.80 0.90 1.27 1.45 1.53 1.50 1.54 1.59 1.56 1.51 1.54 93.2% 1.8% Nonfarm Proprietors’ Employment 1.22 0.93 1.03 1.29 1.18 1.07 1.12 1.08 1.06 1.03 1.05 –13.8% –0.4%
Location Quotients by Industry Farm Employment 0.96 0.69 1.06 1.15 1.21 1.17 1.21 1.26 1.26 1.23 1.24 28.7% 0.7% Nonfarm Employment 1.00 1.01 1.00 1.00 1.00 1.00 1.00 1.00 1.00 1.00 1.00 –0.6% 0.0%
Private Employment 0.92 0.99 0.92 0.92 0.91 0.92 0.92 0.92 0.93 0.94 0.94 2.1% 0.1% Government Employment 1.37 1.10 1.44 1.48 1.51 1.44 1.43 1.45 1.42 1.36 1.38 0.1% 0.0%
Note: Location quotient values greater than 1.00 indicate concentrations relative to the country.
Employment by Type and Industry, 1970-2007
0
2,000
4,000
6,000
8,000
10,000
12,000
14,000
1970
1972
1974
1976
1978
1980
1982
1984
1986
1988
1990
1992
1994
1996
1998
2000
2002
2004
2006
Fu
ll-
an
d P
art
-Tim
e J
ob
s
Total EmploymentNonfarm EmploymentWage & Salary EmploymentProprietors' EmploymentFarm Employment
Source: U.S. Bureau of Economic Analysis, Regional Economic Information System and Bureau of Economic and Business Research, University of Utah.

The Structure and Economic Impact of Utah’s Coal Industry
B U R E A U O F E C O N O M I C A N D B U S I N E S S R E S E A R C H 159
Looking at employment by broad industry, farm jobs shrank 2 percent from 243 in 1970 to 238 in 2007 while nonfarm employment more than doubled from 5,580 to 12,008. Because it’s a ru-ral county, Carbon County has a higher concentration of famers than the national average. Farm employment’s 1.9 percent share of total employment in the county is about 25 percent larger than the nation’s 1.6 percent share. Carbon also has an above-average concentration of public-sector employment. In 2007 the county’s 2,258 government jobs accounted for 18 percent of total employment, down from 24 percent in 1970. This is about 40 percent larger than the public sector’s share nationwide, which is 13 percent. Turning to nonfarm employment by industry, in 1970 state and local government, retail trade, and mining were the largest sectors, providing 1,074, 1,044, and 996 jobs respectively (Table 8.4). Together, these three sectors accounted for more than half of all employment, farm and nonfarm (Table 8.5). Other significant sectors were services (650 jobs) and transportation and utilities (592 jobs, many with the Carbon Power Plant), each providing roughly 10 percent of total employment. By 2000, mining jobs had shrunk to 7 percent of total employment—from 17 percent in 1970—and services (28 percent), retail trade (18 percent), and local government (11.5 percent) were the largest employers. As of 2007, under the NAICS classification system, mining employment was not disclosed to protect firm confidentiality, though 827 mining jobs were re-ported in 2005. Of the sectors for which figures were reported, government provided 2,258 jobs,
Table 8.4
Carbon County Nonfarm Employment by Industry, 1970–2007
By SIC Industry 1970 1980 1990 1991 1992 1993 1994 1995 1996 1997 1998 1999 2000 Ag Services, Forestry, and Fishing 21 35 32 31 36 29 43 37 42 64 55 N/A N/A Mining 996 2,346 1,393 1,346 1,134 1,119 1,055 1,050 1,109 1,174 1,099 966 870 Construction 181 433 261 268 508 320 357 367 392 397 408 487 417 Manufacturing 199 297 327 343 340 328 388 425 461 497 494 459 455 Transportation and Public Utilities 592 709 489 442 436 482 551 496 555 540 539 545 577 Wholesale Trade 175 464 362 414 464 426 454 505 538 586 599 581 570 Retail Trade 1,044 1,713 1,752 1,879 1,805 1,804 1,920 1,866 1,968 2,100 2,103 2,166 2,130 Finance, Insurance, and Real Estate 312 394 416 383 362 405 411 455 474 498 653 N/A N/A Services 650 1,713 2,242 2,178 2,332 2,337 2,722 2,712 2,984 3,219 3,358 3,480 3,289 Government 1,410 1,838 2,103 2,089 2,093 2,099 2,135 2,233 2,358 2,370 2,328 2,326 2,390
Federal, Civilian 170 158 173 168 171 166 169 170 172 172 166 163 186 Military 166 133 158 150 144 137 127 116 117 112 109 106 104 State N/A 475 539 580 592 604 615 653 703 749 719 739 755 Local N/A 1,072 1,233 1,191 1,186 1,192 1,224 1,294 1,366 1,337 1,334 1,318 1,345
By NAICS Industry 2001 2002 2003 2004 2005 2006 2007
Forestry, Fishing, and Related Activities N/A N/A N/A N/A 28 N/A N/A Mining N/A N/A N/A N/A 827 N/A N/A Construction 568 462 455 457 469 585 599 Manufacturing 419 430 327 356 457 478 418 Transportation and Utilities 465 436 423 430 548 587 617 Wholesale Trade 383 391 410 430 468 493 485 Retail Trade 1,573 1,661 1,673 1,593 1,663 1,713 1,743 Information 120 107 109 132 128 149 132 Financial Activity 662 575 650 641 654 695 721 Professional & Business Services 1,065 1,078 N/A N/A N/A 1,026 N/A Education & Health Services N/A N/A N/A N/A N/A N/A N/A Leisure & Hospitality Services 910 933 887 890 889 967 970 Other Services 844 881 870 889 869 929 897 Government 2,370 2,311 2,275 2,257 2,258 2,251 2,258
Federal, Civilian 166 172 180 180 183 175 166 Military 102 102 103 97 96 93 87 State 758 719 715 741 751 773 775 Local 1,344 1,318 1,277 1,239 1,228 1,210 1,230
N/A: Data not shown to avoid disclosure of confidential information or because the data were not available. Source: U.S. Bureau of Economic Analysis, Regional Economic Information System.

The Structure and Economic Impact of Utah’s Coal Industry
160 B U R E A U O F E C O N O M I C A N D B U S I N E S S R E S E A R C H
1,230 of which were at the local level, leisure and hospitality services and other services com-bined provided 1,867 jobs, and retail trade provided 1,743. These represented 18 percent, 14 percent, and 15 percent, respectively, of total employment in the county.
Figure 8.1a
Carbon County Nonfarm Employment by SIC Industry, 1970–2000
0
2,000
4,000
6,000
8,000
10,000
12,000
1970
1972
1974
1976
1978
1980
1982
1984
1986
1988
1990
1992
1994
1996
1998
2000
Fu
ll-
an
d P
art
-Tim
e J
ob
s
Ag Services, Forestry, andFishing
Finance, Insurance, and RealEstate
Construction
M anufacturing
Wholesale Trade
Transportation and PublicUtilities
M ining
Retail Trade
Services
Government
Source: U.S. Bureau of Economic Analysis, Regional Economic Information System.
Figure 8.1b
Carbon County Nonfarm Employment by NAICS Industry, 2001–2007
0
1,000
2,000
3,000
4,000
5,000
6,000
7,000
8,000
9,000
10,000
2001
2002
2003
2004
2005
2006
2007
Fu
ll-
an
d P
art
-Tim
e J
ob
s
Forestry, Fishing, and Related
M ining
Information
M anufacturing
Wholesale Trade
Construction
Transportation and Utilities
Financial Activity
Retail Trade
Pro f. & Bus. Services
Other Services
Leisure & Hospitality Services
Government
Note: Total employment appears much lower in 2001 than in 2000 because figures were not reported for several industries. Source: U.S. Bureau of Economic Analysis, Regional Economic Information System.

The Structure and Economic Impact of Utah’s Coal Industry
B U R E A U O F E C O N O M I C A N D B U S I N E S S R E S E A R C H 161
Table 8.5 Carbon County Nonfarm Employment Shares by Industry, 1970–2007
By SIC Industry 1970 1980 1990 1991 1992 1993 1994 1995 1996 1997 1998 1999 2000
Ag Services, Forestry, and Fishing 0.4% 0.3% 0.3% 0.3% 0.4% 0.3% 0.4% 0.4% 0.4% 0.5% 0.5% N/A N/A Mining 17.1% 23.1% 14.5% 14.0% 11.7% 11.7% 10.3% 10.1% 10.0% 10.0% 9.3% 8.1% 7.4% Construction 3.1% 4.3% 2.7% 2.8% 5.2% 3.3% 3.5% 3.5% 3.5% 3.4% 3.4% 4.1% 3.6% Manufacturing 3.4% 2.9% 3.4% 3.6% 3.5% 3.4% 3.8% 4.1% 4.1% 4.3% 4.2% 3.8% 3.9% Transportation and Public Utilities 10.2% 7.0% 5.1% 4.6% 4.5% 5.0% 5.4% 4.8% 5.0% 4.6% 4.5% 4.6% 4.9% Wholesale Trade 3.0% 4.6% 3.8% 4.3% 4.8% 4.4% 4.4% 4.9% 4.8% 5.0% 5.0% 4.9% 4.9% Retail Trade 17.9% 16.8% 18.2% 19.6% 18.6% 18.8% 18.7% 18.0% 17.7% 18.0% 17.7% 18.1% 18.2% Finance, Insurance, and Real Estate 5.4% 3.9% 4.3% 4.0% 3.7% 4.2% 4.0% 4.4% 4.3% 4.3% 5.5% N/A N/A Services 11.2% 16.8% 23.3% 22.7% 24.0% 24.4% 26.5% 26.1% 26.8% 27.5% 28.3% 29.1% 28.1% Government 24.2% 18.1% 21.9% 21.8% 21.5% 21.9% 20.8% 21.5% 21.2% 20.3% 19.6% 19.4% 20.4%
Federal, Civilian 2.9% 1.6% 1.8% 1.8% 1.8% 1.7% 1.6% 1.6% 1.5% 1.5% 1.4% 1.4% 1.6% Military 2.9% 1.3% 1.6% 1.6% 1.5% 1.4% 1.2% 1.1% 1.1% 1.0% 0.9% 0.9% 0.9% State N/A 4.7% 5.6% 6.0% 6.1% 6.3% 6.0% 6.3% 6.3% 6.4% 6.1% 6.2% 6.4% Local N/A 10.5% 12.8% 12.4% 12.2% 12.4% 11.9% 12.5% 12.3% 11.4% 11.2% 11.0% 11.5%
By NAICS Industry 2001 2002 2003 2004 2005 2006 2007
Forestry, Fishing, and Related Activities N/A N/A N/A N/A 0.2% N/A N/A Mining N/A N/A N/A N/A 7.1% N/A N/A Construction 5.0% 4.1% 4.1% 4.1% 4.0% 4.8% 4.9% Manufacturing 3.7% 3.8% 2.9% 3.2% 3.9% 3.9% 3.4% Transportation and Utilities 4.1% 3.8% 3.8% 3.8% 4.7% 4.8% 5.0% Wholesale Trade 3.4% 3.4% 3.7% 3.8% 4.0% 4.0% 4.0% Retail Trade 13.9% 14.6% 14.9% 14.2% 14.3% 13.9% 14.2% Information 1.1% 0.9% 1.0% 1.2% 1.1% 1.2% 1.1% Financial Activity 5.9% 5.0% 5.8% 5.7% 5.6% 5.7% 5.9% Professional & Business Services 9.4% 9.5% N/A N/A N/A 8.4% N/A Education & Health Services N/A N/A N/A N/A N/A N/A N/A Leisure & Hospitality Services 8.1% 8.2% 7.9% 8.0% 7.6% 7.9% 7.9% Other Services 7.5% 7.7% 7.7% 7.9% 7.5% 7.6% 7.3% Government 21.0% 20.3% 20.3% 20.2% 19.4% 18.3% 18.4%
Federal, Civilian 1.5% 1.5% 1.6% 1.6% 1.6% 1.4% 1.4% Military 0.9% 0.9% 0.9% 0.9% 0.8% 0.8% 0.7% State 6.7% 6.3% 6.4% 6.6% 6.5% 6.3% 6.3% Local 11.9% 11.6% 11.4% 11.1% 10.6% 9.8% 10.0%
Shares are of total farm and nonfarm employment. N/A: Data not shown to avoid disclosure of confidential information or because the data were not available. Source: U.S. Bureau of Economic Analysis, Regional Economic Information System.
Comparing Carbon County’s economy to that of the country as a whole, in 1970 mining’s share of total employment in the county was 21 times the national average (Exhibit 8.8). The next most significant concentration in the county was in transportation and utilities, whose local share was 90 percent larger than its national share. The public sector also had a larger-than-normal presence, with a local employment share more than one-third greater than in the country as a whole. Retail trade also had a modest relative concentration, with a share one-fifth larger than the national average. By 2000, Carbon County’s lopsided concentration in mining had shrunk to “only” 16 times the national share. The transportation and utilities sector’s share of local em-ployment was on a par with the country, while the county’s concentration in government em-ployment had increased to a share 50 percent larger than the national share—and state government’s share was more than twice the national share. Retail trade’s share of local jobs was about 10 percent larger than its national share, and wholesale trade’s share was 7 percent larger. In 2007, under the NAICS system, mining employment was not disclosed. However, in 2005 mining’s share of employment in Carbon County was almost 15 times its national share. In 2007 the industries with the most significant concentrations relative to the country as a whole were state government, with a share more than twice the national average, transportation and utilities (41 percent larger), retail trade (34 percent larger), and local government (28 percent larger). The county also had an above-average concentration in wholesale trade, though the sector’s local employment share was only 8 percent greater than its national share.

The Structure and Economic Impact of Utah’s Coal Industry
162 B U R E A U O F E C O N O M I C A N D B U S I N E S S R E S E A R C H
Exhibit 8.8 Carbon County Nonfarm Employment Location Quotients by Industry, 1970–2007
By SIC Industry 1970 1980 1990 1991 1992 1993 1994 1995 1996 1997 1998 1999 2000
Ag Services, Forestry, and Fishing 0.63 0.43 0.32 0.30 0.35 0.26 0.35 0.30 0.31 0.44 0.38 N/A N/A Mining 20.99 20.62 19.35 19.00 17.32 17.73 15.96 17.01 18.43 18.02 17.39 16.38 15.78 Construction 0.65 0.86 0.52 0.57 1.07 0.68 0.68 0.68 0.67 0.63 0.63 0.72 0.63 Manufacturing 0.16 0.16 0.24 0.26 0.26 0.26 0.29 0.32 0.33 0.34 0.34 0.33 0.34 Transportation and Public Utilities 1.91 1.40 1.08 0.97 0.96 1.06 1.13 1.01 1.05 0.97 0.94 0.93 1.00 Wholesale Trade 0.66 0.91 0.78 0.90 0.99 0.96 0.96 1.05 1.05 1.09 1.09 1.06 1.07 Retail Trade 1.19 1.08 1.11 1.19 1.12 1.14 1.12 1.07 1.05 1.07 1.08 1.10 1.11 Finance, Insurance, and Real Estate 0.80 0.51 0.56 0.53 0.50 0.57 0.54 0.59 0.57 0.57 0.70 N/A N/A Services 0.60 0.77 0.84 0.80 0.83 0.83 0.90 0.88 0.89 0.90 0.91 0.92 0.88 Government 1.37 1.10 1.44 1.42 1.39 1.44 1.39 1.47 1.48 1.44 1.41 1.41 1.48
Federal, Civilian 0.92 0.59 0.78 0.78 0.79 0.80 0.80 0.83 0.82 0.81 0.79 0.80 0.91 Military 0.81 0.60 0.84 0.82 0.78 0.80 0.75 0.73 0.72 0.69 0.69 0.70 0.71 State N/A 1.42 1.78 1.88 1.87 1.93 1.85 1.97 2.03 2.10 2.01 2.07 2.17 Local N/A 1.26 1.64 1.56 1.52 1.55 1.49 1.58 1.57 1.46 1.44 1.41 1.47
By NAICS Industry 2001 2002 2003 2004 2005 2006 2007
Forestry, Fishing, and Related Activities N/A N/A N/A N/A 0.42 N/A N/A Mining N/A N/A N/A N/A 14.76 N/A N/A Construction 0.85 0.70 0.69 0.67 0.64 0.73 0.76 Manufacturing 0.37 0.40 0.32 0.36 0.46 0.47 0.43 Transportation and Utilities 1.13 1.07 1.07 1.10 1.33 1.34 1.41 Wholesale Trade 0.90 0.93 1.00 1.05 1.10 1.09 1.08 Retail Trade 1.26 1.31 1.35 1.30 1.31 1.29 1.34 Information 0.44 0.42 0.45 0.56 0.54 0.60 0.55 Financial Activity 0.73 0.62 0.69 0.67 0.64 0.62 0.64 Professional & Business Services 0.72 0.72 N/A N/A N/A 0.61 N/A Education & Health Services N/A N/A N/A N/A N/A N/A N/A Leisure & Hospitality Services 0.96 0.96 0.91 0.91 0.87 0.90 0.90 Other Services 1.38 1.37 1.36 1.40 1.32 1.33 1.31 Government 1.51 1.44 1.43 1.45 1.42 1.36 1.38
Federal, Civilian 0.90 0.92 0.95 0.98 0.98 0.91 0.88 Military 0.72 0.71 0.73 0.71 0.71 0.66 0.63 State 2.23 2.07 2.11 2.22 2.19 2.18 2.20 Local 1.49 1.41 1.39 1.37 1.32 1.25 1.28
Note: Values greater than 1.00 indicate concentrations relative to the country.
Basic Industries' Location Quotients, 2001-2007
1.00
1.20
1.40
1.60
1.80
2.00
2.20
2.40
2001
2002
2003
2004
2005
2006
2007
State GovernmentLocal GovernmentOther ServicesRetail TradeTransportation and UtilitiesWholesale Trade
Source: U.S. Bureau of Economic Analysis, Regional Economic Information System and Bureau of Economic and Business Research, University of Utah.

The Structure and Economic Impact of Utah’s Coal Industry
B U R E A U O F E C O N O M I C A N D B U S I N E S S R E S E A R C H 163
8.2.1.2 Personal Income and Earnings Total personal income73 in Carbon County doubled, adjusting for inflation, between 1970 and 2007 from $280.3 million to $563.3 million. (All amounts are in constant 2007 dollars.) How-ever, it remained well below its 1982 peak of $663.2 million. Due to population growth, per cap-ita personal income grew more slowly, by 60 percent, from $17,797 to $28,552. It too peaked in 1982, at $27,292, and did not regain this level until 2005. Real average annual wages in Carbon County fell by 1.5 percent over the study period, from $34,523 to $34,022, and in fact in 2007 they were almost 17 percent below their 1978 peak of $40,794 (Table 8.6 and Figure 8.2). Personal transfer receipts, which include government social benefits and retirement income, av-eraged 3.6 percent annual growth between 1970 and 2007, from $34.9 million to $128.5 million. This indicates a growing elderly population in the county. Wage and salary disbursements increased 1.8 percent annually over the period, from $170.0 mil-lion to $326.9 million, and supplements to wages and salaries grew at an average 3.4 percent an-nually from $24.9 million to $84.4 million. In contrast, proprietors’ income shrank 0.6 percent annually, from $27.7 million in 1970 to $22.0 million in 2007, despite an almost tripling of pro-prietors’ employment. This decline was driven by farm proprietors’ income, which fell from $2.1 million in 1970 to a loss of $6.6 million in 2007. Nonfarm proprietors’ income grew only slightly over the period, from $25.6 million to $28.6 million. Like farm proprietors’ income, total farm earnings in Carbon County saw a drastic decline from 1970 to 2007. Earnings were $3.4 million in 1970, but from 1982 through 2007 there were losses in all but three years, with 2007’s totaling $6.0 million. Nonfarm earnings, however, doubled over the period, from $219.2 million to $439.2 million. Within nonfarm earnings, government earnings grew slightly faster than private earnings, but they represent less than one-quarter of all nonfarm earnings. In 2007, three-quarters of total earnings in Carbon County came from wages and salaries, one-fifth was due to supplements to wages and salaries (employer contributions for pensions, insur-ance, and government social insurance), and the remaining 5 percent was proprietors’ income. Proprietors’ share of earnings in the county was less than half (43 percent) of the national aver-age. Part of this was due to the losses among farm proprietors, but even nonfarm proprietors’ share of earnings was less than 60 percent of the average. In contrast, supplements to wages and salaries, particularly employer contributions for pensions and insurance, contributed shares about 20 percent larger than average. Since farm earnings in Carbon County were negative for the last several years, we cannot com-pare their local share of earnings to the national share. Within nonfarm earnings, government’s share of total earnings (22 percent) is about one-third larger than the national average (16 per-cent) while private earnings’ local share (79 percent) is slightly smaller than average (83 percent).
73 Note that the sum of wage and salary disbursements plus supplements to wages and salaries plus proprietors’ income equals the sum of farm and nonfarm earnings. Both are ways of measuring earnings by place of work. Sub-tracting employer and employee contributions for government social insurance and adding personal transfer re-ceipts, income from dividends, interest, and rent, and a residence adjustment that covers the effects of interarea commuters, yields total personal income, which is by place of residence.

The Structure and Economic Impact of Utah’s Coal Industry
164 B U R E A U O F E C O N O M I C A N D B U S I N E S S R E S E A R C H
Table 8.6 Carbon County Income Summary, 1970–2007
(Millions of Constant 2007 Dollars)
1970 1980 1990 2000 2001 2002 2003 2004 2005 2006 2007 Change AARC
Total Personal Income $280.3 $566.7 $470.5 $528.3 $526.8 $518.5 $508.4 $523.7 $557.6 $569.4 $563.3 101.0% 1.9% Per Capita Personal Income (dollars) $17,797 $25,300 $23,329 $25,900 $26,527 $26,110 $25,992 $27,013 $28,834 $29,195 $28,552 60.4% 1.3% Average Annual Wage per Job (dollars) $34,523 $37,322 $32,871 $32,433 $32,296 $31,625 $31,496 $32,432 $32,663 $33,596 $34,022 –1.5% 0.0% Personal Transfer Receipts $34.9 $70.4 $81.5 $110.8 $111.6 $117.7 $120.6 $122.7 $134.7 $127.2 $128.5 268.4% 3.6%
Components of Earnings Wage and salary disbursements $170.0 $329.3 $263.9 $298.0 $289.9 $291.7 $280.7 $287.5 $300.9 $327.8 $326.9 92.2% 1.8% Supplements to wages and salaries $24.9 $72.0 $57.0 $67.2 $66.1 $69.3 $72.6 $77.9 $81.7 $85.2 $84.4 239.4% 3.4%
Employer contribs for pensions and insurance $16.6 $50.7 $36.0 $43.9 $43.3 $45.9 $49.6 $53.9 $56.0 $57.2 $57.7 247.5% 3.4% Employer contribs for gov’t social insurance $8.3 $21.4 $21.0 $23.2 $22.8 $23.4 $23.0 $24.0 $25.7 $28.0 $26.7 223.0% 3.2%
Proprietors’ income $27.7 $28.5 $26.9 $21.0 $20.1 $18.2 $18.9 $20.5 $24.8 $24.9 $22.0 –20.7% –0.6% Farm proprietors’ income $2.1 –$0.4 $0.4 –$3.6 –$3.7 –$4.5 –$3.5 –$3.1 –$3.0 –$5.3 –$6.6 –418.9% N/A Nonfarm proprietors’ income $25.6 $28.9 $26.5 $24.6 $23.8 $22.7 $22.4 $23.6 $27.8 $30.2 $28.6 11.7% 0.3%
Farm earnings $3.4 $0.4 $0.8 –$3.0 –$3.1 –$3.9 –$3.0 –$2.5 –$2.3 –$4.7 –$6.0 –276.4% N/A Nonfarm earnings $219.2 $429.4 $346.9 $389.2 $379.2 $383.1 $375.2 $388.5 $409.8 $442.7 $439.2 100.4% 1.9%
Private earnings $174.3 $370.1 $276.3 $300.4 $289.1 $292.5 $283.6 $295.2 $315.7 $349.1 $343.9 97.3% 1.9% Government earnings $44.8 $59.4 $70.6 $88.8 $90.1 $90.6 $91.5 $93.2 $94.0 $93.6 $95.3 112.6% 2.1%
Components’ Shares of Total Earnings Wage and salary disbursements 76.4% 76.6% 75.9% 77.2% 77.1% 76.9% 75.4% 74.5% 73.9% 74.9% 75.5% Supplements to wages and salaries 11.2% 16.8% 16.4% 17.4% 17.6% 18.3% 19.5% 20.2% 20.1% 19.5% 19.5%
Employer contribs for pensions and insurance 7.5% 11.8% 10.4% 11.4% 11.5% 12.1% 13.3% 14.0% 13.7% 13.1% 13.3% Employer contribs for gov’t social insurance 3.7% 5.0% 6.0% 6.0% 6.1% 6.2% 6.2% 6.2% 6.3% 6.4% 6.2%
Proprietors’ income 12.4% 6.6% 7.7% 5.4% 5.3% 4.8% 5.1% 5.3% 6.1% 5.7% 5.1% Farm proprietors’ income 0.9% –0.1% 0.1% –0.9% –1.0% –1.2% –0.9% –0.8% –0.7% –1.2% –1.5% Nonfarm proprietors’ income 11.5% 6.7% 7.6% 6.4% 6.3% 6.0% 6.0% 6.1% 6.8% 6.9% 6.6%
Farm earnings 1.5% 0.1% 0.2% –0.8% –0.8% –1.0% –0.8% –0.6% –0.6% –1.1% –1.4% Nonfarm earnings 98.5% 99.9% 99.8% 100.8% 100.8% 101.0% 100.8% 100.6% 100.6% 101.1% 101.4%
Private earnings 78.3% 86.1% 79.5% 77.8% 76.9% 77.1% 76.2% 76.5% 77.5% 79.7% 79.4% Government earnings 20.1% 13.8% 20.3% 23.0% 24.0% 23.9% 24.6% 24.1% 23.1% 21.4% 22.0%
Location Quotients of Earnings Components Wage and salary disbursements 0.96 1.01 1.02 1.04 1.05 1.06 1.05 1.05 1.04 1.05 1.05 8.9% 0.2% Supplements to wages and salaries 1.19 1.12 1.05 1.19 1.19 1.13 1.16 1.20 1.19 1.18 1.19 –0.1% 0.0%
Employer contribs for pensions and insurance 1.26 1.17 1.03 1.22 1.21 1.12 1.17 1.23 1.19 1.16 1.20 –4.6% –0.1% Employer contribs for gov’t social insurance 1.08 1.02 1.08 1.14 1.14 1.16 1.15 1.16 1.18 1.21 1.17 8.5% 0.2%
Proprietors’ income 1.09 0.69 0.75 0.48 0.46 0.43 0.45 0.44 0.51 0.47 0.43 –60.4% –2.5% Farm proprietors’ income 0.49 N/A 0.13 N/A N/A N/A N/A N/A N/A N/A N/A Nonfarm proprietors’ income 1.21 0.75 0.81 0.59 0.56 0.54 0.55 0.53 0.59 0.58 0.58 –52.2% –2.0%
Farm earnings 0.60 0.08 0.18 N/A N/A N/A N/A N/A N/A N/A N/A Nonfarm earnings 1.01 1.01 1.01 1.01 1.01 1.02 1.01 1.01 1.01 1.02 1.02 1.0% 0.0%
Private earnings 0.99 1.06 0.98 0.93 0.92 0.93 0.92 0.93 0.94 0.96 0.96 –3.1% –0.1% Government earnings 1.11 0.78 1.14 1.50 1.53 1.46 1.47 1.45 1.39 1.30 1.34 20.6% 0.5%
Note: Average wage per job is wage and salary disbursements divided by wage and salary employment. Location quotient values greater than 1.00 indicate concentrations relative to the country. Source: U.S. Bureau of Economic Analysis, Regional Economic Information System; Utah Department of Workforce Services; and Bureau of Economic and Business Research, University of Utah.

The Structure and Economic Impact of Utah’s Coal Industry
B U R E A U O F E C O N O M I C A N D B U S I N E S S R E S E A R C H 165
Figure 8.2 Carbon County Components of Personal Income, 1970–2007
-$100.0
$0.0
$100.0
$200.0
$300.0
$400.0
$500.0
$600.0
$700.0
1970
1972
1974
1976
1978
1980
1982
1984
1986
1988
1990
1992
1994
1996
1998
2000
2002
2004
2006
Mil
lio
ns o
f C
on
sta
nt
20
07
Do
llars
Total Personal IncomeNonfarm EarningsPersonal Transfer ReceiptsProprietors IncomeFarm Earnings
Source: U.S. Bureau of Economic Analysis, Regional Economic Information System.
The main sources of nonfarm earnings in Carbon County in 1970 were coal mining, which paid $67.3 million (in constant 2007 dollars); transportation and public utilities, including the Carbon Power Plant, which paid $34.5 million; state and local government, which paid $34.2 million; retail trade, which paid $24.2 million; and services, which paid $20.3 million (Table 8.7 and Fig-ure 8.3a). Together these sectors accounted for 81 percent of total nonfarm earnings, with coal mining alone representing 30 percent (Table 8.8). By 2000, service sector earnings had almost quadrupled to $78.4 million, state and local government earnings had more than doubled to $73.2 million, retail trade earnings had grown 40 percent to $33.8 million, and transportation and public utilities and coal mining had grown more modestly to $38.7 million and $80.3 million re-spectively. These sectors accounted for 77 percent of total nonfarm earnings, but coal mining’s share had shrunk to 19 percent while that of services had doubled to 20 percent. There was sig-nificant growth in some of the smaller industries. Manufacturing earnings quadrupled from $5.2 million in 1970 to $21.3 million in 2000, and earnings from wholesale trade more than tripled from $6.7 million to $22.7 million. However, both sectors accounted for less than 6 percent of total earnings each in 2000. In 2007, under the NAICS classification system, mining (except oil and gas) paid $81 million in earnings, which represented almost 19 percent of total nonfarm earnings. This sector includes coal mining, but also covers metals and nonmetallic minerals. From 1999 SIC data we see that metal mining and nonmetallic minerals accounted for just 2 percent of total mining earnings, so it’s probably safe to assume that most of the $81 million of earnings in mining (except oil and gas) in 2007 were from coal mining. State and local government jobs paid $77.2 million in 2007, slightly more than in 2000, and represented 18 percent of total earnings. The next largest sector

The Structure and Economic Impact of Utah’s Coal Industry
166 B U R E A U O F E C O N O M I C A N D B U S I N E S S R E S E A R C H
Table 8.7 Carbon County Nonfarm Earnings by Industry, 1970–2007
(Millions of Constant 2007 Dollars)
By SIC Industry 1970 1980 1990 1991 1992 1993 1994 1995 1996 1997 1998 1999 2000 Agricultural Services, Forestry, Fishing $0.4 $0.4 $0.3 $0.3 $0.4 $0.5 $0.4 $0.4 $0.3 $0.7 $0.7 N/A N/A Mining $67.3 $180.1 $116.2 $108.5 $95.8 $93.5 $83.7 $82.5 $87.7 $96.2 $91.3 $83.3 $80.3
Metal mining N/A N/A N/A N/A N/A N/A N/A N/A $0.00 N/A N/A N/A N/A Coal mining $67.3 $172.1 $113.0 $107.8 $94.9 $90.0 $82.8 $80.8 N/A $93.3 $87.1 $78.7 $73.4 Oil and gas extraction N/A N/A $0.00 $0.00 $0.00 N/A N/A N/A N/A N/A $2.10 $2.77 N/A Nonmetallic minerals, except fuels $0.00 $0.00 N/A N/A N/A $0.20 $0.12 $0.12 N/A N/A N/A N/A N/A
Construction $10.6 $22.4 $11.6 $9.9 $24.1 $11.4 $12.0 $13.8 $13.5 $16.4 $15.0 $18.0 $15.4 Manufacturing $5.2 $9.0 $9.1 $9.7 $9.7 $9.7 $12.2 $14.2 $17.4 $19.0 $21.5 $20.0 $21.3
Petroleum and coal products $0.0 $0.0 $0.0 $0.0 N/A $0.2 N/A N/A $2.3 $3.0 N/A N/A N/A Transportation and Public Utilities $34.5 $50.2 $30.7 $27.2 $28.1 $32.3 $35.0 $33.8 $36.5 $36.1 $34.8 $31.6 $38.7 Wholesale Trade $6.7 $21.8 $15.0 $17.4 $18.0 $17.5 $19.3 $20.7 $21.6 $23.2 $22.4 $22.3 $22.7 Retail Trade $24.2 $34.8 $30.3 $31.6 $31.6 $32.1 $34.0 $31.0 $32.7 $35.4 $36.3 $35.7 $33.8
Building materials and garden equipment $1.09 $3.16 $1.35 $1.41 N/A $1.58 $1.51 $1.41 $1.52 $1.63 $1.67 $1.41 $1.69 General merchandise stores $3.80 $4.37 $2.67 $4.36 N/A $5.01 $4.69 $4.77 $4.98 $5.00 $5.36 $5.95 $5.74 Food stores $3.59 $7.53 $7.64 $7.31 $7.40 $7.02 $7.23 $7.08 $7.31 $7.49 $8.38 $8.00 $7.12 Automotive dealers and service stations $8.11 $8.00 $6.11 $6.26 $6.35 $7.40 $8.45 $7.43 $7.68 $8.29 $7.95 $7.85 $7.60 Apparel and accessory stores $0.87 $1.23 $0.46 $0.51 $0.46 $0.48 $0.62 $0.46 $0.41 $0.34 $0.36 $0.34 $0.27 Home furniture and furnishings stores $1.16 $1.69 $2.63 $2.50 $2.11 $1.79 $1.74 $1.73 $1.94 $2.08 $1.58 $1.52 $1.40 Eating and drinking places $3.54 $5.49 $5.89 $6.06 $5.72 $5.82 $6.29 $5.82 $5.98 $6.13 $6.25 $6.09 $6.20 Miscellaneous retail $2.02 $3.35 $3.54 $3.18 $3.23 $3.04 $3.45 $2.31 $2.87 $4.40 $4.75 $4.58 $3.84
Finance, Insurance, and Real Estate $5.1 $9.0 $6.1 $4.9 $6.0 $7.0 $6.5 $6.8 $6.8 $11.5 $12.2 N/A N/A Services $20.3 $42.3 $56.9 $57.2 $58.0 $63.4 $65.3 $66.5 $69.5 $73.7 $83.8 $85.9 $78.4 Government $44.8 $59.4 $70.6 $70.9 $72.0 $72.1 $77.1 $79.3 $83.3 $85.8 $86.1 $86.3 $88.8
Federal, Civilian $9.4 $9.7 $12.2 $12.4 $12.5 $12.0 $13.1 $12.1 $12.4 $13.2 $13.0 $12.5 $13.7 Military $1.2 $1.4 $2.5 $2.3 $2.3 $2.2 $2.2 $1.9 $2.0 $1.9 $1.9 $1.9 $1.9 State N/A $15.9 $19.1 $20.5 $21.2 $21.5 $23.0 $25.0 $25.9 $27.5 $26.3 $27.1 $27.8 Local N/A $32.4 $36.7 $35.6 $36.1 $36.4 $38.7 $40.3 $42.9 $43.2 $44.9 $44.8 $45.4
By NAICS Industry 2001 2002 2003 2004 2005 2006 2007
Forestry, Fishing, and Related Activities N/A N/A N/A N/A $0.3 N/A N/A Mining N/A N/A N/A N/A $76.6 N/A N/A
Oil and gas extraction N/A N/A N/A N/A N/A N/A N/A Mining (except oil and gas) $53.9 $60.2 $60.3 $65.2 $67.6 $76.6 $81.0 Support activities for mining $1.8 $3.4 $2.9 $2.1 N/A $3.9 N/A
Construction $26.6 $19.6 $16.4 $16.4 $18.7 $31.9 $24.0 Manufacturing $21.0 $16.7 $12.3 $14.8 $22.1 $25.6 $22.8
Petroleum and coal products N/A $0.0 $0.0 N/A N/A N/A N/A Transportation and Utilities $31.8 $32.3 $30.8 $33.1 $38.7 $38.2 $39.8 Wholesale Trade $20.0 $20.4 $21.7 $24.6 $26.3 $28.1 $27.8 Retail Trade $33.1 $33.3 $33.1 $30.9 $33.0 $34.6 $34.4
Motor vehicle and parts dealers $5.6 $5.6 $5.9 $5.7 $6.4 $6.9 $7.5 Furniture and home furnishings stores $1.0 $0.8 $0.6 $0.8 $0.9 $0.8 $0.8 Electronics and appliance stores $0.5 $0.4 $0.4 N/A N/A $0.3 $0.3 Building material and garden supply stores $2.2 $2.2 $2.0 $1.4 $2.0 $2.0 $1.9 Food and beverage stores $6.9 $6.2 $5.8 $5.8 $5.7 $5.6 $5.7 Health and personal care stores $0.9 $1.0 $1.0 $1.0 $0.7 $0.7 $0.7 Gasoline stations $4.7 $4.4 $4.3 $4.3 $4.6 $4.5 $4.5 Clothing and clothing accessories stores N/A N/A N/A $0.3 $0.4 $0.3 $0.3 Sporting goods, hobby, book & music stores $0.7 $0.4 $0.5 $0.4 $0.4 $0.4 $0.3 General merchandise stores $5.8 $8.4 $8.8 $8.5 $8.6 $8.9 $9.0 Miscellaneous store retailers $1.2 $0.9 $0.9 $0.8 $0.8 $1.0 $1.1 Nonstore retailers N/A N/A N/A N/A N/A $3.2 $2.3
Information $3.4 $3.1 $2.8 $3.2 $3.0 $3.6 $3.2 Financial Activity $8.6 $9.6 $10.0 $9.1 $9.9 $10.7 $11.1 Professional & Business Services $24.4 $24.7 N/A N/A N/A $22.6 N/A Education & Health Services N/A N/A N/A N/A N/A N/A N/A Leisure & Hospitality Services $10.0 $10.5 $9.8 $9.8 $10.2 $11.4 $11.4 Other Services $22.8 $24.7 $25.5 $25.2 $20.6 $21.6 $21.8 Government $90.1 $90.6 $91.5 $93.2 $94.0 $93.6 $95.3
Federal, Civilian $13.2 $13.7 $13.5 $14.6 $15.2 $15.0 $14.8 Military $2.0 $2.6 $3.6 $3.7 $4.0 $3.5 $3.3 State $29.1 $29.5 $28.5 $31.8 $32.2 $33.2 $34.5 Local $45.8 $44.8 $45.9 $43.1 $42.7 $41.9 $42.7
N/A: Data not shown to avoid disclosure of confidential information or because the data were not available. Source: U.S. Bureau of Economic Analysis, Regional Economic Information System.

The Structure and Economic Impact of Utah’s Coal Industry
B U R E A U O F E C O N O M I C A N D B U S I N E S S R E S E A R C H 167
Figure 8.3a Carbon County Nonfarm Earnings by SIC Industry, 1970–2000
$0.0
$50.0
$100.0
$150.0
$200.0
$250.0
$300.0
$350.0
$400.0
$450.0
$500.0
1970
1972
1974
1976
1978
1980
1982
1984
1986
1988
1990
1992
1994
1996
1998
2000
Mil
lio
ns o
f C
on
sta
nt
20
07
Do
llars Agricultural Services, Forestry,
Fishing
FIRE
Construction
Manufacturing
Wholesale Trade
Retail Trade
Transportation and PublicUtilities
Services
Mining
Government
Source: U.S. Bureau of Economic Analysis, Regional Economic Information System.
Figure 8.3b Carbon County Nonfarm Earnings by NAICS Industry, 2001–2007
$0.0
$50.0
$100.0
$150.0
$200.0
$250.0
$300.0
$350.0
$400.0
2001
2002
2003
2004
2005
2006
2007
Mil
lio
ns o
f C
on
sta
nt
20
07
Do
llars
Mining
Information
Financial Activity
Leisure & Hospitality Services
Professional & BusinessServicesOther Services
Manufacturing
Wholesale Trade
Construction
Retail Trade
Transportation and Utilities
Government
Note: Total earnings appear much lower in 2001 than in 2000 because figures were not reported for several industries. Source: U.S. Bureau of Economic Analysis, Regional Economic Information System.

The Structure and Economic Impact of Utah’s Coal Industry
168 B U R E A U O F E C O N O M I C A N D B U S I N E S S R E S E A R C H
Table 8.8 Carbon County Nonfarm Earnings Shares by Industry, 1970–2007
By SIC Industry 1970 1980 1990 1991 1992 1993 1994 1995 1996 1997 1998 1999 2000
Agricultural Services, Forestry, Fishing 0.2% 0.1% 0.1% 0.1% 0.1% 0.1% 0.1% 0.1% 0.1% 0.2% 0.2% N/A N/A Mining 30.3% 41.9% 33.4% 32.2% 27.9% 27.6% 24.4% 23.8% 24.0% 24.4% 22.8% 21.4% 20.8%
Metal mining N/A N/A N/A N/A N/A N/A N/A N/A 0.0% N/A N/A N/A N/A Coal mining 30.2% 40.0% 32.5% 32.0% 27.6% 26.5% 24.1% 23.3% N/A 23.7% 21.7% 20.2% 19.0% Oil and gas extraction N/A N/A 0.0% 0.0% 0.0% N/A N/A N/A N/A N/A 0.5% 0.7% N/A Nonmetallic minerals, except fuels 0.0% 0.0% N/A N/A N/A 0.1% 0.0% 0.0% N/A N/A N/A N/A N/A
Construction 4.7% 5.2% 3.3% 2.9% 7.0% 3.4% 3.5% 4.0% 3.7% 4.2% 3.8% 4.6% 4.0% Manufacturing 2.3% 2.1% 2.6% 2.9% 2.8% 2.9% 3.6% 4.1% 4.7% 4.8% 5.4% 5.1% 5.5%
Petroleum and coal products 0.0% 0.0% 0.0% 0.0% N/A 0.1% N/A N/A 0.6% 0.8% N/A N/A N/A Transportation and Public Utilities 15.5% 11.7% 8.8% 8.1% 8.2% 9.5% 10.2% 9.8% 10.0% 9.1% 8.7% 8.1% 10.0% Wholesale Trade 3.0% 5.1% 4.3% 5.2% 5.2% 5.2% 5.6% 6.0% 5.9% 5.9% 5.6% 5.7% 5.9% Retail Trade 10.9% 8.1% 8.7% 9.4% 9.2% 9.5% 9.9% 9.0% 8.9% 9.0% 9.1% 9.2% 8.8%
Building materials and garden equipment 0.5% 0.7% 0.4% 0.4% N/A 0.5% 0.4% 0.4% 0.4% 0.4% 0.4% 0.4% 0.4% General merchandise stores 1.7% 1.0% 0.8% 1.3% N/A 1.5% 1.4% 1.4% 1.4% 1.3% 1.3% 1.5% 1.5% Food stores 1.6% 1.8% 2.2% 2.2% 2.2% 2.1% 2.1% 2.0% 2.0% 1.9% 2.1% 2.1% 1.8% Automotive dealers and service stations 3.6% 1.9% 1.8% 1.9% 1.8% 2.2% 2.5% 2.1% 2.1% 2.1% 2.0% 2.0% 2.0% Apparel and accessory stores 0.4% 0.3% 0.1% 0.2% 0.1% 0.1% 0.2% 0.1% 0.1% 0.1% 0.1% 0.1% 0.1% Home furniture and furnishings stores 0.5% 0.4% 0.8% 0.7% 0.6% 0.5% 0.5% 0.5% 0.5% 0.5% 0.4% 0.4% 0.4% Eating and drinking places 1.6% 1.3% 1.7% 1.8% 1.7% 1.7% 1.8% 1.7% 1.6% 1.6% 1.6% 1.6% 1.6% Miscellaneous retail 0.9% 0.8% 1.0% 0.9% 0.9% 0.9% 1.0% 0.7% 0.8% 1.1% 1.2% 1.2% 1.0%
Finance, Insurance, and Real Estate 2.3% 2.1% 1.7% 1.4% 1.7% 2.1% 1.9% 2.0% 1.9% 2.9% 3.1% N/A N/A Services 9.1% 9.9% 16.4% 17.0% 16.9% 18.7% 19.0% 19.2% 19.0% 18.7% 20.9% 22.0% 20.3% Government 20.1% 13.8% 20.3% 21.0% 21.0% 21.3% 22.5% 22.9% 22.8% 21.8% 21.5% 22.1% 23.0%
Federal, Civilian 4.2% 2.3% 3.5% 3.7% 3.6% 3.5% 3.8% 3.5% 3.4% 3.4% 3.2% 3.2% 3.5% Military 0.5% 0.3% 0.7% 0.7% 0.7% 0.7% 0.6% 0.6% 0.5% 0.5% 0.5% 0.5% 0.5% State N/A 3.7% 5.5% 6.1% 6.2% 6.3% 6.7% 7.2% 7.1% 7.0% 6.6% 7.0% 7.2% Local N/A 7.5% 10.5% 10.6% 10.5% 10.7% 11.3% 11.6% 11.7% 11.0% 11.2% 11.5% 11.8%
By NAICS Industry 2001 2002 2003 2004 2005 2006 2007
Forestry, Fishing, and Related Activities N/A N/A N/A N/A 0.1% N/A N/A Mining N/A N/A N/A N/A 18.8% N/A N/A
Oil and gas extraction N/A N/A N/A N/A N/A N/A N/A Mining (except oil and gas) 14.3% 15.9% 16.2% 16.9% 16.6% 17.5% 18.7% Support activities for mining 0.5% 0.9% 0.8% 0.6% N/A 0.9% N/A
Construction 7.1% 5.2% 4.4% 4.2% 4.6% 7.3% 5.5% Manufacturing 5.6% 4.4% 3.3% 3.8% 5.4% 5.9% 5.3%
Petroleum and coal products N/A 0.0% 0.0% N/A N/A N/A N/A Transportation and Utilities 8.5% 8.5% 8.3% 8.6% 9.5% 8.7% 9.2% Wholesale Trade 5.3% 5.4% 5.8% 6.4% 6.5% 6.4% 6.4% Retail Trade 8.8% 8.8% 8.9% 8.0% 8.1% 7.9% 7.9%
Motor vehicle and parts dealers 1.5% 1.5% 1.6% 1.5% 1.6% 1.6% 1.7% Furniture and home furnishings stores 0.3% 0.2% 0.2% 0.2% 0.2% 0.2% 0.2% Electronics and appliance stores 0.1% 0.1% 0.1% N/A N/A 0.1% 0.1% Building material and garden supply stores 0.6% 0.6% 0.5% 0.4% 0.5% 0.5% 0.4% Food and beverage stores 1.8% 1.6% 1.6% 1.5% 1.4% 1.3% 1.3% Health and personal care stores 0.2% 0.3% 0.3% 0.3% 0.2% 0.2% 0.2% Gasoline stations 1.2% 1.2% 1.2% 1.1% 1.1% 1.0% 1.0% Clothing and clothing accessories stores N/A N/A N/A 0.1% 0.1% 0.1% 0.1% Sporting goods, hobby, book & music stores 0.2% 0.1% 0.1% 0.1% 0.1% 0.1% 0.1% General merchandise stores 1.5% 2.2% 2.4% 2.2% 2.1% 2.0% 2.1% Miscellaneous store retailers 0.3% 0.2% 0.2% 0.2% 0.2% 0.2% 0.2% Nonstore retailers N/A N/A N/A N/A N/A 0.7% 0.5%
Information 0.9% 0.8% 0.7% 0.8% 0.7% 0.8% 0.7% Financial Activity 2.3% 2.5% 2.7% 2.4% 2.4% 2.4% 2.6% Professional & Business Services 6.5% 6.5% N/A N/A N/A 5.2% N/A Education & Health Services N/A N/A N/A N/A N/A N/A N/A Leisure & Hospitality Services 2.7% 2.8% 2.6% 2.6% 2.5% 2.6% 2.6% Other Services 6.1% 6.5% 6.9% 6.5% 5.1% 4.9% 5.0% Government 24.0% 23.9% 24.6% 24.1% 23.1% 21.4% 22.0%
Federal, Civilian 3.5% 3.6% 3.6% 3.8% 3.7% 3.4% 3.4% Military 0.5% 0.7% 1.0% 0.9% 1.0% 0.8% 0.8% State 7.7% 7.8% 7.7% 8.2% 7.9% 7.6% 8.0% Local 12.2% 11.8% 12.3% 11.2% 10.5% 9.6% 9.9%
N/A: Data not shown to avoid disclosure of confidential information or because the data were not available. Source: U.S. Bureau of Economic Analysis, Regional Economic Information System and Bureau of Economic and Business Research, University of Utah.

The Structure and Economic Impact of Utah’s Coal Industry
B U R E A U O F E C O N O M I C A N D B U S I N E S S R E S E A R C H 169
was transportation and utilities, paying $39.8 million, also only slightly more than in 2000 though its share slipped to 9 percent. Earnings from retail sales were $34.4 million. Note that the NAICS retail trade sector does not match the SIC retail trade sector; for example, eating and drinking places in the SIC system were moved to leisure and hospitality services under the NAICS system. This points to another major difference between SIC and NAICS. Under SIC there was a single service sector; under NAICS services were divided into several sectors which are frequently ag-gregated into professional and business services, education and health services, leisure and hos-pitality services, and other services. Because of the increased number of sectors, each sector has fewer firms than the single service sector. Thus, in smaller counties, data may not be disclosed in some sectors to protect firm confidentiality. So in Carbon County in 2007 the only service sec-tors for which earnings were reported were leisure and hospitality services ($11.4 million) and other services ($21.8 million), which together represented less than 8 percent of total earnings. Together these major sectors—mining (except oil and gas), transportation and utilities, state and local government, retail trade, and services—accounted for 61 percent of the county’s nonfarm earnings in 2007. Using location quotients to compare the distribution of earnings by industry in Carbon County with the country as a whole reveals the importance of coal mining to the county’s economy (Ta-ble 8.9 and Figure 8.4). In 1970 coal mining’s share of nonfarm earnings in the county was more than 110 times its national share. The next highest concentration was in transportation and pub-lic utilities, whose local earnings share was just over twice its national share. By 2000 coal min-ing’s share had grown to 182 times the national average and the next highest concentration was in state government, whose local earnings share was 2.3 times the average. Transportation and public utilities’ share had fallen to just 50 percent above average. In 2007, under the NAICS clas-sification system, mining (except oil and gas) had a share of county earnings that was more than 75 times the national average. There was still a significant concentration in state government, at 2.5 times the average, and transportation and utilities was back up to a share more than twice the average. Note also that Carbon County has above-average earnings shares in several retail trade categories, including general merchandise stores, food stores, car dealers, and gas stations.

The Structure and Economic Impact of Utah’s Coal Industry
170 B U R E A U O F E C O N O M I C A N D B U S I N E S S R E S E A R C H
Table 8.9 Carbon County Nonfarm Earnings Location Quotients by Industry, 1970–2007
By SIC Industry 1970 1980 1990 1991 1992 1993 1994 1995 1996 1997 1998 1999 2000
Agricultural Services, Forestry, Fishing 0.41 0.21 0.12 0.14 0.16 0.20 0.17 0.17 0.15 0.27 0.26 N/A N/A Mining 28.65 20.14 30.60 32.96 29.67 30.14 27.65 28.17 26.77 25.24 24.12 24.87 21.85
Metal mining N/A N/A N/A N/A N/A N/A N/A N/A 0.00 N/A N/A N/A N/A Coal mining 110.63 74.22 138.93 145.50 135.18 144.70 135.63 141.40 N/A 162.46 153.86 154.23 182.14 Oil and gas extraction N/A N/A 0.00 0.00 0.00 N/A N/A N/A N/A N/A 0.84 1.27 N/A Nonmetallic minerals, except fuels 0.00 0.00 N/A N/A N/A 0.54 0.31 0.30 N/A N/A N/A N/A N/A
Construction 0.74 0.84 0.57 0.55 1.38 0.66 0.65 0.75 0.68 0.76 0.67 0.79 0.68 Manufacturing 0.09 0.09 0.14 0.15 0.15 0.16 0.19 0.22 0.27 0.28 0.31 0.31 0.33
Petroleum and coal products 0.00 0.00 0.00 0.00 N/A 0.30 N/A N/A 3.03 3.68 N/A N/A N/A Transportation and Public Utilities 2.15 1.56 1.35 1.22 1.24 1.40 1.48 1.42 1.44 1.36 1.30 1.19 1.48 Wholesale Trade 0.51 0.77 0.68 0.82 0.85 0.86 0.92 0.97 0.96 0.95 0.89 0.91 0.94 Retail Trade 1.00 0.82 0.95 1.03 1.02 1.06 1.10 1.00 1.01 1.02 1.04 1.05 1.02
Building materials and garden equipment 0.72 1.29 0.80 0.87 N/A 0.97 0.89 0.81 0.84 0.82 0.83 0.70 0.87 General merchandise stores 0.90 0.80 0.72 1.24 N/A 1.45 1.36 1.37 1.41 1.34 1.43 1.63 1.59 Food stores 0.94 1.00 1.46 1.43 1.45 1.43 1.49 1.46 1.46 1.40 1.60 1.61 1.51 Automotive dealers and service stations 1.75 1.10 1.18 1.26 1.30 1.50 1.63 1.42 1.38 1.41 1.36 1.35 1.37 Apparel and accessory stores 0.59 0.53 0.27 0.30 0.28 0.31 0.41 0.31 0.27 0.21 0.22 0.22 0.17 Home furniture and furnishings stores 0.87 0.72 1.26 1.33 1.20 1.04 0.97 0.92 0.99 0.97 0.70 0.66 0.60 Eating and drinking places 0.89 0.64 0.83 0.86 0.79 0.82 0.87 0.80 0.78 0.75 0.76 0.76 0.80 Miscellaneous retail 0.65 0.52 0.67 0.64 0.63 0.62 0.69 0.46 0.55 0.77 0.83 0.80 0.68
Finance, Insurance, and Real Estate 0.43 0.36 0.26 0.21 0.23 0.26 0.25 0.25 0.22 0.33 0.32 N/A N/A Services 0.59 0.54 0.65 0.66 0.65 0.71 0.73 0.72 0.71 0.69 0.75 0.79 0.71 Government 1.11 0.78 1.14 1.14 1.16 1.18 1.26 1.31 1.34 1.31 1.34 1.42 1.50
Federal, Civilian 0.94 0.52 0.91 0.92 0.92 0.90 1.00 0.95 0.96 0.99 1.01 1.03 1.16 Military 0.20 0.16 0.37 0.34 0.34 0.36 0.38 0.36 0.36 0.34 0.36 0.38 0.40 State N/A 1.12 1.55 1.66 1.73 1.77 1.87 2.03 2.04 2.06 2.02 2.19 2.31 Local N/A 0.93 1.24 1.21 1.21 1.23 1.29 1.34 1.37 1.30 1.36 1.42 1.49
By NAICS Industry 2001 2002 2003 2004 2005 2006 2007 Forestry, Fishing, and Related Activities N/A N/A N/A N/A 0.19 N/A N/A Mining N/A N/A N/A N/A 16.92 N/A N/A
Oil and gas extraction N/A N/A N/A N/A N/A N/A N/A Mining (except oil and gas) 63.00 71.23 75.31 73.55 70.61 71.72 75.62 Support activities for mining 2.53 5.11 4.46 2.95 N/A 3.24 N/A
Construction 1.16 0.85 0.73 0.69 0.72 1.12 0.90 Manufacturing 0.40 0.32 0.25 0.30 0.44 0.47 0.44
Petroleum and coal products N/A 0.00 0.00 N/A N/A N/A N/A Transportation and Utilities 1.86 1.93 1.91 1.93 2.19 2.03 2.12 Wholesale Trade 1.02 1.05 1.14 1.24 1.24 1.22 1.21 Retail Trade 1.29 1.28 1.32 1.23 1.25 1.25 1.28
Motor vehicle and parts dealers 1.09 1.06 1.14 1.11 1.18 1.23 1.40 Furniture and home furnishings stores 0.88 0.72 0.58 0.78 0.78 0.65 0.70 Electronics and appliance stores 0.34 0.27 0.30 N/A N/A 0.21 0.20 Building material and garden supply stores 1.04 1.01 0.93 0.62 0.84 0.78 0.79 Food and beverage stores 1.71 1.51 1.48 1.47 1.42 1.34 1.42 Health and personal care stores 0.56 0.59 0.57 0.57 0.38 0.37 0.33 Gasoline stations 3.56 3.49 3.57 3.61 3.69 3.54 3.63 Clothing and clothing accessories stores N/A N/A N/A 0.17 0.19 0.17 0.18 Sporting goods, hobby, book & music stores 0.86 0.48 0.60 0.50 0.47 0.43 0.41 General merchandise stores 1.80 2.44 2.60 2.48 2.36 2.31 2.38 Miscellaneous store retailers 0.68 0.55 0.59 0.56 0.50 0.62 0.70 Nonstore retailers N/A N/A N/A N/A N/A 2.31 1.62
Information 0.21 0.20 0.20 0.22 0.21 0.23 0.21 Financial Activity 0.23 0.26 0.27 0.24 0.24 0.24 0.26 Professional & Business Services 0.43 0.44 N/A N/A N/A 0.33 N/A Education & Health Services N/A N/A N/A N/A N/A N/A N/A Leisure & Hospitality Services 0.72 0.73 0.68 0.66 0.65 0.68 0.68 Other Services 2.10 2.17 2.27 2.22 1.74 1.73 1.76 Government 1.53 1.46 1.47 1.45 1.39 1.30 1.34
Federal, Civilian 1.17 1.15 1.16 1.18 1.17 1.10 1.10 Military 0.42 0.48 0.62 0.59 0.59 0.49 0.46 State 2.42 2.35 2.23 2.52 2.45 2.38 2.49 Local 1.49 1.39 1.43 1.31 1.23 1.13 1.16
Note: Values greater than 1.00 indicate concentrations relative to the country. Source: U.S. Bureau of Economic Analysis, Regional Economic Information System and Bureau of Economic and Business Research, University of Utah.

The Structure and Economic Impact of Utah’s Coal Industry
B U R E A U O F E C O N O M I C A N D B U S I N E S S R E S E A R C H 171
Figure 8.4 Carbon County Basic Industries’ Location Quotients, 2001–2007
1.00
11.00
21.00
31.00
41.00
51.00
61.00
71.00
81.00
2001
2002
2003
2004
2005
2006
2007
Min
ing
LQ
s
1.00
1.50
2.00
2.50
3.00
3.50
4.00
4.50
5.00
5.50
Oth
er
LQ
s(i
ncl
. S
upport
Act
ivitie
s fo
r M
inin
g)
M ining (except o il and gas) Support activities fo r mining
State Gov't. Other ServicesTransportation and Utilities Local Gov't.
Retail Trade Wholesale TradeFederal Gov't. (civilian)
Source: U.S. Bureau of Economic Analysis and Bureau of Economic and Business Research, University of Utah.

The Structure and Economic Impact of Utah’s Coal Industry
172 B U R E A U O F E C O N O M I C A N D B U S I N E S S R E S E A R C H
8.2.1.3 Retail Sales
Table 8.10
Carbon County Retail Sales by Category, 1978–2008 (Thousands of Constant 2008 Dollars)
Year Bu
ild
ing
&
Gard
en
Gen
era
l M
erc
han
dis
e
Fo
od
Sto
res
Mo
tor
Veh
icle
D
eale
rs
Ap
pare
l &
A
ccess
ory
Fu
rnit
ure
Eati
ng
&
Dri
nkin
g
Mis
cellan
eo
us
1978 $19,792.8 $62,582.2 N/A $57,803.3 $7,340.6 $8,987.8 $15,982.0 $25,072.3 1979 $25,578.1 $68,915.1 N/A $54,793.0 $6,975.5 $9,523.4 $16,981.5 $22,026.0 1980 $23,772.4 $68,718.2 N/A $39,466.4 $6,844.9 $10,149.2 $14,870.0 $18,949.0 1990 $11,439.0 $54,172.0 N/A $29,331.2 $4,536.6 $7,580.8 $16,380.6 $38,301.9 1991 $10,712.8 $49,812.8 N/A $25,048.3 $2,435.7 $4,758.4 $15,367.4 $25,252.9 1992 $10,426.5 $52,324.1 N/A $31,080.6 $2,611.4 $5,080.1 $16,074.5 $13,301.5 1993 $6,009.8 $49,533.0 N/A $37,085.3 $2,798.3 $6,670.3 $16,745.6 $11,431.6 1994 $6,491.6 $51,335.1 N/A $41,561.8 $3,270.7 $7,217.7 $17,222.8 $12,468.5 1995 $6,993.9 $52,471.0 N/A $48,647.8 $2,609.2 $7,173.3 $16,869.4 $11,301.0 1996 $8,333.6 $55,196.6 N/A $45,360.7 $2,843.8 $6,772.4 $17,136.5 $9,848.8 1997 $8,599.0 $56,294.6 N/A $44,656.4 $1,931.9 $7,150.1 $17,947.3 $10,889.5 1998 $11,173.4 $57,133.8 N/A $40,640.7 $1,917.1 $7,223.6 $16,815.1 $13,537.5 1999 $12,353.4 $55,009.7 N/A $38,259.2 $1,661.4 $7,070.6 $18,344.0 $14,602.7 2000 $9,579.0 $53,915.9 N/A $37,262.4 $1,140.3 $6,603.6 $18,064.6 $15,466.8 2001 $10,336.3 $50,828.5 $46,592.1 $40,943.0 $1,061.3 $6,076.8 $17,303.0 $15,696.3 2002 $11,195.4 $66,765.0 $37,758.2 $46,921.8 $892.4 $6,238.6 $17,592.9 $15,100.8 2003 $8,268.6 $68,744.6 $30,848.3 $44,485.7 $760.6 $6,054.8 $16,486.9 $15,479.5 2004 $7,344.3 $68,615.3 $31,389.7 $48,709.0 $673.2 $5,147.3 $17,335.5 $20,980.4 2005 $13,426.5 $71,476.8 $32,742.2 $51,189.2 $1,547.9 $6,227.4 $19,890.8 $22,301.2 2006 $12,906.9 $74,277.2 $37,651.0 $51,509.7 $1,578.6 $6,126.3 $21,222.6 $25,825.7 2007 $14,653.9 $74,133.4 $31,643.5 $65,122.3 $1,675.7 $5,955.4 $20,184.1 $23,298.1 2008 $12,886.6 $77,395.7 $30,164.3 $60,225.4 $2,150.2 $11,329.3 $20,206.0 $19,348.2
Change –34.9% 23.7% 4.2% –70.7% 26.1% 26.4% –22.8% AARC –1.4% 0.7% –6.0% 0.1% –4.0% 0.8% 0.8% –0.9%
NA: Not available; amounts for this category were not reported. The Tax Commission did not publish sales figures for Food Stores prior to 2002. In the quarterly sales data for 2001-06 there are two General Merchandise categories; the second of these generally corresponds to the Food Stores figures from the 2002-06 annual sales data. In several counties the amounts for General Merchandise sales in 1978 through 2000 matched up with the 2001-06 Food Stores sales and so have been reclassified into the latter category. Source: Utah State Tax Commission.
Table 8.11 2008 Retail Sales in Carbon County
Category Amount Share Building & Garden $12,886,582 5.5% General Merchandise $77,395,689 33.1% Food Stores $30,164,267 12.9% Motor Vehicle Dealers $60,225,377 25.8% Apparel & Accessory $2,150,167 0.9% Furniture $11,329,317 4.8% Eating & Drinking $20,205,998 8.6% Miscellaneous $19,348,165 8.3%
Total $233,705,562 100% Source: Utah State Tax Commission.

The Structure and Economic Impact of Utah’s Coal Industry
B U R E A U O F E C O N O M I C A N D B U S I N E S S R E S E A R C H 173
8.2.1.4 Residential Construction
Exhibit 8.9
Permit-Authorized New Dwelling Units and Value of Residential Construction in Carbon County, 1975–2008
Year Sin
gle
-Fam
ily H
om
es
Du
ple
xes
an
d
Tw
in H
om
es
Co
nd
om
iniu
ms
Ap
art
men
ts
(3 o
r m
ore
units)
Cab
ins
Man
ufa
ctu
red
/
Mo
bil
e H
om
es
To
tal
Valu
e
(thousa
nds
of
co
nst
ant
2008 d
olla
rs)
1975 107 12 0 0 0 0 119 $12,808.0 1980 128 4 0 4 0 50 186 $16,167.1 1990 17 0 0 0 0 0 17 $2,370.7 1991 17 0 0 0 2 21 40 $2,583.4 1992 18 0 0 0 2 19 39 $2,496.1 1993 24 0 0 0 0 12 36 $2,873.3 1994 33 0 0 0 0 29 62 $4,337.4 1995 26 4 0 0 1 35 66 $3,770.5 1996 26 0 0 0 2 65 93 $3,765.3 1997 22 2 0 0 2 62 88 $3,452.4 1998 35 0 0 0 7 128 170 $16,689.2 1999 37 0 0 72 8 100 217 $19,441.5 2000 19 0 0 0 9 64 92 $4,740.4 2001 18 0 0 0 13 36 67 $5,378.9 2002 27 0 0 0 10 44 81 $5,202.9 2003 29 2 0 0 8 40 79 $7,434.2 2004 23 0 0 0 11 36 70 $8,552.4 2005 32 0 0 0 6 22 60 $6,500.5 2006 47 0 0 0 2 23 72 $10,054.0 2007 52 0 0 0 18 40 110 $17,557.9 2008 29 0 4 0 7 17 57 $9,177.4
New Single-Family Homes and Total Residential Construction Value
0
20
40
60
80
100
120
140
1975
1980
1990
1991
1992
1993
1994
1995
1996
1997
1998
1999
2000
2001
2002
2003
2004
2005
2006
2007
2008
Sin
gle
-Fam
ily H
om
e P
erm
its
$0
$5
$10
$15
$20
$25
Valu
e(M
illio
ns
of
Const
ant
2008 D
olla
rs)
Single-Family Homes
Total Residential Value
Note: Prior to 1994, condos and other multifamily units were grouped together. Source: Bureau of Economic and Business Research, University of Utah.

The Structure and Economic Impact of Utah’s Coal Industry
174 B U R E A U O F E C O N O M I C A N D B U S I N E S S R E S E A R C H
8.2.1.5 Nonresidential Construction
Exhibit 8.10
Value of Nonresidential Construction in Carbon County, 1975–2008 (Thousands of Constant 2008 Dollars)
Year Ho
tels
& M
ote
ls
Ch
urc
hes
&
Oth
er
Reli
gio
us
Ind
ust
rial /
W
are
ho
use
/
Man
ufa
ctu
rin
g
Ho
spit
al
&
Inst
itu
tio
nal
Off
ice,
Ban
k,
Pro
fess
ion
al
Reta
il,
Merc
an
tile
, R
est
au
ran
t
Pu
blic
Bu
ild
ing
s &
P
roje
cts
Oth
er*
Ad
dit
ion
s an
d
Alt
era
tio
ns
Total 1975 $0.0 $0.0 $0.0 $0.0 $1,311.2 $3,198.6 $0.0 $603.4 $0.0 $5,113.2 1980 $0.0 $3,612.4 $2,308.5 $1,235.3 $482.3 $2,877.8 $886.2 $2,593.3 $1,322.1 $15,318.0 1990 $0.0 $0.0 $7,111.2 $0.0 $0.0 $2,954.6 $1,852.4 $630.9 $582.6 $13,131.7 1991 $0.0 $0.0 $974.1 $0.0 $31.5 $78.7 $0.0 $695.9 $1,507.9 $3,288.1 1992 $0.0 $1.5 $7.7 $1.5 $0.0 $1.5 $0.0 $10,421.6 $92.8 $10,526.8 1993 $0.0 $1,021.6 $539.8 $614.5 $0.0 $300.5 $0.0 $1,082.3 $2,013.2 $5,571.8 1994 $0.0 $904.7 $959.9 $0.0 $114.5 $0.0 $2,605.9 $1,569.1 $1,066.8 $7,221.0 1995 $0.0 $0.0 $1,910.1 $926.7 $2.9 $7.2 $0.0 $1,121.8 $1,597.8 $5,566.4 1996 $0.0 $0.0 $11,350.7 $0.0 $150.5 $83.2 $2,708.8 $717.1 $2,789.6 $17,799.8 1997 $0.0 $189.4 $1,953.8 $0.0 $467.5 $1,633.1 $0.0 $1,220.7 $2,253.2 $7,717.7 1998 $0.0 $0.0 $14,896.5 $0.0 $0.0 $1,272.7 $0.0 $1,155.7 $2,450.6 $19,775.5 1999 $0.0 $0.0 $7,281.6 $0.0 $47.5 $1,362.9 $0.0 $2,163.8 $1,295.0 $12,150.8 2000 $0.0 $8.4 $2,127.0 $0.0 $377.0 $345.6 $0.0 $479.5 $6,075.8 $9,413.2 2001 $0.0 $1,169.1 $1,963.0 $8.0 $92.7 $7,730.5 $0.0 $351.7 $608.8 $11,923.8 2002 $0.0 $0.0 $2,823.8 $356.8 $1,453.1 $570.8 $0.0 $908.1 $2,587.4 $8,699.9 2003 $0.0 $164.9 $383.3 $774.0 $387.2 $409.1 $0.0 $345.2 $1,784.7 $4,248.4 2004 $0.0 $0.0 $6,689.0 $271.4 $455.2 $261.8 $0.0 $620.5 $975.9 $9,273.7 2005 $0.0 $0.0 $297.9 $0.0 $545.6 $60.5 $29.7 $1,326.6 $1,845.2 $4,105.6 2006 $0.0 $0.0 $1,344.7 $0.0 $0.0 $31.9 $1,601.7 $356.1 $966.9 $4,301.3 2007 $0.0 $1,948.9 $1,263.6 $258.8 $1,549.5 $1,583.2 $414.0 $834.9 $853.4 $8,706.3 2008 $0.0 $0.0 $1,328.9 $0.0 $1,074.9 $1,400.0 $4,895.1 $1,007.3 $2,045.0 $11,751.2
1990–2008 Total
$0.0 $5,408.7 $65,206.5 $3,211.7 $6,749.6 $20,087.7 $14,107.6 $27,008.6 $33,392.4 $175,172.9
* Other includes school and educational buildings, service stations and repair garages, agricultural buildings, and structures other than buildings.
Total Value of Nonresidential Construction
$0
$5
$10
$15
$20
$25
1975
1980
1990
1991
1992
1993
1994
1995
1996
1997
1998
1999
2000
2001
2002
2003
2004
2005
2006
2007
2008
Mil
lio
ns o
f C
on
sta
nt
20
08
Do
llars
Source: Bureau of Economic and Business Research, University of Utah.

The Structure and Economic Impact of Utah’s Coal Industry
B U R E A U O F E C O N O M I C A N D B U S I N E S S R E S E A R C H 175
8.2.2 Emery County
8.2.2.1 Employment Emery County’s total employment74 grew 2.8 percent annually from 2,083 in 1970 to 5,814 in 2007. This was the fastest growth of the three coal counties, though Emery has the smallest em-ployment base, about half that of Carbon and Sevier. However, as Exhibit 8.11 shows, Emery’s current employment remains well below its 1982 peak of 7,031. The county’s economy boomed from 1971 to 1982, with total employment growing 260 percent. Mining alone contributed more than one-third of the total job growth over this period, expanding by more than 500 percent. Then employment dropped almost 30 percent in just two years to 5,074. It was essentially flat for the next decade and has grown slowly since 1995, up 16 percent in the 12 years to 2007. As in Carbon County, nonfarm proprietors’ employment was the fastest-growing type of em-ployment in Emery County, growing 3.6 percent annually between 1970 and 2007 from 326 to 1,196. Nonfarm proprietors’ share of total employment increased over the period—after a dip to 7 percent in 1980—from almost 16 percent to almost 21 percent. Wage and salary employment grew 3 percent annually, almost tripling from 1,404 in 1970 to 4,121 in 2007. However, this was subject to the boom, bust, and subsequent slow growth noted above; in fact, 2007 wage and sal-ary employment was essentially unchanged from its 1984 level of 4,108. Proprietors’ employ-ment did not experience the boom and bust of the 1970s and early ’80s but grew more steadily over the study period. Looking at employment by broad industry, Emery was unique among the three study counties in that it was the only one in which there were more farm jobs in 2007 than in 1970. Although farm employment grew 31 percent from 409 to 536 over the period, it has been slowly declining since reaching a high of 566 jobs in 2000. It currently represents 9 percent of total employment, down from nearly 20 percent in 1970. Nonfarm employment more than tripled between 1970 and 2007, from 1,674 to 5,278. However, this closely followed the boom and bust noted above, and 2007’s nonfarm jobs were still below the county’s 1982 peak of 6,531. Within nonfarm employment, in 1970 mining, state and local government, and retail trade were the largest sectors, providing 397, 365, and 248 jobs respectively (Table 8.12). Together they ac-counted for nearly half of all farm and nonfarm employment, with mining alone capturing al-most 20 percent (Table 8.13). After peaking at nearly 40 percent of total employment in 1980, mining had shrunk to 15 percent by 2000, with 816 jobs. However, it was second only to ser-vices (18.5 percent), and was followed by local government and retail trade (each about 14 per-cent) and transportation and utilities (12 percent). As of 2007 mining employment was not disclosed to protect firm confidentiality. The largest known sectors were retail trade (13 percent), local government (12 percent), and construction (10 percent).
74 Total employment covers farm and nonfarm employment, and proprietors’ and wage and salary employment, and counts full- and part-time jobs equally.

The Structure and Economic Impact of Utah’s Coal Industry
176 B U R E A U O F E C O N O M I C A N D B U S I N E S S R E S E A R C H
Exhibit 8.11 Emery County Employment Summary, 1970–2007
1970 1980 1990 2000 2001 2002 2003 2004 2005 2006 2007 Change AARC
Total Employment 2,083 5,508 5,063 5,377 5,333 5,259 5,408 5,625 5,680 5,843 5,814 179.1% 2.8% Employment by Type
Wage and Salary Employment 1,404 4,709 3,873 3,826 3,819 3,773 3,869 3,992 4,050 4,158 4,121 193.5% 3.0% Proprietors’ Employment 679 799 1,190 1,551 1,514 1,486 1,539 1,633 1,630 1,685 1,693 149.3% 2.5%
Farm Proprietors’ Employment 353 406 431 519 516 519 507 505 507 502 497 40.8% 0.9% Nonfarm Proprietors’ Employment 326 393 759 1,032 998 967 1,032 1,128 1,123 1,183 1,196 266.9% 3.6%
Employment by Industry Farm Employment 409 471 498 566 564 559 555 550 554 547 536 31.1% 0.7% Nonfarm Employment 1,674 5,037 4,565 4,811 4,769 4,700 4,853 5,075 5,126 5,296 5,278 215.3% 3.2%
Private Employment 1,194 4,334 3,698 3,895 3,855 3,802 3,972 4,165 4,244 4,413 4,397 268.3% 3.6% Government Employment 480 703 867 916 914 898 881 910 882 883 881 83.5% 1.7%
Shares by Type Wage and Salary Employment 67.4% 85.5% 76.5% 71.2% 71.6% 71.7% 71.5% 71.0% 71.3% 71.2% 70.9% Proprietors’ Employment 32.6% 14.5% 23.5% 28.8% 28.4% 28.3% 28.5% 29.0% 28.7% 28.8% 29.1%
Farm Proprietors’ Employment 16.9% 7.4% 8.5% 9.7% 9.7% 9.9% 9.4% 9.0% 8.9% 8.6% 8.5% Nonfarm Proprietors’ Employment 15.7% 7.1% 15.0% 19.2% 18.7% 18.4% 19.1% 20.1% 19.8% 20.2% 20.6%
Shares by Industry Farm Employment 19.6% 8.6% 9.8% 10.5% 10.6% 10.6% 10.3% 9.8% 9.8% 9.4% 9.2% Nonfarm Employment 80.4% 91.4% 90.2% 89.5% 89.4% 89.4% 89.7% 90.2% 90.2% 90.6% 90.8%
Private Employment 57.3% 78.7% 73.0% 72.4% 72.3% 72.3% 73.4% 74.0% 74.7% 75.5% 75.6% Government Employment 23.0% 12.8% 17.1% 17.0% 17.1% 17.1% 16.3% 16.2% 15.5% 15.1% 15.2% Location Quotients by Type
Wage and Salary Employment 0.78 1.00 0.91 0.85 0.86 0.87 0.87 0.87 0.88 0.89 0.89 13.4% 0.3% Proprietors’ Employment 2.38 1.01 1.50 1.73 1.68 1.63 1.58 1.56 1.50 1.47 1.46 –38.8% –1.3%
Farm Proprietors’ Employment 5.69 3.37 5.31 7.25 7.39 7.45 7.32 7.21 7.29 7.24 7.39 29.7% 0.7% Nonfarm Proprietors’ Employment 1.46 0.59 1.07 1.25 1.20 1.14 1.14 1.16 1.11 1.10 1.09 –25.2% –0.8%
Location Quotients by Industry Farm Employment 4.52 2.57 4.35 5.64 5.78 5.76 5.67 5.65 5.83 5.82 5.87 29.8% 0.7% Nonfarm Employment 0.84 0.95 0.92 0.91 0.91 0.91 0.91 0.92 0.92 0.92 0.92 9.8% 0.3%
Private Employment 0.73 0.98 0.89 0.86 0.86 0.86 0.87 0.88 0.88 0.89 0.89 21.1% 0.5% Government Employment 1.31 0.78 1.12 1.24 1.23 1.21 1.15 1.16 1.13 1.12 1.13 –13.6% –0.4%
Note: Location quotient values greater than 1.00 indicate concentrations relative to the country.
Employment by Type and Industry, 1970-2007
0
1,000
2,000
3,000
4,000
5,000
6,000
7,000
1970
1972
1974
1976
1978
1980
1982
1984
1986
1988
1990
1992
1994
1996
1998
2000
2002
2004
2006
Fu
ll-
an
d P
art
-Tim
e J
ob
s
Total EmploymentNonfarm EmploymentWage & Salary EmploymentProprietors' EmploymentFarm Employment
Source: U.S. Bureau of Economic Analysis, Regional Economic Information System and Bureau of Economic and Business Research, University of Utah.
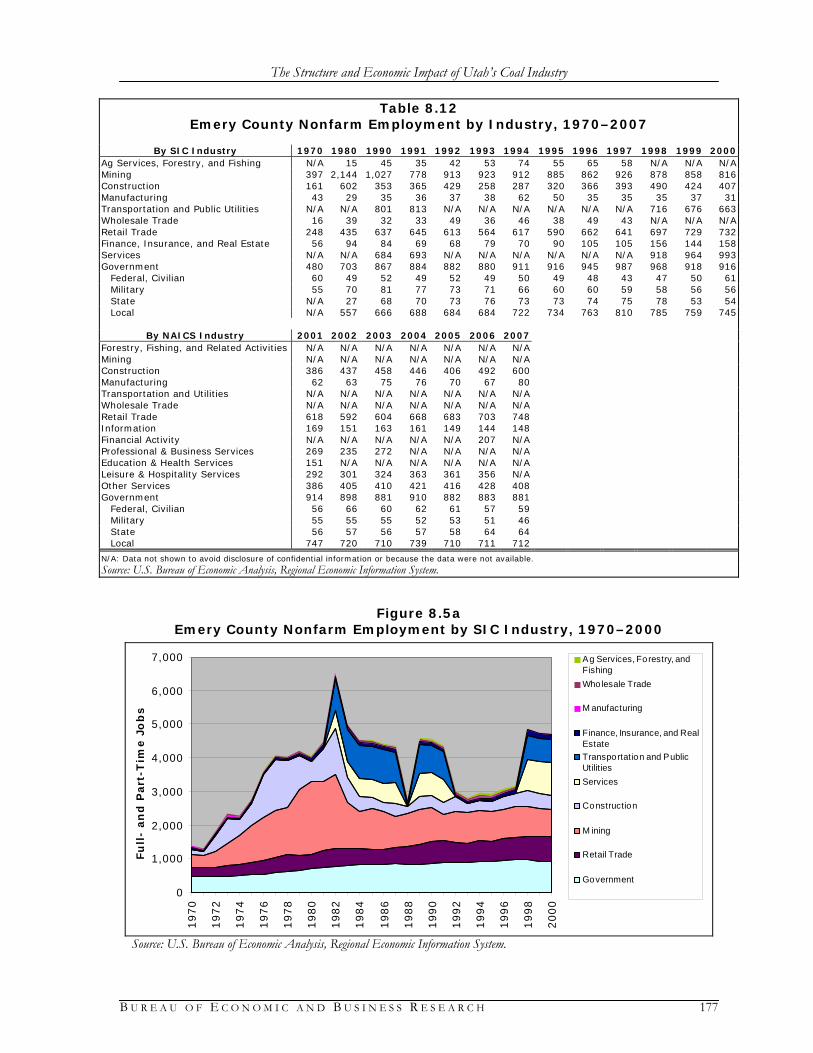
The Structure and Economic Impact of Utah’s Coal Industry
B U R E A U O F E C O N O M I C A N D B U S I N E S S R E S E A R C H 177
Table 8.12 Emery County Nonfarm Employment by Industry, 1970–2007
By SIC Industry 1970 1980 1990 1991 1992 1993 1994 1995 1996 1997 1998 1999 2000
Ag Services, Forestry, and Fishing N/A 15 45 35 42 53 74 55 65 58 N/A N/A N/A Mining 397 2,144 1,027 778 913 923 912 885 862 926 878 858 816 Construction 161 602 353 365 429 258 287 320 366 393 490 424 407 Manufacturing 43 29 35 36 37 38 62 50 35 35 35 37 31 Transportation and Public Utilities N/A N/A 801 813 N/A N/A N/A N/A N/A N/A 716 676 663 Wholesale Trade 16 39 32 33 49 36 46 38 49 43 N/A N/A N/A Retail Trade 248 435 637 645 613 564 617 590 662 641 697 729 732 Finance, Insurance, and Real Estate 56 94 84 69 68 79 70 90 105 105 156 144 158 Services N/A N/A 684 693 N/A N/A N/A N/A N/A N/A 918 964 993 Government 480 703 867 884 882 880 911 916 945 987 968 918 916
Federal, Civilian 60 49 52 49 52 49 50 49 48 43 47 50 61 Military 55 70 81 77 73 71 66 60 60 59 58 56 56 State N/A 27 68 70 73 76 73 73 74 75 78 53 54 Local N/A 557 666 688 684 684 722 734 763 810 785 759 745
By NAICS Industry 2001 2002 2003 2004 2005 2006 2007
Forestry, Fishing, and Related Activities N/A N/A N/A N/A N/A N/A N/A Mining N/A N/A N/A N/A N/A N/A N/A Construction 386 437 458 446 406 492 600 Manufacturing 62 63 75 76 70 67 80 Transportation and Utilities N/A N/A N/A N/A N/A N/A N/A Wholesale Trade N/A N/A N/A N/A N/A N/A N/A Retail Trade 618 592 604 668 683 703 748 Information 169 151 163 161 149 144 148 Financial Activity N/A N/A N/A N/A N/A 207 N/A Professional & Business Services 269 235 272 N/A N/A N/A N/A Education & Health Services 151 N/A N/A N/A N/A N/A N/A Leisure & Hospitality Services 292 301 324 363 361 356 N/A Other Services 386 405 410 421 416 428 408 Government 914 898 881 910 882 883 881
Federal, Civilian 56 66 60 62 61 57 59 Military 55 55 55 52 53 51 46 State 56 57 56 57 58 64 64 Local 747 720 710 739 710 711 712
N/A: Data not shown to avoid disclosure of confidential information or because the data were not available. Source: U.S. Bureau of Economic Analysis, Regional Economic Information System.
Figure 8.5a
Emery County Nonfarm Employment by SIC Industry, 1970–2000
0
1,000
2,000
3,000
4,000
5,000
6,000
7,000
1970
1972
1974
1976
1978
1980
1982
1984
1986
1988
1990
1992
1994
1996
1998
2000
Fu
ll-
an
d P
art
-Tim
e J
ob
s
Ag Services, Forestry, andFishing
Wholesale Trade
M anufacturing
Finance, Insurance, and RealEstate
Transportation and PublicUtilities
Services
Construction
M ining
Retail Trade
Government
Source: U.S. Bureau of Economic Analysis, Regional Economic Information System.

The Structure and Economic Impact of Utah’s Coal Industry
178 B U R E A U O F E C O N O M I C A N D B U S I N E S S R E S E A R C H
Figure 8.5b Emery County Nonfarm Employment by NAICS Industry, 2001–2007
0
500
1,000
1,500
2,000
2,500
3,000
3,500
4,000
2001
2002
2003
2004
2005
2006
2007
Fu
ll-
an
d P
art
-Tim
e J
ob
s
Financial Activity
M anufacturing
Information
Construction
Edu. & Health Services
Pro f. & Bus. Services
Leisure & Hospitality Services
Other Services
Retail Trade
Government
Note: Total employment appears much lower in 2001 than in 2000 because figures were not reported for several industries. Source: U.S. Bureau of Economic Analysis, Regional Economic Information System.

The Structure and Economic Impact of Utah’s Coal Industry
B U R E A U O F E C O N O M I C A N D B U S I N E S S R E S E A R C H 179
Table 8.13 Emery County Nonfarm Employment Shares by Industry, 1970–2007
By SIC Industry 1970 1980 1990 1991 1992 1993 1994 1995 1996 1997 1998 1999 2000
Ag Services, Forestry, and Fishing N/A 0.3% 0.9% 0.7% 0.8% 1.1% 1.5% 1.1% 1.3% 1.1% N/A N/A N/A Mining 19.1% 38.9% 20.3% 16.1% 18.3% 19.3% 18.2% 17.7% 16.8% 17.7% 15.9% 15.9% 15.2% Construction 7.7% 10.9% 7.0% 7.5% 8.6% 5.4% 5.7% 6.4% 7.1% 7.5% 8.9% 7.9% 7.6% Manufacturing 2.1% 0.5% 0.7% 0.7% 0.7% 0.8% 1.2% 1.0% 0.7% 0.7% 0.6% 0.7% 0.6% Transportation and Public Utilities N/A N/A 15.8% 16.8% N/A N/A N/A N/A N/A N/A 13.0% 12.5% 12.3% Wholesale Trade 0.8% 0.7% 0.6% 0.7% 1.0% 0.8% 0.9% 0.8% 1.0% 0.8% N/A N/A N/A Retail Trade 11.9% 7.9% 12.6% 13.3% 12.3% 11.8% 12.3% 11.8% 12.9% 12.2% 12.7% 13.5% 13.6% Finance, Insurance, and Real Estate 2.7% 1.7% 1.7% 1.4% 1.4% 1.7% 1.4% 1.8% 2.0% 2.0% 2.8% 2.7% 2.9% Services N/A N/A 13.5% 14.3% N/A N/A N/A N/A N/A N/A 16.7% 17.9% 18.5% Government 23.0% 12.8% 17.1% 18.3% 17.7% 18.4% 18.2% 18.3% 18.4% 18.8% 17.6% 17.0% 17.0%
Federal, Civilian 2.9% 0.9% 1.0% 1.0% 1.0% 1.0% 1.0% 1.0% 0.9% 0.8% 0.9% 0.9% 1.1% Military 2.6% 1.3% 1.6% 1.6% 1.5% 1.5% 1.3% 1.2% 1.2% 1.1% 1.1% 1.0% 1.0% State N/A 0.5% 1.3% 1.4% 1.5% 1.6% 1.5% 1.5% 1.4% 1.4% 1.4% 1.0% 1.0% Local N/A 10.1% 13.2% 14.2% 13.7% 14.3% 14.4% 14.6% 14.9% 15.5% 14.3% 14.1% 13.9%
By NAICS Industry 2001 2002 2003 2004 2005 2006 2007
Forestry, Fishing, and Related Activities N/A N/A N/A N/A N/A N/A N/A Mining N/A N/A N/A N/A N/A N/A N/A Construction 7.2% 8.3% 8.5% 7.9% 7.1% 8.4% 10.3% Manufacturing 1.2% 1.2% 1.4% 1.4% 1.2% 1.1% 1.4% Transportation and Utilities N/A N/A N/A N/A N/A N/A N/A Wholesale Trade N/A N/A N/A N/A N/A N/A N/A Retail Trade 11.6% 11.3% 11.2% 11.9% 12.0% 12.0% 12.9% Information 3.2% 2.9% 3.0% 2.9% 2.6% 2.5% 2.5% Financial Activity N/A N/A N/A N/A N/A 3.5% N/A Professional & Business Services 5.0% 4.5% 5.0% N/A N/A N/A N/A Education & Health Services 2.8% N/A N/A N/A N/A N/A N/A Leisure & Hospitality Services 5.5% 5.7% 6.0% 6.5% 6.4% 6.1% N/A Other Services 7.2% 7.7% 7.6% 7.5% 7.3% 7.3% 7.0% Government 17.1% 17.1% 16.3% 16.2% 15.5% 15.1% 15.2%
Federal, Civilian 1.1% 1.3% 1.1% 1.1% 1.1% 1.0% 1.0% Military 1.0% 1.0% 1.0% 0.9% 0.9% 0.9% 0.8% State 1.1% 1.1% 1.0% 1.0% 1.0% 1.1% 1.1% Local 14.0% 13.7% 13.1% 13.1% 12.5% 12.2% 12.2%
Shares are of total farm and nonfarm employment. N/A: Data not shown to avoid disclosure of confidential information or because the data were not available. Source: U.S. Bureau of Economic Analysis, Regional Economic Information System.
Comparing Emery County’s economy to that of the country as a whole, in 1970 mining’s share of total employment was more than 23 times the national average (Exhibit 8.12). State and local government and construction both had local employment shares about 60 percent greater than their national shares. By 2000 Emery’s mining specialization was more than 32 times the national rate, after peaking at almost 35 times in 1980. The county’s share of employment in transporta-tion and utilities was two-and-a-half times the national average; and it maintained concentrations in local government (77 percent above average) and construction (34 percent above average). In 2007, of those sectors for which employment was reported, most had above-average employ-ment shares. Concentrations ranged from 21 percent greater than the national rate for retail trade jobs to 60 percent greater for construction. Only manufacturing, the federal government, and state government had smaller employment shares than in the country as a whole.

The Structure and Economic Impact of Utah’s Coal Industry
180 B U R E A U O F E C O N O M I C A N D B U S I N E S S R E S E A R C H
Exhibit 8.12 Emery County Nonfarm Employment Location Quotients by Industry, 1970–2007
By SIC Industry 1970 1980 1990 1991 1992 1993 1994 1995 1996 1997 1998 1999 2000
Ag Services, Forestry, and Fishing N/A 0.34 0.85 0.67 0.79 0.96 1.25 0.92 1.02 0.89 N/A N/A N/A Mining 23.39 34.80 27.08 21.78 27.17 29.32 28.25 29.69 31.00 31.70 29.98 32.27 32.27 Construction 1.60 2.21 1.34 1.54 1.76 1.09 1.13 1.23 1.36 1.40 1.63 1.39 1.34 Manufacturing 0.10 0.03 0.05 0.05 0.06 0.06 0.09 0.08 0.05 0.05 0.05 0.06 0.05 Transportation and Public Utilities N/A N/A 3.37 3.55 N/A N/A N/A N/A N/A N/A 2.69 2.56 2.49 Wholesale Trade 0.17 0.14 0.13 0.14 0.20 0.16 0.20 0.16 0.21 0.18 N/A N/A N/A Retail Trade 0.79 0.50 0.77 0.81 0.74 0.72 0.74 0.70 0.76 0.73 0.77 0.82 0.83 Finance, Insurance, and Real Estate 0.40 0.22 0.22 0.19 0.18 0.22 0.19 0.24 0.27 0.27 0.36 0.35 0.37 Services N/A N/A 0.49 0.50 N/A N/A N/A N/A N/A N/A 0.54 0.57 0.58 Government 1.31 0.78 1.12 1.19 1.14 1.21 1.22 1.25 1.29 1.34 1.27 1.24 1.24
Federal, Civilian 0.91 0.34 0.44 0.45 0.47 0.48 0.48 0.49 0.49 0.45 0.49 0.54 0.65 Military 0.75 0.58 0.82 0.83 0.77 0.83 0.79 0.78 0.80 0.81 0.80 0.82 0.84 State N/A 0.15 0.43 0.45 0.45 0.49 0.45 0.46 0.46 0.47 0.47 0.33 0.34 Local N/A 1.21 1.69 1.79 1.70 1.78 1.80 1.86 1.89 1.97 1.83 1.80 1.77
By NAICS Industry 2001 2002 2003 2004 2005 2006 2007
Forestry, Fishing, and Related Activities N/A N/A N/A N/A N/A N/A N/A Mining N/A N/A N/A N/A N/A N/A N/A Construction 1.23 1.43 1.43 1.31 1.13 1.30 1.60 Manufacturing 0.11 0.13 0.15 0.15 0.14 0.14 0.17 Transportation and Utilities N/A N/A N/A N/A N/A N/A N/A Wholesale Trade N/A N/A N/A N/A N/A N/A N/A Retail Trade 1.04 1.02 1.01 1.09 1.10 1.12 1.21 Information 1.31 1.29 1.40 1.37 1.28 1.22 1.30 Financial Activity N/A N/A N/A N/A N/A 0.39 N/A Professional & Business Services 0.38 0.34 0.38 N/A N/A N/A N/A Education & Health Services 0.25 N/A N/A N/A N/A N/A N/A Leisure & Hospitality Services 0.65 0.67 0.69 0.74 0.73 0.70 N/A Other Services 1.34 1.36 1.34 1.32 1.29 1.29 1.25 Government 1.23 1.21 1.15 1.16 1.13 1.12 1.13
Federal, Civilian 0.64 0.76 0.66 0.67 0.67 0.63 0.66 Military 0.82 0.83 0.81 0.76 0.80 0.76 0.70 State 0.35 0.36 0.34 0.34 0.35 0.38 0.38 Local 1.76 1.68 1.61 1.63 1.57 1.55 1.56
Note: Values greater than 1.00 indicate concentrations relative to the country.
Basic Industries' Location Quotients, 2001-2007
1.00
1.10
1.20
1.30
1.40
1.50
1.60
1.70
1.80
2001
2002
2003
2004
2005
2006
2007
Local GovernmentConstructionInformationOther ServicesRetail Trade
Source: U.S. Bureau of Economic Analysis, Regional Economic Information System and Bureau of Economic and Business Research, University of Utah.

The Structure and Economic Impact of Utah’s Coal Industry
B U R E A U O F E C O N O M I C A N D B U S I N E S S R E S E A R C H 181
8.2.2.2 Personal Income and Earnings Total personal income75 in Emery County more than tripled, adjusting for inflation, between 1970 and 2007 from $76.6 million to $244.4 million. (All amounts are in constant 2007 dollars.) However, after generally rapid growth from 1970 to a high of $264.2 million in 1982, personal income growth has been flat such that it is still below its 1982 peak (Table 8.14 and Figure 8.6). Per capita personal income grew more slowly, by 57 percent, from $14,874 in 1970 to $23,364 in 2007. In fact, it was essentially flat from 1973 until 2003, fluctuating around $20,000. Emery County saw the greatest growth in real average annual wages, with a 20 percent increase over the study period in spite of a 31 percent decline from their 1977 peak. The county has also had the highest wages of the three coal counties since hitting $42,009 in 1972. In 2007 they were $39,685, more than $5,600 above those in Carbon County and over $11,000 above those in Sevier. Personal transfer receipts, which include government social benefits and retirement income, av-eraged 4.3 percent annual growth between 1970 and 2007, almost quintupling from $10.1 million to $48.2 million. This was in spite of flat periods from 1983 to 1992 and 2003 to 2007, and indi-cates a growing elderly population in the county. Wage and salary disbursements increased 3.5 percent annually over the period, from $46.3 mil-lion to $163.5 million, and supplements to wages and salaries grew at an average 5.2 percent an-nually from $6.6 million to $42.9 million. In contrast, proprietors’ income shrank 1.4 percent annually, from $16.4 million in 1970 to $9.6 million in 2007, despite proprietors’ employment growing 2.5 percent annually. Unlike in Carbon and Sevier counties, both farm and nonfarm proprietors’ income fell over the period. Total farm earnings in Emery County were rather volatile over the study period. They began at $5.1 million in 1970, fell to $1.4 million in 1980, were back up to $4.5 million in 1990, then saw a loss of $0.1 million in 2000, climbed to $4.8 million in 2004, and ended with a loss of $2.0 mil-lion in 2007. Nonfarm earnings, however, saw a net gain over the period, more than tripling from $64.2 million to $216.6 million, although they finished well below their 1982 high of $418.7 million. As Figure 8.6 makes clear, from 1972 through 1989 nonfarm earnings exceeded total personal income in the county. This is because earnings are measured by place of work while personal income is measured by place of residence. During this period workers commuted from other counties to jobs in the mining and construction boom, but took their earnings home out of the county, reducing Emery’s total personal income. In 2007, about three-quarters of total earnings in Emery County came from wages and salaries, one-fifth was due to supplements to wages and salaries (employer contributions for pensions, insurance, and government social insurance), and the remaining 5 percent was proprietors’ in-come. Proprietors’ share of earnings in the county was just 38 percent of the national average, down from twice the average in 1970 (three times the average for farm proprietors). The share from supplements to wages and salaries was about 20 percent larger than average in 2007.
75 Note that the sum of wage and salary disbursements plus supplements to wages and salaries plus proprietors’ income equals the sum of farm and nonfarm earnings. Both are ways of measuring earnings by place of work. Sub-tracting employer and employee contributions for government social insurance and adding personal transfer re-ceipts, income from dividends, interest, and rent, and a residence adjustment that covers the effects of interarea commuters, yields total personal income, which is by place of residence.

The Structure and Economic Impact of Utah’s Coal Industry
182 B U R E A U O F E C O N O M I C A N D B U S I N E S S R E S E A R C H
Table 8.14 Emery County Income Summary, 1970–2007
(Millions of Constant 2007 Dollars)
1970 1980 1990 2000 2001 2002 2003 2004 2005 2006 2007 Change AARC
Total Personal Income $76.6 $226.6 $211.7 $239.2 $232.3 $230.2 $234.0 $241.2 $245.3 $251.3 $244.4 219.1% 3.2% Per Capita Personal Income (dollars) $14,874 $19,539 $20,499 $22,189 $22,179 $21,840 $22,336 $22,986 $23,377 $24,076 $23,364 57.1% 1.2% Average Annual Wage per Job (dollars) $32,996 $48,706 $41,786 $41,143 $40,967 $39,618 $37,721 $38,282 $39,654 $40,748 $39,685 20.3% 0.5% Personal Transfer Receipts $10.1 $20.6 $27.3 $41.7 $42.9 $45.3 $47.5 $46.6 $48.0 $48.9 $48.2 380.0% 4.3%
Components of Earnings Wage and salary disbursements $46.3 $229.4 $161.8 $157.4 $156.5 $149.5 $145.9 $152.8 $160.5 $169.5 $163.5 253.0% 3.5% Supplements to wages and salaries $6.6 $54.7 $34.6 $36.1 $35.9 $37.5 $40.5 $46.1 $45.6 $44.5 $42.9 551.0% 5.2%
Employer contribs for pensions and insurance $4.5 $39.8 $21.8 $23.5 $23.8 $25.7 $28.7 $33.5 $31.8 $30.2 $29.6 558.7% 5.2% Employer contribs for gov’t social insurance $2.1 $14.9 $12.8 $12.6 $12.1 $11.9 $11.8 $12.6 $13.8 $14.4 $13.3 534.4% 5.1%
Proprietors income $16.4 $13.6 $18.8 $13.0 $9.1 $9.6 $13.5 $14.3 $14.6 $13.3 $9.6 –41.3% –1.4% Farm proprietors income $4.1 $0.3 $3.6 –$1.4 –$0.4 $0.9 $3.1 $3.5 $2.7 $0.7 –$2.0 –149.9% N/A Nonfarm proprietors income $12.3 $13.3 $15.2 $14.3 $9.6 $8.7 $10.4 $10.8 $11.8 $12.6 $11.7 –5.1% –0.1%
Farm earnings $5.1 $1.4 $4.5 –$0.1 $0.8 $2.3 $4.4 $4.8 $4.2 $2.1 –$0.6 –111.8% N/A Nonfarm earnings $64.2 $296.2 $210.7 $206.6 $200.6 $194.3 $195.5 $208.4 $216.5 $225.2 $216.6 237.5% 3.3%
Private earnings $50.7 $273.7 $181.8 $169.8 $166.5 $159.9 $162.0 $174.6 $183.8 $192.1 $183.3 261.5% 3.5% Government earnings $13.5 $22.5 $28.9 $36.8 $34.2 $34.4 $33.5 $33.8 $32.6 $33.2 $33.3 147.2% 2.5%
Components’ Shares of Total Earnings Wage and salary disbursements 66.8% 77.1% 75.2% 76.2% 77.7% 76.0% 73.0% 71.7% 72.7% 74.6% 75.7% Supplements to wages and salaries 9.5% 18.4% 16.1% 17.5% 17.8% 19.1% 20.3% 21.6% 20.7% 19.6% 19.8%
Employer contribs for pensions and insurance 6.5% 13.4% 10.1% 11.4% 11.8% 13.1% 14.4% 15.7% 14.4% 13.3% 13.7% Employer contribs for gov’t social insurance 3.0% 5.0% 6.0% 6.1% 6.0% 6.0% 5.9% 5.9% 6.3% 6.3% 6.1%
Proprietors income 23.7% 4.6% 8.7% 6.3% 4.5% 4.9% 6.8% 6.7% 6.6% 5.8% 4.5% Farm proprietors income 5.9% 0.1% 1.7% –0.7% –0.2% 0.5% 1.6% 1.6% 1.2% 0.3% –0.9% Nonfarm proprietors income 17.7% 4.5% 7.1% 6.9% 4.7% 4.4% 5.2% 5.1% 5.4% 5.5% 5.4%
Farm earnings 7.4% 0.5% 2.1% –0.03% 0.4% 1.2% 2.2% 2.3% 1.9% 0.9% –0.3% Nonfarm earnings 92.6% 99.5% 97.9% 100.0% 99.6% 98.8% 97.8% 97.7% 98.1% 99.1% 100.3%
Private earnings 73.2% 92.0% 84.5% 82.2% 82.6% 81.3% 81.0% 81.9% 83.3% 84.5% 84.8% Government earnings 19.5% 7.6% 13.4% 17.8% 17.0% 17.5% 16.8% 15.8% 14.8% 14.6% 15.4%
Location Quotients of Earnings Components Wage and salary disbursements 0.84 1.02 1.01 1.03 1.05 1.05 1.02 1.01 1.02 1.04 1.05 24.8% 0.6% Supplements to wages and salaries 1.01 1.23 1.03 1.20 1.20 1.18 1.21 1.29 1.22 1.18 1.21 19.6% 0.5%
Employer contribs for pensions and insurance 1.09 1.33 1.01 1.22 1.24 1.21 1.26 1.38 1.25 1.18 1.23 12.9% 0.3% Employer contribs for gov’t social insurance 0.88 1.03 1.07 1.16 1.13 1.13 1.09 1.10 1.17 1.19 1.17 33.1% 0.8%
Proprietors income 2.06 0.48 0.85 0.56 0.39 0.44 0.59 0.56 0.55 0.48 0.38 –81.7% –4.5% Farm proprietors income 3.07 0.14 1.86 N/A N/A 2.47 3.90 3.48 2.99 1.47 N/A Nonfarm proprietors income 1.86 0.50 0.75 0.64 0.42 0.40 0.47 0.44 0.46 0.47 0.47 –74.6% –3.6%
Farm earnings 2.92 0.43 1.66 N/A 0.65 2.44 3.23 2.97 2.76 1.99 N/A Nonfarm earnings 0.95 1.01 0.99 1.01 1.00 0.99 0.98 0.98 0.99 1.00 1.01 6.2% 0.2%
Private earnings 0.92 1.13 1.04 0.98 0.99 0.98 0.98 0.99 1.01 1.02 1.02 10.9% 0.3% Government earnings 1.07 0.43 0.75 1.16 1.08 1.07 1.00 0.95 0.89 0.89 0.94 –12.4% –0.4%
Note: Average wage per job is wage and salary disbursements divided by wage and salary employment. Location quotient values greater than 1.00 indicate concentrations relative to the country. Source: U.S. Bureau of Economic Analysis, Regional Economic Information System; Utah Department of Workforce Services; and Bureau of Economic and Business Research, University of Utah.

The Structure and Economic Impact of Utah’s Coal Industry
B U R E A U O F E C O N O M I C A N D B U S I N E S S R E S E A R C H 183
Figure 8.6 Emery County Components of Personal Income, 1970–2007
-$50.0
$0.0
$50.0
$100.0
$150.0
$200.0
$250.0
$300.0
$350.0
$400.0
$450.0
1970
1972
1974
1976
1978
1980
1982
1984
1986
1988
1990
1992
1994
1996
1998
2000
2002
2004
2006
Mil
lio
ns o
f C
on
sta
nt
20
07
Do
llars
Total Personal IncomeNonfarm EarningsPersonal Transfer ReceiptsProprietors IncomeFarm Earnings
Note: Nonfarm earnings exceed total personal income from 1972 to 1989 due to large negative residence adjustments reflecting in-commuters during the mining and construction booms taking earnings out of the county. Source: U.S. Bureau of Economic Analysis, Regional Economic Information System.
Since farm earnings in Emery County were negative in 2007, we cannot compare their local share of earnings to the national share. However, in 2006 farm earnings’ local share was twice the national average and was recently as high as three times the average in 2003 and 2004. Non-farm earnings’ share is on par with the country as a whole, while the government’s portion has been slightly below average since 2004. The main sources of (disclosed) nonfarm earnings in Emery County in 1970 were mining, which paid $20.4 million (in constant 2007 dollars); construction, which paid $12.9 million; and state and local government, which together paid $10.3 million (Table 8.15 and Figure 8.7a). Together these sectors accounted for 63 percent of total (farm and nonfarm) earnings, with mining alone representing nearly 30 percent (Table 8.16). By 2000, mining earnings had more than tripled to $64.1 million, and the data reveal that most of this ($62.4 million) was from coal mining. Con-struction earnings were only modestly higher in 2000 at $16.2 million, after peaking at more than $149 million in 1977. State and local government earnings tripled to $32.1 million, and transpor-tation and public utilities had emerged as a significant source of income with $59.5 million in earnings. In 2000, coal mining, transportation and public utilities, and state and local government accounted for three-quarters of total earnings. Construction’s share had shrunk from almost 19 percent to less than 8 percent. In 2007, under the NAICS classification system, mining (except oil and gas) paid $56 million in earnings, which represented 26 percent of total earnings. This sector includes coal mining, but also covers metals and nonmetallic minerals. From available SIC data we know that the lion’s share of total mining earnings is from coal mining. State and local government jobs paid $27.8

The Structure and Economic Impact of Utah’s Coal Industry
184 B U R E A U O F E C O N O M I C A N D B U S I N E S S R E S E A R C H
Table 8.15 Emery County Nonfarm Earnings by Industry, 1970–2007
(Millions of Constant 2007 Dollars)
By SIC Industry 1970 1980 1990 1991 1992 1993 1994 1995 1996 1997 1998 1999 2000 Agricultural Services, Forestry, Fishing N/A $0.2 $0.2 $0.2 $0.4 $0.6 $0.5 $0.4 $0.5 $0.3 N/A N/A N/A Mining $20.4 $161.8 $76.2 $58.4 $71.1 $67.0 $67.9 $66.2 $68.2 $73.8 $68.3 $63.6 $64.1
Metal mining N/A N/A N/A N/A N/A N/A N/A N/A $0.00 $0.00 $0.00 $0.00 $0.00 Coal mining N/A N/A N/A N/A $70.4 $66.4 $67.1 $65.6 $67.5 $72.4 $66.5 $62.1 $62.4 Oil and gas extraction N/A N/A N/A N/A $0.00 $0.00 $0.00 $0.00 $0.00 N/A N/A N/A N/A Nonmetallic minerals, except fuels N/A N/A N/A N/A N/A N/A N/A N/A $0.65 N/A N/A N/A N/A
Construction $12.9 $49.4 $18.9 $17.9 $20.0 $9.1 $10.9 $12.6 $13.8 $14.2 $18.1 $19.3 $16.2 Manufacturing $0.7 $0.7 $0.8 $0.8 $0.9 $1.5 $2.9 $2.2 $1.4 $1.2 $1.2 $1.2 $1.1
Petroleum and coal products $0.0 $0.0 $0.0 $0.0 $0.0 N/A N/A N/A $0.0 N/A $0.0 $0.0 $0.0 Transportation and Public Utilities N/A N/A $57.2 $63.8 N/A N/A N/A N/A N/A N/A $58.1 $55.4 $59.5 Wholesale Trade $0.7 $1.5 $1.8 $1.4 $1.5 $1.4 $1.5 $0.9 $0.8 $0.8 N/A N/A N/A Retail Trade $6.6 $9.0 $8.1 $8.5 $8.1 $8.1 $8.1 $7.3 $7.2 $7.7 $7.8 $7.6 $7.2
Building materials and garden equipment $0.51 $1.05 $0.84 $1.02 $0.94 $0.63 $0.70 $0.65 $0.65 $0.80 N/A N/A N/A General merchandise stores $0.37 N/A N/A N/A N/A N/A N/A N/A N/A N/A N/A N/A N/A Food stores $0.63 $2.59 $2.04 $2.09 $2.34 $2.43 $2.09 $1.94 $1.96 $2.16 $2.53 $2.43 $2.19 Automotive dealers and service stations $1.70 $1.46 $1.43 $1.87 $1.66 $2.08 $2.43 $2.36 $2.36 $2.49 $2.22 $2.22 $2.12 Apparel and accessory stores N/A N/A N/A N/A N/A N/A N/A N/A N/A N/A N/A N/A N/A Home furniture and furnishings stores N/A N/A N/A N/A N/A N/A N/A N/A N/A N/A N/A N/A N/A Eating and drinking places $1.74 $1.91 $2.09 $2.21 $2.04 $1.34 $1.25 $0.89 $0.85 $0.84 $0.75 $0.81 $0.78 Miscellaneous retail $1.63 $1.82 $1.26 $1.06 $1.03 $1.22 $1.24 $1.09 $0.94 $1.02 $1.07 $0.99 N/A
Finance, Insurance, and Real Estate $0.4 $2.2 $1.1 $1.0 $1.4 $1.5 $1.0 $1.1 $1.1 $1.7 $2.0 $1.7 $1.6 Services N/A N/A $17.5 $15.2 N/A N/A N/A N/A N/A N/A $21.0 $19.3 $18.0 Government $13.5 $22.5 $28.9 $29.9 $31.2 $31.4 $32.3 $32.6 $34.2 $35.7 $37.4 $37.2 $36.8
Federal, Civilian $2.8 $2.6 $2.3 $2.5 $3.0 $2.8 $3.1 $2.8 $2.8 $2.7 $2.8 $3.3 $3.7 Military $0.4 $0.7 $1.3 $1.2 $1.2 $1.1 $1.1 $1.0 $1.0 $1.0 $1.0 $1.0 $1.0 State N/A $1.1 $2.8 $3.0 $3.1 $3.1 $3.2 $3.3 $3.4 $3.5 $3.6 $2.6 $2.7 Local N/A $18.2 $22.5 $23.3 $23.9 $24.3 $24.8 $25.5 $27.0 $28.5 $30.0 $30.3 $29.4
By NAICS Industry 2001 2002 2003 2004 2005 2006 2007
Forestry, Fishing, and Related Activities N/A N/A N/A N/A N/A N/A N/A Mining N/A N/A N/A N/A N/A N/A N/A
Oil and gas extraction N/A $0.0 N/A N/A N/A N/A N/A Mining (except oil and gas) $58.0 $49.2 $45.9 $53.5 $64.6 $64.7 $56.0 Support activities for mining N/A N/A N/A N/A N/A N/A N/A
Construction $15.3 $17.9 $18.6 $17.0 $17.5 $22.3 $26.2 Manufacturing $1.3 $1.1 $1.6 $1.3 $1.1 $0.9 $1.0
Petroleum and coal products N/A N/A $0.0 $0.0 $0.0 $0.0 N/A Transportation and Utilities N/A N/A N/A N/A N/A N/A N/A Wholesale Trade N/A N/A N/A N/A N/A N/A N/A Retail Trade $8.4 $7.7 $7.5 $8.3 $8.5 $8.8 $9.1
Motor vehicle and parts dealers $0.5 $0.4 $0.4 $0.4 $0.4 $0.4 $0.4 Furniture and home furnishings stores N/A N/A N/A N/A N/A N/A N/A Electronics and appliance stores N/A N/A N/A N/A N/A N/A N/A Building material and garden supply stores N/A N/A N/A N/A N/A N/A N/A Food and beverage stores $1.5 $1.4 $1.3 $1.4 $1.3 $1.3 $1.4 Health and personal care stores N/A N/A N/A N/A N/A N/A N/A Gasoline stations $4.2 $4.2 $4.0 $4.2 $4.4 $4.6 $4.7 Clothing and clothing accessories stores N/A N/A N/A N/A N/A N/A N/A Sporting goods, hobby, book & music stores $0.1 N/A N/A N/A N/A N/A N/A General merchandise stores N/A N/A N/A N/A $0.4 $0.4 $0.4 Miscellaneous store retailers N/A $0.1 N/A $0.1 $0.2 N/A $0.2 Nonstore retailers $0.1 N/A N/A N/A N/A N/A N/A
Information $5.7 $5.5 $5.8 $5.6 $5.4 $5.3 $5.3 Financial Activity N/A N/A N/A N/A N/A $2.0 N/A Professional & Business Services $4.0 $4.0 $6.0 N/A N/A N/A N/A Education & Health Services N/A N/A N/A N/A N/A N/A N/A Leisure & Hospitality Services N/A $2.7 $3.1 $4.1 $4.2 $4.3 N/A Other Services $12.0 $13.3 $13.4 $12.4 $12.2 $13.0 $13.6 Government $34.2 $34.4 $33.5 $33.8 $32.6 $33.2 $33.3
Federal, Civilian $3.7 $4.3 $3.6 $4.1 $4.1 $3.7 $3.8 Military $1.1 $1.3 $1.9 $1.9 $2.2 $1.9 $1.7 State $2.8 $2.9 $2.8 $3.2 $3.1 $3.6 $3.7 Local $26.5 $25.9 $25.2 $24.6 $23.2 $23.9 $24.1
N/A: Data not shown to avoid disclosure of confidential information or because the data were not available. Source: U.S. Bureau of Economic Analysis, Regional Economic Information System.

The Structure and Economic Impact of Utah’s Coal Industry
B U R E A U O F E C O N O M I C A N D B U S I N E S S R E S E A R C H 185
Figure 8.7a Emery County Nonfarm Earnings by SIC Industry, 1970–2000
$0.0
$50.0
$100.0
$150.0
$200.0
$250.0
$300.0
$350.0
$400.0
$450.0
1970
1972
1974
1976
1978
1980
1982
1984
1986
1988
1990
1992
1994
1996
1998
2000
Mil
lio
ns o
f C
on
sta
nt
20
07
Do
llars
Agricultural Services, Forestry,Fishing
Wholesale Trade
Manufacturing
FIRE
Retail Trade
Construction
Services
Government
Transportation and PublicUtilities
Mining
Source: U.S. Bureau of Economic Analysis, Regional Economic Information System.
Figure 8.7b Emery County Nonfarm Earnings by NAICS Industry, 2001–2007
$0.0
$10.0
$20.0
$30.0
$40.0
$50.0
$60.0
$70.0
$80.0
$90.0
$100.0
2001
2002
2003
2004
2005
2006
2007
Mil
lio
ns o
f C
on
sta
nt
20
07
Do
llars
Manufacturing
Financial Activity
Information
Retail Trade
Leisure & Hospitality Services
Professional & BusinessServices
Other Services
Construction
Government
Note: Total earnings appear much lower in 2001 than in 2000 because figures were not reported for several industries. Source: U.S. Bureau of Economic Analysis, Regional Economic Information System.

The Structure and Economic Impact of Utah’s Coal Industry
186 B U R E A U O F E C O N O M I C A N D B U S I N E S S R E S E A R C H
Table 8.16 Emery County Nonfarm Earnings Shares by Industry, 1970–2007
By SIC Industry 1970 1980 1990 1991 1992 1993 1994 1995 1996 1997 1998 1999 2000
Agricultural Services, Forestry, Fishing N/A 0.1% 0.1% 0.1% 0.2% 0.3% 0.2% 0.2% 0.3% 0.1% N/A N/A N/A Mining 29.4% 54.3% 35.4% 29.2% 32.8% 33.3% 32.7% 32.4% 33.6% 33.9% 31.8% 30.6% 31.1%
Metal mining N/A N/A N/A N/A N/A N/A N/A N/A 0.0% 0.0% 0.0% 0.0% 0.0% Coal mining N/A N/A N/A N/A 32.4% 33.0% 32.3% 32.1% 33.2% 33.2% 30.9% 29.8% 30.2% Oil and gas extraction N/A N/A N/A N/A 0.0% 0.0% 0.0% 0.0% 0.0% N/A N/A N/A N/A Nonmetallic minerals, except fuels N/A N/A N/A N/A N/A N/A N/A N/A 0.3% N/A N/A N/A N/A
Construction 18.7% 16.6% 8.8% 9.0% 9.2% 4.5% 5.2% 6.2% 6.8% 6.5% 8.4% 9.3% 7.8% Manufacturing 1.0% 0.2% 0.4% 0.4% 0.4% 0.7% 1.4% 1.1% 0.7% 0.6% 0.5% 0.6% 0.5%
Petroleum and coal products 0.0% 0.0% 0.0% 0.0% 0.0% N/A N/A N/A 0.0% N/A 0.0% 0.0% 0.0% Transportation and Public Utilities N/A N/A 26.6% 31.9% N/A N/A N/A N/A N/A N/A 27.0% 26.6% 28.8% Wholesale Trade 1.0% 0.5% 0.8% 0.7% 0.7% 0.7% 0.7% 0.5% 0.4% 0.3% N/A N/A N/A Retail Trade 9.6% 3.0% 3.7% 4.3% 3.8% 4.0% 3.9% 3.6% 3.5% 3.5% 3.6% 3.7% 3.5%
Building materials and garden equipment 0.7% 0.4% 0.4% 0.5% 0.4% 0.3% 0.3% 0.3% 0.3% 0.4% N/A N/A N/A General merchandise stores 0.5% N/A N/A N/A N/A N/A N/A N/A N/A N/A N/A N/A N/A Food stores 0.9% 0.9% 0.9% 1.0% 1.1% 1.2% 1.0% 0.9% 1.0% 1.0% 1.2% 1.2% 1.1% Automotive dealers and service stations 2.5% 0.5% 0.7% 0.9% 0.8% 1.0% 1.2% 1.2% 1.2% 1.1% 1.0% 1.1% 1.0% Apparel and accessory stores N/A N/A N/A N/A N/A N/A N/A N/A N/A N/A N/A N/A N/A Home furniture and furnishings stores N/A N/A N/A N/A N/A N/A N/A N/A N/A N/A N/A N/A N/A Eating and drinking places 2.5% 0.6% 1.0% 1.1% 0.9% 0.7% 0.6% 0.4% 0.4% 0.4% 0.3% 0.4% 0.4% Miscellaneous retail 2.3% 0.6% 0.6% 0.5% 0.5% 0.6% 0.6% 0.5% 0.5% 0.5% 0.5% 0.5% N/A
Finance, Insurance, and Real Estate 0.6% 0.7% 0.5% 0.5% 0.7% 0.8% 0.5% 0.6% 0.5% 0.8% 0.9% 0.8% 0.8% Services N/A N/A 8.1% 7.6% N/A N/A N/A N/A N/A N/A 9.8% 9.3% 8.7% Government 19.5% 7.6% 13.4% 15.0% 14.4% 15.6% 15.5% 16.0% 16.9% 16.4% 17.4% 17.9% 17.8%
Federal, Civilian 4.1% 0.9% 1.1% 1.3% 1.4% 1.4% 1.5% 1.4% 1.4% 1.2% 1.3% 1.6% 1.8% Military 0.6% 0.2% 0.6% 0.6% 0.5% 0.6% 0.6% 0.5% 0.5% 0.5% 0.5% 0.5% 0.5% State N/A 0.4% 1.3% 1.5% 1.4% 1.5% 1.6% 1.6% 1.7% 1.6% 1.7% 1.2% 1.3% Local N/A 6.1% 10.5% 11.6% 11.0% 12.1% 11.9% 12.5% 13.3% 13.1% 13.9% 14.6% 14.2%
By NAICS Industry 2001 2002 2003 2004 2005 2006 2007
Forestry, Fishing, and Related Activities N/A N/A N/A N/A N/A N/A N/A Mining N/A N/A N/A N/A N/A N/A N/A
Oil and gas extraction N/A 0.0% N/A N/A N/A N/A N/A Mining (except oil and gas) 28.8% 25.0% 23.0% 25.1% 29.3% 28.4% 25.9% Support activities for mining N/A N/A N/A N/A N/A N/A N/A
Construction 7.6% 9.1% 9.3% 8.0% 7.9% 9.8% 12.1% Manufacturing 0.6% 0.6% 0.8% 0.6% 0.5% 0.4% 0.5%
Petroleum and coal products N/A N/A 0.0% 0.0% 0.0% 0.0% N/A Transportation and Utilities N/A N/A N/A N/A N/A N/A N/A Wholesale Trade N/A N/A N/A N/A N/A N/A N/A Retail Trade 4.2% 3.9% 3.8% 3.9% 3.8% 3.9% 4.2%
Motor vehicle and parts dealers 0.2% 0.2% 0.2% 0.2% 0.2% 0.2% 0.2% Furniture and home furnishings stores N/A N/A N/A N/A N/A N/A N/A Electronics and appliance stores N/A N/A N/A N/A N/A N/A N/A Building material and garden supply stores N/A N/A N/A N/A N/A N/A N/A Food and beverage stores 0.7% 0.7% 0.7% 0.6% 0.6% 0.6% 0.6% Health and personal care stores N/A N/A N/A N/A N/A N/A N/A Gasoline stations 2.1% 2.1% 2.0% 2.0% 2.0% 2.0% 2.2% Clothing and clothing accessories stores N/A N/A N/A N/A N/A N/A N/A Sporting goods, hobby, book & music stores 0.0% N/A N/A N/A N/A N/A N/A General merchandise stores N/A N/A N/A N/A 0.2% 0.2% 0.2% Miscellaneous store retailers N/A 0.1% N/A 0.1% 0.1% N/A 0.1% Nonstore retailers 0.1% N/A N/A N/A N/A N/A N/A
Information 2.9% 2.8% 2.9% 2.6% 2.4% 2.3% 2.5% Financial Activity N/A N/A N/A N/A N/A 0.9% N/A Professional & Business Services 2.0% 2.0% 3.0% N/A N/A N/A N/A Education & Health Services N/A N/A N/A N/A N/A N/A N/A Leisure & Hospitality Services N/A 1.4% 1.6% 1.9% 1.9% 1.9% N/A Other Services 5.9% 6.7% 6.7% 5.8% 5.5% 5.7% 6.3% Government 17.0% 17.5% 16.8% 15.8% 14.8% 14.6% 15.4%
Federal, Civilian 1.9% 2.2% 1.8% 1.9% 1.9% 1.6% 1.7% Military 0.5% 0.7% 1.0% 0.9% 1.0% 0.8% 0.8% State 1.4% 1.5% 1.4% 1.5% 1.4% 1.6% 1.7% Local 13.2% 13.2% 12.6% 11.5% 10.5% 10.5% 11.2%
N/A: Data not shown to avoid disclosure of confidential information or because the data were not available. Source: U.S. Bureau of Economic Analysis, Regional Economic Information System and Bureau of Economic and Business Research, University of Utah.

The Structure and Economic Impact of Utah’s Coal Industry
B U R E A U O F E C O N O M I C A N D B U S I N E S S R E S E A R C H 187
Table 8.17 Emery County Nonfarm Earnings Location Quotients by Industry, 1970–2007
By SIC Industry 1970 1980 1990 1991 1992 1993 1994 1995 1996 1997 1998 1999 2000
Agricultural Services, Forestry, Fishing N/A 0.18 0.13 0.14 0.26 0.40 0.39 0.30 0.44 0.18 N/A N/A N/A Mining 27.83 26.12 32.43 29.87 34.83 36.41 37.06 38.32 37.43 35.03 33.68 35.59 32.65
Metal mining N/A N/A N/A N/A N/A N/A N/A N/A 0.00 0.00 0.00 0.00 0.00 Coal mining N/A N/A N/A N/A 158.61 180.18 181.77 194.81 217.05 227.98 219.02 228.23 289.50 Oil and gas extraction N/A N/A N/A N/A 0.00 0.00 0.00 0.00 0.00 N/A N/A N/A N/A Nonmetallic minerals, except fuels N/A N/A N/A N/A N/A N/A N/A N/A 2.81 N/A N/A N/A N/A
Construction 2.89 2.67 1.49 1.67 1.82 0.88 0.98 1.16 1.26 1.19 1.49 1.58 1.34 Manufacturing 0.04 0.01 0.02 0.02 0.02 0.04 0.08 0.06 0.04 0.03 0.03 0.04 0.03
Petroleum and coal products 0.00 0.00 0.00 0.00 0.00 N/A N/A N/A 0.00 N/A 0.00 0.00 0.00 Transportation and Public Utilities N/A N/A 4.06 4.83 N/A N/A N/A N/A N/A N/A 4.05 3.91 4.25 Wholesale Trade 0.17 0.08 0.13 0.11 0.11 0.12 0.12 0.07 0.06 0.06 N/A N/A N/A Retail Trade 0.88 0.31 0.41 0.47 0.42 0.45 0.44 0.40 0.40 0.40 0.42 0.42 0.40
Building materials and garden equipment 1.08 0.62 0.80 1.06 0.90 0.65 0.68 0.64 0.64 0.73 N/A N/A N/A General merchandise stores 0.28 N/A N/A N/A N/A N/A N/A N/A N/A N/A N/A N/A N/A Food stores 0.53 0.49 0.63 0.69 0.73 0.83 0.71 0.68 0.71 0.73 0.90 0.92 0.87 Automotive dealers and service stations 1.18 0.29 0.45 0.63 0.54 0.71 0.77 0.76 0.76 0.77 0.71 0.72 0.71 Apparel and accessory stores N/A N/A N/A N/A N/A N/A N/A N/A N/A N/A N/A N/A N/A Home furniture and furnishings stores N/A N/A N/A N/A N/A N/A N/A N/A N/A N/A N/A N/A N/A Eating and drinking places 1.40 0.32 0.48 0.53 0.45 0.32 0.29 0.21 0.20 0.19 0.17 0.19 0.19 Miscellaneous retail 1.67 0.41 0.38 0.36 0.32 0.42 0.41 0.36 0.32 0.32 0.35 0.33 N/A
Finance, Insurance, and Real Estate 0.12 0.13 0.08 0.07 0.09 0.10 0.06 0.07 0.06 0.08 0.10 0.08 0.08 Services N/A N/A 0.32 0.30 N/A N/A N/A N/A N/A N/A 0.35 0.33 0.31 Government 1.07 0.43 0.75 0.81 0.79 0.87 0.87 0.91 0.99 0.99 1.09 1.15 1.16
Federal, Civilian 0.91 0.20 0.28 0.32 0.35 0.36 0.39 0.37 0.39 0.37 0.40 0.51 0.59 Military 0.21 0.12 0.31 0.30 0.27 0.31 0.33 0.31 0.34 0.32 0.35 0.38 0.40 State N/A 0.11 0.37 0.40 0.41 0.43 0.43 0.46 0.48 0.48 0.52 0.39 0.42 Local N/A 0.76 1.23 1.33 1.27 1.39 1.37 1.44 1.55 1.55 1.70 1.80 1.80
By NAICS Industry 2001 2002 2003 2004 2005 2006 2007 Forestry, Fishing, and Related Activities N/A N/A N/A N/A N/A N/A N/A Mining N/A N/A N/A N/A N/A N/A N/A
Oil and gas extraction N/A 0.00 N/A N/A N/A N/A N/A Mining (except oil and gas) 126.64 112.26 106.77 109.29 124.47 116.59 104.86 Support activities for mining N/A N/A N/A N/A N/A N/A N/A
Construction 1.25 1.50 1.54 1.30 1.24 1.51 1.97 Manufacturing 0.05 0.04 0.06 0.05 0.04 0.03 0.04
Petroleum and coal products N/A N/A 0.00 0.00 0.00 0.00 N/A Transportation and Utilities N/A N/A N/A N/A N/A N/A N/A Wholesale Trade N/A N/A N/A N/A N/A N/A N/A Retail Trade 0.61 0.57 0.56 0.60 0.59 0.61 0.68
Motor vehicle and parts dealers 0.17 0.16 0.15 0.15 0.15 0.15 0.16 Furniture and home furnishings stores N/A N/A N/A N/A N/A N/A N/A Electronics and appliance stores N/A N/A N/A N/A N/A N/A N/A Building material and garden supply stores N/A N/A N/A N/A N/A N/A N/A Food and beverage stores 0.70 0.64 0.62 0.63 0.62 0.61 0.69 Health and personal care stores N/A N/A N/A N/A N/A N/A N/A Gasoline stations 6.05 6.35 6.15 6.50 6.59 7.00 7.66 Clothing and clothing accessories stores N/A N/A N/A N/A N/A N/A N/A Sporting goods, hobby, book & music stores 0.19 N/A N/A N/A N/A N/A N/A General merchandise stores N/A N/A N/A N/A 0.18 0.20 0.23 Miscellaneous store retailers N/A 0.17 N/A 0.17 0.20 N/A 0.21 Nonstore retailers 0.18 N/A N/A N/A N/A N/A N/A
Information 0.67 0.70 0.76 0.71 0.67 0.65 0.69 Financial Activity N/A N/A N/A N/A N/A 0.09 N/A Professional & Business Services 0.13 0.14 0.21 N/A N/A N/A N/A Education & Health Services N/A N/A N/A N/A N/A N/A N/A Leisure & Hospitality Services N/A 0.36 0.40 0.50 0.50 0.49 N/A Other Services 2.06 2.25 2.23 1.96 1.90 2.01 2.20 Government 1.08 1.07 1.00 0.95 0.89 0.89 0.94
Federal, Civilian 0.62 0.69 0.57 0.60 0.59 0.53 0.56 Military 0.42 0.48 0.61 0.57 0.59 0.50 0.49 State 0.43 0.45 0.41 0.46 0.44 0.50 0.54 Local 1.61 1.55 1.46 1.35 1.23 1.25 1.32
Note: Values greater than 1.00 indicate concentrations relative to the country. Source: U.S. Bureau of Economic Analysis, Regional Economic Information System and Bureau of Economic and Business Research, University of Utah.

The Structure and Economic Impact of Utah’s Coal Industry
188 B U R E A U O F E C O N O M I C A N D B U S I N E S S R E S E A R C H
Figure 8.8 Emery County Basic Industries’ Location Quotients, 2001–2007
1.00
21.00
41.00
61.00
81.00
101.00
121.00
141.00
2001
2002
2003
2004
2005
2006
2007
Min
ing
LQ
s
1.00
1.20
1.40
1.60
1.80
2.00
2.20
2.40
Oth
er
LQ
s
Mining (except oil and gas) Other Services
Construction Local Gov't.
Source: U.S. Bureau of Economic Analysis and Bureau of Economic and Business Research, University of Utah.
million in 2007, down slightly from 2000, and representing 13 percent of total earnings. The next largest disclosed sector was construction, which paid $26.2 million and represented 12 percent of total earnings. These sectors together accounted for just over half of all earnings in 2007. Using location quotients to compare the distribution of earnings by industry in Emery County with the country as a whole reveals the importance of coal mining to the county’s economy (Ta-ble 8.17 and Figure 8.8). In 1970 the entire mining industry’s share of earnings in the county was almost 29 times its national share. The next highest concentration was in construction, whose local earnings share was 2.9 times its national share. In 2000 mining’s share was 2.6 times the national average. However, figures for coal mining were now available and its share of county earnings was almost 290 times the national average. The next highest concentration was in transportation and public utilities, whose local share was 4.25 times the average, while construc-tion’s share was just 34 percent above average. In 2007, under the NAICS classification system, mining (except oil and gas) had a share of county earnings that was 105 times the national aver-age. Construction was back near twice the national share, but data for transportation and utilities was not disclosed. Other services, which includes repair and maintenance, personal services, and religious and civic organizations, had a local share of earnings more than twice the national aver-age. Note also that Emery County has had above-average earnings shares in some retail trade categories, particularly gas stations.

The Structure and Economic Impact of Utah’s Coal Industry
B U R E A U O F E C O N O M I C A N D B U S I N E S S R E S E A R C H 189
8.2.2.3 Retail Sales
Table 8.18
Emery County Retail Sales by Category, 1978–2008 (Thousands of Constant 2008 Dollars)
Year Bu
ild
ing
&
Gard
en
Gen
era
l M
erc
han
dis
e
Fo
od
Sto
res
Mo
tor
Veh
icle
D
eale
rs
Ap
pare
l &
A
ccess
ory
Fu
rnit
ure
Eati
ng
&
Dri
nkin
g
Mis
cellan
eo
us
1978 $4,742.0 N/A $18,054.3 $7,054.3 $246.7 $1,437.8 $8,427.1 $4,073.0 1979 $4,774.3 N/A $17,756.8 $6,941.1 $1,085.0 $1,317.7 $6,895.6 $3,748.6 1980 $5,786.3 N/A $17,299.3 $6,263.4 $1,160.0 $1,288.6 $6,377.2 $3,407.0 1990 $4,548.9 N/A $16,648.3 $3,675.5 $175.5 $1,565.7 $4,170.2 $3,816.3 1991 $4,081.8 N/A $14,089.4 $3,702.0 $159.5 $635.1 $3,939.8 $3,643.0 1992 $3,892.8 N/A $14,499.6 $3,316.0 $237.9 $572.0 $4,135.6 $3,829.3 1993 $5,459.2 N/A $13,629.6 $2,744.9 $354.9 $687.0 $3,869.1 $3,978.2 1994 $6,144.0 N/A $12,868.9 $2,649.4 $277.0 $1,005.9 $3,672.9 $4,785.0 1995 $6,565.1 N/A $13,443.5 $3,371.9 $148.5 $1,006.7 $3,771.6 $4,447.6 1996 $5,615.8 N/A $15,905.3 $3,341.0 $39.0 $950.4 $5,299.5 $3,523.4 1997 $5,311.3 N/A $17,557.1 $1,631.4 $49.2 $1,095.6 $5,789.8 $3,287.2 1998 $5,414.8 N/A $18,168.8 $1,859.4 $233.5 $1,640.4 $3,038.1 $3,535.1 1999 $5,355.0 N/A $18,825.8 $2,567.8 $132.1 $1,637.0 $2,474.3 $2,695.5 2000 $4,658.9 N/A $19,500.6 $4,529.6 $111.3 $875.5 $2,668.3 $3,664.9 2001 $4,702.9 $1,502.5 $20,258.4 $7,128.3 $160.9 $771.6 $2,185.1 $3,574.8 2002 $5,046.2 $1,482.4 $20,001.2 $7,736.2 $141.4 $863.9 $2,122.6 $4,014.4 2003 $4,182.9 $1,415.8 $18,944.0 $10,346.1 $152.2 $1,011.3 $4,484.0 $5,466.4 2004 $4,301.9 $2,762.5 $17,072.0 $11,305.8 $142.2 $850.9 $5,651.9 $6,636.7 2005 $2,965.3 $3,575.4 $20,575.4 $11,305.0 $210.1 $1,007.0 $5,663.3 $8,076.7 2006 $15,097.7 $4,863.0 $22,024.9 $9,475.7 $199.6 $1,133.9 $4,737.3 $24,979.2 2007 $4,283.2 $4,568.3 $19,879.8 $12,374.7 $315.0 $893.2 $5,363.9 $17,323.2 2008 $5,051.3 $3,889.9 $17,498.8 $11,046.4 $275.8 $1,677.9 $5,450.6 $11,457.5
Change 6.5% –3.1% 56.6% 11.8% 16.7% –35.3% 181.3% AARC 0.2% 14.6% –0.1% 1.5% 0.4% 0.5% –1.4% 3.5%
NA: Not available; amounts for this category were not reported. The Tax Commission did not publish sales figures for Food Stores prior to 2002. In the quarterly sales data for 2001-06 there are two General Merchandise categories; the second of these generally corresponds to the Food Stores figures from the 2002-06 annual sales data. In several counties the amounts for General Merchandise sales in 1978 through 2000 matched up with the 2001-06 Food Stores sales and so have been reclassified into the latter category. Source: Utah State Tax Commission.
Table 8.19 2008 Retail Sales in Emery County
Category Amount Share Building & Garden $5,051,293 9.0% General Merchandise $3,889,943 6.9% Food Stores $17,498,846 31.1% Motor Vehicle Dealers $11,046,394 19.6% Apparel & Accessory $275,781 0.5% Furniture $1,677,895 3.0% Eating & Drinking $5,450,626 9.7% Miscellaneous $11,457,527 20.3%
Total $56,348,306 100% Source: Utah State Tax Commission.

The Structure and Economic Impact of Utah’s Coal Industry
190 B U R E A U O F E C O N O M I C A N D B U S I N E S S R E S E A R C H
8.2.2.4 Residential Construction
Exhibit 8.13
Permit-Authorized New Dwelling Units and Value of Residential Construction in Emery County, 1975–2008
Year Sin
gle
-Fam
ily H
om
es
Du
ple
xes
an
d
Tw
in H
om
es
Co
nd
om
iniu
ms
Ap
art
men
ts
(3 o
r m
ore
units)
Cab
ins
Man
ufa
ctu
red
/
Mo
bil
e H
om
es
To
tal
Valu
e
(thousa
nds
of
co
nst
ant
2008 d
olla
rs)
1975 1 0 0 0 0 0 1 $41.8 1980 94 20 0 20 0 30 164 $10,850.2 1990 0 0 0 0 0 0 0 $0.0 1991 1 0 0 0 0 3 4 $292.0 1992 6 0 0 0 0 7 13 $731.2 1993 19 0 0 0 2 10 31 $2,073.6 1994 7 0 0 0 0 2 9 $679.1 1995 9 0 0 0 0 9 18 $1,130.9 1996 8 0 0 0 0 7 15 $964.6 1997 43 0 0 0 1 23 67 $5,123.2 1998 26 2 0 0 0 51 79 $7,454.7 1999 16 0 0 0 0 46 62 $5,348.8 2000 16 0 0 0 0 34 50 $4,322.7 2001 9 0 0 0 2 21 32 $2,748.8 2002 11 0 0 0 1 24 36 $2,513.9 2003 15 0 0 0 3 18 36 $3,224.9 2004 12 0 0 0 1 15 28 $3,248.0 2005 13 0 0 0 0 16 29 $4,049.3 2006 18 0 0 0 2 23 43 $5,625.6 2007 29 0 0 0 1 10 40 $6,361.3 2008 23 0 0 0 0 21 44 $5,716.5
New Single-Family Homes and Total Residential Construction Value
0
10
20
30
40
50
60
70
80
90
100
1975
1980
1990
1991
1992
1993
1994
1995
1996
1997
1998
1999
2000
2001
2002
2003
2004
2005
2006
2007
2008
Sin
gle
-Fam
ily H
om
e P
erm
its
$0
$2
$4
$6
$8
$10
$12
Valu
e(M
illio
ns
of
Const
ant
2008 D
olla
rs)
Single-Family Homes
Total Residential Value
Note: Prior to 1994, condos and other multifamily units were grouped together. Source: Bureau of Economic and Business Research, University of Utah.

The Structure and Economic Impact of Utah’s Coal Industry
B U R E A U O F E C O N O M I C A N D B U S I N E S S R E S E A R C H 191
8.2.2.5 Nonresidential Construction
Exhibit 8.14
Value of Nonresidential Construction in Emery County, 1975–2008 (Thousands of Constant 2008 Dollars)
Year Ho
tels
& M
ote
ls
Ch
urc
hes
&
Oth
er
Reli
gio
us
Ind
ust
rial /
W
are
ho
use
/
Man
ufa
ctu
rin
g
Ho
spit
al
&
Inst
itu
tio
nal
Off
ice,
Ban
k,
Pro
fess
ion
al
Reta
il,
Merc
an
tile
, R
est
au
ran
t
Pu
blic
Bu
ild
ing
s &
P
roje
cts
Oth
er*
Ad
dit
ion
s an
d
Alt
era
tio
ns
Total 1975 $0.0 $0.0 $0.0 $0.0 $0.0 $0.0 $0.0 $0.0 $0.0 $0.0 1980 $0.0 $527.4 $1,023.1 $0.0 $105.5 $158.2 $250.5 $1,811.2 $393.4 $4,269.3 1990 $0.0 $0.0 $0.0 $0.0 $0.0 $0.0 $0.0 $23.7 $40.1 $63.8 1991 $0.0 $0.0 $0.0 $0.0 $0.0 $0.0 $0.0 $408.9 $246.0 $654.9 1992 $0.0 $0.0 $1.5 $0.0 $0.0 $1.5 $1.5 $135.8 $9.3 $149.7 1993 $0.0 $0.0 $75.1 $0.0 $0.0 $16.7 $1.5 $481.5 $165.9 $740.7 1994 $0.0 $1,573.9 $0.0 $0.0 $0.0 $0.0 $0.0 $57.7 $522.7 $2,154.3 1995 $3,261.1 $242.0 $0.0 $0.0 $536.6 $0.0 $0.0 $237.4 $576.7 $4,853.7 1996 $0.0 $13.9 $844.9 $0.0 $0.0 $0.0 $0.0 $151.8 $118.2 $1,128.8 1997 $95.1 $0.0 $342.9 $2,027.4 $46.7 $0.0 $0.0 $1,087.3 $473.2 $4,072.7 1998 $0.0 $0.0 $410.4 $0.0 $649.2 $0.0 $0.0 $253.6 $273.5 $1,586.7 1999 $0.0 $270.5 $245.8 $0.0 $0.0 $0.0 $0.0 $187.1 $158.1 $861.5 2000 $1,068.1 $0.0 $0.0 $0.0 $0.0 $0.0 $0.0 $936.0 $1,274.7 $3,278.7 2001 $0.0 $375.8 $74.2 $0.0 $229.3 $409.7 $5,525.1 $739.1 $67.4 $7,420.6 2002 $2,299.3 $0.0 $284.3 $0.0 $507.6 $1.2 $2,973.0 $346.8 $196.8 $6,609.0 2003 $0.0 $0.0 $349.4 $0.0 $390.5 $0.0 $0.0 $384.2 $246.9 $1,371.0 2004 $0.0 $0.0 $1,319.2 $0.0 $437.9 $12.7 $0.0 $399.7 $160.5 $2,330.1 2005 $399.4 $0.0 $81.7 $0.0 $0.0 $483.6 $984.3 $1,895.9 $1,425.0 $5,269.8 2006 $0.0 $38.4 $2,558.4 $0.0 $793.7 $1,064.8 $2,879.0 $405.8 $305.0 $8,045.1 2007 $21.1 $0.0 $1,137.0 $0.0 $0.0 $0.0 $1,550.1 $1,071.6 $1,043.3 $4,823.1 2008 $40.0 $124.1 $1,665.9 $0.0 $40.0 $0.0 $125.0 $865.3 $149.6 $3,009.9
1990–2008 Total
$7,184.1 $2,638.6 $9,390.9 $2,027.4 $3,631.5 $1,990.3 $14,039.6 $10,069.1 $7,452.7 $58,424.2
* Other includes school and educational buildings, service stations and repair garages, agricultural buildings, and structures other than buildings.
Total Value of Nonresidential Construction
$0
$1
$2
$3
$4
$5
$6
$7
$8
1975
1980
1990
1991
1992
1993
1994
1995
1996
1997
1998
1999
2000
2001
2002
2003
2004
2005
2006
2007
2008
Mil
lio
ns o
f C
on
sta
nt
20
08
Do
llars
Source: Bureau of Economic and Business Research, University of Utah.

The Structure and Economic Impact of Utah’s Coal Industry
192 B U R E A U O F E C O N O M I C A N D B U S I N E S S R E S E A R C H
8.2.3 Sevier County
8.2.3.1 Employment Sevier County’s economy is similar in size to that of Carbon County. Between 1970 and 2007 total employment76 grew 2.5 percent annually, from 4,495 to 11,353. Sevier had the most consis-tent growth of the three coal counties, interrupted by only a couple of flat periods from 1984 to 1992 and 2000 to 2003 (Exhibit 8.15). This was due to its lower dependence on the mining sec-tor, which is subject to boom and bust periods. As in Carbon and Emery counties, nonfarm proprietors’ employment was the fastest-growing type of employment in Sevier County, increasing 3.2 percent annually from 735 jobs in 1970 to 2,321 in 2007. Farm proprietors’ employment declined slowly over the period, as did total farm employment, but its current level is above what prevailed from the early 1970s through most of the 1990s, and represents a share of total employment about 3.9 times the national rate. All pro-prietors’ employment has shrunk as a share of total employment in the county, from 29 percent in 1970 to 25 percent in 2007, but this is still 1.25 times the national average. The growth in non-farm proprietors’ share from 16 percent to 20 percent was outweighed by the decline in farm proprietors’ share from 13 percent to just 4.5 percent. As a result, wage and salary employment has grown from almost 71 percent to 75 percent of all jobs. The three main nonfarm employment sectors in Sevier County have been and continue to be government, retail trade, and services (Tables 8.20 and 8.21). In 1970, these sectors combined accounted for more than half of all jobs in the county. There were 878 government jobs (20 per-cent), 823 retail jobs (19 percent), and 609 service jobs (14 percent). In 2007, under the NAICS system, government (mostly at the local level) provided 1,724 jobs (15 percent of total jobs), the retail trade sector provided 1,661 jobs (15 percent), and the service sector provided at least 2,389 jobs (21 percent). This latter figure represents employment in professional and business services, leisure and hospitality services, and in other services; employment data were not disclosed for education and health services. Although mining’s share of county employment has ranged from 1 percent to about 7 percent, less than that of manufacturing or construction, it is currently almost nine times the national share. In 2007 there were 533 mining jobs in Sevier County: 6 percent more than in 2006, 10 percent more than 1981’s peak of 486, and more than ten times the number in 1970. Most of these are coal mining jobs, but there has been growing oil production in the county since 2004. As noted above, Sevier County does not have the large employment concentration in mining that Carbon and Emery do. However it is significantly above the national average. While in 1970 mining’s share of local employment was only about one-third larger than its national share, by 1980 it was six times larger and in 2007 was more than eight times larger (Exhibit 8.16). In 1970 the county was relatively specialized in agricultural services, forestry, and fishing, with an em-ployment share more than twice the national average. By 2000, the largest relative concentration was in transportation and utilities, with a share three-quarters larger than the national share. Lo-cal government’s share of employment was about one-third greater than the national average, while federal (civilian) and state government each had shares about 10 percent larger. Retail
76 Total employment covers farm and nonfarm employment, and proprietors’ and wage and salary employment, and counts full- and part-time jobs equally.

The Structure and Economic Impact of Utah’s Coal Industry
B U R E A U O F E C O N O M I C A N D B U S I N E S S R E S E A R C H 193
Exhibit 8.15 Sevier County Employment Summary, 1970–2007
1970 1980 1990 2000 2001 2002 2003 2004 2005 2006 2007 Change AARC
Total Employment 4,495 6,407 7,091 10,140 10,004 10,157 10,245 10,673 10,743 11,152 11,353 152.6% 2.5% Employment by Type
Wage and Salary Employment 3,178 4,901 5,398 7,635 7,565 7,673 7,698 8,076 8,039 8,318 8,521 168.1% 2.7% Proprietors’ Employment 1,317 1,506 1,693 2,505 2,439 2,484 2,547 2,597 2,704 2,834 2,832 115.0% 2.1%
Farm Proprietors’ Employment 582 479 420 534 532 533 520 519 521 516 511 –12.2% –0.4% Nonfarm Proprietors’ Employment 735 1,027 1,273 1,971 1,907 1,951 2,027 2,078 2,183 2,318 2,321 215.8% 3.2%
Employment by Industry Farm Employment 814 665 576 639 640 623 628 620 627 618 599 –26.4% –0.8% Nonfarm Employment 3,681 5,742 6,515 9,501 9,364 9,534 9,617 10,053 10,116 10,534 10,754 192.1% 2.9%
Private Employment 2,769 4,489 5,167 7,790 7,715 7,853 7,913 8,342 8,422 8,808 9,030 226.1% 3.2% Government Employment 912 1,253 1,348 1,711 1,649 1,681 1,704 1,711 1,694 1,726 1,724 89.0% 1.7%
Shares by Type Wage and Salary Employment 70.7% 76.5% 76.1% 75.3% 75.6% 75.5% 75.1% 75.7% 74.8% 74.6% 75.1% Proprietors’ Employment 29.3% 23.5% 23.9% 24.7% 24.4% 24.5% 24.9% 24.3% 25.2% 25.4% 24.9%
Farm Proprietors’ Employment 12.9% 7.5% 5.9% 5.3% 5.3% 5.2% 5.1% 4.9% 4.8% 4.6% 4.5% Nonfarm Proprietors’ Employment 16.4% 16.0% 18.0% 19.4% 19.1% 19.2% 19.8% 19.5% 20.3% 20.8% 20.4%
Shares by Industry Farm Employment 18.1% 10.4% 8.1% 6.3% 6.4% 6.1% 6.1% 5.8% 5.8% 5.5% 5.3% Nonfarm Employment 81.9% 89.6% 91.9% 93.7% 93.6% 93.9% 93.9% 94.2% 94.2% 94.5% 94.7%
Private Employment 61.6% 70.1% 72.9% 76.8% 77.1% 77.3% 77.2% 78.2% 78.4% 79.0% 79.5% Government Employment 20.3% 19.6% 19.0% 16.9% 16.5% 16.6% 16.6% 16.0% 15.8% 15.5% 15.2% Location Quotients by Type
Wage and Salary Employment 0.82 0.89 0.90 0.90 0.91 0.91 0.92 0.93 0.92 0.93 0.94 14.5% 0.4% Proprietors’ Employment 2.14 1.64 1.53 1.48 1.44 1.41 1.38 1.31 1.32 1.29 1.25 –41.7% –1.4%
Farm Proprietors’ Employment 4.35 3.42 3.70 3.96 4.06 3.96 3.96 3.90 3.96 3.90 3.89 –10.6% –0.3% Nonfarm Proprietors’ Employment 1.53 1.32 1.28 1.27 1.22 1.20 1.18 1.12 1.14 1.12 1.09 –28.9% –0.9%
Location Quotients by Industry Farm Employment 4.17 3.12 3.59 3.38 3.50 3.32 3.39 3.36 3.49 3.45 3.36 –19.5% –0.6% Nonfarm Employment 0.86 0.93 0.94 0.95 0.95 0.96 0.96 0.96 0.96 0.96 0.96 12.4% 0.3%
Private Employment 0.79 0.87 0.88 0.91 0.91 0.92 0.92 0.93 0.93 0.93 0.94 18.5% 0.5% Government Employment 1.15 1.19 1.25 1.23 1.19 1.17 1.18 1.15 1.15 1.15 1.13 –1.6% 0.0%
Note: Location quotient values greater than 1.00 indicate concentrations relative to the country.
Employment by Type and Industry, 1970-2007
0
2,000
4,000
6,000
8,000
10,000
12,000
1970
1972
1974
1976
1978
1980
1982
1984
1986
1988
1990
1992
1994
1996
1998
2000
2002
2004
2006
Fu
ll-
an
d P
art
-Tim
e J
ob
s
Total EmploymentNonfarm EmploymentWage & Salary EmploymentProprietors' EmploymentFarm Employment
Source: U.S. Bureau of Economic Analysis, Regional Economic Information System and Bureau of Economic and Business Research, University of Utah.

The Structure and Economic Impact of Utah’s Coal Industry
194 B U R E A U O F E C O N O M I C A N D B U S I N E S S R E S E A R C H
Table 8.20 Sevier County Nonfarm Employment by Industry, 1970–2007
By SIC Industry 1970 1980 1990 1991 1992 1993 1994 1995 1996 1997 1998 1999 2000
Ag Services, Forestry, and Fishing 63 14 55 61 65 89 119 102 105 96 N/A N/A N/A Mining 49 435 332 337 333 313 337 N/A N/A N/A N/A N/A N/A Construction 142 448 279 279 321 356 441 482 547 591 581 624 608 Manufacturing 517 489 455 445 450 483 490 506 551 602 632 685 696 Transportation and Public Utilities 164 372 507 498 468 534 603 623 668 699 733 822 883 Wholesale Trade 152 232 292 276 285 267 292 308 328 320 329 351 354 Retail Trade 877 1,191 1,402 1,412 1,392 1,480 1,683 1,720 1,828 1,902 1,873 1,933 1,958 Finance, Insurance, and Real Estate 175 247 356 310 269 319 303 361 399 430 457 470 514 Services 630 1,061 1,489 1,540 1,508 1,596 1,888 N/A N/A N/A 2,260 2,288 2,333 Government 912 1,253 1,348 1,367 1,438 1,488 1,500 1,523 1,557 1,576 1,604 1,675 1,711
Federal, Civilian 165 298 197 192 182 183 183 182 180 171 166 173 193 Military 107 89 121 116 114 111 105 98 101 98 98 96 97 State N/A 179 227 232 252 252 248 253 234 250 265 317 335 Local N/A 687 803 827 890 942 964 990 1,042 1,057 1,075 1,089 1,086
By NAICS Industry 2001 2002 2003 2004 2005 2006 2007
Forestry, Fishing, and Related Activities N/A 63 69 N/A N/A N/A 66 Mining 359 411 409 414 437 504 533 Construction 626 587 588 640 635 691 657 Manufacturing 662 599 580 532 536 552 544 Transportation and Utilities N/A N/A N/A N/A N/A N/A N/A Wholesale Trade N/A N/A N/A N/A N/A N/A N/A Retail Trade 1,420 1,410 1,402 1,588 1,489 1,564 1,661 Information 89 98 96 114 109 116 106 Financial Activity 468 492 532 549 584 623 636 Professional & Business Services 554 N/A N/A N/A N/A N/A 697 Education & Health Services N/A N/A N/A N/A N/A N/A N/A Leisure & Hospitality Services 893 930 931 1,003 1,031 1,038 1,049 Other Services 601 591 596 623 629 661 643 Government 1,649 1,681 1,704 1,711 1,694 1,726 1,724
Federal, Civilian 203 209 215 227 225 215 212 Military 98 98 98 95 95 94 87 State 340 335 327 332 336 333 331 Local 1,008 1,039 1,064 1,057 1,038 1,084 1,094
N/A: Data not shown to avoid disclosure of confidential information or because the data were not available.
Source: U.S. Bureau of Economic Analysis, Regional Economic Information System.
Figure 8.9a
Sevier County Nonfarm Employment by SIC Industry, 1970–2000
0
1,000
2,000
3,000
4,000
5,000
6,000
7,000
8,000
9,000
10,000
1970
1972
1974
1976
1978
1980
1982
1984
1986
1988
1990
1992
1994
1996
1998
2000
Fu
ll-
an
d P
art
-Tim
e J
ob
s
Ag Services, Forestry, andFishingM ining
Wholesale Trade
Finance, Insurance, and RealEstateConstruction
M anufacturing
Transportation and PublicUtilitiesRetail Trade
Services
Government
Source: U.S. Bureau of Economic Analysis, Regional Economic Information System.

The Structure and Economic Impact of Utah’s Coal Industry
B U R E A U O F E C O N O M I C A N D B U S I N E S S R E S E A R C H 195
Figure 8.9b Sevier County Nonfarm Employment by NAICS Industry, 2001–2007
0
1,000
2,000
3,000
4,000
5,000
6,000
7,000
8,000
9,000
2001
2002
2003
2004
2005
2006
2007
Fu
ll-
an
d P
art
-Tim
e J
ob
sForestry, Fishing, and Related
Info rmation
M ining
M anufacturing
Financial Activity
Construction
Retail Trade
Pro f. & Bus. Services
Other Services
Leisure & Hospitality Services
Government
Note: Total employment appears much lower in 2001 than in 2000 because figures were not reported for several industries. Source: U.S. Bureau of Economic Analysis, Regional Economic Information System.
Table 8.21
Sevier County Nonfarm Employment Shares by Industry, 1970–2007
By SIC Industry 1970 1980 1990 1991 1992 1993 1994 1995 1996 1997 1998 1999 2000 Ag Services, Forestry, and Fishing 1.4% 0.2% 0.8% 0.9% 0.9% 1.2% 1.4% 1.2% 1.2% 1.0% N/A N/A N/A Mining 1.1% 6.8% 4.7% 4.8% 4.7% 4.2% 4.1% N/A N/A N/A N/A N/A N/A Construction 3.2% 7.0% 3.9% 4.0% 4.6% 4.8% 5.4% 5.7% 6.1% 6.3% 6.1% 6.3% 6.0% Manufacturing 11.5% 7.6% 6.4% 6.3% 6.4% 6.4% 6.0% 6.0% 6.1% 6.4% 6.6% 6.9% 6.9% Transportation and Public Utilities 3.6% 5.8% 7.1% 7.1% 6.6% 7.1% 7.3% 7.4% 7.4% 7.5% 7.7% 8.3% 8.7% Wholesale Trade 3.4% 3.6% 4.1% 3.9% 4.0% 3.6% 3.5% 3.7% 3.7% 3.4% 3.5% 3.5% 3.5% Retail Trade 19.5% 18.6% 19.8% 20.0% 19.7% 19.8% 20.5% 20.5% 20.4% 20.3% 19.7% 19.5% 19.3% Finance, Insurance, and Real Estate 3.9% 3.9% 5.0% 4.4% 3.8% 4.3% 3.7% 4.3% 4.4% 4.6% 4.8% 4.7% 5.1% Services 14.0% 16.6% 21.0% 21.8% 21.4% 21.3% 22.9% N/A N/A N/A 23.8% 23.0% 23.0% Government 20.3% 19.6% 19.0% 19.4% 20.4% 19.9% 18.2% 18.1% 17.4% 16.8% 16.9% 16.9% 16.9%
Federal, Civilian 3.7% 4.7% 2.8% 2.7% 2.6% 2.4% 2.2% 2.2% 2.0% 1.8% 1.7% 1.7% 1.9% Military 2.4% 1.4% 1.7% 1.6% 1.6% 1.5% 1.3% 1.2% 1.1% 1.0% 1.0% 1.0% 1.0% State N/A 2.8% 3.2% 3.3% 3.6% 3.4% 3.0% 3.0% 2.6% 2.7% 2.8% 3.2% 3.3% Local N/A 10.7% 11.3% 11.7% 12.6% 12.6% 11.7% 11.8% 11.6% 11.3% 11.3% 11.0% 10.7%
By NAICS Industry 2001 2002 2003 2004 2005 2006 2007
Forestry, Fishing, and Related Activities N/A 0.6% 0.7% N/A N/A N/A 0.6% Mining 3.6% 4.0% 4.0% 3.9% 4.1% 4.5% 4.7% Construction 6.3% 5.8% 5.7% 6.0% 5.9% 6.2% 5.8% Manufacturing 6.6% 5.9% 5.7% 5.0% 5.0% 4.9% 4.8% Transportation and Utilities N/A N/A N/A N/A N/A N/A N/A Wholesale Trade N/A N/A N/A N/A N/A N/A N/A Retail Trade 14.2% 13.9% 13.7% 14.9% 13.9% 14.0% 14.6% Information 0.9% 1.0% 0.9% 1.1% 1.0% 1.0% 0.9% Financial Activity 4.7% 4.8% 5.2% 5.1% 5.4% 5.6% 5.6% Professional & Business Services 5.5% N/A N/A N/A N/A N/A 6.1% Education & Health Services N/A N/A N/A N/A N/A N/A N/A Leisure & Hospitality Services 8.9% 9.2% 9.1% 9.4% 9.6% 9.3% 9.2% Other Services 6.0% 5.8% 5.8% 5.8% 5.9% 5.9% 5.7% Government 16.5% 16.6% 16.6% 16.0% 15.8% 15.5% 15.2%
Federal, Civilian 2.0% 2.1% 2.1% 2.1% 2.1% 1.9% 1.9% Military 1.0% 1.0% 1.0% 0.9% 0.9% 0.8% 0.8% State 3.4% 3.3% 3.2% 3.1% 3.1% 3.0% 2.9% Local 10.1% 10.2% 10.4% 9.9% 9.7% 9.7% 9.6%
Shares are of total farm and nonfarm employment. N/A: Data not shown to avoid disclosure of confidential information or because the data were not available. Source: U.S. Bureau of Economic Analysis, Regional Economic Information System.

The Structure and Economic Impact of Utah’s Coal Industry
196 B U R E A U O F E C O N O M I C A N D B U S I N E S S R E S E A R C H
Exhibit 8.16 Sevier County Nonfarm Employment Location Quotients by Industry, 1970–2007
By SIC Industry 1970 1980 1990 1991 1992 1993 1994 1995 1996 1997 1998 1999 2000
Ag Services, Forestry, and Fishing 2.44 0.27 0.74 0.80 0.86 1.03 1.22 1.02 0.95 0.82 N/A N/A N/A Mining 1.34 6.07 6.25 6.47 7.02 6.35 6.36 N/A N/A N/A N/A N/A N/A Construction 0.66 1.41 0.76 0.81 0.93 0.96 1.05 1.11 1.16 1.18 1.12 1.11 1.06 Manufacturing 0.53 0.42 0.45 0.46 0.47 0.49 0.45 0.47 0.49 0.52 0.54 0.58 0.60 Transportation and Public Utilities 0.68 1.17 1.52 1.49 1.43 1.51 1.54 1.56 1.56 1.56 1.59 1.69 1.76 Wholesale Trade 0.74 0.72 0.85 0.82 0.84 0.77 0.77 0.79 0.79 0.74 0.75 0.77 0.77 Retail Trade 1.30 1.19 1.20 1.22 1.19 1.20 1.23 1.22 1.21 1.21 1.20 1.19 1.18 Finance, Insurance, and Real Estate 0.58 0.50 0.65 0.58 0.52 0.58 0.50 0.58 0.60 0.61 0.62 0.61 0.64 Services 0.75 0.76 0.76 0.77 0.74 0.73 0.78 N/A N/A N/A 0.76 0.73 0.72 Government 1.15 1.19 1.25 1.26 1.32 1.31 1.22 1.24 1.21 1.19 1.21 1.22 1.23
Federal, Civilian 1.15 1.77 1.20 1.21 1.16 1.14 1.08 1.10 1.06 1.01 0.99 1.02 1.10 Military 0.67 0.63 0.88 0.86 0.85 0.83 0.77 0.76 0.77 0.75 0.78 0.76 0.77 State N/A 0.85 1.01 1.02 1.10 1.03 0.93 0.94 0.84 0.87 0.93 1.07 1.11 Local N/A 1.28 1.45 1.47 1.57 1.57 1.47 1.49 1.48 1.44 1.45 1.40 1.37
By NAICS Industry 2001 2002 2003 2004 2005 2006 2007
Forestry, Fishing, and Related Activities N/A 0.98 1.14 N/A N/A N/A 1.04 Mining 7.39 8.98 8.32 8.44 8.45 9.08 8.63 Construction 1.06 1.00 0.97 0.99 0.94 0.95 0.90 Manufacturing 0.65 0.62 0.63 0.57 0.59 0.60 0.60 Transportation and Utilities N/A N/A N/A N/A N/A N/A N/A Wholesale Trade N/A N/A N/A N/A N/A N/A N/A Retail Trade 1.28 1.25 1.24 1.36 1.27 1.30 1.37 Information 0.37 0.43 0.44 0.51 0.49 0.51 0.48 Financial Activity 0.58 0.59 0.62 0.60 0.62 0.62 0.61 Professional & Business Services 0.42 N/A N/A N/A N/A N/A 0.44 Education & Health Services N/A N/A N/A N/A N/A N/A N/A Leisure & Hospitality Services 1.06 1.07 1.05 1.07 1.10 1.07 1.05 Other Services 1.11 1.03 1.02 1.03 1.03 1.04 1.01 Government 1.19 1.17 1.18 1.15 1.15 1.15 1.13
Federal, Civilian 1.24 1.25 1.25 1.30 1.31 1.24 1.21 Military 0.78 0.77 0.76 0.73 0.76 0.74 0.68 State 1.13 1.08 1.06 1.04 1.06 1.03 1.01 Local 1.26 1.25 1.27 1.23 1.21 1.23 1.23
Note: Values greater than 1.00 indicate concentrations relative to the country.
Basic Industries' Location Quotients, 2001-2007
1.00
2.00
3.00
4.00
5.00
6.00
7.00
8.00
9.00
10.00
2001
2002
2003
2004
2005
2006
2007
Min
ing
LQ
s
1.00
1.05
1.10
1.15
1.20
1.25
1.30
1.35
1.40
Oth
er
LQ
s
Mining (left scale) Retail TradeFederal Government Local GovernmentLeisure & Hospitality Services State GovernmentOther Services
Source: U.S. Bureau of Economic Analysis, Regional Economic Information System and Bureau of Economic and Business Research, University of Utah.

The Structure and Economic Impact of Utah’s Coal Industry
B U R E A U O F E C O N O M I C A N D B U S I N E S S R E S E A R C H 197
trade’s share was about one-fifth above average. Figures for mining and ag services, forestry, and fishing were not available. In 2007, retail trade, local government, and federal civilian govern-ment continued to represent above-average employment shares, ranging from 21 percent larger for the federal government to 37 percent larger for retail trade. Several sectors—forestry, fishing, and related activities, leisure and hospitality services, other services, and state government—had employment shares between 1 and 5 percent above average. 8.2.3.2 Personal Income and Earnings Total personal income77 in Sevier County grew 2.8 percent annually between 1970 and 2007 from $162.0 million to $453.4 million. (All amounts are in constant 2007 dollars.) The only ex-tended downturn or “bust” was from 1984 to 1991, when personal income shrank from $353.8 million to $306.8 million (Table 8.22 and Figure 8.10). Per capita personal income grew more slowly, just 0.9 percent per year, from $15,957 in 1970 to $22,179 in 2007. In fact, it has been essentially flat since reaching $21,186 in 1978. Real average annual wages have also been stag-nant, growing only 0.4 percent annually from $24,451 in 1970 to $28,425 in 2007, and peaking at just $31,148 in 1984. Sevier County has the lowest average wages of the three coal counties, trail-ing those in Carbon County by $5,600 and those in Emery by more than $11,200 in 2007. In contrast, personal transfer receipts, which include government social benefits and retirement income, averaged 4.5 percent annual growth between 1970 and 2007, increasing fivefold from $19.6 million to $100.3 million. This indicates a growing elderly population in the county. Wage and salary disbursements increased 3.1 percent annually over the period, from $77.7 mil-lion to $242.2 million, and supplements to wages and salaries grew at an average 5.7 percent an-nually from $8.1 million to $61.7 million. In contrast, proprietors’ income shrank 1.1 percent annually, from $38.4 million in 1970 to $25.7 million in 2007, despite proprietors’ employment growing 2.1 percent annually. This decline was driven by farm proprietors’ income, which fell from $16.4 million in 1970 to a loss of $0.8 million in 2007. Nonfarm proprietors’ income grew only slightly over the period, from $22.0 million to $26.4 million. Total farm earnings in Sevier County were rather volatile over the study period. They began at $19.9 million in 1970, reached $28.6 million in 1973, fell to $4.1 million in 1981, climbed back to $18.3 million in 1986 where they more or less remained through 2001, then slid to $12.5 million in 2002, and finally dropped to $2.2 million in 2006 and $3.0 million in 2007. Despite the recent decline, Sevier has by far the highest farm earnings of the three coal counties and was the only county with positive farm earnings in 2007. Sevier’s nonfarm earnings saw a net gain over the study period, more than tripling from $104.2 million to $326.6 million. Sevier County is the only one of the three coal counties in which total personal income and nonfarm earnings in 2007 were at their highest levels of the study period; Carbon and Emery both ended below earlier peaks.
77 Note that the sum of wage and salary disbursements plus supplements to wages and salaries plus proprietors’ income equals the sum of farm and nonfarm earnings. Both are ways of measuring earnings by place of work. Sub-tracting employer and employee contributions for government social insurance and adding personal transfer re-ceipts, income from dividends, interest, and rent, and a residence adjustment that covers the effects of interarea commuters, yields total personal income, which is by place of residence.

The Structure and Economic Impact of Utah’s Coal Industry
198 B U R E A U O F E C O N O M I C A N D B U S I N E S S R E S E A R C H
Table 8.22 Sevier County Income Summary, 1970–2007
(Millions of Constant 2007 Dollars)
1970 1980 1990 2000 2001 2002 2003 2004 2005 2006 2007 Change AARC
Total Personal Income $162.0 $290.5 $309.6 $405.4 $409.4 $407.0 $400.7 $414.4 $429.3 $444.1 $453.4 179.9% 2.8% Per Capita Personal Income (dollars) $15,957 $19,498 $20,062 $21,407 $21,347 $21,162 $20,741 $21,343 $21,847 $22,221 $22,179 39.0% 0.9% Average Annual Wage per Job (dollars) $24,451 $29,949 $27,251 $26,418 $26,785 $27,190 $26,689 $26,520 $26,939 $28,015 $28,425 16.3% 0.4% Personal Transfer Receipts $19.6 $36.7 $55.9 $81.2 $82.4 $86.4 $88.7 $88.5 $93.4 $99.4 $100.3 412.2% 4.5%
Components of Earnings Wage and salary disbursements $77.7 $146.8 $147.1 $201.7 $202.6 $208.6 $205.4 $214.2 $215.1 $231.5 $242.2 211.7% 3.1% Supplements to wages and salaries $8.1 $29.9 $33.0 $46.2 $46.9 $51.1 $53.3 $59.2 $58.6 $60.7 $61.7 666.2% 5.7%
Employer contribs for pensions and insurance $4.8 $20.8 $21.5 $31.0 $31.6 $35.1 $36.8 $41.7 $41.0 $41.9 $42.8 793.0% 6.1% Employer contribs for gov’t social insurance $3.3 $9.1 $11.5 $15.2 $15.3 $16.0 $16.5 $17.5 $17.7 $18.9 $19.0 480.3% 4.9%
Proprietors income $38.4 $36.2 $40.3 $30.0 $35.5 $27.6 $27.2 $31.8 $34.6 $27.3 $25.7 –33.2% –1.1% Farm proprietors income $16.4 $5.8 $15.4 $11.1 $15.6 $8.7 $7.4 $8.5 $7.7 –$1.4 –$0.8 –104.7% N/A Nonfarm proprietors income $22.0 $30.4 $25.0 $18.8 $19.8 $18.9 $19.8 $23.3 $27.0 $28.7 $26.4 20.0% 0.5%
Farm earnings $19.9 $10.4 $18.3 $14.5 $18.9 $12.5 $10.8 $12.0 $11.5 $2.2 $3.0 –85.0% –5.0% Nonfarm earnings $104.2 $202.5 $202.2 $263.3 $266.1 $274.9 $275.2 $293.2 $296.9 $317.3 $326.6 213.4% 3.1%
Private earnings $75.7 $155.2 $152.2 $195.5 $198.9 $206.1 $204.5 $221.8 $224.6 $244.6 $253.4 234.6% 3.3% Government earnings $28.5 $47.3 $49.9 $67.8 $67.2 $68.8 $70.6 $71.4 $72.3 $72.7 $73.2 157.0% 2.6%
Components’ Shares of Total Earnings Wage and salary disbursements 62.6% 68.9% 66.7% 72.6% 71.1% 72.6% 71.9% 70.2% 69.8% 72.4% 73.5% Supplements to wages and salaries 6.5% 14.1% 15.0% 16.6% 16.5% 17.8% 18.6% 19.4% 19.0% 19.0% 18.7%
Employer contribs for pensions and insurance 3.9% 9.8% 9.8% 11.2% 11.1% 12.2% 12.9% 13.7% 13.3% 13.1% 13.0% Employer contribs for gov’t social insurance 2.6% 4.3% 5.2% 5.5% 5.4% 5.6% 5.8% 5.7% 5.7% 5.9% 5.8%
Proprietors income 30.9% 17.0% 18.3% 10.8% 12.4% 9.6% 9.5% 10.4% 11.2% 8.5% 7.8% Farm proprietors income 13.2% 2.7% 7.0% 4.0% 5.5% 3.0% 2.6% 2.8% 2.5% –0.4% –0.2% Nonfarm proprietors income 17.7% 14.3% 11.3% 6.8% 7.0% 6.6% 6.9% 7.6% 8.7% 9.0% 8.0%
Farm earnings 16.0% 4.9% 8.3% 5.2% 6.6% 4.4% 3.8% 3.9% 3.7% 0.7% 0.9% Nonfarm earnings 84.0% 95.1% 91.7% 94.8% 93.4% 95.6% 96.2% 96.1% 96.3% 99.3% 99.1%
Private earnings 61.0% 72.9% 69.0% 70.4% 69.8% 71.7% 71.5% 72.7% 72.8% 76.5% 76.9% Government earnings 23.0% 22.2% 22.6% 24.4% 23.6% 23.9% 24.7% 23.4% 23.5% 22.8% 22.2%
Location Quotients of Earnings Components Wage and salary disbursements 0.79 0.91 0.90 0.98 0.97 1.00 1.00 0.99 0.98 1.01 1.02 29.4% 0.7% Supplements to wages and salaries 0.69 0.94 0.96 1.14 1.11 1.10 1.11 1.16 1.13 1.15 1.14 65.3% 1.4%
Employer contribs for pensions and insurance 0.65 0.97 0.97 1.20 1.17 1.13 1.13 1.20 1.15 1.16 1.17 79.7% 1.6% Employer contribs for gov’t social insurance 0.77 0.88 0.94 1.03 1.01 1.04 1.07 1.07 1.07 1.11 1.09 42.9% 1.0%
Proprietors income 2.70 1.77 1.77 0.96 1.08 0.86 0.83 0.87 0.93 0.71 0.66 –75.6% –3.7% Farm proprietors income 6.85 4.42 7.75 10.54 16.76 16.47 6.49 5.98 6.04 N/A N/A Nonfarm proprietors income 1.86 1.59 1.20 0.62 0.62 0.59 0.63 0.66 0.75 0.76 0.70 –62.3% –2.6%
Farm earnings 6.33 4.35 6.57 7.65 10.40 8.91 5.52 5.20 5.43 1.54 1.47 –76.9% –3.9% Nonfarm earnings 0.86 0.96 0.93 0.95 0.94 0.96 0.97 0.97 0.97 1.00 1.00 15.8% 0.4%
Private earnings 0.77 0.90 0.85 0.84 0.83 0.86 0.87 0.88 0.88 0.92 0.93 20.5% 0.5% Government earnings 1.26 1.26 1.27 1.59 1.51 1.46 1.47 1.41 1.41 1.39 1.35 6.9% 0.2%
Note: Average wage per job is wage and salary disbursements divided by wage and salary employment. Location quotient values greater than 1.00 indicate concentrations relative to the country.
Source: U.S. Bureau of Economic Analysis, Regional Economic Information System; Utah Department of Workforce Services; and Bureau of Economic and Business Research, University of Utah.

The Structure and Economic Impact of Utah’s Coal Industry
B U R E A U O F E C O N O M I C A N D B U S I N E S S R E S E A R C H 199
Figure 8.10 Sevier County Components of Personal Income, 1970–2007
$0.0
$50.0
$100.0
$150.0
$200.0
$250.0
$300.0
$350.0
$400.0
$450.0
1970
1972
1974
1976
1978
1980
1982
1984
1986
1988
1990
1992
1994
1996
1998
2000
2002
2004
2006
Mil
lio
ns o
f C
on
sta
nt
20
07
Do
llars
Total Personal IncomeNonfarm EarningsPersonal Transfer ReceiptsProprietors IncomeFarm Earnings
Source: U.S. Bureau of Economic Analysis, Regional Economic Information System.
In 2007, 73.5 percent of total earnings in Sevier County came from wages and salaries, less than 19 percent was due to supplements to wages and salaries (employer contributions for pensions, insurance, and government social insurance), and the remaining almost 8 percent was proprie-tors’ income. Sevier had the highest share of earnings from proprietors’ income of the three coal counties but it was just two-thirds of the national average, down from 2.7 times the average in 1970. Farm proprietors’ share was 6.0 times the national average in 2004 and 2005, and was as high as 16.8 times in 2001. Similarly, farm earnings’ share of total earnings was 1.5 times the na-tional average in 2006 and 2007, and reached 10.4 times in 2001. Sevier is the most agriculture-dependent of the three study counties. The main sources of nonfarm earnings in Sevier County in 1970 were retail trade, which paid $20.1 million (in constant 2007 dollars); state and local government, which together paid $19.0 million; manufacturing, which paid $17.0 million; transportation and public utilities, which paid $11.2 million; and services, which paid $10.6 million (Table 8.23 and Figure 8.11a). Together these sectors accounted for 63 percent of total (farm and nonfarm) earnings, with the top three representing 16 percent, 15 percent, and almost 14 percent, respectively (Table 8.24). Mining was just 2 percent of total earnings. By way of comparison, farm earnings contributed 16 percent of the total. In 2000 there were the same top five sectors, though their order had changed. State and local government paid $51.4 million, services paid $48.6 million, transportation and public utilities paid $39.0 million, retail trade paid $31.2 million, and manufacturing paid $24.5 million. These sectors now accounted for 70 percent of total earnings, and the top three contributed al-most 19 percent, 17.5 percent, and 14 percent, respectively. Farm earnings had shrunk to just 5 percent, and figures for mining were not disclosed.

The Structure and Economic Impact of Utah’s Coal Industry
200 B U R E A U O F E C O N O M I C A N D B U S I N E S S R E S E A R C H
Table 8.23 Sevier County Nonfarm Earnings by Industry, 1970–2007
(Millions of Constant 2007 Dollars)
By SIC Industry 1970 1980 1990 1991 1992 1993 1994 1995 1996 1997 1998 1999 2000 Agricultural Services, Forestry, Fishing $1.0 $0.2 $0.5 $0.7 $0.6 $0.7 $0.7 $0.6 $0.6 $0.7 N/A N/A N/A Mining $2.2 $33.7 $23.6 $23.1 $22.0 $22.7 $23.3 N/A N/A N/A N/A N/A N/A
Metal mining $0.00 $0.00 N/A $0.00 $0.00 $0.00 $0.00 $0.00 $0.00 N/A $0.00 $0.00 $0.00 Coal mining N/A N/A N/A $21.0 $19.6 $20.0 $19.5 N/A N/A N/A N/A N/A N/A Oil and gas extraction N/A N/A $0.20 N/A $0.20 $0.16 N/A N/A N/A N/A N/A N/A N/A Nonmetallic minerals, except fuels N/A N/A $1.9 N/A $2.2 $2.6 $3.8 $3.3 $3.3 $4.1 N/A N/A N/A
Construction $5.5 $18.9 $7.6 $7.4 $8.6 $10.3 $13.4 $13.4 $13.8 $13.7 $15.1 $14.9 $13.7 Manufacturing $17.0 $18.6 $16.0 $15.0 $15.0 $15.6 $15.7 $17.3 $19.3 $21.1 $22.0 $25.2 $24.5
Petroleum and coal products $0.0 $0.3 $2.5 $2.1 $2.2 $3.4 $2.9 $2.8 $2.9 $3.8 N/A N/A N/A Transportation and Public Utilities $11.2 $20.9 $28.7 $28.4 $28.8 $32.6 $35.0 $32.0 $35.7 $35.5 $36.0 $37.5 $39.0 Wholesale Trade $5.5 $8.4 $12.1 $10.9 $8.9 $7.7 $9.0 $8.5 $9.0 $9.4 $9.4 $10.2 $10.5 Retail Trade $20.1 $23.8 $23.0 $22.3 $22.6 $25.2 $26.1 $26.1 $26.6 $29.3 $30.4 $31.2 $31.2
Building materials and garden equipment $1.83 $1.98 $1.09 $1.11 $1.16 $1.23 $1.44 $1.50 $1.70 $1.68 $2.04 $2.22 $2.28 General merchandise stores $2.80 $2.11 $2.43 $2.04 $2.59 $2.87 $2.68 $2.79 $2.70 $3.03 $3.31 $3.37 N/A Food stores $2.49 $3.92 $4.32 $4.85 $4.80 $5.03 $5.25 $4.90 $5.02 $5.39 $5.98 $6.16 $6.01 Automotive dealers and service stations $6.84 $6.22 $6.05 $5.85 $5.80 $7.56 $8.15 $8.10 $8.05 $8.85 $8.11 $8.26 $8.50 Apparel and accessory stores $0.67 $1.25 $1.21 $1.21 $0.47 $0.50 $0.59 $0.61 $0.64 $0.71 $0.71 $0.66 $0.61 Home furniture and furnishings stores $1.06 $1.29 $1.35 $0.88 $0.74 $0.75 $0.63 $0.57 $0.91 $1.17 $1.01 $0.83 N/A Eating and drinking places $2.07 $3.84 $3.82 $3.96 $4.41 $4.59 $4.69 $5.22 $5.07 $5.16 $5.87 $6.27 $6.45 Miscellaneous retail $2.30 $3.21 $2.70 $2.42 $2.60 $2.66 $2.67 $2.37 $2.56 $3.28 $3.35 $3.46 $3.26
Finance, Insurance, and Real Estate $2.6 $5.2 $5.4 $4.5 $6.2 $7.9 $5.5 $6.0 $5.7 $6.9 $7.9 $6.6 $6.7 Services $10.6 $25.3 $35.3 $34.8 $34.6 $37.3 $42.8 N/A N/A N/A $56.0 $50.1 $48.6 Government $28.5 $47.3 $49.9 $51.0 $53.0 $53.9 $56.6 $57.3 $60.2 $61.0 $64.4 $65.3 $67.8
Federal, Civilian $8.7 $17.4 $12.1 $12.2 $12.4 $12.5 $13.7 $13.1 $13.8 $13.0 $14.2 $13.3 $14.6 Military $0.8 $0.9 $2.0 $1.8 $1.8 $1.8 $1.8 $1.6 $1.7 $1.7 $1.7 $1.7 $1.8 State N/A $7.5 $9.2 $9.5 $9.8 $9.7 $10.3 $10.6 $11.1 $11.6 $12.3 $13.0 $14.0 Local N/A $21.5 $26.6 $27.5 $29.0 $29.9 $30.9 $31.9 $33.5 $34.7 $36.2 $37.2 $37.4
By NAICS Industry 2001 2002 2003 2004 2005 2006 2007
Forestry, Fishing, and Related Activities N/A $0.6 $0.9 N/A N/A N/A $0.5 Mining $21.5 $24.0 $22.7 $23.8 $22.7 $26.2 $30.0
Oil and gas extraction N/A $0.0 N/A N/A N/A N/A N/A Mining (except oil and gas) $21.5 $24.0 $22.7 N/A $22.3 $24.8 $28.3 Support activities for mining N/A $0.0 $0.0 $0.0 N/A N/A N/A
Construction $13.0 $13.2 $13.3 $14.8 $12.9 $13.9 $13.9 Manufacturing $22.4 $19.3 $18.0 $19.1 $18.7 $21.1 $21.7
Petroleum and coal products N/A N/A N/A N/A N/A N/A N/A Transportation and Utilities N/A N/A N/A N/A N/A N/A N/A Wholesale Trade N/A N/A N/A N/A N/A N/A N/A Retail Trade $30.8 $30.4 $29.5 $34.1 $34.1 $35.0 $37.4
Motor vehicle and parts dealers $7.2 $7.2 $7.1 $7.2 $7.6 $7.7 $8.2 Furniture and home furnishings stores $0.5 $0.4 N/A N/A N/A N/A $0.7 Electronics and appliance stores N/A N/A N/A $0.7 $0.5 $0.4 N/A Building material and garden supply stores $3.4 $3.3 $3.4 $3.4 $3.6 $3.8 $5.0 Food and beverage stores $7.1 $7.6 $7.3 $6.9 $7.0 $7.0 $7.1 Health and personal care stores $0.6 $0.4 $0.3 N/A N/A N/A N/A Gasoline stations $4.5 $4.3 $4.0 $4.5 $4.7 $4.8 $4.7 Clothing and clothing accessories stores $0.9 $1.0 $0.6 $0.7 $0.6 $0.6 $0.7 Sporting goods, hobby, book & music stores N/A N/A $0.5 $0.5 $0.5 $0.6 $0.7 General merchandise stores $3.3 $3.2 $3.3 $7.6 $6.5 $6.7 $7.1 Miscellaneous store retailers $1.1 $1.2 $1.0 $1.0 $1.0 $1.0 $1.1 Nonstore retailers $1.2 $1.2 $1.1 $1.1 $1.3 $1.4 $1.6
Information $2.4 $2.3 $2.4 $2.7 $2.9 $3.3 $3.3 Financial Activity $6.2 $8.1 $8.4 $8.7 $9.0 $9.3 $9.5 Professional & Business Services $11.7 N/A N/A N/A N/A N/A $17.3 Education & Health Services N/A N/A N/A N/A N/A N/A N/A Leisure & Hospitality Services $9.3 $9.7 $10.5 $11.0 $11.2 $11.9 $12.4 Other Services $16.7 $15.2 $15.8 $15.8 $15.0 $14.8 $15.0 Government $67.2 $68.8 $70.6 $71.4 $72.3 $72.7 $73.2
Federal, Civilian $15.2 $16.1 $16.4 $18.4 $18.9 $18.9 $18.3 Military $1.9 $2.4 $3.4 $3.5 $4.0 $3.5 $3.3 State $14.3 $14.5 $13.6 $15.0 $14.9 $15.0 $15.0 Local $35.8 $35.8 $37.3 $34.6 $34.6 $35.3 $36.6
N/A: Data not shown to avoid disclosure of confidential information or because the data were not available.
Source: U.S. Bureau of Economic Analysis, Regional Economic Information System.

The Structure and Economic Impact of Utah’s Coal Industry
B U R E A U O F E C O N O M I C A N D B U S I N E S S R E S E A R C H 201
Figure 8.11a Sevier County Nonfarm Earnings by SIC Industry, 1970–2000
$0.0
$50.0
$100.0
$150.0
$200.0
$250.0
1970
1972
1974
1976
1978
1980
1982
1984
1986
1988
1990
1992
1994
1996
1998
2000
Mil
lio
ns o
f C
on
sta
nt
20
07
Do
llars
Agricultural Services, Forestry,Fishing
FIRE
Wholesale Trade
Construction
Manufacturing
Retail Trade
Mining
Transportation and PublicUtilitiesServices
Government
Source: U.S. Bureau of Economic Analysis, Regional Economic Information System.
Figure 8.11b Sevier County Nonfarm Earnings by NAICS Industry, 2001–2007
$0.0
$50.0
$100.0
$150.0
$200.0
$250.0
2001
2002
2003
2004
2005
2006
2007
Mil
lio
ns o
f C
on
sta
nt
20
07
Do
llars
Forestry, Fishing, and RelatedActivities
Information
Financial Activity
Professional & BusinessServices
Leisure & Hospitality Services
Other Services
Construction
Manufacturing
Mining
Retail Trade
Government
Note: Total earnings appear much lower in 2001 than in 2000 because figures were not reported for several industries. Source: U.S. Bureau of Economic Analysis, Regional Economic Information System.
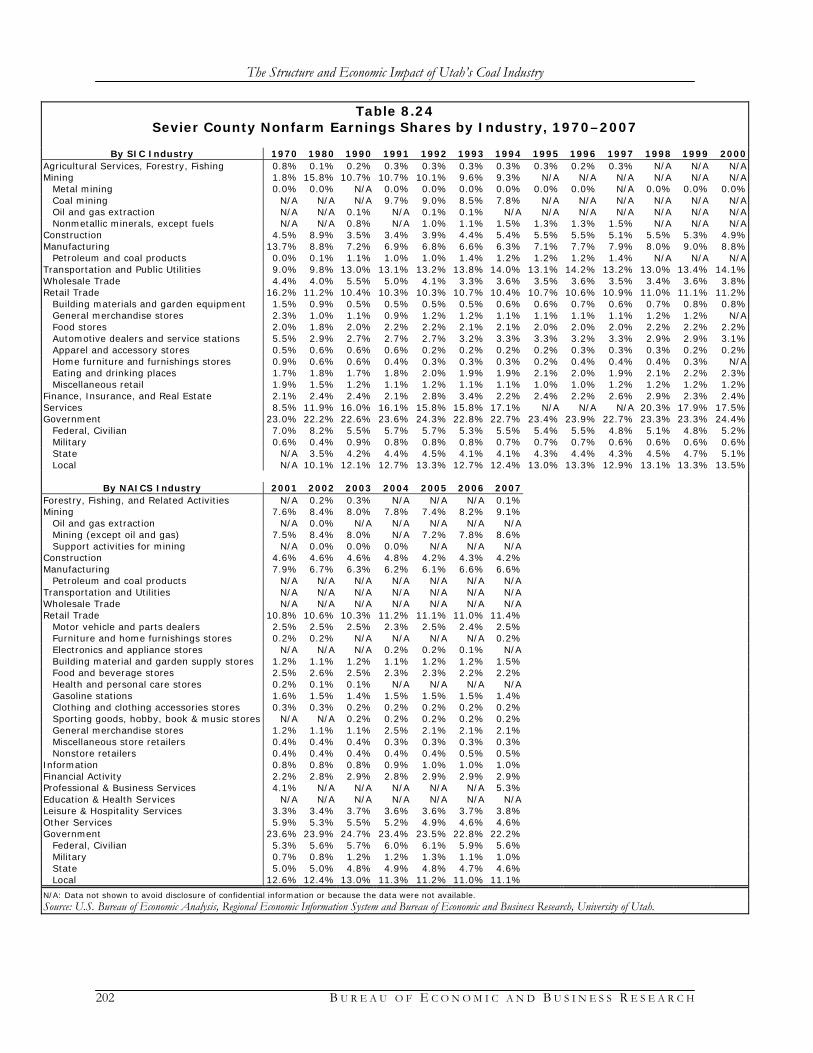
The Structure and Economic Impact of Utah’s Coal Industry
202 B U R E A U O F E C O N O M I C A N D B U S I N E S S R E S E A R C H
Table 8.24 Sevier County Nonfarm Earnings Shares by Industry, 1970–2007
By SIC Industry 1970 1980 1990 1991 1992 1993 1994 1995 1996 1997 1998 1999 2000
Agricultural Services, Forestry, Fishing 0.8% 0.1% 0.2% 0.3% 0.3% 0.3% 0.3% 0.3% 0.2% 0.3% N/A N/A N/A Mining 1.8% 15.8% 10.7% 10.7% 10.1% 9.6% 9.3% N/A N/A N/A N/A N/A N/A
Metal mining 0.0% 0.0% N/A 0.0% 0.0% 0.0% 0.0% 0.0% 0.0% N/A 0.0% 0.0% 0.0% Coal mining N/A N/A N/A 9.7% 9.0% 8.5% 7.8% N/A N/A N/A N/A N/A N/A Oil and gas extraction N/A N/A 0.1% N/A 0.1% 0.1% N/A N/A N/A N/A N/A N/A N/A Nonmetallic minerals, except fuels N/A N/A 0.8% N/A 1.0% 1.1% 1.5% 1.3% 1.3% 1.5% N/A N/A N/A
Construction 4.5% 8.9% 3.5% 3.4% 3.9% 4.4% 5.4% 5.5% 5.5% 5.1% 5.5% 5.3% 4.9% Manufacturing 13.7% 8.8% 7.2% 6.9% 6.8% 6.6% 6.3% 7.1% 7.7% 7.9% 8.0% 9.0% 8.8%
Petroleum and coal products 0.0% 0.1% 1.1% 1.0% 1.0% 1.4% 1.2% 1.2% 1.2% 1.4% N/A N/A N/A Transportation and Public Utilities 9.0% 9.8% 13.0% 13.1% 13.2% 13.8% 14.0% 13.1% 14.2% 13.2% 13.0% 13.4% 14.1% Wholesale Trade 4.4% 4.0% 5.5% 5.0% 4.1% 3.3% 3.6% 3.5% 3.6% 3.5% 3.4% 3.6% 3.8% Retail Trade 16.2% 11.2% 10.4% 10.3% 10.3% 10.7% 10.4% 10.7% 10.6% 10.9% 11.0% 11.1% 11.2%
Building materials and garden equipment 1.5% 0.9% 0.5% 0.5% 0.5% 0.5% 0.6% 0.6% 0.7% 0.6% 0.7% 0.8% 0.8% General merchandise stores 2.3% 1.0% 1.1% 0.9% 1.2% 1.2% 1.1% 1.1% 1.1% 1.1% 1.2% 1.2% N/A Food stores 2.0% 1.8% 2.0% 2.2% 2.2% 2.1% 2.1% 2.0% 2.0% 2.0% 2.2% 2.2% 2.2% Automotive dealers and service stations 5.5% 2.9% 2.7% 2.7% 2.7% 3.2% 3.3% 3.3% 3.2% 3.3% 2.9% 2.9% 3.1% Apparel and accessory stores 0.5% 0.6% 0.6% 0.6% 0.2% 0.2% 0.2% 0.2% 0.3% 0.3% 0.3% 0.2% 0.2% Home furniture and furnishings stores 0.9% 0.6% 0.6% 0.4% 0.3% 0.3% 0.3% 0.2% 0.4% 0.4% 0.4% 0.3% N/A Eating and drinking places 1.7% 1.8% 1.7% 1.8% 2.0% 1.9% 1.9% 2.1% 2.0% 1.9% 2.1% 2.2% 2.3% Miscellaneous retail 1.9% 1.5% 1.2% 1.1% 1.2% 1.1% 1.1% 1.0% 1.0% 1.2% 1.2% 1.2% 1.2%
Finance, Insurance, and Real Estate 2.1% 2.4% 2.4% 2.1% 2.8% 3.4% 2.2% 2.4% 2.2% 2.6% 2.9% 2.3% 2.4% Services 8.5% 11.9% 16.0% 16.1% 15.8% 15.8% 17.1% N/A N/A N/A 20.3% 17.9% 17.5% Government 23.0% 22.2% 22.6% 23.6% 24.3% 22.8% 22.7% 23.4% 23.9% 22.7% 23.3% 23.3% 24.4%
Federal, Civilian 7.0% 8.2% 5.5% 5.7% 5.7% 5.3% 5.5% 5.4% 5.5% 4.8% 5.1% 4.8% 5.2% Military 0.6% 0.4% 0.9% 0.8% 0.8% 0.8% 0.7% 0.7% 0.7% 0.6% 0.6% 0.6% 0.6% State N/A 3.5% 4.2% 4.4% 4.5% 4.1% 4.1% 4.3% 4.4% 4.3% 4.5% 4.7% 5.1% Local N/A 10.1% 12.1% 12.7% 13.3% 12.7% 12.4% 13.0% 13.3% 12.9% 13.1% 13.3% 13.5%
By NAICS Industry 2001 2002 2003 2004 2005 2006 2007
Forestry, Fishing, and Related Activities N/A 0.2% 0.3% N/A N/A N/A 0.1% Mining 7.6% 8.4% 8.0% 7.8% 7.4% 8.2% 9.1%
Oil and gas extraction N/A 0.0% N/A N/A N/A N/A N/A Mining (except oil and gas) 7.5% 8.4% 8.0% N/A 7.2% 7.8% 8.6% Support activities for mining N/A 0.0% 0.0% 0.0% N/A N/A N/A
Construction 4.6% 4.6% 4.6% 4.8% 4.2% 4.3% 4.2% Manufacturing 7.9% 6.7% 6.3% 6.2% 6.1% 6.6% 6.6%
Petroleum and coal products N/A N/A N/A N/A N/A N/A N/A Transportation and Utilities N/A N/A N/A N/A N/A N/A N/A Wholesale Trade N/A N/A N/A N/A N/A N/A N/A Retail Trade 10.8% 10.6% 10.3% 11.2% 11.1% 11.0% 11.4%
Motor vehicle and parts dealers 2.5% 2.5% 2.5% 2.3% 2.5% 2.4% 2.5% Furniture and home furnishings stores 0.2% 0.2% N/A N/A N/A N/A 0.2% Electronics and appliance stores N/A N/A N/A 0.2% 0.2% 0.1% N/A Building material and garden supply stores 1.2% 1.1% 1.2% 1.1% 1.2% 1.2% 1.5% Food and beverage stores 2.5% 2.6% 2.5% 2.3% 2.3% 2.2% 2.2% Health and personal care stores 0.2% 0.1% 0.1% N/A N/A N/A N/A Gasoline stations 1.6% 1.5% 1.4% 1.5% 1.5% 1.5% 1.4% Clothing and clothing accessories stores 0.3% 0.3% 0.2% 0.2% 0.2% 0.2% 0.2% Sporting goods, hobby, book & music stores N/A N/A 0.2% 0.2% 0.2% 0.2% 0.2% General merchandise stores 1.2% 1.1% 1.1% 2.5% 2.1% 2.1% 2.1% Miscellaneous store retailers 0.4% 0.4% 0.4% 0.3% 0.3% 0.3% 0.3% Nonstore retailers 0.4% 0.4% 0.4% 0.4% 0.4% 0.5% 0.5%
Information 0.8% 0.8% 0.8% 0.9% 1.0% 1.0% 1.0% Financial Activity 2.2% 2.8% 2.9% 2.8% 2.9% 2.9% 2.9% Professional & Business Services 4.1% N/A N/A N/A N/A N/A 5.3% Education & Health Services N/A N/A N/A N/A N/A N/A N/A Leisure & Hospitality Services 3.3% 3.4% 3.7% 3.6% 3.6% 3.7% 3.8% Other Services 5.9% 5.3% 5.5% 5.2% 4.9% 4.6% 4.6% Government 23.6% 23.9% 24.7% 23.4% 23.5% 22.8% 22.2%
Federal, Civilian 5.3% 5.6% 5.7% 6.0% 6.1% 5.9% 5.6% Military 0.7% 0.8% 1.2% 1.2% 1.3% 1.1% 1.0% State 5.0% 5.0% 4.8% 4.9% 4.8% 4.7% 4.6% Local 12.6% 12.4% 13.0% 11.3% 11.2% 11.0% 11.1%
N/A: Data not shown to avoid disclosure of confidential information or because the data were not available.
Source: U.S. Bureau of Economic Analysis, Regional Economic Information System and Bureau of Economic and Business Research, University of Utah.

The Structure and Economic Impact of Utah’s Coal Industry
B U R E A U O F E C O N O M I C A N D B U S I N E S S R E S E A R C H 203
Although figures for the mining sector were not reported from 1995 through 2000, Figure 8.11a reveals that it began to expand in the late 1970s and was a significant source of earnings during the 1980s and early 1990s. In 1980 the sector paid $33.7 million in earnings, which was nearly 16 percent of total earnings. In the early 1990s mining earnings averaged around $22 to $23 million per year and about 10 percent of total earnings. When details are available we see that coal min-ing accounted for about 90 percent of all mining earnings. In 2007, under the NAICS classification system, state and local government was the largest source of earnings, paying $51.6 million and 15.7 percent of total earnings. Services—comprising professional and business, leisure and hospitality, and other services—paid $44.8 million and almost 14 percent of the total. Retail trade paid $37.4 million, accounting for over 11 percent of total earnings. Mining paid $30.0 million, 9 percent, of which mining (except oil and gas) was $28.3 million. This latter sector includes coal mining, but also covers metals and nonmetallic minerals. From available SIC data discussed above we know that the lion’s share of total mining earnings is from coal mining. Finally, manufacturing paid $21.7 million and almost 7 percent of total earnings. These sectors—state and local government, services, retail trade, mining, and manufacturing—together accounted for 56 percent of all earnings in 2007. Farm earnings made up less than 1 percent of the total. Using location quotients to compare the distribution of earnings by industry in Sevier County with the country as a whole reveals the importance of coal mining to the county’s economy (Ta-ble 8.25 and Figure 8.12). Its share of county earnings grew from 1.7 times the sector’s national share in 1970 to 7.6 times in 1980 to 9.8 times in 1990. It was more than 10 times the national average in 1991 through 1994. In this period data for coal mining are available and show that Sevier’s share of earnings from this activity was more than 40 times the national share. From 2001 through 2007, under the NAICS system, mining’s share of local earnings jumped from 8.4 times its national share to 10.1 times in 2002, then declined to 6.7 times in 2007. Over this same period the county’s earnings share from mining (except oil and gas) was more than 30 times the national average. Other industries with significant relative earnings concentrations include transportation and pub-lic utilities, which averaged twice the national earnings share from 1990 through 2000 (figures for 2001 through 2007 were not disclosed); various levels of government, though all were less than twice the national average; other services from 2001 through 2007; and retail trade. Within the latter sector, the local share of earnings from gas stations was about five times the average and the shares from building material and garden supply stores, food and beverage stores, and general merchandise stores were all about twice the national average.

The Structure and Economic Impact of Utah’s Coal Industry
204 B U R E A U O F E C O N O M I C A N D B U S I N E S S R E S E A R C H
Table 8.25 Sevier County Nonfarm Earnings Location Quotients by Industry, 1970–2007
By SIC Industry 1970 1980 1990 1991 1992 1993 1994 1995 1996 1997 1998 1999 2000
Agricultural Services, Forestry, Fishing 1.84 0.26 0.38 0.50 0.46 0.45 0.44 0.42 0.40 0.41 N/A N/A N/A Mining 1.71 7.62 9.81 10.92 10.70 10.50 10.60 N/A N/A N/A N/A N/A N/A
Metal mining 0.00 0.00 N/A 0.00 0.00 0.00 0.00 0.00 0.00 N/A 0.00 0.00 0.00 Coal mining N/A N/A N/A 44.06 43.80 46.10 44.03 N/A N/A N/A N/A N/A N/A Oil and gas extraction N/A N/A 0.14 N/A 0.16 0.12 N/A N/A N/A N/A N/A N/A N/A Nonmetallic minerals, except fuels N/A N/A 6.98 N/A 8.94 9.86 12.93 12.02 11.39 13.54 N/A N/A N/A
Construction 0.69 1.43 0.59 0.64 0.78 0.85 1.00 1.03 1.02 0.93 0.97 0.91 0.84 Manufacturing 0.52 0.36 0.38 0.37 0.37 0.36 0.34 0.39 0.44 0.45 0.47 0.54 0.54
Petroleum and coal products 0.00 0.31 4.50 3.79 4.07 5.93 4.88 5.03 5.53 6.88 N/A N/A N/A Transportation and Public Utilities 1.24 1.31 1.99 1.99 2.00 2.03 2.04 1.90 2.05 1.96 1.95 1.97 2.07 Wholesale Trade 0.74 0.60 0.86 0.80 0.66 0.54 0.59 0.56 0.58 0.57 0.54 0.58 0.60 Retail Trade 1.49 1.13 1.13 1.13 1.15 1.20 1.17 1.19 1.20 1.24 1.27 1.28 1.31
Building materials and garden equipment 2.16 1.63 1.01 1.07 1.11 1.08 1.16 1.23 1.36 1.25 1.46 1.54 1.62 General merchandise stores 1.18 0.78 1.03 0.91 1.15 1.19 1.07 1.14 1.11 1.19 1.28 1.29 N/A Food stores 1.18 1.05 1.31 1.47 1.48 1.47 1.48 1.43 1.45 1.48 1.66 1.72 1.77 Automotive dealers and service stations 2.65 1.73 1.84 1.84 1.87 2.20 2.16 2.19 2.10 2.21 2.01 1.98 2.13 Apparel and accessory stores 0.83 1.09 1.13 1.12 0.46 0.46 0.53 0.58 0.61 0.65 0.63 0.58 0.55 Home furniture and furnishings stores 1.42 1.12 1.01 0.73 0.66 0.63 0.48 0.43 0.67 0.80 0.65 0.50 N/A Eating and drinking places 0.93 0.90 0.85 0.87 0.97 0.93 0.90 1.01 0.96 0.92 1.03 1.09 1.15 Miscellaneous retail 1.32 1.00 0.80 0.76 0.80 0.78 0.73 0.66 0.70 0.84 0.85 0.85 0.80
Finance, Insurance, and Real Estate 0.40 0.42 0.36 0.30 0.38 0.43 0.29 0.30 0.27 0.29 0.30 0.24 0.24 Services 0.55 0.65 0.64 0.63 0.61 0.60 0.66 N/A N/A N/A 0.73 0.64 0.61 Government 1.26 1.26 1.27 1.28 1.34 1.26 1.27 1.34 1.40 1.37 1.46 1.49 1.59
Federal, Civilian 1.55 1.89 1.43 1.42 1.43 1.35 1.43 1.46 1.55 1.42 1.60 1.54 1.71 Military 0.23 0.22 0.45 0.41 0.42 0.42 0.44 0.43 0.45 0.44 0.47 0.49 0.51 State N/A 1.06 1.18 1.19 1.26 1.15 1.14 1.22 1.27 1.28 1.37 1.47 1.62 Local N/A 1.25 1.43 1.45 1.53 1.45 1.41 1.50 1.56 1.54 1.60 1.64 1.70
By NAICS Industry 2001 2002 2003 2004 2005 2006 2007 Forestry, Fishing, and Related Activities N/A 0.55 0.89 N/A N/A N/A 0.43 Mining 8.43 10.12 8.74 7.72 6.62 6.40 6.68
Oil and gas extraction N/A 0.00 N/A N/A N/A N/A N/A Mining (except oil and gas) 33.14 37.53 36.99 N/A 30.80 31.87 34.70 Support activities for mining N/A 0.00 0.00 0.00 N/A N/A N/A
Construction 0.75 0.76 0.77 0.79 0.65 0.67 0.68 Manufacturing 0.56 0.49 0.47 0.48 0.49 0.53 0.55
Petroleum and coal products N/A N/A N/A N/A N/A N/A N/A Transportation and Utilities N/A N/A N/A N/A N/A N/A N/A Wholesale Trade N/A N/A N/A N/A N/A N/A N/A Retail Trade 1.58 1.54 1.53 1.72 1.70 1.73 1.83
Motor vehicle and parts dealers 1.85 1.80 1.78 1.77 1.87 1.89 2.01 Furniture and home furnishings stores 0.58 0.54 N/A N/A N/A N/A 0.80 Electronics and appliance stores N/A N/A N/A 0.73 0.49 0.42 N/A Building material and garden supply stores 2.12 2.02 2.10 1.94 1.96 2.03 2.71 Food and beverage stores 2.33 2.43 2.41 2.23 2.30 2.31 2.32 Health and personal care stores 0.48 0.30 0.26 N/A N/A N/A N/A Gasoline stations 4.58 4.49 4.30 4.80 5.08 5.13 4.99 Clothing and clothing accessories stores 0.71 0.75 0.49 0.50 0.43 0.47 0.48 Sporting goods, hobby, book & music stores N/A N/A 0.85 0.84 0.88 1.05 1.09 General merchandise stores 1.37 1.22 1.26 2.80 2.38 2.37 2.45 Miscellaneous store retailers 0.84 0.96 0.84 0.82 0.81 0.86 0.90 Nonstore retailers 1.21 1.20 1.14 1.20 1.27 1.43 1.45
Information 0.20 0.20 0.22 0.24 0.26 0.28 0.28 Financial Activity 0.22 0.29 0.30 0.28 0.29 0.29 0.29 Professional & Business Services 0.27 N/A N/A N/A N/A N/A 0.33 Education & Health Services N/A N/A N/A N/A N/A N/A N/A Leisure & Hospitality Services 0.88 0.89 0.95 0.94 0.95 0.97 0.98 Other Services 2.03 1.76 1.83 1.76 1.66 1.62 1.59 Government 1.51 1.46 1.47 1.41 1.41 1.39 1.35
Federal, Civilian 1.77 1.78 1.82 1.88 1.93 1.89 1.79 Military 0.54 0.59 0.76 0.72 0.77 0.67 0.61 State 1.57 1.52 1.38 1.50 1.50 1.48 1.43 Local 1.54 1.46 1.51 1.32 1.31 1.31 1.31
Note: Values greater than 1.00 indicate concentrations relative to the country.
Source: U.S. Bureau of Economic Analysis, Regional Economic Information System and Bureau of Economic and Business Research, University of Utah.

The Structure and Economic Impact of Utah’s Coal Industry
B U R E A U O F E C O N O M I C A N D B U S I N E S S R E S E A R C H 205
Figure 8.12 Sevier County Basic Industries’ Location Quotients, 2001–2007
1.00
6.00
11.00
16.00
21.00
26.00
31.00
36.00
41.00
2001
2002
2003
2004
2005
2006
2007
Min
ing
LQ
s
1.00
1.20
1.40
1.60
1.80
2.00
2.20
Oth
er
LQ
s
Mining (except oil and gas) Federal Gov't. (civilian)Other Services Retail TradeState Gov't. Local Gov't.
Source: U.S. Bureau of Economic Analysis and Bureau of Economic and Business Research, University of Utah.

The Structure and Economic Impact of Utah’s Coal Industry
206 B U R E A U O F E C O N O M I C A N D B U S I N E S S R E S E A R C H
8.2.3.3 Retail Sales
Table 8.26
Sevier County Retail Sales by Category, 1978–2008 (Thousands of Constant 2008 Dollars)
Year Bu
ild
ing
&
Gard
en
Gen
era
l M
erc
han
dis
e
Fo
od
Sto
res
Mo
tor
Veh
icle
D
eale
rs
Ap
pare
l &
A
ccess
ory
Fu
rnit
ure
Eati
ng
&
Dri
nkin
g
Mis
cellan
eo
us
1978 $10,086.9 N/A $32,354.6 $38,430.0 $3,577.0 $6,255.9 $11,607.8 $10,142.4 1979 $12,150.5 N/A $37,107.5 $39,582.8 $4,687.4 $5,998.5 $10,255.3 $9,613.1 1980 $10,924.3 N/A $32,124.8 $28,084.6 $4,860.5 $4,262.2 $9,210.2 $9,332.4 1990 $8,065.7 N/A $35,119.4 $31,990.5 $2,183.4 $3,738.2 $11,602.6 $7,572.1 1991 $8,107.1 N/A $33,325.5 $27,472.2 $2,315.2 $3,113.2 $10,708.2 $7,339.8 1992 $9,044.0 N/A $33,063.0 $27,596.0 $2,493.1 $3,166.6 $11,368.3 $6,964.1 1993 $10,788.3 N/A $35,395.3 $34,417.5 $2,794.7 $3,195.0 $12,491.7 $6,933.0 1994 $11,347.0 N/A $37,447.7 $36,343.5 $3,046.2 $3,876.8 $13,222.9 $7,939.2 1995 $11,816.9 N/A $37,865.3 $38,897.8 $3,154.1 $3,337.3 $14,003.4 $7,479.6 1996 $14,208.1 N/A $39,124.7 $38,661.9 $3,162.5 $3,907.3 $13,729.5 $7,715.8 1997 $13,977.3 N/A $40,614.4 $35,353.2 $3,048.9 $3,520.6 $13,834.7 $7,551.9 1998 $14,810.8 N/A $41,209.5 $36,627.4 $2,871.4 $3,984.5 $14,496.1 $8,940.8 1999 $16,410.5 N/A $41,703.1 $37,788.7 $2,744.1 $3,777.4 $15,927.7 $9,831.2 2000 $15,364.1 N/A $40,812.7 $26,787.3 $2,703.9 $3,295.0 $15,658.5 $9,900.8 2001 $14,218.4 $25,116.9 $37,364.8 $20,612.7 $2,593.4 $2,867.7 $14,274.2 $9,717.8 2002 $14,944.8 $22,957.3 $38,034.3 $20,996.7 $2,465.1 $3,182.4 $15,196.5 $11,387.9 2003 $13,723.4 $22,494.3 $37,551.9 $23,238.8 $2,587.9 $3,632.0 $14,224.0 $11,242.9 2004 $13,540.8 $50,044.7 $29,031.0 $24,042.4 $2,504.2 $4,281.7 $14,978.4 $11,229.8 2005 $14,239.1 $53,455.9 $29,835.8 $22,099.6 $2,665.1 $6,597.1 $16,356.3 $16,236.2 2006 $15,872.0 $57,202.0 $29,551.4 $27,303.5 $2,747.3 $7,635.7 $17,372.2 $46,784.0 2007 $19,988.6 $57,562.2 $29,442.5 $32,486.4 $2,854.6 $6,985.4 $20,254.6 $32,863.1 2008 $24,399.5 $60,094.8 $27,680.9 $31,468.1 $2,588.3 $5,516.7 $19,305.2 $12,947.6
Change 141.9% –14.4% –18.1% –27.6% –11.8% 66.3% 27.7% AARC 3.0% 13.3% –0.5% –0.7% –1.1% –0.4% 1.7% 0.8%
NA: Not available; amounts for this category were not reported. The Tax Commission did not publish sales figures for Food Stores prior to 2002. In the quarterly sales data for 2001-06 there are two General Merchandise categories; the second of these generally corresponds to the Food Stores figures from the 2002-06 annual sales data. In several counties the amounts for General Merchandise sales in 1978 through 2000 matched up with the 2001-06 Food Stores sales and so have been reclassified into the latter category. Source: Utah State Tax Commission.
Table 8.27 2008 Retail Sales in Sevier County
Category Amount Share Building & Garden $24,399,547 13.3% General Merchandise $60,094,765 32.7% Food Stores $27,680,936 15.0% Motor Vehicle Dealers $31,468,067 17.1% Apparel & Accessory $2,588,347 1.4% Furniture $5,516,682 3.0% Eating & Drinking $19,305,183 10.5% Miscellaneous $12,947,590 7.0%
Total $184,001,118 100% Source: Utah State Tax Commission.

The Structure and Economic Impact of Utah’s Coal Industry
B U R E A U O F E C O N O M I C A N D B U S I N E S S R E S E A R C H 207
8.2.3.4 Residential Construction
Exhibit 8.17
Permit-Authorized New Dwelling Units and Value of Residential Construction in Sevier County, 1975–2008
Year Sin
gle
-Fam
ily H
om
es
Du
ple
xes
an
d
Tw
in H
om
es
Co
nd
om
iniu
ms
Ap
art
men
ts
(3 o
r m
ore
units)
Cab
ins
Man
ufa
ctu
red
/
Mo
bil
e H
om
es
To
tal
Valu
e
(thousa
nds
of
co
nst
ant
2008 d
olla
rs)
1975 37 2 0 0 0 0 39 $4,458.9 1980 117 0 0 34 0 25 176 $17,006.9 1990 10 0 0 0 0 0 10 $1,377.3 1991 24 0 0 0 4 5 33 $3,140.5 1992 15 0 0 0 0 8 23 $1,875.2 1993 45 0 0 0 17 11 73 $5,761.6 1994 105 0 0 6 16 23 150 $15,738.3 1995 70 12 14 0 9 44 149 $15,146.8 1996 112 6 0 32 5 78 233 $22,221.2 1997 85 6 0 0 1 44 136 $16,973.4 1998 84 4 0 0 6 67 161 $20,072.5 1999 104 2 0 30 4 42 182 $19,830.4 2000 69 6 0 20 0 24 119 $13,362.6 2001 76 6 0 0 2 15 99 $13,152.2 2002 74 10 0 36 8 24 152 $15,904.8 2003 77 2 0 0 3 15 97 $15,577.5 2004 78 8 4 3 5 17 115 $17,615.0 2005 90 2 8 0 5 15 120 $22,676.4 2006 107 6 20 0 4 15 152 $29,043.7 2007 94 2 16 4 7 10 133 $24,765.2 2008 44 4 48 0 4 19 119 $16,666.8
New Single-Family Homes and Total Residential Construction Value
0
20
40
60
80
100
120
1975
1980
1990
1991
1992
1993
1994
1995
1996
1997
1998
1999
2000
2001
2002
2003
2004
2005
2006
2007
2008
Sin
gle
-Fam
ily H
om
e P
erm
its
$0
$5
$10
$15
$20
$25
$30
$35
Valu
e(M
illio
ns
of
Const
ant
2008 D
olla
rs)
Single-Family Homes
Total Residential Value
Note: Prior to 1994, condos and other multifamily units were grouped together. Source: Bureau of Economic and Business Research, University of Utah.

The Structure and Economic Impact of Utah’s Coal Industry
208 B U R E A U O F E C O N O M I C A N D B U S I N E S S R E S E A R C H
8.2.3.5 Nonresidential Construction
Exhibit 8.18
Value of Nonresidential Construction in Sevier County, 1975–2008 (Thousands of Constant 2008 Dollars)
Year Ho
tels
& M
ote
ls
Ch
urc
hes
&
Oth
er
Reli
gio
us
Ind
ust
rial /
W
are
ho
use
/
Man
ufa
ctu
rin
g
Ho
spit
al
&
Inst
itu
tio
nal
Off
ice,
Ban
k,
Pro
fess
ion
al
Reta
il,
Merc
an
tile
, R
est
au
ran
t
Pu
blic
Bu
ild
ing
s &
P
roje
cts
Oth
er*
Ad
dit
ion
s an
d
Alt
era
tio
ns
Total 1975 $0.0 $2,355.1 $0.0 $0.0 $238.0 $71.0 $0.0 $60.5 $0.0 $2,724.7 1980 $0.0 $3,330.3 $0.0 $0.0 $2,362.6 $858.0 $26.4 $1,051.0 $485.2 $8,113.5 1990 $0.0 $918.7 $61.8 $0.0 $45.1 $33.4 $1.7 $418.4 $1,854.4 $3,333.4 1991 $719.9 $0.0 $617.5 $0.0 $0.0 $174.4 $25.6 $833.8 $140.3 $2,511.5 1992 $1.5 $3.1 $12.4 $4.6 $0.0 $13.9 $7.7 $219.5 $63.4 $326.2 1993 $37.6 $56.8 $969.0 $77.4 $0.0 $450.3 $316.8 $670.7 $684.6 $3,263.1 1994 $0.0 $0.0 $1,240.6 $26.4 $36.7 $795.8 $10,656.4 $1,760.7 $1,636.3 $16,152.9 1995 $0.0 $0.0 $17.2 $271.9 $50.1 $1,057.4 $14.3 $2,774.1 $4,132.2 $8,317.2 1996 $0.0 $0.0 $786.3 $458.5 $0.0 $385.8 $97.6 $1,192.4 $2,195.8 $5,116.4 1997 $0.0 $0.0 $0.0 $142.9 $0.0 $1,337.5 $0.0 $3,439.4 $3,809.0 $8,728.7 1998 $0.0 $0.0 $1,752.5 $1,643.3 $460.9 $390.1 $0.0 $706.0 $3,005.8 $7,958.7 1999 $780.3 $57.5 $520.2 $0.0 $651.5 $2,431.8 $51.8 $1,035.5 $2,885.4 $8,414.0 2000 $2,136.1 $313.4 $540.3 $0.0 $62.8 $0.0 $1,270.4 $418.4 $980.9 $5,722.4 2001 $0.0 $0.0 $0.0 $0.0 $0.0 $3,636.5 $0.0 $3,074.4 $2,421.2 $9,132.2 2002 $1,339.8 $3,472.5 $0.0 $0.0 $1,065.5 $0.0 $2.4 $3,077.7 $1,141.8 $10,099.6 2003 $0.0 $0.0 $0.0 $0.0 $0.0 $8,874.4 $478.7 $1,215.7 $1,669.7 $12,238.5 2004 $0.0 $0.0 $1,589.9 $0.0 $2,048.5 $1,456.7 $2,452.9 $1,288.4 $1,025.1 $9,861.4 2005 $0.0 $0.0 $1,414.6 $0.0 $792.9 $361.1 $0.0 $2,264.5 $2,208.6 $7,041.7 2006 $0.0 $0.0 $1,465.0 $305.4 $0.0 $0.0 $0.0 $2,510.0 $7,158.2 $11,438.6 2007 $5,667.3 $1,264.7 $0.0 $0.0 $243.2 $9,217.2 $1,966.4 $3,675.4 $4,663.9 $26,698.1 2008 $2,889.0 $0.0 $987.0 $1,000.0 $234.0 $556.0 $0.0 $2,571.6 $2,126.8 $10,364.4
1990–2008 Total
$13,571.5 $6,086.6 $11,974.3 $3,930.5 $5,691.3 $31,172.3 $17,342.5 $33,146.6 $43,803.3 $166,718.9
* Other includes school and educational buildings, service stations and repair garages, agricultural buildings, and structures other than buildings.
Total Value of Nonresidential Construction
$0
$5
$10
$15
$20
$25
$30
1975
1980
1990
1991
1992
1993
1994
1995
1996
1997
1998
1999
2000
2001
2002
2003
2004
2005
2006
2007
2008
Mil
lio
ns o
f C
on
sta
nt
20
08
Do
llars
Source: Bureau of Economic and Business Research, University of Utah.

The Structure and Economic Impact of Utah’s Coal Industry
B U R E A U O F E C O N O M I C A N D B U S I N E S S R E S E A R C H 209
T E C H N I C A L N O T E S A N D M E T H O D O L O G Y Industries are classified by economists according to the North American Industry Classification System (NAICS), which was developed by the Office of Management and Budget in cooperation with other federal agencies and foreign governments (Office of Management and Budget, 2002). The NAICS codes replaced the Standard Industrial Classification (SIC) Codes that had been used since the 1930s. This change was prompted by structural changes in the U.S. economy, with the services sector becoming a much larger portion of the economy and more complex than when the SIC codes were developed. In the switch, the 10 major industrial sectors under the SIC codes were replaced with 20 major sectors under the NAICS codes. Many of the industrial sec-tors under the SIC codes were split among two or more of the redefined sectors under the NAICS codes, making comparisons difficult. The NAICS codes better explain the structure of the current economy but make time series data difficult to compile. Under the NAICS system, companies are classified under 20 major industrial categories which are further subdivided as needed. Coal mining in Utah is covered by NAICS 212112 Bituminous Coal Underground Mining while the state’s coal-fired power plants are classified under NAICS 221112 Fossil Fuel Electric Power Generation. Other local businesses and industries benefit from coal production and coal-fired power plant operation. Additional benefits accrue to local retailers and service providers as a result of spend-ing by workers. These types of effects are referred to as the indirect and induced impacts. The indirect and induced impacts can be calculated from the value of transactions between the par-ticular industry (mining or power generation) and these other businesses using input-output eco-nomic models. 9.1 NAICS Codes for Coal Production and Coal-Fired Power Plants
For this study, we used the following NAICS classifications for the coal production industry and coal-fired power plants. The definitions listed are those developed by the Office of Management and Budget. 212112 B I T U M I N O U S C O A L U N D E R G R O U N D M I N I N G This industry comprises estab-lishments primarily engaged in one or more of the following: (1) underground mining of bitumi-nous coal; (2) developing bituminous coal underground mine sites; and (3) underground mining and beneficiating of bituminous coal (e.g., cleaning, washing, screening, and sizing coal). 221112 F O S S I L F U E L E L E C T R I C P O W E R G E N E R A T I O N This industry comprises es-tablishments primarily engaged in operating fossil fuel–powered electric power generation facili-ties. These facilities use fossil fuels, such as coal, oil, or gas, in internal combustion or combustion turbine conventional steam process to produce electric energy. The electric energy produced in these establishments is provided to electric power transmission systems or to elec-tric power distribution systems.
9

The Structure and Economic Impact of Utah’s Coal Industry
210 B U R E A U O F E C O N O M I C A N D B U S I N E S S R E S E A R C H
9.2 Economic Impacts
Regional exports provide external sources of income and are widely recognized as the engines of economic development and growth. These export base (or basic) industries can potentially lead to the development of backward-linked industries that provide necessary inputs and services to the primary export producer. Forward-linked industries produce additional value-added to the exports before the products are sold outside the region. These backward- and forward-linked industries create more jobs in the regional economy that are directly connected to the export industry. This amounts to an increase in the export base of the region. If the export industries purchase equipment, material, labor, or other inputs from outside the region, this is a leakage and reduces the economic impact of the industry on the host region. Other businesses within the region provide the local population with consumer goods and ser-vices. These are referred to as nonbasic or residentiary sectors. Although these activities do not generate income from the outside world, they do keep some of the income earned through ex-ports within the community to create new jobs and contribute to the multiplier effect. Otherwise the residents of the area must import their consumer goods, which results in a leakage of spend-ing from the regional economy and a very small multiplier. Most products consumed by resi-dents of isolated rural areas must be imported from outside the region even though a local retailer may serve as the middleman. Large, economically integrated metropolitan areas produce a much larger share of the goods and services purchased by households in the region. Conse-quently, these urban regions have much larger income, expenditure, and employment multipliers than do small, isolated communities. As regions develop, the growth of the nonbasic sector is known as import substitution. The larger the geographic region, the greater the multiplier. Various models have been built to evaluate regional economic impacts. These are built using his-torical data from the areas that are modeled. Economic impacts depend upon the structure of the local economy and the specific employment and spending patterns associated with the ex-port base activity. The most accurate impact estimates are possible when the producers provide actual in-region spending patterns (including labor and purchases from in-region firms). This requires firms to commit internal resources (extraction and summary of accounting records) and also a willingness to “open their books” to the analysts. Coal producers were contacted for this study, but none was willing to provide data. Models like REMI can also simulate industry im-pacts when primary data are not available. Production and employment levels serve as inputs and the model generates local impacts. In this study, economic impact is used to mean the impact of coal mining activities or coal-fired power plant operation on the amount of employment and wages paid in the various producing counties in Utah. Many similar studies present the total economic output of an activity as the economic impact; this is the sum of all transactions in a supply chain and can be much larger than the value of the final good or service provided to the end consumer. Similarly, many au-thors apply economic output multipliers to all spending related to an activity, with no distinction between export-based and residentiary spending. The result is often termed “economic contribu-tion” and presented as economic impact. As with all economic output calculations, the result is much larger than the value of the final product delivered to an end consumer. The coal mining industry and coal-fired power plants have a direct impact on the local economy through employment and wages paid. In addition, there are indirect and induced impacts. Indi-

The Structure and Economic Impact of Utah’s Coal Industry
B U R E A U O F E C O N O M I C A N D B U S I N E S S R E S E A R C H 211
rect impacts result from local spending by the industries for goods and services, and induced impacts arise from employees of the mining and power industries spending their earnings. In-duced benefits accrue to local retailers and service providers as a result of spending by workers. The indirect and induced impacts can be calculated from the value of transactions between the coal mining industry and these other businesses. 9.2.1 REMI
The economic and demographic impacts of coal production and of power plant employment for 2007 and for projections from 2008 through 2030 have been evaluated here using the REMI 29-region, 23-sector model built for Utah. The REMI model is a dynamic, multi-regional simulation model that forecasts economic, population, and labor market impacts for many years into the future. Although REMI has many complex, interrelated submodels and features, the essential logic of the REMI model derives from the cohort component, economic base, and input-output submodels. The REMI model connects these submodels through labor, capital, financial, and product markets. It simulates the size and composition of the population and economy over time. If there is an increase in the production of an export base industry in the region, the re-gional employment and income increase as well. There may not be adequate workers to meet this increased demand for labor, and net in-migration to the region could result. Economic mi-grants tend to be young, bringing children with them and having additional children once they become established. This increasing population adds to the local demand for housing, consumer goods and services, public schools, and so forth. Over time, as this population ages, the children of the original migrants enter the labor force and form households of their own. The end result of an increase in regional export base industries is a larger and younger population, larger labor force, and higher levels of income and spending. The magnitude of these changes and other non-modeled costs and consequences depend on the specific situation and sequence of events. 9.3 Fiscal Impacts
State income tax impacts were estimated by calculating the ratio of each county’s Utah income tax liability to the county’s total earnings by place of work as determined by the Bureau of Eco-nomic Analysis. The average of this ratio for the years 2004 through 2006 was then applied to the 2007 total earnings impacts (direct, indirect, and induced) due to coal production in each county and to coal-fired power plant operations to estimate the state personal income taxes paid. Other state fiscal impacts were derived by multiplying the total earnings impacts in each region by the ratio of state sales and gross receipts taxes and other taxes78 to total earnings by place of work in 2007. Tax data were from the Census Bureau’s 2007 Survey of State Government Finances. Local sales tax revenues were estimated by calculating the ratio of 2007 selected county sales tax revenues (general sales and use taxes and the restaurant tax), as reported by counties to the state auditor, to BEA earnings by place of work in 2007. This was then applied to the total direct, in-direct, and induced earnings from coal production and coal-fired power plants to derive an esti-mate of local sales tax revenues generated from these industries’ impacts.
78 Other taxes includes death and gift taxes, documentary and stock transfer taxes, and severance taxes.

The Structure and Economic Impact of Utah’s Coal Industry
212 B U R E A U O F E C O N O M I C A N D B U S I N E S S R E S E A R C H
9.4 Projected Impact Scenarios
The Utah Geological Survey (UGS) prepared a set of coal projection scenarios to be used in this study: Low, Middle, and High production. In all three scenarios, the UGS assumes that there is a continued depletion at existing mines. In the Low Scenario, new mines have difficulty with per-mitting, and demand declines due to the development of affordable alternative fuels and in-creased greenhouse gas regulation. Growth is further restricted in this scenario as export markets do not develop. In the Middle Scenario, new mines are permitted and begin to produce coal, but demand growth is slow as older electric generation plants are shut down and not replaced. The High Scenario also assumes the development of new reserves, but, in addition, increasing de-mand. This increase in demand is from three sources: 1) successful carbon-capture technology and, in consequence, new power plants; 2) successful implementation of coal-to-liquids and coal-to-gas plants; and 3) increasing exports to the Pacific Rim. The physical quantity of coal production is converted to dollar values using the price projections of the Energy Information Administration for Rocky Mountain low-sulfur bituminous coal. These are given in constant 2007 dollars, which were then converted to 2008 dollars. The fiscal impacts of the projection scenarios assume constant taxes-to-earnings ratios for the counties and the state. In addition, the projected statewide local fiscal impacts assume a constant average local tax share of earnings of 0.4 percent, which was the average share across the three coal counties for 2003 through 2007.
