structure and dynamics of aqueous 2-propanol: a … d /d,,
TRANSCRIPT

Structure and dynamics of aqueous 2-propanol: A THz-TDS, NMRand neutron diffraction study
McGregor, J., Li, R., Zeitler, J. A., D'Agostino, C., Collins, J. H. P., Mantle, M. D., ... Gladden, L. F. (2015).Structure and dynamics of aqueous 2-propanol: A THz-TDS, NMR and neutron diffraction study. PhysicalChemistry Chemical Physics , 17(45), 30481-30491. DOI: 10.1039/c5cp01132a
Published in: Physical Chemistry Chemical Physics
Document Version:Publisher's PDF, also known as Version of record
Queen's University Belfast - Research Portal:Link to publication record in Queen's University Belfast Research Portal
Publisher rights© The AuthorsThis is an open access article published under a Creative Commons Attribution License (https://creativecommons.org/licenses/by/3.0/),which permits unrestricted use, distribution and reproduction in any medium, provided the author and source are cited.
General rightsCopyright for the publications made accessible via the Queen's University Belfast Research Portal is retained by the author(s) and / or othercopyright owners and it is a condition of accessing these publications that users recognise and abide by the legal requirements associatedwith these rights.
Take down policyThe Research Portal is Queen's institutional repository that provides access to Queen's research output. Every effort has been made toensure that content in the Research Portal does not infringe any person's rights, or applicable UK laws. If you discover content in theResearch Portal that you believe breaches copyright or violates any law, please contact [email protected].
Download date:28. May. 2018
This journal is© the Owner Societies 2015 Phys. Chem. Chem. Phys., 2015, 17, 30481--30491 | 30481
Cite this:Phys.Chem.Chem.Phys.,
2015, 17, 30481
Structure and dynamics of aqueous 2-propanol:a THz-TDS, NMR and neutron diffraction study†
James McGregor,‡*a Ruoyu Li,a J. Axel Zeitler,a Carmine D’Agostino,a
James H. P. Collins,a Mick D. Mantle,a Haresh Manyar,b John D. Holbrey,b
Marta Falkowska,b Tristan G. A. Youngs,§c Christopher Hardacre,b E. Hugh Stittd
and Lynn F. Gladdena
Aqueous liquid mixtures, in particular, those involving amphiphilic species, play an important role in
many physical, chemical and biological processes. Of particular interest are alcohol/water mixtures;
however, the structural dynamics of such systems are still not fully understood. Herein, a combination of
terahertz time-domain spectroscopy (THz-TDS) and NMR relaxation time analysis has been applied to
investigate 2-propanol/water mixtures across the entire composition range; while neutron diffraction
studies have been carried out at two specific concentrations. Excellent agreement is seen between
the techniques with a maximum in both the relative absorption coefficient and the activation energy
to molecular motion occurring at B90 mol% H2O. Furthermore, this is the same value at which well-
established excess thermodynamic functions exhibit a maximum/minimum. Additionally, both neutron
diffraction and THz-TDS have been used to provide estimates of the size of the hydration shell around
2-propanol in solution. Both methods determine that between 4 and 5 H2O molecules per 2-propanol
are found in the 2-propanol/water clusters at 90 mol% H2O. Based on the acquired data, a description
of the structure of 2-propanol/water across the composition range is presented.
1. Introduction
Aqueous solutions of alcohols have provided a rich seam forscientific research for many years. Such binary mixtures areubiquitous in many fields, including fuel cell technology andbioscience.1–4 In the latter field, alcohols also serve as modelcompounds for more complex amphiphiles such as proteins,with the influence of the solute on the structure of water beingof significant interest. Elsewhere, alcohol/water mixtures areemployed as solvents for chemical processes, including catalyticreactions, with 2-propanol/water systems of particular interest.
A parallel and complementary work specifically explores the roleof aqueous 2-propanol as a solvent in the heterogeneous catalytichydrogenation of 2-butanone.5 In the present contribution wereport an investigation of the structure and dynamics of 2-propanol/water mixtures, with the aim of contributing to a better under-standing of the molecular-scale processes occurring in suchsystems. To this end we have employed nuclear magneticresonance (NMR) spectroscopy, neutron scattering combinedwith empirical potential structure refinement (EPSR) analysisand terahertz time-domain spectroscopy (THz-TDS). THz-TDSallows access to the fast (ps and sub-ps) processes which takeplace within aqueous mixtures. The methodology presented isrelevant to a wide range of liquid systems.
1.1 Background
It is well established that upon mixing, aqueous alcohol solutionsdisplay anomalous transport and thermodynamic behaviour,such as a less than expected increase in entropy. Excess functionsare also observed for other thermodynamic properties: freeenergy and enthalpy. For 2-propanol/water mixtures at 303 K amaximum negative excess enthalpy is observed at B90 mol%H2O.6 The observed maxima in the thermodynamic functions areco-incidental with maxima and minima in the physical propertiesof such mixtures. For instance, the viscosity of alcohol/watermixtures achieves a maximum,7,8 with a corresponding minimum
a Department of Chemical Engineering and Biotechnology, University of Cambridge,
Cambridge CB2 3RA, UK. E-mail: [email protected] School of Chemistry and Chemical Engineering, Queen’s University Belfast,
Belfast BT9 5AG, UKc School of Mathematics and Physics, Queen’s University Belfast, Belfast BT9 5AG,
UKd Johnson Matthey Catalysts, P.O. Box 1, Belasis Avenue, Billingham,
Cleveland TS23 1LB, UK
† Electronic supplementary information (ESI) available. See DOI: 10.1039/c5cp01132a‡ Present address: Department of Chemical and Biological Engineering Universityof Sheffield, Sheffield S1 3JD, UK.§ Present address: ISIS Neutron and Muon Source, Science and TechnologyFacilities Council, Rutherford Appleton Laboratory, Harwell Oxford, DidcotOX11 0QX, UK.
Received 18th May 2015,Accepted 22nd October 2015
DOI: 10.1039/c5cp01132a
www.rsc.org/pccp
PCCP
PAPER
Ope
n A
cces
s A
rtic
le. P
ublis
hed
on 2
3 O
ctob
er 2
015.
Dow
nloa
ded
on 1
6/12
/201
5 17
:49:
14.
Thi
s ar
ticle
is li
cens
ed u
nder
a C
reat
ive
Com
mon
s A
ttrib
utio
n 3.
0 U
npor
ted
Lic
ence
.
View Article OnlineView Journal | View Issue
30482 | Phys. Chem. Chem. Phys., 2015, 17, 30481--30491 This journal is© the Owner Societies 2015
for the diffusion coefficient.9 Despite the apparent simplicity ofalcohol/water systems there has been much debate as to thephysical basis of these effects.10 However, a consensus has nowemerged supporting the view that it is the hydrogen bond (HB)dynamics, and, therefore, the dynamical structure of the solutions,that are the origin of these phenomena.10–15
The earliest analyses, including the seminal work by Frankand Evans,16 proposed that the origin of the anomalous effectsobserved upon mixing alcohols and water was a consequence ofthe water structure becoming ‘‘enhanced’’, or more ‘‘ice-like’’in the presence of a hydrophobic entity such as the alkyl groupof an alcohol. Neutron diffraction studies, however, havedemonstrated that there is no need to invoke such an ‘‘icebergtheory’’. Instead, taking methanol/water mixtures as a repre-sentative example, the excess thermodynamic properties may beexplained as arising from incomplete mixing on the molecularlevel.12,17 Dougan and co-workers have demonstrated that aroundthe composition where excess thermodynamic properties are attheir maxima, methanol and water form separate, bi-percolatingliquid-networks.18 Furthermore, from simulations based onexperimental neutron diffraction data it has been demonstratedthat the excess entropy associated with water/methanol mixtures,and the dependence of this on composition, can be quantitativelyexplained through this segregation of methanol and water at themolecular level.19 The lifetime of the methanol and water clustersformed is on average 3 ps, indicating that the origin of theseeffects is indeed dynamical. Recently, Artola et al., have applieda range of techniques including neutron diffraction and NMRto water/2-methyl-2-propanol mixtures, identifying hydrogenbonding as the driving force behind the observed mesoscopicstructural organisation.20 Elsewhere Juurinen and co-workershave employed X-ray Raman scattering to interrogate water/alcohol mixtures for a range of short-chained alcohols.21
1.2 THz-TDS studies
THz-TDS is ideally suited to the study of HB dynamics as suchprocesses occur on the picosecond timescale. Such short time-scales are readily probed by THz-TDS. Aqueous solutions ofmethanol, acetone and acetonitrile have previously been studiedusing THz spectroscopy by Venables et al.11,22 The non-ideality ofsuch solutions was readily apparent from the acquired terahertzspectroscopy data, with an enhancement in structure observedrelative to the individual components. Additionally, the dynamicalHB breaking/forming processes occurring on ps timescales werequantitatively identified. Such systems bear a close resemblanceto the 2-propanol/water mixtures studied in the present work.More recently we have applied THz-THS to the study of meso-scopic structuring in aqueous solutions of primary alcohols.15
This work identified critical compositions corresponding tochanges in the hydrogen-bonding structure of the mixtures.Considering proton transfer in aqueous solutions, Tielrooij et al.have employed THz-TDS to demonstrate that a large number ofwater molecules are involved in such processes, thereby indicatingthat such a mechanism is likely to be limited to situations where alarge excess of water molecules is present.23 Elsewhere, aqueous
solutions of biologically relevant molecules, and in particular theirhydration, has been the subject of study.4,24–29
1.3 NMR studies
NMR measurements, like terahertz spectroscopy, have alsopreviously been employed to study aqueous solutions of alcohols.Corsaro and co-workers performed 1H NMR experiments in whichthe spin–lattice (T1) and spin–spin (T2) relaxation times weremeasured for methanol/water mixtures.1 These measurementssupported the conclusion that the thermodynamic propertiesof these mixtures are governed by HB dynamics, with thelifetime and stability of HBs being dependent upon the liquidcomposition. Additionally, the results were consistent withthe presence of local clusters at temperatures above 245 K.Elsewhere, an analysis of the rotational correlation time ofwater molecules around benzene based on T1 measurementshas demonstrated that rotational dynamics are correlated withHB strength. Water molecules in the hydration shell of benzenewere concluded to form stronger HBs and to have slower corre-lation times than those in the bulk water phase.30 Measurementsof diffusion times using PFG NMR related these results totranslation motions. PFG NMR has also been applied alongsideTHz-TDS to measure diffusion coefficients in binary primaryalcohol/water systems correlating a minimum in the measureddiffusivity with the formation of extended alcohol–waternetworks.15
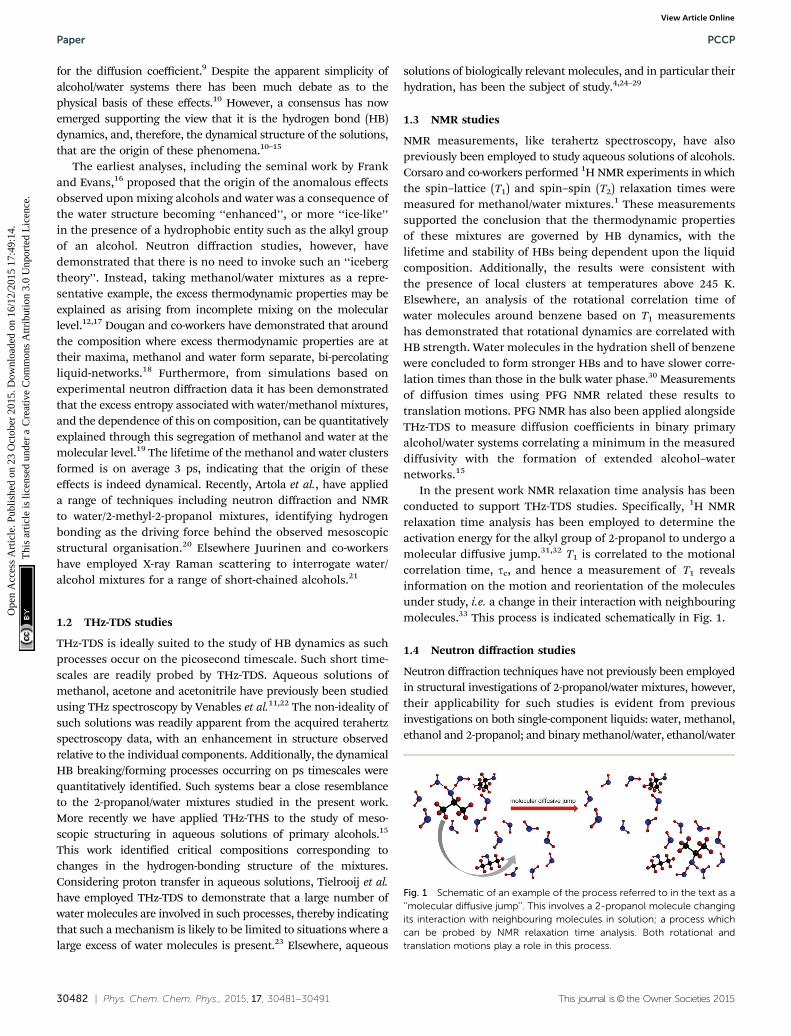
In the present work NMR relaxation time analysis has beenconducted to support THz-TDS studies. Specifically, 1H NMRrelaxation time analysis has been employed to determine theactivation energy for the alkyl group of 2-propanol to undergo amolecular diffusive jump.31,32 T1 is correlated to the motionalcorrelation time, tc, and hence a measurement of T1 revealsinformation on the motion and reorientation of the moleculesunder study, i.e. a change in their interaction with neighbouringmolecules.33 This process is indicated schematically in Fig. 1.
1.4 Neutron diffraction studies
Neutron diffraction techniques have not previously been employedin structural investigations of 2-propanol/water mixtures, however,their applicability for such studies is evident from previousinvestigations on both single-component liquids: water, methanol,ethanol and 2-propanol; and binary methanol/water, ethanol/water
Fig. 1 Schematic of an example of the process referred to in the text as a‘‘molecular diffusive jump’’. This involves a 2-propanol molecule changingits interaction with neighbouring molecules in solution; a process whichcan be probed by NMR relaxation time analysis. Both rotational andtranslation motions play a role in this process.
Paper PCCP
Ope
n A
cces
s A
rtic
le. P
ublis
hed
on 2
3 O
ctob
er 2
015.
Dow
nloa
ded
on 1
6/12
/201
5 17
:49:
14.
Thi
s ar
ticle
is li
cens
ed u
nder
a C
reat
ive
Com
mon
s A
ttrib
utio
n 3.
0 U
npor
ted
Lic
ence
.View Article Online
This journal is© the Owner Societies 2015 Phys. Chem. Chem. Phys., 2015, 17, 30481--30491 | 30483
and 2-methyl-2-propanol/water mixtures.20,34–37 Misawa et al. havestudied 1-propanol/water mixtures using SANS in the low Q regioncombined with large-scale reverse Monte Carlo (RMC) analysis ofthe data and describe the mesoscale structure of the liquids interms of polydispersed water and alcohol clusters in which most ofthe molecules reside at interfaces between the clusters; however,no direct atomistic information can be extracted from these data.38
Tanaka et al. performed a neutron diffraction study of deuteratedmethanol and determined the geometry of molecules within theliquid.34 O–D, C–O and C–D bond lengths of 0.990 � 0.010,1.435 � 0.005 and 1.085 � 0.005 Å, respectively, were established.Zetterstrom et al. investigated the structure of 2-propanol byneutron diffraction35 and the bond lengths obtained were foundto be in good agreement with those reported for methanol andethanol.36 More recently, Takamuku and co-workers combinedX-ray and neutron scattering studies to investigate the structure ofmethanol, methanol/water and ethanol/water mixtures.37 For thealcohol/water mixtures, the tetrahedral-like structure of water waspredominant at Z90 mol% H2O, whilst water and alcohol clusterscoexist in the mixtures from B90–B30 mol% H2O. Below 30 mol%H2O alcohol clusters are predominant. Dixit and co-workers havestudied methanol/water mixtures using neutron diffraction andshowed that most of the water molecules exist as small hydrogenbonded clusters surrounded by close-packed methyl groups, withwater clusters bridging neighbouring methanol hydroxyl groupsthrough hydrogen bonding.17 Investigating more hydrophobicalcohols, Bowron and co-workers have shown how addition of evensmall quantities of water perturbs the liquid structure of tertiarybutanol through preferential hydrogen-bonding of the alcoholOH-group to water.39–41
2. Experimental
THz-TD and NMR spectroscopy measurements have been con-ducted across the entire 2-propanol/water composition range,while small angle neutron scattering data have been collectedon sets of H/D isotopically substituted 2-propanol/water mixturesat two representative compositions of 70 and 90 mol% H2O.
2.1 THz time-domain spectroscopy
2.1.1 Apparatus. Sub-picosecond coherent pulses of broad-band terahertz radiation (0.1 to 4 THz) were generated byphotoexcitation of a DC biased semi-insulating GaAs substrateby 12 fs pulses of a NIR laser (Femtolasers, Femtosource cM1,Vienna, Austria, centre wavelength 800 nm), as describedpreviously.43 In order to suppress the absorption of watervapour in the air, the sealed sample chamber was purged withnitrogen gas to ensure a relative humidity below 2% for allmeasurements. Liquid samples were measured in a standardcell (PIKE Technologies, Watertown, USA) comprising 3 mmz-cut quartz windows and a 200 mm PTFE spacer. For eachsample 200 time-domain waveforms were collected and averaged.The temperature was held constant at 303 � 1 K.
2.1.2 Analysis of dielectric relaxation. The dielectric spectraof 2-propanol/water mixtures have been fitted according to a
previously described15 three-component Debye model. Thisthree-component model is described by eqn (1):
eDebye ¼ e1 þe1
1þ iot1þ e21þ iot2
þ e31þ iot3
; (1)
where o denotes the angular frequency and eN is the opticaldielectric constant; ei and ti are the relaxation strength anddielectric relaxation time of the ith Debye relaxation component.
As described in our earlier work (conducted at 293 K asopposed to at 303 K in the present study),15 in our analysis, t1
and t2 were constrained to the values of the relaxation times ofpure water and pure 2-propanol; these values were determinedto be 7.6 and 26.6 ps, respectively, at 303 K. The relaxationstrengths e1 and e2 are then assumed to represent the relativenumber of molecules present within the respective structuraldomains. As discussed by Li et al.,15 whilst the interpretation ofe1 is as a measure of the number of water molecules present, e2
is taken to represent both the bulk alcohol and alcohol–watermixtures. e3 and t3 are associated with the femtosecond relaxa-tion component which has been considered to be associatedwith the fast process of hydrogen bond formation and decom-position.11,22 The relaxation strength of the femtosecond termis extremely small and, therefore, discussion is focussed onlyon the two picosecond terms. It should be noted that threemodes have previously been identified in the dielectric relaxationspectrum of pure 2-propanol,14,44 and that some previous workhas employed two-component models to analyse aqueoussolutions.11,22 It is, therefore, important to note that the aimof this work is not to determine absolute relaxation times (t),but to use this parameter to separate the spectral response intodistinct domains with different physical properties characterisedby their relaxation strength (e). Further details of this approachare provided by Li et al.15
2.2 NMR relaxation time analysis
The activation energy to a molecular reorientation, or diffusivejump,32,45 has been evaluated in this work by conductingmeasurements of T1 at a series of temperatures, followed bythe application of an Arrhenius-type expression:
1
T1¼ exp
Ea
RT
� �(2)
where Ea is the activation energy towards a molecular diffusivejump, R is the ideal gas constant and T is temperature. Thesemeasurements have focussed on the alkyl group of 2-propanol.Relatively little data, in comparison to that concerned with –OHmoieties, have been published focusing on the behaviour of thealkyl group despite the role that this plays in determining liquidstructure.46 The alkyl functionality is particularly attractive forNMR studies as it allows for ready discrimination between waterand 2-propanol and does not suffer from problems associatedwith 1H-exchange between the two components. Elsewhere, thismethodology has been applied to probe adsorbate–adsorbentinteractions.32 In that work, the strength of interaction betweenadsorbate and adsorbent was described by the difference between
PCCP Paper
Ope
n A
cces
s A
rtic
le. P
ublis
hed
on 2
3 O
ctob
er 2
015.
Dow
nloa
ded
on 1
6/12
/201
5 17
:49:
14.
Thi
s ar
ticle
is li
cens
ed u
nder
a C
reat
ive
Com
mon
s A
ttrib
utio
n 3.
0 U
npor
ted
Lic
ence
.View Article Online

30484 | Phys. Chem. Chem. Phys., 2015, 17, 30481--30491 This journal is© the Owner Societies 2015
the activation energies for molecular diffusive jumps in the liquidphase and for molecular motion on the adsorbent surface.
Measurements of T1 between 298–343 K were carried-out asfollows: NMR measurements were conducted using a Diff30diffusion probe with a 10 mm r.f. coil on a Bruker DMX 300spectrometer, operating at a 1H resonance frequency of300.13 MHz. After heating to the desired temperature, 20 minwas allowed prior to measurement to ensure thermal equili-brium. Temperature stability was �1 K. T1 was measured usinga standard inversion-recovery pulse sequence.47 The 901 and1801 pulse lengths were 10 � 1 ms and 20 � 2 ms, respectively.The precise pulse lengths vary with temperature and chemicalsystem under study, hence the exact 901 and 1801 pulse lengthswere calibrated for each sample at each temperature studied.
2.3 Neutron diffraction
Neutron-scattering data were collected using SANDALS at theISIS pulsed neutron and muon source at the Rutherford AppletonLaboratory, UK. The instrument has a wavelength range of 0.05 to4.5 Å, and data were collected over a Q range of 0.1 to 50 Å�1.Each sample was contained in ‘‘null scattering’’ Ti0.68Zr0.32 flatplate cells with internal geometries of 1 � 35 � 35 mm, with awall thickness of 1 mm. During measurements, the samples weremaintained at a temperature of 298 K using a recirculating JulaboFP50 water bath. Measurements were made on each of the emptysample holders, the empty spectrometer, and a 3.1 mm thickvanadium standard sample for the purposes of data normalisation.
Data were collected from five isotopically-substituted 2-propanol/water mixtures (2-propanol/D2O, 2-propanol-d8/H2O, 2-propanol-d8/D2O, 2-propanol-d6/D2O, 2-propanol/H2O) at 70 and 90 mol%water, and five neat 2-propanol samples (2-propanol-d8,2-propanol-d6, 2-propanol, and 2-propanol-d8/2-propanol in2 : 1 and 1 : 2 ratios).
Data analysis was performed using GUDRUN,48,49 to producea differential scattering cross section for each sample. Theexperimental sample densities and scattering levels were con-sistent with the actual isotopic compositions of the samples.Analysis of the data proceeded via refinement of atomisticmodels of the target systems using EPSR,50–52 and all quantitieswere calculated using either EPSR or dlputils.53 This refinementconsists of a Monte Carlo simulation using Lennard-Jonespotentials with atom-centred point charges comparing the residualsfrom the simulated data with experimental values in Q-space. Thesimulating process combines these data with basic informationabout the structure of the compounds and total atomic densitiesof the system to constrain the simulation in a chemically andphysically reliable manner. The experimental total structure factors,F(Q), were measured for each of the five isotopically distinct samplesat each composition.
The EPSR refinements were initialised using equilibratedMonte Carlo simulations at 298 K containing 500 molecules ina cubic box of sides 39.97, 27.11, and 30.58 Šfor the neat2-propanol, 90 and 70 mol% systems, respectively. These corre-spond to atomic densities of 0.0940, 0.0979, and 0.0997 atoms �3,derived from the experimentally determined molecular densitiesof the fully protiated liquids. Atom types and parameters for the
reference potential used in EPSR were taken from the OPLS-AA54
and SPC/E55 force fields (see ESI,† Table S1).
3. Results3.1 THz-TDS
The absorption coefficients, a, of 2-propanol/water mixtures werecalculated according to the Beer–Lambert law. At all concentra-tions a monotonic increase in a with frequency is observed. Thevariation in a with composition provides a measurement of thestructural differences between solutions on the molecular level.Fig. 2 shows how a, determined at a frequency of 1 THz, changeswith composition. Data at other frequencies also show the sametrend. It is clear that a rapid increase in a is observed for waterconcentrations in excess of B90 mol% H2O.
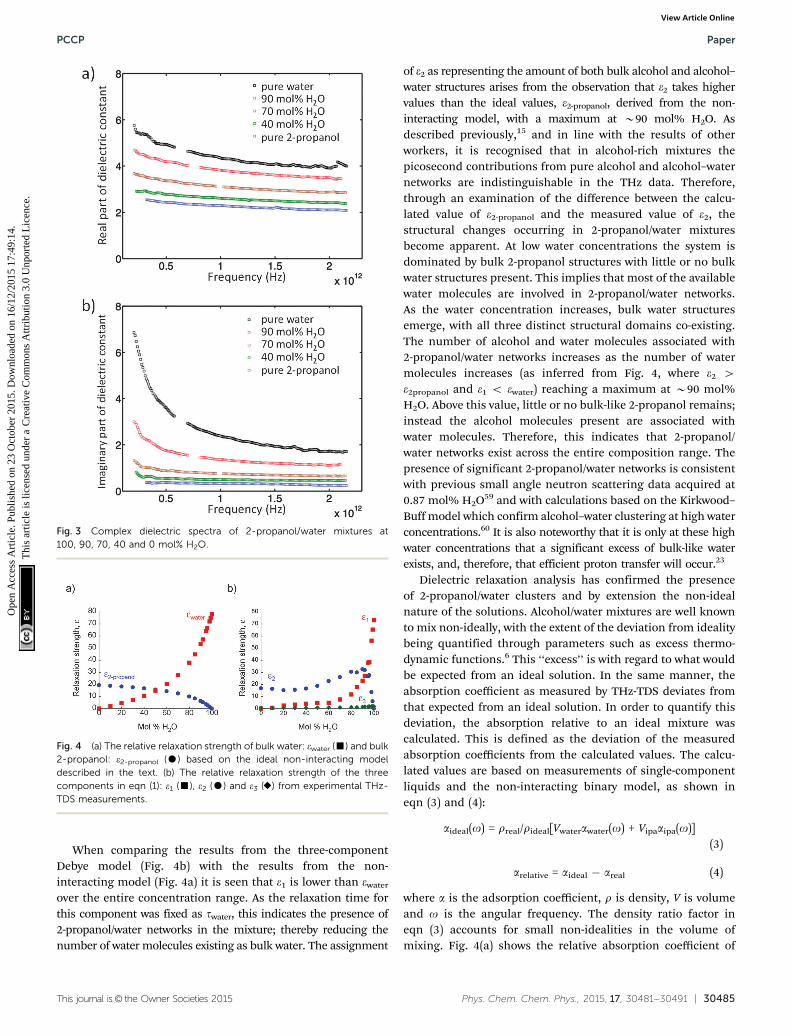
The concentration dependence of the complex dielectricspectra determined in the THz region are shown in Fig. 3.Dielectric relaxation analysis of the THz spectroscopy data hasbeen carried out in order to differentiate between the differentstructural domains present in the mixtures. Fig. 4(a) shows thetheoretical variation of relaxation strength (e) with compositionif the only domains present were bulk water and bulk2-propanol structures, i.e. the ideal case in which no interactionsbetween alcohol and water molecules and consequently no2-propanol/water networks exist. Fig. 4(b) shows the data derivedfrom the experimental system. While the relaxation times ofcomponents 1 and 2 were fixed to the experimentally derivedvalues of twater = 7.6 ps and t2-propanol = 26.6 ps, respectively, thethird component was a free variable and was determined to havea characteristic relaxation time (t) of the order of femtoseconds,ranging from a minimal value of 107 fs (pure water) to amaximum of 161 fs (15 mol% H2O), as shown in Table S2 (ESI†).Table S2 (ESI†) indicates the dielectric relaxation parametersobtained through fitting the model. This approach follows themethodology introduced by Li et al. and further details can befound therein.15 This fs term can be assigned to the fast smallrotations and translations of individual molecules or small,highly local structures.56–58 Due to the small relative relaxationstrength of e3 as compared to e1 and e2, the number of moleculeswith this relative relaxation strength is treated as negligible inthe following discussions.15,57
Fig. 2 Absorption coefficient of 2-propanol/water mixtures at 1 THz.
Paper PCCP
Ope
n A
cces
s A
rtic
le. P
ublis
hed
on 2
3 O
ctob
er 2
015.
Dow
nloa
ded
on 1
6/12
/201
5 17
:49:
14.
Thi
s ar
ticle
is li
cens
ed u
nder
a C
reat
ive
Com
mon
s A
ttrib
utio
n 3.
0 U
npor
ted
Lic
ence
.View Article Online
This journal is© the Owner Societies 2015 Phys. Chem. Chem. Phys., 2015, 17, 30481--30491 | 30485
When comparing the results from the three-componentDebye model (Fig. 4b) with the results from the non-interacting model (Fig. 4a) it is seen that e1 is lower than ewater
over the entire concentration range. As the relaxation time forthis component was fixed as twater, this indicates the presence of2-propanol/water networks in the mixture; thereby reducing thenumber of water molecules existing as bulk water. The assignment
of e2 as representing the amount of both bulk alcohol and alcohol–water structures arises from the observation that e2 takes highervalues than the ideal values, e2-propanol, derived from the non-interacting model, with a maximum at B90 mol% H2O. Asdescribed previously,15 and in line with the results of otherworkers, it is recognised that in alcohol-rich mixtures thepicosecond contributions from pure alcohol and alcohol–waternetworks are indistinguishable in the THz data. Therefore,through an examination of the difference between the calcu-lated value of e2-propanol and the measured value of e2, thestructural changes occurring in 2-propanol/water mixturesbecome apparent. At low water concentrations the system isdominated by bulk 2-propanol structures with little or no bulkwater structures present. This implies that most of the availablewater molecules are involved in 2-propanol/water networks.As the water concentration increases, bulk water structuresemerge, with all three distinct structural domains co-existing.The number of alcohol and water molecules associated with2-propanol/water networks increases as the number of watermolecules increases (as inferred from Fig. 4, where e2 4e2propanol and e1 o ewater) reaching a maximum at B90 mol%H2O. Above this value, little or no bulk-like 2-propanol remains;instead the alcohol molecules present are associated withwater molecules. Therefore, this indicates that 2-propanol/water networks exist across the entire composition range. Thepresence of significant 2-propanol/water networks is consistentwith previous small angle neutron scattering data acquired at0.87 mol% H2O59 and with calculations based on the Kirkwood–Buff model which confirm alcohol–water clustering at high waterconcentrations.60 It is also noteworthy that it is only at these highwater concentrations that a significant excess of bulk-like waterexists, and, therefore, that efficient proton transfer will occur.23
Dielectric relaxation analysis has confirmed the presenceof 2-propanol/water clusters and by extension the non-idealnature of the solutions. Alcohol/water mixtures are well knownto mix non-ideally, with the extent of the deviation from idealitybeing quantified through parameters such as excess thermo-dynamic functions.6 This ‘‘excess’’ is with regard to what wouldbe expected from an ideal solution. In the same manner, theabsorption coefficient as measured by THz-TDS deviates fromthat expected from an ideal solution. In order to quantify thisdeviation, the absorption relative to an ideal mixture wascalculated. This is defined as the deviation of the measuredabsorption coefficients from the calculated values. The calcu-lated values are based on measurements of single-componentliquids and the non-interacting binary model, as shown ineqn (3) and (4):
aideal(o) = rreal/rideal[Vwaterawater(o) + Vipaaipa(o)](3)
arelative = aideal � areal (4)
where a is the adsorption coefficient, r is density, V is volumeand o is the angular frequency. The density ratio factor ineqn (3) accounts for small non-idealities in the volume ofmixing. Fig. 4(a) shows the relative absorption coefficient of
Fig. 3 Complex dielectric spectra of 2-propanol/water mixtures at100, 90, 70, 40 and 0 mol% H2O.
Fig. 4 (a) The relative relaxation strength of bulk water: ewater (’) and bulk2-propanol: e2-propanol (K) based on the ideal non-interacting modeldescribed in the text. (b) The relative relaxation strength of the threecomponents in eqn (1): e1 (’), e2 (K) and e3 (E) from experimental THz-TDS measurements.
PCCP Paper
Ope
n A
cces
s A
rtic
le. P
ublis
hed
on 2
3 O
ctob
er 2
015.
Dow
nloa
ded
on 1
6/12
/201
5 17
:49:
14.
Thi
s ar
ticle
is li
cens
ed u
nder
a C
reat
ive
Com
mon
s A
ttrib
utio
n 3.
0 U
npor
ted
Lic
ence
.View Article Online

30486 | Phys. Chem. Chem. Phys., 2015, 17, 30481--30491 This journal is© the Owner Societies 2015
2-propanol/water mixtures at 303 K at a frequency of 1 THz.Data at other frequencies follow the same trend.
Fig. 5(a) shows the change in relative absorption coefficientas a function of composition in the 2-propanol/water mixtures.It is clear that at all compositions, the absorption coefficient ofthe real mixture is lower than that of the ideal mixtures. Theextent of this difference, i.e. aideal � areal or relative absorptioncoefficient, has previously been shown to correlate with rota-tional dynamics and structuring in liquids.11,15,22 A greaterrelative absorption coefficient indicates more retarded rota-tional dynamics and an increase in the structuring of extendedhydrogen-bonded networks between alcohol and water molecules.2-Propanol/water mixtures, therefore, exhibit greater structurethan an ideal solution, as would be expected from the well-established excess thermodynamic properties of this mixture,with a maximum occurring at B90 mol% H2O.
3.2 NMR measurements
3.2.1 Relaxation time analysis: activation energies. Fig. 5(b)shows the activation energy for 2-propanol to undergo a molecular
diffusive jump, breaking its interaction with its neighbours andforming new interactions. These data are calculated for the alkylgroup of the alcohol through NMR relaxation time analysis asdescribed in Section 2.2. The observed trend closely mirrorsthat of aideal � areal (Fig. 5(a)) with a peak activation energy atB90 mol% H2O. A higher activation energy corresponds to amolecule which is in a structurally more stable, long-lived environ-ment. The NMR results, therefore, support the conclusions ofTHz-TDS that real solutions are more structured than ideal ones,as determined by the presence of extended alcohol–waterhydrogen-bonded networks which are maximised at B90 mol%H2O. The calculated activation energies fall within the limits11.7–22.7 kJ mol�1. These values are similar both to the energyof a HB in bulk water (reported to be between 12.6–33.5 kJ mol�1)61
and to previously measured activation energies for the diffusion ofsolvated protons in water (B11 kJ mol�1).13 For both 2-propanoland solvated protons this is a reflection that the diffusion processis driven by the breaking and formation of HBs. In order for2-propanol to undergo a molecular diffusive jump it is necessaryto break the HBs to the molecules around it, as indicated schema-tically in Fig. 1. A complete description of the environment of2-propanol molecules in 2-propanol/water clusters is provided inSection 4.2.
3.3 Neutron diffraction and EPSR simulation. Neutrondiffraction data and EPSR fits for the neat, 70 and 90 mol%H2O systems are shown in Fig. 6. Good agreement was foundbetween the experimental data and the EPSR-derived structurefactors in all cases.
Molecule–molecule centre of mass radial distribution func-tions (RDFs) of 2-propanol/2-propanol, 2-propanol/water andwater/water at the two compositions are shown in Fig. 7, andare compared with the corresponding RDF from neat 2-propanol.Overall, the RDF profiles at the two 2-propanol/water composi-tions are similar; however, there is a noticeable difference in theamplitude of the peak for the water–water partial RDF. This islargely a result of the decreased number density of watermolecules in the 70 mol% H2O system, resulting in a strongerweighting of the corresponding RDFs.
The water–water near neighbour coordination number,however, (as determined from the integral under the curvebetween 0 and 3.4 Å) was B3.4 for 70 mol% H2O and B3.9 for90 mol% H2O 2-propanol/water mixtures, and is a simple resultof the lower alcohol concentration in the latter sample. Thesecond broad peak centred around B4.5 Å, is characteristic ofthe hydrogen bonded network present in pure water which islargely preserved in both position and amplitude in both the70 and 90 mol% H2O 2-propanol/water mixtures.
Fig. 8 shows the three oxygen–oxygen site–site RDFs fromthe two 2-propanol/water mixtures (70 and 90 mol% H2O) andthe corresponding RDF from neat 2-propanol. O denotes theoxygen atom of a 2-propanol molecule, while OW denotes theoxygen atom of a water molecule. Information about the localoxygen–oxygen structure, association, and the presence ofhydrogen bonding networks in the mixtures can be determinedthrough examination of these RDFs. In both mixtures, therelative profiles of the three RDFs are again similar, consistent
Fig. 5 (a) Relative absorption coefficient of 2-propanol/water mixtures(303 K) at 1 THz as evaluated from THz-TDS measurements. (b) Activationenergy for a molecular diffusive jump of 2-propanol in 2-propanol/watermixtures as determined using NMR relaxation time analysis. (c) Negative excessenthalpy associated with 2-propanol/water mixtures at 303 K, from ref. 6.
Paper PCCP
Ope
n A
cces
s A
rtic
le. P
ublis
hed
on 2
3 O
ctob
er 2
015.
Dow
nloa
ded
on 1
6/12
/201
5 17
:49:
14.
Thi
s ar
ticle
is li
cens
ed u
nder
a C
reat
ive
Com
mon
s A
ttrib
utio
n 3.
0 U
npor
ted
Lic
ence
.View Article Online

This journal is© the Owner Societies 2015 Phys. Chem. Chem. Phys., 2015, 17, 30481--30491 | 30487
with the total RDFs shown in Fig. 7. These indicate that thereare no major changes in the local structuring around either thewater or 2-propanol alcohol groups. The amplitude of the firstpeak of the OW–OW RDF for the 70 mol% H2O 2-propanol/watermixture is larger than the corresponding peak for the 90 mol%H2O mixture; however, the position and shape are similar. Thesecond-neighbour peaks (a signature of the hydrogen bondednetwork) for the O–O and, to a lesser extent, the O–OW RDFs aresimilar for both concentrations indicating no significantchange in the extended network structure. Interestingly, aslightly better defined second shell is observed in the OW–OW
RDFs at the higher water concentration which may indicate amore structured water–water hydrogen bonded network.
4. Discussion4.1 Hydrogen bond dynamics
The relative absorption coefficient (determined from the THz-TDS analysis) and the activation energy for a molecular diffusive
jump of 2-propanol (determined form the NMR relaxation timeanalysis) both show maxima/minima at B90 mol% H2O. Further-more, this is also the concentration at which a maximum isobserved in the negative excess enthalpy of 2-propanol/watermixtures (Fig. 5(c)).6 All these data show the same general profileas a function of composition; namely a slow increase as waterconcentration increases, reaching a maximum at B90 mol% H2O,followed by a much more rapid decrease. Furthermore, the mostrapid rate of change occurs at very low alcohol concentrations, atmost a few percent. Other properties of alcohol/water solutionsare also maximised or minimised at these low concentrations.For instance, excess acoustical absorption shows a similar
Fig. 6 Experimental (red dotted line), EPSR fitted (blue solid line) differentialcross sections and the difference between them (black solid line) as afunction of Q for different isotopically substituted (a) neat 2-propanol,(b) 90 mol% H2O, and (c) 70 mol% H2O 2-propanol/water mixtures.
Fig. 7 Derived centre of mass molecule–molecule radial distributionfunctions for (a) water–water, (b) 2-propanol–water and (c) 2-propanol–2-propanol (c) for 2-propanol/water mixtures at 70 mol% H2O (dashedlines) and 90 mol% H2O (solid lines) compared with (d) neat 2-propanol.
Fig. 8 The site–site oxygen–oxygen partial radial distributions, OW–OW
(green), O–OW (blue) and O–O (red), for 70 mol% H2O 2-propanol/water(dashed lines) and 90 mol% H2O 2-propanol/water (solid lines) comparedwith neat 2-propanol O–O (black) at 298 K derived from the EPSRsimulation.
PCCP Paper
Ope
n A
cces
s A
rtic
le. P
ublis
hed
on 2
3 O
ctob
er 2
015.
Dow
nloa
ded
on 1
6/12
/201
5 17
:49:
14.
Thi
s ar
ticle
is li
cens
ed u
nder
a C
reat
ive
Com
mon
s A
ttrib
utio
n 3.
0 U
npor
ted
Lic
ence
.View Article Online

30488 | Phys. Chem. Chem. Phys., 2015, 17, 30481--30491 This journal is© the Owner Societies 2015
concentration dependence,8,62 while Brillouin scattering mea-surements show a maximum sound velocity in water/1-propanolmixtures at B90 mol% H2O.63 PFG-NMR data exhibit a minimumin the self-diffusivity of the alkyl chain of 2-propanol in waterat B90 mol% H2O at 293 K.15 A similar composition dependenceis observed for Kamlet–Taft p* values which is a measure ofpolarisability.64 The rapid change at high water concentrations isan indication that, from a structural dynamic viewpoint, thesolution rapidly becomes to resemble bulk water. This will havesignificant consequences in, e.g. facilitating proton transfer23
or the availability of water molecules, and therefore on anyprocess or device which may depend on these. Examples ofsuch processes include hydrogenation catalysis and proton-exchange membranes. Here, the observation that the propertiesof the solution below 90 mol% H2O differ significantly fromthose of bulk water is supported by the results of comple-mentary ab initio molecular dynamics simulations. These showthat proton transfer is B27 times faster in pure water than in a87 mol% H2O 2-propanol/water mixture.5 That proton transferinvolves an extended network of water molecules and notsimply those directly bound to the proton has been recentlyevidenced by THz-TDS, with B15 water molecules calculated tobe involved in such processes.23
The observation that the activation energy, relative absorptioncoefficient and excess enthalpy all correlate with each othercan be assigned to the fact that all are related to HB dynamics.Excess enthalpy is essentially a measure of the average strengthof intermolecular interactions.14 A higher magnitude of excessenthalpy therefore suggests stronger, more long-lived, HBs in themixture, as do the more retarded dynamics evidenced by THz-TDS and the higher activation to a molecular diffusive jumpindicated by NMR. It is worth noting that neutron diffractionstudies have previously shown that it is the strength, and not thenumber, of HBs that change on the addition of alcohol to purewater.17 The present study supports the conclusion that theability of 2-propanol to interact with other molecules in solutionis directly controlled by the hydrogen bonding structure of themixture and the dynamics of those HBs. We now demonstratein Section 4.2 that the size of these hydrogen bonded clustersis provided through an analysis of both THz-TDS and neutrondiffraction data.
4.2 Hydration shell analysis
Analysis of the neutron diffraction data presented in Section 3.3also allows for a quantitative analysis of the hydration shellaround 2-propanol. For 70 and 90 mol% H2O 2-propanol/watermixtures, the coordination numbers found in the first shell foreach of the centre-of-mass as well as the oxygen–hydrogen andthe carbon–carbon partial RDFs are summarised in Table 1.These numbers are correlated with data for neat 2-propanoland water.
In the pure 2-propanol, the first-shell centre-of-mass coor-dination number is 11.9. In the mixed systems, the number ofwater molecules present in the first solvation shell of the2-propanol molecules is found to increase with the mole fractionof water. A concomitant decrease in the number of 2-propanol
molecules is also found, highlighting the replacement of thealcohol by water in the first solvation shell of the alcohol. Each2-propanol is replaced by 1.9 and 1.7 water molecules in the70 and 90 mol% H2O systems, respectively. This difference is areflection of the non-ideal mixing in the present systems. In asimilar manner, the solvation shell around water is perturbed ingoing from the lower to higher concentration of 2-propanol,with the number of resident water molecules reduced, and thenumber of alcohol molecules doubled. The environment of thefirst coordination shell around water is able to accommodatethe 2-propanol molecules relatively easily. Due to the bulkynature of the alcohol this suggests that this is via hydrogenbonding, rather than simple incorporation of the methyl groupsinto the shell.
Despite a centre-of-mass coordination number of 11.9 inpure 2-propanol, integration of the O–H partial RDFs up to thefirst minimum (in line with the analysis of Dixit et al.)17 revealsthat only 0.9 hydrogen bond contacts are formed by the oxygenat the centre. This compares with a value of 1.8 calculated formethanol, and is consistent with the bulkier nature of thealiphatic group in the present case. Herein, the predominanttype of contact between 2-propanol molecules is betweenmethyl groups. In fact, an examination of the C–C partial radialdistribution function (see ESI,† Fig. S1) show a methyl–methylcoordination number of 9.2, integrating up to 4.7 Å. Coordina-tion numbers from the mixed systems show that hydrogenbonding between 2-propanol molecules is significantly reducedby the presence of the water, with only 0.2 remaining in thecase of the lower concentration of alcohol. Clearly, hydrogenbonding with water is more favourable, with 1.0 and 1.4 contactsformed between the 2-propanol OH group and the water in the70 and 90 mol% systems, respectively, of which approximately35% are attributable to the 2-propanol acting as the H-bonddonor. In line with this, the number of hydrogen bonds betweenwater molecules reduces from 3.2 to 2.5 on moving to the lower
Table 1 Coordination numbers between 2-propanol and water sitescalculated from integration of the relevant RDFs up to the position ofthe first minimum
Radial distributionfunction
70 mol%H2O
90 mol%H2O Neat
Maxdistance/Å
Centre-of-massWater around water 3.4 3.9 — 3.42-Propanol around water 2.7 1.4 — 5.8Water around 2-propanol 6.2 12.4 — 5.62-Propanol around 2-propanol 8.6 4.4 11.9 7.2Water total 6.1 5.32-Propanol total 14.8 16.8 11.9
Oxygen–hydrogen partial RDFWater around water 2.5 3.2 3.617 2.42-Propanol around water 0.4 0.2 — 2.5Water around 2-propanol 1.0 1.4 — 2.52-Propanol around 2-propanol 0.4 0.2 0.9 2.7Water total 2.9 3.4 3.617
2-Propanol total 1.4 1.6 0.9
Carbon–carbon partial RDFMethyl C around methyl C 6.7 3.4 9.2 4.7
Paper PCCP
Ope
n A
cces
s A
rtic
le. P
ublis
hed
on 2
3 O
ctob
er 2
015.
Dow
nloa
ded
on 1
6/12
/201
5 17
:49:
14.
Thi
s ar
ticle
is li
cens
ed u
nder
a C
reat
ive
Com
mon
s A
ttrib
utio
n 3.
0 U
npor
ted
Lic
ence
.View Article Online
This journal is© the Owner Societies 2015 Phys. Chem. Chem. Phys., 2015, 17, 30481--30491 | 30489
mol% H2O system which can be compared with 3.6 molecules inthe pure water system.17
Using values of 0.9 and 3.617 hydrogen bonds in pure2-propanol and water, respectively, the expected number ofhydrogen bonds per molecule in the 90 mol% H2O mixture iscalculated as 3.3, assuming ideal mixing between the twospecies, while for 70 mol% H2O mixture the expected numberis 2.8. From the discussion above we can see that the overallnumber of hydrogen bonds each 2-propanol OH group isinvolved in increases on the addition of water into the system.The inference from these data is that hydrogen bondingcontacts between alcohol molecules are reduced in favour ofcontacts with water molecules, and this is reflected in theincreased number of water molecules in the primary coordina-tion shell. The net result of this is that, while the number ofhydrogen bonding contacts between 2-propanol moleculesdecreases, the overall number increases significantly due toadditional interactions with water molecules. In terms of contactsbetween hydrophobic groups, even in the 90 mol% H2O systemthere is still significant clustering of methyl groups, with therelevant coordination number calculated as 3.4.
The hydrogen bonding network in such a system is notquantified easily by simple coordination numbers. Calculationsof clusters sizes formed from continuous O–O contacts betweenmolecules of less than 3.1 Å suggest that in neat 2-propanolB40% of alcohol molecules are, at any one instant, isolatedand not participating in hydrogen bonding with other alcoholmolecules. In the 70 mol% H2O mixture this rises to B56%,and in the 90 mol% H2O to 77%, again confirming the breakupof 2-propanol clusters by the water. Combined with the coordi-nation numbers of methyl groups, this suggests a picture of2-propanol molecules that tend not to interact with each othervia hydrogen bonding, but instead tend to cluster through close-contacts with their methyl groups, thus minimising hydrophobiccontacts with the solvent.
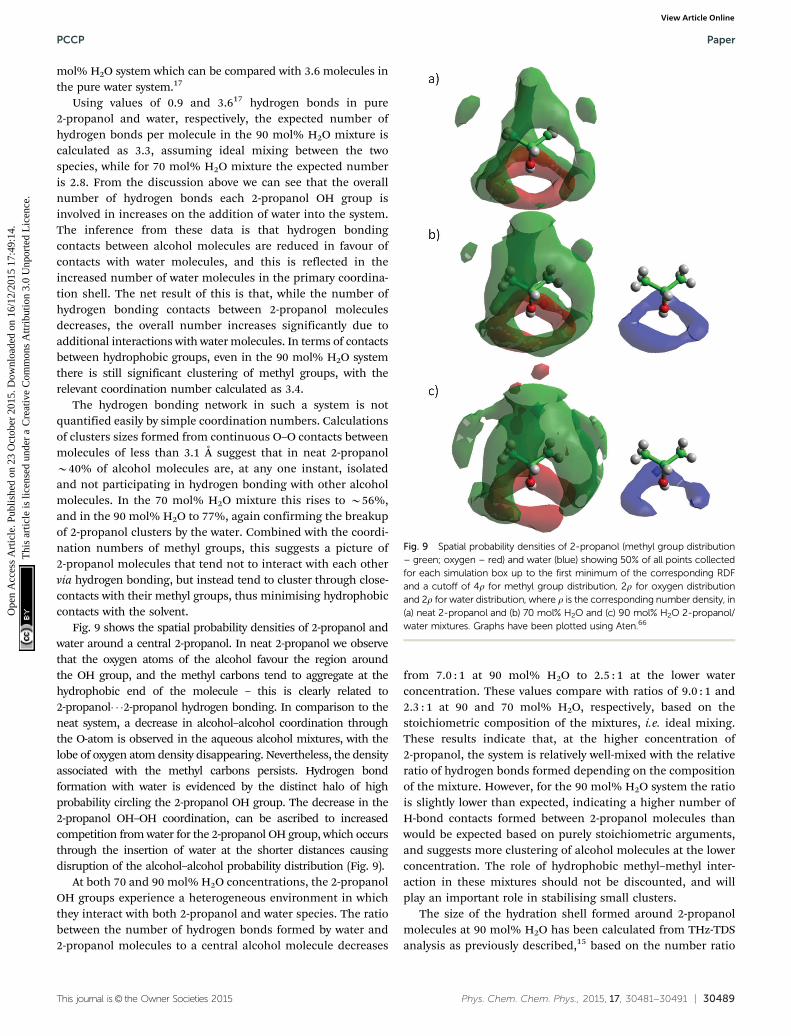
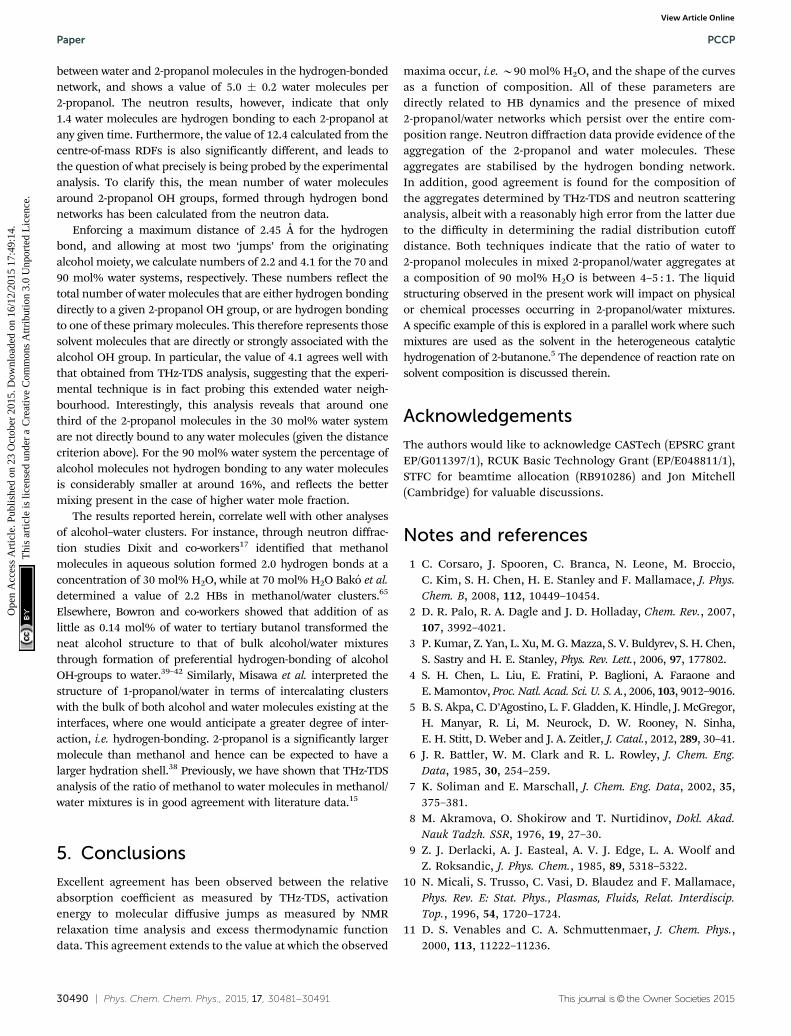
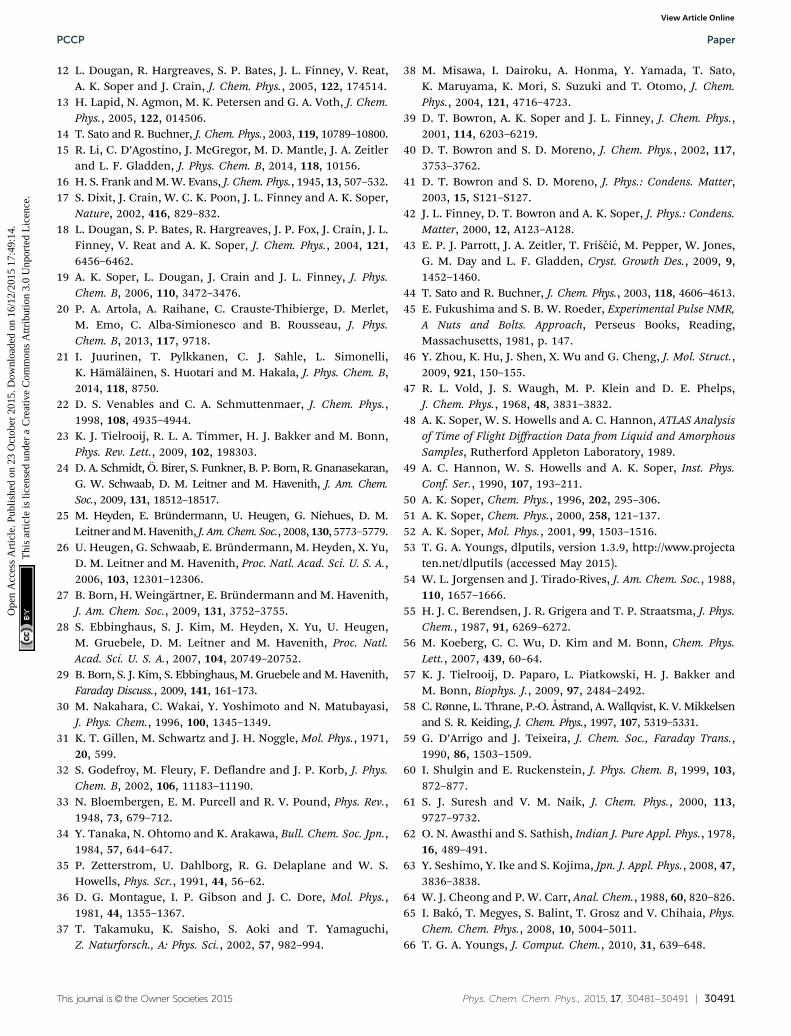
Fig. 9 shows the spatial probability densities of 2-propanol andwater around a central 2-propanol. In neat 2-propanol we observethat the oxygen atoms of the alcohol favour the region aroundthe OH group, and the methyl carbons tend to aggregate at thehydrophobic end of the molecule – this is clearly related to2-propanol� � �2-propanol hydrogen bonding. In comparison to theneat system, a decrease in alcohol–alcohol coordination throughthe O-atom is observed in the aqueous alcohol mixtures, with thelobe of oxygen atom density disappearing. Nevertheless, the densityassociated with the methyl carbons persists. Hydrogen bondformation with water is evidenced by the distinct halo of highprobability circling the 2-propanol OH group. The decrease in the2-propanol OH–OH coordination, can be ascribed to increasedcompetition from water for the 2-propanol OH group, which occursthrough the insertion of water at the shorter distances causingdisruption of the alcohol–alcohol probability distribution (Fig. 9).
At both 70 and 90 mol% H2O concentrations, the 2-propanolOH groups experience a heterogeneous environment in whichthey interact with both 2-propanol and water species. The ratiobetween the number of hydrogen bonds formed by water and2-propanol molecules to a central alcohol molecule decreases
from 7.0 : 1 at 90 mol% H2O to 2.5 : 1 at the lower waterconcentration. These values compare with ratios of 9.0 : 1 and2.3 : 1 at 90 and 70 mol% H2O, respectively, based on thestoichiometric composition of the mixtures, i.e. ideal mixing.These results indicate that, at the higher concentration of2-propanol, the system is relatively well-mixed with the relativeratio of hydrogen bonds formed depending on the compositionof the mixture. However, for the 90 mol% H2O system the ratiois slightly lower than expected, indicating a higher number ofH-bond contacts formed between 2-propanol molecules thanwould be expected based on purely stoichiometric arguments,and suggests more clustering of alcohol molecules at the lowerconcentration. The role of hydrophobic methyl–methyl inter-action in these mixtures should not be discounted, and willplay an important role in stabilising small clusters.
The size of the hydration shell formed around 2-propanolmolecules at 90 mol% H2O has been calculated from THz-TDSanalysis as previously described,15 based on the number ratio
Fig. 9 Spatial probability densities of 2-propanol (methyl group distribution– green; oxygen – red) and water (blue) showing 50% of all points collectedfor each simulation box up to the first minimum of the corresponding RDFand a cutoff of 4r for methyl group distribution, 2r for oxygen distributionand 2r for water distribution, where r is the corresponding number density, in(a) neat 2-propanol and (b) 70 mol% H2O and (c) 90 mol% H2O 2-propanol/water mixtures. Graphs have been plotted using Aten.66
PCCP Paper
Ope
n A
cces
s A
rtic
le. P
ublis
hed
on 2
3 O
ctob
er 2
015.
Dow
nloa
ded
on 1
6/12
/201
5 17
:49:
14.
Thi
s ar
ticle
is li
cens
ed u
nder
a C
reat
ive
Com
mon
s A
ttrib
utio
n 3.
0 U
npor
ted
Lic
ence
.View Article Online
30490 | Phys. Chem. Chem. Phys., 2015, 17, 30481--30491 This journal is© the Owner Societies 2015
between water and 2-propanol molecules in the hydrogen-bondednetwork, and shows a value of 5.0 � 0.2 water molecules per2-propanol. The neutron results, however, indicate that only1.4 water molecules are hydrogen bonding to each 2-propanol atany given time. Furthermore, the value of 12.4 calculated from thecentre-of-mass RDFs is also significantly different, and leads tothe question of what precisely is being probed by the experimentalanalysis. To clarify this, the mean number of water moleculesaround 2-propanol OH groups, formed through hydrogen bondnetworks has been calculated from the neutron data.
Enforcing a maximum distance of 2.45 Å for the hydrogenbond, and allowing at most two ‘jumps’ from the originatingalcohol moiety, we calculate numbers of 2.2 and 4.1 for the 70 and90 mol% water systems, respectively. These numbers reflect thetotal number of water molecules that are either hydrogen bondingdirectly to a given 2-propanol OH group, or are hydrogen bondingto one of these primary molecules. This therefore represents thosesolvent molecules that are directly or strongly associated with thealcohol OH group. In particular, the value of 4.1 agrees well withthat obtained from THz-TDS analysis, suggesting that the experi-mental technique is in fact probing this extended water neigh-bourhood. Interestingly, this analysis reveals that around onethird of the 2-propanol molecules in the 30 mol% water systemare not directly bound to any water molecules (given the distancecriterion above). For the 90 mol% water system the percentage ofalcohol molecules not hydrogen bonding to any water moleculesis considerably smaller at around 16%, and reflects the bettermixing present in the case of higher water mole fraction.
The results reported herein, correlate well with other analysesof alcohol–water clusters. For instance, through neutron diffrac-tion studies Dixit and co-workers17 identified that methanolmolecules in aqueous solution formed 2.0 hydrogen bonds at aconcentration of 30 mol% H2O, while at 70 mol% H2O Bako et al.determined a value of 2.2 HBs in methanol/water clusters.65
Elsewhere, Bowron and co-workers showed that addition of aslittle as 0.14 mol% of water to tertiary butanol transformed theneat alcohol structure to that of bulk alcohol/water mixturesthrough formation of preferential hydrogen-bonding of alcoholOH-groups to water.39–42 Similarly, Misawa et al. interpreted thestructure of 1-propanol/water in terms of intercalating clusterswith the bulk of both alcohol and water molecules existing at theinterfaces, where one would anticipate a greater degree of inter-action, i.e. hydrogen-bonding. 2-propanol is a significantly largermolecule than methanol and hence can be expected to have alarger hydration shell.38 Previously, we have shown that THz-TDSanalysis of the ratio of methanol to water molecules in methanol/water mixtures is in good agreement with literature data.15
5. Conclusions
Excellent agreement has been observed between the relativeabsorption coefficient as measured by THz-TDS, activationenergy to molecular diffusive jumps as measured by NMRrelaxation time analysis and excess thermodynamic functiondata. This agreement extends to the value at which the observed
maxima occur, i.e. B90 mol% H2O, and the shape of the curvesas a function of composition. All of these parameters aredirectly related to HB dynamics and the presence of mixed2-propanol/water networks which persist over the entire com-position range. Neutron diffraction data provide evidence of theaggregation of the 2-propanol and water molecules. Theseaggregates are stabilised by the hydrogen bonding network.In addition, good agreement is found for the composition ofthe aggregates determined by THz-TDS and neutron scatteringanalysis, albeit with a reasonably high error from the latter dueto the difficulty in determining the radial distribution cutoffdistance. Both techniques indicate that the ratio of water to2-propanol molecules in mixed 2-propanol/water aggregates ata composition of 90 mol% H2O is between 4–5 : 1. The liquidstructuring observed in the present work will impact on physicalor chemical processes occurring in 2-propanol/water mixtures.A specific example of this is explored in a parallel work where suchmixtures are used as the solvent in the heterogeneous catalytichydrogenation of 2-butanone.5 The dependence of reaction rate onsolvent composition is discussed therein.
Acknowledgements
The authors would like to acknowledge CASTech (EPSRC grantEP/G011397/1), RCUK Basic Technology Grant (EP/E048811/1),STFC for beamtime allocation (RB910286) and Jon Mitchell(Cambridge) for valuable discussions.
Notes and references
1 C. Corsaro, J. Spooren, C. Branca, N. Leone, M. Broccio,C. Kim, S. H. Chen, H. E. Stanley and F. Mallamace, J. Phys.Chem. B, 2008, 112, 10449–10454.
2 D. R. Palo, R. A. Dagle and J. D. Holladay, Chem. Rev., 2007,107, 3992–4021.
3 P. Kumar, Z. Yan, L. Xu, M. G. Mazza, S. V. Buldyrev, S. H. Chen,S. Sastry and H. E. Stanley, Phys. Rev. Lett., 2006, 97, 177802.
4 S. H. Chen, L. Liu, E. Fratini, P. Baglioni, A. Faraone andE. Mamontov, Proc. Natl. Acad. Sci. U. S. A., 2006, 103, 9012–9016.
5 B. S. Akpa, C. D’Agostino, L. F. Gladden, K. Hindle, J. McGregor,H. Manyar, R. Li, M. Neurock, D. W. Rooney, N. Sinha,E. H. Stitt, D. Weber and J. A. Zeitler, J. Catal., 2012, 289, 30–41.
6 J. R. Battler, W. M. Clark and R. L. Rowley, J. Chem. Eng.Data, 1985, 30, 254–259.
7 K. Soliman and E. Marschall, J. Chem. Eng. Data, 2002, 35,375–381.
8 M. Akramova, O. Shokirow and T. Nurtidinov, Dokl. Akad.Nauk Tadzh. SSR, 1976, 19, 27–30.
9 Z. J. Derlacki, A. J. Easteal, A. V. J. Edge, L. A. Woolf andZ. Roksandic, J. Phys. Chem., 1985, 89, 5318–5322.
10 N. Micali, S. Trusso, C. Vasi, D. Blaudez and F. Mallamace,Phys. Rev. E: Stat. Phys., Plasmas, Fluids, Relat. Interdiscip.Top., 1996, 54, 1720–1724.
11 D. S. Venables and C. A. Schmuttenmaer, J. Chem. Phys.,2000, 113, 11222–11236.
Paper PCCP
Ope
n A
cces
s A
rtic
le. P
ublis
hed
on 2
3 O
ctob
er 2
015.
Dow
nloa
ded
on 1
6/12
/201
5 17
:49:
14.
Thi
s ar
ticle
is li
cens
ed u
nder
a C
reat
ive
Com
mon
s A
ttrib
utio
n 3.
0 U
npor
ted
Lic
ence
.View Article Online
This journal is© the Owner Societies 2015 Phys. Chem. Chem. Phys., 2015, 17, 30481--30491 | 30491
12 L. Dougan, R. Hargreaves, S. P. Bates, J. L. Finney, V. Reat,A. K. Soper and J. Crain, J. Chem. Phys., 2005, 122, 174514.
13 H. Lapid, N. Agmon, M. K. Petersen and G. A. Voth, J. Chem.Phys., 2005, 122, 014506.
14 T. Sato and R. Buchner, J. Chem. Phys., 2003, 119, 10789–10800.15 R. Li, C. D’Agostino, J. McGregor, M. D. Mantle, J. A. Zeitler
and L. F. Gladden, J. Phys. Chem. B, 2014, 118, 10156.16 H. S. Frank and M. W. Evans, J. Chem. Phys., 1945, 13, 507–532.17 S. Dixit, J. Crain, W. C. K. Poon, J. L. Finney and A. K. Soper,
Nature, 2002, 416, 829–832.18 L. Dougan, S. P. Bates, R. Hargreaves, J. P. Fox, J. Crain, J. L.
Finney, V. Reat and A. K. Soper, J. Chem. Phys., 2004, 121,6456–6462.
19 A. K. Soper, L. Dougan, J. Crain and J. L. Finney, J. Phys.Chem. B, 2006, 110, 3472–3476.
20 P. A. Artola, A. Raihane, C. Crauste-Thibierge, D. Merlet,M. Emo, C. Alba-Simionesco and B. Rousseau, J. Phys.Chem. B, 2013, 117, 9718.
21 I. Juurinen, T. Pylkkanen, C. J. Sahle, L. Simonelli,K. Hamalainen, S. Huotari and M. Hakala, J. Phys. Chem. B,2014, 118, 8750.
22 D. S. Venables and C. A. Schmuttenmaer, J. Chem. Phys.,1998, 108, 4935–4944.
23 K. J. Tielrooij, R. L. A. Timmer, H. J. Bakker and M. Bonn,Phys. Rev. Lett., 2009, 102, 198303.
24 D. A. Schmidt, O. Birer, S. Funkner, B. P. Born, R. Gnanasekaran,G. W. Schwaab, D. M. Leitner and M. Havenith, J. Am. Chem.Soc., 2009, 131, 18512–18517.
25 M. Heyden, E. Brundermann, U. Heugen, G. Niehues, D. M.Leitner and M. Havenith, J. Am. Chem. Soc., 2008, 130, 5773–5779.
26 U. Heugen, G. Schwaab, E. Brundermann, M. Heyden, X. Yu,D. M. Leitner and M. Havenith, Proc. Natl. Acad. Sci. U. S. A.,2006, 103, 12301–12306.
27 B. Born, H. Weingartner, E. Brundermann and M. Havenith,J. Am. Chem. Soc., 2009, 131, 3752–3755.
28 S. Ebbinghaus, S. J. Kim, M. Heyden, X. Yu, U. Heugen,M. Gruebele, D. M. Leitner and M. Havenith, Proc. Natl.Acad. Sci. U. S. A., 2007, 104, 20749–20752.
29 B. Born, S. J. Kim, S. Ebbinghaus, M. Gruebele and M. Havenith,Faraday Discuss., 2009, 141, 161–173.
30 M. Nakahara, C. Wakai, Y. Yoshimoto and N. Matubayasi,J. Phys. Chem., 1996, 100, 1345–1349.
31 K. T. Gillen, M. Schwartz and J. H. Noggle, Mol. Phys., 1971,20, 599.
32 S. Godefroy, M. Fleury, F. Deflandre and J. P. Korb, J. Phys.Chem. B, 2002, 106, 11183–11190.
33 N. Bloembergen, E. M. Purcell and R. V. Pound, Phys. Rev.,1948, 73, 679–712.
34 Y. Tanaka, N. Ohtomo and K. Arakawa, Bull. Chem. Soc. Jpn.,1984, 57, 644–647.
35 P. Zetterstrom, U. Dahlborg, R. G. Delaplane and W. S.Howells, Phys. Scr., 1991, 44, 56–62.
36 D. G. Montague, I. P. Gibson and J. C. Dore, Mol. Phys.,1981, 44, 1355–1367.
37 T. Takamuku, K. Saisho, S. Aoki and T. Yamaguchi,Z. Naturforsch., A: Phys. Sci., 2002, 57, 982–994.
38 M. Misawa, I. Dairoku, A. Honma, Y. Yamada, T. Sato,K. Maruyama, K. Mori, S. Suzuki and T. Otomo, J. Chem.Phys., 2004, 121, 4716–4723.
39 D. T. Bowron, A. K. Soper and J. L. Finney, J. Chem. Phys.,2001, 114, 6203–6219.
40 D. T. Bowron and S. D. Moreno, J. Chem. Phys., 2002, 117,3753–3762.
41 D. T. Bowron and S. D. Moreno, J. Phys.: Condens. Matter,2003, 15, S121–S127.
42 J. L. Finney, D. T. Bowron and A. K. Soper, J. Phys.: Condens.Matter, 2000, 12, A123–A128.
43 E. P. J. Parrott, J. A. Zeitler, T. Friscic, M. Pepper, W. Jones,G. M. Day and L. F. Gladden, Cryst. Growth Des., 2009, 9,1452–1460.
44 T. Sato and R. Buchner, J. Chem. Phys., 2003, 118, 4606–4613.45 E. Fukushima and S. B. W. Roeder, Experimental Pulse NMR,
A Nuts and Bolts. Approach, Perseus Books, Reading,Massachusetts, 1981, p. 147.
46 Y. Zhou, K. Hu, J. Shen, X. Wu and G. Cheng, J. Mol. Struct.,2009, 921, 150–155.
47 R. L. Vold, J. S. Waugh, M. P. Klein and D. E. Phelps,J. Chem. Phys., 1968, 48, 3831–3832.
48 A. K. Soper, W. S. Howells and A. C. Hannon, ATLAS Analysisof Time of Flight Diffraction Data from Liquid and AmorphousSamples, Rutherford Appleton Laboratory, 1989.
49 A. C. Hannon, W. S. Howells and A. K. Soper, Inst. Phys.Conf. Ser., 1990, 107, 193–211.
50 A. K. Soper, Chem. Phys., 1996, 202, 295–306.51 A. K. Soper, Chem. Phys., 2000, 258, 121–137.52 A. K. Soper, Mol. Phys., 2001, 99, 1503–1516.53 T. G. A. Youngs, dlputils, version 1.3.9, http://www.projecta
ten.net/dlputils (accessed May 2015).54 W. L. Jorgensen and J. Tirado-Rives, J. Am. Chem. Soc., 1988,
110, 1657–1666.55 H. J. C. Berendsen, J. R. Grigera and T. P. Straatsma, J. Phys.
Chem., 1987, 91, 6269–6272.56 M. Koeberg, C. C. Wu, D. Kim and M. Bonn, Chem. Phys.
Lett., 2007, 439, 60–64.57 K. J. Tielrooij, D. Paparo, L. Piatkowski, H. J. Bakker and
M. Bonn, Biophys. J., 2009, 97, 2484–2492.58 C. Rønne, L. Thrane, P.-O. Åstrand, A. Wallqvist, K. V. Mikkelsen
and S. R. Keiding, J. Chem. Phys., 1997, 107, 5319–5331.59 G. D’Arrigo and J. Teixeira, J. Chem. Soc., Faraday Trans.,
1990, 86, 1503–1509.60 I. Shulgin and E. Ruckenstein, J. Phys. Chem. B, 1999, 103,
872–877.61 S. J. Suresh and V. M. Naik, J. Chem. Phys., 2000, 113,
9727–9732.62 O. N. Awasthi and S. Sathish, Indian J. Pure Appl. Phys., 1978,
16, 489–491.63 Y. Seshimo, Y. Ike and S. Kojima, Jpn. J. Appl. Phys., 2008, 47,
3836–3838.64 W. J. Cheong and P. W. Carr, Anal. Chem., 1988, 60, 820–826.65 I. Bako, T. Megyes, S. Balint, T. Grosz and V. Chihaia, Phys.
Chem. Chem. Phys., 2008, 10, 5004–5011.66 T. G. A. Youngs, J. Comput. Chem., 2010, 31, 639–648.
PCCP Paper
Ope
n A
cces
s A
rtic
le. P
ublis
hed
on 2
3 O
ctob
er 2
015.
Dow
nloa
ded
on 1
6/12
/201
5 17
:49:
14.
Thi
s ar
ticle
is li
cens
ed u
nder
a C
reat
ive
Com
mon
s A
ttrib
utio
n 3.
0 U
npor
ted
Lic
ence
.View Article Online