structural study of calcium phosphonates: a combined synchrotron
TRANSCRIPT

SUPPORTING INFORMATION
Structural study of Calcium phosphonates: a combined synchrotron powder diffraction,
solid-state NMR and first-principle calculations approach
S. Sene, B. Bouchevreau, C. Martineau, C. Gervais, C. Bonhomme, P. Gaveau, F. Mauri, S. Bégu, P. H. Mutin, M. E. Smith, and D. Laurencin
Supplementary Figures
Figure S1. IR spectra of Ca-phosphonate phases 1 to 5.
Figure S2. TGA of Ca-phosphonate phases 1 to 5.
Figure S3. SEM images of Ca-phosphonate phases 1 to 5.
Figure S4. Whole pattern fitting plots (LeBail method) of the SPD diagrams of Ca-phosphonate phases 1 to 4.
Figure S5. Simulated SPD patterns of Ca-phosphonate phases 1 to 4 (relaxed structures).
Figure S6. Different views of the crystal structures of Ca-phosphonate compounds 1 to 4.
Figure S7. Comparison of Ca-binding modes of phenyl and butylphosphonate ligands, to those of phenyl and butylboronate ligands.
Figure S8. 31P MAS NMR spectra of compounds 3 and 5, recorded at a low spinning speed.
Figure S9. Evidence of preferential orientation of Ca-butylphosphonate crystallites in the rotor.
Figure S10. 13C CPMAS NMR spectra of Ca-phosphonate phases 1 to 4.
Figure S11. Comparison of 13C NMR spectra of Ca-phosphonate phases 1 to 4, recorded with (or without) 31P decoupling during acquisition.
Figure S12. 13C{31P} REDOR NMR spectra recorded for phases 3 and 5.
Figure S13. Natural abundance 43Ca MAS NMR spectra of compounds 1, 3 and 5.
Figure S14. 1H DUMBO NMR spectra of Ca-phosphonates 1 to 4.
Figure S15. 31P{23Na} REDOR NMR study of 5.
Figure S16. Evidence of 3JP-C couplings on 13C NMR spectra of butylphosphonate phases 4 and 5.
Supplementary Tables
Table S1. Experimental details for the acquisition of 31P NMR spectra.
Table S2. Experimental details for the acquisition of 13C NMR spectra.
Table S3. Experimental details for the acquisition of natural-abundance 43Ca NMR spectra.
Table S4. Parameters used for whole pattern fitting plots (LeBail method) of the SPD diagrams of Ca-phosphonate phases 1 to 4.
Table S5. Fractional atomic coordinates of Ca-phosphonates 1 to 4 after relaxation of all atomic positions.
Table S6. Experimental and calculated 31P NMR parameters.
Table S7. Experimental and calculated 13C isotropic chemical shifts.
Table S8. Experimental and calculated 43Ca NMR parameters
Table S9. Experimental and calculated 1H isotropic chemical shifts.
Electronic Supplementary Material (ESI) for CrystEngCommThis journal is © The Royal Society of Chemistry 2013

Figure S1. IR spectra of Ca-phosphonate phases 1 to 5.
4000 3500 3000 2500 2000 1500 1000 500
Ca(C4H9-PO3).H2O
Ca(C6H5-PO3).2H2O
Ca(C6H5-PO3H)2
Ca(C4H9-PO3H)2
Ca1.5Na(C4H9-PO3)2
(cm-1)
Electronic Supplementary Material (ESI) for CrystEngCommThis journal is © The Royal Society of Chemistry 2013

Figure S2. TGA of Ca-phosphonate phases 1 to 5.
Ca(C6H5-PO3H)2 vs Ca(C6H5-PO3).2H2O
Ca(C4H9-PO3H)2 vs Ca(C4H9-PO3).H2O
Ca1.5Na(C4H9-PO3)2
100 200 300 400 500 600 700 800
50
60
70
80
90
100
We
igh
t lo
ss (
%)
T (°C)
LDC21TG CaPPhDT
Ca(C6H5-PO3H)2
Ca(C6H5-PO3).2H2O
100 200 300 400 500 600 700 800
50
60
70
80
90
100
We
igh
t lo
ss (
%)
T (°C)
LDC32DT CaPBuDT
Ca(C4H9-PO3H)2
Ca(C4H9-PO3)2.H2O
100 200 300 400 500 600 700 800
50
60
70
80
90
100
We
igh
t lo
ss (
%)
T (°C)
NaCaPBuDT
Electronic Supplementary Material (ESI) for CrystEngCommThis journal is © The Royal Society of Chemistry 2013

Figure S3. SEM images of Ca-phosphonate phases 1 to 5.
(1) Ca(C6H5-PO3H)2
(2) Ca(C6H5-PO3).2H2O
(3) Ca(C4H9-PO3H)2
(4) Ca(C4H9-PO3).H2O
(5) Ca1.5Na(C4H9-PO3)2
6.0 μm 3.0 μm
6.0 μm 3.0 μm
20.0 μm 6.0 μm
7.5 μm 3.0 μm
6.0 μm 3.0 μm
Electronic Supplementary Material (ESI) for CrystEngCommThis journal is © The Royal Society of Chemistry 2013

Figure S4. Whole pattern fitting plots (LeBail method) of the synchrotron powder diffraction
diagrams of Ca-phosphonate phases 1 to 4.
Vertical bars indicate the Bragg positions. Differences between experimental and calculated diagrams
are shown below. Fit statistics are given in Table S4.
1/ Ca(C6H5-PO3H)2
2/ Ca(C6H5-PO3).2H2O
3/ Ca(C4H9-PO3H)2
4/ Ca(C4H9-PO3).H2O
Electronic Supplementary Material (ESI) for CrystEngCommThis journal is © The Royal Society of Chemistry 2013

Figure S5. Simulated SPD patterns of Ca-phosphonate phases 1 to 4 (relaxed structures).
1/ Ca(C6H5-PO3H)2
2/ Ca(C6H5-PO3).2H2O
3/ Ca(C4H9-PO3H)2
4/ Ca(C4H9-PO3).H2O
Electronic Supplementary Material (ESI) for CrystEngCommThis journal is © The Royal Society of Chemistry 2013

Figure S6. Different views of the crystal structures of Ca-phosphonate compounds 1 to 4.
For each compound, the figure on the right represents an alternate view of the part of the structure shadowed in grey
(looking in the direction of the arrow). Ca, P, C, O and H atoms are in green, black, grey, red, and white, respectively.
(1) Ca(C6H5-PO3H)2
(2) Ca(C6H5-PO3).2H2O
(3) Ca(C4H9-PO3H)2
(4) Ca(C4H9-PO3).H2O
a
c
b
c
a
b
b
c
b
ca
b
a
b
b
c
Electronic Supplementary Material (ESI) for CrystEngCommThis journal is © The Royal Society of Chemistry 2013

Figure S7. Comparison of Ca-binding modes of phenyl and butylphosphonate ligands, to those of
phenyl and butylboronate ligands.
Ca, P, B, C, O and H atoms are in green, black, brown, grey, red, and white, respectively.
Butyl- chain Phenyl-chain
Phosphonate (R-PO3H
-)
(1 Ca ; 2 Ca ; 1 H)
(1 Ca ; 2 Ca ; 1 Ca + 1 H)
Phosphonate (R-PO3
2-)
(1 Ca ; 2 Ca ; 3 Ca)
(1 Ca ; 2 Ca ; 2 Ca)
Boronate (R-B(OH)3
-)
(1 Ca; 2 Ca; 2 Ca) (1 Ca; 1 Ca; 1 Ca)
(1 Ca; 1 Ca; 2 Ca)
ab
c
C
Ca
H
O
P
a
b
c
C
Ca
H
O
P
a
bc
C
Ca
H
O
P
a
b
c
C
Ca
H
O
P
Electronic Supplementary Material (ESI) for CrystEngCommThis journal is © The Royal Society of Chemistry 2013

Figure S8. 31P MAS NMR spectra of phases 3 and 5, recorded at 9.4 T, at a low spinning frequency (r
~1.6 kHz). A fit is proposed for each spectrum, and the corresponding 31P CSA parameters are
reported above the spectra. Further details on the measurement conditions used to acquire the
spectra can be found in Table S1.
Ca(C4H9-PO3H)2
Ca1.5Na(C4H9-PO3)2
δiso = 25.3 ± 0.1 ppm
CS = 51.4 ± 2.5 ppm
CS = 0.92 ± 0.05
δiso = 26.8 ± 0.1 ppm
CS = 53.0 ± 2.5 ppm
CS = 0.85 ± 0.05
δiso = 23.1 ± 0.1 ppm
CS = 47.5 ± 1.5 ppm
CS = 0.64 ± 0.05
δiso = 25.8 ± 0.1 ppm
CS = 41.5 ± 1.5 ppm
CS = 0.53 ± 0.03
31P chemical shift (ppm)-150-100-50050100150
exp
sim
diff
31P chemical shift (ppm)
-150-100-50050100150
exp
sim
diff
Electronic Supplementary Material (ESI) for CrystEngCommThis journal is © The Royal Society of Chemistry 2013

Figure S9. Evidence of preferential orientation of Ca-butylphosphonate crystallites in the rotor.
31P static spectra of Ca(C4H9-PO3).H2O (4), recorded at 9.4 T, either directly on the powder, or after diluting it
physically in silica. In the latter case, a better agreement between experimental (solid line) and simulated
lineshapes (dashed line) is observed.
Ca(C4H9-PO3).H2O
31P chemical shift (ppm)-150-100-50050100150
No « dilution »
after « dilution »in SiO2
Electronic Supplementary Material (ESI) for CrystEngCommThis journal is © The Royal Society of Chemistry 2013

Figure S10. 13C CPMAS NMR spectra of Ca-phosphonate phases 1 to 4, recorded at 14.1 T (10 kHz
MAS), without 31P decoupling during acquisition. Further details on the experimental parameters
used can be found in Table S2.
13C chemical shift (ppm)
10011012013014015016013C chemical shift (ppm)
10152025303540
Ca
Cb
Cc
Cd
Cd
Ca Ca
Cb, Cc
Ci
Co
Cm, Cp
Co, Cm, Cp
Ci
d/ Ca(C4H9-PO3).H2O
c/ Ca(C4H9-PO3H)2
b/ Ca(C6H5-PO3).2H2O
a/ Ca(C6H5-PO3H)2
Electronic Supplementary Material (ESI) for CrystEngCommThis journal is © The Royal Society of Chemistry 2013

Figure S11. Comparison of 13C NMR spectra of Ca-phosphonate phases 1 to 4, recorded with (red) or
without (black) 31P decoupling during acquisition.
1/ Ca(C6H5-PO3H)2
3/ Ca(C4H9-PO3H)2
2/ Ca(C6H5-PO3).2H2O
4/ Ca(C4H9-PO3).H2O
10011012013014015016013C chemical shift (ppm)
Dec 1H
Dec 1H and 31P
13C chemical shift (ppm)10152025303540
Dec 1H
Dec 1H and 31P
13C chemical shift (ppm)100110120130140150160
Dec 1H
Dec 1H and 31P
13C chemical shift (ppm)10152025303540
Dec 1H
Dec 1H and 31P
Electronic Supplementary Material (ESI) for CrystEngCommThis journal is © The Royal Society of Chemistry 2013

Figure S12. 13C{31P} REDOR NMR spectra recorded for phases 3 and 5.
Details on the acquisition conditions can be found in the experimental section of the article. Spectra
recorded with (red) and without (black) 31P recoupling pulses were compared. The difference
spectrum S (grey) allows identification of the C atoms closest to the P.
Ca(C4H9-PO3H)2
Ca1.5Na(C4H9-PO3)2
13C chemical shift (ppm)10152025303540
S
13C chemical shift (ppm)10152025303540
S
Electronic Supplementary Material (ESI) for CrystEngCommThis journal is © The Royal Society of Chemistry 2013

Figure S13. Natural abundance 43Ca MAS NMR spectra of compounds 1, 3, and 5.
Details on the acquisition conditions can be found in Table S3. Spectra were fitted at both fields
(dashed red line) to extract the 43Ca NMR parameters.
43Ca chemical shift (ppm)
-100-80-60-40-20020406080100
600 MHz
850 MHz
c/ Ca1.5Na(C4H9-PO3)2
-100-80-60-40-20020406080100
600 MHz
850 MHz
43Ca chemical shift (ppm)
a/ Ca(C6H5-PO3H)2
43Ca chemical shift (ppm)
-100-80-60-40-20020406080100
600 MHz
850 MHz
b/ Ca(C4H9-PO3H)2
iso = -14 3 ppm
CQ = 3.5 0.6 MHzQ = 0.4 0.3
iso = 0 4 ppm
CQ = 2.78 0.20 MHzQ = 0.6 0.3
Site 1:iso = 30.4 0.4 ppmCQ = 1.55 0.09 MHz
Q = 0.6 0.1
Site 2:iso = 2 2 ppm
CQ = 2.25 0.25 MHzQ = 0.75 0.20
Electronic Supplementary Material (ESI) for CrystEngCommThis journal is © The Royal Society of Chemistry 2013

Figure S14. 1H DUMBO NMR spectra of Ca-phosphonates 1 to 4, recorded at 14.1 T, at 10 kHz MAS.
Details on the acquisition conditions can be found in the experimental section of the manuscript.
Artifacts due to the sequence used are indicated by (*) symbols on the spectra.
024681012
1H chemical shift (ppm)
*
*
Ca(C4H9-PO3).H2O
Ca(C6H5-PO3).2H2O
Ca(C6H5-PO3H)2
Ca(C4H9-PO3H)2
P-OH
P-OH
H2O
H2O
Har
Har (+ H2O)
Hbu
Hbu
Electronic Supplementary Material (ESI) for CrystEngCommThis journal is © The Royal Society of Chemistry 2013

Figure S15. 31P{23Na} REDOR NMR study of 5. Comparison of 31P spectra recorded with (red) or
without (black) 23Na recoupling pulses.
The31P{23Na} REDOR NMR experiment was carried out on the “Ca1.5Na(C4H9-PO3)2” phase, on a Varian
VNMRS 600 MHz (14.1 T) spectrometer, using a 3.2 mm Varian T3 HXY MAS probe tuned to triple-
resonance mode and spinning at 10 kHz. 1H31P CP was first applied, with a 2.5 s 90° 1H excitation
pulse, followed by a ramped contact pulse of 2 ms. A 3.2 ms total dephasing time was applied, with 6
s rotor-synchronized 180° solid pulses on the 23Na. The 180° pulse on the 31P was 6 s. Spinal-64 1H
decoupling (100 kHz RF) was used during the dephasing and acquisition periods. 8 transients were
recorded, with a recycle delay of 16 s.
31P chemical shift (ppm)
18192021222324252627282930
Electronic Supplementary Material (ESI) for CrystEngCommThis journal is © The Royal Society of Chemistry 2013

Figure S16. Evidence of 3JP-C couplings on 13C NMR spectra of butylphosphonate phases 4 and 5.
CPMAS NMR spectra recorded at 14.1 T, spinning at 20 kHz MAS. Further details on the acquisition
conditions can be found in Table S2.
13C chemical shif t (ppm)
121416182022242628303234
3J(P-Cc)
3J(P-Cc)1J(P-Ca)
1J(P-Ca)
Ca(C4H9-PO3).H2O
Ca1.5Na(C4H9-PO3)2
Electronic Supplementary Material (ESI) for CrystEngCommThis journal is © The Royal Society of Chemistry 2013

Table S1. Experimental details for the acquisition of 31P NMR spectra.
Field MAS rate Pulse sequence D1 NS
Ca(C6H5-PO3H)2 9.4 T 9.4 T 9.4 T
14.1 T
20 kHz 1.58 kHz
Static 10 kHz
Single pulsea
Single pulsea
Hahn echoc
Single pulsed
450 sb
450 sb
450 sb
450 sb
8 16
184 4
Ca(C6H5-PO3).2H2O 9.4 T 9.4 T 9.4 T
14.1 T
20 kHz 1.57 kHz
Static 20 kHz
Single pulsea
Single pulsea
Hahn-echoc
CPe
340 sb
340 sb
340 sb
16 s
4 16
196 4
Ca(C4H9-PO3H)2 9.4 T 9.4 T 9.4 T
14.1 T
20 kHz 1.59 kHz
Static 2.45 kHz
Single pulsea
Single pulsea
Hahn echoc,f
Single pulse
d
850 sb
850 sb
850 sb
850 sb
4 12
184 4
Ca(C4H9-PO3).H2O 9.4 T 9.4 T 9.4 T
14.1 T
20 kHz 1.56 kHz
Static 20 kHz
Single pulsea
Single pulsea
Hahn echoc,g
CP
e
160 sb
160 sb
160 sb
16 s
24 12
272 4
Ca1.5Na(C4H9-PO3)2 9.4 T 14.1 T 14.1 T 14.1 T
1.58 kHz Static
2.70 kHz 20 kHz
Single pulsea
Hahn echoh,i
Single pulse
d
CPe
400 sb
60 s 400 s
b
16 s
8 1728
4 4
a Single pulse experiments were performed at 9.4 T using a 90° pulse of 5 μs on the
31P, and 100 kHz spinal-64
1H
decoupling during acquisition.
b The recycle delay used allowed a full relaxation of the
31P resonance.
c Static Hahn echo experiments were performed at 9.4 T using a 90° pulse of 5 μs on the
31P (180° pulse at 10 μs), an echo
delay of 40 μs, and CW 1H decoupling during acquisition (100 kHz RF).
d Single pulse experiments were performed at 14.1 T using a 90° pulse of 3.25 μs on the
31P, and 100 kHz spinal-64
1H
decoupling during acquisition.
e 1H
31P CPMAS experiments were performed at 14.1 T using a 2.5 μs
1H 90° excitation pulse, followed by a 2 ms ramped
contact pulse. Spinal-64 1H decoupling was applied during acquisition (100 kHz RF).
f Preferential orientation of the crystallites in the rotor hampered the simulation of this static spectrum.
g To avoid preferential orientation of the crystallites in the rotor, the powder was physically diluted in SiO2 before recording
the static spectrum.
h Static Hahn echo experiments were performed at 14.1 T using a 90° pulse of 3 μs on the
31P (180° pulse at 6 μs), an echo
delay of 100 μs, and CW 1H decoupling during acquisition (100 kHz RF).
i The static spectrum was difficult to simulate in this case, possibly due to (i) preferential orientation effects of the
crystallites, (ii) 23
Na-31
P dipolar couplings, and/or (iii) the choice of too short a recycle delay here.
Electronic Supplementary Material (ESI) for CrystEngCommThis journal is © The Royal Society of Chemistry 2013
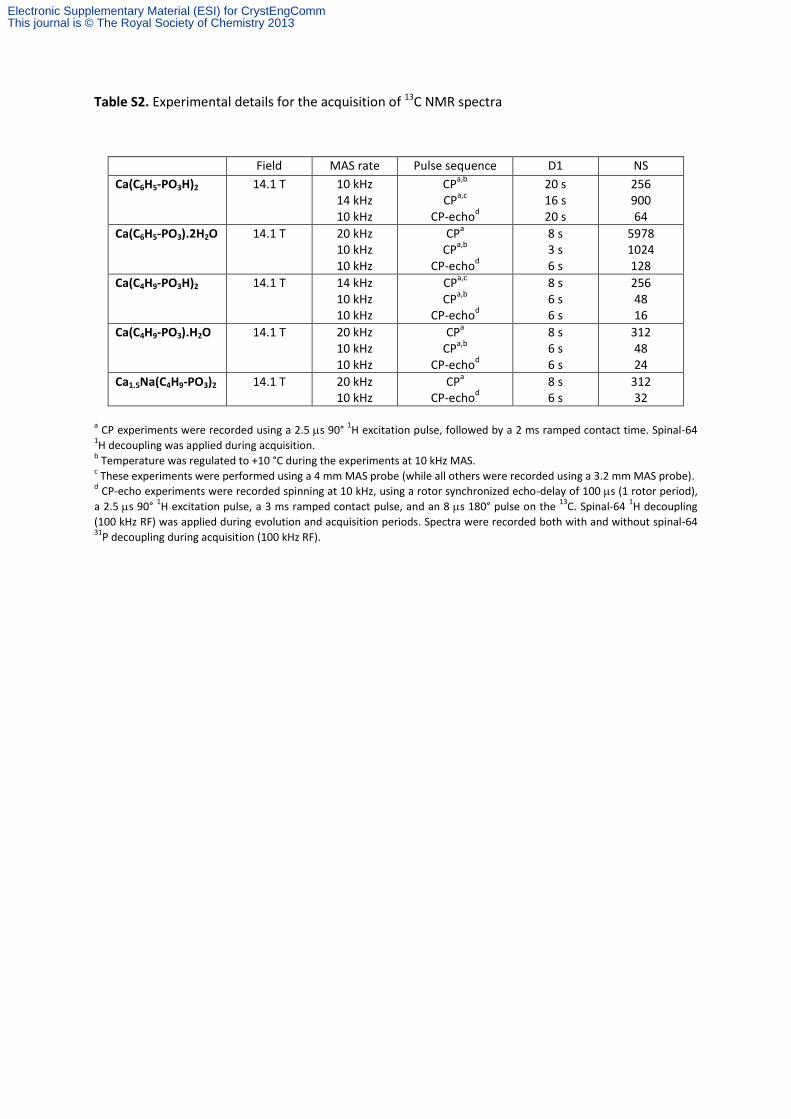
Table S2. Experimental details for the acquisition of 13C NMR spectra
Field MAS rate Pulse sequence D1 NS
Ca(C6H5-PO3H)2 14.1 T 10 kHz 14 kHz 10 kHz
CPa,b
CP
a,c
CP-echod
20 s 16 s 20 s
256 900 64
Ca(C6H5-PO3).2H2O 14.1 T 20 kHz 10 kHz 10 kHz
CPa
CPa,b
CP-echo
d
8 s 3 s 6 s
5978 1024 128
Ca(C4H9-PO3H)2 14.1 T 14 kHz 10 kHz 10 kHz
CPa,c
CP
a,b
CP-echod
8 s 6 s 6 s
256 48 16
Ca(C4H9-PO3).H2O 14.1 T 20 kHz 10 kHz 10 kHz
CPa
CPa,b
CP-echo
d
8 s 6 s 6 s
312 48 24
Ca1.5Na(C4H9-PO3)2 14.1 T 20 kHz 10 kHz
CPa
CP-echod
8 s 6 s
312 32
a CP experiments were recorded using a 2.5 s 90°
1H excitation pulse, followed by a 2 ms ramped contact time. Spinal-64
1H decoupling was applied during acquisition.
b Temperature was regulated to +10 °C during the experiments at 10 kHz MAS.
c These experiments were performed using a 4 mm MAS probe (while all others were recorded using a 3.2 mm MAS probe).
d CP-echo experiments were recorded spinning at 10 kHz, using a rotor synchronized echo-delay of 100 s (1 rotor period),
a 2.5 s 90° 1H excitation pulse, a 3 ms ramped contact pulse, and an 8 s 180° pulse on the
13C. Spinal-64
1H decoupling
(100 kHz RF) was applied during evolution and acquisition periods. Spectra were recorded both with and without spinal-64 31
P decoupling during acquisition (100 kHz RF).
Electronic Supplementary Material (ESI) for CrystEngCommThis journal is © The Royal Society of Chemistry 2013

Table S3. Experimental details for the acquisition of natural abundance 43Ca NMR spectra.
Field Probe rotor diameter
MAS rate Pulse sequence
a,b
D1 NS Total expt time
Ca(C6H5-PO3H)2 14.1 T 20.0 T
9.5 mm 7 mm
4 kHz 4 kHz
DFS-1pulse RAPT-1pulse
7.0 s 1.0 s
36000 47280
~70 h ~13 h
Ca(C6H5-PO3).2H2O 14.1 T 20.0 T
9.5 mm 7 mm
4 kHz 4 kHz
DFS-1pulse RAPT-1pulse
0.8 s 0.8 s
89660 32000
~20 h ~7 h
Ca(C4H9-PO3H)2 14.1 T 20.0 T
9.5 mm 4 mm
4 kHz 5 kHz
DFS-1pulse RAPT-1pulse
1.5 s 0.8 s
52700 140000
~22 h ~31 h
Ca(C4H9-PO3).H2O 14.1 T 20.0 T
9.5 mm 7 mm
4 kHz 4 kHz
DFS-1pulse RAPT-1pulse
0.8 s 0.8 s
209300 44000
~47 h ~10 h
Ca1.5Na(C4H9-PO3)2 14.1 T 20.0 T
9.5 mm 7 mm
4 kHz 4 kHz
DFS-1pulse RAPT-1pulse
0.8 s 0.8 s
103200 49000
~23 h ~11 h
a DFS-1pulse conditions: convergence sweep from 400 to 80 kHz (duration ~ 6 ms; RF ~ 8 kHz); enhancement
factor of ~2 (as tested on 43
Ca-labeled *CaHPO4).
b RAPT-1pulse conditions: set +X / –X 20 s Gaussian pulses with ~150 kHz radiofrequency offset (RF ~ 9 kHz);
enhancement factor ~2 (as tested on 43
Ca-labeled *CaHPO4).
Electronic Supplementary Material (ESI) for CrystEngCommThis journal is © The Royal Society of Chemistry 2013

Table S4. Parameters used for whole pattern fitting plots (LeBail method) of the synchrotron powder diffraction diagrams of Ca-phosphonate phases 1 to 4. Background was modeled manually.
(1) Ca(C6H5-PO3H)2
(2) Ca(C6H5-PO3).2H2O
(3) Ca(C4H9-PO3H)2
(4) Ca(C4H9-PO3).H2O
No. FullProf profile 7 (TCH-pV)* 7 (TCH-pV)* 5 (pV)* 5 (pV)*
U 0.00021 0.0699 0.0079 0.0321 V -0.00002 -0.0739 0 0 W 0.00006 0.0190 0.00321 0.00115 X 0.147 0.2406 Y 0.1115 Number of background pts 18 76 32 26
(G/L mixing param.) 0.528 0.524
Rp (%) 19.6 21.7 26.7 17.6 Rwp (%) 21.5 20.4 30.0 16.9 Rexp (%) 2.89 2.77 5.97 2.90
2 55.2 54.6 25.3 34.1
*TCH: Thompson Cox-Hastings; pV: pseudo-Voigt.
Spherical Harmonics coefficients for anisotropic size broadening for (1)
Y00 0.080 Y20 -0.096 Y22+ -0.184
Y22- 0.013 Y40 -0.267 Y42+ -0.206
Y42- 0.182 Y44+ 0.109 Y44- 0.324
Spherical Harmonics coefficients for anisotropic size broadening for (2)
Y00 -2.37 Y20 -1.79 Y22+ -1.22
Y22- -1.55 Y40 -0.29 Y42+ -0.66
Y42- 0.58 Y44+ -1.43 Y44- 1.01
Electronic Supplementary Material (ESI) for CrystEngCommThis journal is © The Royal Society of Chemistry 2013

Table S5. Fractional atomic coordinates of Ca-phosphonates 1, 2, 3 and 4 after relaxation of all
atomic positions.
Ca(C6H5-PO3H)2 (1)
Ca(C6H5-PO3).2H2O (2)
a = 31.4573 Å, b = 5.6432 Å, c = 7.7558 Å a =15.0432 Å, b =11.0379 Å, c = 5.7199 Å
= = 90°, = 102.2347°
= = = 90°, = 92.7490°
Atom x/a y/b z/c Atom x/a y/b z/c
C1 0.3806 0.1970 0.9934 C5 0.7470 0.5769 0.3483
C2 0.3506 0.0265 0.0231 C6 0.8040 0.6322 0.5178
C3 0.2915 0.2677 0.8655 C7 0.7831 0.5234 0.1522
C4 0.3212 0.4371 0.8345 C8 0.8955 0.6329 0.4920
C5 0.3062 0.0625 0.9599 C9 0.8749 0.5236 0.1272
C6 0.3656 0.4027 0.8988 C10 0.9311 0.5784 0.2969
Ca17 0.5000 0.6080 0.2500 Ca16 0.4737 0.1338 0.6734
H11 0.3619 0.8655 0.0947 H11 0.7768 0.6752 0.6697
H12 0.2568 0.2958 0.8166 H12 0.7388 0.4819 0.0195
H13 0.3102 0.5964 0.7596 H13 0.9393 0.6761 0.6236
H14 0.2832 0.9297 0.9847 H14 0.9017 0.4815 0.9738
H15 0.3888 0.5336 0.8737 H15 0.0027 0.5795 0.2784
H16 0.4468 0.1882 0.3880 H19 0.7902 0.2198 0.9630
O7 0.4637 0.3172 0.9822 H20 0.7400 0.1242 0.1069
O8 0.4479 0.2712 0.2723 H21 0.6363 0.2365 0.4393
O9 0.4484 0.8931 0.0848 H22 0.5938 0.1420 0.2610
P10 0.4381 0.1578 0.0796 O1 0.5816 0.5256 0.1628
O2 0.5959 0.6938 0.4726
Ca(C4H9-PO3H)2 (3)
O3 0.6154 0.4798 0.5973
a =5.628 Å, b =7.392 Å, c =16.742 Å
O17 0.7680 0.2042 0.1181
= 101.228°, = 87.673°, = 89.873°
O18 0.5795 0.2114 0.3647
Atom x/a y/b z/c P4 0.6287 0.5688 0.3931
C1 0.0473 0.6918 0.4148 C2 0.8645 0.6120 0.3532 Ca(C4H9-PO3).H2O (4)
C3 0.8631 0.7031 0.2785 a =15.5774 Å, b =6.7082 Å, c = 8.1004 Å
C4 0.6691 0.6223 0.2209 = = 90°, = 92.448° C9 0.4741 0.7953 0.5673 Atom x/a y/b z/c
C10 0.6509 0.8659 0.6326 C2 0.7204 0.2149 0.6231
C11 0.5980 0.7946 0.7112 C3 0.7878 0.0480 0.6360
C12 0.7555 0.8805 0.7806 C4 0.8762 0.1222 0.6980
Ca17 0.8642 0.2531 0.0024 C5 0.9402 0.9519 0.7261
H18 0.2285 0.6753 0.3876 Ca9 0.4566 0.1349 0.8161
H19 0.0423 0.6228 0.4671 H11 0.7184 0.2990 0.7390
H20 0.0162 0.8396 0.4380 H12 0.7374 0.3234 0.5288
H21 0.6866 0.6254 0.3834 H13 0.7936 0.9764 0.5149
H22 0.8969 0.4633 0.3328 H14 0.7669 0.9307 0.7199
H23 0.0377 0.6848 0.2464 H15 0.8696 0.2051 0.8139
H24 0.8345 0.8525 0.2981 H16 0.9011 0.2299 0.6094
H25 0.4936 0.6546 0.2514 H17 0.9523 0.8742 0.6101
Electronic Supplementary Material (ESI) for CrystEngCommThis journal is © The Royal Society of Chemistry 2013
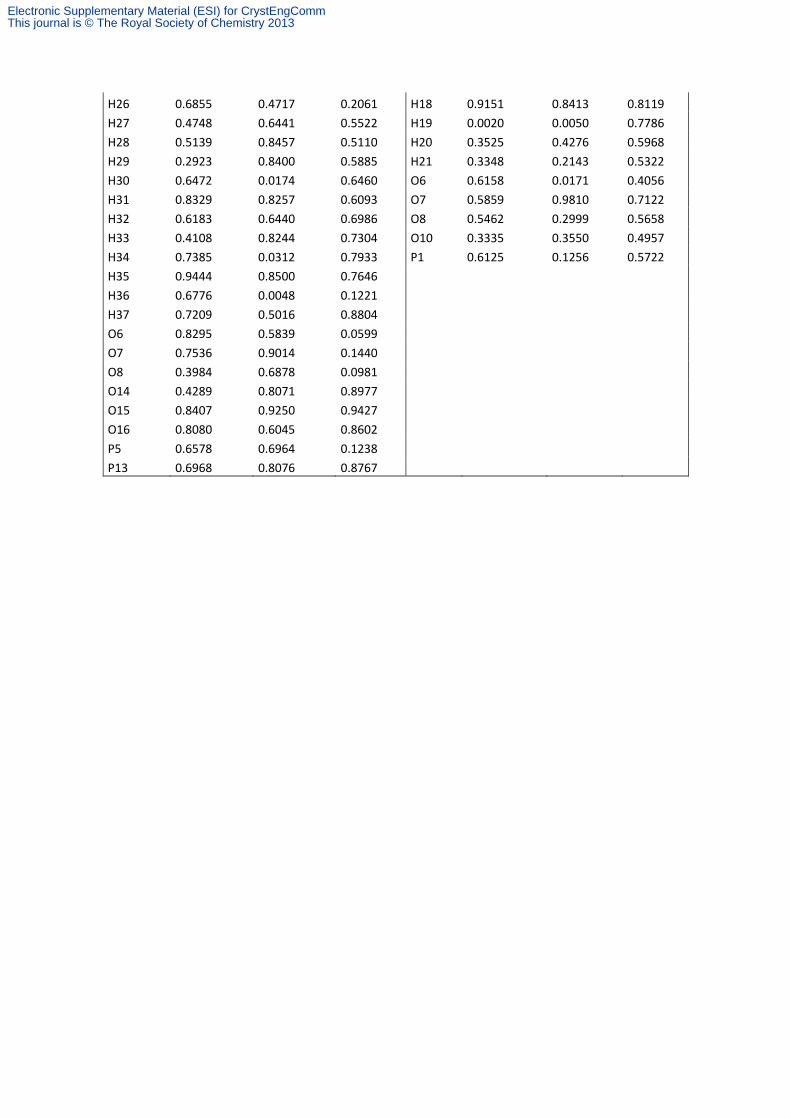
H26 0.6855 0.4717 0.2061 H18 0.9151 0.8413 0.8119
H27 0.4748 0.6441 0.5522 H19 0.0020 0.0050 0.7786
H28 0.5139 0.8457 0.5110 H20 0.3525 0.4276 0.5968
H29 0.2923 0.8400 0.5885 H21 0.3348 0.2143 0.5322
H30 0.6472 0.0174 0.6460 O6 0.6158 0.0171 0.4056
H31 0.8329 0.8257 0.6093 O7 0.5859 0.9810 0.7122
H32 0.6183 0.6440 0.6986 O8 0.5462 0.2999 0.5658
H33 0.4108 0.8244 0.7304 O10 0.3335 0.3550 0.4957
H34 0.7385 0.0312 0.7933 P1 0.6125 0.1256 0.5722
H35 0.9444 0.8500 0.7646 H36 0.6776 0.0048 0.1221 H37 0.7209 0.5016 0.8804 O6 0.8295 0.5839 0.0599 O7 0.7536 0.9014 0.1440 O8 0.3984 0.6878 0.0981 O14 0.4289 0.8071 0.8977 O15 0.8407 0.9250 0.9427 O16 0.8080 0.6045 0.8602 P5 0.6578 0.6964 0.1238 P13 0.6968 0.8076 0.8767
Electronic Supplementary Material (ESI) for CrystEngCommThis journal is © The Royal Society of Chemistry 2013

Table S6. Experimental and calculated 31P NMR parameters.
Structure Phosphonate Connectivity
a
δiso (ppm) ΔCS (ppm)e ηCS
e
Expb,c
Calcd
Expb,c
Calcd Exp
b,c Calc
d
Ca(C6H5-PO3H)2 (1Ca; 2Ca; 1Ca+1H) 10.1 ± 0.1 17.6 -83.8 ± 1.5 -92.0 0.93 ± 0.02 0.92
Ca(C6H5-PO3).2H2O (1Ca; 2Ca; 2Ca) 12.5 ± 0.1 21.3 63.9 ± 1.5 66.6 0.42 ± 0.02 0.51
Ca(C4H9-PO3H)2 Site 1 (P5) Site 2 (P13)
(1Ca; 2Ca; 1H) (1Ca; 2Ca; 1H)
25.3 ± 0.1 26.8 ± 0.1
34.6 38.5
51.4 ± 2.5 53.0 ± 2.5
57.1 59.0
0.92 ± 0.05 0.85 ± 0.05
0.96 0.84
Ca(C4H9-PO3).H2O (1Ca; 2Ca; 3Ca) 28.8 ± 0.1 40.2 37.3 ± 1.5 38.6 0.59 ± 0.05 0.46
Ca1.5Na(C4H9-PO3)2 Site 1 Site 2
23.1 ± 0.1 25.8 ± 0.1
47.5 ± 1.5 41.5 ± 1.5
0.64 ± 0.05 0.53 ± 0.03
Ca(CH3-PO3).H2O f (1Ca; 2Ca; 3Ca) 38.7 39.0 0.53
Ca(C6H13-PO3H)2 f Site 1 (P1)
Site 2 (P2) (1Ca; 2Ca; 1H) (1Ca; 2Ca; 1H)
37.1
39.7 54.9
56.5 0.88
0.80
Ca-EDTMP g
Site 1 (P1) Site 2 (P2)
(1Ca, 1H, /) (1Ca, 1H, /)
16.1 16.7
98.9 -120.8
0.83 0.76
Ca-CEPA h
(1Ca, 1Ca, 2Ca) 33.4 52.7 0.62
Ca3(HPAA)2(H2O)14 i (1Ca, /, /) 27.0 74.0 0.15
Ca-PMIDA j
(1Ca, 1Ca, 1H) 9.8 -91.5 0.88
a Connectivity determined using d(Ca…O) = 3 Å as a cut-off.
b Experimental values were obtained at ~25°C.
c Error bars on the experimental values were determined from the fitting of 2 independent
31P NMR spectra (either 2 MAS
recorded at different speeds and magnetic field, or 1 MAS and 1 static).
d NMR parameters were calculated on structural models after relaxation of all atomic positions.
e The principal values 11, 22 and 33 are sorted such as |33 - iso| |11 - iso| |22 - iso|. Then, iso = 1/3(11 + 22 + 33),
CS = 33 - iso, and CS = (22 - 11)/(33 - iso).
f Mallouk et al, Inorg. Chem., 1990, 29, 2112; (CSD SEZVOI and SEZVUO).
g Demadis et al, Cryst. Growth Design, 2009, 9, 1250; (CCDC 605561).
h Demadis et al, Appl. Mater. Interf., 2009, 1, 35; (CCDC 607002).
i Demadis et al, Appl. Mater. Interf., 2010, 2, 1814; (CCDC 766599).
j Stavgianoudaki et al, Cryst. Eng. Comm., 2012, 14, 5385; (CCDC 870777).
Electronic Supplementary Material (ESI) for CrystEngCommThis journal is © The Royal Society of Chemistry 2013

Table S7. Experimental and calculated 13C isotropic chemical shifts.
C typea C number
b δiso (ppm) JP-C (Hz)
Expc,d
Calcd Exp
Ca(C6H5-PO3H)2
Ci Co Co’ Cm Cm’ Cp
C1 C6 C2 C4 C5 C3
135.2 134.0 131.3
~127.9e
129.3e
139.0 137.0 134.4 131.1 130.5 129.6
1JP-C = 195 10
f
Ca(C6H5-PO3).2H2O
Ci Co Co’ Cm Cm’ Cp
C5 C6 C7 C8 C9 C10
138.4e
127 to 133
129.8e
141.2 134.6 134.8 132.6 131.5 134.8
1JP-C = 172 5
Ca(C4H9-PO3H)2
Ca Cb Cc Cd Ca‘ Cb‘ Cc‘ Cd‘
C4
C3
C2 C1
C12
C11
C10
C9
31.9g
27.9g
~27.9g
16.3g
30.1h
28.7h
~27.9h
15.9h
31.5 27.2 26.6 14.4 29.3 26.9 25.8 14.2
1JP-C = 140 2
1JP-C = 140 2
Ca(C4H9-PO3).H2O
Ca Cb Cc Cd
C2
C3
C4 C5
30.0e
28.2e
26.2e
15.2e
29.7 26.3 25.5 12.5
1JP-C = 137 2
3JP-C = 13 2
i
Ca1.5Na(C4H9-PO3)2
Ca Cb Cc Cd Ca‘ Cb‘ Cc‘ Cd‘
/ 31.5j
29.1j
26.2j
15.2j
29.6k
27.7k
25.1k
14.0k
/ 1JP-C = 134 2
3JP-C = 15 2
i
1JP-C = 134 2
3JP-C = 19 2
i
Ca(CH3-PO3).H2O l
C C1 / 14.6
Ca(C6H13-PO3H)2 l
Ca Cb Cc Cd
Ce
Cf Ca Cb Cc Cd Ce
Cf
C1 C2 C3 C4 C5 C6 C7 C8 C9 C10 C11 C12
/ 32.5 26.1 37.1 35.5 27.3 14.6 29.5 27.2 35.9 36.0 26.0 14.1
Electronic Supplementary Material (ESI) for CrystEngCommThis journal is © The Royal Society of Chemistry 2013

a The C type designates the positioning of the C atom along the phosphonate chain, as depicted on the figures on the left.
b The C number provides the numbering of the C atoms in the corresponding .cif file.
c The experimental
13C chemical shifts correspond to spectra recorded +10 °C. Maximum error bars on experimental
13C
chemical shifts: 0.3 ppm for phenylphosphonates; 0.2 ppm for butylphosphonates.
d Calculated values correspond to structural models after relaxation of all atomic positions.
e Assignment proposed on the basis of
13C{
31P} REDOR experiments.
f The
1JP-C we measured in the case of the related Sr(C6H5-PO3H)2 phase is also ~195 Hz (data no shown).
g Butyl chain attached to the P at iso(
31P) = 25.3 ppm; assignment of the peaks on the basis of
13C{
31P} REDOR and
1H-
13C-
31P
double-CP experiments.
h Butyl chain attached to the P at iso(
31P) = 26.8 ppm; assignment of the peaks on the basis of
13C{
31P} REDOR and
1H-
13C-
31P
double-CP experiments.
i
3JP-C values were determined from CPMAS spectra recorded at 14.1 T and spinning at 20 kHz MAS (with no temperature
regulation). (see figure S16)
j Butyl chain attached to the P at iso(
31P) = 23.1 ppm; assignment of the peaks on the basis of
13C{
31P} REDOR and
1H-
13C-
31P
double-CP experiments.
k Butyl chain attached to the P at iso(
31P) = 25.8 ppm; assignment of the peaks on the basis of REDOR and
1H-
13C-
31P double-
CP experiments.
l Mallouk et al, Inorg. Chem., 1990, 29, 2112; (CSD SEZVOI and SEZVUO).
Electronic Supplementary Material (ESI) for CrystEngCommThis journal is © The Royal Society of Chemistry 2013

Table S8. Experimental and calculated 43Ca NMR parameters.
δiso (ppm) CQ (MHz) ηQ
Expa,b
Calcc,d
Expa,b,e
Calcc Exp
a,b Calc
c
Ca(C6H5-PO3H)2 -14 ± 4 -20.0 3.5 ± 0.6 2.3 0.4 ± 0.3 0.5
Ca(C6H5-PO3).2H2O 17.9 ± 0.4 18.2 3.09 ± 0.07 2.1 0.75 ± 0.10 0.7
Ca(C4H9-PO3H)2 0 ± 4 -5.1 2.78 ± 0.20 1.6 0.6 ± 0.3 0.9
Ca(C4H9-PO3).H2O 17 ± 1 16.9 2.49 ± 0.02 1.4 0.5 ± 0.1 0.5
Ca1.5Na(C4H9-PO3)2 Site 1 Site 2
30.4 ± 0.4 2 ± 2
1.55 ± 0.09 2.25 ± 0.25
0.6 ± 0.1 0.75 ± 0.20
Ca(CH3-PO3).H2O f 21.8 1.5 0.6
Ca(C6H13-PO3H)2 f
2.2 1.9 0.8
Ca-EDTMP g
47.0 1.6 0.7
Ca-CEPA h
12.4 0.7 0.3
Ca3(HPAA)2(H2O)14 I Site 1
Site 2 31.9
2.7 2.2
-1.0 0.6
0.7
Ca-PMIDA j 18.1 2.0 0.7
a Experimental values were obtained at ~25°C.
b Error bars were determined from simultaneous simulations of the
43Ca NMR spectra recorded at 14.1 and 20.0 T.
c NMR parameters were calculated on structural models after relaxation of all atomic positions.
d The error on calculated
43Ca isotropic chemical shifts is generally estimated to 5 ppm.
e The sign of CQ is not measured experimentally.
f Mallouk et al, Inorg. Chem., 1990, 29, 2112 ; (CSD SEZVOI and SEZVUO).
g Demadis et al, Cryst. Growth Design, 2009, 9, 1250 ; (CCDC 605561).
h Demadis et al, Appl. Mater. Interf., 2009, 1, 35 ; (CCDC 607002).
i Demadis et al, Appl. Mater. Interf., 2010, 2, 1814 ; (CCDC 766599).
j Stavgianoudaki et al, Cryst. Eng. Comm., 2012, 14, 5385 ; (CCDC 870777).
Electronic Supplementary Material (ESI) for CrystEngCommThis journal is © The Royal Society of Chemistry 2013

Table S9. Experimental and calculated 1H isotropic chemical shifts.
H type
a
H number
b
δiso (ppm)
Expc Calc
d
Ca(C6H5-PO3H)2
O-H Har
H16
H11
H12
H13
H14
H15
~12.2
5.0 to 8.4
13.2 5.5 7.0 5.2 6.2 7.4
Ca(C6H5-PO3).2H2O
O-H
Har
H19
H20
H21
H22
H11
H12
H13
H14
H15
~2.6 (1.6 to 3.4)
5.4 to 8.0
2.2 3.0 3.7 8.8 6.2 7.8 6.4 7.2 7.1
Ca(C4H9-PO3H)2
O-H
Hbu
H36
H37
H18 H19
H20
H21
H22
H23
H24
H25
H26
H27
H28 H29 H30 H31 H32 H33 H34 H35
~10.6
0.7 to 2.8
11.7 11.3 0.8 1.2 0.7 1.3 1.1 1.6 1.2 1.7 2.3 0.8 1.2 0.8 1.1 1.3 1.3 1.4 2.1 1.9
Ca(C4H9-PO3).H2O
O-H
Hbu
H20
H21
H11
H12
H13
H14
H15
H16
H17
H18 H19
~5.4
0.5 to 2.6
6.2 5.7 2.1 2.0 1.3 1.2 0.9 1.2 0.8 0.8 1.3
Ca1.5Na(C4H9-PO3)2 Hbu / 0.4 to 2.1 /
Ca(CH3-PO3).H2O e O-H
Hme
H4 H5 H1 H2 H3
/ 6.2 5.4 1.4 2.0 2.2
Electronic Supplementary Material (ESI) for CrystEngCommThis journal is © The Royal Society of Chemistry 2013

Ca(C6H13-PO3H)2 e
O-H
Hhex
H1 H2 H3 H4 H5 H6 H7 H8 H9 H10 H11 H12 H13 H14 H15 H16 H17 H18 H19 H20
H21
H22
H23
H24
H25
H26
H27
H28
/ 13.4 12.5 1.8 2.6 1.9 1.2 1.3 1.3 1.4 1.1 1.5 1.3 1.0 0.9 1.3 2.1 2.4 1.4 1.6 1.1 1.5 1.3 1.3 1.4 1.3 1.3 1.0 0.9
a The H type differentiates H atoms bound to a C atom of the organic chain from those bound to an O atom (belonging to
a water molecule or phosphonate).
b The H number provides the numbering of the H atoms in the corresponding .cif file.
c Experimental values were obtained at ~25°C.
d NMR parameters were calculated on structural models after relaxation of all atomic positions.
e Mallouk et al, Inorg. Chem., 1990, 29, 2112 ; (CSD SEZVOI and SEZVUO).
Electronic Supplementary Material (ESI) for CrystEngCommThis journal is © The Royal Society of Chemistry 2013