structural properties and out-of-plane stability of roller ... · people interested in the ......
TRANSCRIPT

Structural properties and out-of-plane stability of rollerbent steel archesSpoorenberg, R.C.
DOI:10.6100/IR716581
Published: 01/01/2011
Document VersionPublisher’s PDF, also known as Version of Record (includes final page, issue and volume numbers)
Please check the document version of this publication:
• A submitted manuscript is the author's version of the article upon submission and before peer-review. There can be important differencesbetween the submitted version and the official published version of record. People interested in the research are advised to contact theauthor for the final version of the publication, or visit the DOI to the publisher's website.• The final author version and the galley proof are versions of the publication after peer review.• The final published version features the final layout of the paper including the volume, issue and page numbers.
Link to publication
Citation for published version (APA):Spoorenberg, R. C. (2011). Structural properties and out-of-plane stability of roller bent steel arches Eindhoven:Technische Universiteit Eindhoven DOI: 10.6100/IR716581
General rightsCopyright and moral rights for the publications made accessible in the public portal are retained by the authors and/or other copyright ownersand it is a condition of accessing publications that users recognise and abide by the legal requirements associated with these rights.
• Users may download and print one copy of any publication from the public portal for the purpose of private study or research. • You may not further distribute the material or use it for any profit-making activity or commercial gain • You may freely distribute the URL identifying the publication in the public portal ?
Take down policyIf you believe that this document breaches copyright please contact us providing details, and we will remove access to the work immediatelyand investigate your claim.
Download date: 23. Jun. 2018

Structural properties and out-of-plane stability of roller bent steel arches


Structural properties and out-of-plane stability of roller bent steel arches
PROEFSCHRIFT
ter verkrijging van de graad van doctor aan de
Technische Universiteit Eindhoven, op gezag van de
rector magnificus, prof.dr.ir. C.J. van Duijn, voor een
commissie aangewezen door het College voor
Promoties in het openbaar te verdedigen
op dinsdag 13 september 2011 om 16.00 uur
door
Roeland Christiaan Spoorenberg
geboren te Nijmegen
Dit proefschrift is goedgekeurd door de promotoren:
prof.ir. H.H. Snijder
en
prof.dr. D. Beg
Copromotor:
dr.ir. J.C.D. Hoenderkamp

Samenstelling van de Promotiecommissie:
prof.ir. E.S.M. Nelissen (voorzitter) Technische Universiteit Eindhoven
prof.ir. H.H. Snijder Technische Universiteit Eindhoven
prof.dr. D. Beg University of Ljubljana
dr.ir. J.C.D. Hoenderkamp Technische Universiteit Eindhoven
prof.ir. F. Soetens Technische Universiteit Eindhoven
prof.dr.ir. L.J. Sluys Technische Universiteit Delft
prof.dr.ir. Ph. Van Bogaert Universiteit Gent
dr.ir. J. Maljaars TNO
ISBN 978-90-77172-76-6
First printing July 2011
Keywords: Arch, Out-of-plane stability, Roller bending process, Residual stresses, Mechanical
properties, Finite element analyses.
This thesis was prepared in MS-Word by the author and printed by Ipskamp Drukkers B.V.
Cover design: Roel Spoorenberg
Copyright ©2011 by R.C. Spoorenberg, Eindhoven, the Netherlands
All rights reserved. No part of this publication may be reproduced, stored in a retrieval system, or
transmitted in any form or by any means, electronic, mechanical, photocopying, recording or
otherwise, without prior written permission of the copyright holder.

This research was carried out under the project number MC1.06262 in the
framework of the Research Program of the Materials innovation institute (M2i)
(www.m2i.nl)

Summary vii
Summary
Structural properties and out-of-plane stability of roller bent steel arches
In contemporary architecture the use of steel arches has seen a significant increase. They are
applied in buildings and large span bridges, combining structural design with architectural merits.
For arches lacking lateral support (or freestanding arches) the out-of-plane structural stability
behavior is the decisive design criterion. However, suitable methods or design rules to assess the
out-of-plane structural stability resistance of arches are lacking and the collapse behavior is often
unknown. Nowadays engineers have to perform laborious calculations which can lead either to
conservative or nonconservative arch designs.
This Ph.D. project is aimed at studying the out-of-plane structural stability behavior of steel
arches, and developing design rules for these arches. The out-of-plane structural stability
behavior was studied by means of geometrical and material non-linear finite element analyses
including structural imperfections with ANSYS v. 11.0. The investigation was confined to wide
flange circular freestanding arches which are subjected to in-plane vertical loads and
manufactured by the roller bending process. The roller bending process is a manufacturing
technique by which steel members are bent at ambient temperature into circular arches. It was
expected that the residual stresses and mechanical properties (e.g. yield stress, ultimate tensile
stress) are altered due to roller bending. Since the alteration of residual stresses and mechanical
properties (imperfections) can affect the out-of-plane structural stability of freestanding steel
arches, the influence of the roller bending process was studied first. Residual stress
measurements and tensile tests were conducted on both straight and roller bent members to assess
the influence of roller bending. In addition to the experiments, finite element simulations of the
roller bending process were performed in the ANSYS v. 11.0 environment to estimate the
residual stress distribution in the arches. Good agreement between the experimentally and
numerically obtained residual stresses in roller bent arches was observed.
Based on the experimental and numerical studies of the imperfections in roller bent arches a
residual stress model and distribution of mechanical properties across the steel bent section were
proposed which serve as the initial state of a roller bent arch when assessing its structural
performance by means of non-linear finite element simulations. Numerical analyses showed that
the residual stresses in roller bent arches have a minor influence on the load carrying capacity.
However, the alterations of the mechanical properties can result in a significant reduction of the
arch strength.

viii Structural properties and out-of-plane stability of roller bent steel arches
The existing column curve formulations as given in EC3 were adapted to include out-of-plane
buckling of arches by altering the form of the imperfection parameter. The column curves can
give an accurate prediction of the out-of-plane buckling load provided an appropriate
imperfection parameter is selected and the non-dimensional slenderness is known. Based on
numerous finite element calculations an imperfection parameter curve was derived which was
substituted into the column curve formulation rendering a column curve for roller bent arches
failing by out-of-plane buckling. Finite element results showed that multiple column curves were
necessary to capture the out-of-plane buckling response of arches for various load cases and steel
grades. The column curves require the determination of the non-dimensional slenderness
represented by the in-plane plastic capacity and out-of-plane elastic buckling load. Since any
closed form equations are lacking to approximate these buckling parameters finite element
techniques were adopted. For future research it is recommended that closed-form solutions or
design graphs should be derived with mechanical models to obtain the elastic-plastic buckling
load of freestanding roller bent arches without using finite element analyses.

Samenvatting ix
Samenvatting
Structural properties and out-of-plane stability of roller bent steel arches
Het gebruik van stalen bogen in de hedendaagse architectuur heeft een enorme vlucht genomen.
Stalen bogen worden vooral toegepast in gebouwen en bruggen met grote overspanningen,
waarin de constructieve meerwaarde van de stalen boog wordt gecombineerd met de
architectonische verschijningsvorm. Voor bogen die geen zijdelingse steunen bezitten is knik uit
het vlak het belangrijkste ontwerpcriterium. Geschikte methoden of rekenregels voor het bepalen
van de kniklast uit het vlak zijn nog niet beschikbaar voor ontwerpende ingenieurs en het
bezwijkgedrag van deze bogen is vaak onbekend.
Dit promotieonderzoek is gericht op het bestuderen van knik van stalen bogen uit het vlak en het
ontwikkelen van rekenregels voor deze bogen. Geometrische en materiaal niet-lineaire
imperfecte analyses met behulp van het commercieel beschikbare eindige elementen pakket
ANSYS v. 11.0 werden uitgevoerd voor het bestuderen van het knikgedrag van deze bogen. Het
onderzoeksgebied was beperkt tot cirkelvormige vrijstaande bogen, onderworpen aan verticale
belastingen in het vlak van de boog. De bogen werden gefabriceerd uit rechte breedflensprofielen
door middel van profielbuigen, een fabricageproces dat plaatsvindt bij kamertemperatuur.
Het lag in de lijn der verwachting dat de restspanningen en mechanische eigenschappen
(vloeispanning, treksterkte, etc.) worden beïnvloed door het profielbuigen. Omdat deze
verandering weer van invloed kan zijn op de stabiliteit van vrijstaande bogen werd de invloed
van het profielbuigen eerst bestudeerd. Restspanningen en trekproeven werden uitgevoerd op
rechte en gebogen profielen om de imperfecties ten gevolge van het profielbuigen vast te stellen.
De restspanningen werden daarnaast ook bepaald door middel van eindige elementen
berekeningen met het pakket ANSYS v. 11.0. Goede overeenkomst werd gevonden tussen
experimenteel en numeriek bepaalde restspanningen. Op basis van het experimentele en
numerieke werk van de imperfecties werden een restspanningsmodel en verdelingsmodel van de
mechanische eigenschappen gesuggereerd, die dienen voor de eindige-elementen-berekeningen
voor de zijdelingse stabiliteit van bogen. Eindige-elementen-berekeningen lieten zien dat de
restspanningen in gebogen profielen maar weinig invloed hebben op het stabiliteitsgedrag uit het
vlak van stalen bogen. De mechanische eigenschappen in gebogen profielen hebben een
duidelijke invloed op het knikgedrag en de bijbehorende kniklast.

x Structural properties and out-of-plane stability of roller bent steel arches
De bestaande knikkrommen van EC3 werden aangepast voor het knikgedrag uit het vlak van
bogen door de imperfectieparameter te veranderen. Knikkrommen kunnen een goede benadering
van de elasto-plastische kniklast geven wanneer een goede imperfectieparameter is geselecteerd
en de slankheid bekend is. Op basis van een groot aantal eindige-elementen-berekeningen werd
een imperfectieparameterkromme afgeleid die in de huidige knikkrommen werd gesubstitueerd
om tot een knikromme te komen voor bogen. Op basis van de eindige-elementen-berekeningen
zijn meerdere knikkrommen voorgesteld om een nauwkeurige bepaling van de kniklast uit het
vlak mogelijk te maken. De slankheid, gevormd door de plastische capaciteit in het vlak en de
elastische kniklast uit het vlak, is nodig voor het bepalen van de elasto-plastische kniklast.
Vandaag de dag zijn eenvoudige formules voor het bepalen van deze parameters niet aanwezig,
waardoor eindige elementen analyses nodig zijn voor het bepalen van de slankheid. Voor
vervolgonderzoek is daarom aanbevolen om eenvoudige formules af te leiden om de slankheid
van vrijstaande bogen te bepalen, waardoor de kniklast van bogen kan worden bepaald zonder
het gebruik van eindige-elementen-analyses.

Preface xi
Preface This thesis is in the first place devoted to God in heaven, who is forgiving, tenderhearted and
beyond imagination. Without Him nothing would have been possible in the first place. All glory
to Him, forever and ever.
I would like to express my sincere appreciation to my supervisors in Eindhoven: Prof. Snijder
and Dr. Hoenderkamp, for the pleasant and successful period of research during the last 4 years.
Their guidance and support has proven to be essential. My second supervisor, Prof. Beg from the
University of Ljubljana is highly acknowledged for supplying me abundant information about
residual stress measurements during the initial stage of the research and later carefully reading
the manuscript of my thesis. I would like to thank the members of the doctoral committee, Prof.
Sluys, Prof. Soetens, Prof. van Bogaert and Dr. Maljaars, for reviewing the manuscript and their
suggestions for improvements
Dr. Monique Bakker was my co-supervisor during the initial stage of my Ph.D. and provided me
with great help. Although she only supervised my Ph.D. from May 2007 until the summer of
2009, her input was of great importance for the later phases.
I like to thank Theo van de Loo and Eric Wijen of the laboratory of the group of Structural
Design and Construction Technology at Eindhoven University of Technology. The residual stress
measurements and tensile tests would have been impossible without their help. They assembled
the measurement equipment and arranged test set-up and can be largely credited for the
successful experimental results. Hans Lamers and Martien Ceelen ordered the strain gauges and
helped me with the measurement planning. Harrie de Laat and Mariële Dirks – Smit of the GTD
(Gemeenschappelijke Technische Dienst) are acknowledged for removing the test coupons from
the steel members with the Electric Discharging Machining (EDM) technique and allowing me to
conduct several residual stress measurements in their production hall using the EDM technique in
the autumn of 2008.
The steel members for the experiments were delivered by Deltastaal BV and bent by Kersten
Europe BV free of charge, for which I am thankful. Special thanks to Bart Simonse of Kersten
Europe BV who gave me extra information about the roller bending process.
I would like to express my gratitude for the (former) MSc-undergraduates Paulien Hanckmann,
Maartje Dijk, Eeuwe Bloemberg, Michael van Telgen, Linh Sa Lê and Rianne Luimes who
helped me during the first 1.5 year of my Ph.D. by working on various research topics.
The help of Dr. Leroy Gardner of Imperial College in London during my research is greatly
appreciated. Prof. F.M. Mazzolani of the University of Naples is acknowledged for sending his
residual stress measurement reports. Dr. Dagowin La Poutré, whom I met on the Eurosteel
Conference in Graz, Austria in September 2008, provided extensive information about his Ph.D.
research on arch buckling.
I would like to acknowledge my (former) Ph.D. colleagues at the Department of Architecture,
Building and Planning - unit of Structural Design in Eindhoven: Johan Maljaars, Ernst Klamer,
Natalia Kutanova, Paul Teeuwen, Edwin Huveners, Dennis Schoenmakers, Frank Huijben, Lex
van der Meer, Sander Zegers, Sarmediran Silitonga, Ronald van der Meulen and Juan Manuel
Davila Delgado for the pleasant working atmosphere, great help and advice. I like to thank the
xii Structural properties and out-of-plane stability of roller bent steel arches
secretary of the unit of structural design and design systems for their support and help throughout
my Ph.D: Bianca Magielse, Marlyn Aretz, Litania van de Venne and Nathalie Rombley.
My research was partly funded by the Materials innovations institute (M2i) in Delft. Although I
was stationed in Eindhoven and was not able to visit M2i that frequently, I would like to
acknowledge the complete staff of M2i in Delft for their support and in particular: Alice Sosef,
Monica Reulink, Gitty Bouman, Pia Legerstee, Margo Poelman-van Os and Irina Bruckner.
The initiative for research on arch buckling was made by the Dutch organization for
constructional steelwork: Bouwen met Staal and the Dutch federation for steel work:
Staalfederatie Nederland. I was given the ample opportunity to give presentations for the
technical committee of Bouwen met Staal „BmS/TC8‟ about the Ph.D. process and research
results. The complete committee of „TC8‟ is greatly acknowledged for their remarks and
suggestions during all presentations. I also had frequently contact with my friends from college
who gave me useful advice during my research. I like to mention Wouter ten Napel, Rick Bruins,
Caspar Breman, Wim de Groot and Inge Schouwenaars.
The extensive football matches during my whole Ph.D. proved to be invaluable. It is for me a
great pleasure to thank my friends of the football squad of SV Orion 7 Nijmegen (and later SV
Orion 8): Sweder Scholtz, Remco van Rooijen, Jimmy Knubben, Joost Rooijakkers, Philip
Mendels, Timo Brits, Tijn Frik, Joris van Halder, Wouter Schoot, Jorn van Dorst, Daan
Sutmuller, Joep Rooijakkers, Jochem van Halen, Michel Freriks, Rens Zwakenberg, Gijs Graste,
Tom Frenken, Thijs Smarius, Rikkert Heydendael, Marc Hesselink, Stijn Vissers and Arjan Zoet
for the good times on almost every Saturday! In addition I would like to thank my friends from
the Republic of Moldova for their hospitality and the great times in the summers of 2008, 2009
and during the winter of 2009: Rita Postica, Irina Postica, Cris Petrimari, Natasha Groza and the
Dutch volunteers Dirk Willem Klos and Welmoed van der Veen. The weekly fitness courses
together my friends in Eindhoven: Jop Courage, Robbert Lieven, Eeuwe Bloemberg and Wouter
Schoot gave me a good insight in the world of iron and motivation next to the world of steel.
I consider myself lucky since both of my grandma‟s are living in (the neighborhood of)
Eindhoven and I enjoyed visiting them during my research. Also my aunt Stella, my uncle Rob
and their daughters are acknowledged for the pleasant moments in the last 4.5 years.
I would like to acknowledge the great support of my parents, Cees and Marjon Spoorenberg, and
my twin brother Bram. Thank you very much for the necessary support and great laughter. I owe
a great debt to my girlfriend Yuzhong Lin. She made the last year of my Ph.D. very comforting
for me. Your support throughout the final stages of my Ph.D. was priceless. Thank you for the
nice times thus far: boat trip in Giethoorn, train travel in Ireland, and so forth. The trip to the
People‟s Republic of China and visiting your parents and family was superb! I hope we can have
great times for the nearby future and beyond as well!
Roel Spoorenberg
Eindhoven, July, 2011

Nomenclature xiii
Nomenclature
Abbreviation Unit
Latin capitals
A Section area [mm2]
E Young‟s modulus [N/mm2]
E0.2 Modulus of elasticity at 0.2 % proof stress [N/mm2]
It Torsional moment of inertia [mm4]
Iw Warping moment of inertia [mm6]
Iy Major moment of inertia [mm4]
Iz Minor moment of inertia [mm4]
G Shear modulus [N/mm2]
F Concentrated force [N]
L Span of arch [m]
M Bending moment [Nm]
R Arch radius [m]
S Arch length [m]
Wpl plastic section modulus [mm3]
Latin lower case
b width of section [mm]
f Rise of arch [mm]
h height of section [mm]
n hardening exponent [-]
m hardening exponent [-]
q Uniformly distributed load [N/m]
tf flange thickness [mm]
tw web thickness [mm]
fp proportional limit (0.01 % offset proof stress) [N/mm2]
fy yield stress (0.2 % offset proof stress) [N/mm2]
ft ultimate tensile stress [N/mm2]
u,v,w displacements in x,y,z respectively [mm]
x,y,z coordinates [mm]
Subscripts
s straight
r roller bent
imp geometric imperfection
perm permanent deformation

xiv Structural properties and out-of-plane stability of roller bent steel arches
Greek lower case
α shape factor / subtended angle / imperfection factor / [-] / [º] / [-] /
load factor [N]/[N/m]/[Nm]
αcr critical load amplifier [N]/[N/m]/[Nm]
αpl plastic collapse load amplifier [N]/[N/m]/[Nm]
αult ultimate load amplifier [N]/[N/m]/[Nm]
γ half of subtended angle [º]
ε0.01 strain at proportional limit: fp/E + 0.0001 [-]
ε0.2 strain at 0.2 % proof stress: fy/E + 0.002 [-]
εy yield strain: fy/E [-]
εt strain at ultimate tensile stress [-]
εu strain at fracture [-]
δ,ε,ζ rotations about x,y,z-axis respectively [º]
ε imperfection parameter [-]
non-dimensional slenderness [-]
0 plateau length column curve [-]
ζ stress [N/mm2]
ζrc compressive residual stress [N/mm2]
ζrt tensile residual stress [N/mm2]
ζfrc compressive residual stress in flanges [N/mm2]
ζfrt tensile residual stress in flanges [N/mm2]
ζwrc compressive residual stress in web [N/mm2]
ζwrt tensile residual stress in web [N/mm2]
ϕ variable angle [º]
χ reduction factor [-]
Greek capital
Φ column curve variable [-]

Contents
SUMMARY ................................................................................................................... VII
SAMENVATTING .......................................................................................................... IX
PREFACE ...................................................................................................................... XI
NOMENCLATURE ...................................................................................................... XIII
1 INTRODUCTION ................................................................................................ 1
1.1 Arches ................................................................................................................ 1 1.1.1 Application ..................................................................................................... 1 1.1.2 Types of arches .............................................................................................. 3 1.1.3 Scope .............................................................................................................. 6
1.2 Stability ............................................................................................................. 6 1.2.1 Description ..................................................................................................... 6 1.2.2 Stability and Stability analyses ...................................................................... 8
1.3 Roller bending process ................................................................................... 10
1.4 Problem statement and objectives................................................................. 10
1.5 Methodology and outline of thesis ................................................................. 11
2 LITERATURE STUDY ON ARCH BUCKLING ................................................ 13
2.1 Introduction .................................................................................................... 13
2.2 In-plane plastic collapse load ......................................................................... 13
2.3 Elastic buckling analysis of arches ................................................................ 14 2.3.1 Uniform bending and uniform compression ................................................ 14 2.3.2 Vertical loading ............................................................................................ 16 2.3.3 Design standards .......................................................................................... 17
2.4 Non-linear finite element analyses of arches ................................................ 18 2.4.1 Japanese Research ........................................................................................ 18 2.4.2 Dutch Research ............................................................................................ 19

16 Structural properties and out-of-plane stability of roller bent steel arches
2.4.3 Australian Research ..................................................................................... 19 2.4.4 Other research studies .................................................................................. 20
2.5 Design rules for out-of-plane strength of arches .......................................... 20 2.5.1 Japanese design rules ................................................................................... 20 2.5.2 Dutch design rules ........................................................................................ 22 2.5.3 Australian design rules ................................................................................. 24
2.5.3.1 Uniform bending and uniform compression .......................................... 24 2.5.3.2 Vertical loading ..................................................................................... 25
2.5.4 Other design rules ........................................................................................ 27
2.6 Conclusions ..................................................................................................... 28
3 EXPERIMENTAL INVESTIGATION OF RESIDUAL STRESSES .................... 29
3.1 Introduction .................................................................................................... 29 3.1.1 Straight hot rolled sections ........................................................................... 29 3.1.2 Cold bent sections ........................................................................................ 30 3.1.3 Experimental program.................................................................................. 30
3.2 Specimen preparation .................................................................................... 31
3.3 Additional measurements .............................................................................. 32
3.4 Experimental results ...................................................................................... 33 3.4.1 Introduction .................................................................................................. 33 3.4.2 Straight sections ........................................................................................... 34 3.4.3 Roller bent HE 100A sections ...................................................................... 36 3.4.4 Roller bent HE 100B sections ...................................................................... 37 3.4.5 Roller bent HE 360B sections ...................................................................... 38 3.4.6 Roller bent IPE 360 sections ........................................................................ 39
3.5 Sensitivity analyses ......................................................................................... 40 3.5.1 Influence of temperature .............................................................................. 40 3.5.2 Repeatability of measurements .................................................................... 41
3.6 Discussion ........................................................................................................ 42 3.6.1 Residual stresses in roller bent sections ....................................................... 42 3.6.2 Comparison to straight sections ................................................................... 42 3.6.3 Influence of bending radius on residual stress ............................................. 43 3.6.4 Influence of steel grade on residual stress .................................................... 43 3.6.5 Magnitude of residual stress ........................................................................ 43 3.6.6 Comparison with theory ............................................................................... 43
3.7 Conclusions ..................................................................................................... 44

Contents 17
4 FINITE ELEMENT SIMULATIONS OF RESIDUAL STRESSES ..................... 45
4.1 Introduction .................................................................................................... 45 4.1.1 Earlier studies............................................................................................... 45
4.2 Simulation of roller bending process ............................................................ 46 4.2.1 Scope ............................................................................................................ 46 4.2.2 Model description ........................................................................................ 46
4.2.2.1 Wide flange section ............................................................................... 47 4.2.2.2 Rollers and Contact Surface .................................................................. 50
4.2.3 Solution procedure and forming process ...................................................... 51 4.2.4 Completion of numerical run ....................................................................... 53 4.2.5 Curvature distribution .................................................................................. 53 4.2.6 Residual stresses .......................................................................................... 54
4.3 Sensitivity analyses ......................................................................................... 56 4.3.1 Influence of initial residual stresses ............................................................. 56 4.3.2 Influence of flange support roller ................................................................. 57
4.4 Discussion ........................................................................................................ 58 4.4.1 Comparison between numerical and experimental residual stresses ............ 58 4.4.2 Comparison to theory ................................................................................... 59 4.4.3 Sensitivity analyses ...................................................................................... 59 4.4.4 Explanations of differences .......................................................................... 59
4.5 Conclusions ..................................................................................................... 60
5 RESIDUAL STRESS MODEL FOR ROLLER BENT WIDE FLANGE SECTIONS ..................................................................................................................... 61
5.1 Introduction .................................................................................................... 61
5.2 Residual stress analyses based on finite element computations.................. 61 5.2.1 Numerically obtained roller bent residual stresses ....................................... 62 5.2.2 Influence of bending radius .......................................................................... 62 5.2.3 Influence of original yield stress .................................................................. 63
5.3 Roller bent residual stress model for wide flange sections .......................... 63 5.3.1 Residual stress pattern and magnitudes ........................................................ 63 5.3.2 Residual stress model features ..................................................................... 65
5.4 Discussion ........................................................................................................ 65 5.4.1 Comparison to experiments ......................................................................... 65 5.4.2 Comparison to numerical analyses............................................................... 66 5.4.3 Comparison between existing hot-rolled and proposed roller bent residual
stress models ............................................................................................................. 67

18 Structural properties and out-of-plane stability of roller bent steel arches
5.4.4 Range of applicability residual stress model ................................................ 68
5.5 Conclusions ..................................................................................................... 68
6 MECHANICAL PROPERTIES OF ROLLER BENT SECTIONS - EXPERIMENTAL INVESTIGATION .............................................................................. 69
6.1 Introduction .................................................................................................... 69 6.1.1 Cold formed steel ......................................................................................... 69 6.1.2 Motivation for research ................................................................................ 70
6.2 Experimental program and testing procedure............................................. 70 6.2.1 Experimental program.................................................................................. 70 6.2.2 Testing procedure ......................................................................................... 72
6.3 Experimental results ...................................................................................... 73 6.3.1 Straight reference sections ........................................................................... 74 6.3.2 Roller bent sections ...................................................................................... 75
6.3.2.1 Distribution of mechanical properties ................................................... 75 6.3.2.2 Yielding behavior in roller bent sections ............................................... 75
6.3.3 Alteration of mechanical properties ............................................................. 77 6.3.4 Compression tests ........................................................................................ 78
6.4 Discussion ........................................................................................................ 81 6.4.1 Change in mechanical properties ................................................................. 81
6.4.1.1 Top flange ............................................................................................. 81 6.4.1.2 Bottom flange ........................................................................................ 81 6.4.1.3 Web ....................................................................................................... 81 6.4.1.4 General observations ............................................................................. 81
6.4.2 Bending ratio ................................................................................................ 81 6.4.3 Steel grade .................................................................................................... 82 6.4.4 Comparison to engineering assumptions for cold bending .......................... 82
6.5 Conclusions ..................................................................................................... 83
7 MECHANICAL PROPERTIES OF ROLLER BENT SECTIONS – PREDICTION MODEL ................................................................................................... 85
7.1 Introduction .................................................................................................... 85 7.1.1 Stress-strain models ..................................................................................... 86 7.1.2 Earlier suggested alterations to stress curves for cold-formed steel sections
86
7.2 Prediction formulae for mechanical properties ........................................... 88 7.2.1 Strength distribution ..................................................................................... 88 7.2.2 Yield stress and ultimate tensile stress in roller bent sections...................... 88

Contents 19
7.2.3 Change in yield stress and ultimate tensile stress per zone .......................... 89 7.2.4 Altered mechanical properties...................................................................... 92
7.2.4.1 Yield stress ............................................................................................ 92 7.2.4.2 Proportional limit .................................................................................. 92 7.2.4.3 Ultimate tensile stress ............................................................................ 93 7.2.4.4 Strain at ultimate tensile stress .............................................................. 93 7.2.4.5 Strain at fracture .................................................................................... 94
7.3 Development of stress-strain curves for roller bent wide flange sections .. 95 7.3.1 Stress-strain curves for the flange material .................................................. 95 7.3.2 Stress-strain curves for the web material ..................................................... 98
7.4 Discussion ........................................................................................................ 98 7.4.1 Accuracy of altered mechanical properties .................................................. 98 7.4.2 Accuracy of non-linear curves for flanges ................................................... 99 7.4.3 Accuracy of bi-linear curves for web ......................................................... 101 7.4.4 Use of nominal yield stress ........................................................................ 102 7.4.5 Bending limits due to ductility requirements ............................................. 102
7.5 Conclusions ................................................................................................... 104
8 FINITE ELEMENT MODELING OF ROLLER BENT ARCHES ...................... 105
8.1 Introduction .................................................................................................. 105
8.2 Finite Element Analysis Type ...................................................................... 105 8.2.1 Linear Elastic Analysis (LEA) ................................................................... 105 8.2.2 Linear Buckling Analysis (LBA) ............................................................... 105 8.2.3 Material Non-linear Analysis (MNA) ........................................................ 106 8.2.4 Geometrical Non-linear Imperfect Analysis (GNIA) ................................. 106 8.2.5 Geometrical Material Non-linear Imperfect Analysis (GMNIA) ............... 106 8.2.6 Overview .................................................................................................... 106
8.3 Finite element model – Preprocessing ........................................................ 107 8.3.1 Elements used ............................................................................................ 107 8.3.2 Loading ...................................................................................................... 107 8.3.3 Boundary conditions .................................................................................. 108 8.3.4 Mesh........................................................................................................... 108 8.3.5 Non-geometric imperfections .................................................................... 109
8.3.5.1 Non-uniform mechanical properties .................................................... 109 8.3.5.2 Residual stress ..................................................................................... 110
8.3.6 Geometric imperfections ............................................................................ 111 8.3.6.1 Prescribed geometric imperfections EN 1993-2: 2006 (E) .................. 112 8.3.6.2 Measured imperfections ...................................................................... 112 8.3.6.3 Selecting a substitute imperfection ...................................................... 113 8.3.6.4 Typical comparison between measured and substitute imperfection ... 114

20 Structural properties and out-of-plane stability of roller bent steel arches
8.4 Solution phase – Solving .............................................................................. 115 8.4.1 Linear analyses and linear buckling analysis ............................................. 115 8.4.2 Non-linear analyses .................................................................................... 115
8.5 Finite element output - Postprocessing ....................................................... 116 8.5.1 Load-deflection characteristics .................................................................. 116 8.5.2 Plotting results in column curve ................................................................. 116 8.5.3 Equation of column curve – Selecting the appropriate curve..................... 118
8.6 Validation finite element model .................................................................. 119 8.6.1 Experiments La Poutre ............................................................................... 119 8.6.2 Experiments Sakata and Sakimoto ............................................................. 123 8.6.3 Resume ....................................................................................................... 125 8.6.4 Discussion on validation experiments La Poutre ....................................... 125
8.6.4.1 Uncertainties in experiments ............................................................... 125 8.6.4.2 Shortcomings numerical model ........................................................... 126
8.7 Sensitivity analyses ....................................................................................... 128 8.7.1 Geometric imperfections ............................................................................ 128 8.7.2 Residual stresses ........................................................................................ 128 8.7.3 Mechanical properties ................................................................................ 129
8.8 Conclusions ................................................................................................... 131
9 TOWARDS DESIGN RULES ......................................................................... 133
9.1 Introduction .................................................................................................. 133
9.2 Column curve formulation .......................................................................... 134 9.2.1 Imperfection parameter .............................................................................. 134 9.2.2 Representation of finite element results ..................................................... 135
9.3 Buckling parameters .................................................................................... 136 9.3.1 Buckling parameters for columns and beams ............................................ 136 9.3.2 Material models for buckling parameters................................................... 137 9.3.3 Procedure for determining αpl .................................................................... 137 9.3.4 Discussion on the determination of αpl ....................................................... 138 9.3.5 Comparison in slenderness ......................................................................... 138
9.4 Discussion on material models .................................................................... 139 9.4.1 Use of nominal values for fy;s ..................................................................... 139 9.4.2 Use of compressive stress-strain curves ..................................................... 141 9.4.3 Resume ....................................................................................................... 142
9.5 Design rules ................................................................................................... 142

Contents 21
9.5.1 Numerical results in imperfection parameter graph ................................... 142 9.5.2 Column curves ........................................................................................... 145
9.6 Conclusions ................................................................................................... 145
10 CONCLUSIONS & RECOMMENDATIONS ................................................... 147
10.1 Conclusions ................................................................................................... 147
10.2 Recommendations ........................................................................................ 149
REFERENCES ............................................................................................................ 151
Appendix A Design example ............................................................................... 161
Appendix B Permanent deformation verification finite element model ........... 163
Appendix C Back calculation of FE results ........................................................ 169
CURRICULUM VITAE ................................................................................................. 171


1 Introduction This thesis describes the properties and out-of-plane structural stability behavior of roller bent
steel arches. In this chapter, the applications, classification and scope of research are introduced
and the problem statement and objectives of the research are described. Introductions on
stability and the roller bending process are given as well. Finally the methodology and contents
of this thesis are outlined.
1.1 Arches
1.1.1 Application
Arches have a widespread application and continue to find new applications in many different
fields. The application of arches seems to have started around two thousand years ago. The
Romans were the first to use arch structures of a significant size and some of these structures can
be seen even today. One example of the application of arch structures in Roman building
engineering is the Pont du Gard (France). This engineering achievement was not exceeded until
medieval times by the construction of the Pont d‟Avignon (France). The first arches were
executed in stone or masonry construction, the only materials available to bridge spans with
considerable length. During the industrial revolution the first major advances in arch engineering
were made with the use of cast iron.
Bridges
Nowadays the application of braced arches in bridges is quite common up to 500 m. Arch bridges
may comprise concrete, steel or hybrid structures. Table 1 lists the longest span steel arched
bridges. These bridges all comprise two parallel arch-ribs.
Table 1 Longest span steel braced bridges
Name Span
(m)
Location Year of
completion
New River Gorge
Bridge
518 Fayetteville, West Virginia, USA 1977
Bayonne Bridge 504 Kill van Kull, New Jersey, New York,
USA
1931
Sydney Harbour
Bridge
503 Sydney, Australia 1932
Wushan Bridge 460 Chongqing, China 2005
Caiyanba Bridge 420 Chongqing, China 2007
Freestanding arches are also applied in bridge design although to a lesser degree and with smaller
spans in comparison to non-freestanding arches. The Svinesund bridge in Norway/Sweden1
(Steiner and Wagner [127], Jordet and Jakobsen [51]) is an example of a freestanding arch. The
arch comprises a concrete section which is fixed at the supports. Forces from the bridge deck are
transmitted to the arch by means of cables. A total span of nearly 275 m was achieved. An
freestanding arch with a smaller span is the Yarra River Bridge in Melbourne, Australia2 (Figure
2).
1 Lund & Slaatto Arkitekter A/S 2 Architect: engineers Whilybird
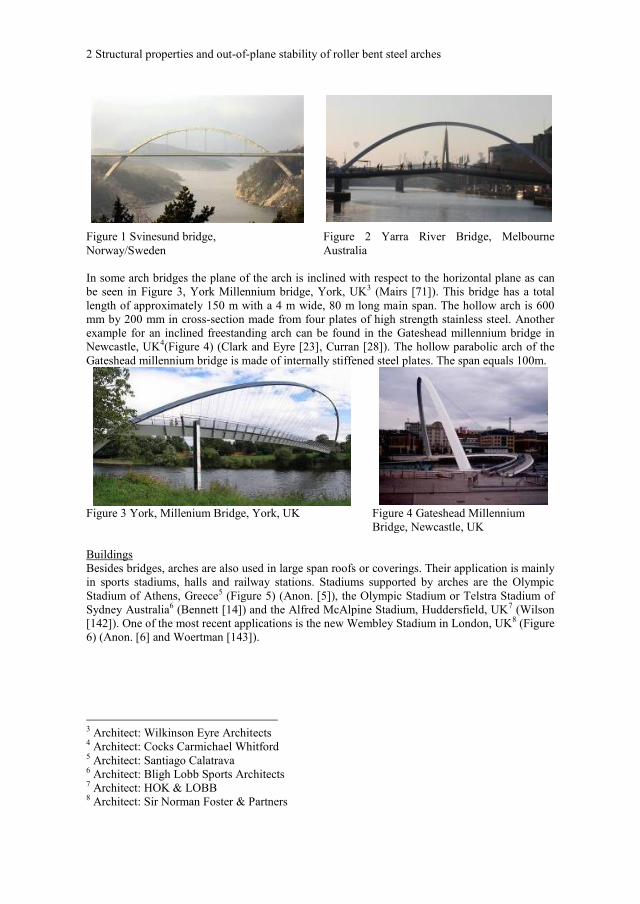
2 Structural properties and out-of-plane stability of roller bent steel arches
Figure 1 Svinesund bridge,
Norway/Sweden
Figure 2 Yarra River Bridge, Melbourne
Australia
In some arch bridges the plane of the arch is inclined with respect to the horizontal plane as can
be seen in Figure 3, York Millennium bridge, York, UK3 (Mairs [71]). This bridge has a total
length of approximately 150 m with a 4 m wide, 80 m long main span. The hollow arch is 600
mm by 200 mm in cross-section made from four plates of high strength stainless steel. Another
example for an inclined freestanding arch can be found in the Gateshead millennium bridge in
Newcastle, UK4(Figure 4) (Clark and Eyre [23], Curran [28]). The hollow parabolic arch of the
Gateshead millennium bridge is made of internally stiffened steel plates. The span equals 100m.
Figure 3 York, Millenium Bridge, York, UK Figure 4 Gateshead Millennium
Bridge, Newcastle, UK
Buildings
Besides bridges, arches are also used in large span roofs or coverings. Their application is mainly
in sports stadiums, halls and railway stations. Stadiums supported by arches are the Olympic
Stadium of Athens, Greece5 (Figure 5) (Anon. [5]), the Olympic Stadium or Telstra Stadium of
Sydney Australia6 (Bennett [14]) and the Alfred McAlpine Stadium, Huddersfield, UK7 (Wilson
[142]). One of the most recent applications is the new Wembley Stadium in London, UK8 (Figure
6) (Anon. [6] and Woertman [143]).
3 Architect: Wilkinson Eyre Architects 4 Architect: Cocks Carmichael Whitford 5 Architect: Santiago Calatrava 6 Architect: Bligh Lobb Sports Architects 7 Architect: HOK & LOBB 8 Architect: Sir Norman Foster & Partners

Introduction 3
Figure 5 Olympic Stadium, Athens, Greece Figure 6 Wembley Stadium, London, UK
Arches can also be found in office buildings. Examples can be found in the London Exchange
House, London, UK9 (Boks [18]) and the Ludwig Erhard House, Berlin, Germany10 (Anon. [4]).
In both examples the arch serves as a superstructure; see Figure 7 and Figure 8.
Figure 7 London Exchange House, London,
UK
Figure 8 Ludwig Erhard House, Berlin,
Germany
1.1.2 Types of arches
Arches can be classified in several ways. In this thesis a distinct difference is made between
arches and curved beams. An arch is supported in such a way that outward spreading of the arch
is prevented which induces major compressive actions in the arch-rib in addition to bending. So
the structure is classified by the end conditions. As outward spreading is prevented, an arch can
be pinned supported or two-hinged, Figure 9(a), or fixed, Figure 9(b). In case outward spreading
is not prohibited the acting loads are primarily resisted through bending action (Figure 10). A
mixed support combination (e.g. a hinge for the left support and a fixation for the right support)
is also possible. The orientation of the supports is presented in accordance with the local axis of
the arch Figure 11(a), instead of the global coordinates of the system Figure 11(b).
(a) Pinned supported (b) Fixed
Figure 9 In-plane support conditions arches. Figure 10 Curved beam
The efficiency of an arch as a load-carrying structure is dependent on the extent with which the
thrust-line follows the arch-rib. An optimum design is achieved when the shape of the arch
matches the thrust-line. In that case the arch-rib experiences compressive stresses and no bending
stresses.
9 Architect: SOM 10 Architect: Grimshaw & Partners, London/Berlin

4 Structural properties and out-of-plane stability of roller bent steel arches
Z
X
Mxz
x MT
Z
XMZ
z
x
MT
MX
MZ
MX
(a) Local coordinates (b) Global coordinates
Mx
Figure 11 Orientation of supports.
The thrust-line is determined by the acting load. A circular arch is most efficient if it carries
radial load uniformly distributed around the centroidal axis of the arch, Figure 12(a), a parabolic
arch when carrying a uniformly distributed load, Figure 12(b), and an inverted catenary arch
carrying self-weight only, Figure 12(c).
(a) Circular arch (b) Parabolic arch (c) Inverted catenary arch
Self-weight
Figure 12 Arch shapes with matching thrust-lines.
For practical design loadings, however, the arch acts in combined bending and compression.
Whether compression or bending is the major action depends on the loading conditions, support
conditions, subtended angle and arch length. When an arch is subjected to load uniformly
distributed along the horizontal projection of the entire arch, the compression is relatively high
and the bending moment is relatively low. In contrary, in case an arch is subjected to a central
point load, the bending moment is relatively high and the compression is relatively low. Arches
used in roofings are subjected to forces, for example, induced by purlins. These forces maintain
their original direction in the deformed shape and are denoted as conservative forces, Figure
13(a). When an arch is applied in bridge design, the forces are often transmitted through cables
connected to the arch-rib and to the bridge deck, see for example Figure 6. The direction of force
changes with deformation of the arch which is better known as a non-conservative force; see
Figure 13(b).
(a) Conservative force (b) Non-conservative force
F F
Figure 13 Conservative force and non-conservative force in deformed shape
The support conditions are featured by the in-plane and out-of-plane supports characteristics. For
a freestanding, in-plane, pinned supported and out-of-plane pinned arch the torsional rotation at
the support should be prevented to avoid rigid body motion. A fork support is sufficient to
enforce no torsional rotation, see Figure 14. However, when the subtended angle is 180 degrees
lateral stability is no longer ensured and a rigid body rotation about the line through both
supports occurs. An out-of-plane fixed arch is featured by a fork support where the out-of-plane

Introduction 5
rotations are prevented, see Figure 15. The effect of restrained warping is an additional degree of
freedom for the out-of-plane support conditions.
(a) Beam
x
z
y
z
x
y
(b) Arch (a) Beam (b) Arch
u = v = w = δ = 0 u = v= w = δ = ζ = 0
y
xz u
w
v
δ
ζ
εPostive local coordinate system
with deformation abbreviations
xz
y
z
x
y
Figure 14 Fork support Figure 15 Fork support with out-of-plane restraint
An out-of-plane support can be provided by lateral bracing, Figure 16(a). However, when lateral
bracing is absent, in which case the arch is considered freestanding, lateral support must be
provided by the out-of-plane bending stiffness, torsional stiffness and warping rigidity of the
arch-rib, Figure 16(b). The boundary conditions also contribute to the lateral stability of
freestanding arches.
(a) Laterally braced
Arch
Bracing
(b) Freestanding Figure 16 Out-of-plane support.
Arches are made from different materials. Early arches were made of masonry or timber.
Nowadays most arches are made of steel, reinforced concrete or a combination of both. The use
of material determines the cross section. In general it can be stated that steel arches applied for
relative small spans are made from roller bent steel sections, whereas for larger spans welded
box-sections made out of plates are used. A full overview on the arch dimensional parameters is
presented in Figure 17.
L
S
f
R
γα
h
L = Span
S = Arch length
R = Radius
f = Rise
h = Section height
α = Subtended angle
γ = Half of subtended angle
= Angular coordinate
Figure 17 Dimensional arch parameters

6 Structural properties and out-of-plane stability of roller bent steel arches
1.1.3 Scope
This thesis is confined to the study of freestanding circular arches subjected to two different
loads: a central point load and a uniformly distributed load (UDL) over the entire span see Figure
18.
F q
(a) Central load (b) Full span UDL
L
Figure 18 Investigated loadcases for in-plane pinned supported arches.
Commonly arches in bridge and roof structures have in-plane pinned or fixed connections. This
study is limited to in-plane pinned support conditions, since fixation of the supports in the plane
of the arch will have only a minor contribution to the structural performance. The supports out-
of-plane are completely fixed: rotations and warping deformations are restrained, to give
additional out-of-plane stiffness. An overview of the support conditions is presented in Table 2.
The loads are conservative, i.e. no directional change of the force vector during loading is taken
into account.
Table 2 Investigated support conditions
In-plane Out-of-plane Warping at support
Pinned Fixed Restrained
Only arches made from roller bent wide flange steel sections are investigated. The roller bending
process with a three-roller bending machine is a widely used method to arch a straight hot-rolled
sections and this study is limited to this method of arch production. It is mentioned that the
definition of “wide flange section” applies to hot-rolled I-shaped sections for which the width of
the top flange approximately equals the height, whereas sections featured by smaller height-to-
width ratios are annotated as “I-sections”. In this thesis however, the definition of wide flange
sections applies to all hot-rolled I-shaped sections.
1.2 Stability
In this section the phenomenon of structural stability is treated. First the most common failure
modes for beams, columns and arches with respect to stability are outlined. Subsequently the
different theories for structural analysis are presented and their relationship with structural
stability.
1.2.1 Description
Columns
Columns are prone to three different stability phenomena: flexural buckling, torsional buckling
and flexural- torsional buckling as illustrated in Figure 19. Flexural buckling (Figure 19(a))
occurs when a concentrically loaded column changes from axial deformation to a flexural
deformation. Torsional buckling (Figure 19(b)) is a dominant mode of buckling for double-
symmetrical open sections subjected to compression. Due to rotation of the column around its
shear centre, which coincides with the centre of gravity, instability occurs. Flexural-torsional
buckling (Figure 19(c)) is a combination of flexure and torsion occurring when shear centre and
centre of gravity do not coincide. Flexural-torsional buckling occurs when the load application
does not coincide with the shear centre. For all three phenomena the strength of slender columns
is lower than the squash load or plastic capacity of the cross section.

Introduction 7
(a) flexural buckling (b) torsional buckling (c) flexural-torsional buckling Figure 19 Stability phenomena of columns.
Beams
The global instability of beams is denoted by lateral-torsional buckling. Lateral-torsional
buckling arises in slender beams subjected to general loading Figure 20(a). This is due to a
compressive action in the upper section of the beam. The deformation of the beam changes from
in-plane deformation to a combination of in-plane deformation, twist and lateral deflection
Figure 20(b). Slender beams fail by lateral-torsional buckling before reaching their in-plane
plastic capacity.
v
w
(a) Loading (b) Deformation of cross section
z
y
x
δ
Figure 20 Lateral-torsional buckling
Arches
Stability of freestanding arches can be subdivided into three stability phenomena: snap-through
instability, Figure 21(a), in-plane instability, Figure 21(b) and out-of-plane instability, Figure
21(c). This study is focused on the out-of-plane stability of arches.
(a) Snap-through (b) In-plane buckling (c) Out-of-plane buckling
FF F F
Figure 21 Stability phenomena
Snap-trough instability occurs in shallow arches which are restrained against out-of-plane
displacements. Due to axial shortening, the arch is capable of moving „through‟ the span and will
subsequently act in tension. In-plane instability is a dominant mode of failure for non-shallow
arches prevented from out-of-plane buckling. In-plane instability can be featured by a symmetric
or (more common) asymmetric buckling mode. Out-of-plane instability of arches is a
combination of out-of-plane flexural and lateral-torsional buckling; therefore the out-of-plane
stability of arches is sometimes denoted as flexural-torsional buckling. Similarly to columns and
beams, slender arches may fail by out-of-plane buckling prior to the attainment of the in-plane
plastic capacity. Arches, made from thin plates can also fail in a local buckling mode as featured
by flange buckling or web crippling. This buckling mode, however, is not investigated in this
thesis.

8 Structural properties and out-of-plane stability of roller bent steel arches
1.2.2 Stability and Stability analyses
In this section a small overview on the issue of stability is given. Consider a pin-ended steel
column with flexural stiffness EI and length L subjected to a vertical load F at the top and a
smaller - but proportional - horizontal load H applied at mid height (Figure 22(a)). This column
can be analyzed according different theories, each featuring different degrees in output and
structural phenomena taken into account. The analysis types available to assess the structural
response can be subdivided into 2 categories: 1st order analysis and 2nd order analysis. For each
category a further distinction between elastic (Figure 22(b)) or plastic material (Figure 22(c))
behavior can be made, rendering a total of four structural analysis types.
1st order analysis
In a 1st order analysis it is assumed that the deformations do not influence the equilibrium
equations. When the column is analyzed by the 1st order elastic theory, loads and deformations
are linearly related; indicating that any increase of the force will induce a proportional increase in
deformations. Hence, plotting the vertical load F on the ordinate and horizontal deflection at mid-
height w on the abscissa in a conventional load-deflection graph gives a straight line as shown in
Figure 22(d). Incorporating the yielding behavior of the material into the structural analysis by
performing a 1st order plastic analysis will induce a change in the load-deflection graph. At
relative low load levels the column behaves according to the 1st order elastic theory. As soon as F
approaches the plastic collapse load Fpl* the load-deflection graph starts to deviate from the
straight line from 1st order elastic analysis (Figure 22(f)). As the load approaches Fpl* any small
increase in load will induce a larger increase in deformations, represented by a decreasing slope
of the load-deflection graph. At Fpl* the load carrying capacity is exhausted and a plastic collapse
mechanism has formed. Due to the presence of the horizontal force H the plastic collapse load is
smaller than the squash load Fpl of the cross-section. Although a 1st order analysis has proven to
be an economic basis for the design of structures when loss of stability is not an issue, it may be
inaccurate when confronted with structures under large compressive forces. For these structures
recourse has to be taken to 2nd order analyses.
2nd order analysis
In a 2nd order analysis the equilibrium equations are formulated in the deformed state of the
structure, and hence can be classified as non-linear. It is obvious that the horizontal force
(resembling actual steel imperfections) induces a small deflection and bending moment. Since
the column has deflected in horizontal direction, this in turn will induce an extra bending moment
due to emerged misalignment between the centroid of the column and force F. The bending
moments will induce additional deformations, which will increase the bending moments even
more, and this process will continue until equilibrium between external and internal forces is
achieved. The load-deflection graphs of a 2nd order elastic analysis deviates from the straight line
from the 1st order analysis at the onset of loading and moves asymptotically towards the elastic
buckling load Fcr as shown in Figure 22(e). Provided the column is not susceptible to lateral-
torsional buckling due to the presence of the horizontal force at mid-height the elastic buckling
load for this column can be computed by the well-known equation of Euler: Fcr=π2EI/L2. From
the load-deflection graph it can be seen that at relative low load levels of F the line follows the 1st
order elastic theory closely since the column is predominately under axial compression and
bending actions are relative small. As the load increases, the column experiences an increasing
amount of flexure, featured by a decreasing slope of the load-deflection graph, while the axial
force remains equal to the vertical load F. In the vicinity of the elastic buckling load the column
experiences large bending actions. Due to the presence of a horizontal force at the onset of
loading the axial compression and bending action are coupled to certain extent. When the
horizontal force H is taken smaller, axial forces and bending actions become decreasingly
coupled. In the limiting case (i.e. when the horizontal force is taken to be infinitely small) there is

Introduction 9
no coupling between axial forces and bending actions. In this case the load-deflection graph is
manifested by two straight lines or load paths, intersecting at a bifurcation point or the elastic
buckling load Fcr. The first branch represents the axial load path and the second branch the
bending load path.
A 2nd order elastic-plastic analysis takes into account both the geometrical and material non-
linearities. The 2nd order elastic-plastic load-deflection graph is identical to the line from the 2nd
order elastic analysis, until the yield stress in the cross-section is reached (Figure 22(g)). After
the onset of yielding the column is able to sustain a small increase in load until the limit load,
featured by a maximum in the load-deflection graph. The limit load from a 2nd order elastic-
plastic analyses is also known as elastic-plastic buckling load or ultimate load. Due to the
complexity inherent to the analysis type the 2nd order elastic-plastic response is often investigated
with finite element analyses or similar numerical procedures.
F
w
F
(d) 1st order elastic (e) 2nd order elastic
F
(a) ColumnF
w
F
Limit load
(g) 2nd order elastic-plastic
Commencement
yielding
Fpl*
Fcr
Fcr
Fult
H
Bifurcation point
Decreasing H
LEI
348EIF HL
1
w
w
ζ
ε
E1
(b) elastic
material law
ζ
ε
E1
w
1st order 2nd order
(c) elastic-plastic
material law
fy
εy
Fpl*
(f) 1st order elastic-plastic Figure 22 Stability behavior of a column.
Stability essentials
From the preceding text it becomes clear that the subject of stability can only be studied
sufficiently with 2nd order elastic-plastic analyses. Furthermore, the elastic buckling load,
featuring the bifurcation point, shows little resemblance to a structure failing in an elastic-plastic
buckling mode. Moreover, the elastic buckling load is insensitive to the horizontal force H or
equivalent imperfection. Hence, performing an elastic buckling analysis to find Fcr is only a small
step in a stability check. The horizontal load does influence the load-deflection curve for the 2nd
order analysis and thus the limit load. The magnitude of the horizontal force indicates whether
gradual or more explosive buckling behavior is will take place. From this it can be concluded that
imperfections have a great influence on the stability behavior of steel structures. Imperfections
can be subdivided into three categories: geometrical imperfections (or deviations from the ideal
geometry), residual stresses and non-uniform distributions of mechanical properties. The first
imperfection category applies to all 2nd order analyses, whereas the latter two only apply to 2nd
order elastic-plastic analyses.
Stability and design rules
It would be complete madness to perform a 2nd order elastic-plastic analysis to check the stability
of every steel column or beam susceptible to buckling. Therefore, in order to check the stability
resistance, design rules have been proposed, which make proper allowance for the buckling
phenomena. A structural engineer can check the buckling resistance by conducting a 1st order
10 Structural properties and out-of-plane stability of roller bent steel arches
elastic analysis to find the internal force distribution and adopt the design codes to make proper
allowance for any buckling issues. However, design rules are not available for every structural
element.
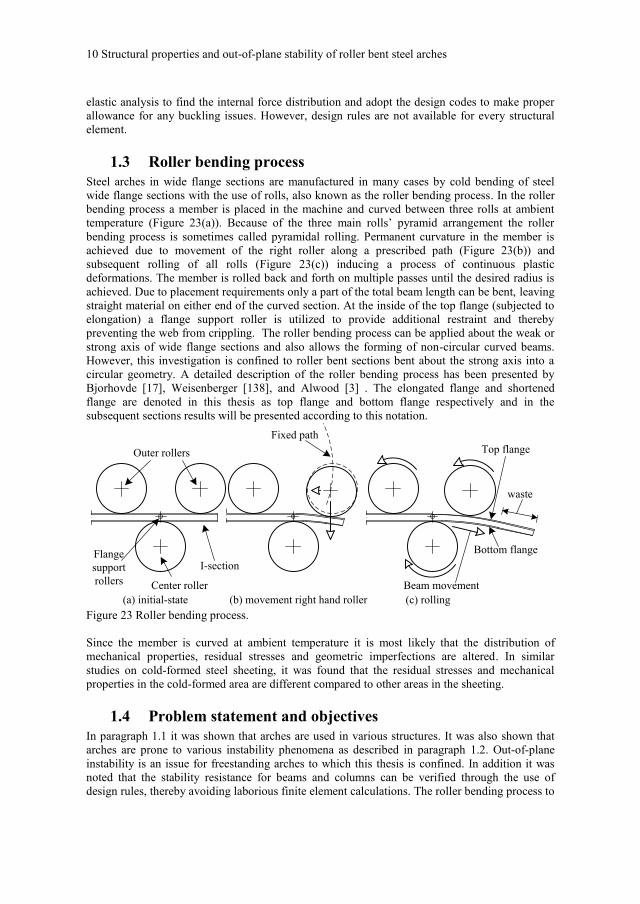
1.3 Roller bending process
Steel arches in wide flange sections are manufactured in many cases by cold bending of steel
wide flange sections with the use of rolls, also known as the roller bending process. In the roller
bending process a member is placed in the machine and curved between three rolls at ambient
temperature (Figure 23(a)). Because of the three main rolls‟ pyramid arrangement the roller
bending process is sometimes called pyramidal rolling. Permanent curvature in the member is
achieved due to movement of the right roller along a prescribed path (Figure 23(b)) and
subsequent rolling of all rolls (Figure 23(c)) inducing a process of continuous plastic
deformations. The member is rolled back and forth on multiple passes until the desired radius is
achieved. Due to placement requirements only a part of the total beam length can be bent, leaving
straight material on either end of the curved section. At the inside of the top flange (subjected to
elongation) a flange support roller is utilized to provide additional restraint and thereby
preventing the web from crippling. The roller bending process can be applied about the weak or
strong axis of wide flange sections and also allows the forming of non-circular curved beams.
However, this investigation is confined to roller bent sections bent about the strong axis into a
circular geometry. A detailed description of the roller bending process has been presented by
Bjorhovde [17], Weisenberger [138], and Alwood [3] . The elongated flange and shortened
flange are denoted in this thesis as top flange and bottom flange respectively and in the
subsequent sections results will be presented according to this notation.
(a) initial-state (b) movement right hand roller (c) rolling
Center roller
Flange
support
rollers
Outer rollers
I-section
Beam movement
waste
Fixed path
Top flange
Bottom flange
Figure 23 Roller bending process.
Since the member is curved at ambient temperature it is most likely that the distribution of
mechanical properties, residual stresses and geometric imperfections are altered. In similar
studies on cold-formed steel sheeting, it was found that the residual stresses and mechanical
properties in the cold-formed area are different compared to other areas in the sheeting.
1.4 Problem statement and objectives
In paragraph 1.1 it was shown that arches are used in various structures. It was also shown that
arches are prone to various instability phenomena as described in paragraph 1.2. Out-of-plane
instability is an issue for freestanding arches to which this thesis is confined. In addition it was
noted that the stability resistance for beams and columns can be verified through the use of
design rules, thereby avoiding laborious finite element calculations. The roller bending process to

Introduction 11
arch straight beams into the desired curvature alters the imperfections of the member section in
terms of cross-sectional shape, residual stresses and variation in mechanical properties as
outlined in paragraph 1.3. From this it follows that the manufacturing process may influence the
elastic-plastic buckling behavior of roller-bent arches.
Currently no design rules are available which take into account the change in imperfections
arising from the roller bending process and their influence on the out-of-plane structural stability
behavior of steel arches. Nowadays, when confronted with freestanding roller bent arches,
engineers have to take recourse to time-consuming finite element calculations, without even
being aware of the influence of imperfections or failure modes inherent to out-of-plane buckling.
On the one hand this situation can lead over-dimensioned arches and hence inefficient structures.
On the other hand the lack of knowledge on out-of-plane buckling of freestanding arches can
compromise the safety of the arch structure.
Based on the preceding text, the problem statement of the research can be summarized as
follows: For freestanding arches, subjected to in-plane loading, design rules do not exist which
give insight into the structural behavior and take into account the influence of the roller bending
process.
The objective of this research is to gain insight into the out-of-plane buckling behavior of
freestanding roller bent circular steel arches and to derive design rules for the limit load, in which
the influence of the roller bending process is taken into account.
The field of application for freestanding roller bent arches is small. Freestanding arches are often
manufactured with a different method than roller bending. Roller bent arches, in contrary, are
often applied in roofings for which the purlins provide lateral stability and are therefore not
considered freestanding but laterally braced. The design rules for roller bent freestanding arches
will therefore serve as a first step towards design rules for (a) laterally braced arches and (b)
freestanding arches manufactured with other manufacturing processes prone to out-of-plane
instability. The derived design rules for freestanding arches can also be applied to arches
subjected to non-conservative forces as a safe approximation, since these non-conservative forces
result in a higher failure load when compared to conservative forces.
1.5 Methodology and outline of thesis
This thesis is divided into three distinct parts: (I) investigation of residual stresses in roller bent
wide flange sections, (II) examination of influence of roller bending process on mechanical
properties in wide flange sections and (III) examination of carrying capacity of freestanding
arches and accompanying proposal for design rules for freestanding arches. Each part is
subdivided into two or more chapters.
In chapter 2 an overview of earlier research on out-of-plane buckling of steel arches is given, in
addition to earlier suggested design rules.
The residual stresses in roller bent arches are measured and predicted with a finite element
model. The experimental results and finite element analyses are presented in chapter 3 and
chapter 4, respectively. From these finite element results a residual stress model is proposed. The
derivation of this model is presented in chapter 5.
The mechanical properties are measured by performing tensile tests on coupons taken from roller
bent arches. The experimental results are given in chapter 6. Subsequently the experimental
results are used to arrive at a prediction model by which the mechanical properties over the cross-

12 Structural properties and out-of-plane stability of roller bent steel arches
section of a roller bent arch can be predicted (chapter 7). The residual stress model and the
prediction model are used to define the initial state of a roller bent arch for elastic-plastic
buckling computations.
In chapter 8 the finite element model with all implemented imperfections is outlined. The
performance of the finite element model is examined through comparison with experimental
results. The influence of the imperfections from the roller bending process on the out-of-plane
elastic-plastic buckling response is investigated by means of sensitivity analyses. The apotheosis
of the thesis, reflected by the design rules, is presented in chapter 9. The underlying procedure to
arrive at the design rules is presented.
Conclusions and recommendations for further research are given in chapter 10. A full outline on
the methodology and accompanying chapter numbers in the thesis is presented in Figure 24.
Literature Survey (2)
I Residual stresses in roller bent wide flange
sections
III Out-of-plane structural stability of roller bent wide
flange sections
Experiments (3)
Finite element simulations (4)
Residual stress model (5)
Finite element analyses (8)
Proposed design rules (9)
Conclusions and recommendations (10)
II Mechanical properties of roller bent wide flange
sections
Experiments (6)
Prediction model (7)
Figure 24 Flow chart

2 Literature study on arch buckling This chapter gives an overview of the theoretical and numerical studies on the structural
performance of steel arches. The first section deals with the in-plane plastic collapse load of steel
arches. The literature on the elastic buckling load is outlined in the subsequent section.
Numerous research studies were devoted to obtain a closed-form equation to obtain the elastic
buckling load for freestanding arches subjected to various loading conditions. The design rules
emanating and non-linear finite element analyses for freestanding arches are presented in
section 2.5 and 2.4, respectively.
2.1 Introduction
The literature on the structural response of arches and arch buckling is extensive. A large amount
of text books, journal articles and conference papers was devoted to this subject. The overview of
this chapter is limited to freestanding circular arches, loaded in-plane and predominantly failing
by out-of-plane buckling. The first two sections deal with the in-plane plastic collapse load of
steel arches and the elastic buckling load of arches. These subjects have no immediate relevance
to the research subject, but are important topics in view of the design rule which will be
presented in chapter 9. The literature on residual stresses and mechanical properties of roller bent
sections will be treated in the corresponding chapters.
2.2 In-plane plastic collapse load
This paragraph gives a review of the literature on the in-plane plastic collapse load of (steel)
arches. The earliest reported research on the plastic collapse analysis of steel arches was
performed by Hendry [46]. A graphical method was verified with experiments. The investigation
was confined to parabolic arches with square and I-sections. Axial thrust was measured in the
experiments, however, not taken into account in the analyses. It was stated that the effect of the
axial stress on the strength was in no case sufficiently large to reduce the plastic moments. The
investigation of Onat and Prager [81] was based on the assumption that for shallow arches the
influence of axial forces can no longer be neglected. The in-plane strength was evaluated for
circular arches subjected to three loadcases: a single force at the crown, a uniformly distributed
load over the entire span and a uniformly distributed load over the left-hand half of the span. In
the first loadcase the plastic capacity was evaluated by employing two methods: a kinematic
approach based on a collapse mechanism and an evaluation of the internal forces. For the other
two loadcases only the kinematic approach was used. The investigation was confined to arches
with a rectangular cross section. Stevens [128] also found that the application of the plastic-
theory to arches requires a reduction of the bending capacity due to considerable axial forces
associated which arch action. Secondly he found that small deflections can produce significant
changes in the force and bending-moment systems. Theoretical investigations were compared
with experimental results which included both small and large-scale arches with various
loadings, shapes and end conditions. The theoretical investigations were based on graphical
methods since the solution required a large computational effort. The analyses were limited to
rectangular cross sections. A computer program was written by Cornforth and Childs [25] to
compute the in-plane plastic collapse load based on an iterative approach. It was assumed that the
compressive action in the arch-rib was not of any influence with respect to plastic moment
capacity of the section. A step-by-step approach for the analysis of elasto-plastic arches under
quasi-static loading was presented by Cohn and Abdel-Rohman [24]. Techniques for matrix
analysis were extended to take into account both the effects of axial forces and deformations on
the stress distribution. Four types of support conditions and loading were considered: hinged-

14 Structural properties and out-of-plane stability of roller bent steel arches
supports and single concentrated load; hinged-supports and uniformly distributed load; hinged-
supports and nonsymmetrical distributed load; and fixed supports and single concentrated load.
Both piecewise linear and a non-linear yield curves were considered. It was concluded that the
effects of the in-plane deformations and normal forces have a major influence on the arch
behavior. The use of a piecewise linearized yield condition; however; has a minor influence. The
solutions showed excellent agreement with the collapse loads obtained by Onat & Prager and
Stevens. Chakrabarty [22] provided design graphs for circular arches with a rectangular cross
section subjected to a single force applied at the top, which was basically an extension of the
work of Onat & Prager. The yield criterion was defined for combined bending and compression
but shear forces were not taken into account. A plastic collapse analysis was performed by
Trahair et al. [134]. The analysis was part of a larger investigation on the use of the method of
plastic collapse analysis for the in-plane design of steel arches. A special-purpose computer
program was used for the analyses. The calculations were confined to pin-ended circular arches
with concentrated vertical loads. La Poutre and Snijder [68] evaluated the in-plane plastic
collapse load for wide flange semicircular arches subjected to a single load applied at the crown.
The yield criterion was solely defined by bending; the influence of compression forces was
neglected. The in-plane plastic collapse load was obtained by using the kinematic approach based
on a collapse mechanism. The in-plane plastic collapse load was compared with finite element
analyses and good agreement was found for slender arches but not for stocky arches. The
analyses were expanded by La Poutre [67] to wide flange circular arches with varying subtended
angle. The yield criterion was confined to the plastic section modulus and no influence of axial
forces was taken into account.
A literature survey on the plastic analyses of arches shows that the in-plane plastic collapse of
arches is featured by greater complexities than the plastic collapse load of beams and columns.
The vertical loading induces a combination of axial force and flexure in the arch-rib which
reduces the plastic capacity of the cross-section to considerable extent. No closed-form equations
exist by which the in-plane plastic collapse load can be accurately determined.
2.3 Elastic buckling analysis of arches
Next to equations for the in-plane plastic capacity of steel arches as presented in section 2.2, this
paragraph sketches the development of closed-form equations to obtain the elastic buckling load
of arches. Such solutions for out-of-plane pinned arches have been proposed by a number of
researchers. However, most of the analyses were limited to circular arches subjected to uniform
bending or uniform compression, see Figure 25.
αM
q
(a) Positive uniform bending (c) Uniform compression(b) Negative uniform bending
α αM M M
Figure 25 Circular arch under uniform bending (a and b) and uniform compression (c)
2.3.1 Uniform bending and uniform compression
Early equations for the elastic buckling load were proposed by Timoshenko and Gere [133] using
the equilibrium approach. They ignored the effects of restrained warping by choosing cross
sections with low warping rigidity. Vlasov [137] formulated the stability equations by
substituting the curvature terms of the curved beam into the straight beam equilibrium equation.
Yoo [147] proposed new formulae by using general fourth order coupled differential equations,
however, also based on straight-beam theory. Yang and Kuo [146] used the principle of virtual

Literature study on arch buckling 15
displacements for deriving the same differential equations. Papangelis and Trahair [82] derived
new equations based on the curved beam theory using the energy method. They proved that the
solutions of Vlasov [137] and Yoo [147] for uniform compression gave an overestimation of the
elastic buckling load. Rajasekaran and Padmanabhan [102] established equations based on the
principle of virtual work. Kang and Yoo [52] developed nonlinear equations that describe the
elastic behavior of thin-walled curved beams. These equations were applied by Kang and Yoo
[53] in closed-form solutions for the elastic flexural buckling load. Delrue [31] made a
comparison between the formulae obtained by the earlier mentioned researchers. She stated that
the solution presented by Rajasekaran & Padmanabhan provided the most accurate results for
both uniform compression and bending. The comparison was confined to two different subtended
angles and two different types of cross section. An improved formulation for spatial stability of
thin-walled curved beams with nonsymmetric cross sections was presented by Kim et al. [59], by
deriving the total potential energy from the principle of linearized virtual work for a continuum.
In a companion paper by Kim et al. [60], the formulae were verified with a finite element model,
consisting of specially created elements. Lim and Kang [70] developed an elastic buckling theory
for thin-walled arches by using the principle of minimum total potential energy to obtain the
governing differential equations. Pi et al. [90] used both a virtual work approach and a new
treatment of static equilibrium approaches to investigate the elastic flexural-torsional buckling of
circular arches. They studied the influence of the directionality of the radially distributed load by
comparing hydrostatic loads and radial loads towards the centre of the arch with invariant radial
loads. An increase of the elastic buckling load of an arch under uniform compression was found
for hydrostatic loads and for radial loads towards the centre of the arch, which was attributed to
the lateral components of these loads. They also described a solution for uniform bending which
was consistent with the solution obtained by Vlasov [137] and Rajasekaran and Padmanabhan
[102]. Pi et al. [90] proposed a solution for an arch under uniform compression, which was
identical to Papangelis and Trahair [82] and Pi and Trahair [95]. The positive effect of
hydrostatic pressure on circular arches was also addressed by Bradford and Pi [20]. They
formulated the problem both from a virtual work viewpoint and a mechanical visualization of the
arch in its deformed configuration using equilibrium of force and moment vectors.
Solutions for the elastic buckling resistance for out-of-plane fixed circular arches subjected to
uniform bending and uniform compression were obtained by Pi and Bradford [86]. The solution
was compared to the second mode buckling load of out-of-plane simply supported arches.
Bradford and Pi [19] devoted a separate paper to the elastic buckling of laterally fixed steel
arches under uniform bending.
Pi et al. [91] included the prebuckling deformations by substituting the nonlinear strain-
displacement relations obtained by the position vector in the second variation of the total
potential energy. When taking into account the prebuckling deformations the original geometry
of the arch is altered. Prebuckling deformations change the curvature of the arch, from which it
follows that it affects the elastic buckling load. When the ratio of minor axis flexural stiffness to
the major axis flexural stiffness is not small and end movement of the supports is permitted,
neglecting prebuckling deformations may lead to an inaccurate prediction. A modification to the
elastic buckling moment for laterally fixed arches under uniform bending as stated by Pi and
Bradford [86] was established by including the in-plane prebuckling deformations, Pi and
Bradford [85]. An improved analytical formulation for the spatial stability analysis for shear
deformable curved beams was proposed by Moon-Young et al. [76]. Shear deformation effects
due to shear forces and restrained warping were considered. Numerical examples were presented
to illustrate the accuracy and validity of the analytical formulation. In order to induce uniform
bending in an arch, one end must have the ability to move freely, when both ends are subjected to
equal but opposite bending moments, Pi and Bradford [86], Pi and Bradford [85]. Thereby, the

16 Structural properties and out-of-plane stability of roller bent steel arches
arch is replaced by a so-called curved beam according to the definition from section 1.1.2. The
arch must have pinned supports in order to contain uniform compression when subjected to a
radial load, Pi and Trahair [95].
2.3.2 Vertical loading
Besides closed-form solutions to obtain the elastic buckling load for arches under uniform
bending or uniform compression, solutions are also available for arches subjected to vertical
loading. These solutions are more complicated since any vertical loading acting on an arch
induces a combination of compressive and bending actions in the arch-rib.
Pi et al. [89] investigated the elastic buckling load of circular in-plane pin-ended and out-of-plane
simply supported arches, in addition to in-plane and out-of-plane fixed arches, subjected to a
central load applied at the crown. The principle of stationary potential energy in conjunction with
the Rayleigh-Ritz method was used to obtain the elastic buckling load. The support conditions
affect the distribution of the bending moments and axial compression in the arch-rib and hence
alter the elastic buckling behavior. The theoretical results were compared to finite element
studies and excellent agreement was found.
The elastic buckling of freestanding arches subjected to a uniformly distributed load was first
investigated by Namita [77]. The numerical findings were presented in graphical form. In Figure
26 the elastic buckling load is expressed as a function of m and n, where m represents the ratio
between the torsional stiffness and the minor axis bending stiffness. The ratio between the
warping stiffness and minor axis bending stiffness is featured by n. Design graphs were only
provided for two rise-to-span ratios: f/L=0.1 and f/L=0.2. The dashed line represents the
numerical solution for identical arches subjected to radially directed loading as provided by
Fukasawa [38]. The symbols are adapted to meet the nomenclature as adopted in the thesis.
f/L=0.10 λs=qRL2/EIz
n=EIw/R2EIzm=GIt/EIz
n=10-3
n=10-4
n=10-5
n=0
n=010-4 10-3 10-2 10-1 1m
L
q
f
R
40
35
30
25
20
15
10
5
0
λ s
Figure 26 Buckling coefficients for circular arches subjected to uniformly distributed loading
along the span (figure re-drawn from Namita [77]).
Usami and Koh [135] presented a large displacement theory for plane-curved members with thin-
walled open sections. The analysis only treats in-plane pin-ended supported and out-of-plane
fixed arches. The theory was applied in the analysis of elastic buckling of circular arches
subjected to a vertical uniformly distributed load and can be seen as an extension of the work of
Namita [77]. Extensive overviews on elastic buckling of arches have been published by Hayashi
[45] and Ziemian [149].

Literature study on arch buckling 17
2.3.3 Design standards
Eurocode 3, Part 2 (EN 1993-2 [36]) gives design equations for the elastic buckling load of
arches. The critical buckling load for freestanding arches subjected to a uniformly distributed
load for out-of-plane buckling is expressed by the critical normal force at the supports:
cr z
2
πN = EI
βL
(1)
Where
Ncr relates to the buckling force at the supports;
L is the projection length of the arch;
EIz is the out-of-plane flexural stiffness of the arch;
is the buckling length factor.
For out of plane buckling of freestanding arches the buckling length factors may be taken as:
1 2β (2)
Where 1 2 are given in Table 3 and Table 4 respectively
Table 3 β1 – values
f/L 0.05 0.10 0.20 0.30 0.40
Iz constant 0.50 0.54 0.65 0.82 1.07
/ 2L
f
Iz,0αB
/ 2L
Iz varies
I
Icos
z,0
z B
B
0.50 0.52 0.59 0.71 0.86
Table 4 β2 – values
Loading 2 Comments
Conservative (the deck is
fixed to the top of the arch)
1
α
R
By hangers H1 0.35
q
q
By posts St1 0.45
q
q
q Total load
qH load part transmitted by hangers
qSt load part transmitted by posts
For out of plane buckling of freestanding circular arches with radial loading the buckling length
factor may be taken as
2 2
2 2-
KR
L
(3)
Where
R is the radius of the circle
is the section angle of the arch 0 (in radians)
K is the ratio between the minor axis bending stiffness and the torsional stiffness: EIz/GIt
It can be seen that the elastic buckling of arches has received great interest. Especially arches
under uniform bending and uniform compression were a subject of attention to many researchers,
resulting in the proposal of closed-form equations to obtain the elastic buckling load. For arches

18 Structural properties and out-of-plane stability of roller bent steel arches
under vertical loading, no closed-form equations exist and recourse must be taken to graphical
forms.
2.4 Non-linear finite element analyses of arches
This section gives the major research contributions from various research groups on the finite
element analyses to investigate elastic-plastic arch buckling. The finite element models are
described in terms of elements, material modeling, imperfections and the most important results
are presented. Based on an overview of the existing literature on non-linear finite element
analyses of arches and subsequent design rules it was found that the investigations can be divided
into three different national groups: Japan, The Netherlands and Australia. Each group adopted
its own finite element approach and proposed its own design rule. The proposed design rules are
presented in section 2.5.
2.4.1 Japanese Research
Spatial elastic-plastic finite element analyses on both freestanding and braced arches subjected to
a uniformly distributed vertical load were performed by Komatsu and Sakimoto [63], Sakimoto
and Komatsu [114], Sakimoto and Komatsu [113]. A special-purpose finite element model was
developed earlier by Komatsu and Sakimoto [62]. The elastic-plastic buckling loads from non-
linear finite element computations were compared to experimental results as published by Sakata
and Sakimoto [112] and Sakimoto et al. [117]. Good coherence between the numerical and
experimental results indicated the suitability of the finite element model. The numerical analyses
of single arch rib bridges were confined to rectangular box sections and laterally fixed arches.
The adopted residual stress patterns due to welding are shown Figure 27.
ζrt
ζrc = 0.2 - 0.4fy
ζrc
b
h
ζrt
ζrt = 0.9fy
ζrc = 0.2 - 0.4fy
ζrt = fy
ζrc
b
h
Figure 27 Adopted residual stresses by Komatsu and Sakimoto [63] and Sakimoto and Komatsu
[114] (left) and Sakimoto and Komatsu [113] (right).
The finite element mesh for the arch rib consisted of 14-16 straight elements along the arch
length and the cross section was divided into 48 so-called sub-elements to incorporate residual
stress patterns and trace the growth of the plastic zones. An elastic-perfectly plastic material
model was used with a nominal yield stress. The shape of the arches considered was parabolic or
circular, with a rise-to-span (f/L) ratio in the range between 0.1 – 0.2. The shape of the lateral
imperfection was that of a half-sine curve with corresponding amplitude of 1/1000 of the arch
span length (L).
A summary of numerical results revealed that the reduction of the ultimate load carrying capacity
due to the presence of the residual stresses is about 20 % at maximum for parabolic mild steel
arches. It was also observed from computational results that unbounded lateral deflection of the
arch rib occurred before appearance of a fully plastic hinge Komatsu and Sakimoto [63].

Literature study on arch buckling 19
2.4.2 Dutch Research
Delrue [31] investigated the out-of-plane buckling behavior of arches subjected to uniform
compression and bending. A bilinear material law with a yield stress of 235 N/mm2 was used and
a residual stresses pattern based on roller bending stresses proposed by Timoshenko [132] and
shown in Figure 28 with: α = ratio between the plastic and elastic section modulus or shape
factor; fy = yield stress; h = height of cross section; and R = the radius of the circular arch. When
a bar or plate is plastically bent into a certain radius a plastic stress distribution emerges (Figure
28(b)). After releasing the acting moments, an elastic release or springback of the member takes
place, thereby imposing an elastic stress distribution on the already present loading stresses
(Figure 28(c)). The result is a stress distribution, which is a summation of the loading and
unloading stresses (Figure 28(d)). The prediction is founded on a uniaxial stress condition and
therefore no stress gradient is present along the width of the beam. The theoretical model has
found widespread application in the structural analysis of curved steel, King and Brown [61].
(α-1)fy
(a) cold bending under uniform moment (b) Loading (c) Unloading (d) Residual stresses
0 0 0
hMM
fy αfy
fyR
h
Figure 28 Theoretical residual stresses due to cold bending, Timoshenko [132].
Delrue performed linear buckling analyses and geometrically and material non-linear analyses to
study the elastic and elasto-plastic buckling behavior of steel arches. The elastic buckling
analyses were compared to closed form solutions presented by others (outlined in section
2.3).The finite element model consisted of shell elements: 10 elements over the cross section and
20 along the length. The initial crookedness was based on the Dutch standards for elevated
structures and beams, whichever was the largest.
A further contribution to non-linear finite element analyses on out-of-plane structural stability
behavior was proposed by La Poutre [65]. A finite element model was created and compared to
experiments on full-scale steel arches. The finite element model incorporated measured residual
stresses (Figure 29 (b)), cross-sectional imperfections and material properties measured from
roller bent sections and hence included the influence of the roller bending process. The residual
stress model was identical to Delrue (Figure 29(a)), with the exception of a residual stress
gradient in the bottom flange. The geometrical imperfections measured in the test-setup were
incorporated in the model. Shell elements were used to model the wide flange section; 6 elements
were used for the flange and web. It was found that the use of shell elements significantly
underestimated the torsional stiffness of the wide flange section, due to absence of the fillets. The
lack of torsional stiffness was compensated by adding beam elements at the web-to-flange
junctions. The dimensions of the beam elements were chosen to match the lacking torsional
stiffness. The finite element model provided accurate approximations of the elastic-plastic
buckling load and load-deformation characteristics.
2.4.3 Australian Research
In Pi and Trahair [95] and Pi and Bradford [87], a comprehensive study for the out-of-plane
stability of arches was presented. The FE model used consisted of specifically developed beam
elements described by Pi and Trahair [92]. These beam elements were verified with experiments
on beams and arches, Pi and Bradford [84], Pi and Trahair [94] and theoretical solutions: Pi and
Trahair [93], Pi and Trahair [94]. A hot-rolled residual stress pattern was used in all analyses
(Figure 29 (c)). It was stated that residual stresses due to cold bending have little influence due to

20 Structural properties and out-of-plane stability of roller bent steel arches
the fact that elastic-plastic buckling is controlled primarily by flange stresses, Papangelis and
Trahair [83], Pi and Trahair [96]. It was found that the incorporated residual stresses reduce the
load carrying capacity by up to 12 % for simply supported arches subjected to uniform
compression.
The initial lateral crookedness and twist were modeled by a half-sine wave and full-cosine wave
for pin-ended and fixed arches respectively. A maximum lateral crookedness of S/1000 was
adopted, in which S is the arch-rib length. The FE model used to investigate the out-of-plane
stability of arches included large displacements, von Mises yield criterion, associated flow rule
and strain hardening.
A tri-linear material law was adopted with a yield-plateau, based on typical stress-strain behavior
of mild-steel. The nominal yield stress was used.
ζfrt = 0.5fy
ζfrc = 0.35fy
ζfrt
ζfrc
h/4
h/2
h/4
ζwrt h/2
Delrue La Poutre Pi & Bradford
ζwrt = -ζwrc = fy
ζfrt = -ζfrc = fy(Mpl/Mel - 1)
ζfrc = -109 N/mm2
ζfrt = 191N/mm2
h
ζfrc
ζwrc ζwrt
ζfrc
ζfrt
ζwrc
a b c
Figure 29 Overview of applied residual stress patterns.
2.4.4 Other research studies
The 1st order elastic response and elastic buckling behavior for through-type arch bridges using
both an in-house developed finite element code and the commercial code ABAQUS was
presented by Nazmy [78]. Special attention was paid to joint resistance of arch ribs and bridge
deck to withstand gravitational and lateral wind loads. Several design variables were compared in
view of the internal force distribution and buckling resistance. The out-of-plane elastic buckling
behavior of steel arches as applied in bridges and the influence of stiffness of the bridge deck was
investigated by Bergmeister et al. [15]. The analyses were performed with beam elements and
confined to elastic material behavior. Both investigations treated the structural performance of
the arch together with the bridge-deck.
2.5 Design rules for out-of-plane strength of arches
Recent proposals for design rules for out-of-plane elastic-plastic buckling of arches have
independently been put forward in the countries: Japan, The Netherlands and Australia. The
proposed design rules are in close coherence with the earlier described finite element studies.
2.5.1 Japanese design rules
Komatsu and Sakimoto [63], Sakimoto and Komatsu [113] and Sakimoto and Komatsu [114]
showed that the column strength formula or column curve can be used to determine the out-of-
plane strength of a single arch bridge by employing a slenderness parameter what is identical for
columns. This formula was introduced by Sakimoto and Sakata [115] and was compared to
German and Japanese design provisions and numerical simulations.

Literature study on arch buckling 21
The proposed formula was founded on the following requirement:
s
pl
1N
N
(4)
In which:
Ns is the axial force at the support of the arch
Npl is the squash load of the cross-section
is the reduction factor obtained from the column curve as a function of the slenderness
parameter .
The slenderness parameter is analogous to the slenderness defined for columns.
e β L1 yf K K K S
E r
(5)
in which
Ke is an effective-length factor related to the end conditions, which equals 0.5 for the arch
with laterally clamped ends and 1.0 for the arch with laterally hinged ends.
Kβ is an effective length factor to account for the effect of the lateral bracing or end portal
frame, given as a function of the laterally braced length of the arch rib (For a freestanding arch
Kβ=1.0)
β e1 2 0.5 0.94 /K r aK (6)
In which
a is the distance between two arch ribs
β is the relative braced curved length of the arch, for a freestanding arch β=1.0, Sakimoto
and Komatsu [114]
is the shear-flexibility parameter of the bracing members, which was not specified by
Sakimoto and Sakata [115], but can be found in Sakimoto et al. [116].
KL is an effective-length factor to account for the direction of the applied load, depending
on the lateral bending stiffness of the floor system.
14
L gy ay gy ay
L gy ay
1 0.35 / / 1.0
0.65 / 1.0
K I I I I
K I I
(7)
Where
Igy is the moment of inertia for the floor system as a whole with respect to out-of-plane
bending
Iay is the moment of inertia for the connected arch ribs or single arch in case of a
freestanding arch.
S is the curved length of the arch rib
r is the radius of gyration of the single-arch rib with respect to out-of-plane bending.
The strength can be obtained by substituting the slenderness into the column formula to obtain χ=
Nult/Afy = ζ/fy, where A is the cross-sectional area. The column formula to predict the arch
strength can be either the ECCS column curve “c”, curve “2” of the SSRC multiple column
curves or similar column curves provided by other standards.
The design rule covers both braced and freestanding arches. The applicability of the formula has
been confirmed for freestanding arches by comparing its design loads with those of computer
simulations, as demonstrated by Sakimoto et al. [116] (Figure 30), and Sakimoto and Komatsu
[114] using the column curve according the Japanese Specification for Highway Bridges (JSBH).

22 Structural properties and out-of-plane stability of roller bent steel arches
Sakata and Sakimoto [112] performed buckling tests on single and twin arch ribs loaded by a
uniform vertical load. The experimental results were compared with the proposed design rule and
good coherence was found (Figure 30).
The design rule is only valid for freestanding arches which are composed of box-sections with
rise-to-span ratios in the range between 0.1 – 0.2 subjected to a uniformly distributed load over
the entire span. The design rule applies to circular and parabolic arches. Although the design
rules seem straightforward, easy to implement and shows good coherence with both finite
element results and experimental results, it suffers from a number of limitations. Firstly, it
assumes that the subtended angle has no significant influence on the collapse strength of steel
arches. This is highly doubtful when examining the closed form solutions for the elastic buckling
load as presented section 2.3. Secondly, the Japanese research papers postulate implicitly that the
torsional rigidity has no influence on the elastic-plastic buckling response, restricting the design
rule to sections with high torsional rigidity (e.g. box-sections).
0.5
0.4=
0.1 0.2Shape
S
0 2.0
0.5
1.0
Parabolic
Circular
f/L
LNuNu
JSBH
Column CurveVertical Load
Square box section
=875Efy
=w0
L1
1000
λ
σrc
f
0.5 1.0
1.0
JSBH
Column Curve
No.1
No.2
No.3
No.4
No.5
No.6
No.9
No.10
No.11
Twin Singleχ
fy
χ
λ
Figure 30 Lateral buckling strength of a single arch rib (re-drawn from Sakimoto et al.
[116])(left) and experimental results for buckling strength of arches (re-drawn from Sakata and
Sakimoto [112]) (right).
2.5.2 Dutch design rules
Delrue [31] suggested the use of column curves for arches subjected to uniform bending and
compression. The slenderness is defined as the square root of the ratio between the in-plane
plastic collapse load and the elastic buckling load. The in-plane plastic collapse load was taken to
be the squash load and the plastic bending moment of the cross section for uniform compression
and uniform bending, respectively. The elastic buckling load is to be determined with the
equations of Rajasekaran and Padmanabhan [102]. A modification factor was introduced in this
formula to account for a slight deviation between finite element results and the closed form
solution by Rajasekaran and Padmanabhan [102] for arches with a considerable rise-to-span
ratio.
The proposed design rule was verified by comparing finite element calculations with column
curve “a” of the ECCS multiple column curves (Figure 31). Good agreement between the
numerical results and the column curve indicated the applicability of column curves to
approximate the elastic-plastic buckling load of freestanding arches.
The analyses were limited to laterally simply supported arches which are highly susceptible to
out-of-plane buckling, as illustrated by the high slenderness values and low dimensionless
carrying capacity (Figure 31).

Literature study on arch buckling 23
Uniform bending
10-1
10-1
10-4
10-3
0 10 20 30 40 50 60 70
1
Uniform compression
ECCS column curve a
10-2
ECCS column curve a
0 1 2 3 4 5 6 7
1
M M
Finite element calculations
Finite element calculations
λ
χ χ
Finite element calculations
λ
Figure 31 Column curve with finite element results according Delrue [31].
The studies were expanded to in-plane pinned and laterally fixed arches subjected to a tilting load
applied at the crown La Poutre [65], who adopted an experimental and finite element approach.
Two different cross-sections were investigated: HE 100A and HE 600B*, with the latter tested to
scale. Similar to Delrue and the Japanese research, a column curve was suggested to obtain the
load-carrying capacity of freestanding arches susceptible to out-of-plane buckling. The
slenderness for the arches was, however, different from the slenderness definition according to
the Japanese research but identical to the proposal of Delrue:
MNA
LBA
F
F (8)
Where:
FMNA is the in-plane plastic collapse load
FLBA is the elastic buckling load out-of-plane
These parameters can be determined by using finite element techniques. By substituting the non-
dimensional slenderness into an ECCS column curve the non-dimensional elastic-plastic
buckling load χ can be obtained. According to Ziemian [149] curve “b” is considered best
suitable. Subsequently the elastic-plastic buckling load can be determined by combining the
reduction factor from the column curve with the in-plane plastic collapse load:
GMNIA
MNA
F
F (9)
Where:
FGMNIA is the elasto-plastic buckling load out-of-plane
The use of column curves was investigated by obtaining a reduction factor χ from experiments
(Figure 32 (left)) and finite element simulations (Figure 32 (right)). This reduction factor was
plotted in the column curves graph along with the numerically obtained slenderness value. It was
found that the experimental values lie above the most favorable column curve “a”. Hence, the
analyses showed that the use of column curves provides a good approximation for obtaining the

24 Structural properties and out-of-plane stability of roller bent steel arches
elastic-plastic buckling load of freestanding arches provided that the slenderness parameter can
be determined.
χexp HE 100A
χexp HE 600B*
curve “a”
curve “d”
1.20.80.40
0
1
λ [-]
χexp
[-]
χexp Sim. of exp
χexp Additional sim.
curve “a”
curve “d”
1.510.50
0
1
λ [-]
χsim
[-]
Figure 32 Experimental results (left) and finite element results (right) in conjunction with ECCS
column curves (re-drawn from Ziemian [149]).
Hence, column curves can be used to predict the elastic-plastic buckling load of freestanding
arches when examining the Dutch research efforts. Although the slenderness definition is more
complex when compared to the Japanese design rule, it takes into account the effect of arch
curvature and is not restricted to sections with high torsional rigidity only.
2.5.3 Australian design rules
2.5.3.1 Uniform bending and uniform compression
Pi and Trahair [95] and Pi and Bradford [87] employed column curves to predict the out-of-plane
strength for in-plane pinned and out-of-plane simply supported arches and in-plane fixed and out-
of-plane fixed arches subjected to uniform compression and uniform bending, similar to Delrue
[31]. The elastic-plastic buckling load of a circular arch subjected to a radially distributed load
can be estimated by the following formula:
ult ca plN N (10)
Whereca and Npl are the column slenderness reduction factor from the Australian column
curves and the squash load of the cross-section, respectively. The column curve is given by:
ca a
a
901 1
(11)
With:
2
a y pl
a 2
y ya cr
a
90 1 1,
2502 90
0.00326 13.5 0
f NS
r k N
(12)
Where is a non-dimensional slenderness, ry is the radius of gyration about the minor axis, and
Ncr is the elastic buckling load of an arch subjected to a uniformly distributed load as given by Pi
and Trahair [95] and Pi and Bradford [86] for a pin-ended arch and fixed arch, respectively.
The applicability of the suggested design rule was determined by performing geometrical
material non-linear finite element analyses. By examining the nominal capacity and the
slenderness, the column curves were verified and it was concluded that the column curves
provided values for the out-of-plane strengths with high accuracy for both pin-ended and fixed
support conditions, Pi and Trahair [95], Pi and Bradford [87].

Literature study on arch buckling 25
For an arch subjected to uniform bending its nominal capacity can be determined according:
ult sa plM α M (13)
Where Mpl is the plastic moment capacity of the cross-section and sa is the arch column curve
for an arch in uniform bending defined by:
4 2
asa 0.6 3α λ λ
(14)
With:
pl
cr
Mλ
M (15)
reflecting the non-dimensional slenderness of an arch in uniform bending. Mcr is the elastic
buckling load for an arch under uniform bending, which can be computed according to Pi et al.
[91] for pin-ended support conditions. For a laterally fixed arch Mcr must obtained according Pi
and Bradford [86]. The proposed design nominal capacity given by equation (13) gives the
strength of arches in uniform bending with reasonable accuracy when compared to finite element
analyses, as stated in Pi and Trahair [95] and Pi and Bradford [87] for pin-ended arches and fixed
arches respectively. For an arch under uniform bending or uniform compression, the Australian
design rule is identical to the Dutch equivalent, with the exception that the Australians adopt their
own column curve, whereas the Dutch research utilizes the ECCS column curve.
2.5.3.2 Vertical loading
For arches subjected to vertical loading which display a combination of compression and bending
in the arch-rib, design rules for the out-of-plane strength were derived for in-plane pinned and
out-of-plane pinned arches by Pi and Trahair [96] and fixed arches by Pi and Bradford [87],
respectively. These design rules are formulated as an interaction formula which is based on the
column curves for arches subjected to uniform compression and bending as outlined in the
previous section.
The design rule for pin-ended arches by Pi and Trahair [96] is described as follows:
m m
any ult amy ult
N M
N M
(16)
for which:
Nult = the design strength of a pin-ended arch in uniform compression according
(10)
Mult = the design strength of a pin-ended steel arch in uniform bending according
(13)
Nm = the maximum axial compression based on a first order elastic analysis
Mm = the maximum bending moment based on a first order elastic analysis
any = axial compression modification factor
amy = moment modification factor
= capacity factor, 0.9
The design rule for fixed arches by Pi and Bradford [87] is listed below, which is the same to the
previous design rule for pin-ended arches:
* *
any ult amy ult
1N M
N M
(17)
for which:
Nult = the design strength of a fixed arch in compression according (10)

26 Structural properties and out-of-plane stability of roller bent steel arches
Mult = the design strength of a pin-ended steel arch in uniform bending based (13)
N* = the maximum axial compression obtained by a first order elastic analysis
M* = the maximum moment given by: by mM
Mm = maximum moment obtained by a first order elastic analysis
δby = the moment amplification factor given by: *
by cr1/ 1 /N N
Ncr = elastic flexural-torsional buckling load of a fixed arch in uniform
compression according Pi and Bradford [86]
any = axial compression modification factor, for fixed arches
amy = moment modification factor, for fixed arches
= capacity factor, 0.9
The modification factors for axial compression and bending, for pin-ended and fixed support
conditions are presented in Table 5.
Table 5 Factors for out-of-plane strength of hinged and fixed arches.
Load-
case
q
q
L/2
F
L
FL/4
Hinge 1)
αany 1.1 1.5 1.4 2.7
αamy 1.1 1.1 1.2 1.2
Fixed 2)
αany 1.2 1.6 1.4 2.2
αamy 2.2 2.2 1.5 1.8 1) Pi and Trahair [96] 2) Pi and Bradford [87]
The design equations for pin-ended arches was compared with finite element analyses for arches
with subtended angle 5° – 150° and modified slenderness = 0.20-5.55 according to equation
(15). The proposed design equation yielded generally satisfactory predictions, see Figure 33.
Prediction
0.4
0.6
0.8
1.0
1.2
0.2
0.4
0.6
0.8
1.0
1.2
0.2
Prediction
Results for central concentrated loadResults for quarter point concentrated load
F FL/4
Dimensionless nominal moment m amy ult/M M
Dim
ensi
on
less
ax
ial
com
pre
sio
nm
any
ult
/N
N
0.2 0.4 0.6 0.8 1.0
1.0
1.2
θ θ
q q
L/2
θ θ
Dimensionless nominal moment m amy ult/M M0.2 0.4 0.6 0.8 1.0 1.2
Dim
ensi
on
less
ax
ial
com
pre
sio
nm
any
ult
/N
N
Results for entire arch distributed loadResults for half arch distributed load
1.0
Figure 33 Strength of pin-ended arches with concentrated loads (left) and distributed loads (right)
figure re-drawn from Pi and Trahair [96].

Literature study on arch buckling 27
The proposed design rule for fixed arches was checked against finite element simulations with an
out-of-plane slenderness ratio of 25 ≤ 0.5S/ry ≤ 340 and included angle from 10° to 180°. It was
recommended by Pi and Bradford [87] that a second-order in-plane elastic analysis should be
carried out for fixed arches to obtain N* and M* when the moment amplification factor δby
exceeds 1.4.
2.5.4 Other design rules
Several national design codes give limited formulae to verify the out-of-plane buckling resistance
of steel arches. The German steel design code DIN 18800 and the Japanese Specification for
Highway Bridges (JSBH) provide limited formulae to check the out-of-plane buckling resistance
of freestanding arches. The design rules as suggested by the Japanese research group are a
modification to these earlier national design codes.
A comprehensive manual to check the in-plane stability and out-of-plane stability of arches is
provided by the Steel Construction Institute (SCI) in a publication by King and Brown [61]. A
distinction is made between arch members under hogging moments and arch members under
sagging moments. When confronted with hogging moments the manual suggests to treat the arch
member similar as a straight member, since the hogging moment in conjunction with the
curvature of the member will have a positive influence on the member resistance. Curved
members under sagging moments require a different approach. The manual suggests treating the
problem analogous to a straight member susceptible to lateral torsional buckling, with the
exception of using a different slenderness value. The effective slenderness for a curved member
can be computed as follows:
2
pl
cr y
π=
M E
M p (18)
Where:
Mpl = the capacity of the member, ignoring shear stresses, depending on the
section class.
py = the design strength
Mcr = the elastic critical buckling moment for a curved member defined by:
2 2
2 2
cr
14
2
c cab
R R L RM
(19)
a = out-of-plane bending stiffness EIz
b = 2 2
t w /GI EI L
c = a + b
R = radius of the curved member
E = modulus of elasticity of steel
Iz = second moment of area
It = torsional constant
Iw = warping constant
L = the distance between torsional restraints.
The length of the member is taken as the distance between two torsional supports. Equation (19)
is based on the work of Vacharajittiphan and Trahair [136] and Timoshenko and Gere [133].
Using the effective slenderness the stability checks for members for arches under a combination
of bending and axial compression can be performed according the BS 5950-1. In addition the SCI
states that curved members under bending moment and axial loads must also resist the out-of-
plane component. This out-of-plane component results from the curvature of the member. The

28 Structural properties and out-of-plane stability of roller bent steel arches
out-of-plane component is featured by radial loads (Figure 34(a)-(b)), which in turn must be
resisted by out-of-plane bending in the flange (Figure 34 (c)). The out-of-plane bending stress
(Figure 34(d)) is given by:
2
1
2
f
3 0.5
4
b
Rt
(20)
Where:
ζ1 = the stresses emerging from in-plane loading in the flanges
b = the width of the section
R = the radius of the curved member
tf = flange thickness
σ1
σ1
Radial
loads
σ1
σ1
(b) Radial
loads
(c) Bending
moments
σ2
(d) Out-of-plane
stresses in flange
(a) Out-of-plane bending of
I section flanges
Radial loads
R
tf
0.5b
b
h
Figure 34 Out-of-plane bending stresses in flange (re-drawn from King and Brown [61])
2.6 Conclusions
This chapter presented an overview of design equations for the plastic collapse load and the out-
of-plane elastic buckling load of steel arches. In addition an overview was given on non-linear
finite element techniques to obtain the elastic-plastic buckling load of freestanding arches and the
accompanying design rules. From the literature survey the following conclusions can be drawn.
The in-plane plastic collapse load and out-of-plane elastic buckling load for arches under vertical
loads can only be determined with design graphs. For less practical load cases, featured by an
arch under uniform bending or uniform compression, closed-form equations are available in the
literature to obtain the elastic buckling load. The out-of-plane elastic-plastic buckling behavior of
steel arches is influenced by its geometry, cross-sectional properties and steel imperfections. It
was observed that the residual stresses and geometrical imperfections have a significant influence
on the out-of-plane buckling load. With the exception of the research study of La Poutre, the
influence of the roller bending process was not taken into account.
Several design rules have been proposed, treating the arch buckling behavior analogously to the
flexural buckling of steel columns, suggesting column curves be able to give the collapse load of
arches. In that case a problem arises in the slenderness definition and the reduction factor, for
which different possibilities exist. The use of column curves has been verified for arches under
uniform compression, uniform bending and single force applied at the crown. For arches
subjected to vertical loading, the Australian design rules treat arch buckling similarly to beam-
column buckling, thereby splitting the problem into compressive action and flexural action in the
arch-rib. An interaction formula was proposed, but does not take into account the influence of the
roller bending process.

3 Experimental investigation of residual stresses Residual stresses in straight hot rolled wide flange sections are well documented and have been
investigated in the recent past. However, to the knowledge of the author, residual stress
measurements have not been published on roller bent wide flange sections. Since roller bent
sections underwent severe plastic deformation during the forming process, the well-known
residual stress patterns from hot rolling may not be appropriate for roller bent steel. It is
important that a realistic residual stress pattern is implemented when assessing the load carrying
capacity of roller bent arches. An experimental program has been carried out to investigate the
residual stresses in roller bent wide flange sections bent about the strong axis. Residual stresses
were measured with the sectioning method. The experimental technique was investigated with
respect to possible temperature influence and repeatability of the measurements. Experimental
values revealed that the residual stress pattern and magnitude in roller bent sections is different
when compared to their straight counterparts. Parts of this chapter have been published in
Spoorenberg et al. [122].
3.1 Introduction
3.1.1 Straight hot rolled sections
The residual stress distributions in straight hot rolled wide flange sections are well documented
and based on numerous experiments as presented by Huber and Beedle [49], Beedle and Tall
[11], Jez-Gala [50], Mas and Massonet [72], Lay and Ward [69], Daddi and Mazzolani [29],
Young [148] and Ziemian [149] amongst others. The residual stress distribution in straight hot
rolled sections is characterized by compressive residual stresses (-) at the flange tips and tension
at the web to flange junctions (+). The web is under compressive and tensile residual stresses, as
illustrated in Figure 35(a-b).
0
200
N/mm2
0 200
12 WF 50 section 16×7 in. section
205.2 mm
309.6
mm
177.8 mm
406.4
mm
Hot-rolled Rotorized
200 mm
HE 200A section
196 m
m
(b) Young(a) Beedle & Tall (c) Alpsten Figure 35 Residual stress models
The magnitude of the residual stresses in these hot rolled shapes greatly depends on the
geometric properties and the cooling conditions. When a member is straightened (also called
rotorized) after leaving the steel mill to fulfill the straightness requirements of hot rolled shapes,
it exhibits a different residual stress distribution as reported by Alpsten [2]. The residual stresses

30 Structural properties and out-of-plane stability of roller bent steel arches
caused by earlier cooling are redistributed depending on the amount of straightening, (Figure
35(c)).
3.1.2 Cold bent sections
Residual stresses have been measured in cold bent sections earlier. Kato and Aoki [56]
investigated the residual stress distribution in cold formed circular hollow sections analytically
and experimentally. Weng and White [141] and Weng and Pekoz [140] measured residual
stresses in press braked plates. Tan et al. [131] evaluated the residual stress in bent metal sheets.
To the author‟s knowledge no experimental investigation with respect to residual stress
distributions has been performed on roller bent wide flange sections.
Section 2.4 showed that residual stresses are of paramount importance when investigating the
load carrying capacity of steel arches. The computed results were based on arches with either
welding residual stresses or residual stress due to differential cooling, not on residual stresses due
to cold forming. Since the material experienced severe plastic straining during rolling it cannot
be assumed that the residual stresses in roller bent sections are identical to their straight hot rolled
counterparts. Incorporating a hot rolled stress distribution in numerical form to assess the load
carrying capacity of roller bent arches may therefore yield inaccurate results. The numerical
computations could also be carried out by implementing the theoretical residual stress pattern in
cold forming as suggested by Timoshenko (see section 2.4.2). But his theoretical residual stress
distribution is questioned since the true bending process exhibits a complex interaction between
rolls and beam, as explained in section 1.3 which cannot be represented by a uniaxial loading-
unloading scheme.
The aim of the experimental study is to investigate the residual stress patterns of roller bent
sections. The sectioning method in conjunction with electrical strain gauges was employed to
establish the residual stress distributions for 18 curved steel sections, bent to different radii and
with different steel grades. Also measurements on 11 straight reference sections were carried out
to assess the influence of the roller bending process. Previous measurements of residual stresses
on roller bent sections with the hole-drilling method yielded unsatisfactory results, La Poutre
[65]. Since possible disturbances caused by the sectioning method were expected based on
previous research, additional measurements were carried out to investigate the robustness of the
measurement technique.
3.1.3 Experimental program
Table 6 shows the experimental program. The program comprised small and medium size wide
flange sections with different curvature and steel grade. Each arch was curved from straight hot
rolled steel. The initial residual stress distribution and base material properties were determined
from the straight sections serving as reference sections (Figure 36).
R=3820 mm
Straight reference section
R=2546 mm
Curved Specimen
Figure 36 Position of straight reference section.

Experimental investigation of residual stresses 31
Coupons were milled from straight reference sections and subjected to a uniaxial tension test to
obtain the Young‟s modulus, yield stress (fy) and tensile stress (ft). The 0.2% offset proof stress
was adopted as the yield stress. Extra tests were performed on curved coupons taken from the top
flange to assess the increase in yield stress and tensile stress due to cold forming as associated
with the roller bending process.
Table 6 Experimental program
Specimen Type Mechanical properties
straight reference sections
Steel
Grade
Bending
radius
R
[mm]
Number of
Strain
gauges fy
[N/mm2]
ft
[N/mm2]
A HE 100A 322 433 S235 1910 40
B 279 418 2546 40
C 3820 40
D 364 566 S355 1910 40
E 2546 40
F 3820 40
G HE 100B 248 411 S235 1910 40
H 285 412 2546 40
I 3820 40
J 386 492 S355 1910 40
K 390 495 2546 40
L 3820 40
M HE 360B 269 389 S235 8000 108
N 357 534 S355 8000 108
O IPE 360 297 414 S235 4500 84
P 8000 84
Q 361 528 S355 4500 84
R 8000 84
3.2 Specimen preparation
The sectioning method was used to measure residual stresses in roller bent steel arches. The test
specimen was saw cut from larger steel arches. Electrical strain gauges were applied to the
surface of the roller bent wide flange sections. Electrical strain gauges were selected in
preference to a mechanical gauge or Whittemore gauge due to their better accuracy and
applicability to curved steel. For this investigation small (2 x 6 mm) electric strain gauges
manufactured by Tokyo Sokki Kankyujo Co. Ltd. were used. The arrangement of the strain
gauges is shown in Figure 37(a). To reduce end effects, the test area was a distance of 2.5 times
the height of the beam from the ends (see Figure 37(b)). The number of strain gauges used on
each of the specimens is presented in Table 6. Only the longitudinal stresses were measured.
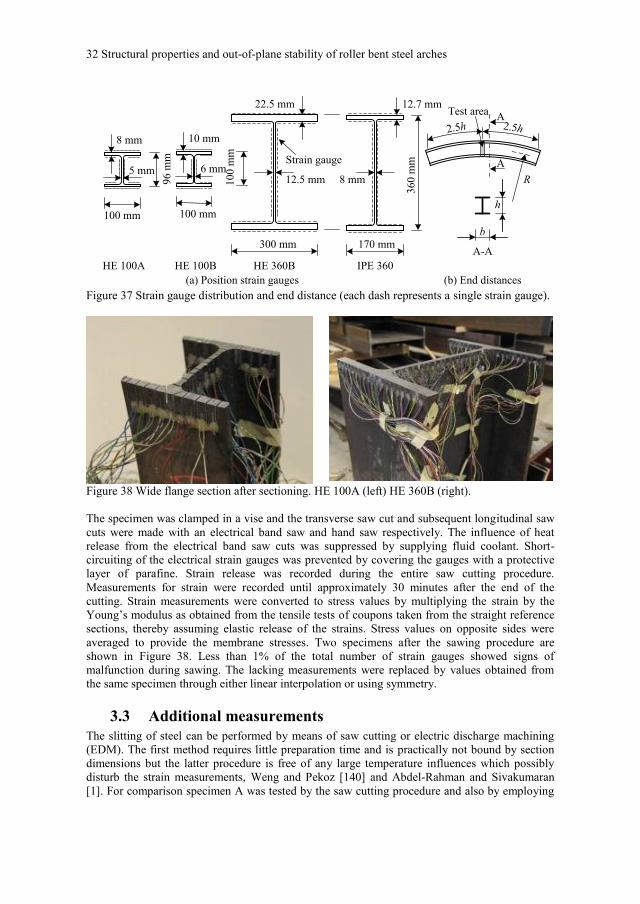
32 Structural properties and out-of-plane stability of roller bent steel arches
5 mm8 mm
360 m
m
300 mm 170 mm
100 mm
96 m
m
12.5 mm
22.5 mm 12.7 mm
IPE 360HE 360BHE 100A
8 mm
(b) End distances
R
2.5h2.5h
h
b
A-A
A
ATest area
Strain gauge
(a) Position strain gauges
6 mm
100 mm
100 m
m
10 mm
HE 100B
Figure 37 Strain gauge distribution and end distance (each dash represents a single strain gauge).
Figure 38 Wide flange section after sectioning. HE 100A (left) HE 360B (right).
The specimen was clamped in a vise and the transverse saw cut and subsequent longitudinal saw
cuts were made with an electrical band saw and hand saw respectively. The influence of heat
release from the electrical band saw cuts was suppressed by supplying fluid coolant. Short-
circuiting of the electrical strain gauges was prevented by covering the gauges with a protective
layer of parafine. Strain release was recorded during the entire saw cutting procedure.
Measurements for strain were recorded until approximately 30 minutes after the end of the
cutting. Strain measurements were converted to stress values by multiplying the strain by the
Young‟s modulus as obtained from the tensile tests of coupons taken from the straight reference
sections, thereby assuming elastic release of the strains. Stress values on opposite sides were
averaged to provide the membrane stresses. Two specimens after the sawing procedure are
shown in Figure 38. Less than 1% of the total number of strain gauges showed signs of
malfunction during sawing. The lacking measurements were replaced by values obtained from
the same specimen through either linear interpolation or using symmetry.
3.3 Additional measurements
The slitting of steel can be performed by means of saw cutting or electric discharge machining
(EDM). The first method requires little preparation time and is practically not bound by section
dimensions but the latter procedure is free of any large temperature influences which possibly
disturb the strain measurements, Weng and Pekoz [140] and Abdel-Rahman and Sivakumaran
[1]. For comparison specimen A was tested by the saw cutting procedure and also by employing

Experimental investigation of residual stresses 33
the electric discharging machining technique in order to investigate possible temperature
influences from the saw cutting procedure. In addition specimen F was investigated with the saw
cutting procedure at three different positions along the curved member in order to review the
variation or scatter of the residual stresses and to assess the robustness of the measurement
technique. Based on observations from these additional measurements it can be concluded that
temperature effects are not of any significant influence with respect to the experimental data, as
obtained with the saw cutting procedure. Also it can be stated that the measurement technique is
robust. A full review on the possible disturbance caused by the saw cutting procedure and the
scatter of residual stresses at various locations along the member is presented in section 3.5.
3.4 Experimental results
3.4.1 Introduction
Results for all experimental findings are presented. The residual stresses in the flanges and webs
of straight beams due to hot rolling of the various steel sections are shown in (Figure 39-Figure
42) for HE 100A, HE 100B, HE 360B and IPE 360 sections respectively. The annotation of top
flange and bottom flange is according Figure 23.
-200
-100
0
100
200
-50 0 50
-48
0
48
-200
-100 0
100
200
-200
-100
0
100
200
-50 0 50
(A)
S235
Top fl.
Bot. fl.
-50
-25
0
25
50
-50 0 50
-48
0
48
-20
0
-10
0 0
10
0
20
0
-50
-25
0
25
50
-50 0 50
(B, C)
S235
Top fl.
Bot. fl.
-50
-25
0
25
50
-50 0 50
-48
0
48
-100
-50 0
50
10
0
-50
-25
0
25
50
-50 0 50
(D, E, F)
S355
Top fl.
Bot. fl.
Outside, left Inside, right Average Theory
Figure 39 Hot-rolled residual stresses in straight HE 100A reference section in N/mm2.

34 Structural properties and out-of-plane stability of roller bent steel arches
-200
-100
0
100
200
-50 0 50
-50
0
50
-10
0 0
10
0
-200
-100
0
100
200
-50 0 50
(G)
S235
-50
-25
0
25
50
-50 0 50
-50
0
50
-50
-25 0
25
50
-50
-25
0
25
50
-50 0 50
(H-I)
S235
Top fl.
Bot. fl.
Top fl.
Bot. fl.
-50
-25
0
25
50
-50 0 50
-50
0
50
-100
-50 0
50
100
-50
-25
0
25
50
-50 0 50
(J)
S355
Top fl.
Bot. fl.
-50
-25
0
25
50
-50 0 50
-50
0
50
-100
-50 0
50
100
-50
-25
0
25
50
-50 0 50
(K-L)
S355
Top fl.
Bot. fl.
-200
-100
0
100
200
-50 0 50
-50
0
50
-10
0 0
10
0-200
-100
0
100
200
-50 0 50
(G)
S235
-50
-25
0
25
50
-50 0 50
-50
0
50
-50
-25 0
25
50
-50
-25
0
25
50
-50 0 50
(H-I)
S235
Top fl.
Bot. fl.
Top fl.
Bot. fl.
-50
-25
0
25
50
-50 0 50
-50
0
50
-100
-50 0
50
100
-50
-25
0
25
50
-50 0 50
(J)
S355
Top fl.
Bot. fl.
-50
-25
0
25
50
-50 0 50
-50
0
50
-100
-50 0
50
100
-50
-25
0
25
50
-50 0 50
(K-L)
S355
Top fl.
Bot. fl.
Outside, left Inside, right Average Theory
Figure 40 Hot-rolled residual stresses in straight HE 100B reference section in N/mm2.
The final residual stress distributions across the sections of curved beams as a result of the roller
bending process are given in (Figure 43-Figure 46)for the HE 100A, HE 100B, HE 360B and IPE
360 sections respectively. The measured data of the roller bent specimens is supplemented with
the theoretical distribution of residual stresses in cold bent sections as proposed by Timoshenko
[132], (outlined in section 2.4.2 and Figure 28), incorporating the measured yield stress (Table 6)
and shape factor of the straight wide flange sections.
3.4.2 Straight sections
The residual stresses for the straight HE 100A and HE 100B beams are presented in Figure 39
and Figure 40 respectively. The results show typical residual stress distributions for the members
when compared to earlier presented results by Daddi and Mazzolani [29] and Mazzolani [73]. It
should be noted that for the straight reference section for specimens D, E and F only a limited
number of strain gauges were employed.

Experimental investigation of residual stresses 35
(M)
S235
-100
0
100
200
-150 0 150
-100
0
100
200
-150 0 150
(N)
S355
-100
0
100
200
-150 0 150
-100
0
100
200
-150 0 150
Top fl.
Bot. fl.
Top fl.
Bot. fl.
-300
-150 0
150
300
-300
-150 0
150
300
Outside, left Inside, right Average Theory
Figure 41 Hot-rolled residual stresses in straight HE 360B reference section in N/mm2.
Measured hot rolled residual stress distributions in the straight HE 360 B and IPE 360 beams are
presented in Figure 41 and Figure 42 respectively. The observed stress distributions across the
webs in compression and tension near the flanges agree very well with theoretical predictions. It
is also shown that the hot rolled residual stresses in the larger HE 360B and IPE 360 sections are
higher than in the smaller HE 100A and HE 100B sections confirming previous experimental
results by Young [148] that the magnitude of hot rolled stresses is dependent on the section size
and geometry. The large differences in residual stresses between the left and right hand sides of
the webs near the fillets are taken to be the result of straightening of the beams where after
milling rollers are applied near the fillets Bjorhovde [17].

36 Structural properties and out-of-plane stability of roller bent steel arches
-100
-50
0
50
100
-85 0 85
-100
-50
0
50
100
-85 0 85
(O,P)
S235
Top fl.
Bot. fl.
-200
-100 0
100
200
-100
0
100
200
-85 0 85
-100
0
100
200
-85 0 85
(Q, R)
S355
Top fl.
Bot. fl.
-200
-100 0
100
200
Outside, left Inside, right Average Theory
Figure 42 Hot-rolled residual stresses in straight IPE 360 reference section in N/mm2.
3.4.3 Roller bent HE 100A sections
The residual stress distributions due to roller bending of HE 100A beams are given in Figure 43.
The diagrams show that the maximum tensile stresses are in the bottom flanges at the web to
flange junction. The webs of the sections mainly display compressive residual stresses. The stress
distributions in the sections of steel beams consisting of S355 material are similar to those for the
members with steel grade S235. Although the maximum residual stresses are higher for the S355
members, the maximum tensile and compressive stresses are also observed at the web to flange
junctions and webs respectively. It is noted that the maximum measured residual stress in
specimen A is 353 N/mm2. This is 10% above the yield stress and 18% below the tensile stress of
the straight beam. It is noted that the maximum measured residual stress in specimen D is 468
N/mm2. This is 29% above the yield stress and 17% below the tensile stress of the straight beam.

Experimental investigation of residual stresses 37
-100
-50
0
50
100
-50 0 50
-48
0
48
-300
-150 0
150
300
-200
0
200
400
-50 0 50
(A)
S235
R=1910 mm
-100
-50
0
50
100
-50 0 50
-48
0
48
-300
-150 0
150
300
-200
0
200
400
-50 0 50
-100
-50
0
50
100
-50 0 50
-48
0
48
-300
-150 0
150
300
-200
0
200
400
-50 0 50
-200
-100
0
100
200
-50 0 50
-48
0
48
-400
-200 0
20
0
40
0
-200
0
200
400
600
-50 0 50
-200
-100
0
100
200
-50 0 50
-48
0
48
-40
0
-20
0 0
200
400
-200
0
200
400
600
-50 0 50
-200
-100
0
100
200
-50 0 50
-48
0
48
-40
0
-20
0 0
200
400
-200
0
200
400
600
-50 0 50
(B)
S235
R=2546 mm
(C)
S235
R=3820 mm
(D)
S355
R=1910 mm
(E)
S355
R=2546 mm
(F)
S355
R=3820 mm
Top fl.
Bot. fl.
Top fl.
Bot. fl.
Top fl.
Bot. fl.
Top fl.
Bot. fl.
Top fl.
Bot. fl.
Top fl.
Bot. fl.
Outside, left Inside, right Average Theory
Figure 43 Residual stresses after roller bending of hot-rolled HE 100A section in N/mm2.
3.4.4 Roller bent HE 100B sections
A plot of the residual stresses of the roller bent HE 100B specimens is shown in Figure 44.
Similarly to the HE 100A sections, it can be seen that the top flange is featured by small
compressive stresses and the bottom flange is featured by large tensile residual stresses.

38 Structural properties and out-of-plane stability of roller bent steel arches
-200
-100
0
100
200
-50 0 50
-50
0
50
-300
-150 0
150
300
-200
0
200
400
-50 0 50
(G)
S235
R=1910mm
Top fl.
Bot. fl.
-200
-100
0
100
200
-50 0 50
-50
0
50
-300
-150 0
150
300
-200
0
200
400
-50 0 50
(H)
S235
R=2546mm
Top fl.
Bot. fl.
-200
-100
0
100
200
-50 0 50
-50
0
50
-300
-150 0
150
300
-200
0
200
400
-50 0 50
(I)
S235
R=3820mm
Top fl.
Bot. fl.
-200
-100
0
100
200
-50 0 50
-50
0
50
-400
-200 0
200
400
-200
0
200
400
600
-50 0 50
(J)
S355
R=1910mm
Top fl.
Bot. fl.
-200
-100
0
100
200
-50 0 50
-50
0
50
-400
-200 0
200
400
-200
0
200
400
600
-50 0 50
(K)
S355
R=2546mm
Top fl.
Bot. fl.
-200
-100
0
100
200
-50 0 50
-50
0
50
-400
-200 0
200
400
-200
0
200
400
600
-50 0 50
(L)
S355
R=3820mm
Top fl.
Bot. fl.
Outside, left Inside, right Average Theory
Figure 44 Residual stresses after roller bending of hot-rolled HE 100B section in N/mm2.
3.4.5 Roller bent HE 360B sections
The residual stress distribution for specimen M and specimen N are shown in Figure 45. It is
observed that compressive stresses and tensile stresses are present in the top flange of the S235
and S355 specimen respectively. The residual stresses in the roller bent member with steel grade
S355 are distributed with 473 N/mm2 in tension at the bottom flange center and -139 N/mm2 at
the web.

Experimental investigation of residual stresses 39
(M)
S235
R=8000 mm
-200
-100
0
100
-150 0 150
-200
0
200
400
-150 0 150
-30
0
-15
0 0
150
30
0
(N)
S355
R=8000 mm
-100
0
100
200
-150 0 150
-200
0
200
400
600
-150 0 150
Top fl.
Bot. fl.
Top fl.
Bot. fl.
-40
0
-20
0 0
200
40
0
Outside, left Inside, right Average Theory
Figure 45 Residual stresses after roller bending of hot-rolled HE 360B section in N/mm2.
3.4.6 Roller bent IPE 360 sections
The residual stress distributions due to roller bending of hot rolled IPE 360 beams are shown in
Figure 46. The average values of the residual stresses in the top flange are quite small but larger
values were found in the web and bottom flange. The rather large differences between stresses
obtained from the outside measurements and inside measurements along a limited width of the
flange indicate the presence of local bending in the top flange. This bending, however, has minor
influence on the average stress distribution. It can be seen that the residual stresses obtained from
both sides of the web are very close, with the exception of specimen Q.
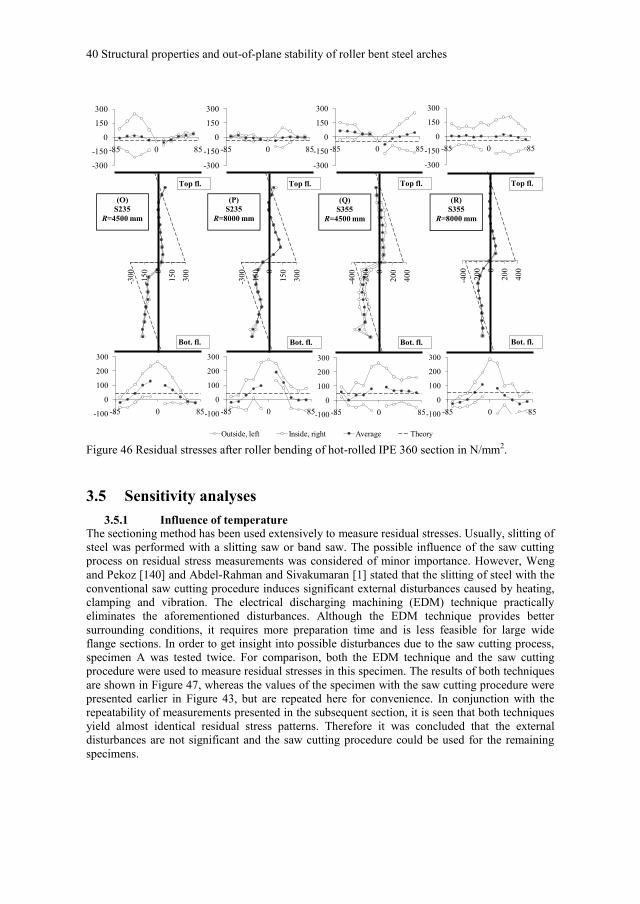
40 Structural properties and out-of-plane stability of roller bent steel arches
-300
-150
0
150
300
-85 0 85
-300
-150 0
150
300
-100
0
100
200
300
-85 0 85
(O)
S235
R=4500 mm
-300
-150
0
150
300
-85 0 85
-100
0
100
200
300
-85 0 85
(P)
S235
R=8000 mm
-300
-150
0
150
300
-85 0 85
-100
0
100
200
300
-85 0 85
(Q)
S355
R=4500 mm
-300
-150
0
150
300
-85 0 85
-100
0
100
200
300
-85 0 85
(R)
S355
R=8000 mm
Top fl.
Bot. fl.
Top fl.
Bot. fl.
Top fl.
Bot. fl.
Top fl.
Bot. fl.
-300
-150 0
150
300
-400
-200 0
200
400
-400
-200 0
200
400
Outside, left Inside, right Average Theory
Figure 46 Residual stresses after roller bending of hot-rolled IPE 360 section in N/mm2.
3.5 Sensitivity analyses
3.5.1 Influence of temperature
The sectioning method has been used extensively to measure residual stresses. Usually, slitting of
steel was performed with a slitting saw or band saw. The possible influence of the saw cutting
process on residual stress measurements was considered of minor importance. However, Weng
and Pekoz [140] and Abdel-Rahman and Sivakumaran [1] stated that the slitting of steel with the
conventional saw cutting procedure induces significant external disturbances caused by heating,
clamping and vibration. The electrical discharging machining (EDM) technique practically
eliminates the aforementioned disturbances. Although the EDM technique provides better
surrounding conditions, it requires more preparation time and is less feasible for large wide
flange sections. In order to get insight into possible disturbances due to the saw cutting process,
specimen A was tested twice. For comparison, both the EDM technique and the saw cutting
procedure were used to measure residual stresses in this specimen. The results of both techniques
are shown in Figure 47, whereas the values of the specimen with the saw cutting procedure were
presented earlier in Figure 43, but are repeated here for convenience. In conjunction with the
repeatability of measurements presented in the subsequent section, it is seen that both techniques
yield almost identical residual stress patterns. Therefore it was concluded that the external
disturbances are not significant and the saw cutting procedure could be used for the remaining
specimens.

Experimental investigation of residual stresses 41
-50
0
50
100
-50 0 50
-48
0
48
-20
0
-10
0 0
100
20
0-200
0
200
400
-50 0 50
EDM saw-cutting
-50
0
50
100
-50 0 50
-48
0
48
-20
0
-10
0 0
10
0
200
-200
0
200
400
-50 0 50
Top fl.
Bot. fl.
Top fl.
Bot. fl.
Outside, left Inside, right Average Theory
Figure 47 Comparison of residual stresses from EDM technique and saw cutting procedure for
specimen A.
3.5.2 Repeatability of measurements
Residual stresses were measured at three different locations along a single member as shown in
Figure 48. The results are presented in Figure 49 for specimen F. The variation or scatter in the
residual stress values along the member is quite small. This indicated that for the other
specimens, representative values could be obtained by performing measurements at a single
location in the roller bent beam. The results at location 1 are identical to Figure 43 and are shown
here again for convenience.
R=3820 mm
1400 mm 1400 mm
12
3
96 mm
Figure 48 Three locations along the single member

42 Structural properties and out-of-plane stability of roller bent steel arches
-50
0
50
100
-50 0 50
-48
0
48
-20
0
-10
0 0
10
0
20
0
-200
0
200
400
600
-50 0 50
1
-50
0
50
100
-50 0 50
-48
0
48
-20
0
-10
0 0
10
0
20
0
-200
0
200
400
600
-50 0 50
2
-50
0
50
100
-50 0 50
-48
0
48
-200
-100 0
10
0
20
0
-200
0
200
400
600
-50 0 50
3Top fl.
Bot. fl.
Top fl.
Bot. fl.
Top fl.
Bot. fl.
Outside, left Inside, right Average Theory
Figure 49 Residual stress distributions at three different locations for specimen F.
3.6 Discussion
3.6.1 Residual stresses in roller bent sections
The measured residual stresses in the roller bent beam sections show very similar distributions in
the sections of all specimens. The small stresses in the top flanges are almost uniformly
distributed along their widths. The stresses in the webs near the top flanges are in general small,
tensile or compressive. They increase in compression towards the bottom flange. The stress
distributions along the width of the bottom flanges are non-uniform and display large peaks near
the junctions with the webs. The measured stresses on both sides of the webs show small
differences. This was expected as the beam was roller bent about the major axis, i.e. little or no
bending about the minor axis occurred. The larger differences between the stresses on the inside
and outside surfaces of the flanges indicate the presence of bending about the major axes of the
individual flanges. The average state of stress in a top flange is a small uniform tension or
compression. The differences between inside and outside stresses in the bottom flanges display
distributions which are very different from those in the top flanges. The average state of stress in
the bottom flanges are not uniform and in all specimens show both tension and compression.
3.6.2 Comparison to straight sections
Because of the limited data it is difficult to draw conclusions for the HE 100A and HE 100B
sections other than that in general the roller bending process introduces tensile stresses into the
top and bottom flanges and compressive stresses into the web.
The more detailed and consistent data for the residual stresses in the HE 360 B and IPE 360
sections shows the roller bending process introduces changes towards more uniformly distributed
stress distributions along the top flanges. The bottom flanges show significantly increased
stresses in the extreme fibers but smaller changes in the average stress distributions. The webs of
the sections appear to have been subjected to bending with an introduction of tensile stresses into
the top half of the web and compressive stresses into the bottom half. This resulted in a reversed
stress pattern in the bottom half with maximum values near the bottom flange.

Experimental investigation of residual stresses 43
The findings show that the roller bending process has a significant effect on the longitudinal
residual stress distribution, i.e. the roller bending process modifies the initial residual stress
distribution due to differential cooling and rotorizing. The deformation strains from the roller
bending process significantly alter the doubly symmetric hot rolled residual stress distribution
resulting in a new monosymmetric residual stress pattern with respect to the minor axis of
bending. The measured values show that the residual stresses in roller bent sections are larger
compared to their straight counterparts, indicating that premature yielding is likely to be more
prevalent in roller bent sections.
3.6.3 Influence of bending radius on residual stress
The experimental results for the roller bent HE 100A sections in Figure 43, HE 100B sections in
Figure 44 and IPE 360 sections in Figure 46 reveal that there is no clear relationship between
increasing curvature and residual stress. However, it can be observed that with decreasing
bending radii the compressive stresses in the webs increase marginally whilst the stresses in the
top and bottom flanges remain largely unchanged.
3.6.4 Influence of steel grade on residual stress
In general it can be observed that specimens with steel grade S355 reveal residual stress patterns
with a slightly larger magnitude compared to specimens with steel grade S235. However, the top
flange of the roller bent S235 HE 360B beam in Figure 45 displays average compression stresses
while the stresses for the S355 beam are tensile across this flange. The residual stresses in the
web show different distributions for the two grades of steel, i.e. bending about the major axis for
S235 and almost uniform compression for S355 steel. The stresses in the bottom flanges display
similar distributions but are much larger for the higher grade steel. It could be suggested that in
general with increasing steel grade the stress distributions in the flanges increase or move
towards tension and the residual stresses in the webs increase or move towards compression.
3.6.5 Magnitude of residual stress
The measured residual stresses are generally below the yield stress of the straight material,
although the yield stress was exceeded by the residual stress values in the bottom flange. At first
sight, this observation violates the conversion from measured strain to stress values as stated in
section 3.2, since this conversion was based on elastic strain release and therefore restricts the
magnitude of the residual stress to a maximum value, i.e. the yield stress. However a higher
residual stress than the yield stress can be expected as a result of cold working the material
during the roller bending process. Therefore a larger elastic strain release can be expected
compared to the maximum strain release as governed by the yield stress of the straight material.
Additional tensile tests on coupons taken from curved sections support this theory as they
showed an increased yield stress. The experimental findings of Cruise and Gardner [26] showed
a similar phenomenon for residual stresses in stainless steel sections.
3.6.6 Comparison with theory
Residual stresses and their distribution along the flanges and webs of steel sections that are
obtained from theoretical models for cold bent beams (section 2.4.2) are different from measured
results. Theoretical models assume residual stress distributions in cold bent sections to be the
result of uniaxial loading and reloading. In addition, the models do not account for a residual
stress gradient along the width of the flanges. The experimentally obtained stresses do show a
large stress gradient along the bottom flange and a small gradient or a nearly uniform distribution
in the top flange. This clearly indicates a multi-axial stress state rather than a uniaxial stress state
after rolling. Also, the theoretically derived stress pattern postulates an anti-symmetric residual
stress distribution about the major axis of bending. This anti-symmetry could not be clearly
observed in the specimens with the exception of the IPE 360 sections which to some extent
display a zigzag pattern as postulated by Timoshenko, see Figure 28.

44 Structural properties and out-of-plane stability of roller bent steel arches
3.7 Conclusions
An experimental investigation of residual stresses in roller bent wide flange sections and straight
hot rolled wide flange sections was presented. The strain readings were obtained using the
method of sectioning and subsequently converted into stress values by multiplying the strains by
the Young‟s modulus. Experimental findings show significant differences in residual stress levels
and patterns between roller bent wide flange sections and straight hot rolled wide flange sections.
The measured residual stresses in the roller bent sections are larger than those in straight sections.
Therefore, the suggestion to use a residual stress model based on straight hot rolled sections for
curved roller bent members is questionable. Also, the residual stress model proposed by
Timoshenko [132] and outlined by King and Brown [61] yields stress patterns that are quite
different from experimentally obtained stresses. Residual stress gradients along the flange widths
were observed in all curved specimens, indicating that a uniaxial stress assumption for loading
and reloading is not valid for modeling residual stress distributions in roller bent sections

4 Finite element simulations of residual stresses This chapter presents a numerical modeling technique to estimate residual stresses in curved
wide flange sections manufactured by the pyramid roller bending process. The technique
incorporates material non-linearity, geometrical non-linearity and contact modeling.
Numerically obtained residual stresses are compared to experimental results from chapter 3 and
good agreement was found for the top flange. Only moderate agreement was observed for the
web but very good coherence was realized for the bottom flange. It is concluded that a finite
element analysis can be used to estimate residual stresses in roller bent wide flange sections.
Parts of this chapter have been published in Spoorenberg et al. [123].
4.1 Introduction
In order to investigate the structural carrying capacity of roller bent sections, it is necessary to
have an insight into the effect of the roller bending process on the residual stresses. Residual
stress measurements have been carried out earlier in chapter 3 on a limited number of roller bent
wide flange sections to quantify the effects of the manufacturing process on the already existing
residual stresses due to hot rolling. In order to gain comprehensive insight into the formation of
residual stresses as a result of roller bending for wide flange sections in general, the use of a
finite element model can be seen as an alternative to experimental procedures. In this chapter the
commercially available finite element code ANSYS v11.0 is therefore employed for simulating
the roller bending process to obtain residual stresses over the cross-section of wide flange steel
sections.
4.1.1 Earlier studies
Earlier numerical studies on the roller bending process have been confined to the relationship
between movement of the rollers and the emerging curvature of plates and bars. The first
contribution to the investigation of the three-roller bending process was published by Bassett and
Johnson [10]. Theoretical analyses and experiments were carried out to obtain the roll force,
driving torque and springback. Hansen and Jannerup [44] analyzed theoretically the three-roller
bending process by taking into account the geometry of the roller configuration and beam
section. Using a simulation model, Yang and Shima [144], estimated the deformations along the
section during the roller bending process. This yielded a relationship between the position of the
rolls and the final curvature of the bar. Possible cross-sectional deformations of roller bent
hollow steel sections were examined by Seddeik and Kennedy [121]. None of the previous
studies paid attention to the residual stresses as a result of roller bending.
Obtaining residual stresses in cold-formed members by finite element methods has been done
before. As part of a larger study on rotary draw bending of aluminum alloy profiles, Welo et al.
[139] examined the residual stress distribution in both single and double chamber sections. The
residual stresses emerging from coiling and uncoiling of thin sheets have been studied by Quach
et al. [98] for carbon steel with elastic-perfectly plastic stress-strain behavior. A closed-form
analytical solution was presented in conjunction with finite element results, which showed good
coherence. Subsequently, a numerical study was carried out by Quach et al. [99] to predict the
residual stresses in press-braked thin-walled sections. A finite element model was created to
serve as an alternative for experimental techniques. Numerical methods agreed closely with
experimental values. The analyses were later expanded to include stainless steel sections,
featuring nonlinear stress-strain behavior without a sharply defined yield point, Quach et al.
[100] and Quach et al. [101].

46 Structural properties and out-of-plane stability of roller bent steel arches
Finite element models to estimate residual stresses in roller bending operations have not been
published so far, but the influence of the roller straightening process on the formation of residual
stresses has received attention. The roller straightening process is often employed to straighten
deformed members to meet delivery standards. This process is featured by feeding a member
through a series of rolls bending the member back and forth, thereby progressively removing the
initial deformations. The roller straightening process has strong similarities with the roller
bending process. A finite element model was created with the commercially available program
ABAQUS/Explicit by Finstermann et al. [37], Schleinzer and Fischer [118] and Schleinzer and
Fischer [119] for predicting residual stresses due to roller straightening of railway sections. It
was found that numerical results were in good agreement with experimental data. Ringsberg and
Lindback [110] performed similar computations as part of a larger study on the influence of
residual stresses on fatigue failure resistance. The analyses were later expanded by Betegon
Biempica et al. [16] to adjust the roller straightening machine configuration in order to reduce
residual stresses. All these finite element straightening studies underlined the importance of using
a full 3D model, movement of the member through the rolls and incorporating contact effects.
Table 7 Roller bent members employed in simulation.
Simulation no. Section Steel grade Bending radius [mm]
A
HE 100A
S235
1910
B 2546
C 3820
D
S355
1910
E 2546
F 3820
M HE 360B
S235 8000
N S355 8000
Section 2.4.2 showed the theoretical model of Timoshenko [132] for the prediction of residual
stress in roller bent sections. Although the model is subject to oversimplifications, its solution
was experimentally confirmed by tests on cold bent steel sheeting, as published by Weng and
White [141] and Tan et al. [131]. Although Timoshenko‟s model has shown its applicability to
cold bent steel sheeting, experiments in chapter 3 have shown its limitations for estimating the
residual stresses in roller bent open sections. In this chapter a finite element technique is
proposed to estimate residual stresses in roller bent wide flange sections.
4.2 Simulation of roller bending process
4.2.1 Scope
The investigation into the finite element modeling technique for estimating residual stresses
introduced by roller bending of steel bars is confined to a limited number of mild steel wide
flange sections. Full details on the type of section, steel grade and bending radius of the
specimens are presented in Table 7, which complies with the specimens in Table 6.
4.2.2 Model description
The implicit finite element code ANSYS v11.0, ANSYS guide [7] will be used to simulate the
roller bending process. The curving process is modeled with the inclusion of full interaction
between the machine parts (rollers) and workpiece (steel section) (Figure 50). In finite element
studies on residual stresses in cold formed sheeting, permanent curvature was achieved by
applying prescribed rotations (Quach et al. [98] and Quach et al. [100]), rather than using contact
modeling. This strategy requires less computational effort when compared to contact element
modeling. Applying to wide flange sections however resulted in large errors when compared to

Finite element simulations of residual stresses 47
experimentally obtained residual stresses. It was therefore decided to employ a full interaction
model as shown in Figure 50 for further development.
The finite element model can be subdivided into three distinct components: rollers, beam and the
contact surface. Each of the components has its own distinct properties and will therefore be
treated individually in more detail in the following subsections. To reduce computation time,
only one half of the I-section was modeled, using symmetry of the model. The nominal section
dimensions were used.
0.5 tw
h
0.5 b
Center roller
Flange support roller
R2
R1
R3
R1
S
(a) overview model
L
Left rollerRight roller
(b) half slice of beam
0.5 b
h
tf
Beam
Figure 50 Roller bending setup.
The HE 100A and HE 360B sections were bent into circular arches requiring different machine
configurations, which are given in Table 8. For a HE 100A section the nominal dimensions are:
the width of the flange b=100mm, the height h=96mm, the flange thickness tf=8mm and the web
thickness tw=5mm. The corresponding values for the HE 360B section are: b=300mm,
h=360mm, tf=22.5mm and tw=12.5mm (Figure 50).
Table 8 Finite element model parameters.
Section
HE 100A HE 360B
Distance between outer rolls, S [mm] 900 2500
Modeled beam length, L [mm] 3000 10800
Radius of left and right roll, R1 [mm] 300 325
Radius of center roll, R2 [mm] 300 325
Radius of flange support roll, R3 [mm] 20 80
4.2.2.1 Wide flange section
The wide flange section is meshed with solid elements. Preliminary trials on modeling the wide-
flange section by means of shell or beam elements gave large errors with respect to experimental
results. No initial residual stress distribution due to differential cooling was applied to the beam
in the model. It is assumed that these stresses have no significant influence on the final residual
stress distribution, as found earlier by Ringsberg and Lindback [110] and Betegon Biempica et al.
[16]. A justification of this modeling simplification is presented in section 4.3.1.
Mesh convergence study
In order to determine an optimum distribution of elements in the model and to select a suitable
element type, a limited mesh study was performed. Two element types and three mesh densities
were examined for computation of the residual stresses in an HE 100A section of steel grade
S235 bent into a radius of approximately 1910 mm. Coarse, medium and fine mesh densities
were selected (Figure 51(a-c)). Each mesh density was analyzed using an 8-node solid element

48 Structural properties and out-of-plane stability of roller bent steel arches
(SOLID45) and a 20-node solid element (SOLID95) (Figure 51(d)). These elements have large
rotation, large strain and plasticity capabilities. For both elements a reduced integration scheme
was applied. The material models for these analyses are given in Figure 54 by specimen A.
(b) Medium mesh(a) Coarse mesh
SOLID95
(c) Fine mesh
SOLID45
node
(d) Elements Figure 51 Employed meshes and elements.
The number of elements along the beam length was kept constant (120) for all mesh
configurations, since it was found that numerical and experimental residual stress values
(previous chapter) showed no significant stress gradient along the length of the curved member.
The computed extreme residual stresses for each mesh and element type are provided in Table 9.
The fine mesh with 20-node elements serves as a reference. The maximum tensile and
compressive residual stresses were found at the web-to-flange junction of the bottom flange and
in the lower part of the web, respectively. These locations were observed in all mesh density
analyses. Figure 52 shows the numerical residual stress values as obtained for different meshes
and different element types together with experimental results.
-100
-50
0
50
100
-50 0 50
-48
0
48
-200
-10
0 0
100
20
0
-100
0
100
200
-50 0 50
SOLID95
R=1910 mm
Top fl.
Bot. fl.
-100
-50
0
50
100
-50 0 50
-48
0
48
-20
0
-10
0 0
100
200
-100
0
100
200
-50 0 50
SOLID45
R=1910 mm
Top fl.
Bot. fl.
Coarse mesh Medium mesh Fine mesh Experimental
Figure 52 Computed residual stresses for varying element types (8-node brick element (left) and
20-node brick element (right)), and mesh densities in conjunction with experimental results,
stresses in N/mm2.

Finite element simulations of residual stresses 49
Table 9 Comparison of maximum residual stresses for HE 100A.
Mesh
refinement
Element Total no. of
brick
elements
Maximum Tensile
stress
Maximum Compressive
stress
Stress
[N/mm2]
Diff.
[%]
Stress
[N/mm2]
Diff. [%]
Coarse SOLID45 2160 180.75 20.86 -77.36 52.79
Medium SOLID45 4560 98.19 -34.34 -171.33 -4.55
Fine SOLID45 7920 87.92 -41.21 -130.23 20.53
Coarse SOLID95 2160 168.28 12.52 -143.36 12.52
Medium
(adopted)
SOLID95 4560 143.93 -3.76 -157.88 3.66
Fine SOLID95 7920 149.56 - -163.88 -
It can be seen in Figure 52 that the stresses obtained from 8-node brick elements show less
coherence than the 20-node brick element when compared to the experimental results. The
discrepancy between the finite element models equipped with SOLID45 elements and the
experimental values is consistent for all mesh densities. The SOLID95 models show a better
performance when compared to the SOLID45 element models. Both Figure 52 and Table 9 show
small differences in residual stress values between the medium mesh and the coarse mesh for the
SOLID95 element. In view of the small scatter for the experimental values, as observed by in
chapter 3, these very small differences between the two models are considered acceptable. The
medium mesh is selected in favor of the fine mesh due to its smaller demands in computational
time. Combined with SOLID95 elements this mesh will be adopted for all finite element
computations.
Material models
The material characteristics of the beam were modeled using a true stress-logarithmic strain
relationship based on tensile test data of the straight base material. The material plasticity was
characterized by the Von Mises yield criterion, the Prandtl-Reuss flow rule and the isotropic
hardening law. The adopted material law obtained from tensile tests conducted on coupons taken
from straight reference sections is presented in Figure 54. The experimental tensile-test data
show a significant difference between the mechanical properties of coupons taken from just
below the web-flange junctions (B) and other locations (A), see Figure 53(a) and Figure 53(b).
This is taken into account in the numerical model.
(a) mesh cross section (c) contact elements
20-node brick elements
8-node contact elements
(b) material-law
Material law B
Material law AIntegration
point
Figure 53 Cross-sectional mesh for HE 100A.

50 Structural properties and out-of-plane stability of roller bent steel arches
0
100
200
300
400
500
600
0 0.01 0.02 0.03 0.04
Strain [-]
Str
ess
[N
/mm
2]
A B
0
100
200
300
400
500
600
0 0.01 0.02 0.03 0.04
Strain [-]
Str
ess
[N
/mm
2]
A B
HE 100A S235 Specimen A HE 100A S235 Specimen B-C
0
100
200
300
400
500
600
0 0.01 0.02 0.03 0.04
Strain [-]
Str
ess
[N
/mm
2]
A B
0
100
200
300
400
500
600
0 0.01 0.02 0.03 0.04
Strain [-]
Str
ess
[N
/mm
2]
A B
HE 100A S355 Specimen D HE 100A S355 Specimen E-F
0
100
200
300
400
500
600
0 0.01 0.02 0.03 0.04
Strain [-]
Str
ess
[N
/mm
2]
A B
0
100
200
300
400
500
600
0 0.01 0.02 0.03 0.04
Strain [-]
Str
ess
[N
/mm
2]
A B
HE 360B S235 Specimen M HE 360B S355 Specimen N
Figure 54 Stress-strain curves from experiments.
4.2.2.2 Rollers and Contact Surface
The interaction between the rollers and the wide flange section is based on contact between parts,
which can only be properly modeled using contact elements in the finite element environment.
Since the rollers of the machine have a much higher stiffness compared to the beam, the
interaction between a roller and the surface of a wide flange section was treated as a so-called
rigid-to-flexible contact type in the finite element program ANSYS. The contacting surfaces of

Finite element simulations of residual stresses 51
the rollers were modeled as infinitely rigid, whereas the contacting surfaces of the beam were
modeled as flexible.
The rollers were modeled as rigid bodies using 3-dimensional TARGE170 elements. The exact
circular geometry of the four rollers has been taken into account, i.e. the circle was not
approximated by a polygon. The contact element CONTA174 is used to model the contact
surfaces on the beam, providing contact between rollers and the wide flange section. The contact
element is located on the surfaces of the solid element and the arrangement of the nodes complies
with the underlying 20-node brick element SOLID95 (Figure 53(c)).
When the CONTA174 elements of contact surface of the beam penetrate the designated
TARGE170 element of the rigid rollers, contact is established. Contact is detected at the Gauss
integration point locations, which in general provides more accurate results than the nodal
detection scheme prescribing contact detection at the contact nodes (Newton-Cotes/Lobatto nodal
scheme).
The combination of the selected elements (TARGE170 and CONTA174) for the contact problem
classifies the contact-interaction as so-called surface-to-surface contact. Surface-to-surface
contact supports sliding, friction and large deformations. It is therefore considered suitable for
the roller bending analyses.
Structural analyses involving contact are highly nonlinear and necessitate adequate
computational algorithms to solve the contact problem. The ANSYS program‟s contact elements
are supported by five different contact algorithms: augmented Lagrangian, penalty method,
internal multipoint constraint, Lagrange & penalty, and Lagrange multiplier, (ANSYS guide
[7]):. The augmented Lagrangian algorithm was selected since the contact constraint is satisfied
via the Lagrange multipliers, thereby omitting the use of a high penalty stiffness; avoiding
convergence difficulties and ill-conditioning of the global stiffness matrix. This however is at the
expense of more equilibrium iterations compared to other algorithms. Similar finite element
studies involving contact problems also employed the augmented Lagrangian algorithm: del Coz
Diaz et al. [30], Betegon Biempica et al. [16].
4.2.3 Solution procedure and forming process
From the preceding sections it becomes clear that the analyses are featured by material non-
linearities, geometrical non-linearities and contact modeling. The equilibrium equations were
therefore solved iteratively by the Newton-Raphson method. The iterations were stopped when
the residual or out-of-balance forces, displacements and rotations were less than 0.05 % of the
applied forces, displacements and rotations.
In practice, all rollers are driven simultaneously during bending of wide flange sections. The
friction between the rollers and the surfaces of the wide flange section enables section movement
through the machine. As the wide flange section advances through the machine, the surface speed
of the top flange (stretched) is faster when compared to the bottom flange (compressed), due to
the imparted curvature. The difference in surface speeds is not constant but changes continuously
as the section moves through the rollers. This is compensated for in the roller bending machine
by rotating each roller at individual speed, thereby avoiding oscillation of stick and slip behavior
at the interface between rollers and the wide flange section.
This speed adjustment of the rollers could not be incorporated in the finite element model. When
rotating all rolls with the same speed non-converged solutions were obtained, as a result of rapid
oscillation of stick and slip behavior at the rolls.

52 Structural properties and out-of-plane stability of roller bent steel arches
In order to model the forming process by means of roller contact but avoid non-convergence, the
feeding process was slightly changed in the finite element environment. All rolls were considered
frictionless with the exception of the center roller. An artificially high friction coefficient (μ=0.8)
in conjunction with the Coulomb friction law was assigned to the center roller and the contact
elements on the outside of the compressed bottom flange. During the bending process, only the
center roller rotated and caused beam movement, thereby avoiding oscillation of stick-slip at the
interface between rollers and contact surfaces.
Consequently, the complete driving force is only located at a small contact area between the
center roller and contact surface of the beam. To achieve beam movement this necessitated an
unrealistically large friction coefficient (μ=0.8). The employment of a more realistic friction
coefficient of for example μ=0.2 or μ=0.3 as representative for steel contact yielded slippage
between the center roller and contact surface.
Straight material
Figure 55 Schematic distribution of plastic strains in curved member after completion of roller
bending process (HE 100A section), mesh not shown.
Permanent curvature in the beam was achieved by moving the right hand roller towards the
center roller (Figure 23(b)) and feeding the beam through the rollers by rotating only the center
roller.
A constant force was exerted by the small flange support roller in the finite element model to
prevent web crippling. Since the exact magnitude of the flange support roller force during roller
bending is unknown, the influence of this flange support force on the residual stresses was further
investigated and is presented in section 4.3.2.

Finite element simulations of residual stresses 53
Only a single forming pass was simulated, assuming that the residual stresses are identical for
single and multiple pass bending. In the real process multiple passes are required to obtain the
desired radius (section 1.3).
The use of a single roller to enforce the movement of the section through the rollers and
simulating only a single pass are modeling simplifications. It was found that these specified
simplifications were necessary to avoid convergence problems, but also because the actual
number of roll passes for the specimens was unknown.
4.2.4 Completion of numerical run
A plot of the plastic strain distribution along the length of the beam at the end of the roller
bending process is presented in Figure 55. From this it can be clearly seen that the ends of the
beam are not subjected to plastic deformations. Since the roller bending process induces non-
uniform bending deformations along the length, the distribution of the curvature needs to be
studied first before it can be established whether a circular arch is obtained.
4.2.5 Curvature distribution
The curvature distribution along the length of the deformed section is obtained by examining the
total strains (= elastic strains + plastic strains) in longitudinal direction over the cross-section.
The curvature of the arch is obtained from the linear strain distribution of the total strains. A
typical curvature distribution along a 3 m long beam length is shown in Figure 56 for a HE 100A
section with steel grade S235. This section was roller bent with a prescribed vertical
displacement of the right hand roller of 31 mm. The vertical axis represents the curvature and the
horizontal axis shows the beam length. The graph should be read from the lower right corner (A)
towards the left, which illustrates beam movement through the rollers.
F
D
R
AB
C
E
3000200010000
0
Beam length [mm]
0.0001
0.0002
0.0003
0.0004
Curv
ature
[1/m
m]
Circular arch
offset
Permanent
curvature
springback
Beam movement
Prescribed displacement, 31 mm
Figure 56 Distribution of curvature along beam length for a HE 100A S235 bent with a
prescribed displacement of 31 mm.
The onset of plastic deformation is found at (B), and indicates the placement requirements of the
roller bending machine with accompanying waste of material, given by distance A-B. After a
transient or unsteady phase a constant permanent curvature distribution (or constant radius)
commences at (C). In practice the relationship between the movement of the right hand roller and
the rotation of the rollers is in such a way that the beam is bent into the desired curvature with a
minimum length for the unsteady zone, as indicated by the distance B-C. At point D the beam
exits the roller bending machine. The position of contact point D, between roller and beam, shifts
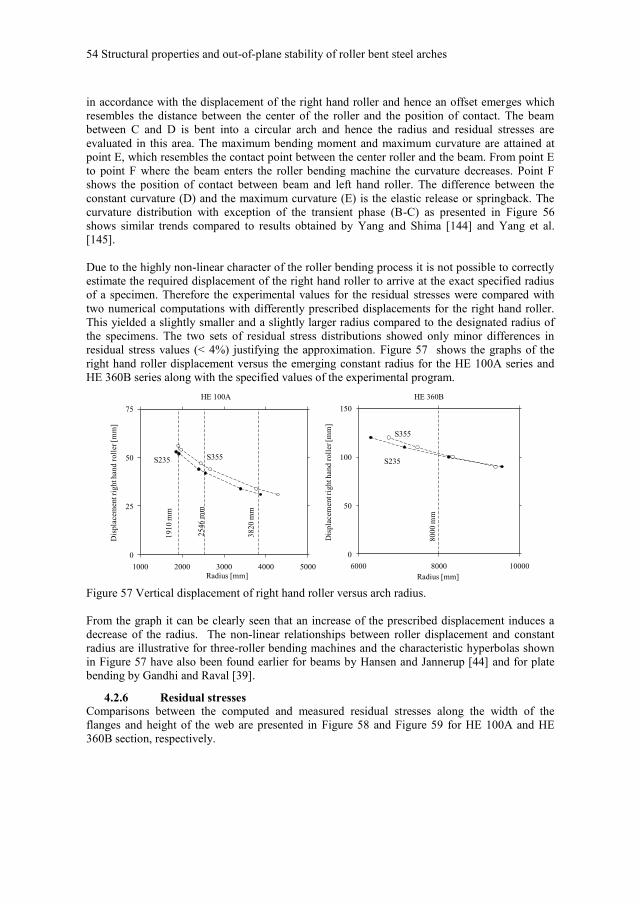
54 Structural properties and out-of-plane stability of roller bent steel arches
in accordance with the displacement of the right hand roller and hence an offset emerges which
resembles the distance between the center of the roller and the position of contact. The beam
between C and D is bent into a circular arch and hence the radius and residual stresses are
evaluated in this area. The maximum bending moment and maximum curvature are attained at
point E, which resembles the contact point between the center roller and the beam. From point E
to point F where the beam enters the roller bending machine the curvature decreases. Point F
shows the position of contact between beam and left hand roller. The difference between the
constant curvature (D) and the maximum curvature (E) is the elastic release or springback. The
curvature distribution with exception of the transient phase (B-C) as presented in Figure 56
shows similar trends compared to results obtained by Yang and Shima [144] and Yang et al.
[145].
Due to the highly non-linear character of the roller bending process it is not possible to correctly
estimate the required displacement of the right hand roller to arrive at the exact specified radius
of a specimen. Therefore the experimental values for the residual stresses were compared with
two numerical computations with differently prescribed displacements for the right hand roller.
This yielded a slightly smaller and a slightly larger radius compared to the designated radius of
the specimens. The two sets of residual stress distributions showed only minor differences in
residual stress values (< 4%) justifying the approximation. Figure 57 shows the graphs of the
right hand roller displacement versus the emerging constant radius for the HE 100A series and
HE 360B series along with the specified values of the experimental program.
0
25
50
75
1000 2000 3000 4000 5000Radius [mm]
HE 100A
0
50
100
150
6000 8000 10000
Radius [mm]
HE 360B
S355S235
19
10
mm
254
6 m
m
3820 m
m
80
00
mm
S235
S355
Dis
pla
cem
ent r
igh
t han
d r
oll
er [
mm
]
Dis
pla
cem
ent r
igh
t han
d r
oll
er [
mm
]
Figure 57 Vertical displacement of right hand roller versus arch radius.
From the graph it can be clearly seen that an increase of the prescribed displacement induces a
decrease of the radius. The non-linear relationships between roller displacement and constant
radius are illustrative for three-roller bending machines and the characteristic hyperbolas shown
in Figure 57 have also been found earlier for beams by Hansen and Jannerup [44] and for plate
bending by Gandhi and Raval [39].
4.2.6 Residual stresses
Comparisons between the computed and measured residual stresses along the width of the
flanges and height of the web are presented in Figure 58 and Figure 59 for HE 100A and HE
360B section, respectively.

Finite element simulations of residual stresses 55
-100
-50
0
50
100
-50 0 50
-48
0
48
-30
0
-15
0 0
150
30
0
-100
0
100
200
-50 0 50
(A)
S235
R=1910 mm
Top fl.
Bot. fl.
-100
-50
0
50
100
-50 0 50
-48
0
48
-30
0
-15
0 0
15
0
30
0
-100
0
100
200
-50 0 50
(B)
S235
R=2546 mm
Top fl.
Bot. fl.
-100
-50
0
50
100
-50 0 50
-48
0
48
-30
0
-15
0 0
15
0
300
-100
0
100
200
-50 0 50
(C)
S235
R=3820 mm
Top fl.
Bot. fl.
-100
-50
0
50
100
-50 0 50
-48
0
48
-400
-20
0 0
200
40
0
-100
0
100
200
300
-50 0 50
(D)
S355
R=1910 mm
Top fl.
Bot. fl.
-100
-50
0
50
100
-50 0 50
-48
0
48
-400
-200 0
20
0
40
0
-100
0
100
200
300
-50 0 50
(E)
S355
R=2546 mm
Top fl.
Bot. fl.
-100
-50
0
50
100
-50 0 50
-48
0
48
-40
0
-200 0
20
0
40
0
-100
0
100
200
300
-50 0 50
(F)
S355
R=3820 mm
Top fl.
Bot. fl.
-1000100200
-150 0 150Numerical Experimental Theory Figure 58 Residual stress distributions HE 100A in N/mm2.
The experimental values shown in the diagrams are the average of measurements taken from
strain gauges place on the inside and outside of the flanges or left and right side of the web, as
suggested by Cruise and Gardner [26]. For the numerical values the average of the stresses at the
integration points are used. The top flange and bottom flange are subjected to tensile strains and
compressive strains respectively in longitudinal direction during the roller bending process
(Figure 23). Theoretical values proposed by Timoshenko [132] are given alongside the numerical
and experimental values. The theoretical stresses were obtained by employing measured yield
stresses in the flanges with a bilinear elasto-plastic material law and shape factor of the wide
flange sections.

56 Structural properties and out-of-plane stability of roller bent steel arches
-30
0
-15
0 0
15
0
30
0
-40
0
-20
0 0
20
0
40
0
-200
-100
0
100
200
-150 0 150
-100
0
100
200
-150 0 150
Top fl.
Bot. fl.
(M)
S235
R=8000 mm
-200
-100
0
100
200
-150 0 150
-100
0
100
200
300
-150 0 150
Top fl.
Bot. fl.
(N)
S355
R=8000 mm
-1000100200
-150 0 150Numerical Experimental Theory Figure 59 Residual stress distributions HE 360B in N/mm2.
4.3 Sensitivity analyses
The previous section elaborated on the development of a numerical model with a number of
simplifications and uncertainties which may affect the solution accuracy. In this section a
sensitivity analysis is carried out on the influence of two simplifications: the neglect of initial
residual stresses (section 4.2.2.1) and the force exerted by the flange support roller. By
performing numerical simulations and changing the model parameters, the influence of the model
simplifications with respect to the final residual stress distribution after rolling can be evaluated.
4.3.1 Influence of initial residual stresses
The numerically obtained residual stress distributions give the final stress pattern after roller
bending. All initial residual stresses due to differential cooling in the beam before roller bending
are assumed to have no influence on the final residual stress pattern after roller bending. For
simple mechanical models, it has been shown by O'Connor [80] and King and Brown [61] that
the initial residual stresses before cold forming are not of any influence with respect to the
response and final residual stress distribution in cold formed members. Their findings have
justified the modeling simplification of omitting initial residual stresses. As stated earlier, the
roller bending process exhibits a complex interaction between rollers and beam, which induces a
sequence of loading and unloading actions on the beam. The incorporation of plastic behavior of
the beam and a friction model between rollers and beam make the numerical problem path-
dependent (i.e. the sequence in which loads are applied affects the final results), adding to its
complexity. Assuming that initial residual stresses have no influence on the roller bending
stresses might be an oversimplification. In order to find out whether initial residual stresses can
be safely neglected; numerical computations were made for two identical sections: one with and

Finite element simulations of residual stresses 57
one without initial residual stresses. The HE 360B section with steel grade S235 was examined.
The residual stresses before and after roller bending were measured earlier in chapter 3. The
measurements of the straight hot-rolled member were taken on both sides of the flanges and web
and were averaged. The averaged stresses were subsequently modified in order to satisfy
equilibrium and achieve a doubly symmetric initial residual stress pattern. The modified pattern
is shown in Figure 60 (left) together with the averaged measured values. These modified stresses
were applied to the finite element model to define the initial state for the subsequent numerical
roller bending computations.
-20
0
-10
0 0
10
0
20
0
-100
-50
0
50
100
-150 0 150
-100
-50
0
50
100
-150 0 150
Top fl.
Bot. fl.
Initial residual
stresses
Straight
-300
-150 0
150
300
-100
-50
0
50
100
-150 0 150
-100
0
100
200
-150 0 150
Top fl.
Bot. fl.
Final residual
stresses
Curved
-100-50050100
-150 0 150
Measured initial residual stresses Modified initial residual stresses
-100-50050100
-150 0 150
Exclude initial residual stress Include initial residual stress
Figure 60 Initial residual stresses due to differential cooling (left) and influence on final residual
stress distribution after roller bending (right) for an HE 360B, steel grade S235, all stresses in
N/mm2.
The computed residual stress patterns for the HE 360B member, with and without initial residual
stresses are shown in Figure 60 (right). The numerical values demonstrate that the initial residual
stress pattern has a negligible influence on the final residual stress pattern after roller bending.
This justifies the simplification in the numerical model, i.e. omitting initial residual stresses.
4.3.2 Influence of flange support roller
It is known that the flange support roller exerts a force on the inside of the top flange during
roller bending in order to prevent web buckling in the section. However, in practice the
magnitude of this force is unknown, and the application is left to good workmanship by the
machine operator. It is therefore necessary to investigate the influence which this force may have
on the residual stress pattern after roller bending.
All numerical simulations have been performed by allowing initial contact between flange
support roller and the inside of the top flange. The roller was fixed at this initial position
(standard) and was not able to move either upwards or downwards (Figure 61(a)).

58 Structural properties and out-of-plane stability of roller bent steel arches
Increasing flange
support pressure
Lowering flange
support pressure
0.3 mm
Standard position
-100
-50
0
50
100
-50 0 50
-48
0
48
-20
0
-10
0 0
10
0
20
0
-100
0
100
200
300
-50 0 50
fl. Sup. Roll.
S355
R =3820 mm
Top fl.
Bot. fl.
-1000100200
-150 0 150
0% 37% 67%
(a) Overview flange support roller (b) Residual stress distribution in
N/mm2 in specimen F (HE 100A)
Figure 61 Influence of flange support roller on residual stresses.
Subsequently, the movement of the right hand roller pushes the top flange downwards enabling
the flange support roller to exert a force on the inside of the top flange. Depending on the initial
position of the flange support roller, the force can be increased or decreased. For example, by
lowering the flange support roller (with respect to the standard set-up) the force decreases and
when the flange support roller is lowered sufficiently no force is exerted at all. By moving the
flange support roller upwards the force can be increased.
The possible influence of the exerted force on the final residual stress distribution was
investigated by performing two additional simulations for specimen F: one without force from
the flange support roller and one with extra force. The extra force is realized by introducing an
arbitrary upward displacement of 0.3 mm (Figure 61(a)). The different residual stress patterns as
a result of varying the flange support force are shown in Figure 61(b). The results are annotated
by the ratio between the maximum force of the flange support roller and the center roller. In the
case where the flange support roller exerts no force at all on the inside of the top flange this ratio
is equal to 0 %. This force ratio is 37 % when the roller is fixed at its initial or standard contact
position. The ratio for extra flange force with a 0.3 mm movement upwards is 67 %. It can be
seen that the residual stress distribution in the flanges remains largely unaffected by the flange
support roller force. The residual stresses in the web, however, are affected but the trends are
similar to the results obtained with the standard flange support roller position.
4.4 Discussion
4.4.1 Comparison between numerical and experimental residual stresses
In comparing the numerically obtained roller bending residual stresses to experimentally
obtained measurements it can be observed from Figure 58 and Figure 59 that good agreement
was found in the top flange and very good agreement bottom flange, but only moderate

Finite element simulations of residual stresses 59
coherence is displayed in the web. The experimental values show largely a symmetrical pattern
with respect to the minor axis of bending, justifying the use of symmetry in the finite element
model. The steel grade influences the residual stress distribution in roller bent sections as
demonstrated by the residual stress distributions in the bottom flanges, where an increase in steel
grade results in higher residual stresses. However, the effect of a different steel grade is not
clearly visible in the web and top flange of the sections.
Due to placement requirements of the strain gauges it is difficult to obtain average stress values
close to the junction of the web and flange for HE 100A sections. Numerical simulations,
however, have shown a large stress peak at these junctions between the web and the bottom
flange. The numerical data is therefore supplemented with measurements taken from the outer
and inner surface for specimen A-C, as shown in Figure 62. It can be seen that the outer surface
measurements confirm the presence of numerically obtained peak stresses.
-200
0
200
400
-50 0 50-200
0
200
400
-50 0 50-200
0
200
400
-50 0 50
(A)
S235
R=1910 mm
(B)
S235
R=2546 mm
(C)
S235
R=3820 mm
-200
0
200
400
-50 0 50
Numerical Experimental average Experimental outer surface Experimental inner surface
Figure 62 Residual stress distributions bottom flange HE 100A, steel grade S235, in N/mm2.
4.4.2 Comparison to theory
Residual stresses in roller bent sections show a more irregular pattern when compared to the
theoretical patterns based on Timoshenko [132]. The theoretical model is not suitable to give a
stress gradient along the flange width, whereas experimental and numerical results revealed a
clear stress gradient. The experimental and numerical results were featured by predominantly
compressive stresses in the web without a sudden stress reversal at mid-height of the section as
given by the theoretical solution. Furthermore, the distinctive antisymmetrical residual stress
pattern suggested by the theoretical model was neither obtained from the numerical computations
nor from laboratory tests.
4.4.3 Sensitivity analyses
All numerical computations were performed without the inclusion of an initial residual stress
pattern due to hot rolling of the beam section. A sensitivity analysis has shown that the
incorporation of an initial residual stress pattern prior to rolling has a negligible influence on the
final residual stress distribution. Another sensitivity analysis was performed to assess the
influence of the exerted force of the flange support roller on the residual stresses. Variation of the
flange support roller displacement altered the exerted force which revealed that the residual
stresses in the web were influenced and the residual stresses in the flanges were largely
unaffected.
4.4.4 Explanations of differences
The stress distributions in the webs show only moderate agreement between numerical and
experimental results. The lack of coherence is most dominant in the middle and top parts of the
web (Figure 58 and Figure 59). The reasons for this discrepancy can possibly be attributed to a
shortcoming in the material model in conjunction with multiple pass bending (see also section
1.3). The discrepancy may also be partly caused by the influence of the flange support roller. An
isotropic hardening law was implemented based on uniaxial tensile tests carried out on coupons

60 Structural properties and out-of-plane stability of roller bent steel arches
taken from straight wide flange sections, thereby fully neglecting the possible presence of the
Bauschinger effect. The beam was fed through the rollers in a single pass in the finite element
environment. During actual roller bending, the member is forced through the rollers in multiple
passes featuring a process of repeated loading and unloading. The response of a steel beam bent
in a single pass incorporating an isotropic hardening law, may be somewhat different compared
to that of a real beam formed during multiple passes, obeying a hardening law and experiencing
the Bauschinger effect.
This effect will possibly be most profound for the area near the neutral axis of the beam. During
cold forming it is known that the neutral axis gradually shifts towards the bottom (compressive)
flange as found by Hill [48], thereby changing the sign of the plastic strains in that area. The fact
that this shift is achieved by feeding the beam in a single pass or in multiple passes and
employing a simple hardening law, may alter the final stress distribution in the vicinity of the
neutral axis. The complexity of multiple pass bending is further increased since the number of
passes to arrive at the designated radius varies from section to section and is not known
beforehand.
Previous finite element investigations on roller straightening of railway members, which to some
extent can be seen as repeated roller bending passes, have underlined the importance of an
accurate material law. Schleinzer and Fischer [119] carried out cyclic tests on specimens taken
from railway sections in order to make allowances for the Bauschinger effect.
Similarly, Ringsberg and Lindback [110], as part of their investigation on residual stresses due to
straightening of railway sections, attributed discrepancies between numerical residual stresses
and experimental values to a simplified material model. This model could not accurately describe
the real material behavior during cyclic loading.
The lack of coherence between numerical and experimental residual stresses in the web will be of
minor importance in view of the structural stability behavior of steel arches. Elastic-plastic
buckling of steel arches is usually governed by flange yielding as stated by Pi and Trahair [96]
and Pi et al. [88] rather than the attainment of the yield stress in the web. The residual stresses in
the flanges, for which a sufficiently accurate estimation has been achieved with the finite element
model, are therefore of greater interest compared to the residual stresses in the web.
4.5 Conclusions
Based on a comparison of the residual stresses of finite element and experimental results, the
following conclusions can be drawn. For the top flange of the wide flange sections investigated
good agreement was observed. The finite element model and the experiments only revealed
moderate coherence in the web. Very good agreements between both methodologies were found
for the bottom flange. Large tensile peak stresses at the bottom flange were observed in all
simulations.
The residual stresses found in the finite element analyses are not affected by an initial residual
stress pattern. The residual stresses in the web are influenced by the force exerted by the flange
support roller. Both the experimental and numerical values showed a large contrast with respect
to the theoretical pattern based on Timoshenko [132]. In view of the possible model
simplifications and uncertainties associated with the roller bending process and the accuracy with
which residual stresses can be measured, it is concluded that the proposed finite element method
can be regarded as a suitable tool to estimate residual stresses in roller bent wide flange steel
sections for design purposes.

5 Residual stress model for roller bent wide
flange sections This chapter proposes a residual stress model for roller bent wide flange sections, based on
earlier conducted numerical investigations which were validated by experimental research
(previous chapter). The proposed residual stress model can serve as an initial state of a roller
bent steel section in fully non-linear finite element analyses to accurately predict its influence on
the elastic-plastic buckling response. Parts of this chapter have been published in Spoorenberg et
al. [126].
5.1 Introduction
The study of the structural behavior of steel arches subject to in-plane loading necessitates a
detailed knowledge of residual stresses in roller bent steel sections bent about the major axis in
view of their influence on the elastic-plastic buckling response of steel arches. Considering the
observations from the chapter 3 and chapter 4, the final step is an examination of all numerical
data to arrive at a residual stress model for circular roller bent wide flange steel sections bent
around the major axis. The proposed residual stress model will be compared against the
experimental and numerical data as a final check on the accuracy.
5.2 Residual stress analyses based on finite element
computations.
It has been shown in chapter 4 that close agreement can be attained between finite element
analyses and experimental results for the averaged residual stresses over the web and flange
thickness. The finite element model was not developed to simulate the residual stress gradients
over the web thickness and flange thickness. However, it yields averaged residual stresses over
the web and flange thickness for the entire cross-section. An experimental approach for obtaining
residual stresses cannot yield data for the entire cross-section due to placement requirements of
the strain gauges. It was therefore decided to employ finite element analyses to generate residual
stresses which can be used in the development of a proposal for a roller bent residual stress
model, thereby ignoring residual stress gradients over the web and flange thickness. In view of
earlier developed residual stress models (Daddi and Mazzolani [29], Beg and Hladnik [13]) for
straight steel members, which also ignored the measured residual stress gradient over the web
and flange thickness, this simplification was considered appropriate. Residual stresses were
obtained for a total of 18 wide flange steel sections by simulation in the finite element
environment. Two steel grades, four different sections and five bending radii were used which
yielded 8 different bending ratios (Table 6). The bending ratio equals the radius of the circular
arch divided by the nominal height of the cross-section. An increase of the bending ratio means a
decrease of the degree of cold-working, when the height of the section is kept constant. As part
of the experimental procedure to measure residual stresses, tensile tests were performed on
coupons taken from the flanges of straight reference sections to obtain the yield stress and
ultimate tensile stress, according to NEN-EN 10002-1 [79] and EN 10025 [34]. These straight
sections were originally attached to the roller-bent specimens and give information on the state of
the material prior to roller bending. Dividing the numerically obtained residual stresses by the
measured yield stresses of the straight material gives normalized residual stress values.

62 Structural properties and out-of-plane stability of roller bent steel arches
5.2.1 Numerically obtained roller bent residual stresses
The roller bent residual stresses obtained by finite element analysis of all 18 wide flange sections
are presented in Figure 63 at normalized locations. The residual stresses in the top flange range
from 0fy to 0.2fy at the tips and at the web-to-flange junction they range from -0.2fy to 0.2fy. The
bottom flange is featured by compressive stresses at the flange tips that range from -0.1fy to -0.3fy
and tensile stresses at the web-to-flange junction ranging from 0.4fy to 0.7fy. The web shows a
large scatter when compared to the stress characteristics in the flanges. Although consistent
trends from the web stresses cannot readily be observed, it can be concluded that the upper part
of the web is in tension with an average maximum stress of approximately 0.3fy. The lower part
of the web is mainly subject to compression with an average maximum stress of approximately -
0.4fy. Steep stress gradients are observed at the web-to-flange junctions, as reflected by the large
difference between the stress values in the top and bottom of the web and in the middle of the top
flange and bottom flange respectively. In Figure 63 it can be seen that the numerical calculations
comprise a wide range of bending radii and steel grades. For the development of a single residual
stress model the influence of the bending ratio and the yield stress of the original material on the
numerical residual stresses were studied first. It was observed that the maximum tensile and
compressive residual stresses from all 18 analyses are consistently located in the bottom flange at
the web-to-flange junction and flange tips respectively. It was therefore decided that the residual
stress patterns across the bottom flange, which was subjected to compressive actions during roller
bending, would be used to investigate the influence of bending ratio and original yield stress.
-1
-0.5
0
0.5
1
-0.5 0 0.5
-0.5
0
0.5
-1
-0.5 0
0.5 1-1
-0.5
0
0.5
1
-0.5 0 0.5
Top fl.
Bot. fl.
Figure 63 Normalized residual stresses in 18 roller bent wide flange sections
5.2.2 Influence of bending radius
The amount of cold-work or plastic straining applied during roller bending may affect the
magnitude of the residual stresses. For steel exhibiting a clear hardening stage, a decrease of the
bending ratio is expected to induce higher residual stresses. For each steel section as presented in
Table 6, the numerically obtained maximum tensile and maximum compressive normalized
residual stresses in the bottom flange are displayed as a function of the bending ratio in Figure
64(left). It can be seen that the bending ratio has no clear influence on the extreme residual
stresses within the examined range of 12.5 ≤ R/h ≤ 39.79. Consequently a residual stress model
can be developed which is independent of the bending radius, and applicable to a bending ratio
range of approximately 10 ≤ R/h ≤ 40.

Residual stress model for roller bent wide flange sections 63
-1
-0.5
0
0.5
1
0 10 20 30 40
Bending ratio R/h [-]
residual stress against bending ratio
-300
-150
0
150
300
0 125 250 375 500
Yield stress [N/mm2]
residual stress against yield stressN
orm
aliz
ed r
esid
ual
str
ess
[-]
Res
idu
al s
tres
s [N
/mm
2]
ζres = -68 + 0.73 fy
ζres = 43 - 0.31 fy
Figure 64 Normalized maximum tensile and compressive residual stresses in the bottom flange
versus bending ratio (left) and maximum tensile and compressive residual stresses in the bottom
flange versus yield stress of original material (right).
5.2.3 Influence of original yield stress
The yield stress of the original material may also affect the magnitude of the residual stresses.
Structural steel with a higher yield stress prior to roller bending may have higher residual stresses
after bending when compared to steel with low yield stress levels. Residual stress measurements
published by Gardner and Cruise [41] on press braked angles and cold-rolled box sections have
shown a clear relationship between material yield stress and magnitude of residual stresses.
Figure 64(right) shows the maximum tensile and compressive residual stresses in the bottom
flange versus the measured yield stress of the material before roller bending. The residual stress
values are not normalized, in order to display the influence of the yield stress on the magnitude of
the residual stress. It can be seen that larger tensile residual stresses are obtained from original
material with an increased yield stress. This is exemplified by the trend line. The compressive
stresses exhibit a similar trend. Based on the trend lines in Figure 64(right) it was decided that a
normalized residual stress pattern can be modeled which is linearly related to the yield stress of
the original straight material, for steel grades S235 and S355.
5.3 Roller bent residual stress model for wide flange sections
Based on the numerically obtained roller bent residual stresses, a model of these stresses for wide
flange steel sections is suggested. This proposal is intended to be generally applicable,
independent of the bending ratio for the range of 10 ≤ R/h ≤ 40 (section 5.2.2) and linearly
related to the magnitude of the original yield stress for S235 and S355 steel sections (section
5.2.3). The magnitudes and pattern for the residual stress model are determined to best fit the
finite element results.
5.3.1 Residual stress pattern and magnitudes
The residual stress model is based on the numerically obtained residual stresses as shown in
Figure 63and the trend lines as shown in Figure 64 and is shown in Figure 65. A symmetric bi-
linear stress pattern along the half bottom flange is suggested with a maximum tensile stress
value of 0.7fy at the web-to-flange junction and 0.35fy compression at the flange tip. These stress
values are based on the gradient of the trend lines as shown in Figure 64 A somewhat larger
compressive stress value for the flange tips than shown in the trend line of Figure 64 has been
proposed, since numerical data could not be obtained at the flange tips but at a distance away

64 Structural properties and out-of-plane stability of roller bent steel arches
from the ends (integration point location). Using the gradient of the trend line would therefore
result in an underestimation of the compressive stresses at the flange tips.
h0
ζwrt
(b) Residual stresses
0.2fy
0.2fy
0.35fy
0.35fy
b
h
(a) Dimensions
tf
tw
0.35fy
(c) Equilibrium of stress blocks in web
Resultant tensile force0.25btf0.35fy
1/2h0
1/4h0
Resultant tensile force
b/4
ζwrc 1/4h0
Figure 65 Proposed residual stress model for roller bent wide flange steel sections.
For the top flange a linear stress gradient is suggested based on a qualitative fit with numerical
data, featured by 0.2fy tensile stresses and 0.2fy compressive stresses at the flange tips and flange
center, respectively (Figure 65(c)).
For the web two triangular stress blocks are suggested. The tensile and compressive stress peak
of the triangles are located at a distance of 1/4 h0 and 3/4 h0 from the web-to-flange junction of
the top flange, respectively. The stress values are equal to zero at the top and bottom of the web.
The maximum tensile and compressive residual stress values in the web are annotated by ζwrt and
ζwrc respectively and their magnitudes are governed by the internal equilibrium requirement.
Equilibrium conditions for residual stresses consist of the axial force, major moment and minor
moment equilibrium requirement as stated earlier by Lay and Ward [69], Szalai and Papp [129].
Equilibrium about the minor bending axis is automatically satisfied due to the symmetric pattern
of the suggested residual stress model about this axis. The bi-linear residual stress pattern in the
bottom flange yields a net tensile force, which is balanced by residual stresses in the web,
according the equilibrium requirements. The two unknown web stresses: ζwrt and ζwrc can be
obtained from the two remaining equilibrium equations: the normal forces and the major bending
moment requirement Figure 65(c). The equilibrium equations are simplified by neglecting the
fillets in the wide flange section.
Axial force (N) and major moment (M) equilibrium equations can be set up by summing forces
for all stress blocks and summing the product of these normal forces and their distances to the
center of the top flange, as depicted in Figure 65(c):
f w 0 wrt wrc y
f 0 w 0 0 wrt 0 0 wrt y
7 1 1 1 10
80 8 4 8 4
7 1 1 1 5 1 7 1 50
80 8 6 4 12 4 12 8 6
N bt t h f
M bt h t h h h h f
(21)
Equation (21) can be simplified into:
f w 0 wrt wrc y
f 0 0 w wrt wrc 0 y
7 3 30
80 8 8
7 1 10
80 8 4
N bt t h f
M bt h h t h f
(22)
And written in matrix notations:

Residual stress model for roller bent wide flange sections 65
f
wrt
y 0 w y
wrc0 0 f 0
3 3 7
08 8 80
1 1 7 0
8 4 80
btN
f h t fM
h h bt h
(23)
Solving (23) for ζwrt and ζwrc yields:
f fwrt y wrc y
0 w 0 w
7 14,
30 30
bt btf f
h t h t (24)
With these values the residual stress model for roller bent wide flange steel sections is complete.
5.3.2 Residual stress model features
From equation (24) it is clear that the requirement of internal equilibrium renders the proposed
model to be different per section geometry. The residual stress values in the web are governed
by the ratio between the area of the flange and area of the web. The proposed model is
qualitatively identical for all wide flange sections but the magnitude of the residual stresses in the
web is dependent on the geometry of the cross section.
Figure 65 shows that the numerical residual stress pattern is featured by a sharp stress gradient at
the web-to-flange junctions of the roller bent wide flange sections. This sharp stress gradient has
been approximated in the proposed residual stress model by a so-called „stress jump‟ at the web-
to-flange junctions (i.e. the stress value at the top of the web or bottom of the web is different
than the stress value in the middle of the top flange or middle of the bottom flange, respectively).
A stress jump is a stress change over an infinitesimal distance and can also be found in residual
stress models for welded sections, Sakimoto and Komatsu [113] (Figure 27 (b)). Modeling the
large stress gradients instead of the stress-jumps in the web-to-flange junctions in a residual
stress model would significantly complicate the stress pattern in the web and improve its
accuracy only marginally as the pertaining section areas are extremely small. The stress jump
provides therefore a simplification to the residual stress model and enhances the simplicity of the
equilibrium equations and ease of applicability when employed in numerical models.
5.4 Discussion
5.4.1 Comparison to experiments
A full overview of the averaged experimental results from chapter 3 compared with the suggested
residual stress model is shown in Figure 66. The averaged experimental results for roller bent
sections and the suggested residual stress model are plotted against the location over the section
normalized by the flange width b or section height h. Due to placement requirements of the strain
gauges, average values could not be obtained close to the junction of the flanges and web.
Similarly to the numerical stress values, the experimental results were normalized with respect to
the measured yield stress of the straight material (Figure 66). The proposed residual stress model
agrees well with the measured residuals stress value for the HE 100A, HE 100B and HE 360B
sections, although less coherence is found in the web of the IPE 360 series.

66 Structural properties and out-of-plane stability of roller bent steel arches
-0.5
0
0.5
-1
-0.5 0
0.5 1-1
-0.5
0
0.5
1
-0.5 0 0.5
-1
-0.5
0
0.5
1
-0.5 0 0.5
HE 100A Top fl.
-1
-0.5
0
0.5
1
-0.5 0 0.5
-0.5
0
0.5
-1
-0.5 0
0.5 1-1
-0.5
0
0.5
1
-0.5 0 0.5
Bot. fl.
HE 100B Top fl.
Bot fl.
-1
-0.5
0
0.5
1
-0.5 0 0.5
-0.5
0
0.5
-1
-0.5 0
0.5 1-1
-0.5
0
0.5
1
-0.5 0 0.5
-1
-0.5
0
0.5
1
-0.5 0 0.5
-0.5
0
0.5
-1
-0.5 0
0.5 1-1
-0.5
0
0.5
1
-0.5 0 0.5
IPE 360 Top fl.
Bot fl.
HE 360B Top fl.
Bot fl.
Experiment Residual stress model
Figure 66 Normalized measured averaged residual stresses and proposed residual stress model.
5.4.2 Comparison to numerical analyses
The proposed residual stress model is based on the finite element patterns and magnitudes from
all wide flange sections as summarized in Figure 67 and the trend lines shown in Figure 67.
However, in order to meet the internal equilibrium requirements, the suggested model will be
different for all wide flange steel sections. The proposed residual stress model is therefore
compared to the finite element residual stresses in all 4 different section types, see Figure 67. A
good correlation of results can be observed for the HE 100A, HE 100B and HE 360B series but
larger discrepancies are found in the top flange of the IPE 360 series.

Residual stress model for roller bent wide flange sections 67
-1
-0.5
0
0.5
1
-0.5 0 0.5
-0.5
0
0.5
-1
-0.5 0
0.5 1-1
-0.5
0
0.5
1
-0.5 0 0.5
-1
-0.5
0
0.5
1
-0.5 0 0.5
-0.5
0
0.5
-1
-0.5 0
0.5 1-1
-0.5
0
0.5
1
-0.5 0 0.5
HE 100A Top fl.
Bot. fl.
HE 100B Top fl.
Bot. fl.
-1
-0.5
0
0.5
1
-0.5 0 0.5
-0.5
0
0.5
-1
-0.5 0
0.5 1-1
-0.5
0
0.5
1
-0.5 0 0.5
-1
-0.5
0
0.5
1
-0.5 0 0.5
-0.5
0
0.5
-1
-0.5 0
0.5 1-1
-0.5
0
0.5
1
-0.5 0 0.5
HE 360B Top fl.
Bot. fl.
IPE 360 Top fl.
Bot. fl.
Numerical Residual stress Model
Figure 67 Normalized computed residual stresses and proposed residual stress model.
5.4.3 Comparison between existing hot-rolled and proposed roller bent residual
stress models
Compressive residual stresses in the flange tips are detrimental to the resistance of members
susceptible to either flexural or lateral torsional buckling. Compressive residual stresses in the
flange tips reduce the flexural stiffness during elastic-plastic arch buckling and subsequently will
cause early collapse of the arch. A hot-rolled residual stress model is featured by compressive
stresses in all four flange tips, whereas the proposed model displays only compressive stresses in
the tips of the bottom flange. From a qualitative comparison between the hot-rolled model and
the proposed roller bent model it can be concluded that the proposed residual stress model for

68 Structural properties and out-of-plane stability of roller bent steel arches
roller bent wide flange steel sections will be more favorable to the resistance of steel arches,
when either failing by in-plane or out-of-plane elastic-plastic buckling.
5.4.4 Range of applicability residual stress model
Good coherence between the residual stress model and experimental results for various roller
bent wide flange sections can be observed in Figure 66. This allows the application of the
residual stress model to other wide flange sections that did not make part of the experimental
program. In addition, since the residual stress model can be expressed as a function of the yield
stress of the straight material, it can be applied to other steel grades (e.g. steel grade S275).
Under the assumption that for bending ratios R/h > 40 the required amount of cold work on the
section will be marginally smaller, the reduction in residual stresses will be of minor influence.
Application of the residual stress model to roller bent arches with larger bending ratios than
currently investigated seems appropriate but is probably conservative.
5.5 Conclusions
In this chapter residual stresses obtained from finite element analyses from chapter 4 have been
summarized and normalized with respect to the yield stress of the material before roller bending
to develop and present a residual stress model. It was found that the bending ratio does not
influence the magnitudes of the residual stresses, allowing for a residual stress model
representing all examined bending radii for 10 ≤ R/h ≤ 40. The residual stresses were found to be
linearly dependent on the yield stress of the original material and a single normalized residual
stress model could therefore represent all roller bent sections, for steel grades S235 and S355.
Based on a best fit of the finite element data, the proposed linear stress gradient along the width
of the top flange (the flange that is plastically elongated in longitudinal direction during roller
bending) is featured by stress magnitudes of 0.2fy in tension and 0.2fy in compression at the
flange tips and flange center respectively. The residual stress in the bottom flange (the flange
that is plastically shortened in longitudinal direction during roller bending) can be represented by
a bi-linear pattern with a maximum compressive stress of 0.35fy at the flange tip, zero stress at
the quarter points of the flange width and a maximum tension of 0.70fy at the web-to-flange
junction. The residual stress pattern over the height of the web can be represented by two
triangular stress blocks: tensile stress in the upper region of the web near the top flange and
compressive stress in the lower region. The maximum value for the two zones can be determined
from internal equilibrium which results in 0.2-0.4fy for tension and 0.4-0.8fy for compression
residual stresses. The residual stress model was compared to experimental and numerical residual
stress measurements and good agreement was observed. The suggested residual stress model can
be implemented in finite element models with beam or shell elements to assess its influence on
the elastic-plastic buckling response of steel arches. In view of the detrimental influence of
compressive residual stress at the flange tips it is expected that the proposed residual stress model
will yield higher resistances compared to finite element analyses using models for hot-rolled
residual stresses when investigating elastic-plastic arch buckling

6 Mechanical properties of roller bent sections -
Experimental investigation This chapter presents the results of an extensive experimental investigation of the mechanical
properties of roller bent wide flange sections. It comprises tensile tests and compression tests on
coupons taken from roller bent sections and their straight counterparts. The results show that the
roller bending process alters the mechanical properties of the material non-uniformly over the
cross-section. In this chapter the experimental results are presented. In the subsequent chapter
the experimental results are used to arrive at a set of equations that yields different stress-strain
curves for specific zones across the roller bent steel section. Parts of this chapter have been
published in Spoorenberg et al. [124].
6.1 Introduction
The development of numerical procedures such as the finite element method has expanded the
possibilities to obtain close estimates of the maximum resistance of structural steel members.
These numerical procedures necessitate a detailed knowledge of input parameters such as initial
crookedness, residual stresses and mechanical properties. For most structural steels, the material
characteristics are well-known and can easily be implemented in finite element models. The
stress-strain relationship of structural carbon steel is characterized by a linear elastic branch with
a sharp yield point, and a flat yield plateau followed by strain hardening. This behavior is often
idealized by a bi-linear (elastic, perfectly-plastic) material law in conjunction with the nominal
yield stress, which is acceptable for the majority of structural design purposes. However, for the
design of an arched structure using a roller bent steel section, the employment of a single bi-
linear stress-strain relationship across the entire section leads to an oversimplification of the
analysis. This is due to fact that the roller bending process has a significant impact on the
material parameters required for the numerical analysis. An experimental investigation was
undertaken to determine the mechanical properties of roller bent wide flange steel sections. It
consisted of performing tensile and compression tests on coupons taken from roller bent sections
and their straight counterparts. In the subsequent chapter the experimental results are used to
arrive at a set of equations that yields seven different stress-strain curves for nine specific zones
across the steel sections.
6.1.1 Cold formed steel
When a steel member is cold-formed, it can be expected that the newly obtained mechanical
properties of the steel are different when compared to the original steel used. The yield stress,
ultimate tensile stress and ductility change. The cold forming process also causes fundamental
changes in the yielding type, whereby the initially distinct sharp yield point present in most
carbon steels is replaced by a rounded stress-strain curve.
In structural engineering the change in mechanical properties as a result of cold working has been
studied earlier. Chajes et al. [21] conducted experiments on the influence of uniform cold
stretching on the mechanical properties of carbon steel sheeting. It was observed that the increase
in yield stress and ultimate tensile stress depend on the direction of cold working and the
properties of the original material. When the direction of plastic stretching coincides with the
direction of loading, increases in yield stress and ultimate tensile stress were observed,
underlining the potential benefit of cold working steel in structural applications.
The influence of the manufacturing process on the mechanical properties of cold-formed steel
sections has also been studied extensively. Cold-formed sections are produced from flat steel
sheeting by means of various cold-forming techniques such as press-braking and roll forming.

70 Structural properties and out-of-plane stability of roller bent steel arches
The influence on structural carbon steel has been investigated experimentally by Karren [54],
Karren and Winter [55], Key et al. [58] and Abdel-Rahman and Sivakumaran [1] and on stainless
steel by Rasmussen and Hancock [106], Gardner and Nethercot [42] and Cruise and Gardner
[27]. It was found that especially the corner regions of these cold formed sections showed a
significant increase in yield stress and ultimate tensile stress. Karren suggested that since the
corner regions represent up to 30 % of the cross-sectional area, the influence of the altered
mechanical properties should be incorporated in structural calculations.
6.1.2 Motivation for research
The changes in mechanical properties due to roller bending were first investigated by Schlim
[120]. He performed uniaxial tensile tests on coupons taken from HE 220M mild steel sections of
steel grade RSt 37-2 (Steel grade S235) bent into 3 different radii. In addition Charpy V-Notch
tests were conducted to measure changes in fracture toughness. Experimental results showed a 10
% increase in both yield stress and ultimate tensile stress. No significant change for the fracture
toughness was found. The majority of earlier studies (chapter 2) on the carrying capacity of steel
arches did not consider the influence of the manufacturing process on the mechanical properties
of steel arches. Since the material is cold worked during the roller bending process, it cannot be
assumed that the stress-strain curve of the straight material is representative for roller bent
sections. This leaves a gap in the use of material models for arch design. The current chapter
presents the experimental results of tensile tests conducted on roller bent wide flange sections
and straight reference sections to examine the influence of the roller bending process on the
mechanical properties. In the subsequent chapter, a series of equations is proposed to predict the
change in mechanical properties and to provide stress-strain curves for roller bent sections. The
utilization of the adjusted mechanical properties and stress-strain curves in structural analyses
form an important step towards improved estimates for strength capacities of steel arches.
6.2 Experimental program and testing procedure
The mechanical properties of the roller bent sections were obtained from tensile tests on coupons
taken from roller bent wide flange sections and straight reference sections.
6.2.1 Experimental program
An experimental program was set-up which comprised different steel grades, sections and
bending radii. The specimens consisted of small and medium-sized wide flange sections, i.e.
HE100A-HE100B and HE360B-IPE 360 sections. A full overview of the experimental program
is presented in Table 10, which comprises the same sections as presented in Table 6. The curved
specimens were made from steel grades S235 and S355 with a nominal yield stress of 235 and
355 N/mm2, respectively. The bending ratio equals the arch radius R divided by the nominal
section height h, and reflects the degree to which the member has been cold worked. A decrease
in the bending ratio reflects an increased amount of cold work. The examined range of the
bending ratio was 12.5 ≤ R/h ≤ 39.79. The section dimensions are presented in Table 11. Tensile
tests on coupons taken from straight reference sections were taken in order to make a comparison
with their roller bent counterparts. The straight reference sections were cut from the same
production member as the roller bent ones, thereby representing the material prior to roller
bending (Figure 36).
The European delivery standard EN 10025 [34] for structural steel states that only a single
coupon in longitudinal direction be taken from the flange at one sixth of its width from the edge
of the flange in order to verify the mechanical properties of the entire member. However, since it
is expected that the material will show considerable variation in mechanical properties across the
section, multiple coupons were taken in the longitudinal direction at different locations over the
section for both straight and roller bent members, Figure 68(a). Figure 68(b) shows the locations

Mechanical properties of roller bent sections – Experimental investigation 71
of the tensile test coupons by Schlim [120]. In the current investigation of the smaller sections, 3
coupons were taken from the flanges and 3 coupons from the web, making a total of 9 coupons.
Due to the dimensions of the IPE 360 and HE 360B sections, 3 and 5 coupons were milled from
the flanges in addition to 7 and 5 coupons from the webs, respectively. A total of 128 coupons
were taken from straight sections and 190 coupons were taken from the roller bent sections.
Table 10 Roller bent sections used.
Section
type
Steel
grade
Radius
[mm]
Bending ratio
R/h [-]
No of coupons
Flange Web Total
HE 100A S235 1910 19.89 3 3 9
S355 1910 19.89 3 3 9
S235 2546 26.52 3 3 9
S355 2546 26.52 3 3 9
S235 3820 39.79 3 3 9
S355 3820 39.79 3 3 9
HE 100B S235 1910 19.1 3 3 9
S355 1910 19.1 3 3 9
S235 2546 2.546 3 3 9
S355 2546 2.546 3 3 9
S235 3820 3.82 3 3 9
S355 3820 3.82 3 3 9
HE 360B S235 8000 22.22 5 5 15
S355 8000 22.22 5 5 15
IPE 360 S235 4500 12.5 3 7 13
S355 4500 12.5 3 7 13
S235 8000 22.22 3 7 13
S355 8000 22.22 3 7 13
h/4
b/6
IPE 360HE 360BHE 100A
1 2 3
4 5 6
789
1 2 3 4 5
6 7 8 9 10
11
12
13
14
15
1 2 3
4 5 6
7
8
9
10
11
12
13
b/6
b
h
b/6
h/8
h/8
h/8
h/8
h/8b/6
h
b b
tf
tw
HE 220M
b/6
(a) Author´s investigation (b) Schlim
h1
h1/6
h/4
1 2 3
4 5 6
789b/6
b
h
HE 100B
Figure 68 Position of tensile coupons and the accompanying reference numbers.

72 Structural properties and out-of-plane stability of roller bent steel arches
Table 11 Nominal section dimensions [mm]
Section Height h Width b Flange thickness
tf
Web thickness tw
HE 100A 96 100 8 5
HE 100B 100 100 10 6
HE 360B 360 300 22.5 12.5
IPE 360 300 170 12.7 8
6.2.2 Testing procedure
The coupons were placed in a 250 kN Schenck servo-controlled testing machine. The axial
deformations were measured by two extensometers: a small one with a limited range (up to 4%
strain) but high accuracy and a large extensometer with a large range (up to 50% strain) but
lower accuracy. Strain values were obtained by dividing the axial deformations by the initial
gauge length. The applied loading was divided by the original (measured) cross-sectional area to
obtain engineering stress values. The size of the coupons was based on EN 10002-1 [33].
It has been shown by Tall and Alpsten [130] that the strain rate or loading speed influences the
stress values. When the loading speed is not suppressed, a stress-strain curve is obtained which is
influenced by the strain rate, referred to as the „dynamic‟ stress-strain curve (Figure 69). In the
current investigation the influence of the strain rate has been excluded by pausing the applied
straining three times for 1.5 min near the 0.2 % proof stress and near the ultimate tensile stress
according to Technical Memoranda B.7 and B.8. of the structural stability guide by Ziemian
[149]. At each stop the load drops until it stabilizes thereby creating low points in the stress-
strain curve.
0
100
200
300
400
500
600
0 0.005 0.01 0.015 0.02
Str
ess
[N/m
m2]
Strain [-]
0
100
200
300
400
500
600
0 0.1 0.2 0.3 0.4 0.5
Str
ess
[N/m
m2]
Strain [-]
Dynamic Stress
Static Stress
0.002
Dynamic Stress
Static Stress
fy
(εt, ft)
εu
Large extensometerSmall extensometer
Figure 69 Stress-strain curve for straight steel, HE 100A, steel grade S235, coupon #1.
The left diagram shows the stress-strain curves as measured with the small extensometer and the
graph on the right displays the stress-strain curves measured with the large extensometer. The
„static‟ stress-strain curve was obtained by shifting the „dynamic‟ stress-strain curve downwards
to the low points in the stress-strain curve (black line in Figure 69). The yield stress (fy) is
defined as the intersection between the static stress-strain curve and the 0.2 % offset line,
regardless of the yielding type (i.e. sharp yielding or rounded yielding). A Young‟s modulus
value of E=200 000 N/mm2 was used to determine the 0.2 % offset line. The ultimate tensile
stress (ft) is defined as the maximum stress obtained from the static stress-strain curve. The strain
value at ultimate tensile stress is defined as εt. The specimens were loaded until fracture. The
strain at fracture εu is a measure of the ductility of steel. Hereafter, only static stress-strain curves

Mechanical properties of roller bent sections – Experimental investigation 73
will be presented. The coupons taken from the flanges of the smaller roller bent specimens (HE
100A – HE 100B) have a permanent curvature (Figure 70).
Figure 70 Curved coupons after fracture with strain gauges and curved coupons at the back.
Due to the small thickness of the flanges and the minimum coupon dimensions required by the
milling apparatus, it was not possible to obtain flat coupons from the flanges of the HE 100A and
HE 100B series. The curved coupons were flattened as soon as they were gripped in the testing
machine. One strain gauge was attached to each of the four sides of the coupon (Figure 70). The
strain values from the curved sides were averaged to give the membrane engineering strain. The
gauges attached to the flat sides (thickness) of the curved coupon served for additional checking.
Due to the bending moment exerted by the grips on the coupon, it was expected that the material
would deviate from linear elastic behavior at low load levels thereby affecting the proportional
limit values in the stress-strain curves. The stress-strain data from the flanges of the smaller
sections will therefore not be used to obtain the proportional limit. It is assumed that the gripping
had negligible influence on the values of the other mechanical properties.
6.3 Experimental results
An illustrative comparison between the tensile-test data taken from a straight section and a roller
bent section is shown in Figure 71.
0
100
200
300
400
500
600
0 0.005 0.01 0.015 0.02
Str
ess
[N/m
m2]
Strain [-]
0
100
200
300
400
500
600
0 0.1 0.2 0.3 0.4 0.5
Str
ess
[N/m
m2]
Strain [-]
Roller bent steel
Straight steel
Roller bent steel
Straight steel
0.002
fy;s
fy;r
(εu;r, ft;r)
εu;r εu;s
(εu;s, ft;s)
Small extensometer Large extensometer
Figure 71 Stress-strain curve of straight and roller bent section. HE 360B, steel grade S235,
coupon #5.

74 Structural properties and out-of-plane stability of roller bent steel arches
The stress-strain curve for coupon number 5 (Figure 68) taken from the top flange of an HE
360B with steel grade S235, bent into an arch with a radius R=8000 mm is shown in Figure 71
together with the stress-strain curve of its straight reference section. Straight steel and roller bent
steel are respectively referred to by the subscripts „s‟ or „r‟ after the semicolon.It can be seen that
the yield stress and ultimate tensile stress increase as a result of roller bending but the strain at
ultimate stress and strain at fracture decrease. The yield stress of the straight material is
significantly higher than the nominal value according to its specifications, underlining the
importance of measuring straight reference sections in order to correctly determine the change in
mechanical properties as a result of roller bending. The coupons taken from the roller bent
sections have no definite yield point and show an early departure from the linear elastic branch,
this will be treated more thoroughly in section 6.3.2.2.
6.3.1 Straight reference sections
The yield stress, ultimate tensile stress, strain at ultimate tensile stress and strain at fracture as
obtained from all tensile tests are plotted at their normalized locations in Figure 72. From these
plots it can be seen that the yield stress value varies greatly per location on the cross-section.
Coupons taken from the center of the web generally display lower yield stress values compared
to coupons taken at other locations of the web.
0 200 400 600 800
0
200
400
600
800
0
200
400
600
800
Top
Flange
Bottom
Flange
0 200 400 600 800
0
200
400
600
800
0
200
400
600
800
Top
Flange
Bottom
Flange
fy;sft;s
0 0.1 0.2 0.3 0.4 0.5
0
0.1
0.2
0.3
0.4
0.5
0
0.1
0.2
0.3
0.4
0.5
Top
Flange
Bottom
Flange
εt;s
0 0.1 0.2 0.3 0.4 0.5
0
0.1
0.2
0.3
0.4
0.5
0
0.1
0.2
0.3
0.4
0.5
Top
Flange
Bottom
Flange
εu;s
Steel grade S235 Steel grade S355
Figure 72 Mechanical properties distribution for straight hot-rolled wide flange sections. Stresses
in N/mm2.
On the contrary, the strain at ultimate tensile stress and strain at fracture of coupons taken from
the center of the web are higher than for the coupons taken from other locations of the web
(Figure 72). The differences in the web are due to fact that the straight sections are often roller
straightened in order to meet the delivery requirements for out-of-straightness, whereby the
straightening rolls are applied to the web close to the web-to-flange junction. The high pressure
exerted by the rolls to these areas causes a higher yield stress, ultimate tensile stress and lower
ductility in the web nearest to the web-to-flange junctions compared to other regions. This was
noted earlier by Bjorhovde [17].

Mechanical properties of roller bent sections – Experimental investigation 75
6.3.2 Roller bent sections
6.3.2.1 Distribution of mechanical properties
The distribution of the yield stress, ultimate tensile stress, strain at ultimate tensile stress and
strain at fracture for the roller bent wide flange steel sections are shown in Figure 73. It can
clearly be seen that the mechanical properties are not uniform along the width of the flanges,
especially in the bottom flange. Coupons taken at the web-to-flange junction of the bottom flange
exhibit a significantly higher material strength than other coupons from the bottom flange. The
strength characteristics in the web are more or less symmetric with respect to the major bending
axis. The strain at fracture has the largest values near the neutral axis. Small values of strain at
ultimate tensile stress (around 0.05 – 0.12) are observed at the web-to-flange junction of the
bottom flange.
0 200 400 600 800
0
200
400
600
800
0
200
400
600
800
Top
Flange
Bottom
Flange
0 200 400 600 800
0
200
400
600
800
0
200
400
600
800
Top
Flange
Bottom
Flange
fy;rft;r
0 0.1 0.2 0.3 0.4 0.5
0
0.1
0.2
0.3
0.4
0.5
0
0.1
0.2
0.3
0.4
0.5
Top
Flange
Bottom
Flange
εt;r
0 0.1 0.2 0.3 0.4 0.5
0
0.1
0.2
0.3
0.4
0.5
0
0.1
0.2
0.3
0.4
0.5
Top
Flange
Bottom
Flange
εu;r
Steel grade S235 Steel grade S355
Figure 73 Mechanical properties distribution for roller bent wide flange sections. Stresses in
N/mm2.
6.3.2.2 Yielding behavior in roller bent sections
When observing the stress-strain curves obtained from the small extensometer, it was found that
the roller bending process changes the yielding type at several locations in the cross-section. In
Figure 74 illustrative comparisons between the stress-strain curves in the flanges and web are
displayed for an HE 360B bent into a radius of 8000 mm with steel grades S235 and S355. The
distinctive sharp yielding behavior for carbon steels is replaced by a rounded stress-strain curve.
This phenomenon, however, is only observed in the flanges, whereas the coupons taken from the
web in roller bent sections largely display a yielding behavior similar to their straight
counterparts. Similar observations were made by Key et al. [58] for cold-formed hollow sections:
tensile coupons taken from the flat faces of the sections generally showed a yield plateau while
coupons taken from the cold-worked corner regions displayed gradual yielding behavior. In case
the yield plateau disappears and is replaced by a rounded stress-strain curve the material will
deviate from linear elastic behavior at the proportional limit (fp;r). The stress corresponding to the
proportional limit can be defined by the 0.01 % offset proof stress as suggested by Rasmussen
[104]. This deviation shows that a bi-linear material model as used for structural carbon steel is

76 Structural properties and out-of-plane stability of roller bent steel arches
not suitable to describe the stress-strain behavior of the flanges of roller bent wide flange
sections. It is noted that a rounded stress-strain curve as observed from the curved coupons taken
from the flanges of the HE 100A and HE 100B sections may be influenced to a certain degree by
the gripping of these specimens in the tensile testing device at the beginning of the tensile test
(section 6.2.2). These coupons are therefore not used for the determination of the proportional
limit in roller bent sections.
0
100
200
300
400
500
600
0 0.005 0.01 0.015 0.02
Str
ess
[N/m
m2]
Strain [-]
Roller bent steel
Straight steel
0
100
200
300
400
500
600
0 0.005 0.01 0.015 0.02
Str
ess
[N/m
m2]
Strain [-]
Roller bent steel
Straight steel
0
100
200
300
400
500
600
0 0.005 0.01 0.015 0.02
Str
ess
[N/m
m2]
Strain [-]
Roller bent steel
Straight steel
(a) HE 360B steel grade S235 with R=8000mm
0
100
200
300
400
500
600
0 0.005 0.01 0.015 0.02
Str
ess
[N/m
m2]
Strain [-]
Roller bent steel
Straight steel
0
100
200
300
400
500
600
0 0.005 0.01 0.015 0.02
Str
ess
[N/m
m2]
Strain [-]
Straight steel
Roller bent steel
0
100
200
300
400
500
600
0 0.005 0.01 0.015 0.02
Str
ess
[N/m
m2]
Strain [-]
Roller bent steel
Straight steel
(b) HE 360B steel grade S355 with R=8000mm
Figure 74 Stress-strain curves of coupons taken from the flanges and web measured with the
small extensometer.
A full overview of the proportional limit distribution in the flanges is shown in Figure 75 for the
roller bent HE 360B and IPE 360 sections. It can be seen that the proportional limit and the ratio
between the proportional limit and yield stress is considerably lower in the bottom flange when
compared to the top flange.

Mechanical properties of roller bent sections – Experimental investigation 77
0
200
400
600
800
0
200
400
600
800
Top
Flange
Bottom
Flange
fp;r
0
0.2
0.4
0.6
0.8
1
0
0.2
0.4
0.6
0.8
1
Top
Flange
Bottom
Flange
fp;r/fy;r
Steel grade S235 Steel grade S355
Figure 75 Proportional limit distribution for roller bent wide flange steel sections (left) and non-
dimensionalized with respect to the yield stress (right). Stresses in N/mm2.
6.3.3 Alteration of mechanical properties
The influence of the roller bending process on the mechanical properties is obtained by
subtracting the stress and strain values of coupons taken of the straight reference sections from
the values of the corresponding roller bent coupons. The influence of cold working can thus be
assessed over the cross-section. A representation of the change of mechanical properties over the
cross-sectional area is shown in Figure 76.
In this figure it can clearly be seen that the top flange shows an increase in both the yield stress
and ultimate tensile stress. A reduction in yield stress is observed in the bottom flange, with the
exception of the area close to the web-to-flange junction. Tensile coupons from the center of the
web have approximately the same stress-strain curve compared to their straight counterparts. The
change in yield stress is larger when compared to the change in ultimate tensile stress. The strain
at ultimate tensile stress decreases significantly over the cross-section. The largest reduction is
observed at the web-to-flange junction of the bottom flange, where a maximum strain reduction
of 0.15 is observed. Similar trends are found for the strain at fracture with reductions of up to
0.20. It can be seen that the strain at fracture is more influenced by the roller bending process
compared to the strain at ultimate tensile stress.

78 Structural properties and out-of-plane stability of roller bent steel arches
-200 -100 0 100 200
-200
-100
0
100
200
-200
-100
0
100
200
Top
Flange
Bottom
Flange
-200 -100 0 100 200
-200
-100
0
100
200
-200
-100
0
100
200
Top
Flange
Bottom
Flange
fy;r - fy;s ft;r - ft;s
-0.2 -0.1 0 0.1 0.2
-0.2
-0.1
0
0.1
0.2
-0.2
-0.1
0
0.1
0.2
Top
Flange
Bottom
Flange
εt;r - εt;s
-0.2 -0.1 0 0.1 0.2
-0.2
-0.1
0
0.1
0.2
-0.2
-0.1
0
0.1
0.2
Top
Flange
Bottom
Flange
εu;r - εu;s
Steel grade S235 Steel grade S355
Figure 76 Change in mechanical properties. Stresses in N/mm2.
6.3.4 Compression tests
Due to the nature of cold work and its associated Bauschinger effect, it is likely that the
mechanical properties will vary with the direction of loading (i.e. tension or compression).
Therefore, compression tests were performed on a single roller bent HE 100A section of steel
grade S235 with a radius of 1910 mm to investigate the influence of loading direction on the
mechanical properties. Compression coupons were removed from roller bent sections with the
Electrical Discharging Machining (EDM) technique. The compression coupons were taken from
similar locations as for the tensile specimens (Figure 68(a)). The use of the EDM technique was
preferred over milling in order to obtain perfectly flat ends of the coupons, thereby ensuring
proper load transfer during the compression test. Teflon paper was not applied between the
loading plate and compression coupon.
T
(b) Cross-section A-A
A
A
(a) Front view
Loading plate
Compression
coupon
Support JigBolt holes
Teflon paper
Compression coupon
Electrical strain gauge
p
q r
4-5 mm
(c) Compression coupon
Isometric view
L
B
T
Figure 77 Compression test set-up.
Mechanical properties of roller bent sections – Experimental investigation 79
The compression coupons taken from the flanges were significantly smaller compared to their
tensile counterparts. It could thus be assumed that curvature effects would be negligible. Since
compression tests are sensitive to buckling about their minor axis, the compression coupons were
provided with a lateral support system or support jig. The coupons were approximately 4-5 mm
longer than the support jig in order to ensure proper loading of the specimens, see Figure 77 (a).
Two different support jigs were used for the flange coupons and web coupons, since the flange
coupons had different dimensions compared to the web coupons. Each jig consists of two solid
steel blocks with four bolt holes. The dimensions for the large block are: q=64 mm, p=52mm,
and r=35 mm and for the small block: q=54mm; p=30 mm and r=35 mm.The compression
specimens were too small to be equipped with an extensometer. Hence, two electrical strain
gauges were attached on the exposed sides of the coupon (Figure 77 (b)). Strain readings from
both gauges were averaged to give engineering strains. Possible friction influence between the
compression coupons and the support jig was suppressed by teflon paper. The compression
coupon was clamped between both blocks of the support jig by four bolts. The test set-up for the
compression tests is identical to the set-up as used and published by Rasmussen et al. [105].
The dimensions of the compression coupons are given in Figure 77(c): L = the specimen length;
B = the specimen width; and T = the specimen thickness. The specimen thickness T complies
with the flange thickness or web thickness, depending on the location of the coupon. For the
coupons taken from the flanges, the following dimensions were used: L=56 mm, B=22mm. For
the coupons taken from the web, the dimensions were different: L=35 mm and B=14 mm. All
dimensions were based on Technical Memorandum B.2: Notes on compression testing of metals,
Ziemian [149].
A major drawback in compression testing lies in the fact that the ultimate compression stress
cannot be obtained due to the absence of a necking phenomenon, Gardner and Nethercot [42].
The specimens were loaded up to approximately 2 % strain. Therefore only the yield stress could
be obtained which will be used for comparison with the tensile test data.
The test procedure was similar to the tensile tests; suppressing the strain rate effect by pausing
the test three times near the 0.2 % offset proof stress. Typical stress-strain curves for the material
in both tension and compression up to 2% strain are shown Figure 78. The differences between
tensile and compression tests in 0.2 % offset proof stress are tabulated in Table 12. It can be seen
that for the top flange, the compression values are smaller (up to 9.58 %) compared to the tensile
test data. The yield stress in the compression flange is higher compared to the data obtained from
tensile tests (up to 32.75 %). The direction of loading influences the yield stress values,
indicating the presence of the Bauschinger effect.
It is suggested that the experimental values obtained from tensile tests provide a safe
approximation of the yield stress in the bottom flange. Combined with the fact that values for
ultimate stress and ultimate strain cannot be obtained from the compression tests, the results from
tensile tests will be used in a further development towards adjusted stress-strain curves for roller
bent wide flange steel sections.
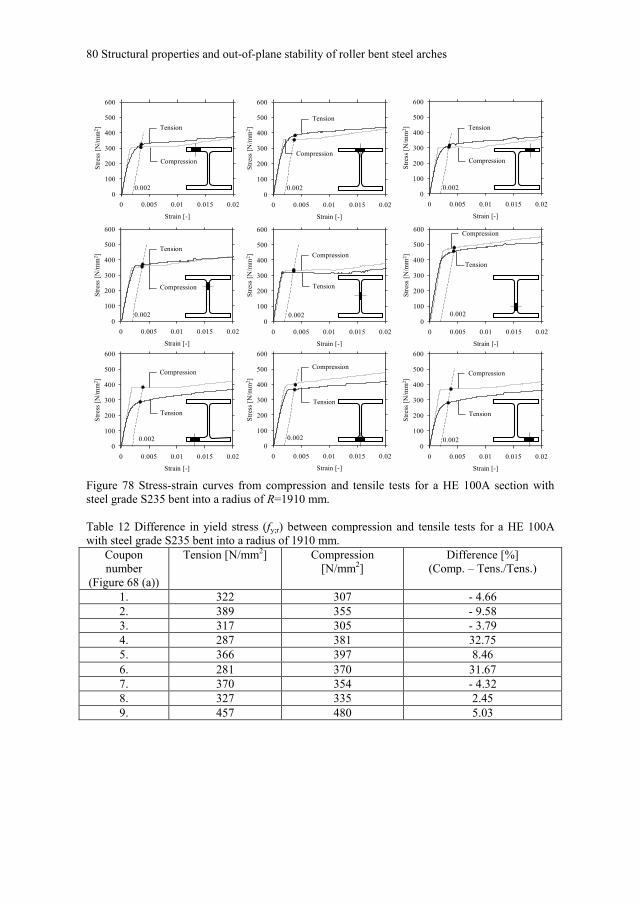
80 Structural properties and out-of-plane stability of roller bent steel arches
0
100
200
300
400
500
600
0 0.005 0.01 0.015 0.02
Str
ess
[N/m
m2]
Strain [-]
0
100
200
300
400
500
600
0 0.005 0.01 0.015 0.02
Str
ess
[N/m
m2]
Strain [-]
0
100
200
300
400
500
600
0 0.005 0.01 0.015 0.02
Str
ess
[N/m
m2]
Strain [-]
0
100
200
300
400
500
600
0 0.005 0.01 0.015 0.02
Str
ess
[N/m
m2]
Strain [-]
Compression
Tension
0.0020
100
200
300
400
500
600
0 0.005 0.01 0.015 0.02
Str
ess
[N/m
m2]
Strain [-]
Compression
Tension
0.0020
100
200
300
400
500
600
0 0.005 0.01 0.015 0.02
Str
ess
[N/m
m2]
Strain [-]
Compression
Tension
0.002
0
100
200
300
400
500
600
0 0.005 0.01 0.015 0.02
Str
ess
[N/m
m2]
Strain [-]
Tension
Compression
0
100
200
300
400
500
600
0 0.005 0.01 0.015 0.02
Str
ess
[N/m
m2]
Strain [-]
Tension
Compression
0.002
0
100
200
300
400
500
600
0 0.005 0.01 0.015 0.02
Str
ess
[N/m
m2]
Strain [-]
Tension
Compression
0.002
Compression
Tension
0.002
Tension
Compression
0.002
Tension
Compression
0.002
0.002
Figure 78 Stress-strain curves from compression and tensile tests for a HE 100A section with
steel grade S235 bent into a radius of R=1910 mm.
Table 12 Difference in yield stress (fy;r) between compression and tensile tests for a HE 100A
with steel grade S235 bent into a radius of 1910 mm.
Coupon
number
(Figure 68 (a))
Tension [N/mm2] Compression
[N/mm2]
Difference [%]
(Comp. – Tens./Tens.)
1. 322 307 - 4.66
2. 389 355 - 9.58
3. 317 305 - 3.79
4. 287 381 32.75
5. 366 397 8.46
6. 281 370 31.67
7. 370 354 - 4.32
8. 327 335 2.45
9. 457 480 5.03

Mechanical properties of roller bent sections – Experimental investigation 81
6.4 Discussion
6.4.1 Change in mechanical properties
Observations on the influence of the roller bending process on the mechanical properties of the
studied wide flange steel sections are presented separately for the flanges and the webs. They
include the changes in the mechanical properties displayed in Figure 76, in addition to the
proportional limit values presented in Figure 75.
6.4.1.1 Top flange
Coupons taken from the top flange of the roller bent specimens show considerable increase in
both yield stress and ultimate tensile stress and a decrease in strain at ultimate tensile stress and
strain at fracture when compared to coupons taken from their straight counterparts. The effect of
the roller bending process is more pronounced near the web-to-flange junction than at other areas
of the top flange. A change in yielding type is observed over the entire top flange of the HE 360B
and IPE 360 sections.
6.4.1.2 Bottom flange
The experimental results for the bottom flange show that the material located on either side of the
web is featured by a decrease in yield stress due to roller bending. Coupons taken from the web-
to-flange junction of the roller bent specimens show an increase in both yield stress and ultimate
tensile stress when compared to coupons taken from their straight counterparts. The reduction in
strain at ultimate tensile stress and strain at fracture is most pronounced in the center area of the
bottom flange. The well-known sharp yielding behavior as observed in the straight coupons is
replaced by a gradual yielding characteristic after roller bending.
6.4.1.3 Web
Material located in the vicinity of the neutral axis shows a smaller increase in both yield stress
and ultimate tensile stress compared to other locations in the web. An overall reduction in strain
at ultimate tensile stress and strain at fracture is observed over the entire height of the web.
6.4.1.4 General observations
It can be seen that the roller bending process induces larger alterations in yield stress than in
ultimate tensile stress. The changes in yield stress are characterized by larger scatter than the
changes in ultimate tensile stress. The reduction in strain at ultimate tensile stress and strain at
fracture shows considerable scatter. The proportional limit in the bottom flange of the medium
size roller bent wide flange sections is lower than the values obtained from the top flange. From
Figure 76 it can be seen that the size of the section does not influence the alteration of
mechanical properties.
6.4.2 Bending ratio
Earlier experimental studies have shown that the alteration of mechanical properties depends to a
large extent on the imposed plastic strains i.e. on the amount of cold work exerted on the member
during roller bending, Chajes et al. [21]. The change in yield stress and change in strain at
ultimate tensile stress are most pronounced in the web-to-flange junctions. This is indicated in
Figure 79 and Figure 80 where the influence of the bending ratio on both changes is shown for
steel grades S235 and S355, respectively. It can be clearly seen for both steel grades that the
yield stress increases and the ductility decreases with decreasing bending ratio. It should be noted
that these observations are limited to the examined bending ratios: 12.5 ≤ R/h ≤ 39.79.

82 Structural properties and out-of-plane stability of roller bent steel arches
-200
-150
-100
-50
0
50
100
150
200
0 10 20 30 40
f y,r
-f y
,s[N
/mm
2]
R/h [-]
-0.2
-0.15
-0.1
-0.05
0
0.05
0.1
0.15
0.2
0 10 20 30 40
ε t,r
-ε t
,s[-
]
R/h [-]
top flange center ■ bottom flange center top flange center ■ bottom flange center
Figure 79 Influence of bending ratio on change in yield stress (left) and strain at ultimate tensile
stress (right) for steel grade S235.
-200
-150
-100
-50
0
50
100
150
200
0 10 20 30 40
f y,r
-f y
,s[N
/mm
2]
R/h [-]
-0.2
-0.15
-0.1
-0.05
0
0.05
0.1
0.15
0.2
0 10 20 30 40
ε t,r
-ε t
,s[-
]
R/h [-]
top flange center ■ bottom flange center top flange center ■ bottom flange center
Figure 80 Influence of bending ratio on change in yield stress (left) and strain at ultimate tensile
stress (right) for steel grade S355.
6.4.3 Steel grade
The increase in yield stress is in general the same for both steel grades in the top flange and
center of the bottom flange. However, the change in the yield stress in the bottom flange tips
varies with the steel grade. When comparing the data for steel grade S235 with steel grade S355
in Figure 76, it can be seen that coupons taken from roller bent wide flange steel sections with
steel grade S235 display a larger increase in ultimate tensile stress, but larger decreases in strain
at ultimate tensile stress and strain at fracture when compared to their S355 equivalents.
6.4.4 Comparison to engineering assumptions for cold bending
From a structural engineering point of view it can be expected that during roller bending,
material furthest away from the neutral axis will undergo the largest amount of plastic straining
and hence will be subjected to the largest alterations in mechanical properties. When the

Mechanical properties of roller bent sections – Experimental investigation 83
Bauschinger effect is ignored, it also can be expected that the change in mechanical properties
will be symmetric with respect to the major axis of bending. The current investigation shows that
both expectations are not supported by the experiments. Coupons taken from the flanges at the
web-to-flange junctions show larger effects of the roller bending process compared to other
coupons taken from the flanges. This indicates that the effect of cold work on the mechanical
properties is not related to the distance from the neutral axis. Material taken from the top flange
shows in general different stress-strain behavior compared to bottom flange material, rendering
the strength distribution asymmetric with respect to the major axis of bending.
6.5 Conclusions
This chapter has presented the first part of a study on the mechanical properties of roller bent
wide flange steel sections. Tensile tests were performed on 190 coupons taken from roller bent
wide flange sections and 128 coupons taken from straight reference sections. In addition 9
compression coupons removed from a curved section were tested to assess the Bauschinger
effect. Coupons were taken from different locations over the cross-section. The experimental
investigation comprised 4 different section types and 8 different bending ratios (i.e. ratio between
bending radius R and nominal section height h) for both steel grade S235 and steel grade S355.
The mechanical properties of the roller bent sections were compared to the mechanical properties
of their straight counterparts.
The most important findings can be summarized as follows:
1. The change in mechanical properties due to roller bending is not uniformly or linearly
distributed over the cross-section.
2. The top flange (subjected to plastic elongation in longitudinal direction during roller
bending) and the center of the bottom flange (subjected to plastic shortening in
longitudinal direction during roller bending) experience an increase in both yield stress
and ultimate tensile stress.
3. In general the bottom flange tips show a decrease in yield stress and ultimate tensile
stress.
4. The flanges experience an early departure from linear elastic behavior stressing the
importance of the proportional limit characterized by the 0.01 % offset proof stress.
5. The web material keeps a sharp yielding behavior.
6. The alterations in mechanical properties vary significantly with steel grade.
7. The influence of the roller bending process is strongly related to the bending ratio of
the arch; the alterations in mechanical properties are more pronounced for arches with
a smaller bending ratio than for arches with a larger bending ratio.
8. The size of the section does not influence the alterations of the mechanical properties.
Compression tests showed that the effects of the roller bending process depend on the direction
of testing. The compression tests give predominately larger yield stress values than their tensile
equivalents in the bottom flange. Compression tests give no information concerning the ultimate
tensile stress, strain at ultimate tensile stress and strain at fracture. Therefore experimental data
from the tensile tests will be used instead of compression test data in the development of
expressions to obtain the change in mechanical properties and to model a full stress-strain curve
for roller bent wide flange sections.


7 Mechanical properties of roller bent sections –
Prediction Model This chapter provides a series of simple equations that allow the structural engineer to predict
the mechanical properties across the section of roller bent wide flange steel members:
proportional limit, yield stress, ultimate tensile stress, strain at ultimate tensile stress and strain
at rupture. The equations are based on experimental results from tensile tests performed on
coupons taken from roller bent wide flange sections which are presented in the previous chapter.
The newly obtained mechanical properties yield seven different full stress-strain curves for nine
specific locations on the steel cross-section. The stress-strain models for the material of the
flanges are defined by non-linear curves. The stress-strain characteristics in the web allow the
material to be represented by bi-linear stress-strain curves. Comparison between predicted
adjustments in mechanical properties due to roller bending and measured properties gives good
agreement. Parts of this chapter have been published in Spoorenberg et al. [125].
7.1 Introduction
When structural steel is cold worked at ambient temperatures it undergoes significant changes in
structural properties. In most cases, the yield stress and ultimate tensile stress increase, but the
material loses a significant amount of its ductility. A frequently used manufacturing technique for
shaping wide flange sections into curved members is roller bending. This is a process by which a
straight section is bent into an arch by feeding it through a roller bending machine. The member
is loaded beyond its yield stress thereby inducing permanent deformations in the cross-section.
Since the material is cold-worked at ambient temperatures, the stress-strain curve of the straight
steel is altered in the process.
In the previous chapter the results of a large experimental study are presented. Tensile tests were
conducted on 190 coupons taken from roller bent wide flange sections. An additional 128
coupons were taken from straight reference sections to allow a comparison between the material
before and after roller bending by monitoring the influence of the roller bending process over the
cross-section. It was observed that roller bending has a significant effect on the stress-strain
behavior of the original material. This influence, however, is not uniform over the cross-section.
In particular, coupons taken from the web-to-flange junctions were considerably more affected
by roller bending than coupons taken from other locations. The flange tips of the bottom flange
(which is plastically compressed during roller bending) exhibited a reduction in both yield stress
and ultimate tensile stress, when loaded in tension. This is a clear indication of the Bauschinger
effect. The top flange (which is plastically elongated during roller bending) showed an overall
increase in yield stress and ultimate tensile stress. The sharp yield point in the stress-strain curve
of the straight material was altered to a rounded stress-strain curve for the flanges of the roller
bent wide flange sections. Furthermore, it was observed that the strains at fracture were reduced
over the entire cross-section. In general, it was found that the bending ratio (ratio between radius
R and nominal section height h) and the steel grade of the material had a major influence on the
changes in mechanical properties due to roller bending.
In this chapter a proposal is made for obtaining stress-strain curves at various locations on the
cross-section of a roller bent steel member. It comprises a series of equations which are based on
earlier presented tensile tests on curved and straight steel. The equations yield values for salient
strength parameters such as yield stress, ultimate tensile stress and proportional limit in addition
to the strain at ultimate tensile stress and at fracture. This allows the composition of stress-strain

86 Structural properties and out-of-plane stability of roller bent steel arches
curves that include the effects of roller bending. The newly obtained stress-strain curves can be
used as the initial state in numerical modeling of roller bent steel for the design of arches.
7.1.1 Stress-strain models
Structural steel design codes and finite element procedures are based on materials‟ response to
loading. In most cases only the yield stress (fy) is used. Although the yield stress is an important
parameter of material strength, additional information concerning the stress-strain curve is
usually necessary to capture the full material behavior.
Based on numerous tensile tests, the stress-strain behavior of most structural carbon steels can be
represented by a bi-linear (elastic, perfectly plastic) curve, in conjunction with the nominal yield
stress. This material model consists of a linear stress-strain curve up to the yield stress, followed
by a yield plateau. The bi-linear model is generally accepted as the basis for computations in
design codes for structural carbon steels.
Some steel alloys show considerable deviation from linear elastic behavior at relatively low
stress levels. The material displays so-called gradual yielding and does not have a distinct yield
point. For gradual yielding alloys, such as stainless steel or aluminum, the 0.2 % offset proof
stress is usually adopted as the yield stress. The stress at which deviation from linear elastic
behavior starts is the proportional limit, in most the cases identified by a 0.01 % offset proof
stress. For gradual yielding structural alloys, a rounded stress-strain curve can be adopted to
model the material behavior. An expression for obtaining such curves has been suggested earlier
by Ramberg and Osgood [103]. Modifications to these curves were proposed by Hill [47]. The
„roundness‟ of the stress-strain curve is determined by the proportional limit and yield stress and
differs considerably between structural steels, but this can be accounted for by the Ramberg-
Osgood expression. An illustrative comparison between a bi-linear material law and a rounded
stress-strain curve with an identical 0.2 % offset proof stress is presented in Figure 81.
0
100
200
300
400
500
600
0 0.002 0.004 0.006 0.008
Str
ess
[N/m
m2]
Strain [-]
Gradual yielding steel
0.01 % offset proof stress
(proportional limit)
0.2 % offset proof stress
(yield stress)
0.0020.0001
Sharp yielding steel
Figure 81 Representative stress-strain curves for structural steels.
7.1.2 Earlier suggested alterations to stress curves for cold-formed steel sections
In this section a short overview is given of previous studies which were aimed at providing
equations to predict the yield stress and stress-strain curve for cold formed members at specific
zones in the cross-section.

Mechanical properties of roller bent sections – Prediction model 87
The earliest expression to obtain the enhanced yield stress in cold-formed carbon steel members
was suggested by Karren [54]. A power formula to obtain the increased yield stress based on the
yield stress of the material prior to cold forming was proposed.
The effect of the manufacturing process on cold-rolled tubular sections was investigated by
Kurobane et al. [64], who provided an expression for the increased yield stress in the member.
The Ramberg-Osgood model was suggested to model the stress-strain curve with the increased
yield stress. As part of an investigation into the behavior of cold-formed square hollows sections,
a modified yield stress distribution was adopted by Key and Hancock [57]. The corners were
modeled by the Ramberg-Osgood model and a bi-linear material model was utilized in the
section faces; see Figure 82 (a).
A similar strength distribution across cold-formed steel channel sections was proposed by Abdel-
Rahman and Sivakumaran [1] for mild steel. They adapted the equations suggested by Karren.
The channel section was divided into two different zones: corner zones and flat zones (Figure 82
(b)). Two multi-linear stress-strain relationships including gradual yielding behavior were
adopted and each zone was assigned its appropriate mechanical properties.
r
½πr
½πr
Corner zone
Cen
ter
lin
e
Flat zone
(b) Abdel-Rahman and Sivakumaran
Cold rolled zone
(c) Cruise and Gardner
Flat zone t
r
2t
2t
(a) Key and Hancock
Corner regionSection face
r2
Square Hollows Section Channel section Cold-rolled box
r2
Figure 82 Illustrative strength distributions.
Gardner and Nethercot [42] suggested a simplified equation to determine the yield stress in the
corner regions of roll-formed stainless steel hollow sections. The yield stress in the corners may
be taken as 85 % of the ultimate tensile stress of the straight material. The distance beyond the
curved corner portions to which the enhanced corner properties apply is equal to 2t, where t is the
material thickness, as proposed by Gardner and Nethercot [43].
Ashraf et al. [8] proposed a formula for the altered yield stress and ultimate tensile stress in roll-
formed and press-braked stainless steel sections. In a publication on the finite element modeling
of cold-formed stainless steel sections, Ashraf et al. [9] suggested to use the Ramberg-Osgood
expression in conjunction with the altered yield stress to model the stress-strain curve in the cold-
worked corners. In addition it was suggested that the corner enhancements be extended up to t
and 2t beyond the curved corner portions for press-braked and roll-formed sections, respectively.
The above suggested method and extension to corner regions for the strength enhancements were
modified by Cruise and Gardner [27] for both press-braked angles and cold-rolled box sections
(Figure 82 (c)).
Steel sheeting is rolled into a coil for transport and later unrolled from the coil at the fabrication
plant, which introduces plastic deformations into the sheeting, prior to any manufacturing
operations. An equation for estimating residual stresses and the enhanced yield stress in cold-
formed steel members, explicitly taking into account the rolling and unrolling from a coil, was
presented by Moen et al. [75].

88 Structural properties and out-of-plane stability of roller bent steel arches
Rossi et al. [111] suggested a prediction formula for obtaining the enhanced proof stress in cold-
formed non-linear metallic sections, which was based on analytical procedures, rather than curve-
fitting techniques.
From the studies on strength distributions in cold formed sections it becomes clear that the
investigations are limited to thin-walled sections, which are only cold-worked at certain zones.
To the knowledge of the author, procedures for estimating the stress-strain behavior in roller bent
wide flange sections are not available.
7.2 Prediction formulae for mechanical properties
In this section a proposal for a method to predict mechanical properties in roller bent wide flange
steel sections is presented. The procedure allows mechanical properties at various locations over
the cross-section to be obtained. The equations are derived from curve-fitting analyses of
experimental data. The newly obtained mechanical properties are combined to determine
individual stress-strain curves for specific zones in the cross-section of a roller bent wide flange
steel section.
7.2.1 Strength distribution
It was found in the previous chapter that changes in the mechanical properties and yielding
behavior due to roller bending are non-uniform over the cross-section but similar for all
investigated sections. This necessitates different zones of the cross-section to be considered
separately. The cross-section therefore was subdivided into nine zones. Because of symmetry in
the experimental results with respect to the minor axis, this could be reduced to seven different
zones, denoted by roman numbers (Figure 83).
h1/3
h1/3
h1/3
h1
b
b/3 b/3 b/3
Zonal division of cross-section
I III
III IIIIV
V
VI
VII
h
Figure 83 Cross-section.
Additionally, it was observed that the magnitude of alterations to the mechanical properties due
to the roller bending process was strongest influenced by the steel grade and the bending ratio.
The procedure to arrive at equations for all mechanical properties will be as follows. First, an
expression will be derived for the yield stresses in the seven different zones in the cross-section
of the roller bent wide flange steel section. Subsequently, the remaining mechanical properties
will be derived based on the yield stress in each specific zone of the roller bent section.
7.2.2 Yield stress and ultimate tensile stress in roller bent sections
Following the prediction formulae as proposed by Ashraf et al. [8], the yield stress of the straight
material (fy;s) and the bending ratio (R/h, where R is the radius and h is the nominal height of the

Mechanical properties of roller bent sections – Prediction model 89
section) will be utilized in the current study to obtain a closed-form equation to predict the yield
stress in roller bent wide flange steel sections. The influence of the original mechanical
properties on the yield stress and ultimate tensile stress of the roller bent sections is indirectly
reflected by comparing the ratio between the ultimate tensile stresses of roller bent sections and
straight reference sections (ft;r/ft;s) to the ratio between the yield stresses of roller bent sections
and straight reference sections (fy;r/fy;s), as shown in Figure 84. It shows that a large increase in
yield stress is accompanied by a smaller increase in ultimate tensile stress, as the tangent of the
gradient is smaller than 1.0 for both steel grades. The relationship between the increase in
ultimate tensile stress and increase in yield stress can be approximated using a non-linear
regression technique. The trend lines were constrained through a unity point at (1.0, 1.0),
implying that no change in ultimate tensile stress is present when no change in yield stress is
found and vice versa. The trend lines can be expressed as follows:
For steel grade S235:
y;rt;r
t;s y;s
0.441 +0.559ff
=f f
(25)
For steel grade S355:
y;rt;r
t;s y;s
=0.114 +0.886ff
f f (26)
A similar experimental trend was found by Karren [54] for cold formed carbon steel sections.
Cruise and Gardner [27] presented a similar expression for cold-formed stainless steel sections.
0
0.5
1
1.5
0.5 1 1.5 2
f t;r/ f
t;s[-
]
fy;r/ fy;s [-]
0
0.5
1
1.5
0.5 1 1.5 2
f t;r/ f
t;s[-
]
fy;r/ fy;s [-]
S235 S355
Figure 84 Ultimate tensile stress ratio (ft;r/ft;s) versus yield stress ratio (fy;r/fy;s).
7.2.3 Change in yield stress and ultimate tensile stress per zone
As a measure of cold work applied during the roller bending process, a parameter (ft;r/fy;r)/(ft;s/fy;s)
is introduced. For each coupon taken from the roller bent sections in conjunction with their
straight counterparts, this parameter can be determined and assigned to a specific zone (Figure
83). The diagrams in Figure 85 show the cold work parameter as a function of the applied
bending ratio. Employing a non-linear regression analysis yields the following relationship:
t;r y;r
t;s y;s
1f f C
R hf f (27)
Figure 84 shows that when the yield stress in roller bent wide flange section increases, it
approaches the ultimate tensile stress, rendering a change in ft;r /fy;r compared to its original state

90 Structural properties and out-of-plane stability of roller bent steel arches
(ft;s/fy;s). For an increase in yield stress and ultimate tensile stress the ratio ft;r/fy;r becomes smaller
than the ratio for the straight reference section: ft;s/fy;s. Hence an increase in yield stress and
ultimate tensile stress yields a cold working parameter (ft;r/fy;r)/(ft;s/fy;s)< 1.0. A decrease in yield
stress and ultimate tensile stress, will increase the ratio ft;r/fy;r compared to the ratio of the
reference material, which can be expressed by an increase of the cold work parameter. A similar
relationship between the bending ratio and this cold working parameter was published by Cruise
and Gardner [27] as part of their prediction model to obtain the enhanced yield stress in cold-
formed stainless steel sections.
Table 13 Values for C for different locations
Zone number Description C-value
Steel grade
S235 S355
I Top flange tips 0.912 2.75
II Top flange center 2.98 4.01
III Bottom flange tips -1.18 -4.74
IV Bottom flange center 2.23 4.34
V Top web 1.02 1.52
VI Center web 0 0
VII Bottom web 1.93 0.619
The values of C are calibrated on the experimental data presented in Figure 85. The parameter C
varies per zone and per steel grade (Table 13), reflecting the relative change of the yield stress
and ultimate tensile stress in roller bent wide flange sections. An increase in (ft;r/fy;r)/(ft;s/fy;s) with
increasing bending ratio R/h is represented by a positive value of C. A negative value of C
indicates a decrease in (ft;r/fy;r)/(ft;s/fy;s) with increasing bending ratio. A value for C of zero
implies no change in (ft;r/fy;r)/(ft;s/fy;s) for a change in bending ratio. The magnitude of the absolute
value of C reflects the sensitivity of the change in yield stress and ultimate tensile stress with
respect to the degree of roller bending.
It can be seen that the cold working parameter (ft;r/fy;r)/(ft;s/fy;s) in equation (27) moves
asymptotically towards 1.0 when the bending ratio increases, indicating a diminishing influence
of the roller bending process on the change in mechanical properties. This agrees with
expectations: a large bending ratio will induce only small changes in mechanical properties.
0
0.5
1
1.5
2
0 10 20 30 40
f t;r/f
y;r/f
t;s/
f y;s
[-]
R/h [-]
I
0
0.5
1
1.5
2
0 10 20 30 40
f t;r/f
y;r/f
t;s/
f y;s
[-]
R/h [-]
II

Mechanical properties of roller bent sections – Prediction model 91
0
0.5
1
1.5
2
0 10 20 30 40
f t;r/f
y;r/f
t;s/
f y;s
[-]
R/h [-]
III
0
0.5
1
1.5
2
0 10 20 30 40
f t;r/f
y;r/f
t;s/
f y;s
[-]
R/h [-]
IV
0
0.5
1
1.5
2
0 10 20 30 40
f t;r/f
y;r/f
t;s/
f y;s
[-]
R/h [-]
V
0
0.5
1
1.5
2
0 10 20 30 40
f t;r/f
y;r/f
t;s/
f y;s
[-]
R/h [-]
VI
0
0.5
1
1.5
2
0 10 20 30 40
f t;r/f
y;r/f
t;s/
f y;s
[-]
R/h [-]
VII
Steel grade S235 Steel grade S355
Figure 85 Cold working parameter versus bending ratio for all zones in the cross-section.

92 Structural properties and out-of-plane stability of roller bent steel arches
7.2.4 Altered mechanical properties
7.2.4.1 Yield stress
The relationship between the yield stress ratio of straight and roller bent sections, and the
analogous ultimate tensile stress ratio is given by equations (25) and (26) for steel grade S235
and steel grade S355 respectively. Equation (27) shows the influence on the change in
mechanical properties as function of the bending ratio and the location on the cross-section.
Combining these equations yields an expression to obtain the yield stress in the different zones of
the cross-section as a function of the yield stress of the straight material and the bending ratio.
For steel grade S235:
y;s
y;r
0.559
0.559 /
ff
C R h
(28)
For steel grade S355:
y;s
y;r
0.886
0.886 /
ff
C R h
(29)
7.2.4.2 Proportional limit
In the previous chapter it was observed that the sharp yield point is replaced by rounded stress-
strain behavior in the flanges due to roller bending. Therefore the proportional limit (fp;r) is
introduced to capture this rounded stress-strain behavior. The proportional limit will be related to
the yield stress in roller bent sections. The proportional limits as defined by the 0.01 % offset
proof stress were only obtained from coupons in the flanges of the roller bent HE 360B and IPE
360 sections. It was expected that the proportional limit for coupons taken from the flanges of the
roller bent HE 100A and HE 100B sections would be too much influenced by the bending
moments exerted by the grips of the tensile testing apparatus on the curved coupons. These
coupons were therefore omitted in the study on the proportional limit. Non-dimensional
relationships between the proportional limit and yield stress are shown in Figure 86.
0
0.2
0.4
0.6
0.8
1
0.001 0.002 0.003
f p;r/f
y;r
[-]
fy;r/E [-]
0
0.2
0.4
0.6
0.8
1
0.001 0.002 0.003
f p;r/f
y;r
[-]
fy;r/E [-]
S235 S355
Figure 86 Stress ratio (fp;r/fy;r) vs. non-dimensional yield stress (fy;r/E).
It can be seen that for the roller bent specimens the proportional limit is almost linearly related to
the yield stress and a small change in yield stress introduces a large change in the proportional
limit. It is noted that the proportional limit cannot exceed the yield stress.

Mechanical properties of roller bent sections – Prediction model 93
The relationships between the proportional limit and the yield stress were approximated using
linear regression analyses which resulted in the following equations:
For steel grade S235:
p;r y;r y;r0.701 815 1.0f f f E (30)
For steel grade S355:
p;r y;r y;r0.468 519 1.0f f f E (31)
7.2.4.3 Ultimate tensile stress
One of the most consistent trends associated with structural steel is that the ultimate tensile stress
to yield stress ratio decreases with increasing yield stress. A similar relationship was observed by
Kurobane et al. [64] and Rasmussen [104] for cold-formed tubes and stainless steel members,
respectively. In Figure 87 the stress ratio fy/ft is shown as a function of the non-dimensional yield
stress fy/E for all tested coupons taken from straight and roller bent sections. Since Figure 87
covers coupons taken from straight and roller bent wide flange sections, the subscripts “s” or “r”
are omitted. It can be seen that the relationship between the stress ratio and the non-dimensional
yield stress (fy/E) is identical for coupons taken from roller bent wide flange sections and
coupons taken from their straight counterparts. The data points for steel grade S235 show a
different trend than for steel grade S355. A linear regression analysis based on the experimental
data yields the following equations for both steel grades.
For steel grade S235:
y t y0.347 234 1.0f f f E (32)
For steel grade S355:
y t y0.121 313 1.0f f f E (33)
The equations are only valid for a stress ratio of fy/ft ≤ 1.0, since the yield stress cannot exceed
the ultimate tensile stress. From equation (32) and equation (33) the ultimate tensile stress in a
roller bent wide flange steel section can be determined per zone, based on the yield stress (fy;r) for
that zone.
0
0.2
0.4
0.6
0.8
1
0.001 0.002 0.003
f y/f
t [-
]
fy/E [-]
Straight Roller bent
0
0.2
0.4
0.6
0.8
1
0.001 0.002 0.003
f y/f
t [-
]
fy/E [-]
Straight Roller bent
S235 S355
Figure 87 Stress ratio (fy/ft) vs. non-dimensional yield stress (fy/E).
7.2.4.4 Strain at ultimate tensile stress
Earlier experimental studies on cold formed steel by Abdel-Rahman and Sivakumaran [1] have
shown that the deformation capacity at ultimate tensile stress decreases after cold bending the
material. An increase in yield stress will induce a decrease in strain at ultimate tensile stress. A

94 Structural properties and out-of-plane stability of roller bent steel arches
similar relationship can be found when examining the experimental data of the current
investigation. In Figure 88 the strain at ultimate tensile stress is shown as a function of the non-
dimensional yield stress for all coupons. Using a linear regression analysis yields the following
expressions:
For steel grade S235:
t y0.404 160 f E (34)
For steel grade S355:
t y0.282 79.3 f E (35)
From these equations the strain at ultimate tensile stress εt;r for each zone in a roller bent section
can be determined from its corresponding yield stress fy;r.
0
0.1
0.2
0.3
0.4
0.5
0.001 0.002 0.003
ε t [-
]
fy/E [-]
Straight Roller bent
0
0.1
0.2
0.3
0.4
0.5
0.001 0.002 0.003
ε t [-
]
fy/E [-]
Straight Roller bent
S235 S355
Figure 88 Strain at ultimate tensile stress εt vs. non-dimensional yield stress (fy/E).
7.2.4.5 Strain at fracture
Similarly to the strain at ultimate tensile stress, the strain at fracture decreases as a result of cold
working the material. The strain at fracture is shown in Figure 89 as function of the non-
dimensional yield stress.
0
0.1
0.2
0.3
0.4
0.5
0.001 0.002 0.003
ε u [-
]
fy/E [-]
0
0.1
0.2
0.3
0.4
0.5
0.001 0.002 0.003
ε u [-
]
fy/E [-]
Straight Roller bent Straight Roller bent
S235 S355
Figure 89 Strain at fracture εu vs. non-dimensional yield stress (fy/E).

Mechanical properties of roller bent sections – Prediction model 95
It can be seen that the strain at fracture has a larger scatter when compared to the data points for
the strain at ultimate tensile stress. It is noted that the strain at fracture is always higher than the
strain at ultimate tensile stress. The following equations are obtained from a linear-regression
analysis:
For steel grade S235:
u y t0.612 208 f E (36)
For steel grade S355:
u y t0.409 70.7 f E (37)
From equations (36) and (37) the altered fracture strain can be determined per zone, based on the
yield stress of the roller bent sections (fy;r) for that zone.
7.3 Development of stress-strain curves for roller bent wide
flange sections
Based on the yield stress of the original material (fy;s) and the bending ratio (R/h), the modified
mechanical properties due to roller bending can easily be obtained for steel grades S235 and
S355 using the equations (28)-(37).In this section the mechanical properties for roller bent
sections will be used to construct a stress-strain curve, which is valid from the onset of straining
until the strain at ultimate tensile stress. Two types of stress-strain behavior are suggested: bi-
linear for the material in the web and non-linear for the flanges. The proposal for two different
types of stress-strain curves is analogous to the stress-strain model suggested by Key and
Hancock [57] who used a Ramberg-Osgood model for the material in the cold-worked corners
and a bi-linear relationship for the flat faces of cold-formed hollow sections. It should be noted
that the calculated strain at fracture does not form part of the stress-strain curve but serves as a
ductility parameter. This will be further discussed in section 7.4.
7.3.1 Stress-strain curves for the flange material
Based on observations of gradual yielding and hardening in the flanges, a full stress-strain curve
comprises two parts: the Ramberg-Osgood model up to the yield stress and a second part valid
for stress values between fy;r and ft;r, using a modified Ramberg-Osgood model. Combining both
parts yields a non-linear curve which has been used earlier by Mirambell and Real [74] and
Rasmussen [104] to define the full stress-strain behavior for stainless steel alloys. The transition
between the two parts is defined by the 0.2 % offset proof stress fy;r. The first part is given by an
expression suggested by Ramberg and Osgood [103] and Hill [47]:
y;r
y;r
= +0.002 for
n
fE f
(38)
where n is a hardening coefficient, defining the „roundness‟ of the stress-strain curve. When n
approaches infinity, equation (38) renders a bi-linear material law. The hardening coefficient n is
defined by the offset strain for the proportional limit, offset strain for the yield stress,
proportional limit fp;r and the yield stress fy;r. For the offset strain for the proportional limit and
the offset strain for the yield stress a value of 0.0001 and a value of 0.002 were adopted,
respectively. The hardening coefficient can be written as follows:
y;r p;r
ln 0.002 0.0001=
lnn
f f (39)
A more gradual transition from elastic to plastic behavior is represented by low values of n as
stated by Gardner and Ashraf [40]. The stress-strain curve coincides with the proportional limit
(fp;r) and the 0.2 % offset proof stress (fy;r), at the accompanying strains, ε0.01 and ε0.2 respectively,
where ε0.01=fp;r/E+ 0.0001 and ε0.2=fy;r/E+ 0.002 (Figure 90). Typical n-values obtained from the

96 Structural properties and out-of-plane stability of roller bent steel arches
authors‟ experimental data are between 3 and 60. Equation (38) gives a stress-strain curve based
on only three parameters (E, fp;r and fy;r) but is only valid up to the 0.2 % proof stress fy;r. Large
inaccuracies were observed by Mirambell and Real [74] and Rasmussen [104] when extending
equation (38) beyond fy;r. They suggested a second curve in addition to the Ramberg-Osgood
model for stresses larger than fy;r,:
y;r y;r y;r y;r y;r
t,r y;r
0.2 0.2 t;r y;r
=0.002+ + + 0.002 for
m
f f f f ff
E E E E f f
(40)
where E0.2 defines the modulus of elasticity at 0.2 % proof stress. This modulus of elasticity is
represented by the tangent of the stress-strain curve given by equation (38) and evaluated at fy;r:
0.2
y;r1 0.002
EE
n E f
(41)
It is mentioned that, although equation (40) can give a good approximation of the stress-strain
behavior between the yield stress and ultimate tensile stress, the tangent of the curve at ultimate
tensile stress is not equal to zero. This shortcoming renders a discrepancy between the second
curve and the experimental curves in the vicinity of the ultimate tensile stress. Since the material
is not stressed close to the ultimate tensile stress for most engineering problems this shortcoming
is considered acceptable.
0
100
200
300
400
500
600
0 0.005 0.01 0.015 0.02
Str
ess
[N/m
m2]
Strain [-]
0
100
200
300
400
500
600
0 0.05 0.1 0.15
Str
ess
[N/m
m2]
Strain [-]
0.002
(ε0.2, fy;r)
(ε0.2, fy;r)
(εt;r, ft;r)
(ε0.01, fp;r)
Ramberg -Osgood
model (first curve)
Second curve
1
E
1
E0.2
E0.21
0.0001
Ramberg -Osgood
model (first curve)
Second curve
Figure 90 Typical non-linear stress-strain curve for the flanges. Initial stress-strain curve (left)
and full stress-strain curve (right).
The exponent m describes the roundness of the second curve. When m is equal to 1.0, the second
curve reduces to a straight line, whereas for high values of m a larger degree of roundness
between fy;r and ft;r is obtained. Rasmussen [104] proposed an equation to obtain m, using
qualitative fitting techniques. He compared the second curve derived from experimental
mechanical properties to experimentally obtained tensile stress-strain curves. By varying the
parameter m and observing coherence between both curves, an expression was proposed to give a
value for m based on the ratio between the yield stress and the ultimate tensile stress. This
approach is repeated here. Figure 91 displays the factor m as a function of the yield stress over
the ultimate stress for the flange of the roller bent HE 360B and IPE 360 sections.

Mechanical properties of roller bent sections – Prediction model 97
Applying a linear regression analyses will then yield the following expressions for m.
For steel grade S235:
y;r t;r12.0 13.0m f f (42)
For steel grade S355.
y;r t;r11.8 11.4m f f (43)
When substituting the mechanical properties as derived in section 7.2 per zone into equations
(38)-(43) the non-linear stress strain curve in the zones of flanges can be determined for that
zone.
0
1
2
3
4
5
6
0 0.2 0.4 0.6 0.8 1
m[-
]
fy;r/ft;r [-]
S235
0
1
2
3
4
5
6
0 0.2 0.4 0.6 0.8 1
m[-
]
fy;r/ft;r [-]
S355
Figure 91 Values of m vs. fy;r/ft;r for coupons taken from the flanges of the HE 360B and IPE 360
section.
0
100
200
300
400
500
600
0 0.005 0.01 0.015 0.02
Str
ess
[N/m
m2]
Strain [-]
0
100
200
300
400
500
600
0 0.05 0.1 0.15
Str
ess
[N/m
m2]
Strain [-]
(εy;r, fy;r)
(εt;r, ft;r)
(εy;r, fy;r)
E
1
Linear elastic branch
Hardening branch
Linear elastic branch
Hardening branch
Figure 92 Typical non-linear stress-strain curve for the web. Initial stress-strain curve (left) and
full stress-strain curve (right).

98 Structural properties and out-of-plane stability of roller bent steel arches
7.3.2 Stress-strain curves for the web material
Bi-linear stress-strain relationships are suggested for the material in the web since changes in
yielding types and/or immediate strain hardening beyond the yield stress were not observed in the
experimental results. The bi-linear curve consists of two branches: a linear elastic branch up to
yield stress fy;r followed by a straight line up to ultimate tensile stress ft;r with matching strain
value εt;r (Figure 92). Equipping the bi-linear curve with the mechanical properties for each zone
in the web, as detailed in section 7.2, gives the stress-strain curve for that zone.
7.4 Discussion
7.4.1 Accuracy of altered mechanical properties
The accuracy of the suggested equations to predict the mechanical properties is determined by
comparing the experimental results with the predicted values. The measured yield stress of the
straight sections (fy;s) is substituted into the equations to obtain the predicted values.
0
200
400
600
800
0 200 400 600 800
f y;r
(mea
sure
d) [N
/mm
2]
fy;r (predicted) [N/mm2]
0
200
400
600
800
0 200 400 600 800
f t;r
(mea
sure
d) [N
/mm
2]
ft;r (predicted) [N/mm2]
- 10%
+ 10%
0
0.1
0.2
0.3
0.4
0 0.1 0.2 0.3 0.4
ε t;r
(mea
sure
d) [-
]
εt;r (predicted) [-]
0
0.1
0.2
0.3
0.4
0 0.1 0.2 0.3 0.4
ε u;r
(mea
sure
d) [-
]
εu;r (predicted) [-]
- 10%
+ 10%
- 10%
+ 10%
- 10%
+ 10%
- 20%
+ 20% - 20%
+ 20%
- 30%
+ 30%
+ 30%
- 30%
Steel grade S235 Steel grade S355
Figure 93 Comparison between experimental and predicted results for all sections.

Mechanical properties of roller bent sections – Prediction model 99
A full comparison between measured and predicted values for the yield stress, ultimate tensile
stress, strain at ultimate tensile stress and strain at fracture is presented in Figure 93. The
correlation between predicted and experimental values for the proportional limit and m-values in
the flanges in the HE 360B and IPE 360 series is shown in Figure 94.
0
100
200
300
400
0 100 200 300 400
f p;r
(mea
sure
d) [N
/mm
2]
fp;r (predicted) [N/mm2]
0
1
2
3
4
5
6
0 1 2 3 4 5 6m
(mea
sure
d) [-
]
m (predicted) [-]
+ 20%
- 20%- 20%
+ 20%
- 10%
+ 10%
- 10%
+ 10%
Steel grade S235 Steel grade S355
Figure 94 Comparison between experimental and predicted results for the flanges of the HE
360B and IPE 360 sections.
It can be seen that the yield stress and ultimate tensile stress can roughly be predicted with an
accuracy of approximately 20 % error. The strain values are predicted with a smaller accuracy, as
reflected by 30 % error. The proportional limit and m-value are predicted with larger errors. This
is due to the following. In the previous sections it became clear that a prediction of all
mechanical properties and m-values are dependent on the predicted value of the yield stress (fy;r).
Any difference between the predicted and measured yield stress of a roller bent wide flange
section may cause a larger difference for the other mechanical properties. It can be observed from
the slope of the suggested curves in Figure 87, Figure 88 and Figure 89 that a change in the yield
stress in roller bent wide flange steel sections (fy;r) will only cause a minor change in the ultimate
tensile stress, strain at ultimate tensile stress and strain at fracture, respectively. Hence, a slight
deviation between the measured and predicted yield stress values will result in a minor error in
these mechanical properties. However, the slopes of the curves in Figure 86 and Figure 91 for fp;r
and m indicate an increased sensitivity towards the variation in yield stress. A small error in the
predicted yield stress will therefore cause a larger error in the predicted values of the proportional
limit and m-value.
7.4.2 Accuracy of non-linear curves for flanges
The applicability of the non-linear curve is tested by using the measured yield stress of the
straight reference section fy;s and bending ratio R/h to obtain the mechanical properties of the
roller bent section as presented in section 7.2 and subsequently composing the pertaining stress-
strain curves as detailed in section 7.3 for comparison with experimental results. In Figure 95-
Figure 97 the non-linear stress-strain curves are shown for the flanges in roller bent wide flange
steel sections and compared to the tensile test data. In addition a tri-linear stress-strain curve is
plotted, based on the computed mechanical properties. The tri-linear curve is decribed by linear
stress-strain branches between the different stress values. Also a bi-linear stress-strain curve with
the measured yield stress and no strain hardening of the straight reference section is plotted.

100 Structural properties and out-of-plane stability of roller bent steel arches
0
100
200
300
400
500
600
0 0.005 0.01 0.015 0.02
Str
ess
[N/m
m2]
Strain [-]
0
100
200
300
400
500
600
0 0.05 0.1 0.15 0.2S
tres
s [N
/mm
2]
Strain [-]
fp;r (predicted)
fy;r (predicted)
fy;r (measured)
fp;r (measured)
ft;r, εt;r (predicted)
ft;r, εt;r (measured)
fy;r (predicted)
fy;s (measured)
fy;r (measured)fy;s (measured)
non-linear curve experiment tri-linear curve bi-linear curve (straight reference section)
Figure 95 Stress-strain curves for HE 360B, steel grade S235, R=8000 mm, top flange tips.
0
100
200
300
400
500
600
0 0.005 0.01 0.015 0.02
Str
ess
[N/m
m2]
Strain [-]
0
100
200
300
400
500
600
0 0.05 0.1 0.15 0.2
Str
ess
[N/m
m2]
Strain [-]
fp;r (predicted)
fy;r (predicted)
fy;r (measured)
fp;r (measured)
ft;r, εt;r (predicted)
ft;r, εt;r (measured)
fy;r (measured)
fy;r (predicted)
fy;s (measured)
fy;s (measured)
non-linear curve experiment tri-linear curve bi-linear curve (straight reference section)
Figure 96 Stress-strain curves for IPE 360, steel grade S355, R=8000 mm, bottom flange tips.
It can be seen that the non-linear curve gives a far better approximation of the stress-strain
behavior in roller bent wide flange steel sections when compared to the tri-linear curve. When
adopting the bi-linear curve in conjunction with the yield stress of the straight material, which
would be the case when no influence of the roller bending process is assumed, the stiffness is
overestimated in the late elastic stage of the stress-strain curve.

Mechanical properties of roller bent sections – Prediction model 101
0
100
200
300
400
500
600
0 0.005 0.01 0.015 0.02
Str
ess
[N/m
m2]
Strain [-]
0
100
200
300
400
500
600
0 0.05 0.1 0.15 0.2S
tres
s [N
/mm
2]
Strain [-]
fp;r (predicted)
fy;r (predicted)
fy;r (measured)
fp;r (measured)
ft;r, εt;r (predicted)
ft;r, εt;r (measured)
fy;r (predicted)
fy;r (measured)
fy;s (measured)fy;s (measured)
non-linear curve experiment tri-linear curve bi-linear curve (straight reference section)
Figure 97 Stress-strain curves for HE 360B, steel grade S355, R=8000 mm, bottom flange center.
7.4.3 Accuracy of bi-linear curves for web
The accuracy of the bi-linear curve as proposed for the web of roller bent wide flange sections is
examined by comparing it to experimentally obtained curves (Figure 98). In addition a bi-linear
curve without strain hardening and the measured yield stress of the straight material is also given.
0
100
200
300
400
500
600
0 0.005 0.01 0.015 0.02
Str
ess
[N/m
m2]
Strain [-]
0
100
200
300
400
500
600
0 0.05 0.1 0.15 0.2 0.25 0.3
Str
ess
[N/m
m2]
Strain [-]
fy;r (measured)
fy;r (predicted)
fy;s (measured) fy;s (measured)
fy;r (predicted)
fy;r (measured)
ft;r, εt;r (predicted)
ft;r, εt;r (measured)
bi-linear curve experiment bi-linear curve (straight reference section)
Figure 98 Stress-strain curves for IPE 360, steel grade S235, R=4500 mm, web top.

102 Structural properties and out-of-plane stability of roller bent steel arches
From Figure 98 it can be seen that the proposed bi-linear curve approximates the experimental
behavior quite well up to 1 % strain. For larger strains the bi-linear curve for the web
underestimates the experimental curve. Neglecting the influence of the roller bending process by
adopting the measured yield stress of the straight member in a bi-linear curve without strain
hardening is a conservative solution.
7.4.4 Use of nominal yield stress
In structural engineering, the nominal yield stress of straight wide flange sections according to
material specifications is usually adopted for strength computations. This is also the case when
determining the stress-strain curves in roller bent wide flange sections. The phenomenon that the
measured yield stress in straight wide flange sections usually exceeds nominal values is often not
taken into account. Adopting nominal stress values instead of measured values will yield lower
values for the proportional limit, yield stress en ultimate tensile stress in most of the zones of
roller bent wide flange sections. However, nonconservative values of the strain at ultimate tensile
stress and the strain at fracture will be obtained. These values will generally not be reached for
arches during elastic-plastic buckling. An example of the predicted mechanical properties and
stress-strain curves in a roller bent wide flange section by adopting the nominal yield stress is
presented in appendix A.
7.4.5 Bending limits due to ductility requirements
A minimum ductility is required in order to allow for sufficient deformations prior to structural
failure. This ductility demand is expressed by two criteria in two European steel standards: EN
1993-1-1 [35] and EN 10025 [34] (Table 14): the ultimate tensile stress must be larger than 1.1
times the yield stress and the strain at fracture must be larger than specified minimum values.
Tensile tests performed on a large number of coupons taken from roller bent sections showed a
strain at fracture which is considerably lower than the minimum requirement stated in EN 10025
[34] (see chapter 6). Figure 87 shows the experimentally obtained relationship between fy/ft and
the non-dimensional yield stress (fy/E) for steel grade S235 and steel grade S355. It can be
observed that a small number of coupons taken from roller bent sections with steel grade S355
have an ultimate tensile stress value which is smaller than 1.1 times the yield stress, i.e. fy/ft >
1/1.1, thereby compromising the ductility requirement. This deterioration of deformation
capacity in cold-formed members was also noticed by Kurobane et al. [64]. Combining equations
(36) and (28) for steel grade S235 and equations (37) and (29) for steel grade S355 yields
relationships between the strain at fracture and bending ratio for each specific zone in the steel
section. Using the minimum specified fracture strain according EN 10025 [34] presented in Table
14, gives the minimum allowable bending ratio for roller bent sections.
For steel grade S235:
y;s
u;r
0.559=0.612 - 208 0.26
0.559 - /
f
E C R h
(44)
For steel grade S355:
y;s
u;r
0.886=0.409 - 70.7 0.22
0.886 - /
f
E C R h
(45)
The relationship between the strain at fracture and bending ratio for the largest C-value and
nominal yield stress values is presented in Figure 99(a) for both steel grade S235 and steel grade
S355. The minimum specified fracture strain of 0.15 according EN 1993-1-1 [35] is shown in
Figure 99(a). It is less demanding compared to EN 10025. The intersection between the curves
for steel grade S235 and S355 based on the nominal yield stress and the ductility requirements
defines the minimum bending ratio as tabulated in Table 14.
A similar procedure to obtain the minimum bending ratio requirements is based on the ratio
between the ultimate tensile stress and yield stress. When combining equation (28) with (32), and

Mechanical properties of roller bent sections – Prediction model 103
equation (29) with (33) for steel grades S235 and S355 respectively, a minimum bending ratio is
found to ensure acceptable ratios between the ultimate tensile stress and yield stress in all zones
of the cross-section.
For steel grade S235:
t;r
y;r y;s
11.10
0.5590.347 234
0.559 - /
f
f f
E C R h
(46)
For steel grade S355:
t;r
y;r y;s
11.10
0.8860.121 313
0.886 - /
f
f f
E C R h
(47)
The relationship between ft;r/fy;r and the bending ratio is presented in Figure 99(b) for the largest
C-values.
0
0.1
0.2
0.3
0.4
0 10 20 30 40
ε u;r
[-]
R/h [-]
Ductility req. for
S235 EN 10025
S235, fy;s=235 N/mm2 with C=2.98
S355 fy;s=380
N/mm2 with C=4.34
Ductility req. for S355 EN 10025
0
0.5
1
1.5
2
0 10 20 30 40
f t;r/f
y;r
[-]
R/h [-]
1.10
Ductility req.
0.22
0.26
Limit
S235, fy;s=235 N/mm2 with C=2.98
S355, fy;s=355N/mm2
with C=4.34
Ductility req. EN 1993-1-1
(a) (b)
Figure 99. Fracture strain vs. bending ratio (a) and ultimate tensile stress to yield stress ratio vs.
bending ratio (b).
Table 14 Ductility requirements and minimum bending ratios
Ductility parameters Minimum ducility
requirement
Minimum allowable bending
ratio [R/h] [-]
Based on
S235 a) S355 a) S235 S355
Ratio ft;r/fy;r [-] 1.10 1.10 11.1 16.6 EN 1993-1-1
[35]
Strain at fracture
εu;r[-]
0.26 b) 0.22 b) 17.5 14.4 EN 10025 [34]
a) S235 and S355 are denoted as S235JRG2 and S355J2G3 in EN 10025 [34] b) EN 1993-1-1 [35] also gives minimum requirements for the elongation at fracture (0.15),
however, the most demanding values are stated in EN 10025 [34] and are therefore adopted in
the current study.

104 Structural properties and out-of-plane stability of roller bent steel arches
The corresponding minimum bending ratio for the largest C-values and nominal yield stress is
given in Table 14. It can be seen that the fracture strain is the governing bending ratio criterion
for steel grade S235 but the ultimate tensile stress to yield stress ratio is the decisive criterion for
steel grade S355. A minimum allowable bending ratio of 17.5 for steel grade S235 and 16.6 for
steel grade S355 is recommended from a ductility point of view.
It should be noted that the minimum allowable bending ratios presented in Table 14 are based on
the performance of the structural steel after roller bending, and are not based on local failure
during the bending process. Due to the large forces exerted by the rollers on the wide flange
sections, web buckling or steel fracturing due to overstraining may occur. This can limit the
bending ratio to an even greater extent than the ductility requirements. For more documentation
on the roller bending requirements in view of potential failure during roller bending see
Bjorhovde [17].
7.5 Conclusions
Based on the experimental results of tensile tests of the previous chapter, a series of equations
has been proposed that allows seven new stress-strain relationships to be obtained for nine
specific zones in the cross-section of roller bent wide flange steel arches. The equations give
values for mechanical properties of the steel section after roller bending: proportional limit, yield
stress at 0.2 % offset proof strain, ultimate tensile stress, strain at ultimate tensile stress and strain
at fracture.
The accuracy of the predicted mechanical properties was obtained by comparing the predicted
mechanical properties to test results. It was found that the yield stress and ultimate tensile stress
in roller bent sections can be determined within 20 % error. For the strain at ultimate tensile
stress and strain at fracture, the proposed equations provide results within approximately 30 %
error.
The stress-strain behavior of the web material can be modeled by a bi-linear elastic perfectly
plastic relationship. The steel in the flanges is characterized by a non-linear (modified) Ramberg-
Osgood relationship. The proportional limit and hardening exponent required for the modified
Ramberg-Osgood curve could be estimated with errors around 40 %.
The expressions for the strength parameters were combined to obtain the minimum allowable
bending ratio‟s for roller bent wide flange sections to maintain sufficient ductility according to
the criteria of the European standards EN 10025 [34] and EN 1993-1-1 [35].
The newly obtained stress-strain relationships for the various zones in the cross-section can be
used in non-linear finite element analyses of arches where the initial state of stress is defined by
the earlier published residual stress distribution (chapter 5) for roller bent wide flange steel
sections.

8 Finite element modeling of roller bent arches In this chapter the elastic-plastic buckling load of freestanding arches is investigated by means of
finite element analyses. The finite element model was validated against earlier performed
experiments on freestanding circular arches. The influence of key-parameters on the out-of-
plane elastic-plastic buckling response is presented. Several residual stress models are
implemented in the finite element model to assess their influence on the structural response of
freestanding arches. Similar sensitivity analyses were performed by varying the geometric
imperfections and material models. The results have been plotted in conventional load-deflection
graphs in addition to column curves.
8.1 Introduction
In this chapter a description of a finite element model to capture the out-of-plane buckling
response of freestanding roller bent arches is given. The influence of certain changes in input
parameters (such as residual stresses, geometric imperfections) on the out-of-plane structural
stability response of arches is investigated. Since it is not feasible to investigate the parameter
change on the structural response by means of experimental techniques, a more practical
approach is to obtain the influence of selected parameters through finite element analyses. The
different types of finite element analysis used in the investigation to monitor the structural
response (8.2), the finite element model (8.3), the required analysis steps (8.4 + 8.5) and the
validation of the finite element model (8.6) are outlined first. The finite element model is
validated against experiments. The sensitivity analyses are presented in section 8.7. The chapter
closes with a final finite element model, representing a freestanding roller bent arch.
8.2 Finite Element Analysis Type
The finite element method offers different analysis types to obtain distinct response
characteristics of a single arch configuration. These analyses vary considerably in number of
required input parameters, computational resources and level of output. Firstly a short overview
will be given on the analysis types and their application to the current investigation.
8.2.1 Linear Elastic Analysis (LEA)
A linear elastic analysis is the simplest analysis available in the finite element environment and is
based on the 1st order elastic theory (see section 1.2.2) meaning that Hooke‟s law applies and
equilibrium is defined in the undeformed state of the structure. Hence, the deflections and loads
are linearly related, indicating that for example an increase of the acting forces by 2 will induce a
deformation increase of a factor 2. A LEA will give an indication of the force distribution in the
arch at the onset of loading (e.g. it can be observed whether the arch is dominated by
compressive action or flexure). Geometrical non-linear and material non-linear effects are
ignored. The LEA is often employed when confronted with rather simple engineering issues.
When the LEA is used in conjunction with the appropriate design standards it can serve as a
suitable basis for the verification of the structural safety.
8.2.2 Linear Buckling Analysis (LBA)
Following the linear elastic analysis, it is a simple matter to determine the elastic buckling load
computationally. A linear buckling analysis gives the elastic buckling load or elastic critical
resistance of an ideal arch (αcr) and the accompanying buckling mode or eigenvector. The Greek
letter alpha is used the express the elastic buckling load by a load multiplier (e.g. Fcr=αcr×F or
qcr=αcr×q, etc.), rendering the definition independent of the acting loads. The elastic buckling

106 Structural properties and out-of-plane stability of roller bent steel arches
load serves as a parameter to determine the slenderness of the arch. The buckling modes can be
employed in subsequent analyses to define the shape of geometric imperfections. The LBA is
based on 2nd order elastic theory (i.e. equilibrium is defined in the deformed state), in the limiting
case that imperfections are assumed to be infinitely small (see section 1.2.2). Unlike any other
analyses described in this section, the LBA only gives information about the buckling load and
mode shapes. No load-deflection graph can be constructed from an LBA.
8.2.3 Material Non-linear Analysis (MNA)
A material non-linear analysis takes into account the non-linear behavior of the material.
Geometrical non-linear effects are ignored and equilibrium is defined in the undeformed state of
the structure. This type of analysis can give a good estimate of the collapse load of stocky
structural members, failing by a plastic mechanism. In the field of elastic-plastic buckling a
MNA usually gives an overestimation of the failure load since detrimental geometrical non-linear
effects are ignored. This type of analysis serves as a reference analysis to determine the in-plane
plastic capacity of the arch, which in turn can be used to determine the slenderness of the arch.
The in-plane plastic capacity αpl is identified as a maximum load sustained by the arch when a
plastic mechanism occurs for a specific type of loading (e.g. Fpl=αpl×F, etc.). The plastic capacity
can be identified as a maximum in the load-deflection curve from a MNA. A MNA can be a
useful type of analysis when assessing the 1st order elastic-plastic response of a structure.
8.2.4 Geometrical Non-linear Imperfect Analysis (GNIA)
A GNIA is also known as a non-linear buckling analysis. Geometrical imperfections like the
lateral crookedness and twist have to be included in order to initiate buckling. Although a GNIA
is not of any use with respect to the carrying capacity of arches as material nonlinearities are
ignored, it serves as an excellent reference analysis to determine the onset of yielding when
presented alongside a Geometrical Material Non-linear Imperfect Analysis (GMNIA). For beam-
like structures, a GNIA can also give good insight to whether a successful buckling load has been
computed with a LBA, when not taking into account the effects of large deformations. A correct
result for the buckling load is found when the load-displacement curve from the GNIA
asymptotically approaches the elastic buckling load, see also section 1.2.2. However for the
present investigation, where the effects of large rotations/deformations are included, a GNIA is
not suitable to verify the computation of the elastic buckling load.
8.2.5 Geometrical Material Non-linear Imperfect Analysis (GMNIA)
A GMNIA is the most elaborate type of analysis. It incorporates geometrical non-linearities,
material non-linearties, geometric imperfections and residual stresses. A GMNIA analyses can be
regarded as a 2nd order elastic-plastic analyses (1.2.2). The sole difference between a GNIA and
GMNIA lies in the inclusion of a nonlinear material law and residual stresses, as where they are
omitted in case of a GNIA and incorporated when a GMNIA is performed. The load-deflection
curve from a GMNIA at relatively low load levels is identical to that of a GNIA, however, after
the onset of yielding it deviates from the GNIA load-deflection characteristic. A major challenge
in a GMNIA lies in the determination of a failure criterion. Although many criteria are available,
especially for thin-walled shell structures, the limit load is defined as the failure load in this
research study. The limit load can be identified as the load corresponding to a nearly horizontal
load-displacement characteristic, after which the arch becomes unstable (αult) see section 1.2.2
(e.g. Fult=αult×F, etc.). When no limit load is found, the bifurcation load from the LBA will be
adopted as the failure load. In general it can be stated that a GMNIA for a stocky arch will yield a
failure load close to the plastic collapse load from a MNA whereas for slender arches the
GMNIA will approach a failure load in the vicinity of the elastic buckling load from the LBA.
8.2.6 Overview
For each analysis type mentioned above, the geometrical properties, loading conditions and
boundary conditions are identical. Each analysis gives specific information about the structural
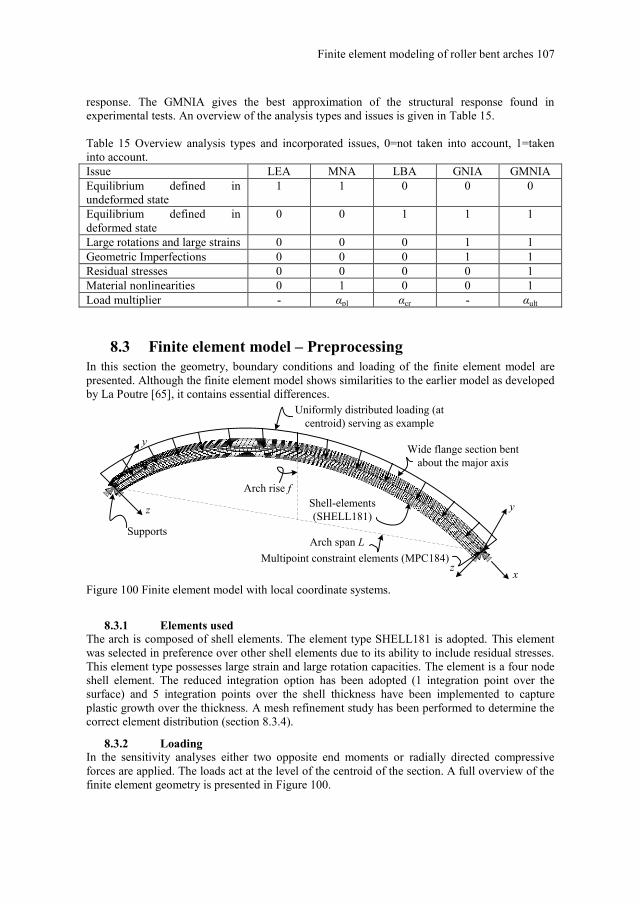
Finite element modeling of roller bent arches 107
response. The GMNIA gives the best approximation of the structural response found in
experimental tests. An overview of the analysis types and issues is given in Table 15.
Table 15 Overview analysis types and incorporated issues, 0=not taken into account, 1=taken
into account.
Issue LEA MNA LBA GNIA GMNIA
Equilibrium defined in
undeformed state
1 1 0 0 0
Equilibrium defined in
deformed state
0 0 1 1 1
Large rotations and large strains 0 0 0 1 1
Geometric Imperfections 0 0 0 1 1
Residual stresses 0 0 0 0 1
Material nonlinearities 0 1 0 0 1
Load multiplier - αpl αcr - αult
8.3 Finite element model – Preprocessing
In this section the geometry, boundary conditions and loading of the finite element model are
presented. Although the finite element model shows similarities to the earlier model as developed
by La Poutre [65], it contains essential differences.
Uniformly distributed loading (at
centroid) serving as example
Supports
Shell-elements
(SHELL181)
Arch span L
Wide flange section bent
about the major axis
Multipoint constraint elements (MPC184)
Arch rise f
y
x
z
xz
y
Figure 100 Finite element model with local coordinate systems.
8.3.1 Elements used
The arch is composed of shell elements. The element type SHELL181 is adopted. This element
was selected in preference over other shell elements due to its ability to include residual stresses.
This element type possesses large strain and large rotation capacities. The element is a four node
shell element. The reduced integration option has been adopted (1 integration point over the
surface) and 5 integration points over the shell thickness have been implemented to capture
plastic growth over the thickness. A mesh refinement study has been performed to determine the
correct element distribution (section 8.3.4).
8.3.2 Loading
In the sensitivity analyses either two opposite end moments or radially directed compressive
forces are applied. The loads act at the level of the centroid of the section. A full overview of the
finite element geometry is presented in Figure 100.

108 Structural properties and out-of-plane stability of roller bent steel arches
8.3.3 Boundary conditions
As mentioned in chapter 1, different boundary conditions can be adopted for an arch. Based on
the fact that the use of in-plane clamped boundary conditions yields a minor contribution to the
out-of-plane structural performance of an arch, the finite element models are equipped with in-
plane hinged conditions only. The out-of-plane boundary conditions may vary. A full overview
of the possible boundary conditions is presented in Table 16. In order to avoid excessively high
stress concentrations at the supports, multipoint constraint elements (MPC184) are used (Figure
101). These elements are used instead of Coupling Equations (CEs) as used by La Poutre [65],
since they allow large deformations. The CEs can only prescribe linear behavior. By defining a
boundary condition at the centroid, the multipoint constraint elements impose a correct transfer
of the displacements to the adjacent elements.
Arch
MPC184 elements
along flange width
MPC184 elements
over web height
(a) Restrained warping at support (b) No restrained warping at support
Arch
Support Support
Figure 101 Modeling of boundary conditions.
The number of MPC184 elements complies with the shell element distribution over the width of
the flanges and height of the web as applied in the arch. In order to correctly model the multi
point constraint, the rigid beam option has been selected. The kinematic constraints are imposed
with the direct elimination method. The Lagrange multiplier method can also be used to impose
the kinematic constraints. However, this method is not supported in a LBA. Restrained warping
at the support is enforced by applying MPC184 elements over the web height and flange widths
(Figure 101 (a)). Confining the use of MPC184 elements to the web height at the support allows
warping deformations to occur (i.e. no restrained warping at the support in Figure 101 (b)).
Table 16 Adopted boundary conditions.
No In-plane
boundary conditions
Out-of-plane
boundary conditions
Restrained warping
included
1 Hinged Hinged No
2 Hinged Fixed No
3 Hinged Hinged Yes
4 Hinged Fixed Yes
8.3.4 Mesh
The finite element mesh of the arch can be characterized by elements along the width of the
flanges, over the height of the web and along the developed length of the arch. A mesh
refinement study is performed to ascertain the correct conversion of the mathematical model to a
finite element discretization. The mesh refinement study is performed such that the finer mesh is
always part of the larger mesh. A HE 100A with a subtended angle of 90 º and arch length S of
3000 mm is subjected to a radially directed compressive load. The arch is in-plane pin-ended
supported and out-of-plane restrained against rotations and warping deformations. The arch is

Finite element modeling of roller bent arches 109
meshed with four different element distributions. For each mesh distribution the critical
compressive force at the support (Ncr) from a LBA is evaluated in addition to the ultimate force at
the support (Nult) from a GMNIA. For the GMNIA a bi-linear material model with fy=235 N/mm2
and geometric imperfection pattern according the lowest buckling mode with a maximum
amplitude of S/1000 has been implemented. The results of the mesh refinement analyses are
shown in Table 17 for the elastic buckling force and the ultimate force at the support. The
difference in elastic buckling load and ultimate load for a mesh and mesh no.4 are tabulated as
well.
Table 17 Mesh refinement.
Mesh no. No. of elements Elastic buckling load Ultimate load
Flanges/
Web
Arch
length
Total Ncr [N] Diff [%] Nult [N] Diff [%]
1 2 24 144 426808 - 15.28 317537 - 6.34
2 4 48 576 488955 - 2.94 335417 - 1.07
3 8 96 2304 501591 - 0.43 339160 + 0.03
4 16 192 9216 503772 - 339049 -
It can be seen that in general an increasing mesh density increases the elastic buckling force and
ultimate load. The little difference between mesh no. 3 and mesh no. 4 shows that the
discretization error has almost vanished. Mesh no. 3 will therefore be adopted for the subsequent
finite element analyses. It is remarkable to note that by increasing the number of elements the
elastic buckling load and ultimate load increase. Convergence studies are in most cases featured
by a decrease in elastic buckling load and ultimate load, as the element mesh is refined.
8.3.5 Non-geometric imperfections
Imperfections can be classified into three different types: non-uniform mechanical properties,
residual stresses and geometric imperfections. All three imperfection types are implemented for a
GMNIA. Only the geometric imperfections are included in the GNIA. The geometric
imperfections will be treated separately in the subsequent section.
8.3.5.1 Non-uniform mechanical properties
From chapter 6 and 7 it became clear that the use of nominal steel properties for computation of
roller bent steel arches can give erroneous results, since the effects of the roller bending process
are ignored. Therefore the prediction model has been adopted such that the influence of the roller
bending process on the steel properties is incorporated, unless stated otherwise. A multilinear
curve is used to approximate the stress-strain curve from the earlier developed prediction model,
through the Multilinear Isotropic Hardening (MISO) option in ANSYS. The stress-strain curve is
approximated by a piece-wise linearized multilinear curve characterized by 30 stress-strain points
(Figure 102). The MISO option uses the Von Mises yield criterion in conjunction with the
isotropic hardening assumption and Prandtl-Reuss flow rule.

110 Structural properties and out-of-plane stability of roller bent steel arches
0
100
200
300
400
500
600
0 0.005 0.01 0.015 0.02
Tru
e st
ress
[N
/mm
2]
True strain [-]
Prediction model Numerical Input
0
100
200
300
400
500
600
0 0.05 0.1 0.15 0.2 0.25
Tru
e st
ress
[N
/mm
2]
True strain [-]
Prediction model Numerical Input
Figure 102 Typical stress-strain curves, initial stage (left) full stress-strain curve (right).
The different material properties, numbered according to the different zones as specified in
chapter 7 are shown in Figure 103.
1
2
1
6
7
34
5
3
Figure 103 Material properties distribution.
8.3.5.2 Residual stress
The residual stress model as presented in chapter 5 is implemented to define the initial state of
the roller bent arch, unless stated otherwise. Residual stresses are defined at Gauss integration
points which coincide with the element centroid (Figure 104 (a)), since a reduced integration
scheme has been applied. As the residual stress defined at the element centroid defines the initial
stress state for the whole element (Figure 104 (b)) a step-wise residual pattern is obtained.

Finite element modeling of roller bent arches 111
ζwrt ζwrc
0.2fy
0.2fy
Ideal residual stress pattern
Finite element discretization
0.7fy
0.35fy
Element centroid
(a) Residual stress model
with element mesh
(b) Implementation of residual stress model in FE-code
b
h0
tf
tw
tf
Figure 104 Residual stresses
After inserting the residual stress into the elements a first solution step was performed to verify
internal equilibrium in the implemented residual stress model. Negligible differences were
observed between the stresses inserted and observed internal stresses at integration point location
after solving, indicating internal equilibrium over the cross-section and correct implementation of
the residual stress model (Figure 105).
Figure 105 Residual stress distribution in finite element model from chapter 5, based on fy=235
N/mm2.
8.3.6 Geometric imperfections
Geometric imperfections can be characterized as a deviation from the ideal geometry. Geometric
imperfections are always present in structural steel members and can have a significant influence
on the elastic-plastic buckling response. A geometric imperfection covers several items as given
in Table 18. A distinction can be made between the out-of-straightness of the member and an
eccentric load application. Based on earlier research in the field of elastic-plastic buckling of
columns by Beer and Schulz [12] and ECCS [32] it was assumed that the effects of load

112 Structural properties and out-of-plane stability of roller bent steel arches
eccentricity and out-of-straightness of the member are most likely not working together in a
detrimental fashion. Hence the effect of load eccentricity can be ignored by explicitly defining an
appropriate value for the out-of-straightness for the member. In this investigation for numerical
analyses a fixed imperfection pattern and amplitude are proposed, ignoring load eccentricities.
Table 18 Classification of geometric imperfections
Out-of-straightness Load eccentricity [mm]
Lateral imperfection or
Crookedness [mm]
Rotation or
Twist [o]
8.3.6.1 Prescribed geometric imperfections EN 1993-2: 2006 (E)
The shape and amplitudes of the lateral imperfections for arches are presented in Annex D of the
Eurocode – Design of Steel Structures – part 2: Steel Bridges, EN 1993-2 [36]. No
recommendations with respect to initial twist are presented. Depending on the classification of
the cross section to the column curve and the horizontal span of the arch the maximum lateral
imperfection e0 can be determined (Table 19). From Table 19 it can be seen that the
imperfections are much larger when compared to adopted imperfection amplitudes in numerical
studies presented by Sakimoto et al. [116] (L/1000) and Pi and Trahair [95] (S/1000) amongst
others (see also section 2.4.1 and 2.4.3). The shape of geometric imperfections can be either a
half sine wave or a parabola, however, this shape is independent of the out-of-plane boundary
conditions (i.e. either fixed or pinned). The amplitude of the geometric imperfection takes into
account the presence of residual stresses in the arch-rib.
Table 19 Shape and amplitudes of imperfections for out-of-plane buckling of arches, EN 1993-2
[36]
Shape of
imperfection
(sinus or parabola)
e0 according to classification of
cross section to column curve
a b c d
e0
/ 2L / 2L
20L m
300
L
250
L
200
L
150
L
1
20
20 [ ]
L m
L L m
1
300
L 1
250
L 1
200
L 1
150
L
8.3.6.2 Measured imperfections
Earlier research on the out-of-plane elastic-plastic buckling response of freestanding arches gives
information about the geometric imperfection of roller bent arches. La Poutre [65] performed
measurements to assess the geometric imperfections of 12 full-scale roller bent arches. Lateral,
radial and twist imperfections were measured on roller bent HE 100A sections of steel grade
S235 (Figure 106). The arch radius varied between 1910 mm and 3820 mm. The developed
length of the arch was kept constant: S=6000 mm.
wimpvimp
R
(b) elevation(a) top view
δimp
(c) side view
LL
f
Radial imperfectionsLateral imperfections Twist imperfections
S
Figure 106 Geometric imperfections.

Finite element modeling of roller bent arches 113
The imperfections were measured at regular angular intervals along the developed length of the
arch. The subtended angle was divided into 12 equal parts, rendering 11 measurement points
along the arch-rib. The measured imperfections were approximated with a sixth degree
polynomial function of the following form for implementation in finite element models:
2 3 4 5 6
imp 0 1 2 3 4 5 6
2 3 4 5 6
imp 0 1 2 3 4 5 6
2 3 4 5 6
imp 0 1 2 3 4 5 6
[mm]
[mm]
[ ]
v a a a a a a a
w b b b b b b b
c c c c c c c
(48)
The coefficients (a0-a6, b0-b6 and c0-c6) were based on a best fit analysis with polynomial
regression. The measurement procedure and coefficients are presented in La Poutre [66].
Measured imperfections give an accurate representation of the out-of-straightness of the arch.
However, they cannot be extrapolated for inclusion in finite element models for arches other than
the ones from which the imperfections were obtained. In addition it cannot be expected that the
imperfections are measured prior to construction for inclusion in non-linear finite element models
for arches. Therefore a substitute imperfection which represents the out-of-straightness of a roller
bent wide section and can be used for a broad range of arches sections must be sought.
8.3.6.3 Selecting a substitute imperfection
The shape of a substitute imperfection, replacing measured values in finite element analyses, is
often that of the lowest buckling mode or eigenmode obtained by LBA. Since this imperfection
shape is closely related to the failure mode of the structure, it is often considered as the most
detrimental to the structural response. The main challenge is the selection of an appropriate
amplitude together with the imperfection shape. The amplitude will be determined by comparing
the elastic-plastic buckling response of arches with measured imperfections to those with
substitute imperfections, thereby varying the amplitude. By combining the amplitude with the
lowest buckling mode, the nodal coordinates of the buckling mode are scaled accordingly to
define the initial geometry for the elastic-plastic buckling analyses.
0
0.2
0.4
0.6
0.8
1
1.2
0 50 100 150 200
q/q
cr [
-]
Central arch deflection v [mm]
S/100
S/1000
S/10000Measured imperfections
0
0.2
0.4
0.6
0.8
1
1.2
0 20 40 60 80
q/q
cr [
-]
Central arch deflection v [mm]
S/300
S/400
S/1000
Measured imperfections
Figure 107 Load deflection characteristics for test 1A (left) and 3A (right).
The polynomial functions, representing the measured imperfections, are implemented in the
finite element model and a comparison is made with a substitute geometric imperfection
represented by the shape of the first eigenmode from the LBA with given amplitude. The
amplitude is expressed as a function of the developed length S. The comparison is confined to the
investigated arches by La Poutre [66]. The arches are in-plane pin supported and out-of-plane
fixed and prevented against warping, the in-plane load consists of a radial compression. A bi-

114 Structural properties and out-of-plane stability of roller bent steel arches
linear stress-strain curve with fy=235 N/mm2 is used together with the residual stress model for
roller bent arches. Load-deflection response of an arch equipped with a measured imperfection
shape and with „substitute‟ imperfection shapes are presented in Figure 107 for two specific
arches. When performing comparisons with GMNIA for all full-scale arches for which measured
imperfections are available a spectrum of amplitudes is obtained, varying roughly between S/300
– S/10000 (Table 20) with an average of approximately S/1000. This amplitude will be
implemented as the geometric imperfection together with the first eigenmode, unless stated
otherwise. It is mentioned that the substitute imperfection is calibrated on measurements taken
from 12 different arches, which is rather limited. The measurements may not represent the actual
imperfections in roller bent specimen. Furthermore, the selected amplitude is only valid for
arches failing by out-of-plane buckling, not for freestanding arches prone to snap-trough and in-
plane buckling
Table 20 Measured and modeled imperfections.
Test no. acc.
La Poutre [65]
Angle α
[ ]
Max. measured lateral imperfection
[mm]
Closest
amplitude
1A 180 5.64 S/1000
1B 5.64 S/2000
1C 15.28 S/500
2A 160 9.65 S/800
2B 1.41 S/10000
3A 135 18.27 S/300
3B 8.74 S/750
4A 110 16.42 S/500
4B 12.34 S/500
5A 90 5.89 S/1500
5B 3.50 S/10000
5C 6.10 S/2000
8.3.6.4 Typical comparison between measured and substitute imperfection
A typical comparison between the measured imperfections and the substitute pattern over the
length of the arch-rib is shown in Figure 108. The prescribed lateral, radial and twist
imperfections based on measurements by La Poutre [65] for test 1A-1C are presented in addition
to the substitute imperfection based on the first eigenmode with an amplitude of S/1000 mm. The
imperfections are plotted against the subtended angle. It can be seen that the substitute
imperfection provides no radial imperfections. Moreover, the maximum imperfection found from
the measurements is usually larger than the amplitude of the substitute imperfection.
-20
-10
0
10
20
0 45 90 135 180
Lat
eral
imp
erfe
ctio
n v
imp[m
m]
Subtended angle [º]
1C
1B
1A
-8
-4
0
4
8
0 45 90 135 180
Rad
ial i
mp
erfe
ctio
n w
imp
[mm
]
Subtended angle [º]
1C 1B
1A
-2
-1
0
1
2
0 45 90 135 180
Tw
ist i
mp
erfe
ctio
n δ
imp
[º]
Subtended angle [º]
1B
1C
1A
Measured Substitute with S/1000
(a) (b) (c)
Figure 108 Measured and substitute imperfection for test no. 1A-1C.

Finite element modeling of roller bent arches 115
8.4 Solution phase – Solving
8.4.1 Linear analyses and linear buckling analysis
The LEA is solved with the default sparse equation solver. The eigenvalue extraction, necessary
for the LBA is performed with the Block-Lanczos method.
8.4.2 Non-linear analyses
The MNA, GNIA and GMNIA can be classified as structural non-linear analyses, implying that
the system of equilibrium equations has to be solved stepwise and iteratively. The load is divided
into load steps, which in turn are divided into load increments. The load increments are
successively placed on the arch and by using a series of iterations equilibrium is found. For these
analyses the Newton-Raphson method was adopted in the solution phase. The convergence
criterion for the out-of-balance load vector is equal to 0.5 %. In addition to the force norm check
a convergence criterion of 0.5 % was applied for the displacement increments. All analyses are
load controlled. Besides the Newton-Raphson method, ANSYS offers the possibility to solve the
equilibrium iterations with the arc-length method. The arc-length method can be applied in non-
linear analyses for structures which exhibit unstable load-paths, e.g. to investigate post-buckling
behavior. Post-buckling behavior was observed in GMNIA of arches, where the arch displays a
significant loss of carrying-capacity after reaching its ultimate load.
In order to verify whether the Newton-Raphson method is able to produce a close approximation
of the ultimate load, a comparison is made with the arc-length method. The elastic-plastic
buckling response of a freestanding arch subjected to a uniformly radially directed load, with a
bi-linear material law with fy=235 N/mm2 is investigated, whereby two solution algorithms have
been used: Newton-Raphson method and the arc-length method. A comparison between the load-
deflection graphs obtained with both solution algorithms is presented in Figure 109, where the
acting loads are normalized with respect to the elastic critical load from a LBA.
0
0.2
0.4
0.6
0.8
1
1.2
0 30 60 90 120
q/q
cr[-
]
Central arch deflection v [mm]
HE 100A S=4m α=120 º
Out-of-plane fixed restrained warping
qult
q
α
arc-length newton-raphson
Figure 109 Load-deflection graph from two different solution procedures.
It can be seen that both solution algorithms produce identical load-deflection characteristics up to
the ultimate load qult. Beyond the ultimate load, the arc-length method is able to give information
on the post-buckling trajectory, whereas the Newton-Raphson method terminates at qult.

116 Structural properties and out-of-plane stability of roller bent steel arches
Since the ultimate load is the primary objective and tracking the post-buckling buckling behavior
requires additional computational expense, the Newton-Raphson method was selected in this
study in preference to the arc-length method.
8.5 Finite element output - Postprocessing
8.5.1 Load-deflection characteristics
A MNA, GNIA and GMNIA give each a load-deflection characteristic, representing the
structural performance at different load levels. The load, denoted by α, is plotted on the ordinate
and the out-of-plane deflection at the crown of the arch is presented on the abscissa. The loads
are presented as so-called load amplifiers. A load amplifier is the load divided by the applied
loading. For instance for a MNA the plastic load amplifier for an arch under a central load can be
computed as follows:
/pl plF F (49)
Where:
αpl is the plastic load amplifier obtained by a MNA.
Fpl is the maximum load obtained from the load-deflection characteristics.
F is the central load on the arch.
Since F is always unity, Fpl is equal to αpl. Analogous to αpl, αcr and αult can be obtained from Fcr
and Fult, respectively. In the load-deflection graphs the loads α are normalized against the elastic
load amplifier αcr. Typical load-deflection characteristics from a GNIA and GMNIA are shown in
Figure 110 for arches under uniform compression with a bi-linear material law with fy=235
N/mm2.
8.5.2 Plotting results in column curve
In addition to load-deflection graphs, the stability performance of freestanding arches can also be
represented by plotting the load amplifiers in a column curve graph. When performing a LBA
and MNA the accompanying load amplifiers can be obtained, which can be used to define the
arch non-dimensional slenderness:
pl cr (50)
Where:
αpl is the plastic load amplifier obtained by a MNA.
αcr is the critical load amplifier obtained by a LBA.
The reduction factor is obtained by using the ultimate load amplifier αult obtained from a GMNIA
in addition to the load amplifier αpl from the MNA:
ult pl (51)
Where:
αult is the ultimate load amplifier obtained from a GMNIA.
Plotting the out-of-plane elastic-plastic buckling response of a single arch configuration in a
column curve graph requires three different analyses: LBA for αcr, MNA for αpl, and GMNIA for
αult, in conjunction with equation (50)-(51). The European column curves a and a0 and four arch
configurations are shown in Figure 111. The numerical data points are retrieved from the
GMNIA load-deflection curves of Figure 110. The representation of the numerical data in
column curves can show the influence of certain parameters over the whole slenderness
spectrum.

Finite element modeling of roller bent arches 117
0
0.2
0.4
0.6
0.8
1
1.2
0 4 8 12 16 20
α/α
cr[-
]
Central arch deflection v [mm]
HE 100A, S=2.4m α=30 deg.
Out-of-plane fixed restrained warping
λ=0.61
αult/αcr
αpl/αcr=0.37
0
0.2
0.4
0.6
0.8
1
1.2
0 100 200 300
α/α
rc[-
]
Central arch deflection v [mm]
HE 360B S=12m α=70 deg.
Out-of-plane fixed restrained warping
λ=1.22
αult/αcr
αpl/αcr=1.49
0
0.2
0.4
0.6
0.8
1
1.2
0 20 40 60 80
α/α
cr[-
]
Central arch deflection v [mm]
HE 100A, S=6 m α=70 deg.
Out-of-plane fixed restrained warping
λ=1.83
αult/αcr
αpl/αcr=3.35
0
0.2
0.4
0.6
0.8
1
1.2
0 20 40 60 80
α/α
cr[-
]
Central arch deflection v [mm]
HE 100A, S=6 m α=120 deg.
Out-of-plane fixed restrained warping
λ=2.48
αult/αcr
αpl/αcr=6.15
GNIA GMNIA
Figure 110 Load-deflection characteristics for different slenderness values.
0
0.2
0.4
0.6
0.8
1
1.2
0 1 2 3 4
redcu
tion fac
tor
[-]
non-dimensional slenderness [-]
ECCS column curve a0
ECCS column curve a
λ=0.61
λ=1.22
λ=1.83
λ=2.48
Figure 111 Comparison of arch data points with ECCS column curves.

118 Structural properties and out-of-plane stability of roller bent steel arches
8.5.3 Equation of column curve – Selecting the appropriate curve
The column curves for members under axial compression or bending moment can be used to
determine the elastic-plastic buckling resistance of freestanding arches, after implementing the
necessary alterations. Before proceeding to the methodology for selecting the appropriate column
curve, the curves given in EN 1993-1-1 [35] are presented first. The column curves presented
determine the buckling resistance of axially loaded members which are given by:
2 2
1but 1.0
(52)
where:
20.5 1 0.2 (53)
The imperfection factor α corresponding to the appropriate column curve is given in Table 21.
Table 21 Imperfection factors for column curves
Column curve a0 a b c d
Imperfection factor α 0.13 0.21 0.34 0.49 0.76
When plotting the finite element results together with the column curve, an appropriate
imperfection factor can be adopted. For example, the finite element results in Figure 111 indicate
that column curve „a‟ with an imperfection factor α of 0.21 would be most suitable.
For members susceptible to lateral-torsional buckling (LTB) the column curve is given by:
LT LT2 2
LT LT LT
1but 1.0
(54)
Where:
2
LT LT LT LT0.5 1 0.2 (55)
αLT is an imperfection factor which is given in Table 22.

Finite element modeling of roller bent arches 119
Table 22 Imperfection factors for column curves
Column curve a b c d
Imperfection factor αLT 0.21 0.34 0.49 0.76
This curve is virtually identical to the curve for members under axial compression, with the
exception that curve a0 is not provided. In addition to the standard buckling curves for LTB, there
is a specific buckling curve for rolled sections and equivalent welded sections which gives more
freedom to the user.
LT LT LT 22 2LTLT LT LT
1 1but 1.0 and
(56)
Where:
2
LT LT LT LT,0 LT0.5 1 (57)
The values for LT,0 and ß are given by:
LT,0 =0.4 (maximum value)
ß=0.75 (minimum value)
As a concluding remark it can be noted that the buckling curves allow for modifications, making
close coherence between the curves and numerical data possible.
8.6 Validation finite element model
In this section the performance of the finite element model is evaluated by comparing its results
with earlier performed experiments.
8.6.1 Experiments La Poutre
La Poutre [65] performed a series of tests on circular arches with in-plane hinged supports and
out-of-plane fixed supports, with restrained warping (Figure 112 (a)). The cross section consisted
of a roller bent wide HE 100A section (Figure 112 (b)). Loading was introduced by means of a
tension rod, thereby ensuring that the load always remained directed towards the center of the
baseline of the arch, see Figure 112 (c). The tension rod was given a prescribed downward
displacement at the baseline. The in-plane downward deflection (w), out-of-plane deflection (v)
and twist (δ) were measured in addition to the load (F) exerted on the tension rod.
(a) Arch configuration (c) Loading in undeformed
and deformed state
(b) Cross section
tf
twh
bδ
wire-hangerFF
v
w
baseline
δ
F
δ
Figure 112 Experiments by La Poutre [65]
A total of 12 circular arches were tested, with different radii, varying from 1910 mm to 3820
mm. An overview of the experimental program is given in Table 23.

120 Structural properties and out-of-plane stability of roller bent steel arches
Table 23 Experimental program La Poutre [65] with HE 100A arches.
Test No. of
tests
Radius
R [mm]
Angle
α [º]
Arch length
S [mm]
Rise
f [mm]
Span
L[mm]
Rise-to-span ratio
f/L [-]
1A-1C 3 1910 180 6000 1910 3820 0.50
2A-2B 2 2149 160 6000 1775 4231 0.42
3A-3B 2 2546 135 6000 1572 4705 0.33
4A-4B 2 3125 110 6000 1333 5120 0.26
5A-5C 3 3820 90 6000 1119 5402 0.21
The material properties obtained from tensile tests and geometrical imperfections measured by
La Poutre [65] were implemented in the finite element model together with the residual stress
model from chapter 5.
Load-deflection characteristics
Typical load-deformation characteristics from finite element analyses and earlier performed tests
are shown in Figure 113. All deformations are plotted positive. The maximum force and the
accompanying deflections/rotations are given as well. A full comparison between the ultimate
load and corresponding deformations/rotations obtained by finite element analyses and
experiments is presented in Table 24. It can be seen that the ratio between ultimate loads from
tests and finite element analyses is within 1.18.
Table 24 Load-deformation results obtained from experiments and FEM
Test results Test/FEM
Test no. Fult
[kN]
wult
[mm]
vult
[mm]
ζult
[º]
F w v ζ
1A 104.7 39.5 89.0 6.59 1.09 1.03 1.01 0.72
1B 103.2 38.8 103.3 10.3 1.08 1.01 1.18 1.12
1C 104.8 41.6 93.6 6.35 1.11 1.08 1.07 0.70
2A 104.9 35.0 65.7 6.10 1.11 0.91 0.95 0.79
2B 104.3 36.1 69.3 9.22 1.11 0.96 1.03 1.24
3A 100.0 34.7 68.1 8.21 1.09 0.96 1.12 1.07
3B 99.2 33.5 58.3 7.68 1.07 0.94 1.06 1.09
4A 99.4 33.3 36.6 4.60 1.10 1.02 0.75 0.72
4B 96.3 30.7 40.0 4.47 1.05 0.87 0.77 0.62
5A 97.3 36.5 19.8 3.98 1.18 1.17 0.54 0.77
5B 95.2 35.4 26.9 5.55 1.15 1.12 0.77 1.19
5C 95.0 32.0 41.2 5.00 1.17 1.02 1.05 0.89

Finite element modeling of roller bent arches 121
0
20000
40000
60000
80000
100000
120000
0 10 20 30 40 50 60
Cen
tral
forc
e F
[N]
In-plane deflection w [mm]
wult, Fult (experimental)
wult, Fult (numerical)
Test 1A
0
20000
40000
60000
80000
100000
120000
0 10 20 30 40 50 60 70 80
Cen
tral
fo
rce
F[N
]
In-plane deflection w [mm]
wult, Fult (experimental)
wult, Fult (numerical)
Test 5A
0
20000
40000
60000
80000
100000
120000
0 30 60 90 120 150
Cen
tral
fo
rce
F[N
]
Out-of-plane deflection v [mm]
vult, Fult (experimental)
vult, Fult (numerical)
Test 1A
0
20000
40000
60000
80000
100000
120000
0 30 60 90 120 150
Cen
tral
forc
e F
[N]
Out-of-plane deflection v [mm]
vult, Fult (numerical)
vult, Fult (experimental)
Test 5A
0
20000
40000
60000
80000
100000
120000
0 5 10 15 20
Cen
tral
fo
rce
F[N
]
Twist δ [º]
δult, Fult (numerical)
δult, Fult (experimental)
Test 1A
0
20000
40000
60000
80000
100000
120000
0 5 10 15 20
Cen
tral
fo
rce
F[N
]
Twist δ [º]
δult, Fult (numerical)
δult, Fult (experimental)
Test 5A
0
20000
40000
60000
80000
100000
120000
0 10 20 30 40 50 60
Cen
tral
forc
e [N
]
In-plane deflection w [mm]
Experimental Numerical
Figure 113 Load-deformation characteristics for test 1A (left) and 5A (right).
Deformation mode
For all tests, the permanent deformations after the test were measured. The shape of the
permanent deformations gives information about the buckling mechanism of the arch. The
permanent lateral deformations (vperm), radial deformations (wperm) and twist deformations (δperm)

122 Structural properties and out-of-plane stability of roller bent steel arches
were measured. In the numerical environment the arches were loaded with a prescribed
downward deflection (), approximately equal to the deflection issued in the test. After the
prescribed displacement was exerted to the arch, it was removed in the subsequent loadstep,
which allowed the arch to deflect elastically. In the postprocessor phase the nodal deformations
were obtained and plotted versus the experimental results.
A plot of the permanent deformations along the arch is shown in Figure 114 and Appendix B.
The correspondence between the measured values and finite element results is fairly good. The
permanent twist deformations are predicted with less accuracy compared to the lateral and radial
deformations.
-60
-50
-40
-30
-20
-10
0
10
0 45 90 135 180
Per
man
ent l
ater
al d
efo
rmat
ion
vp
erm
[mm
]
Subtended Angle [º]
Test 1A
-10
0
10
20
30
40
50
60
70
80
0 22.5 45 67.5 90
Per
man
ent l
ater
al d
efo
rmat
ion
vp
erm
[mm
]
Subtended Angle [º]
Test 5A
-40
-20
0
20
40
0 45 90 135 180
Per
man
ent r
adia
l def
orm
atio
n w
perm
[mm
]
Subtended Angle [º]
Test 1A
-60
-40
-20
0
20
40
60
0 22.5 45 67.5 90
Per
man
ent r
adia
l def
orm
atio
n w
perm
[mm
]
Subtended Angle [º]
Test 5A

Finite element modeling of roller bent arches 123
-6
-4
-2
0
2
4
6
0 45 90 135 180
Per
man
ent t
wis
t def
orm
atio
n δ
perm
[º]
Subtended Angle [º]
Test 1A
-8
-6
-4
-2
0
2
4
6
8
0 22.5 45 67.5 90
Per
man
ent t
wis
t def
orm
atio
n δ
perm
[º]
Subtended Angle [º]
Test 5A
-60-50-40-30-20-10
010
0 45 90 135 180
Per
man
ent l
ater
al
def
orm
atio
n [
mm
]
Subtended Angle [º]
Finite element method Experiment
Figure 114 Permanent deformations for test 1A (left) and test 5A (right)
8.6.2 Experiments Sakata and Sakimoto
Sakata and Sakimoto [112] performed an experimental study to investigate the out-of-plane
elastic-plastic stability behavior of freestanding and braced arches. The arch configuration was
either circular or parabolic, with in-plane hinged supports and out-of-plane fixed supports with
restrained warping. The experimental study was mainly focused on parabolic arches and only a
single freestanding circular arch was tested. The experimental results of this freestanding arch are
compared to a finite element analysis. The span of the arch was 2800 mm and the rise 560 mm,
giving a rise-to-span ratio (f/L) of 0.20 (Figure 115 (a)). The subtended angle was 87.2 degrees
and the developed length 3089 mm. The radius was 2030 mm. The cross section of the arch was
a welded H-section with the following dimensions: tf=6 mm, h=136 mm, tw=6 mm and b=110
mm (Figure 115 (b)). The material model consisted of an elastic-perfectly plastic material model
with a hardening branch, for which: fy=240.3 N/mm2, E=208700 N/mm2, εy=0.00115, εst=0.0205
and Est=1088 N/mm2 (Figure 115 (c)).
f
L(a) Arch configuration (d) Loading in undeformed
and deformed state
(b) Cross
section
q tf
twh
b
fy
εy εst
E
Est
ζ
ε
(c) Stress-strain
relationship Figure 115 Experiments Sakata and Sakimoto.
The arches were subjected to a uniformly distributed vertical load, idealized by a group of eight
concentrated loads, applied at the center of the bottom flange. For the circular freestanding arch
the vertical loading was able to move sideways perpendicular to the plane of the arch
(conservative) (Figure 115 (d)). Since the exact locations of the point loads were not given, the
series of point loads was approximated by a uniformly distributed load in the finite element
model.

124 Structural properties and out-of-plane stability of roller bent steel arches
-200 -100 0 100 200
-100
0
100
-100
0
100
Numerical Implementation Experiments Sakata & Sakimoto
Figure 116 Residual stresses in N/mm2.
The residual stresses measured by Sakata & Sakimoto were implemented in numerical form,
thereby maintaining internal equilibrium. An overview of the residual stresses measured by
Sakata & Sakimoto and the numerical implementation is presented in Figure 116. The lateral
imperfections measured by Sakata & Sakimoto and implemented in numerical form are shown in
Figure 117 (left). Radial and twist imperfections were not measured.
-1
0
1
2
3
4
0 43.6 87.2
Lat
eral
Imper
fect
ion v
imp
[mm
]
Subtended angle [º]
0
0.2
0.4
0.6
0.8
1
1.2
0 25 50 75 100
α/α
cr
central lateral deflection v [mm]
GNIA GMNIA
αult/αcr
Figure 117 Geometric imperfections (left) and load-deflection characteristic.
A LEA, LBA, GNIA and GMNIA were performed. The results of the GNIA en GMNIA are
presented in Figure 117 (right).There are no experimental load-deflection characteristics
available for this arch. A comparison between the total ultimate load (αult) from the GMNIA and
the collapse load as reported by Sakata & Sakimoto is presented in Table 25, in addition to the
compressive force at the support at failure (Nult). The total ultimate load is equal to the ultimate
distributed load (qult) multiplied by the span length (L).

Finite element modeling of roller bent arches 125
Table 25 Comparison between experiments and finite element analysis
Exp. FEM Exp./FEM
αult [kN] 485.9 447.9 1.08
Nult [kN] 382.4 358.4 1.07
8.6.3 Resume
From the comparison between experimental results from La Poutre and Sakata & Sakimoto, and
the finite element analyses it can be seen that the model is capable of simulating the out-of-plane
elastic-plastic buckling load with reasonably-to-good accuracy. The load-deflection
characteristics in Figure 113 show reasonable coherence between finite element results and
experimental data. The failure modes illustrated by the permanent deformations after failure are
accurately predicted by the finite element model (Figure 114).
8.6.4 Discussion on validation experiments La Poutre
From Table 24 it can be seen that the ratio between the experimental limit load and numerical
limit load is between 1.05–1.11 for tests 1-4 and between 1.15-1.18 for tests 5, showing that the
numerical analyses consistently underestimate the experimental values. In this section several
reasons for this underestimation are given. A distinction is made between uncertainties arising
from the experimental test-setup and the shortcomings in the finite element model.
8.6.4.1 Uncertainties in experiments
Material properties in compression
The implemented measured stress-strain curves from La Poutre [65] were based on tensile tests
conducted on coupons taken from roller bent wide flange sections. For the numerical analyses the
stress-strain curves were modeled symmetrically (i.e. the material is modeled to behave identical
under tension and compression). The compression tests in chapter 6 show that the stress-strain
curves for coupons taken from roller bent wide flange sections in compression are considerably
different to those in tension, especially in the flanges. The unfavorable rounded stress-strain
curve as observed in the tensile tests in the flanges was not found in the compressive tests.
Therefore it can be concluded that closer coherence between experimental and numerical
analyses can possibly be achieved when an asymmetric material law is implemented, based on
tensile tests and compression tests on coupons taken from roller bent wide flange sections.
Partial fixation load introduction plate
In the experimental test-setup, special attention was paid to the load introduction at the crown. A
spherical hydrostatic bearing was designed to rule out any restraint effects by the load
introduction plate. Possible friction in the hydrostatic bearing was monitored from which La
Poutre concluded that the load bearing worked frictionless. However, when looking at a typical
load-deflection graph, it can be seen that after the maximum displacement is attained and the
unloading procedure commences the curve moves (almost) vertically downward, after which
typical unloading behavior is observed (Figure 118). The unloading curve consists of two
branches. This vertical movement might indicate presence of restraint in the hydrostatic bearing
during the loading phase. This phenomenon was observed in all investigated tests. Thereby it is
mentioned that this phenomenon is more pronounced in the in-plane load-deflection graphs
compared to the out-of-plane and twist load-deflection graphs. The possible restraining effect
may have produced additional elastic-plastic buckling resistance during testing, which explains
the consistent underestimation of ultimate load by the finite element model.

126 Structural properties and out-of-plane stability of roller bent steel arches
0
20000
40000
60000
80000
100000
120000
0 10 20 30 40 50 60
Cen
tral
fo
rce
[N]
In-plane deflection w[mm]
0
20000
40000
60000
80000
100000
120000
0 30 60 90 120
Cen
tral
fo
rce
[N]
Out-of-plane deflection v [mm]
ΔFΔF
Figure 118 Possible fixation of hydrostatic bearing during experiments for test 2B.
8.6.4.2 Shortcomings numerical model
Lacking torsional stiffness
The shell model is composed of 3 different plate sections (i.e. 2 flanges and 1 web) intersecting
at the web-to-flange junctions. The fillets of the roller bent wide flange sections are not taken
into account (Figure 119 (a)). The intersection creates a small overlap at the web-to-flange
junction. Not taking into account the material in the fillets has only minor influence on the minor
bending stiffness, major axis bending stiffness and warping stiffness. However, it was stated by
La Poutre [65] that the elastic torsional stiffness of the wide flange section is underestimated up
to 30 % when ignoring the fillets. In order to compensate for the lacking torsional stiffness in the
shell model, La Poutre suggested using beam elements at the web-to-flange junctions. The cross-
sections of the beam elements were modeled as Square Hollow Sections (SHS). The dimensions
of the SHS were chosen such that the elastic torsional stiffness could be accurately matched
(Figure 119 (b)).
(a) Cross section
Fillet
(b) FE-idealisation
tf
Flange
web
b
Beam element SHS to compensate
for lacking elastic torsional stiffness
bSHS
bSHS
tSHS tSHS
bSHS=37mm
tSHS=0.16mm
overlap
Figure 119 Fillets in cross-section (only web-to-flange junction at top flange is drawn).
In the present investigation the beam elements were deliberately not taken into account in the FE-
model. Although the use of beam elements seems appropriate to correctly model the elastic
torsional stiffness, its application suffers from a number of drawbacks. First of all the dimensions
of the SHS-section are based on the elastic torsional stiffness. It is not likely that the onset of
yielding due to torsion, the elastic-plastic torsional response and the plastic moment can be
captured by the beam element.
Finite element modeling of roller bent arches 127
Moreover, since the beam element serves as a compensation element, it remains an issue which
material properties and residual stresses have to be attributed to the element. The most
straightforward solution seems that the material properties for the center of the flanges are also
used for the beam elements and that any residual stresses are ignored.
From this it can be concluded that the use of beam elements to compensate for the lacking
torsional stiffness raises additional questions, justifying the decision not taking them into account
for the finite element computations for a design rule. In view of the uncertainties with respect to
the stress-strain response of the material in roller bent wide flange sections under compression
and the hydrostatic bearing plate, the exclusion of the beam elements is considered appropriate.
These beam elements will not be used for the subsequent analyses.
Additional GMNIA
A number of additional GMNIA were performed to investigate the influence of the above
mentioned shortcomings on the experimental failure load. Per experimental test 3 additional
GMNIA were performed. The finite element model was equipped with beam elements at the
web-to-flange junctions according La Poutre (1), the stress-strain curves were based on the
compression tests from chapter 6 (Figure 78) (2) and both modeling features were combined (3),
keeping all other parameters the same. The results of these additional GMNIA are presented in
Table 26.
From the additional GMNIA it can be seen that adding beam elements to compensate for the
lacking elastic torsional stiffness gives an overall better approximation of the experimental
failure load. Similar conclusions can be drawn when implementing the compressive stress-strain
response from a roller bent wide flange section. Combining both aspects in the finite element
model gives an overestimation of the experimental ultimate load. From this it can be seen that the
underestimation of the ultimate load as observed from Table 25 can be attributed partly to the
incorrect modeling of the elastic torsional stiffness and the shortcoming in the material model.
Table 26 Influence on ultimate load F
Test/FEM
Test Beam elements at web-to-flange
junctions acc. La Poutre [65] (1)
Stress-strain curves based on
compression tests (2)
(3)=(1)+(2)
1A 1.05 1.03 0.98
1B 1.04 1.02 0.97
1C 1.06 1.02 0.98
2A 1.07 1.02 0.97
2B 1.07 1.02 0.96
3A 1.05 0.99 0.94
3B 1.03 0.96 0.91
4A 1.06 0.99 0.95
4B 1.02 0.96 0.90
5A 1.14 0.96 0.90
5B 1.11 0.94 0.88
5C 1.13 0.98 0.92

128 Structural properties and out-of-plane stability of roller bent steel arches
8.7 Sensitivity analyses
8.7.1 Geometric imperfections
It has been shown in other finite element studies that the existence of initial lateral deflections
reduces the limit load of freestanding arches. It was found for example by Pi and Bradford [87]
that for out-of-plane fixed arches an increase of the initial out-of-plane imperfections results in a
decrease of the out-of-plane strengths.
0
0.2
0.4
0.6
0.8
1
1.2
0 200 400 600 800 1000
α/α
cr[-
]
Central arch deflection v [mm]
S/100
S/1000
S/10000
HE 360B S=18 m α=60 deg.
Out-of-plane fixed and restrained warping
0
0.2
0.4
0.6
0.8
1
1.2
0 1 2 3 4
reduct
ion f
acto
r [-
]
non-dimensional slenderness [-]
S/10000
S/1000
S/100
ECCS column curve a0
ECCS column curve d
ECCS column curve a
GNIA GMNIA
a b
Figure 120 Load deflection response for a HE 360B (a) and summarized in column curve graph
(b).
The effect of geometrical imperfections on the elastic-plastic buckling capacity of arches was
assessed by performing a numerical study. A set of 10 arch configurations covering a range of
slenderness values of 0.6 3.8 are used to investigate the influence of the magnitude of the
initial imperfections on the strength of arches subjected to uniform compression. The
imperfection shape is related to the buckling mode of the lowest eigenvalue. The arches were
modeled using three imperfection amplitudes: S/100, S/1000 and S/10000. An elastic-perfectly
plastic stress-strain relationship with fy=235 N/mm2 and the roller bent residual stress model were
used. Figure 120(a) demonstrates the effects of changes in amplitudes. Comparisons of ultimate
load carrying capacity are plotted in the column curve graph (Figure 120(b)). From Figure 120(b)
it can be observed that the influence of the imperfections is most signficiant for arches with
slenderness within the range of 0.6 2.5 .
8.7.2 Residual stresses
A study of the sensitivity of the finite element model with respect to different residual stress
models was also performed. Simulations were run with 2 different residual stress models: a hot-
rolled residual stress model (Figure 29(c)) and a roller-bent residual stress model (Figure 65) in
addition to simulations without residual stresses, while all other parameters remained constant.
Figure 121(a) shows load-deflection curves for freestanding arches with different residual stress
patterns. It can be seen that the residual stresses cause an early departure from elastic arch
behavior and lower the elastic-plastic buckling load, compared to the analyses when no residual
stresses are implemented. The hot-rolled residual stress pattern is more detrimental to the arch
strength when compared to the roller-bent residual stress pattern. The ultimate loads are plotted
in the column curve graph (Figure 121 (b)). An elastic-perfectly plastic stress-strain relationship

Finite element modeling of roller bent arches 129
with fy=235 N/mm2 was used. An initial crookedness similar to the lowest buckling mode with
amplitude S/1000 was implemented.
0
0.2
0.4
0.6
0.8
1
1.2
0 4 8 12 16 20
α/α
cr[-
]
Central arch deflection v [mm]
HE 100A S=2.4m α=60 deg.
Out-of-plane fixed and restrained warping
0
0.2
0.4
0.6
0.8
1
1.2
0 1 2 3 4
red
uct
ion
fac
tor
[-]
non-dimensional slenderness [-]
No residual stresses
Roller-bent residual stresses
Hot-rolled
residual stresses
ECCS column curve a
ECCS column curve b
GNIA GMNIA (roller bent r.s.)
GMNIA (no r.s.) GMNIA (hot-rolled r.s.)
a b
Figure 121 Load deflection response for a HE 100A (left) and summarized in column curve
graph (right).
It can be seen that the residual stress models have only little influence on the ultimate load of the
arch. The incorporation of the roller bent residual stress model only affects the ultimate load
marginally.
8.7.3 Mechanical properties
In chapter 6 and chapter 7 the change in mechanical properties due to roller bending was
measured and converted into a prediction model. The prediction model is implemented in the
finite element model and a comparison is made with other material models. A number of arch
configurations were selected for the investigation and each arch was analyzed four times. The
four analyses used different material models: (1) measured stress-strain curves obtained from the
experiments in chapter 6, (2) nominal steel properties (fy=235 N/mm2) in conjunction with an
elastic-perfectly plastic material law, (3) the prediction model from chapter 7 with fy;s
=235N/mm2 and (4) the prediction model with fy;s=290 N/mm2, leaving all other parameters
unchanged.

130 Structural properties and out-of-plane stability of roller bent steel arches
0
0.2
0.4
0.6
0.8
1
1.2
0 10 20 30 40
α/α
cr[-
]
Central arch deflection v [mm]
HE 100A S=2m α=60 deg.
Out-of-plane fixed and restrained warping
0
0.2
0.4
0.6
0.8
1
1.2
0 10 20 30 40
α/α
cr[-
]
Central arch deflection v [mm]
HE 100A S=4m α=120 deg.
Out-of-plane fixed and restrained warping
GNIA GMNIA (1) GMNIA (2) GMNIA (3) GMNIA (4)
Figure 122 Load deflection characteristics for different mechanical properties.
0
0.2
0.4
0.6
0.8
1
1.2
0 1 2 3 4
red
uct
ion
fac
tor
[-]
non-dimensional slenderness [-]
0
0.2
0.4
0.6
0.8
1
1.2
0 1 2 3 4
reduct
ion fac
tor [-
]
non-dimensional slenderness [-]
R/h=19.89 R/h=19.89
S235 S235
αM M
q
α
GMNIA (1) GMNIA (2) GMNIA (3) GMNIA (4)
Figure 123 Difference in mechanical properties for a HE 100A bent into a radius of 1910 mm.
Naturally, analysis (1) has the closest coherence with the actual performance (i.e. experimental
test). However, for most structural analyses tensile tests for numerical input are not performed. If
information about the roller bending process is not known an elastic-perfectly plastic material
law with nominal steel properties would most likely be implemented (2). The suggested
prediction model can give 7 full stress-strain curves for nine different zones over the cross-
section. However, the actual yield stress of the straight material, required for the prediction
model, is usually unknown. Substituting the nominal yield stress (fy;s=235 N/mm2) into the
prediction model yields material models for a GMNIA (3). Incorporating a measured yield stress
(e.g. fy;s=290 N/mm2) of the straight material gives stress-strain curves for analysis (4).

Finite element modeling of roller bent arches 131
The corresponding load-deflection characteristics from the different GMNIAs in addition to the
GNIAs are shown in Figure 122 for two arches under uniform compression. The bending ratio
R/h of both arches are the same; yielding identical mechanical properties for the roller bent steel.
The results are also presented in column curve graphs by using the αpl for nominal steel
properties for arches with identical curvature (Figure 123). For these sensitivity analyses, serving
as preliminary computations prior to the design rule, the αpl values as based on nominal steel
properties was considered appropriate.
It can be seen that the prediction model with the lowest yield stress fy;s gives the lowest reduction
factor. Moreover analysis (3) shows a deviation from linear elastic behavior at relative low loads
compared to the other analyses, indicating premature yielding at specific zones in the cross-
section. Analysis (4) also shows earlier yielding compared to analyses (1) and (2). Employing
measured steel properties gives a higher ultimate load, compared to analyses with the prediction
model.
It can be seen that when employing the measured stress-strain curves (1) or the prediction model
(3+4) a reduction factor of χ>1.0 can be obtained for low slenderness values. The reason for this
is that the reduction factor and non-dimensional slenderness are based on the in-plane plastic
capacity αpl with a nominal yield stress, instead of the altered stress-strain curves. Correct
presentation of numerical results in the column curve graph using the appropriate value of αpl will
be treated in more detail in the subsequent chapter.
8.8 Conclusions
This chapter was focused on the finite element modeling of roller bent freestanding steel arches
for elastic-plastic buckling analyses. The residual stress model as presented in chapter 5 and the
prediction model for the mechanical properties of chapter 7 were implemented in the finite
element model. The finite element model was created in the implicit ANSYS v.11.0 environment
and comprised of shell elements. A geometric imperfection, based on a comparison with earlier
measured imperfections on roller bent arches, consisting of the eigenmode belonging to the
lowest critical load amplifier with maximum amplitude of S/1000 was proposed for inclusion in
the numerical model, where S is the developed length of the arch. The performance of the finite
element model was evaluated by comparing the numerical results with experimental test results.
Arches under a vertical non-conservative load applied at the crown and under a conservative
uniformly distributed vertical load were investigated. It was observed that the finite element
model was able to replicate the experimental results with reasonably-to-good accuracy.
Sensitivity analyses were performed to investigate the influence of the imperfections on the
elastic-plastic buckling response. The effect of geometrical imperfections and mechanical
properties from roller bending on the out-of-plane elastic-plastic buckling strength is significant
for freestanding arches. Residual stresses have less influence on the out-of-plane elastic-plastic
buckling response.
The European column curves (or similar curves) can be used directly to check the out-of-plane
elastic-plastic buckling resistance for arches under uniform bending or uniform compression. The
accompanying non-dimensional slenderness values and reduction factors must be determined
with linear buckling analyses (LBA) and material non-linear analyses (MNA). In view of the
results as presented in the column curves it was observed that the influence of the geometric
imperfections and mechanical properties is most profound in the relative slenderness
range 0.6 2.5 .


9 Towards design rules The use of the finite element model to arrive at design rules is described in this chapter. A short
overview is given of possible design rules to estimate the ultimate load of freestanding arches
failing by out-of-plane buckling. The column curve formulation, currently used for structural
design of columns and beams, is selected. Finite element results are analyzed and column curves
are proposed. Due to the large scatter in numerical data, a column curve is proposed for each
steel grade and load case. The design rule requires the determination of the in-plane plastic
collapse load and elastic buckling load to estimate the elastic-plastic buckling load. Since no
closed-form solutions are available, these parameters must be determined with numerical
procedures.
9.1 Introduction
Chapter 8 showed the composition and performance of the finite element model for elastic-
plastic buckling analyses of freestanding arches. The finite element model is able to replicate
experimental results which sufficient accuracy and allows it to be used for parametric studies.
This chapter proposes design rules to check the out-of-plane elastic-plastic buckling resistance of
roller bent arches. The design rules are based on parametric studies using the finite element
model from chapter 8 incorporating residual stresses, geometric imperfections and the non-
uniform distribution of material properties.
A limited number of design rules are available to predict the out-of-plane elastic-plastic buckling
load of steel arches, see chapter 2. The earlier proposed design rules can be adopted for the
current investigation. A short overview is given of the possibilities of the various design rules for
application in the current research.
Japanese design rules suggest the use of column curves to predict the elastic-plastic buckling
load, see section 2.5.1. The definition of slenderness treats the arch buckling problem similarly to
that of a clamped-clamped column. The design procedure ignores the effect of arch curvature.
The applicability is limited to out-of-plane fixed arches with welded box-sections under a
uniformly distributed load.
The interaction formulae proposed by Pi and Trahair [96] Pi and Bradford [87] (section 2.5.3.2)
for out-of-plane pinned and fixed arches respectively, seem suitable to check the out-of-plane
stability of arches but suffer from a number of deficiencies. The influence of the roller bending
process is not taken into account, and the interaction formulae treat the arch problem as a linear
combination of bending and compression, which does not reflect the complex interaction
between bending and compression actions in the arch. Furthermore the unity check emerging
from the interaction formula does not reveal whether out-of-plane arch buckling is governed by
plastic collapse, elastic-plastic buckling or predominant elastic buckling.
In order to take altered residual stresses and mechanical properties of roller bent sections into
account in the design of arch structures subject to out-of-plane buckling it is suggested to follow
the Japanese approach and use the generally known column curves. This proposal requires that
the Japanese definition of non-dimensional slenderness for arches be adjusted.
Finite element results described in chapter 8 and investigations by Delrue [31], Pi and Trahair
[95] Pi and Bradford [87] have shown the applicability of column curves to check the out-of-

134 Structural properties and out-of-plane stability of roller bent steel arches
plane stability of freestanding arches under uniform bending or uniform compression. The major
advantage of the column curve formulation is that it can easily be determined whether an arch
will fail by plastic collapse, elastic-plastic buckling or elastic buckling, depending on the non-
dimensional slenderness. Moreover, when the non-dimensional slenderness is between
0.5 1.5 it can be observed that imperfections have a greater influence compared to arches
with other non-dimensional slenderness values.
Adopting the column curve formulation for the determination of the elastic-plastic buckling load
for roller bent arches using the same slenderness definition as for columns introduces a number
of difficulties. The column curve formulation was developed for straight columns and later
expanded to include beams. Due to the unambiguous definition of the plastic capacity and elastic
buckling load for columns subjected to a point load at the top or simply supported beams under
uniform bending these buckling parameters or structural properties are straightforward and can
be determined using closed-form equations. In chapter 2 it was found that, with the exception of
an arch under uniform bending or uniform compression, no closed-form equation exist by which
the elastic buckling load or in-plane plastic collapse load can be determined. Therefore these
buckling parameters must be determined with finite element analyses.
9.2 Column curve formulation
A popular method of using finite element results to arrive at a column curve is to obtain the
imperfection parameter (ε) as back-calculated from the multipliers from finite element analyses
(αult, αpl and αcr), propose an expression for ε and substitute this expression into the column curve
formulation in EN 1993-1-1 [35] (equation (52)). The expression of the imperfection parameter
can be adapted, but the general column curve formulation is unaltered. This procedure has been
adopted by Rasmussen and Rondal [107], Rasmussen and Rondal [108] and Rasmussen and
Rondal [109] to obtain column curves for non-linear metallic materials, such as aluminum and
stainless steel.
9.2.1 Imperfection parameter
The relationship between the imperfection parameter ε and the non-dimensional slenderness λ is
presented in Figure 124 for all ECCS column curves. It can be seen that the ECCS column curves
show a linear relationship between ε and .
0 0 (58)
Where α is the imperfection parameter as presented in Table 21 and 0 is the plateau length of
the column curve, defined by 0.2. The steepness of the imperfection curve is governed by factor
α (Table 21, Table 22). The imperfection parameter can be inserted into the column curve
(equation(52)) by the following equation:
20.5 1 (59)
Combining (58) with (59) gives equation (53).

Towards design rules 135
0
0.25
0.5
0.75
1
1.25
1.5
0 1 2 3 4
imp
erfe
ctio
n p
aram
eter
[-]
non-dimensional slenderness [-]
d
c
b
a
a0
Figure 124 Imperfection parameter vs. non-dimensional slenderness for ECCS column curves
The imperfection parameter can also be expressed by rewriting the column curve formulation
according to equation (52):
2 2
2
11
(60)
A full derivation of equation (60) is presented in Appendix C. Employing the distinctive load
multipliers (αult, αpl and αcr) into equation (60) leads to the following expression.
2
pl pl plult
pl ult cr cr
1
(61)
Equation (61) allows finite element results to be presented in an imperfection parameter graph, as
Figure 125, showing a relationship between the non-dimensional slenderness value ( ) and
imperfection parameter (ε). The numerical data in the imperfection parameter graph can then be
used to find a closed-form relationship between both non-dimensional slenderness and
imperfection parameter through curve-fitting techniques. The emerging equation can be
substituted into the column curve formulation as defined by equations(52) and(59).
9.2.2 Representation of finite element results
To show the representation of finite element results in the imperfection graph a small parametric
study is performed. Finite element analyses are performed on a number of HE 100A arches The
subtended angle α is varied between 63 and 135 degrees and the developed length S between
2800 and 6000 mm, keeping the bending ratio fixed at 26.52. The arches are subjected to a
radially directed uniformly distributed load. A bi-linear material law with a yield stress of 235
N/mm2 is employed. For each arch a MNA, LBA and GMNIA are performed to obtain the
necessary buckling parameters, αpl αcr and αult, respectively. The results are plotted in the
imperfection graph in addition to the column curve graph, as shown in Figure 125. In both
diagrams the ECCS column curves “a” en “d” are shown.

136 Structural properties and out-of-plane stability of roller bent steel arches
0
0.25
0.5
0.75
1
1.25
1.5
0 1 2 3 4
imp
erfe
ctio
n fac
tor
[-]
non-dimensional slenderness [-]
0
0.2
0.4
0.6
0.8
1
1.2
0 1 2 3 4
reduct
ion fac
tor [-
]
non-dimensional slenderness [-]
ECCS column curve d
ECCS column curve a
ECCS column curve d
ECCS column curve a
q
α
q
α
Figure 125 Numerical results in column curve graph (left) and imperfection parameter graph
(right).
It can be seen that any difference between the numerical data and the column curve can be
observed in greater detail in the imperfection parameter graph. It is noted that as the non-
dimensional slenderness increases, the effect of imperfections on the reduction factor decreases.
This cannot be observed in the imperfection parameter graph.
9.3 Buckling parameters
In order to arrive at a column curve and imperfection parameter diagram representing the out-of-
plane buckling behavior of freestanding roller bent arches the ultimate load multiplier αult must
be plotted in an imperfection parameter diagram, using equation (61). Therefore the plastic
multiplier αpl and elastic critical multiplier αcr are necessary.
9.3.1 Buckling parameters for columns and beams
For a column subjected to a load F applied at the top with a bi-linear stress-strain curve the
buckling parameters can easily be obtained:
2 2
pl pl y cr cr /F F Af F F EI L (62)
Where:
A is the cross-section
fy yield stress of the material
E is the Young‟s modulus
Iy is the minor moment of inertia
L is the length of the column
For a simply supported beam subjected to two opposite end moments M the buckling parameters
can be determined with:
2
2 2 wpl pl y;pl y cr cr t 2
/EI
M M W f M M EI L GIL
(63)
Where:
Wpl is the plastic section modulus
G is the shear modulus
It is the torsional rigidity
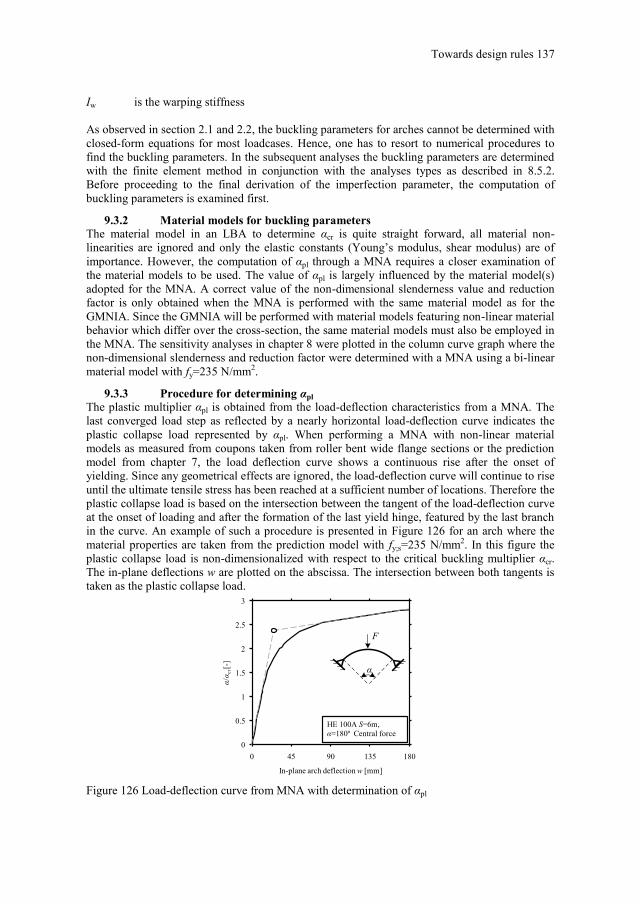
Towards design rules 137
Iw is the warping stiffness
As observed in section 2.1 and 2.2, the buckling parameters for arches cannot be determined with
closed-form equations for most loadcases. Hence, one has to resort to numerical procedures to
find the buckling parameters. In the subsequent analyses the buckling parameters are determined
with the finite element method in conjunction with the analyses types as described in 8.5.2.
Before proceeding to the final derivation of the imperfection parameter, the computation of
buckling parameters is examined first.
9.3.2 Material models for buckling parameters
The material model in an LBA to determine αcr is quite straight forward, all material non-
linearities are ignored and only the elastic constants (Young‟s modulus, shear modulus) are of
importance. However, the computation of αpl through a MNA requires a closer examination of
the material models to be used. The value of αpl is largely influenced by the material model(s)
adopted for the MNA. A correct value of the non-dimensional slenderness value and reduction
factor is only obtained when the MNA is performed with the same material model as for the
GMNIA. Since the GMNIA will be performed with material models featuring non-linear material
behavior which differ over the cross-section, the same material models must also be employed in
the MNA. The sensitivity analyses in chapter 8 were plotted in the column curve graph where the
non-dimensional slenderness and reduction factor were determined with a MNA using a bi-linear
material model with fy=235 N/mm2.
9.3.3 Procedure for determining αpl
The plastic multiplier αpl is obtained from the load-deflection characteristics from a MNA. The
last converged load step as reflected by a nearly horizontal load-deflection curve indicates the
plastic collapse load represented by αpl. When performing a MNA with non-linear material
models as measured from coupons taken from roller bent wide flange sections or the prediction
model from chapter 7, the load deflection curve shows a continuous rise after the onset of
yielding. Since any geometrical effects are ignored, the load-deflection curve will continue to rise
until the ultimate tensile stress has been reached at a sufficient number of locations. Therefore the
plastic collapse load is based on the intersection between the tangent of the load-deflection curve
at the onset of loading and after the formation of the last yield hinge, featured by the last branch
in the curve. An example of such a procedure is presented in Figure 126 for an arch where the
material properties are taken from the prediction model with fy;s=235 N/mm2. In this figure the
plastic collapse load is non-dimensionalized with respect to the critical buckling multiplier αcr.
The in-plane deflections w are plotted on the abscissa. The intersection between both tangents is
taken as the plastic collapse load.
0
0.5
1
1.5
2
2.5
3
0 45 90 135 180
α/α
cr [-
]
In-plane arch deflection w [mm]
HE 100A S=6m,
α=180º Central force
F
α
Figure 126 Load-deflection curve from MNA with determination of αpl

138 Structural properties and out-of-plane stability of roller bent steel arches
9.3.4 Discussion on the determination of αpl
A different procedure for the determination of αpl, with similar values of αcr and αult will induce a
change in the non-dimensional slenderness value and reduction factor and hence a „shift‟ in the
position of the numerical data points in the column curve diagram. Adopting different material
models for a MNA and GMNIA can lead to an erroneous calibration of a column curve.
Although using an elastic-perfectly plastic material law with a constant yield stress over the
cross-section in the determination of αpl does not result in a correct value of the slenderness or
reduction factor for roller bent arches, it does possess some advantages over using multiple non-
linear material curves similar to the GMNIA. For instance when employing an elastic-perfectly
plastic material law for arches under either uniform compression or uniform bending αpl is equal
to the plastic moment capacity and squash load of the cross-section, respectively. This means that
for these loadcases rather simple formulae can be used instead of a MNA.
9.3.5 Comparison in slenderness
Arches experience both compression and bending actions under the acting loads making the non-
dimensional slenderness definition less straightforward compared to beams or columns. Whether
compression or bending is the major action depends on the applied loading, boundary conditions
and geometry of the arch. For example when an arch is subjected to a vertical load uniformly
distributed along the horizontal projection of the arch the bending moment is low and
compression is high. On the other hand, the bending moment can be high and compression low
for an arch with a concentrated load applied at the crown. The compressive actions are higher for
arches with low rise-to-span ratios compared to arches with high rise-to-span ratios. An arch
under uniform bending or uniform compression represents the extremis of the internal load
distribution possible in an arch. An arch subjected to two opposite end moments is featured by
flexural action in the arch-rib only. Compressive action in the arch-rib is the only internal force
for a circular arch subjected to radially distributed loading.
0
0.2
0.4
0.6
0.8
1
1.2
0 1 2 3 4
red
uct
ion
fac
tor
[-]
non-dimensional slenderness [-]
0
0.2
0.4
0.6
0.8
1
1.2
0 1 2 3 4
red
uct
ion
fac
tor [-
]
non-dimensional slenderness [-]
ECCS column curve b
ECCS column curve d
ECCS column curve b
ECCS column curve d
HE 100A S=4.5m, α=135º HE 100A S=6m, α=135º
Uniform bending
Uniform compression
Uniform bending
Uniform compression
Figure 127 Slenderness for an out-of-plane fixed arch under uniform bending or uniform
compression.
Hence, the non-dimensional slenderness and reduction factor depend on the loading conditions,
keeping the boundary conditions, cross-sectional properties and arch geometry the same. By
investigating the slenderness of identical arches subjected to either uniform compression or
uniform bending the influence of the loading conditions on the slenderness is investigated. Figure
127 shows the difference in slenderness for identical arches of grade S235 subjected to either

Towards design rules 139
uniform compression or uniform bending. The underlying GMNIA and MNA were performed
with the prediction model of chapter 7 with fy;s=235 N/mm2. Arches subjected to uniform
bending have a lower slenderness value compared to an arch under uniform compression,
indicating that the latter is more susceptible to buckling. Also it can be seen that the reduction
factor for an arch under uniform bending is closer to column curve “b”, whereas column curve
“d” is more appropriate for arches under uniform compression. Hence, an arch under uniform
bending is less influenced by imperfections than an arch under uniform compression.
9.4 Discussion on material models
Before proceeding to a full derivation of the imperfection parameter curve and column curves for
freestanding arches, a small investigation is performed to outline the influence of material
properties and load cases on the imperfection parameter. The investigations are performed with
finite element simulations.
9.4.1 Use of nominal values for fy;s
The prediction model from chapter 7 produces 7 different stress-strain curves for nine zones of
the cross-section, based on the bending ratio (R/h) and the yield stress of the material prior to
cold bending (fy;s). The magnitude of fy;s determines the magnitude of the stress-strain curves to a
considerable extent. From the experimental results of coupons taken from straight sections it
became clear that for steel grade S235 there is a significant difference between nominal yield
stress (nominal=235 N/mm2) and measured yield stress (on average=290 N/mm2) prior to
forming. This phenomenon was less pronounced for steel grade S355 (nominal=355 N/mm2 vs.
measured on average=370 N/mm2). Naturally, choosing (averaged) measured values instead of
the nominal ones for fy;s will give higher stress-strain curves for roller bent sections. The degree
of roundness of the stress-strain curves is highly dependent on fy;s, keeping the bending ratio
fixed. Hence increasing fy;s will produce a substantial increase in the elastic-plastic buckling
resistance.
Exploiting the difference between the (averaged) measured yield stress and nominal yield stress
of the material prior to roller bending in the prediction model is considered inappropriate. The
yield stress of the material is not known in most cases and therefore one has to resort to nominal
values, serving as a lower bound value for fy;s. The column curves will be calibrated with the
prediction model in conjunction with nominal values for fy;s for steel grade S235 and steel grade
355.
Thirty-two arches are used to investigate the imperfection parameter sensitivity of roller bent
steel arches in uniform bending and 58 arches in uniform compression. These arches are further
divided into two groups: steel grade S235 and steel grade S355. The subtended angle varies
between 30 and 180 degrees. Each arch configuration is analyzed four times, employing different
material models, similarly as in section 8.7.3, with the exception that the plastic multiplier αpl is
determined with a MNA using an identical material model as for the GMNIA. The results are
summarized in Figure 128.
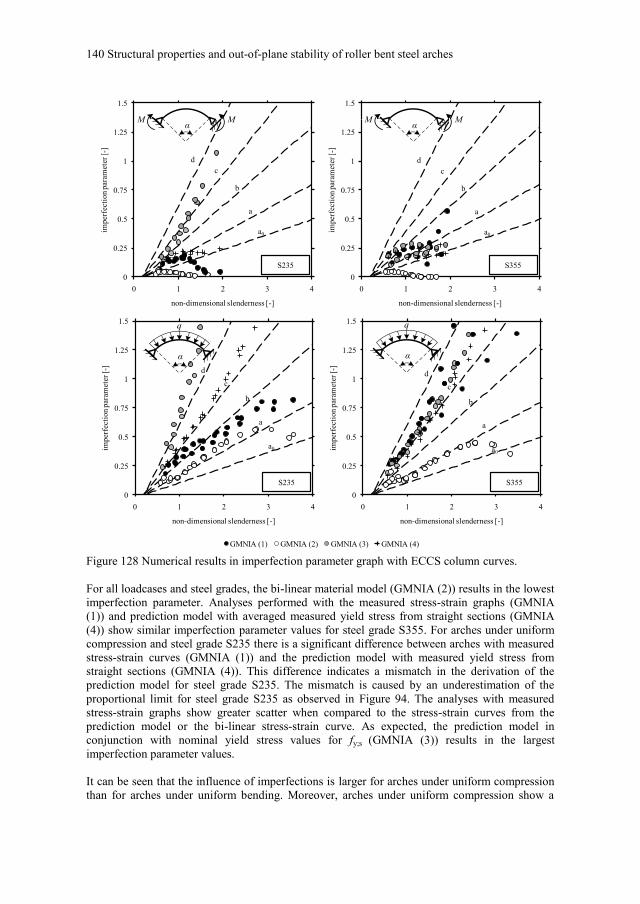
140 Structural properties and out-of-plane stability of roller bent steel arches
0
0.25
0.5
0.75
1
1.25
1.5
0 1 2 3 4
imper
fect
ion p
aram
eter
[-]
non-dimensional slenderness [-]
S235
0
0.25
0.5
0.75
1
1.25
1.5
0 1 2 3 4
imper
fect
ion p
aram
eter
[-]
non-dimensional slenderness [-]
S355
0
0.25
0.5
0.75
1
1.25
1.5
0 1 2 3 4
imper
fect
ion p
aram
eter
[-]
non-dimensional slenderness [-]
S235
0
0.25
0.5
0.75
1
1.25
1.5
0 1 2 3 4
imper
fect
ion p
aram
eter
[-]
non-dimensional slenderness [-]
S355
d
c
b
a
a0
d
c
b
a
a0
c
b
a
a0
c
b
a
a0
q
α
q
α
αM M
αM M
d d
GMNIA (1) GMNIA (2) GMNIA (3) GMNIA (4)
Figure 128 Numerical results in imperfection parameter graph with ECCS column curves.
For all loadcases and steel grades, the bi-linear material model (GMNIA (2)) results in the lowest
imperfection parameter. Analyses performed with the measured stress-strain graphs (GMNIA
(1)) and prediction model with averaged measured yield stress from straight sections (GMNIA
(4)) show similar imperfection parameter values for steel grade S355. For arches under uniform
compression and steel grade S235 there is a significant difference between arches with measured
stress-strain curves (GMNIA (1)) and the prediction model with measured yield stress from
straight sections (GMNIA (4)). This difference indicates a mismatch in the derivation of the
prediction model for steel grade S235. The mismatch is caused by an underestimation of the
proportional limit for steel grade S235 as observed in Figure 94. The analyses with measured
stress-strain graphs show greater scatter when compared to the stress-strain curves from the
prediction model or the bi-linear stress-strain curve. As expected, the prediction model in
conjunction with nominal yield stress values for fy;s (GMNIA (3)) results in the largest
imperfection parameter values.
It can be seen that the influence of imperfections is larger for arches under uniform compression
than for arches under uniform bending. Moreover, arches under uniform compression show a
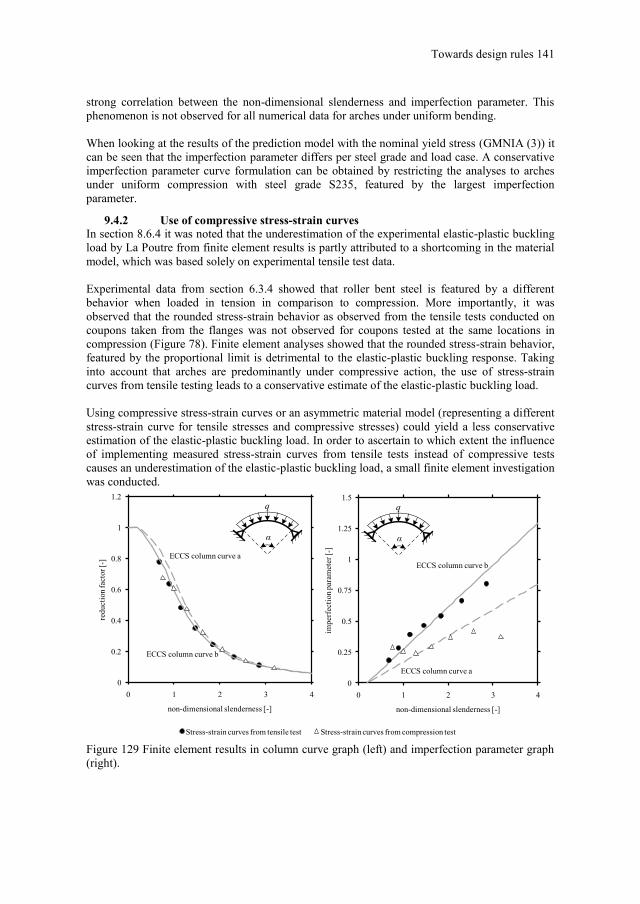
Towards design rules 141
strong correlation between the non-dimensional slenderness and imperfection parameter. This
phenomenon is not observed for all numerical data for arches under uniform bending.
When looking at the results of the prediction model with the nominal yield stress (GMNIA (3)) it
can be seen that the imperfection parameter differs per steel grade and load case. A conservative
imperfection parameter curve formulation can be obtained by restricting the analyses to arches
under uniform compression with steel grade S235, featured by the largest imperfection
parameter.
9.4.2 Use of compressive stress-strain curves
In section 8.6.4 it was noted that the underestimation of the experimental elastic-plastic buckling
load by La Poutre from finite element results is partly attributed to a shortcoming in the material
model, which was based solely on experimental tensile test data.
Experimental data from section 6.3.4 showed that roller bent steel is featured by a different
behavior when loaded in tension in comparison to compression. More importantly, it was
observed that the rounded stress-strain behavior as observed from the tensile tests conducted on
coupons taken from the flanges was not observed for coupons tested at the same locations in
compression (Figure 78). Finite element analyses showed that the rounded stress-strain behavior,
featured by the proportional limit is detrimental to the elastic-plastic buckling response. Taking
into account that arches are predominantly under compressive action, the use of stress-strain
curves from tensile testing leads to a conservative estimate of the elastic-plastic buckling load.
Using compressive stress-strain curves or an asymmetric material model (representing a different
stress-strain curve for tensile stresses and compressive stresses) could yield a less conservative
estimation of the elastic-plastic buckling load. In order to ascertain to which extent the influence
of implementing measured stress-strain curves from tensile tests instead of compressive tests
causes an underestimation of the elastic-plastic buckling load, a small finite element investigation
was conducted.
0
0.25
0.5
0.75
1
1.25
1.5
0 1 2 3 4
imp
erfe
ctio
n p
aram
eter
[-]
non-dimensional slenderness [-]
0
0.2
0.4
0.6
0.8
1
1.2
0 1 2 3 4
red
uct
ion
fac
tor
[-]
non-dimensional slenderness [-]
ECCS column curve a
ECCS column curve b
ECCS column curve a
ECCS column curve b
q
α
q
α
Stress-strain curves from tensile test Stress-strain curves from compression test
Figure 129 Finite element results in column curve graph (left) and imperfection parameter graph
(right).

142 Structural properties and out-of-plane stability of roller bent steel arches
A number of HE 100A arches with steel grade S235, with a fixed bending ratio of 19.89 was
selected. The arches were examined with two different material models: the measured stress-
strain curves from tensile tests and the measured stress-strain curves from compression tests. The
arch was loaded under uniform compression, so the difference in elastic-plastic buckling load
between stress-strain curves from tensile and compression is demonstrated to its greatest extent.
The finite element results are presented in the imperfection parameter graph in addition to the
column curve graph, see Figure 129.
From this it can be seen that implementing stress-strain curves based on compression tests may
lead to a higher elastic-plastic buckling load. The finite element results based on tensile test data
reveal that column curve “b” is appropriate; column curve “a” is more suitable for the finite
element analyses with compressive test data.
9.4.3 Resume
In this section an investigation on the influence of material models on the imperfection parameter
was performed. The prediction model together with nominal values for fy;s will be adopted to
generate the stress-strain curves for the finite element models. Although this model has been
carefully calibrated in chapter 7 it suffers from a number of conservative assumptions:
The rounded stress-strain curve as observed in the tensile tests on coupons taken from
the flanges was incorporated in the prediction model. This rounded curve is detrimental
to the elastic-plastic buckling response. The stress-strain curves from compressive tests
did not show this rounded curve, indicating that the prediction model is conservative
since it assumes gradual yielding behavior for both compressive and tensile loading.
The proportional limit in the stress-strain curves for steel grade S235 is underestimated
due to lack of accuracy of the prediction model, as illustrated in Figure 94. The
proportional limit is more accurately predicted for steel grade S355.
9.5 Design rules
Column curves are proposed based on the finite element analyses, as presented in the
imperfection parameter graph. Four different loadcases are examined: uniform bending, uniform
compression, central load at the crown and uniformly distributed load. The imperfection
parameter expressions are presented first.
9.5.1 Numerical results in imperfection parameter graph
The imperfection parameter curves for arches under uniform bending and uniform compression
for steel grade S235 and S355 are presented in Figure 130. The finite element results are
retrieved from Figure 128, GMNIA (3).

Towards design rules 143
0
0.5
1
1.5
2
0 1 2 3 4
imper
fect
ion p
aram
eter
[-]
non-dimensional slenderness [-]
S235
0
0.5
1
1.5
2
0 1 2 3 4
imper
fect
ion p
aram
eter
[-]
non-dimensional slenderness [-]
S355
0
0.5
1
1.5
2
0 1 2 3 4
imper
fect
ion p
aram
eter
[-]
non-dimensional slenderness [-]
S235
0
0.5
1
1.5
2
0 1 2 3 4
imper
fect
ion p
aram
eter
[-]
non-dimensional slenderness [-]
S355
ECCS column curve a
Imperfection parameter curve
ECCS column curve dECCS column curve d
Imperfection parameter
curve
ECCS column curve a
ECCS column curve d
ECCS column curve a
Imperfection parameter curve
ECCS column curve a
ECCS column curve d
Imperfection parameter
curve
q
α
q
α
αM M
αM M
Figure 130 Imperfection parameter graphs for steel grade S235 and steel grade S355, for arches
under uniform bending and uniform compression load in addition to numerical results.

144 Structural properties and out-of-plane stability of roller bent steel arches
Figure 131 shows the imperfection parameter graph with numerical results, taken from arches
under a central load applied at the crown and uniformly distributed load for steel grade S235 and
steel grade 355.
0
0.25
0.5
0.75
1
1.25
1.5
0 1 2 3 4
imper
fect
ion p
aram
eter
[-]
non-dimensional slenderness [-]
S235
ECCS Column curve a
ECCS Column curve d
Imperfection parameter
curve
F
α
0
0.25
0.5
0.75
1
1.25
1.5
0 1 2 3 4im
per
fect
ion
par
amet
er [-]
non-dimensional slenderness [-]
S355
ECCS Column curve a
ECCS Column curve d
Imperfection parameter
curve
F
α
0
0.25
0.5
0.75
1
1.25
1.5
0 1 2 3 4
imper
fect
ion p
aram
eter
[-]
non-dimensional slenderness [-]
ECCS Column curve d
ECCS Column curve a
S235
Imperfection
parameter curve
q
α
0
0.25
0.5
0.75
1
1.25
1.5
0 1 2 3 4
imper
fect
ion p
aram
eter
[-]
non-dimensional slenderness [-]
ECCS Column curve d
ECCS Column curve a
S355 Imperfection
parameter curve
q
α
Figure 131 Imperfection parameter graphs for steel grade S235 and steel grade S355, for arches
under a central load and uniformly distributed load in addition to numerical results.
The suggested imperfection parameter is displayed by the black lines. Depending on the load
case and steel grade a newly defined imperfection parameter curve is chosen. The imperfection
parameter expression for the four different load cases and two different steel grades are tabulated
in Table 27. Depending on the distribution of the numerical data a linear or parabolic
imperfection parameter has been selected.

Towards design rules 145
Table 27 Proposed imperfection parameter ε.
Load case Steel grade S235 Steel grade S355
Central load 0.63 0.11 20.30 0.99 0.23
Uniformly distributed load 1.03 0.38 0.48 0.14
Uniform bending 0.69 0.31 0.17
Uniform compression 1.82 1.22 0.71 0.31
9.5.2 Column curves
The column curves for prediction of the out-of-plane stability of roller bent steel arches are
obtained by inserting the imperfection parameter formulation given in Table 27 into the column
curve equation (52) employing equation (59). The final column curves for steel grade S235 and
S355 for four different loadcases are presented in Figure 132.
0
0.2
0.4
0.6
0.8
1
1.2
0 1 2 3 4
reduct
ion fac
tor [-
]
non-dimensional slenderness [-]
ECCS column curve a0
0
0.2
0.4
0.6
0.8
1
1.2
0 1 2 3 4
redu
ctio
n f
acto
r [-
]
non-dimensional slenderness [-]
S235 S355
ECCS column curve d
ECCS column curve a0
ECCS column
curve d
Central load at crown Uniform bending
Uniform compression Uniformly distributed load
Figure 132 Column curves for arches under various loading conditions for steel grade S235 (left)
and steel grade S355 (right).
9.6 Conclusions
A design rule to check the out-of-plane stability for freestanding roller bent arches was proposed.
The out-of-plane elastic-plastic buckling load can be estimated by inserting the non-dimensional
arch slenderness in the column curve formulation.
Using the multipliers from the different finite element analyses (αult, αpl and αcr), the elastic-
plastic buckling loads were plotted in a so-called imperfection parameter graph, which expresses
the relationship between the imperfection parameter and non-dimensional slenderness. Plotting
the finite element results in the imperfection parameter graph instead of the column curve graph
allows for a more accurate proposal for the final column curve. An equation for the imperfection
parameter was proposed based on these numerical results and substituted in the column curve
formulation.

146 Structural properties and out-of-plane stability of roller bent steel arches
From the finite element data it was found that the influence of imperfections is dependent on type
of loading and steel grade. Therefore eight column curves were proposed for two different steel
grades and four different load cases: a central load at the crown, a uniformly distributed load, two
opposite end moments and a radially distributed load.
The proposed design rule shows strong similarities with the current design rules for columns and
beams failing by buckling. The non-dimensional slenderness, featured by the in-plane plastic
capacity and elastic buckling load, however, must be determined using numerical methods for
most loadcases.
10 Conclusions & Recommendations In this chapter the conclusions and recommendations are given. The conclusions and
recommendations are subdivided into three distinct parts of the research as outlined in chapter 1
(Figure 24).
10.1 Conclusions
Residual stresses in roller bent wide flange sections
Residual stress measurements were conducted on roller bent wide flange sections, bent about
their major axis. In addition finite element analyses were performed to estimate residual stresses
in roller bent wide flange sections. Based on the experimental and finite element approach the
following conclusions are drawn with respect to residual stresses in roller bent wide flange
sections:
A theoretical model to estimate residual stresses in cold bent sections, based on a
simply supported beam loaded and unloaded by uniform bending, cannot be used for
roller bent wide flange sections, since this model is an oversimplification.
Residual stresses in roller bent wide flange sections differ significantly from residual
stresses in hot-rolled and welded sections.
A finite element model, taking into account contact interaction between beam and
roller bending machine, geometrical non-linearities and material non-linearities, is able
to replicate the experimentally obtained residual stresses with reasonable-to-good
accuracy.
A residual stress model for roller bent wide flange sections was proposed for
implementation in finite element models. Based on the finite element calculations it is
suggested that the residual stress model is unaffected by the size of the wide flange
sections and bending ratio (ratio between bending radius and nominal section height)
but shows strong coherence with the yield stress of the straight material.
Mechanical properties of roller bent wide flange sections
Coupons were cut from both straight reference sections and roller bent wide flange sections at
different locations over the cross-section and loaded until fracture in a tensile test set-up. Based
on the stress-strain curves from the tensile tests, the following mechanical properties could be
monitored over the cross-section: the proportional limit, yield stress, ultimate tensile stress, strain
at ultimate tensile stress and strain at fracture. Subtracting the mechanical properties of the
coupons taken from straight reference sections from those of their roller bent counterparts
revealed the net influence of the roller bending process which allowed the following conclusions
to be drawn:
The change in mechanical properties due to roller bending is neither uniformly nor
linearly distributed over the cross-section and varies significantly with steel grade.
The influence of the roller bending process is strongly related to the bending ratio of
the arch; the alterations in mechanical properties are more pronounced for arches with
a smaller bending ratio than for arches with a larger bending ratio.

148 Structural properties and out-of-plane stability of roller bent steel arches
The size of the section does not influence the alterations of the mechanical properties.
The experimental results were collated and analyzed to arrive at a prediction model. The
following conclusions can be drawn:
A prediction model is proposed to obtain stress-strain curves in nine different zones of
a roller bent wide flange section. By substituting the yield stress of the material prior to
cold forming and the bending ratio into the prediction model, 7 stress-strain curves can
be obtained, representing the material properties of a roller bent arch in 9 different
zones.
It was found that the yield stress and ultimate tensile stress in roller bent sections can
be determined within 20 % error.
For the strain at ultimate tensile stress and strain at fracture, the proposed equations
provide results within approximately 30 % error.
The proportional limit curve can be estimated with errors around 40 %.
Out-of-plane structural stability behavior of roller bent wide flange sections
A finite element model composed of shell elements was constructed in the ANSYS v. 11.0
environment. The finite element model was validated against earlier performed experiments. The
influence of residual stresses, material model from the prediction model and geometric
imperfections on the out-of-plane elastic buckling response was investigated by means of
sensitivity analyses. The conclusions with respect to the finite element model are summarized as
follows:
It was observed that the finite element model was able to replicate the experimental
out-of-plane elastic-plastic buckling response with reasonable-to-good accuracy.
Discrepancies were attributed to uncertainties in the material model and approximation
of the cross-section by shell elements.
The effect of geometrical imperfections and mechanical properties from roller bending
on the out-of-plane elastic-plastic buckling strength is significant for freestanding
arches. The residual stress distribution as a result of the roller bending process has less
influence on the out-of-plane elastic-plastic buckling response.
After performing a parametric study and plotting the finite element output in an imperfection
parameter graph, the relationship between the non-dimensional slenderness and the imperfection
parameter was obtained. Using linear regression analyses, an expression was proposed for the
imperfection parameter. These expressions were substituted into the existing ECCS column curve
formulation to arrive at column curves for roller bent arches.
Due to the large scatter in the finite element results, column curves were proposed per
investigated load case for steel grade S235 and S355. It was found that imperfections
are most detrimental for arches under uniform compression for steel grade S235.
The column curve can be used as an efficient tool to estimate the elastic-plastic out-of-
plane buckling resistance, provided the non-dimensional slenderness of the arch is
known. Since no closed-form solutions for the elastic critical load and plastic collapse

Conclusions and recommendations 149
load are available to calculate the non-dimensional slenderness for most loadcases,
these must be determined with finite element analyses.
10.2 Recommendations
Residual stresses in roller bent wide flange sections
The numerical model to predict the residual stresses in roller bent sections can be improved by
performing cyclic tests on straight steel specimens to determine the Bauschinger effect in wide
flange sections. Subsequently the obtained material characteristics, the number of forming passes
and an actual flange support force can be modeled to reduce the discrepancies between
experimental and numerical residual stresses in the web. It is suggested that a modified model
can be created in the explicit finite element environment in order to overcome any convergence
difficulties associated with multiple pass bending with the implicit code.
Mechanical properties of roller bent wide flange sections
When observing the accuracy of the prediction model, it can be seen that for steel grade S235 the
proportional limit in the flanges of roller bent wide flange sections is significantly
underestimated. This induces a conservative value of the proportional limit in the stress-strain
curves for the flanges and influences the structural response of the arch. It is recommended that
the expression for the proportional limit is enhanced by performing more tensile tests on coupons
taken from the flanges of roller bent wide flange sections.
The limited number of compression tests performed on coupons taken from roller bent wide
flange sections showed a different response compared to the coupons tested in tension. It is
therefore recommended that more compression tests be performed on coupons taken from roller
bent wide flange sections in order to investigate this phenomenon more thoroughly. Furthermore
the data collected from the compression tests should be incorporated in the prediction model,
rendering two different curves for tension and compression.
Compression tests on roller bent steel may give only limited information on the structural
response of steel. Cyclic tests on coupons taken from roller bent sections in general may
overcome this problem and provide more insight into the material behavior.
Out-of-plane structural stability behavior of roller bent wide flange sections
The recommendations on the improvement of the prediction model should be implemented in the
finite element model to capture the out-of-plane elastic-plastic buckling response. Currently most
commercial FE codes do not have material behavior options available which allow the material to
be represented by a different characteristic under tension and compression. Although ANSYS has
a limited number of material behavior options which allow the definition of a different
tension/compression characteristic for ductile materials these options suffer from a number of
restrictions, making them not suitable to represent the stress-strain curves of roller bent steel. An
asymmetric material model is available, to model different yield stress under tension and
compression. However, this model cannot be combined with residual stresses and is limited to bi-
linear stress-strain curves, thereby not suitable to described gradual yielding materials.
In order to incorporate the material behavior in FE models other than through the available
material behavior options, ANSYS offers the possibility to implement a user material option
based on the so-called USER MATerial subroutine (USERMAT) which is an ANSYS user-
programmable feature. When adopting the USERMAT a constitutive material model with a
different response under tension and compression can be implemented in ANSYS. It is therefore
recommended to adopt the USERMAT material behavior option for implementation in ANSYS.

150 Structural properties and out-of-plane stability of roller bent steel arches
The ultimate load of freestanding arches failing by out-of-plane buckling can be obtained by
inserting the non-dimensional slenderness into the column curve formulation. The non-
dimensional slenderness is the square root of the in-plane plastic capacity divided by the out-of-
plane elastic buckling load. Closed-form expressions for these buckling parameters are lacking
for most load cases. It is recommended that in future research closed-form expressions are
derived, by which the structural engineer can make a close estimation of the non-dimensional
slenderness. These closed-form expressions should be based on mechanical models rather than
extensive finite element analyses together with curve-fitting techniques.
All presented analyses concerning the out-of-plane structural stability behavior of roller bent
steel arches were based on fixed values for imperfections, loads, etc., rendering deterministic
limit load values. A point of attention for future research lays in the variability of these
imperfections and their influence on the limit load. Preferably the current finite element analyses
are supplemented with so-called Monte Carlo Simulations. A Monte Carlo simulation involves
repeated analyses, using in each analysis randomly generated variables obtained from probability
distributions. The output can give information concerning the mean performance of arches and
overall uncertainties, allowing the suggestion of appropriate safety factors for inclusion in prEN
1990 [97].

References [1] Abdel-Rahman N and Sivakumaran KS. Material Properties Models for Analysis of
Cold-Formed Steel Members. Journal of Structural Engineering ASCE
1997;123(9):1135-1143.
[2] Alpsten G. Residual stresses, yield stress, and the column strength of hot-rolled and
roller-straightened steel shapes. IABSE reports of the working commissions
1975;23:39-59.
[3] Alwood TA. What engineers should know about bending steel. Modern Steel
Construction 2006;(5).
[4] Anon. Glanzende Ribbenkast. Bouwen met Staal 1999;147:10-11.
[5] Anon. Olympian feat. Arch Rev 2004;6:28-.
[6] Anon. Werelds Aureool. Bouwen met Staal 2007;195:6-7.
[7] ANSYS guide. ANSYS structural analysis guide ANSYS release 11.0:ANSYS Inc.;
2009.
[8] Ashraf M, Gardner L, and Nethercot DA. Strength enhancement of the corner regions
of stainless steel cross-sections. Journal of Constructional Steel Research 2005;61:37-
52.
[9] Ashraf M, Gardner L, and Nethercot DA. Finite element modelling of structural
stainless steel cross-sections. Thin-Walled Structures 2010;44(10):1048-1062.
[10] Bassett MB and Johnson J. The bending of plate using a three-roll pyramid type plate
bending machine. Journal of Strain Analysis 1966;1(5):398-414.
[11] Beedle LS and Tall L. Basic Column Strength. Transactions of the ASCE
1962;127:138-179.
[12] Beer H and Schulz G. The European column curves. IABSE reports of the working
commissions 1975;23:385-398.
[13] Beg D and Hladnik L. Eigenspannungen bei geschweissten I-profilen aus hochfesten
Stahlen. Stahlbau 1994;63(5):134-139.
[14] Bennett D. Australia Stadium: for the Olympics and beyond. The Structural Engineer
2000;78(16):11-14.
[15] Bergmeister K, Capsoni A, Corradi L, and Menardo A. Lateral Elastic Stability of
Slender Arches for Bridges Including Deck Slenderness. Structural Engineering
International 2009;19(2):149-154.

152 Structural properties and out-of-plane stability of roller bent steel arches
[16] Betegon Biempica C, del Coz Diaz JJ, Garcia Nieto PJ, and Penuelas Sanchez I.
Nonlinear analysis of residual stresses in a rail manufacturing process by FEM.
Applied Mathematical Modelling 2009;33:34-53.
[17] Bjorhovde R. Cold Bending of Wide-Flange Shapes for Construction. Engineering
Journal 2006;43(4):271-286.
[18] Boks M. Staalconstructie Broadgate phase 11. Bouwen met Staal 1989;90:11-17.
[19] Bradford MA and Pi Y-L. Flexural-torsional buckling of fixed steel arches under
uniform bending. Journal of Constructional Steel Research 2006;62:20-26.
[20] Bradford MA and Pi Y-L. Elastic flexural-torsional instability of structural arches
under hydrostatic pressure. Int.J.Mech.Sci. 2008;50:143-151.
[21] Chajes A, Britvec SJ, and Winter G. Effects of Cold-Straining on Structural Sheet
Steels. Journal of the Structural Division-ASCE 1963;1-32.
[22] Chakrabarty J. Theory of Plasticity:McGraw-Hill; 1988.
[23] Clark GM and Eyre J. The Gateshead Millenium Bridge. The Structural Engineer
2001;79(3):30-35.
[24] Cohn MZ and Abdel-Rohman M. Analysis up to collapse of elasto-plastic arches.
Comput.Struct. 1976;6:511-517.
[25] Cornforth RC and Childs SB. Computer Analysis of two-hinged circular arches.
J.Struct.Div. 1967;93(2):319-338.
[26] Cruise RB and Gardner L. Residual stress analysis of structural stainless steel sections.
Journal of Constructional Steel Research 2008;64(3):352-366.
[27] Cruise RB and Gardner L. Strength enhancements induced during cold forming of
stainless steel sections. Journal of Constructional Steel Research 2008;64(11):1310-
1316.
[28] Curran P. Gateshead Millenium Bridge, UK. Structural Engineering International
2003;13(4):214-216.
[29] Daddi I, Mazzolani FM. Determinazione sperimentale delle imperfezioni strutturali nei
profilati di acciaio:Universita degli studi di Napoli istituto di tecnica delle costruzioni;
1971.
[30] del Coz Diaz JJ, Rodriguez Mazon F, Garcia Nieto PJ, and Suarez Dominguez FJ.
Design and finite element analysis of a wet cycle cement rotary kiln. Finite elements in
analysis and design 2002;39(1):17-42.
[31] Delrue SF. Out-of-plane stability of steel arches. MSc-thesis:Technische Universiteit
Eindhoven; 1998.

References 153
[32] ECCS. Manual on stability of steel structures - ECCS Committee 8 Stability: 1976.
[33] EN 10002-1. Metallic materials - tensile testing - Part 1: Method of test at ambient
temperature:CEN European Committee Standardization; 2001.
[34] EN 10025. Hot rolled products of non-alloy structural steels. Technical delivery
conditions.:CEN European Committee Standardization; 1993.
[35] EN 1993-1-1. Eurocode 3. Design of steel structures, general rules and rules for
buildings:CEN European Committee for Standardization; 2004.
[36] EN 1993-2. Eurocode 3 - Design of Steel Structures - Part 2: Steel Bridges:CEN
European Committee for Standardization; 2006.
[37] Finstermann G, Fischer FD, Shan G, and Schleinzer G. Residual stresses in rails due to
roll straightening. Steel Research 1998;69(7):272-278.
[38] Fukasawa Y. The buckling of circular arches by lateral flexure and torsion under axial
thrust. Trans.Japan Soc.Civ.Engrs 1963;96:29-47.
[39] Gandhi AH and Raval HK. Analytical and emperical modeling of top roller position for
three-roller cylindrical bending of plates and its experimental verification. Journal of
Materials Processing Technology 2008;197:268-278.
[40] Gardner L and Ashraf M. Structural design for non-linear metallic materials.
Engineering Structures 2006;28(6):926-934.
[41] Gardner L and Cruise RB. Modeling of Residual Stresses in Structural Stainless Steel
Sections. Journal of Structural Engineering ASCE 2009;135(1):42-53.
[42] Gardner L and Nethercot DA. Experiments on Stainless steel hollow sections-Part 1:
Material and cross-sectional behaviour. Journal of Constructional Steel Research
2004;60:1291-1318.
[43] Gardner L and Nethercot DA. Numerical Modeling of Stainless Steel Structural
Components - A consistent Approach. J Struc Eng-ASCE 2004;130(10):1586-1601.
[44] Hansen NE and Jannerup O. Modeling of elastic-plastic bending of beams using a
roller bending machine. Journal of Engineering for Industry Transactions of the ASME
1979;101(3):304-310.
[45] Hayashi T. Handbook of Structural Stability:Corona Publishing Company, Ltd.; 1971.
[46] Hendry AW. The Plastic Design of Two-pinned Mild Steel Arch Ribs. Civil
Engineering and Public Works Review 1952;47:38-41.
[47] Hill HN. Determination of stress-strain relations from the offset yield strength values,
Technical Note No. 927, National Advisory Committee for Aeronautics, Washington
D.C.: 1944.

154 Structural properties and out-of-plane stability of roller bent steel arches
[48] Hill R. The Mathematical Theory of Plasticity:Oxford University Press; 1950.
[49] Huber AW and Beedle LS. Residual Stress and the Compressive Strength of Steel.
Welding Journal Research Supplement 1954;33(12):589-615.
[50] Jez-Gala C. Residual Stresses in Rolled I sections. Proceedings of the Institution of
Civil Engineers 1962;23(3):361-378.
[51] Jordet EA and Jakobsen SE. The Svinesund Bridge, Norway/Sweden. Structural
Engineering International 2007;17(4):309-313.
[52] Kang YJ and Yoo CH. Thin-Walled Curved Beams. I: Formulation of Nonlinear
Equations. J.Engrg.Mech., ASCE 1994;120(10):2072-2101.
[53] Kang YJ and Yoo CH. Thin-Walled Curved Beams. II: Analytical Solutions for
Buckling of Arches. J.Engrg.Mech., ASCE 1994;120(10):2102-2125.
[54] Karren KW. Corner Properties of Cold-formed Steel Shapes. Journal of the Structural
Division-ASCE 1967;93(1):401-432.
[55] Karren KW and Winter G. Effects of Cold-forming on Light-gage Steel Members.
Journal of the Structural Division-ASCE 1967;93(1):433-469.
[56] Kato B and Aoki H. Residual Stresses in Cold-formed Tubes. Journal of Strain
Analysis 1978;13(4):193-204.
[57] Key PW and Hancock GJ. A theoretical investigation of the column behavior of cold-
formed square hollows sections. Thin-Walled Structures 1993;16(1-4):31-64.
[58] Key PW, Hasan SW, and Hancock GJ. Column behavior of cold-formed hollows
sections. Journal of Structural Engineering ASCE 1988;114(2):390-407.
[59] Kim M-Y, Min B-C, and Suh M-W. Spatial Stability of Nonsymmetric Thin-Walled
Curved Beams. I: Analytical Approach. J.Engrg.Mech., ASCE 2000;126(5):497-505.
[60] Kim M-Y, Min B-C, and Suh M-W. Spatial Stability of Nonsymmetric Thin-Walled
Curved Beams. II: Numerical Approach. J.Engrg.Mech., ASCE 2000;126(5):506-514.
[61] King C, Brown D. Design of Curved Steel:The Steel Construction Institute; 2001.
[62] Komatsu S and Sakimoto T. Nonlinear analysis of spatial frames consisting of
members with closed cross-sections. Proc.Japan Soc.Civ.Engrs 1976;252:143-157.
[63] Komatsu S and Sakimoto T. Ultimate load carrying capacity of steel arches. Journal of
the Structural Division 1977;103(12):2323-2336.
[64] Kurobane Y, Ogawa K, and Ochi K. Recent research developments in the design of
tubular structures. Journal of Constructional Steel Research 1989;13(2-3):169-188.

References 155
[65] La Poutre DB. Inelastic spatial stability of circular wide flange steel arches. Ph.D.
thesis.:Eindhoven University of Technology.; 2004.
[66] La Poutre DB. Stability experiments on circular steel arches: Research Report No O-
2004.3:Technische Universiteit Eindhoven; 2004.
[67] La Poutre DB. In-plane stability of circular steel arches with variable subtanded angles.
Proceedings of the annual SSRC annual stability conference, 2007.
[68] La Poutre DB, Snijder HH. In-plane stability of semicircular steel arches loaded in
bending and compression. Proceedings of the annual SSRC annual stability conference,
2006.
[69] Lay MG and Ward R. Residual stresses in steel sections. Journal of the Australian
Institute of Steel Construction 1969;3(3):2-21.
[70] Lim N-H and Kang YJ. Out of plane stability of circular arches. Int.J.Mech.Sci.
2004;46:1115-1137.
[71] Mairs D. York Millenium Bridge, A Footbridge with an Inclined Arch, UK. Structural
Engineering International 2001;11(3):172-174.
[72] Mas E and Massonet Ch. Part prise par la belgique dans les recherches experimentales
de la convention europeenne des associations de la construction metallique sur le
flambement centriques des barres en acier doux. Acier-Stahl-Steel 1966;9:393-400.
[73] Mazzolani FM. Buckling curves of hot-rolled steel shapes with structural
imperfections. IABSE reports of the working commissions 1975;23:152-161.
[74] Mirambell E and Real E. On the calculation of deflections in structural stainless steel
beams: an experimental and numerical investigation. Journal of Constructional Steel
Research 2000;54(1):109-133.
[75] Moen CD, Igusa T, and Schafer BW. Prediction of residual stresses and strains in cold-
formed steel members. Thin-Walled Structures 2010;46(11):1274-1289.
[76] Moon-Young K, Sung-Bo K, and Nam-Il K. Spatial stability of shear deformable
curved beams with non-symmetic thin-walled sections. I: Stability formulation and
closed-form solutions. Comput.Struct. 2005;83:2525-2541.
[77] Namita Y. Die Theorie II. Ordnung von krummen Stablen und ihre Anwendung auf das
Kipp-Problem des Bogentragers. Trans.Japan Soc.Civ.Engrs 1968;155:32-41.
[78] Nazmy AS. Stability and load-carrying capacity of three-dimensional long-span steel
arch bridges. Computers & Structures 2011;65(6):857-868.
[79] NEN-EN 10002-1. Metalen - Trekproef - Deel 1: Beproevingsmethoden bij
omgevingstemperatuur:Nederlands Normalisatie Instituut; 2001.

156 Structural properties and out-of-plane stability of roller bent steel arches
[80] O'Connor C. Residual stresses and their influence on structural design. Journal of the
Institution of Engineers, Australia 1955;27(12):313-321.
[81] Onat ET and Prager W. Limit Analysis of Arches. Journal of the Mechanics and
Physics and Solids 1953;1:77-89.
[82] Papangelis JP and Trahair NS. Flexural-Torsional Buckling of Arches. J Struc Eng-
ASCE 1987;133(4):889-906.
[83] Papangelis JP and Trahair NS. Flexural-torsional buckling tests on arches. J Struc Eng-
ASCE 1987;113(7):1433-1443.
[84] Pi Y-L and Bradford MA. Elasto-plastic buckling and postbuckling of arches subjected
to a central load. Computers & Structures 2003;81(8):1811-1825.
[85] Pi Y-L and Bradford MA. Effects of prebuckling deformations on the elastic flexural
torsional buckling of laterally fixed arches. Int.J.Mech.Sci. 2004;46(2):321-342.
[86] Pi Y-L and Bradford MA. Elastic flexural-torsional buckling of fixed arches.
Q.J.Mech.Appl.Math. 2004;57(4):551-569.
[87] Pi Y-L and Bradford MA. Out-of-Plane Strength Design of Fixed Steel I-section
Arches. Journal of Structural Engineering ASCE 2005;131(4):560-568.
[88] Pi Y-L, Bradford MA, and Tin-Loi F. In-plane Strength of Steel Arches. Advanced
Steel Construction 2008;4(4):306-322.
[89] Pi Y-L, Bradford MA, and Tong G-S. Elastic lateral-torsional buckling of circular
arches subjected to a central concentrated load. Int.J.Mech.Sci. 2010;52(6):847-862.
[90] Pi Y-L, Bradford MA, Trahair NS, and Chen YY. A further study of flexural-torsional
buckling of elastic arches. International Journal of Structural Stability and Dynamics
2005;5(2):163-183.
[91] Pi Y-L, Papangelis JP, and Trahair NS. Prebuckling deformations and flexural-
torsional buckling of arches. Journal of Structural Engineering ASCE
1995;121(9):1313-1322.
[92] Pi Y-L and Trahair NS. Nonlinear inelastic analysis of steel beam-columns. I: Theory.
Journal of Structural Engineering ASCE 1994;121(9):2041-2061.
[93] Pi Y-L and Trahair NS. Nonlinear inelastic analysis of steel beam-columns. II:
Applications. Journal of Structural Engineering ASCE 1994;121(9):2062-2085.
[94] Pi Y-L and Trahair NS. Three-dimensional nonlinear analysis of steel arches.
Engineering Structures 1996;18(1):49-63.
[95] Pi Y-L and Trahair NS. Out-of-Plane Inelastic Buckling and Strength of Steel Arches.
Journal of Structural Engineering ASCE 1998;124(2):174-183.

References 157
[96] Pi Y-L and Trahair NS. Inelastic lateral buckling strength and design of steel arches.
Engineering Structures 2000;22(8):993-1005.
[97] prEN 1990. Eurocode - Basis for structural design:CEN European Committee for
Standardization; 2001.
[98] Quach WM, Teng JG, and Chung KF. Residual stresses in steel sheets due to coiling
and uncoiling: a closed-form analytical solution. Engineering Structures
2004;26(9):1249-1259.
[99] Quach WM, Teng JG, and Chung KF. Finite element predictions of residual stresses in
press-braked thin-walled steel sections. Engineering Structures 2006;28(11):1609-
1619.
[100] Quach WM, Teng JG, and Chung KF. Residual stresses in press-braked stainless steel
sections, I: Coiling and uncoiling of sheets. Journal of Constructional Steel Research
2009;65(8-9):1803-1815.
[101] Quach WM, Teng JG, and Chung KF. Residual stresses in press-braked stainless steel
sections, II: Press-braking operations. Journal of Constructional Steel Research
2009;65(8-9):1816-1826.
[102] Rajasekaran S and Padmanabhan S. Equations of curved beams. J.Engrg.Mech.ASCE
1989;115(5):1094-1111.
[103] Ramberg W, Osgood WR. Determination of stress-strain curves by three parameters.
Technical note no. 503, National Advisory Committee on Aeronautics (NACA): 1941.
[104] Rasmussen KJR. Full-range stress-strain curves for stainless steel alloys. Journal of
Constructional Steel Research 2003;59(1):47-61.
[105] Rasmussen KJR, Burns T, Bezkorovainy P, and Bambach MR. Numerical modeling of
stainless steel plates in compression. Journal of Constructional Steel Research
2003;59:1345-1362.
[106] Rasmussen KJR and Hancock GJ. Design of Cold-Formed Stainless Steel Tubular
Member I: Columns. Journal of Structural Engineering ASCE 1993;119(8):2349-2367.
[107] Rasmussen KJR and Rondal J. Strength Curves for Metal Columns. Journal of
Structural Engineering ASCE 1997;123(6):721-728.
[108] Rasmussen KJR and Rondal J. Column curves for stainless steel alloys. Journal of
Constructional Steel Research 2000;54(1):89-107.
[109] Rasmussen KJR and Rondal J. Strength curves for aluminium alloy columns.
Engineering Structures 2000;23(11):1505-1517.

158 Structural properties and out-of-plane stability of roller bent steel arches
[110] Ringsberg JW and Lindback T. Rolling contact fatigue analysis of rails including
numerical simulations of the rail manufacturing process and repeated wheel-rail contact
loads. International Journal of Fatigue 2010;25(6):547-558.
[111] Rossi B, Degee H, and Pascon F. Enhanced mechanical properties after cold process of
fabrication of non-linear metallic profiles. Thin-Walled Structures 2009;47(12):1575-
1589.
[112] Sakata T and Sakimoto T. Experimental study on the out-of-plane buckling strength of
steel arches with open cross-section. Proc.Japan Soc.Civ.Engrs 1990;416:101-112.
[113] Sakimoto T and Komatsu S. Ultimate strength formula for central-arch-girder bridges.
Proc.Japan Soc.Civ.Engrs 1983;333:183-186.
[114] Sakimoto T and Komatsu S. Ultimate Strength Formula for Steel Arches. J Struc Eng-
ASCE 1983;109:613-627.
[115] Sakimoto T and Sakata T. The Out-of-plane Buckling Strength of Through-type Arch
Bridges. Journal of Constructional Steel Research 1990;16:307-318.
[116] Sakimoto T, Sakata T, and Tsuruta E. Elasto-plastic out-of-plane buckling strength of
through type and half-through type arch bridges. Proc.Japan Soc.Civ.Engrs
1989;410:137-148.
[117] Sakimoto T, Yamao T, and Komatsu S. Experimental study on the ultimate strength of
steel arches. Proceedings of the Japanese Society of Civil Engineers 1979;286:139-149.
[118] Schleinzer G and Fischer FD. Residual stresses in new rails. Materials Science and
Engineering A 2000;288(2):280-283.
[119] Schleinzer G and Fischer FD. Residual stress formation during the roller straightening
of railway rails. International Journal for Mechanical Sciences 2001;43:2281-2295.
[120] Schlim R. Effect of Bending on Mechanical Properties of Sections: Technical
Report:ARBED Centre de Recherches; 1987.
[121] Seddeik MM and Kennedy JB. Deformations in hollow structural section (HSS)
members subjected to cold-bending. International Journal of Mechanical Sciences
1987;29:195-212.
[122] Spoorenberg RC, Snijder HH, and Hoenderkamp JCD. Experimental investigation of
residual stresses in roller bent wide flange steel sections. Journal of Constructional
Steel Research 2010;66(6):737-747.
[123] Spoorenberg RC, Snijder HH, and Hoenderkamp JCD. Finite element simulations of
residual stresses in roller bent wide flange sections. Journal of Constructional Steel
Research 2011;67(1):39-50.

References 159
[124] Spoorenberg RC, Snijder HH, and Hoenderkamp JCD. Mechanical properties of roller
bent wide flange sections - part 1: experimental investigation. Journal of Constructional
Steel Research 2011;submitted for publication.
[125] Spoorenberg RC, Snijder HH, and Hoenderkamp JCD. Mechanical properties of roller
bent wide flange sections - part 2: prediction model. Journal of Constructional Steel
Research 2011;submitted for publication.
[126] Spoorenberg RC, Snijder HH, and Hoenderkamp JCD. Proposed residual stress model
for roller bent wide flange steel sections. Journal of Constructional Steel Research
2011;67(6):992-1000.
[127] Steiner G and Wagner P. Die Svinesundbrucke. Stahlbau 2005;74(2):73-86.
[128] Stevens LK. Carrying Capacity of Mild-steel Arches. Proceedings of the Institution of
Civil Engineers 1957;6:493-514.
[129] Szalai J and Papp F. A new residual stress distribution for hot-rolled I-shaped sections.
Journal of Constructional Steel Research 2005;61(6):845-861.
[130] Tall L and Alpsten G. On the scatter in yield strength and residual stresses in steel
members. IABSE reports of the working commissions 1969;4:151-163.
[131] Tan Z, Li B, and Persson B. On Analysis and Measurement of Residual Stresses in the
Bending of Sheet Metals. International Journal of Mechanical Sciences
1994;36(5):483-491.
[132] Timoshenko SP. Strength of Materials. Part II Advanced Theory and Problems:D. Van
Nostrand Company, Inc.; 1940.
[133] Timoshenko SP, Gere JM. Theory of Elastic Stability:McGraw-Hill; 1961.
[134] Trahair NS, Pi Y-L, Clarke MJ, and Papangelis JP. Plastic Design of Steel Arches.
Advances in Structural Engineering 1997;1(1):1-9.
[135] Usami T and Koh SY. Large displacement theory of thin-walled curved members and
its application to lateral-torsional buckling analysis of circular arches. I 1980;16:71-95.
[136] Vacharajittiphan P and Trahair NS. Flexural-Torsional Buckling of Curved Members.
J.Struct.Div. 1975;101(6):1223-1238.
[137] Vlasov VZ. Thin-walled Elastic Beams:Israel Program for Scienftic Translations Ltd;
1961.
[138] Weisenberger G. Bending in the right direction. Modern Steel Construction 2007;(5).
[139] Welo T, Paulsen F, and Brobak TJ. The Behaviour of Thin-Walled, Aluminium Alloy
Profiles in Rotary Draw Bending - A Comparison between Numerical and
Experimental Results. Journal of Materials Processing Technology 1994;45:173-180.

160 Structural properties and out-of-plane stability of roller bent steel arches
[140] Weng CC and Pekoz T. Residual Stresses in Cold-Formed Steel Members. Journal of
Structural Engineering ASCE 1990;116(6):1611-1625.
[141] Weng CC and White RN. Residual Stresses in Cold-bent Thick Steel Plates. Journal of
Structural Engineering ASCE 1990;116(1):24-39.
[142] Wilson D. Alfred McAlpine Stadium, Huddersfield UK. Structural Engineering
International 1999;9(3):189-190.
[143] Woertman S. Architectonisch Feestje. de Architect 2007;7:48-51.
[144] Yang M and Shima S. Simulation of pyramid type three-roll bending process.
International Journal of Mechanical Sciences 1988;30(12):877-886.
[145] Yang M, Shima S, and Watanabe T. Model-based Control for Three-Roll Bending
Process of Channel Bar. Journal of Engineering for Industry Transactions of the ASME
1990;112:346-351.
[146] Yang Y-B and Kuo S-R. Static Stability of Curved Thin-Walled Beams.
J.Engrg.Mech., ASCE 1986;112(8):821-841.
[147] Yoo CH. Flexural-Torsional Stability of Curved Beams. J.Engrg.Mech.Div.
1982;108(6):1351-1369.
[148] Young BW. Residual stresses in hot rolled members. IABSE reports of the working
commissions 1975;23:25-38.
[149] Ziemian RD. Guide to Stability Design Criteria for Metal Structures:John Wiley &
Sons; 2010.

Appendix 161
Appendix A Design example
In this section a worked example is presented. This worked example shows the influence of the
roller bending process on the mechanical properties of the material and gives the stress-strain
curves for a roller bent wide flange section. Possible issues for numerical implementation are
outlined.
A HE 200A with steel grade S235 is bent into a radius of 5 m. The bending ratio (R/h) equals:
5/0.19=31.6. Per zone the strength parameters can be determined. The strength parameters are
tabulated in Table 28. The nominal yield stress is 235 N/mm2. The full stress-strain curves based
on these strength parameters are given in Figure 133. The strain at fracture (εu;r) as given in 7th
column is not part of the stress-strain curves.
Table 28 Strength parameters for a HE 200A bent into radius of 5m, for steel grade S235,
fy;s=235 N/mm2. Strength
parameters fp;r
[N/mm2] fy;r
[N/mm2] ft;r
[N/mm2] εt;r [-] εu;r [-] n [-] E0.2
[N/mm2] m [-]
Equation: (30) (28) (32) (34) (36) (39) (41) (42)
Zone C-value
(Table 13)
I 0.91 87.3 256 396 0.199 0.345 2.78 37401 3.58
II 2.98 197 322 445 0.147 0.277 6.07 23440 2.57
III -1.18 34.3 212 356 0.234 0.391 1.65 48776 4.25
IV 2.23 147 295 425 0.169 0.305 4.30 29268 2.99
V 1.02 n/a 259 398 0.197 0.342 n/a n/a n/a
VI 0.000 n/a 235 377 0.216 0.367 n/a n/a n/a
VII 1.93 n/a 285 418 0.176 0.315 n/a n/a n/a
It can be seen that the prediction model gives full stress-strain curves for different locations over
the cross-section. These full stress-strain curves can be implemented into finite element models
serving as the initial state of a roller bent arch. Depending on the adopted finite element code, the
stress-strain curves must be converted to a multi-linear material law. Such a multi-linear model
approximates the stress-strain curve by a piece-wise linear relationship. It is mentioned that the
predictions render an engineering stress-strain curve, without making any allowance for possible
geometric effects. When confronted with structural analyses involving large strains, the proposed
stress-strain model must be converted into a true-stress-logarithmic strain model.

162 Structural properties and out-of-plane stability of roller bent steel arches
0
100
200
300
400
500
600
0 0.005 0.01 0.015 0.02
Str
ess
[N/m
m2]
Strain [-]
I II III
IV V VI
VII
0
100
200
300
400
500
600
0 0.05 0.1 0.15 0.2 0.25 0.3
Str
ess
[N/m
m2]
Strain [-]
I II III
IV V VI
VII
Figure 133 Stress-strain curves for the different zones, initial stage (left) and full curve (right).

Appendix 163
Appendix B Permanent deformation verification finite element
model
-60
-50
-40
-30
-20
-10
0
10
0 45 90 135 180
Per
man
ent l
ater
al d
efo
rmat
ion
vp
erm
[mm
]
Subtended Angle [º]
-40
-20
0
20
40
0 45 90 135 180
Per
man
ent r
adia
l def
orm
atio
n w
perm
[mm
]
Subtended Angle [º]
-6
-4
-2
0
2
4
6
0 45 90 135 180
Per
man
ent t
wis
t def
orm
atio
n δ
perm
[º]
Subtended Angle [º]
Test 1A
Test 1A
Test 1A
-10
0
10
20
30
40
50
0 45 90 135 180P
erm
anen
t lat
eral
def
orm
atio
n v
perm
[mm
]
Subtended Angle [º]
-40
-20
0
20
40
0 45 90 135 180
Per
man
ent r
adia
l def
orm
atio
n w
perm
[mm
]
Subtended Angle [º]
-4
-2
0
2
4
0 45 90 135 180
Per
man
ent t
wis
t def
orm
atio
n δ
perm
[º]
Subtended Angle [º]
Test 1B
Test 1B
Test 1B
-60-50-40-30-20-10
010
0 45 90 135 180
Per
man
ent l
ater
al
def
orm
atio
n [
mm
]
Subtended Angle [º]
Finite element method Experiment

164 Structural properties and out-of-plane stability of roller bent steel arches
-60
-50
-40
-30
-20
-10
0
10
0 45 90 135 180
Per
man
ent l
ater
al d
efo
rmat
ion
vp
erm
[mm
]
Subtended Angle [º]
-40
-20
0
20
40
0 45 90 135 180
Per
man
ent r
adia
l def
orm
atio
n w
perm
[mm
]
Subtended Angle [º]
-6
-4
-2
0
2
4
6
0 45 90 135 180
Per
man
ent t
wis
t def
orm
atio
n δ
perm
[º]
Subtended Angle [º]
Test 1C
Test 1C
Test 1C
-10
0
10
20
30
40
0 40 80 120 160
Per
man
ent l
ater
al d
eform
atio
n v
perm
[mm
]
Subtended Angle [º]
-40
-20
0
20
40
0 40 80 120 160
Per
man
ent r
adia
l def
orm
atio
n w
perm
[mm
]
Subtended Angle [º]
-4
-2
0
2
4
0 40 80 120 160
Per
man
ent t
wis
t def
orm
atio
n δ
perm
[º]
Subtended Angle [º]
Test 2A
Test 2A
Test 2A
-60-50-40-30-20-10
010
0 45 90 135 180
Per
man
ent l
ater
al
def
orm
atio
n [
mm
]
Subtended Angle [º]
Finite element method Experiment

Appendix 165
-10
0
10
20
30
40
50
0 40 80 120 160
Per
man
ent l
ater
al d
eform
atio
n v
perm
[mm
]
Subtended Angle [º]
-40
-20
0
20
40
0 40 80 120 160
Per
man
ent r
adia
l def
orm
atio
n w
perm
[mm
]
Subtended Angle [º]
-4
-2
0
2
4
0 40 80 120 160
Per
man
ent t
wis
t def
orm
atio
n δ
perm
[º]
Subtended Angle [º]
Test 2B
Test 2B
Test 2B
-10
0
10
20
30
40
50
0 33.75 67.5 101.25 135
Per
man
ent l
ater
al d
efo
rmat
ion
vp
erm
[mm
]
Subtended Angle [º]
-40
-20
0
20
40
0 33.75 67.5 101.25 135
Per
man
ent r
adia
l def
orm
atio
n w
perm
[mm
]
Subtended Angle [º]
-4
-2
0
2
4
0 33.75 67.5 101.25 135
Per
man
ent t
wis
t def
orm
atio
n ζ
perm
[º]
Subtended Angle [º]
Test 3A
Test 3A
Test 3A
-60-50-40-30-20-10
010
0 45 90 135 180
Per
man
ent l
ater
al
def
orm
atio
n [
mm
]
Subtended Angle [º]
Finite element method Experiment

166 Structural properties and out-of-plane stability of roller bent steel arches
-10
0
10
20
30
40
50
0 33.75 67.5 101.25 135
Per
man
ent l
ater
al d
efo
rmat
ion
vp
erm
[mm
]
Subtended Angle [º]
-40
-20
0
20
40
0 33.75 67.5 101.25 135
Per
man
ent r
adia
l def
orm
atio
n w
perm
[mm
]
Subtended Angle [º]
-4
-2
0
2
4
0 33.75 67.5 101.25 135
Per
man
ent t
wis
t def
orm
atio
n δ
perm
[º]
Subtended Angle [º]
Test 3B
Test 3B
Test 3B
-70
-60
-50
-40
-30
-20
-10
0
10
0 27.5 55 82.5 110
Per
man
ent l
ater
al d
efo
rmat
ion
vp
erm
[mm
]
Subtended Angle [º]
-40
-20
0
20
40
0 27.5 55 82.5 110
Per
man
ent r
adia
l def
orm
atio
n w
perm
[mm
]
Subtended Angle [º]
-6
-4
-2
0
2
4
6
0 27.5 55 82.5 110
Per
man
ent t
wis
t def
orm
atio
n δ
perm
[º]
Subtended Angle [º]
Test 4A
Test 4A
Test 4A
-60-50-40-30-20-10
010
0 45 90 135 180
Per
man
ent l
ater
al
def
orm
atio
n [
mm
]
Subtended Angle [º]
Finite element method Experiment

Appendix 167
-60
-50
-40
-30
-20
-10
0
10
0 27.5 55 82.5 110
Per
man
ent l
ater
al d
eform
atio
n v
perm
[mm
]
Subtended Angle [º]
-40
-20
0
20
40
0 27.5 55 82.5 110
Per
man
ent r
adia
l def
orm
atio
n w
perm
[mm
]
Subtended Angle [º]
-6
-4
-2
0
2
4
6
0 27.5 55 82.5 110
Per
man
ent t
wis
t def
orm
atio
n δ
perm
[º]
Subtended Angle [º]
Test 4B
Test 4B
Test 4B
-10
0
10
20
30
40
50
60
70
80
0 22.5 45 67.5 90
Per
man
ent l
ater
al d
efo
rmat
ion
vp
erm
[mm
]
Subtended Angle [º]
-60
-40
-20
0
20
40
60
0 22.5 45 67.5 90
Per
man
ent r
adia
l def
orm
atio
n w
perm
[mm
]
Subtended Angle [º]
-8
-6
-4
-2
0
2
4
6
8
0 22.5 45 67.5 90
Per
man
ent t
wis
t def
orm
atio
n δ
perm
[º]
Subtended Angle [º]
Test 5A
Test 5A
Test 5A
-60-50-40-30-20-10
010
0 45 90 135 180
Per
man
ent l
ater
al
def
orm
atio
n [
mm
]
Subtended Angle [º]
Finite element method Experiment
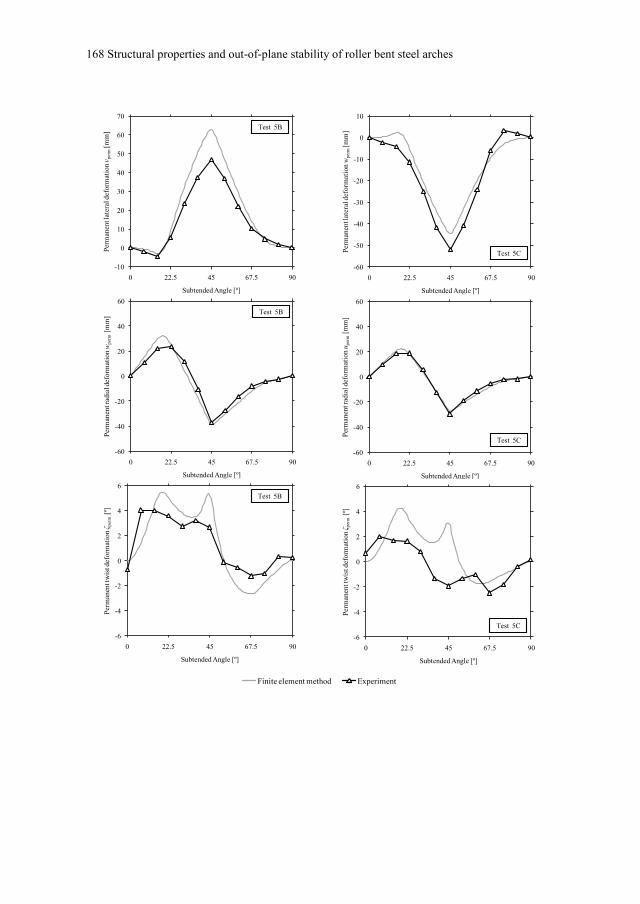
168 Structural properties and out-of-plane stability of roller bent steel arches
-10
0
10
20
30
40
50
60
70
0 22.5 45 67.5 90
Per
man
ent l
ater
al d
efo
rmat
ion
vp
erm
[mm
]
Subtended Angle [º]
-60
-40
-20
0
20
40
60
0 22.5 45 67.5 90
Per
man
ent r
adia
l def
orm
atio
n w
perm
[mm
]
Subtended Angle [º]
-6
-4
-2
0
2
4
6
0 22.5 45 67.5 90
Per
man
ent t
wis
t def
orm
atio
n δ
perm
[º]
Subtended Angle [º]
Test 5B
Test 5B
Test 5B
-60
-50
-40
-30
-20
-10
0
10
0 22.5 45 67.5 90
Per
man
ent l
ater
al d
eform
atio
n w
perm
[mm
]
Subtended Angle [º]
-60
-40
-20
0
20
40
60
0 22.5 45 67.5 90
Per
man
ent r
adia
l def
orm
atio
n u
perm
[mm
]
Subtended Angle [º]
-6
-4
-2
0
2
4
6
0 22.5 45 67.5 90
Per
man
ent t
wis
t def
orm
atio
n δ
perm
[º]
Subtended Angle [º]
Test 5C
Test 5C
Test 5C
-60-50-40-30-20-10
010
0 45 90 135 180
Per
man
ent l
ater
al
def
orm
atio
n [
mm
]
Subtended Angle [º]
Finite element method Experiment

Appendix 169
Appendix C Back calculation of FE results
Equation (52) can be rewritten as:
2 2- 1 (64)
Isolating the expression in the root
2 2 1 (65)
Squaring both sides gives:
22 2 21 2 (66)
Bringing 2 2 to the right sides gives:
2 20 1 2 (67)
And
2 22 1 (68)
And then:
2 212
(69)
Utilizing equation(53) and (58) gives:
22 20.5 1 12
(70)
This can be simplified into:
2 2 21 1 (71)
The imperfection factor of the finite element data can be obtained by inserting equation (50) and
equation (51) in (71).

Curriculum Vitae
Personal data
Roeland Christiaan (Roel) Spoorenberg
Venbergsemolen 95
5612 DX Eindhoven
e-mail: [email protected]
Date of birth: July 13th 1983
Place of birth: Nijmegen, The Netherlands
Nationality: Dutch
Professional Education
1995 – 2000: Secondary School NSG Nijmegen, HAVO, Diploma in 2000
2000 – 2004: Polytechnic Avans Hogeschool ‟s Hertogenbosch, Bachelor Degree in Built
Environment in 2004
2004 – 2007: Eindhoven University of Technology, Eindhoven, Master Degree in Architecture
Building and Planning in 2007.
Work experience
2007 – 2011: Ph.D. candidate, Eindhoven University of Technology, Department of Architecture,
Building and Planning, Unit of Structural Design and Construction Technology.