structural models for nbn deployment. karl-heinz neumann paper.pdfstructural models for nbn...
TRANSCRIPT

WIK •
Structural models for NBN deployment
Paper presented at the Eleventh ACCC Regulatory Conference
“Market Structure Revisited”
Surfers Paradise 29-30 July 2010
Author: Dr. Karl-Heinz Neumann
WIK Scientific Institute for Infrastructure and Communication Services
Rhöndorfer Str. 68 53604 Bad Honnef
Germany


Structural models for NBN deployment I
Contents
Introduction 1
1 The economics of NGA 2
1.1 Profitability and replicability of NGA – Model results for six European countries 2
1.2 The economics of a multi-fibre deployment 12
2 The European approach 22
2.1 Market development 22
2.2 The European Community approach 28
2.2.1 Digital Agenda for Europe 29
2.2.2 The NGA Recommendation 30
2.2.3 State Aid Guidelines 34
3 The NBN approach in worldwide perspective 37
3.1 Role of the state 37
3.2 Objectives and roll-out plan 38
3.3 Investment and architecture 41
3.4 Competition and open access 43
3.5 Cost benefit analysis 44
4 Demand as a success factor for ultra-fast broadband 50
References 52

Structural models for NBN deployment 1
Introduction
Governments around the world have announced plans for ultra-fast National Broadband Networks (NBN). While these plans typically involve the use of fibre to deploy new ac-cess networks, deployment patterns and architectures are of considerable diversity. Operators, in particular incumbent telcos, seem to be less enthusiastic about large scale fibre investment. When they invest in fibre access networks, they seem to be more driven by the challenge of cable operators and fibre projects of alternative opera-tors than by their own favourable business expectations regarding NBN.
The reluctance of many operators to make large scale investments into NGA networks follows from uncertainties about the profitability of fibre access networks at the current level of willingness to pay of users for advanced communications networks. Further-more, pervasive capital market imperfections make it difficult even for large incumbent operators to mobilize the considerable financial resources necessary for a large scale NGA roll-out. The time horizon of the capital market and the management of publicly listed telcos does not seem to support large scale new infrastructure investment in a competitive market.
Many governments seem to be convinced that the social value of a larger scale de-ployment of fibre access networks will exceed the private value of users and operators which define the market incentives to invest in NGA networks. That is why they try to accelerate the NGA deployment process by formulating targets, measures to reduce deployment costs, providing public funds and even by taking over the operator respon-sibility.
Before this background this paper is organized as follows: Section 1 deals with the ba-sic economic characteristics of NGA and the profitability and replicability of NGA net-works in particular. Section 2 gives a flavour on the European approach towards NGA with particular reference to measures taken or planned at the European level. Section 3 puts the Australian NBN approach into a worldwide perspective. The paper concludes with a few and tentative remarks on demand as a success factor for ultra-fast broad-band development.
2 Structural models for NBN deployment
1 The economics of NGA
1.1 Profitability and replicability of NGA – Model results for six European countries
Around the world various stakeholders of the telecommunications market are trying to find out how viable the roll-out of fibre networks is and to what degree fibre networks are even replicable by several operators. We have developed a generic business model to assess the viability of next generation access business models and the potential for national coverage of NGA.1 For six European countries (Germany, France, Sweden, Portugal, Italy, Spain) the model provides empirical evidence on the viability of replica-tion of VDSL/FTTC infrastructure as well as of the deployment of FTTB/H infrastructure. The model generates the profitable deployment area and the degree of replicability of fibre networks. We also show the impact of regulatory measures like duct and dark fibre access, fibre loop and sub-loop unbundling on the replicability of NGA roll-out and com-petition.
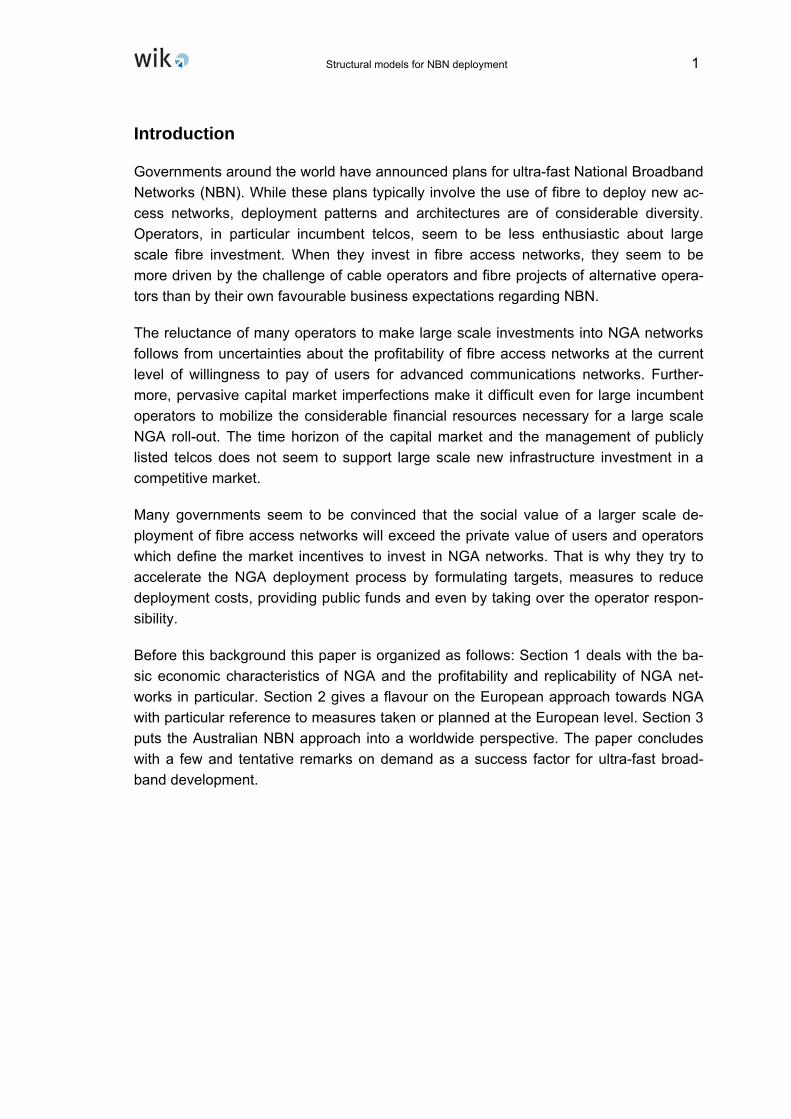
Our basic modelling approach relies upon the long-run incremental cost (LRIC) ap-proach in a bottom-up manner. We model the total cost of the services considered un-der efficient network cost conditions, taking into account the cost of all network ele-ments needed to produce these services. The modelling approach is long-term. We assume an advanced state of network and broadband service development in which 80% of all subscribers to fixed telecommunications receive double and triple play ser-vices. This is higher than the take-up of these services today, but is considered a rea-sonable expectation over the horizon of an investment decision. Where the cost curve cuts the revenue line (average revenue per user per month), the business becomes profitable or the operator achieves a market rate of return (see Figure 1-1). This point determines the critical market share necessary to become profitable. This is our model target output because the profitability of NGA strongly depends on the market share reached and on the penetration rate of homes connected to the network. In order to calculate the critical market share we make a steady state assumption, taking a time in the future where the NGA business already is developed and ignore any ramp up cost.
1 The model and its results are documented in Elixmann et. al. (2008).
Structural models for NBN deployment 3
Figure 1-1: Determination of the critical market share for a single cluster: illus-tration
AR
PU
0 €
10 €
20 €
30 €
40 €
50 €
60 €
70 €
80 €
90 €
100 €
0% 10%
20%
30%
40%
50%
60%
70%
80%
90%
market share
Total cost per subscriber and month (cluster 7)
Average revenue per subscriber and month in €
Total cost per subscriber and month, urban cluster
Average revenue per subscriber and month in €
Market share
Source: WIK-C
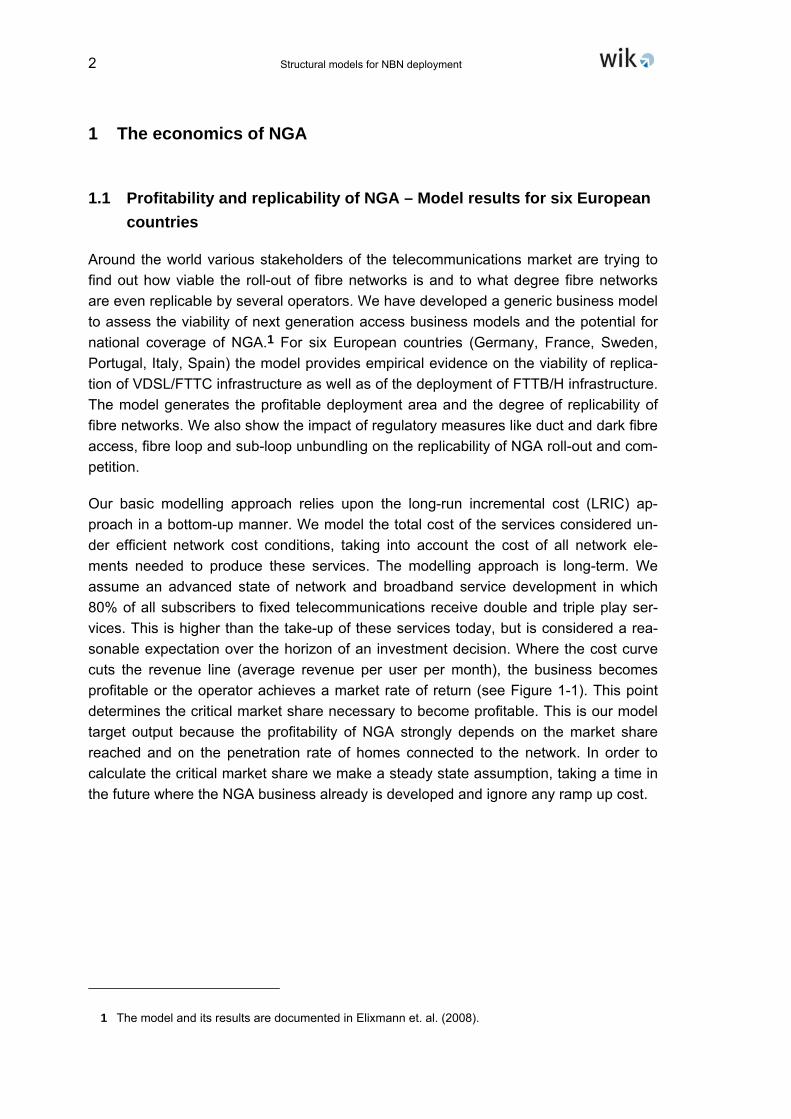
We have structured the model to calculate fibre deployment for eight coverage areas or “clusters” in each country defined by subscriber density with the expectation that the cost of NGA deployment depends on density (see Table 1-1).
Table 1-1: Model specification: Clusters of subscriber densities
Geotype Cluster Subscriber density per km2 (1) Dense Urban > 10.000 (2) Urban > 6.000 Urban (3) Less Urban > 2.000 (4) Dense Urban > 1.500 (5) Suburban > 1.000 Suburban (6) Less Suburban > 500 (7) Dense Rural > 100 Rural (8) Rural ≤ 100
Source: WIK-C

4 Structural models for NBN deployment
The market share concept we use indicates shares of all households and businesses (potential subscribers) which may include households without fixed connections (e.g. mobile-only users) or with cable services.
The basic approach we take is greenfield. We assume that all network elements needed for NGA have to be newly invested, including civil works. Incumbents and to some extent utilities may have the ability of using existing infrastructure like ducts or buildings which lowers the investment requirements of NGA compared to the results presented here.
On the basis of the business model we have developed the following results based on the quantitative approach covering Germany, France, Sweden, Portugal, Spain and Italy:
1. We modelled three architectural approaches for NGA, FTTC-VDSL, FTTH-PON and FTTH-P2P. In general, their profitability (in terms of coverage and critical mar-ket share to be achieved) is ranked in the order above; the most profitable is VDSL, followed by PON and then by P2P. This ranking does not consider whether the dif-ferent capabilities support high bandwidth, are future proof and/or ease an unbun-dling approach. Likewise, it does not consider the possible degree of replicability in the case of fibre SLU/ LLU. 2
2. The costs of an access network infrastructure depend on the population density of the area served. Therefore we define clusters of the same line density per country and calculate the profitability for each cluster independently. The results confirmed our basic assumption: the denser populated the more profitable the NGA business in that area. NGA deployment requires significant investments. The following Table 1-2 shows the investment per home passed in the various NGA architectures de-rived from our model.
2 VDSL might not be a suitable solution for broadband access networks due to technical or operational restrictions. On the one hand, a major amount of copper sub-loops (e.g. 25%) is longer than 1 km (like in France with an average sub-loop length of 750m) the bandwidth on these lines is reduced to ADSL or even less, unsuitable for high speed broadband transmission. On the other hand, the street cabi-nets do not allow to disseminate the heat of the active equipment (the DSLAMs) or only at prohibitive costs.
Structural models for NBN deployment 5
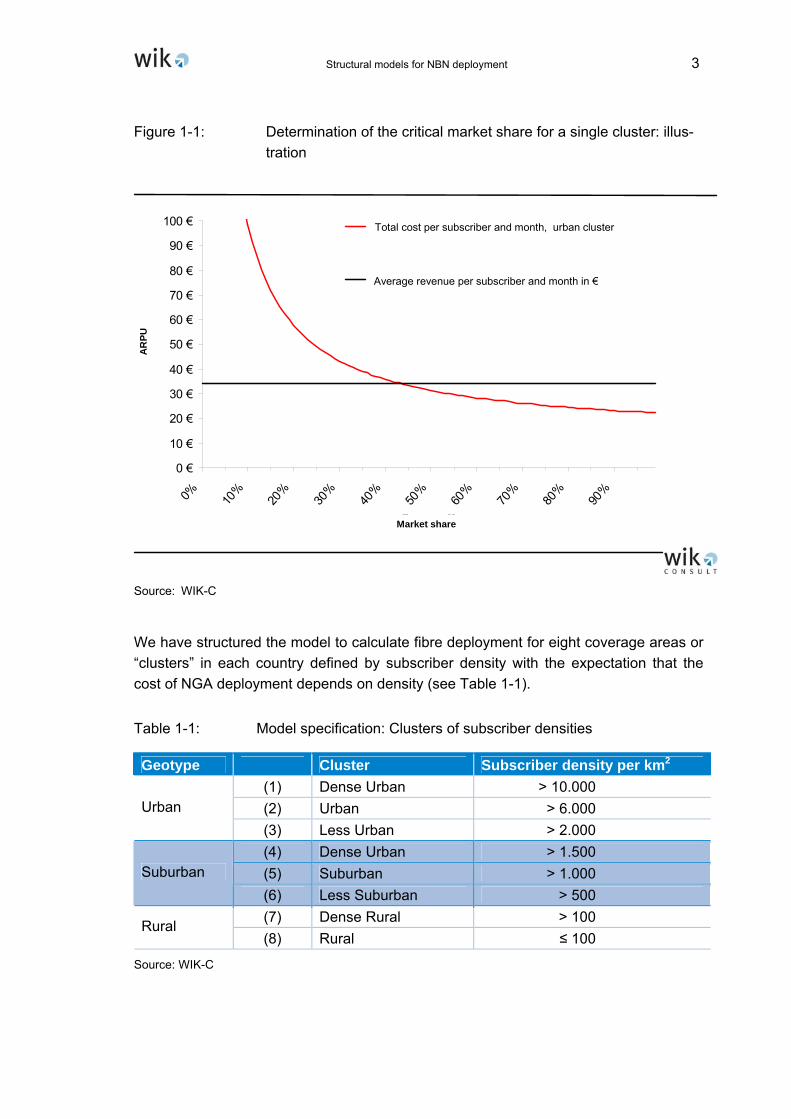
Table 1-2: Investment per home passed (in Euro), urban cluster, stand-alone first mover*
VDSL
PON
P2P
* Based on the investment of the urban cluster. No consideration of inhouse cabling and CPE.
859 504919 930 530 776
100 190
793 619 393 616 714 389
201 n.v. 149 82
Network Type
Country [in €]
DE FR SE PT ES IT
Source: WIK-C
3. The investment per home passed in the case of a stand-alone operator (not being the incumbent, without regulatory measures) connecting all homes in the viable clusters differs from country to country and is increasing from cluster to cluster. Table 1-2 presents the investment per home passed in the urban cluster across all countries as an example3. The figures do not include investment for CPE or in-house cabling since this investment will be conducted only if the customer is con-nected to the network.
The difference between the VDSL and the FTTH stand-alone architectures is mainly caused by the fact that the distribution cable segment in VDSL does not have to be invested; rather, it is rented via copper SLU. Portugal in general is cheaper in its construction costs, which is reflected in the investment requirements. Sweden has the shortest distribution cable length in the urban and less urban clus-ter, respectively. The effect of an attractively priced existing infrastructure can be observed in Italy (Socrate) and France. However, in France this effect is compen-sated by the long access lines.
The VDSL investment is the highest in Germany, followed by Italy, Sweden, Spain and Portugal. A comparison between Germany and Portugal points out that the in-vestment in civil engineering is remarkably higher in Germany than in Portugal. In Portugal the digging cost per trench metre is relatively low and the same holds for the number of street cabinets which, in turn, determines the required number of trenches linking each street cabinet to the metro core location. Both parameters tend to decrease the investment in civil engineering. Another aspect for the differ-ence between the two countries is the average number of subscribers per street cabinet which is higher in Portugal. In combination with a slightly lower investment per street cabinet it leads to half the per-subscriber investment in Germany.
3 We have chosen the stand-alone case as a basis for comparison because it is defined by the lowest share of rented infrastructure and therefore it eliminates additional sources of differences between the countries. For the same reason we just have chosen a cluster of similar population density instead of calculating averages across all viable clusters, because these values are, besides others, influenced by the different ARPUs. For Sweden we have taken the less urban instead of the urban cluster, re-flecting that population density starts with less urban.

6 Structural models for NBN deployment
If the roll-out focuses on FTTH-PON, an Italian operator can expect the lowest in-vestment per home passed. On the contrary, the investment will be highest for a German operator. It is about two times higher than in Italy. The difference mainly results from the Socrate network. The Italian operator rents these existing ducts for about half of its required infrastructure and since the rent is considered as Opex it does not contribute to the investment value. De facto the investment figures in Italy are not comparable to those of the other countries. The same holds true of France where the investment level is in-between the two countries. Similar to Italy, the French operators use existing infrastructure (sewer systems) to some extent. How-ever, the systems only partly exist in the urban cluster which we consider for the in-vestment analysis, so beside renting ducts the operator has also to take into ac-count own civil engineering work. However, the use of sewers leads to an invest-ment which is lower than in Germany, but which is at about the level expected in Portugal.
An operator deploying FTTH-P2P faces highest investment in France. The invest-ment in Germany is slightly lower due to the lower length of the distribution cables which is about two thirds of the level in France. Italy is the best place to deploy P2P at least if investment is considered only.
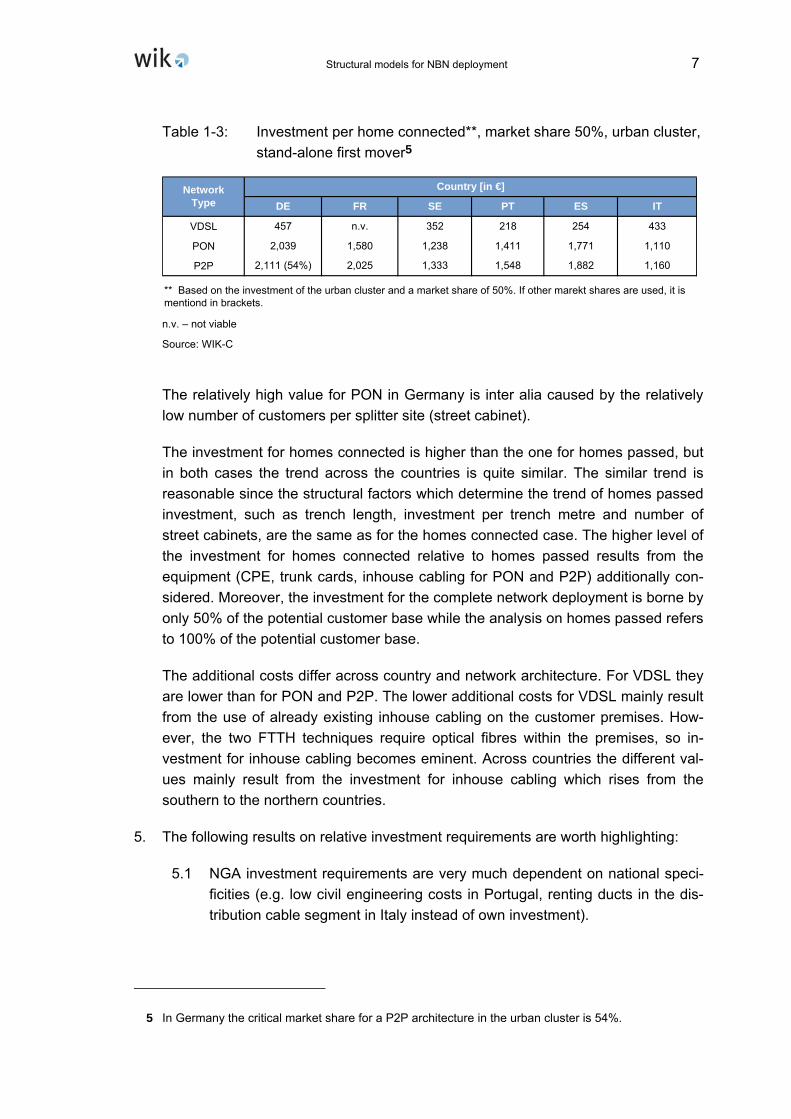
4. The investment per home connected depends on the cluster considered and on the market share being achieved (in Table 1-3 we assume the urban cluster and a market share of 50%) 4. The figures include inhouse cabling and CPE in any of the countries. While the cost of the passive infrastructure differ due to varying construc-tion cost, existing infrastructure (ducts/aerial cabling) and network topology, the cost of the active equipment more or less is the same in all countries.
4 We compare one cluster with a dedicated market share. Taking the individual critical market shares per cluster would result in different values per architecture, cluster and country and would hardly be comparable.
Structural models for NBN deployment 7
Table 1-3: Investment per home connected**, market share 50%, urban cluster, stand-alone first mover5
VDSL
PON
P2P
** Based on the investment of the urban cluster and a market share of 50%. If other marekt shares are used, it is mentiond in brackets.
1,882 1,1602,111 (54%) 2,025 1,333 1,548
254 433
2,039 1,580 1,238 1,411 1,771 1,110
457 n.v. 352 218
Network Type
Country [in €]
DE FR SE PT ES IT
n.v. – not viable
Source: WIK-C
The relatively high value for PON in Germany is inter alia caused by the relatively low number of customers per splitter site (street cabinet).
The investment for homes connected is higher than the one for homes passed, but in both cases the trend across the countries is quite similar. The similar trend is reasonable since the structural factors which determine the trend of homes passed investment, such as trench length, investment per trench metre and number of street cabinets, are the same as for the homes connected case. The higher level of the investment for homes connected relative to homes passed results from the equipment (CPE, trunk cards, inhouse cabling for PON and P2P) additionally con-sidered. Moreover, the investment for the complete network deployment is borne by only 50% of the potential customer base while the analysis on homes passed refers to 100% of the potential customer base.
The additional costs differ across country and network architecture. For VDSL they are lower than for PON and P2P. The lower additional costs for VDSL mainly result from the use of already existing inhouse cabling on the customer premises. How-ever, the two FTTH techniques require optical fibres within the premises, so in-vestment for inhouse cabling becomes eminent. Across countries the different val-ues mainly result from the investment for inhouse cabling which rises from the southern to the northern countries.
5. The following results on relative investment requirements are worth highlighting:
5.1 NGA investment requirements are very much dependent on national speci-ficities (e.g. low civil engineering costs in Portugal, renting ducts in the dis-tribution cable segment in Italy instead of own investment).
5 In Germany the critical market share for a P2P architecture in the urban cluster is 54%.

8 Structural models for NBN deployment
5.2 FTTC/VDSL requires much less investment than FTTH due to saving the distribution cable segment by using the existing copper sub-loops and sav-ing the inhouse cabling.
5.3 FTTH requires roughly 5-times higher investments than VDSL. The more fu-ture-proof and open access friendly P2P FTTH architecture requires less than 10% additional investment than the PON architecture.
6. A nationwide NGA roll-out is not profitable in any of the six countries analyzed on the basis of current costs. This result holds for any NGA technology and even for a monopolistic market structure. The area of NGA coverage beyond the level of prof-itable roll-out can only be expanded with public funding or subsidies.
7. The following Table 1-4 provides an overview of the viability of the NGA roll-out of incumbents for all six countries considered in this study. The results are shown for all three architectures and show the coverage areas which can be served profitably.
Table 1-4: Viability of NGA roll-out for incumbents across countries and tech-nologies
VDSL
PON
P2P
SE PT ES IT
71.5% n.r. 18.3% 39.0% 67.4% 100.0%
DE FR
25.1% 25.2% 18.3% 19.2%
13.7% 18.6% 18.3% 19.2%
12.2% 17.6%
12.2% 12.6%
CountryNetwork Type
n.r. – not realisable
The incumbent in Germany can profitably roll-out VDSL for 71.5% of the population while viability in Sweden ends at 18.3% of population. A FTTH roll-out is much less viable and is in the range from 12 to 25% across the six countries.
8. Our model exhibits the importance of scale and scope economies limiting the de-gree of replicability. Where viable, replication of the incumbent’s NGA requires a more significant scale and/or market share for alternative operators compared with current business models based on local loop unbundling. This limits the number of feasible competitors in the access network.
9. The next Table 1-5 shows the viability and potential replicability of a second mover’s NGA roll-out. These results are provided for the optimistic scenario that the second mover has access to 80% of existing ducts.

Structural models for NBN deployment 9
Table 1-5: Replicability of NGA roll-out for a second mover, 80% access to ex-isting ducts
VDSLPONP2P
n.v. 1.6%0.0% 6.8% n.v. n.v. n.v. 0.2%0.3% 6.8% n.v. n.v.
Network Type
CountryDE FR SE PT ES IT
18.5% n.r. n.v. 39.0% n.r. 17.6%
n.v. – not viable n.r. – not replicable
VDSL in Portugal is replicable for 39% of population and for 18.5% in Germany. Across all countries there is only relatively low replicability of FTTH infrastructure: for 6.8% of the population in France and for only 0.3% in Germany.
10. Replicating the incumbents' VDSL network roll-out by alternative operators is less viable than the current LLU approach of alternative operators. In a VDSL NGA envi-ronment, the current degree of LLU based competition does not seem to be replic-able. These results are similar to those generated in studies for NRAs in the Neth-erlands, Ireland and Belgium.
11. As indicated by other studies and/or analytical expectations, our model results sup-port the finding that civil engineering cost and inhouse wiring are key barriers to replicability in FTTB/H NGA deployment. However, even addressing these barriers by regulatory measures will not alone be sufficient to deliver competitive outcomes.
12. Incumbents are better placed than alternative operators to invest in NGA on a large scale:
12.1 Incumbents can rely on the availability of major network elements needed for NGA (locations of street cabinets, ducts, fibre) which they might use at their book values. Alternative operators still have to invest in such network elements or might get access at current costs.
12.2 Incumbents can save (economically) investments by generating lump-sum revenues due to dismantling of MDFs. These savings are modelled in the incumbent scenarios presented here.
12.3 Incumbents can make better use of economies of scale and scope due to their larger subscriber base (80-90% of local loop, around 50% of retail broadband customers) compared to that of the leading broadband competi-tor (10-15% retail market share), which they can migrate to NGA.
12.4 Alternative operators usually face a higher cost of capital than incumbents due to their size and risk position.

10 Structural models for NBN deployment
12.5 Due to the factors mentioned above, investments in NGA are more risky for alternative operators than for incumbents. Yet, alternative operators may act as first movers in NGA because their current business model as a whole is under threat.
12.6 For areas shown as viable, and where incumbents currently have the re-quired market share of access lines to make a fair return and have depreci-ated existing copper loops, little or no risk may be incurred, and the FTTx investment constitutes normal infrastructure renewal.
13. Our model results show that incumbents can reduce their own costs by infrastruc-ture sharing, can increase the profitability of their NGA roll-out and can reach prof-itability with a lower level of retail market shares if they provide wholesale services. This result suggests that investment cases of incumbents may be supported rather than undermined through open access regimes, whilst delivering market outcomes that are more compatible with effective competition. Our model suggests in the sample case of Portugal that if only duct access were available, the presence of second fibre access provider would significantly improve the incumbent’s profitabil-ity but the market structure would tend to support only two significant fibre opera-tors. A model in which wholesale fibre LLU or SLU was available would lower the critical retail market share for the incumbents’ profitability whilst supporting a num-ber of additional players.
14. Our model results underline the importance of efficiency in the duplication of infra-structure. If more access networks are rolled out than suggested viable by the model or if particular access network providers fail to achieve the critical market shares calculated, market players would either need to charge higher retail prices to recoup their investment or have to face major stranded investment failing to make a fair return on investment. A similar situation due to overinvestment in back-bone and undersea cables occurred when the internet bubble burst in 2000/01.
15. Properly defined access remedies and/or wholesale products increase the degree of replicability of NGA access infrastructure and therefore the degree and potential for competition.
16. We have modelled several regulatory measures relating to the use and sharing of infrastructure. These measures can be combined with each other in a relevant form. Some combinations of regulatory measures result in more efficient network roll-outs than pure solutions of one type, depending on the architecture. Thus, choice between different regulatory options (wholesale products) increases the effi-ciency of NGA investments.
17. Our model results have proven the critical and quantitative importance of efficient backhaul solutions between the street cabinet and the operator’s network node. The necessity of establishing stand-alone backhaul services limits the replicability

Structural models for NBN deployment 11
of FTTC NGA development significantly. Thus, the availability of proper access products and the choice between duct access and dark fibre backhaul, improves replicability.
18. The economics of FTTx do not support multiple replication of the access network sufficient to achieve effective competition. In case of (theoretical) replicability usu-ally only one or in rare cases two operators (in addition to the first mover) can prof-itably invest in NGA infrastructure. In any case, replicability is limited to denser populated areas.
19. In an FTTx NGA environment, the current degree of competition based on LLU can only be maintained if fibre SLU (in case of PON architecture) and/or fibre LLU (in case of P2P architecture) are available as access products together with appropri-ate backhaul. Fibre LLU and fibre SLU increase replicability significantly and enable viable competition in all clusters where a first mover rolls out the FTTH infrastruc-ture. Replicability is not given in less populated clusters.
20. The next Table 1-6 shows the viability and potential replicability of FTTH PON for a second mover if fibre SLU is available, provided different backhaul options are available.
Table 1-6: Replicability of FTTH PON for a second mover, fibre SLU
Country
PON + 20% df
PON + 80% df
df - dark fibreop - number of operators
Network Type
18.5% (op=4) 6.8% (op=9) 8% (op=13) 19.2% (op=2) 12.2% (op=3) 9.3% (op=2)
2.4% (op=2) 6.8% (op=4) 8% (op=6) 19.2% (op=2) 12.2% (op=2) 1.6% (op=3)
DE FR SE PT ES IT
If the operator realizes its backhaul connection via 80% duct access, it can repli-cate the incumbents FTTH roll-out for 18.5% of population in Germany and even for 19.2% in Portugal. In these cases market access is viable for four operators in Germany and two operators in Portugal.
21. The effectiveness of regulated access on increasing replicability and competition is strongly affected by the price of access including the WACC. Sensitivities on the level of the cost of capital show the critical dependency of NGA profitability and coverage from this parameter. Increasing the WACC for instance in France from 10.25% to 15% reduces the viable coverage of a PON FTTH infrastructure from 18.6% to 6.8% of population. In the viable areas the critical market shares for prof-itability increase significantly. If only the WACC for the regulated wholesale ser-vices on the SMP operator is increased by the same degree, the critical market shares (or the costs) of competitors increase significantly and the viable address-
12 Structural models for NBN deployment
able customer base decreases. These results show how careful regulators have to deal with a risk premium approach to incentivise investments in NGA. If wholesale rates are fixed significantly above the relevant NGA project risk, replicability and competition can be heavily affected.
22. Compared to other studies, our model results are somewhat more optimistic re-garding the replicability of NGA infrastructure This seems to follow from our explicit consideration of fibre loop and fibre sub-loop unbundling. Indeed, by explicitly mod-elling these access options we show that greater replicability can be achieved through regulatory measures. These access opportunities enable competition wherever a first mover (e.g. the incumbent) rolls out a FTTH NGA infrastructure and require lower market shares for profitability commensurate with market shares that might be realistically achievable in a competitive environment. Fibre LLU and SLU are also the prerequisite for getting (at least) the same degree of competition as under the current unbundling model in the PSTN.
23. Regulatory intervention and proper access products are needed for a competitive NGA market:
23.1 Duct and dark fibre access increase the level of infrastructure replicability, but are not alone sufficient for viable competition.
23.2 Physical collocation at the street cabinet level increases the limited degree of replicability in case of FTTC.
23.3 Fibre full local loop unbundling (at metro core locations) and fibre sub-loop unbundling (at OSDF) increase the scope for competition significantly.
23.4 Bitstream access remains relevant where unbundling is not technically fea-sible, to support the ladder of investment concept, for less urban areas where unbundling is not economically viable and for business service pro-viders.
23.5 In addition, the regulatory framework has to deal with the sunk investments of competitors related to LLU infrastructure to enable a viable migration path to NGA.
1.2 The economics of a multi-fibre deployment
There is some fascination in Europe on deploying fibre not as a single fibre connection between the customer and a network node but by installing a number of fibres to one single end-customer. This approach is supposed to have low additional deployment cost but comes close to full fledged infrastructure competition.

Structural models for NBN deployment 13
What does a multi-fibre deployment mean in the context of relevant FTTH architec-tures? The nowadays relevant two FTTH architectures are fibre point-to-point (P2P) and Passive Optical Network (PON). With fibre P2P there is an individual fibre connection from each home to the MPoP, while PON concentrates an amount of fibres from the homes (up to 128) to one single fibre using a splitter in a Distribution Point (DP)6. Ad-ministering the multiple use of the single fibre by an GPON OLT causes a bandwidth limitation for the commonly used downstream signals to 2.5 Gbit/s and for the upstream signals to 1.25 Gbit/s. P2P in contrast only is limited by the port speed of the end sys-tems in the customer premises and the MPoP, thus offering 1 Gbit/s per home – or even more - in a symmetric manner.
Figure 1-2: NGA FTTH architectures
• FTTH Point to Multipoint (PMP), (PON)
• FTTH Point to Point (P2P)
OLT
ONT
SCDPMPoPAggregation Net
CPE
Inhouse
Aktive TechnikActive Technique
Fibre Fibre
OSDF
1:1
Splice
FibreInhouse
SCDPMPoPAggregation Net
CPE
Inhouse
Aktive TechnikActive Technique
Fibre Fibre
OSDF
1:1
Splice
FibreInhouse
SCDPMPoPAggregation Net
CPE
Inhouse
Aktive TechnikActive Technique
Fibre Fibre
Splitter/ OSDF
1:x
Splice
FibreInhouse
SCDPMPoPAggregation Net
CPE
Inhouse
Aktive TechnikActive Technique
Fibre Fibre
Splitter/ OSDF
1:x
Splice
FibreInhouse
Drop CableFeeder Cable
Multifibre: 4 Fibres per Home
2nd – 4th
Operator
2nd – 4th
Operator
Multiple-fibre architectures deploy more than one single fibre per home, e.g. four, in the drop cable segment and (optionally) in the feeder cable segment, in order to enable several operators in parallel to get access to the same end customers and thus offering the end customers a wider choice – on the infrastructure level limited to the four opera-
6 This point is sometimes also called “concentration point”.

14 Structural models for NBN deployment
tors. The investing operator connects at least one fibre per home to its ongoing feeder network up to the MPoP. The second to fourth operator each shares fibres in the drop cable segment to the end customer homes and in principle has the choice to connect these fibres to its own separately ducted feeder network (e.g. local power utility ducts) at the Distribution Point or to also share fibres in the feeder infrastructure up to the MPoP and collocate there.
Comparing multi-fibre with a fibre unbundling approach at the DP or MPoP one will not find differences in quality for the transmitted signals but may identify less process risk in switching on and off new services, because the fibre has not to be changed between the operators and providing a new service could happen in parallel to an existing one, which then might be switched off later. The operation of the fibre is done by the investor in the multi-fibre case and by the incumbent in the fibre unbundling case, thus normally by a third party from the view of an access seeker. If both the investor respectively the incumbent equally operate the fibres, the process between the access seeker and the fibre operators for failure analysis and repair have to be synchronised and performed in the same manner and therefore do not differ from each other.
Switzerland is at the moment the European country where a quite advanced and con-crete multi-fibre deployment model and an access model based on this network roll-out has been under active negotiation and implementation for some time. In France multi-fibre is a deployment approach for inhouse calling. Broadband competition in Switzer-land is mainly dominated by the competition between the dominant fixed-line incumbent Swisscom and the cable companies with Cablecom as the major player in this segment. Fixed-line competitors have a much weaker position in the market than in most EU Member States. As a response to some local utility plans to roll-out fibre networks in some major cities, Swisscom stopped the further roll-out of VDSL in 2008 and an-nounced a far reaching FTTH network roll-out. Swisscom deploys a FTTH P2P network architecture. Swisscom is connecting each home in a multi-fibre approach with four fi-bres from a manhole into each home. On the basis of cooperation models with other operators or utilities, Swisscom intends to negotiate co-investment arrangements to swap fibres and to share the terminating fibre segments with these partners.
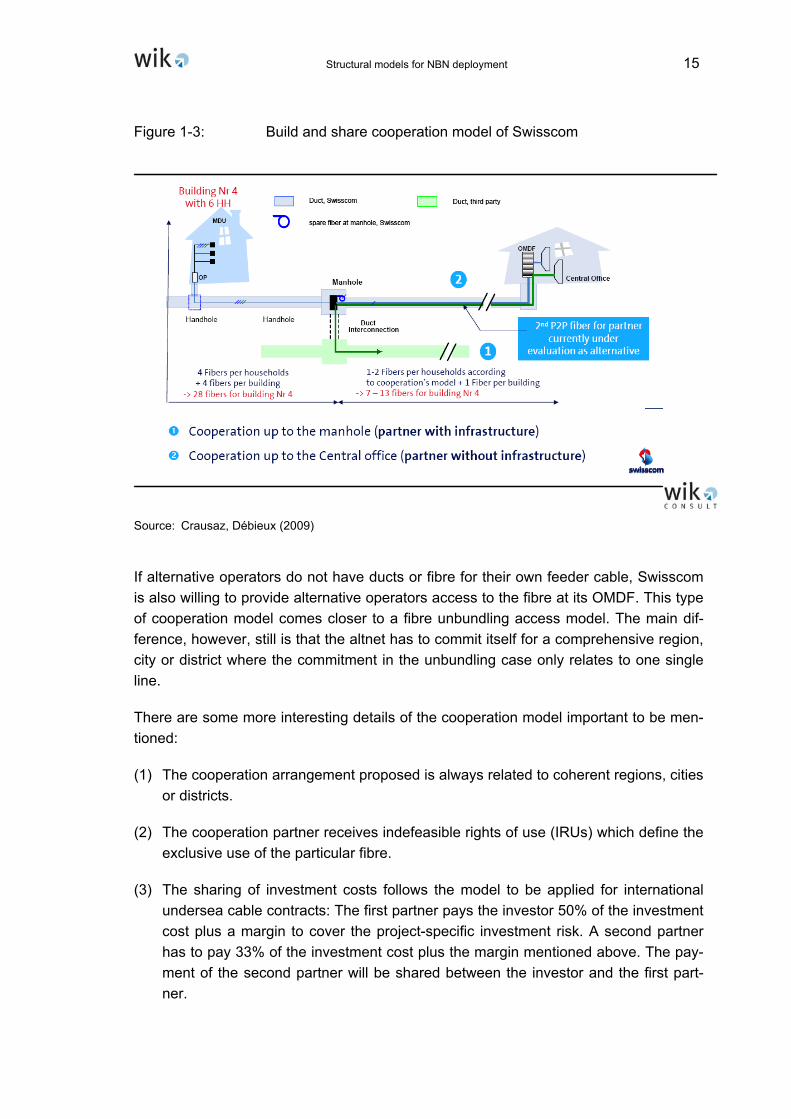
Technically, Swisscom's cooperation model is described in Figure 1-3. Each home in a building is connected with four separate fibres, all ending in a standardised plug. At the other side all fibres of a building end in a manhole close to the building. At this distribu-tion point at least one fibre per home is directed through the distribution cable to the Optical Main Distribution Frame (OMDF) of Swisscom (resp. the constructing operator), the other fibres may be accessed by competitors running their own infrastructure down to the manhole, where they connect to the shared fibre end lines.
Structural models for NBN deployment 15
Figure 1-3: Build and share cooperation model of Swisscom
Source: Crausaz, Débieux (2009)
If alternative operators do not have ducts or fibre for their own feeder cable, Swisscom is also willing to provide alternative operators access to the fibre at its OMDF. This type of cooperation model comes closer to a fibre unbundling access model. The main dif-ference, however, still is that the altnet has to commit itself for a comprehensive region, city or district where the commitment in the unbundling case only relates to one single line.
There are some more interesting details of the cooperation model important to be men-tioned:
(1) The cooperation arrangement proposed is always related to coherent regions, cities or districts.
(2) The cooperation partner receives indefeasible rights of use (IRUs) which define the exclusive use of the particular fibre.
(3) The sharing of investment costs follows the model to be applied for international undersea cable contracts: The first partner pays the investor 50% of the investment cost plus a margin to cover the project-specific investment risk. A second partner has to pay 33% of the investment cost plus the margin mentioned above. The pay-ment of the second partner will be shared between the investor and the first part-ner.

16 Structural models for NBN deployment
(4) In the (symmetrical) swapping model there is no financial compensation, because both partners are investors. Instead, they grant each other IRUs for one fibre in their respective roll-out area.
Figure 1-4 shows the impact of the sharing assumptions on the distribution of invest-ment cost. Swisscom assumes the total investment cost to increase by 10% to 30%.7 Compared to the single fibre architecture, the investor has to bear only 55% to 65% of the total investment. The same holds for his investment partner. Both partners can reach 100% of the potential customer base at a lower investment than on a stand-alone investment case.
Figure 1-4: Potential investment cost distribution in the multi-fibre model
100%100%
CostsSingle Model
Total
110% - 130%
Overall costsCooperation
Model
Scenario:
2 Partners
Scenario:
3 Partners
Each
55% - 65%
Each
36% - 43%
To evaluate the economics of a multi-fibre deployment against a single fibre deployment we have used the same general model structure as described in the previous subsec-tion.8
The model describes the view of an investor, investing in a greenfield approach, but being able to cooperate with other infrastructure providers by constructing commonly, where appropriate. We used the model variant of a first mover, not being the incumbent. This scenario is motivated by the fact that investors not necessarily are the incumbent and that the MDFs may still have to be kept in operation for a longer transition period. If there are several operators, the investment of the commonly used infrastructure in the
7 See Gromard (2009). 8 See Ilic, Neumann, Plückebaum (2009).

Structural models for NBN deployment 17
drop and feeder cable segments are shared in equal parts. Thus, each operator has access to the whole customer base in the deployment area (100% of homes passed). Therefore the model scenario with multi-fibre and one operator describes the total in-vestment needed for the multi-fibre approach.
The view of a second operator is the same as long as it is sharing the same infrastruc-ture in equal parts and as long as its own infrastructure (e.g. that to the DP) is as effec-tive as the infrastructure of the investor.9 This position might change if the second op-erator does not share the feeder infrastructure but uses empty ducts of the investor or even dark fibre.
In order to compare the investment figures we have to define a market share to which the network is connected to the homes, since the total investment depends on the mar-ket share. We have assumed a market share of 50% in all architectures and all clusters considered. This share does not relate to the critical market share needed and may be less or higher; it is simply set for comparison reasons. Our figures accumulate the in-vestment for the four most dense clusters for the reference case of Germany populated clusters or for 18.4% of population, since the investment for areas outside profitability are of less relevance.
Figure 1-5: Total investment per homes passed, based on the four most dense clusters, 50% market share, in Mio €
PON DP P2P DP PON MPOP P2P MPOP
Total Investment, in Mio €
10,9
28
11,5
07
10,9
28
11,5
07
12,2
78
13,0
09
12,2
93 14,1
46
6,96
4
7,69
6
6,34
3 7,46
7
4,30
8
5,03
9
3,36
8
4,12
7
0
2,000
4,000
6,000
8,000
10,000
12,000
14,000
Single fibre case
MF 1 op / 4 fb
MF 2 op / 4 fb
MF 4 op / 4 fb
PON DP P2P DP PON MPOP P2P MPOP
Total Investment, in Mio €
10,9
28
11,5
07
10,9
28
11,5
07
12,2
78
13,0
09
12,2
93 14,1
46
6,96
4
7,69
6
6,34
3 7,46
7
4,30
8
5,03
9
3,36
8
4,12
7
0
2,000
4,000
6,000
8,000
10,000
12,000
14,000
Single fibre case
MF 1 op / 4 fb
MF 2 op / 4 fb
MF 4 op / 4 fb
9 Normally, one cannot expect that existing ducts of utilities etc. touch the DPs planned by the telco investor. Therefore costs to connect these networks would arise and the other operators’ infrastruc-tures to connect the DP are less efficient than that of the investor. Therefore, our assumption is valid only for greenfield approaches. One may remember the result for sub-loop unbundling in our previous study to be less efficient than collocation at the MCL (MPoP).

18 Structural models for NBN deployment
Comparing single fibre and multi-fibre one operator cases Figure 1-5 shows the total investment for a multi-fibre network to be between 13% and 23% higher than for the comparable single fibre networks. The differences are mainly driven by the higher num-ber of fibres per customer which generally leads to additional works in inhouse cabling and splicing, digging of larger trenches and deployment of higher sized cables as well as the installation of collocation equipment. The highest increase in investment results for P2P MPoP (from 11,507 to 14,146 Mio. € or 23%). This architecture considers four fibres per customer on the complete length between the customer’s premise and the MPoP, thus in the drop and feeder cable segment. In these two segments the large number of fibres requires larger trenches and bigger cables which are able to capture the higher fibre capacity. The four fibres per customers also need customer sided OSDF and ODF ports which increases the investment
The total investment in the multi-fibre network increases if the number of co-investing operators increases either. The investment positions listed in Figure 1-5 are referring to investment per operator and do not reveal the sum of all investments of FTTH opera-tors. Therefore, the total investment of the roll-out could be approximated by multiplying the listed values with the number of operators considered. The total investment in the two operator multi-fibre case (PON DP) is at about (2*6,964.5 Mio. € =) 13,929 Mio. € which is about 13.4% higher than the related one operator case (12,278.2 Mio. €). The total investment in the case of four operators increases to 17,230.4 Mio. €, about 40% higher than the one operator scenario. The increase of the total investment is mainly driven by additional passive equipment to be installed at the distribution point in order to enable the fibre hand-over. The additionally required elements are e.g. splitter, larger sized manholes (or cabinets) and OSDF equipment (ports, patch cables etc). A fibre hand-over of PON at the distant MPoP level instead results in an increase of the total investment of 3.2% (two operators) respectively 9.6% (four operators). These values are (remarkably) lower (=1/4) than those of the PON DP case, since the feeder segment now is also shared. This result impressively demonstrates the savings being achieved by not duplicating the feeder infrastructure compared to sub-loop unbundling architec-tures.
While the total investment increases with every additional operator, the investment per operator decreases. A multi-fibre approach with two operators reduces investment per operator by about 40% to 48% compared to the same infrastructure operated by one. If the number of operators increases to four, the investment per operator is even lower accordingly (60% to 73%).
A look at the total investment per cluster indicates that in less dense clusters the rela-tive investment difference between the single fibre case and the multi-fibre case with one operator decreases. For example, the P2P case with fibre hand-over at the DP in-dicates for the dense urban cluster a relative increase of about 20.5% while in the dense suburban cluster the relative difference is 12.3%. For the multi-fibre case it can be stated that the less dense the considered cluster is, the less is the investment share

Structural models for NBN deployment 19
of the inhouse cabling segment and the distribution point equipment relative to the total investment. These positions are the main cost drivers of the multi-fibre case. Since the share of these positions decreases in less dense clusters, the total investment is less affected.10
Figure 1-6 also points out that the more network segments are shared, the lower is the investment to be borne by each operator an a stand alone basis, i.e. fibre hand-over at MPoP locations with common deployment in both drop cable and feeder segment is at about 12% (for PON) to 16% (for P2P) lower than the fibre hand-over at the distribution point with stand alone deployment in the feeder. The effect is higher for P2P, because the more fibres are deployed, the lower is the incremental investment per fibre, and so common deployment implies higher investment savings for P2P than for PON.
Figure 1-6: Average investment per homes passed, based on the four most dense clusters, 50% market share, in €
Average Investment per homes passed, in €
1,37
9
1,45
2
1,37
9
1,45
2
1,55
0
1,64
2
1,55
2
1,78
6
879 97
1
801 94
3
544 63
6
425 52
1
0
200
400
600
800
1,000
1,200
1,400
1,600
1,800
Single fibre caseMF 1 op / 4 fbMF 2 op / 4 fbMF 4 op / 4 fb
PON DP P2P DP PON MPOP P2P MPOP
Average Investment per homes passed, in €
1,37
9
1,45
2
1,37
9
1,45
2
1,55
0
1,64
2
1,55
2
1,78
6
879 97
1
801 94
3
544 63
6
425 52
1
0
200
400
600
800
1,000
1,200
1,400
1,600
1,800
Single fibre caseMF 1 op / 4 fbMF 2 op / 4 fbMF 4 op / 4 fb
PON DP P2P DP PON MPOP P2P MPOP
The investment numbers indicate that the investment in P2P multi-fibre architectures compared to the corresponding PON case vary with regard to the collocation point (DP or MPoP). For MPoP collocation P2P investment is about 15% higher than that for PON, while the same ratio is reduced to 6% for DP collocation.
10 A comparison of the P2P single and multi-fibre one operator case with hand-over at the DP indicates that for the most dense cluster the inhouse cabling is about 36% of the total investment while in the fourth dense cluster it is only about 20%. For the same clusters the DP investment share decreases from 9.1% to 6.0%. The decrease results from the higher investment share of the drop cable segment, the feeder cable segment and the MPoP equipment.

20 Structural models for NBN deployment
The basic economic advantage for the individual operator is that under a multi-fibre ap-proach he only has to bear a certain proportion of the investment, but still can reach 100% of the potential customers. Our empirical results show that the more network segments (drop cable incl. inhouse, feeder) are shared, the higher the benefit for sev-eral operators from sharing the investment. The investment savings for the individual operator amount up to 40% if two operators share the relevant investment and up to 70% if four operators share the relevant investment. The higher the shared part of infra-structure, the more attractive the successful sharing approach gets. Thus hand-over at the MPoP is more efficient than at the DP. For efficiency reasons multi-fibre approaches should therefore not be restricted to the drop cable segment only. Fibre investments in a multi-fibre sharing arrangement increase replicability. The competition by several op-erators in the market is viable in a larger coverage area compared to single fibre end-to-end network duplication. The critical market shares for an individual operator for profit-ability therefore are lower. Nevertheless, the areas where each of two or even four op-erators reach the critical market shares for profitability are rather limited. The coverage of a successful infrastructure sharing with four operators is less than in a single fibre case (due to the higher investment needed). This coverage could be expanded, if higher ARPU is achieved than assumed in the model or if customers buy services from several operators in parallel and in total spend more than assumed in the model.
The multi-fibre model has the following advantages:
a. The multi-fibre model generates competition at the deepest level of the network and provides a relevant model of replicability of the fibre at lower costs than the end-to-end infrastructure duplication.
b. The altnet has a better end-to-end control over his network infrastructure.
c. The multi-fibre model allows for a competitive scenario where the user can get different services from different operators.
d. The multi-fibre approach potentially can contribute to solve the termination mo-nopoly problem. A user could for instance subscribe to different termination ser-vices from different operators.
e. In cases or scenarios where the multi-fibre approach actually has achieved ef-fective competition, regulation becomes obsolete.
Besides the additional investment a multi-fibre approach has some further relevant dis-advantages:
a. The significant higher requirements of sunk investment generate a significantly higher barrier to entry and generate increased penetration risks for non SMP operators.
Structural models for NBN deployment 21
b. The number of competitors is determined by the market in the unbundling model. In a multi-fibre model unconstrained by regulation, the maximum number of competitors is determined ex ante by the investor and his decision on the number of fibres to be deployed. It is fair to say, that this restriction may be overcome by a secondary market of fibre lines, e.g. on the basis of unbundling, in particular, if unbundling is mandated.
c. Depending on the distribution of market shares, the multi-fibre model can cause significant asymmetries in per line costs and therefore in competition which can result in unsustainability of competition.
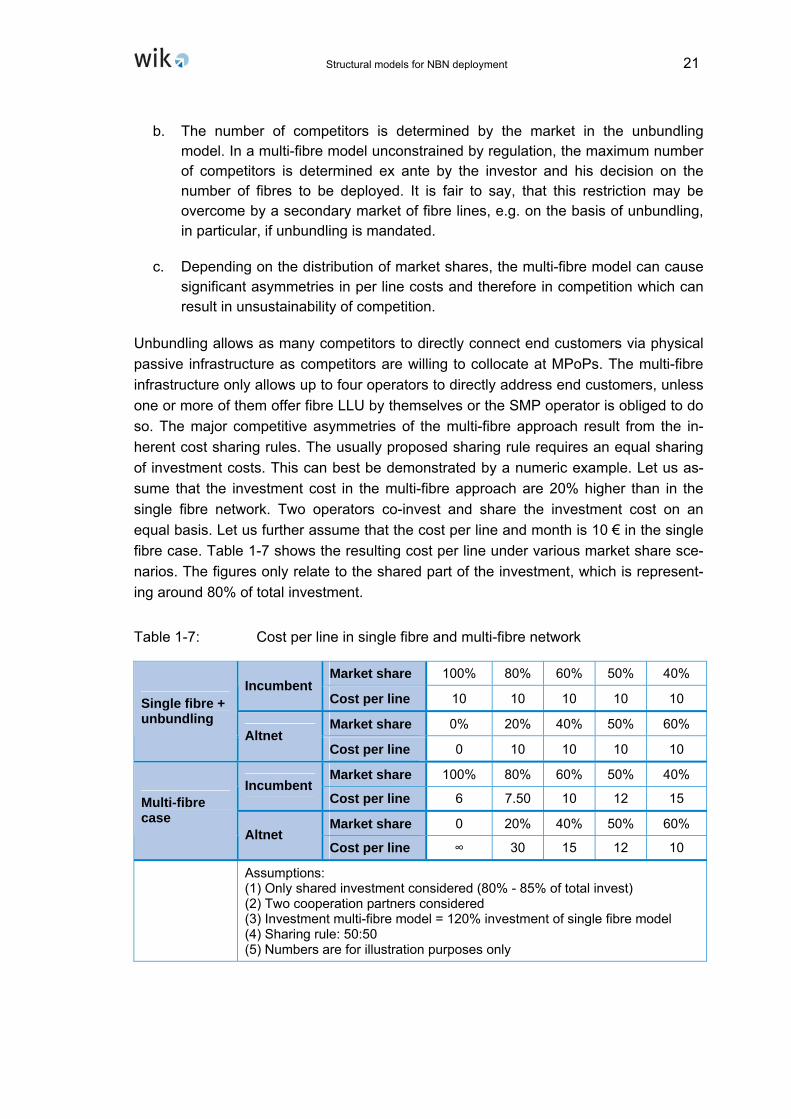
Unbundling allows as many competitors to directly connect end customers via physical passive infrastructure as competitors are willing to collocate at MPoPs. The multi-fibre infrastructure only allows up to four operators to directly address end customers, unless one or more of them offer fibre LLU by themselves or the SMP operator is obliged to do so. The major competitive asymmetries of the multi-fibre approach result from the in-herent cost sharing rules. The usually proposed sharing rule requires an equal sharing of investment costs. This can best be demonstrated by a numeric example. Let us as-sume that the investment cost in the multi-fibre approach are 20% higher than in the single fibre network. Two operators co-invest and share the investment cost on an equal basis. Let us further assume that the cost per line and month is 10 € in the single fibre case. Table 1-7 shows the resulting cost per line under various market share sce-narios. The figures only relate to the shared part of the investment, which is represent-ing around 80% of total investment.
Table 1-7: Cost per line in single fibre and multi-fibre network
Market share 100% 80% 60% 50% 40% Incumbent
Cost per line 10 10 10 10 10
Market share 0% 20% 40% 50% 60% Single fibre + unbundling
Altnet Cost per line 0 10 10 10 10
Market share 100% 80% 60% 50% 40% Incumbent
Cost per line 6 7.50 10 12 15
Market share 0 20% 40% 50% 60% Multi-fibre case
Altnet Cost per line ∞ 30 15 12 10
Assumptions: (1) Only shared investment considered (80% - 85% of total invest) (2) Two cooperation partners considered (3) Investment multi-fibre model = 120% investment of single fibre model (4) Sharing rule: 50:50 (5) Numbers are for illustration purposes only

22 Structural models for NBN deployment
In the single fibre case under cost-based LRIC pricing the incumbent and the altnet al-ways face the same cost per line. Furthermore, the cost per line and under cost-based LRIC pricing also the price for the wholesale service is independent of the market share distribution between the incumbent and the altnet. It is only the total number of lines sold in the market which determines cost. In the multi-fibre case and an investment cost sharing rule it is no longer the total number of lines sold in the market which determine the cost for each operator. Instead, it is the share in the investment cost which deter-mines the cost per line for each operator. To reach the same level of cost an operator has to achieve a market share of at least 60%. In this case the cost of the competing operator are higher by 50%. In case one operator only achieves a 20% market share it has a cost disadvantage of 300%.
There seem to be some competitive advantages of the multi-fibre approach. On the other hand barriers to entry increase, which means that the potential for competition and market entry decreases. The unbundling model is open for a variety of market structures and supports the search for the most efficient market structure; the multi-fibre model on the other hand often tends to a duopoly market structure including a tendency towards collusion. The best solution would be to ensure that both options are available. Generally, it should not be the NRA which should pick a successful business model. This should be the task of market players and/or the outcome of the competitive proc-ess.
2 The European approach
2.1 Market development
Europe is in an advanced stage of broadband access market development. As of Janu-ary 2010 there were approximately 124 million fixed broadband subscriber lines in the EU11 and the market is still growing in volume at a rate of 9.3% in 2009. Broadband access corresponds to an average EU penetration rate of about 24.8% of the population in January 2010 and more than 50% of all private households. Countries like the Neth-erlands or Denmark are leading the edge with a penetration rate per household of 37.7% or 37.8%. Even Romania and Bulgaria, the countries with the lowest penetration, exhibit a penetration rate of 13%.
In 2009, the EU continued to be the largest broadband market in the world and some EU states enjoy the highest penetration levels on a worldwide basis. The EU was catch-ing up with the US in broadband take-up. The difference in penetration rates declined to 2.8 percentage points in July 2009 (23.9% in the EU and 26.7% in the US).
11 See EU Commission (2010c), p. 19.
Structural models for NBN deployment 23
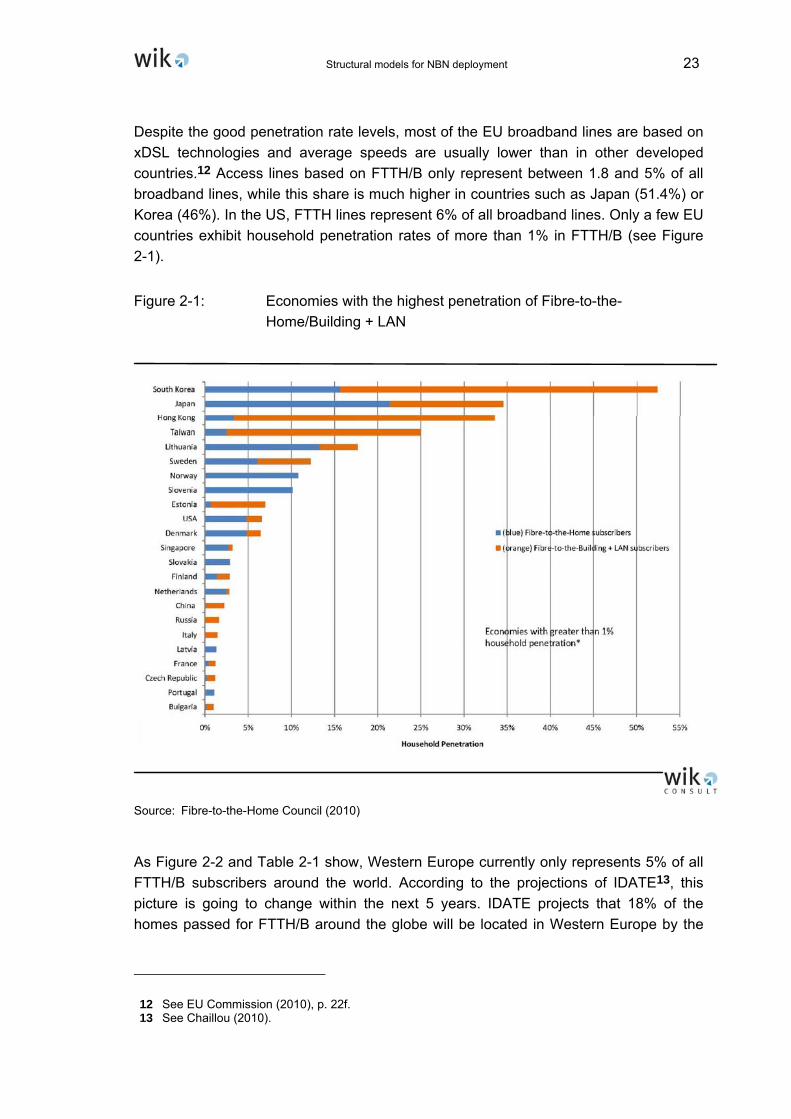
Despite the good penetration rate levels, most of the EU broadband lines are based on xDSL technologies and average speeds are usually lower than in other developed countries.12 Access lines based on FTTH/B only represent between 1.8 and 5% of all broadband lines, while this share is much higher in countries such as Japan (51.4%) or Korea (46%). In the US, FTTH lines represent 6% of all broadband lines. Only a few EU countries exhibit household penetration rates of more than 1% in FTTH/B (see Figure 2-1).
Figure 2-1: Economies with the highest penetration of Fibre-to-the-Home/Building + LAN
Source: Fibre-to-the-Home Council (2010)
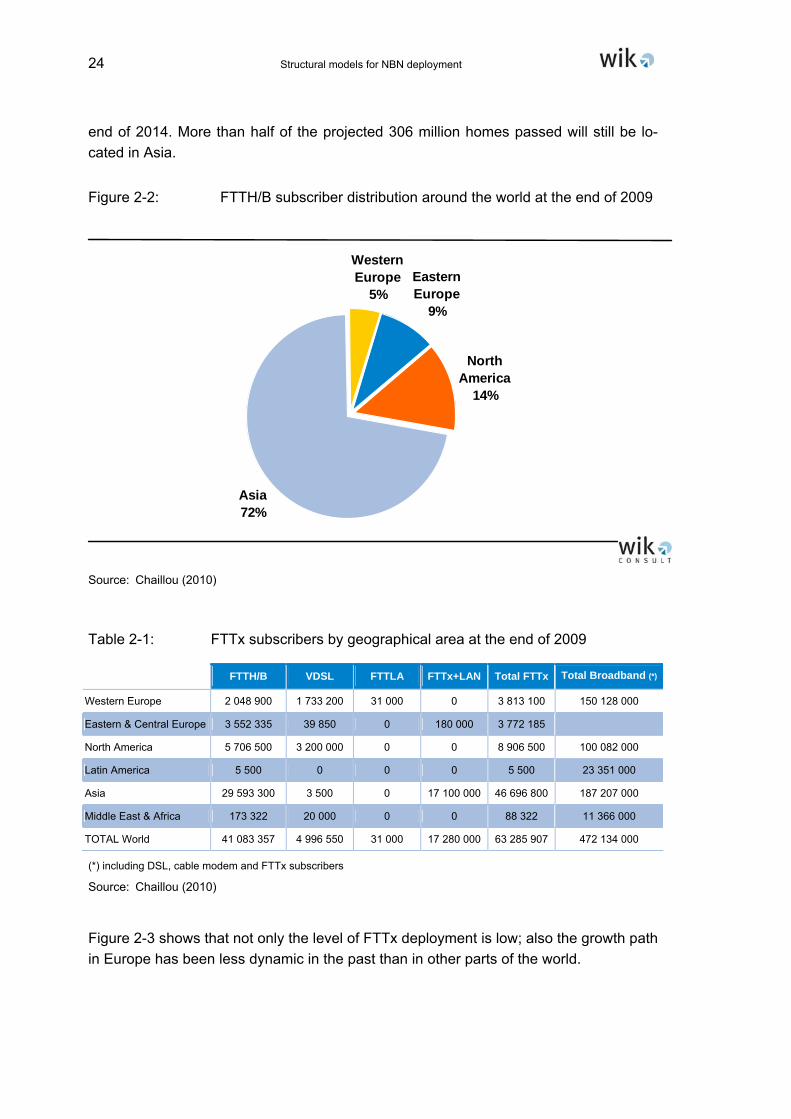
As Figure 2-2 and Table 2-1 show, Western Europe currently only represents 5% of all FTTH/B subscribers around the world. According to the projections of IDATE13, this picture is going to change within the next 5 years. IDATE projects that 18% of the homes passed for FTTH/B around the globe will be located in Western Europe by the
12 See EU Commission (2010), p. 22f. 13 See Chaillou (2010).
24 Structural models for NBN deployment
end of 2014. More than half of the projected 306 million homes passed will still be lo-cated in Asia.
Figure 2-2: FTTH/B subscriber distribution around the world at the end of 2009
Western Europe
5%Eastern Europe
9%
North America
14%
Asia72%
Source: Chaillou (2010)
Table 2-1: FTTx subscribers by geographical area at the end of 2009
FTTH/B VDSL FTTLA FTTx+LAN Total FTTx Total Broadband (*)
Western Europe 2 048 900 1 733 200 31 000 0 3 813 100 150 128 000
Eastern & Central Europe 3 552 335 39 850 0 180 000 3 772 185
North America 5 706 500 3 200 000 0 0 8 906 500 100 082 000
Latin America 5 500 0 0 0 5 500 23 351 000
Asia 29 593 300 3 500 0 17 100 000 46 696 800 187 207 000
Middle East & Africa 173 322 20 000 0 0 88 322 11 366 000
TOTAL World 41 083 357 4 996 550 31 000 17 280 000 63 285 907 472 134 000
(*) including DSL, cable modem and FTTx subscribers
Source: Chaillou (2010)
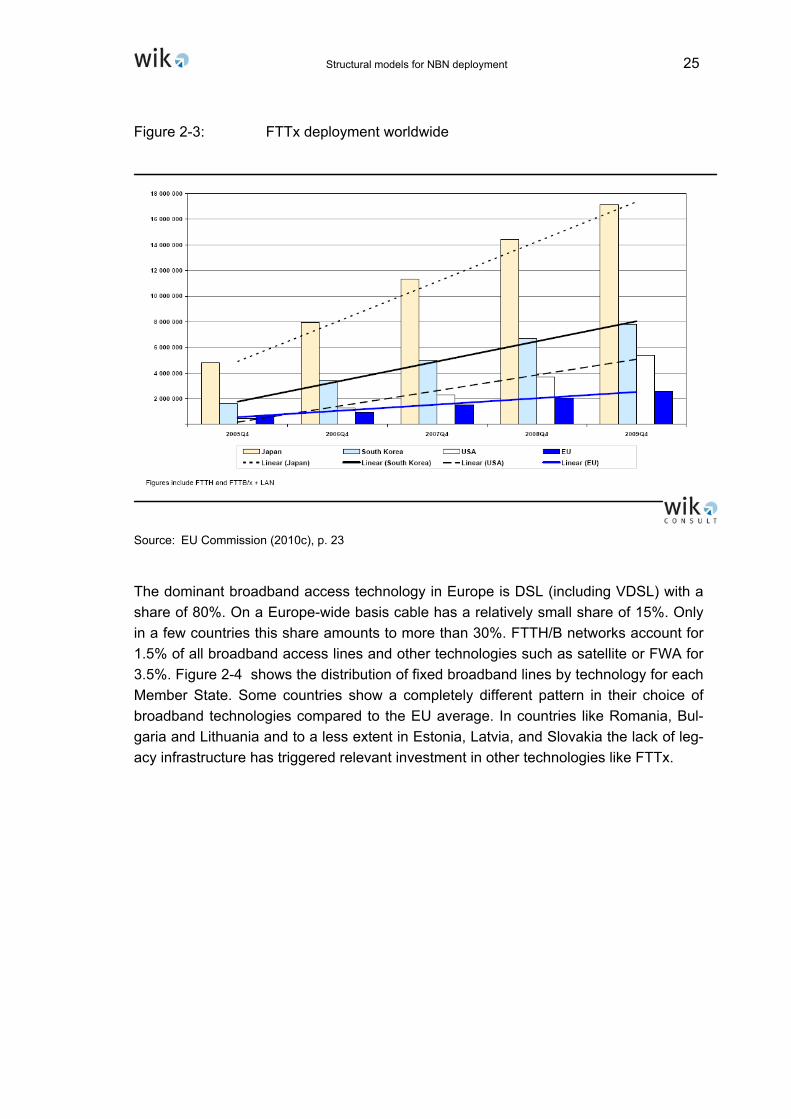
Figure 2-3 shows that not only the level of FTTx deployment is low; also the growth path in Europe has been less dynamic in the past than in other parts of the world.
Structural models for NBN deployment 25
Figure 2-3: FTTx deployment worldwide
Source: EU Commission (2010c), p. 23
The dominant broadband access technology in Europe is DSL (including VDSL) with a share of 80%. On a Europe-wide basis cable has a relatively small share of 15%. Only in a few countries this share amounts to more than 30%. FTTH/B networks account for 1.5% of all broadband access lines and other technologies such as satellite or FWA for 3.5%. Figure 2-4 shows the distribution of fixed broadband lines by technology for each Member State. Some countries show a completely different pattern in their choice of broadband technologies compared to the EU average. In countries like Romania, Bul-garia and Lithuania and to a less extent in Estonia, Latvia, and Slovakia the lack of leg-acy infrastructure has triggered relevant investment in other technologies like FTTx.

26 Structural models for NBN deployment
Figure 2-4: Fixed broadband lines by technology in the EU, January 2010
Source: EU Commission (2010), p. 25
The effective roll-out of fibre networks, however, significantly exceeds the actual pene-tration. In December 2008 the number of homes passed by FTTH/B networks was 11 million in the EU.14 In July 2009, only and approximately 1.7 million subscribers were connected to FTTH/B networks. Another 1 million customers subscribed to FTTN/VDSL. In sum, a total of 2.7 million customers are actually served by NGA networks, which amounts to 2.2% of the total broadband market. The physical reach of NGA network coverage is, however, significantly higher with approximately 26.9 million homes al-ready passed by FTTH/B or VDSL networks at the end of 2008. The number of homes passed amounts to 13.8% of all households or 22.6% of the total broadband market. Cable networks which have already been upgraded to DOCSIS 3.0 are also part of the NGA coverage. Under this definition, the physical reach of NGA networks in the EU27 comes close to 40% of the total broadband subscribership.
Who is investing in NGA in Europe? Incumbent operators (so far) have focussed their investment on VDSL and have passed 15.6 million homes. FTTH/B networks of incum-bent operators (so far), on the other hand, only have passed 1.7 million homes. FTTH/B investments in Europe are mainly driven by alternative operators. Their networks have passed 7.2 million homes and represent a subscriber base of about 40%. Leading FTTH/B operators are Fastweb in Italy, Numericable and Iliad in France, NetCologne
14 IDATE (2008).

Structural models for NBN deployment 27
and M-net in Germany, B2 in Sweden. Deployment of fibre by utility companies, munici-palities and housing companies also represents a major part of the market, their net-works have passed 2.3 million homes. Table 2-2 shows for a larger scope of Europe a similar picture. Incumbents account here only for 15.1% of all homes passed by FTTH/B. NGA deployment in the UK, Belgium and Germany is mainly focussed on VDSL. It is worth mentioning that the German incumbent operator Deutsche Telekom just recently has announced to deploy FTTH for 10% of all access lines within the next three years.
Table 2-2: Investors in FTTH/B in Europe
Source: IDATE for Fibre-to-the-Home Council (2010)
At the level of investment and deployment announcements for the next two or three years it is expected that incumbents in Germany and the UK will mainly be directed to-wards VDSL, whereas in France it will be towards FTTH/B. In Spain and the Nether-lands the picture is mixed with all NGA technologies. Alternative operators are likely to continue to favour deploying FTTH/B. Many observers estimate that the cumulative in-vestment in FTTH/B in Europe will only in 2013 exceed cumulative investment in VDSL.
28 Structural models for NBN deployment
The level of investment to be anticipated is significantly less than needed to build NGA networks to a level to reach the fibre deployment targets of the Digital Agenda.15
2.2 The European Community approach
The European broadband policy regarding ultra-fast NGA is not yet fully developed. As part of a general European strategy document16 for smart, sustainable and inclusive growth for 2020, the Community has formulated ambitious broadband targets to be achieved as part of a Digital Agenda.17 It is, however, less clear what the corresponding implementation approach for the strategy might be. So far only bits and pieces of an implementation strategy have been formulated. Public funding at a European level is rather limited and basically focussed to facilitate basic broadband coverage. As part of a European Economic Recovery plan adopted on 26 November 2008, the Commission decided to earmark € 1 billion to help rural areas get online. In the years before the EU structural and rural development funds were already structured to make funds available to bring (basic) broadband to sparely-populated rural and remote areas. The current structural funds programmes of 2007 – 2013 are to invest almost € 2.3 billion in com-munications infrastructures, mainly broadband actions. European public funding for NGA deployment is not foreseen so far. Only a number of Member States have an-nounced plans to support investment not only in high-speed broadband infrastructure for rural and underserved areas, but also to accelerate the deployment of very high or ultra-fast NGA not only in rural but also in urban areas. The Commission as adopted Community Guidelines which state and clarify under which circumstances and/or condi-tions such public funding is compatible with Europe’s relatively strict State aid rules. We highlight the major provisions of these Guidelines in section 2.2.3.
Under the current European Universal Service policy, broadband access is not re-garded as a universal service like fixed telephony. The Commission is currently in a process of evaluating the market performance again regarding broadband access and a potential designation as a universal service. For the second half of 2010 a Communica-tions from the Commission is to be expected which will clarify a European position as to whether a “broadband for all” policy needs to be supported by means of the universal service concept of the regulatory framework.
During the debate on the telecom reform package of the regulatory framework in the last three years there was and there still is an ongoing debate in Europe as to focus on proper investment incentives to new infrastructure investment. In particular incumbents fostered a debate on a potential trade-off between network investment and competition or regulating newly built infrastructures. The debate cumulates on the needs and/or
15 See section 2.2.1. 16 EU Commission (2010b). 17 EU Commission (2010d).

Structural models for NBN deployment 29
concepts to regulate NGA. The Commission is going to develop a European regulatory policy approach by means of the Next Generation Access Recommendation. This Rec-ommendation has seen three draft versions up to now, and it is expected that the document will be adopted in the second half of 2010. We will summarize the major con-tent of this Draft Recommendation in section 2.2.2.
2.2.1 Digital Agenda for Europe
As one of its firs initiatives the new European Commission launched in March 2010 the Europe 2020 strategy18 to exit the crisis and prepare the EU economy for the chal-lenges of the next decade. This strategy is covering a broad range of policy areas. The Digital Agenda for Europe is one of the seven flagship initiatives of the Europe 2020 strategy:
“The overall aim of the Digital Agenda is to deliver sustainable economic and social benefits from a digital single market based on fast and ultra fast internet and inter-operable applications.”19
To define the key enabling role of the use of Information Technologies (ICT), the Digital Agenda defines a broad set of action items and proposals to operationalize the Agenda. These include:
• Creation of a vibrant digital single market;
• Interoperability and standards;
• Trust and security;
• Fast and ultra-fast internet access;
• Enhancing digital literacy, skills and inclusion;
• Generate ICT-enabled benefits for EU society.
In our NGA/NBN context the targets and measures relating to fast and ultra-fast internet access are of particular interest. The Agenda at this point is driven by the insight, that currently the level of investment in NGA in Europe is (too) low. The Commission sees the need for an intensified roll-out and take-up of ultra-fast broadband and the need to facilitate and stimulate investment without re-monopolising the networks. As a guideline for policy measures the Digital Agenda sets three key performance targets for broad-band deployment in Europe:
18 See European Commission (2010b). 19 European Commission (2010d), p.3.
30 Structural models for NBN deployment
(1) Basic broadband for all by 2013: basic broadband coverage of 100% of EU citi-zens. (Baseline: Total DSL coverage (as % of the total EU population) was at 93% in December 2008).
(2) Fast broadband by 2020: broadband coverage at 30 Mbps or more for 100% of EU citizens. (Baseline: 23% of broadband subscriptions were with at least 10 Mbps in January 2010).
(3) Ultra-fast broadband by 2020: 50% of European households should have subscrip-tions above 100 Mbps. (No baseline)
These ambitious targets shall be reached by a mix of technologies. To guarantee uni-versal broadband coverage with increasing speed intends to outline a common frame-work to lower the cost of broadband deployment in the entire EU territory, ensuring proper planning and coordination and reducing administrative burdens. Authorities should in this context ensure that public and private civil engineering works systemati-cally provide for broadband networks and inhouse wiring, clearing of rights of way and mapping of available passive infrastructure. A forward-looking European spectrum pol-icy should promote efficient spectrum management for wireless broadband. Regarding financing of investment, EU and European Investment Bank funding instruments shall be used for well targeted broadband investments in areas where the business case is currently weak.
To foster the deployment of NGA and to encourage market investment in competitive networks the Commission will adopt a NGA Recommendation as a regulatory policy guideline to harmonize the regulatory approaches of the NRAs later in 2010. In an up-coming Broadband Communication the Commission is supposed to lay out a common framework for actions at EU and Member State level to meet the 2020 broadband tar-gets.
2.2.2 The NGA Recommendation
In the legal framework of the EU a Recommendation is not a legislation binding Member States and their respective authorities in a legal sense. Member States have, however, to take utmost account of the provisions of Recommendations in regulatory decision making.
The NGA Recommendation is a piece of policy and regulatory work which is heavily debated in Europe now for about two years. The Commission has published already three versions of the Recommendation for consultation. The latest version dates back to

Structural models for NBN deployment 31
April 2010.20 Adoption of the final Recommendation is expected for the second half of 2010.
The Recommendation intends to give guidance to EU NRAs on the future design of regulatory remedies concerning NGAs. The Commission justifies its intervention with the need for consistency of regulatory approaches taken by NRAs to avoiding distor-tions of the single market and to creating legal certainty for all investing undertakings.
The scope of the Recommendation primarily covers remedies to be imposed upon op-erators designated with Significant Market Power (SMP) on the basis of the usual mar-ket analysis procedure carried out by the NRAs. The Recommendation, however, also opens the field to impose obligations of reciprocal sharing of facilities in case of ineffi-cient duplication of infrastructure.
The Recommendation develops access remedies for various NGA architectures:
(1) Access to civil engineering infrastructure of the SMP operator
Access to civil engineering infrastructure is regarded as crucial for the deployment of parallel fibre networks and therefore competition at the deepest level of the net-work. NRAs shall obtain all relevant information on location, capacity and availabil-ity of ducts and other local loop facilities to make this access opportunity meaning-ful and viable. Sharing of civil engineering can increase the replicability of fibre networks.21 Mandating access to civil engineering will be effective only if the SMP operator provides access under the same conditions to its own downstream arm and to access seekers. To support this non-discrimination rule, the Commission has formulated equivalence principles. As part of equivalence the SMP operator e.g. should share all necessary information pertaining to infrastructure characteris-tics and apply to same procedures for access ordering and provisioning. Reference offers and SLAs are instrumental to applying equivalence. Providing information on infrastructure availability and access points is essential to receive equivalence. NRAs shall ensure that the principle of equivalence will be effectively applied by SMP operators. When it comes to new investment, NRAs shall in accordance with market demand, encourage or oblige the SMP operator to install sufficient capacity for other operators.
(2) Access to the terminating segment in the case of FTTH
In a FTTH context duplication of the terminating segment of the fibre loop will in most relevant cases be costly and inefficient. Sustainable network competition therefore requires access to the terminating segment of the fibre infrastructure. To
20 EU Commission (2010a). 21 In section 1.1 I have presented the results of our own impact analysis of duct and dark fibre access on
replicability.
32 Structural models for NBN deployment
ensure efficient entry, access has to be granted at a level in the network which en-ables entrants to minimum efficient scale for efficient and sustainable competition. The Recommendation foresees mandated access to the terminating segment in-cluding inside buildings wiring. NRAs shall determine the distribution point22 of the terminating segment for the purpose of mandating access. Usually there are con-flicting interests between the access seeker and the access provider on the location of such points. Furthermore, the location is independent on the architecture cho-sen. In case of unbundling only one operator can get access to the terminating segment for an individual customer. In case of networks based on multiple fibre lines in the terminating segment, several operators at the same time have access to a fibre loop to an individual customer. Thereby controlling their own connection up to the end-user. The Commission assumes that a multiple fibre architecture can be deployed at a marginally higher cost than single fibre networks. We have calcu-lated the incremental investment cost of a multi-fibre FTTH network compared to a singe fibre network with our own NGA model for the case of Germany and Switzer-land.23 The results are presented in section 1.2.
(3) Unbundled access to the fibre loop in the case of FTTH
Where the SMP operator deploys FTTH, the NGA Recommendation foresees that NRAs should in principle mandate unbundled access to the fibre loop, accompa-nied by appropriate measures assuring co-location and backhaul. Access should be provided at the most appropriate point in the network, which is normally the Met-ropolitan Point of Presence (MPoP). In case the SMP operator is not deploying a Point-to-Point architecture but a PON architecture, unbundled access to the fibre loop only is feasible at a concentration or distribution point deeper in the network or closer to the end-user. This type of access is limited to access to the terminating segment. Existing LLU reference offers shall be complemented to include unbun-dled access to the fibre loop. The price of access to the unbundled fibre loop in principle should be cost-oriented. The Commission assumes that the deployment of FTTH will normally entail considerable risks, which should properly be reflected in the access price. Therefore the cost of capital of setting access prices for invest-ment in fibre should be higher than for networks based on copper. Also the pricing structure for access products can be structured better reflecting the risk and allow-ing for an intensified sharing of risk between access seeker and access provider. SMP operators will be allowed to offer lower access prices to the unbundled fibre loop in return for up-front commitments on long-term or volume contracts, if the lower prices appropriately reflect an actual reduction of investment risk of the ac-cess provider. Such pricing schemes should, however, not be unduly discriminatory and do not lead to a margin-squeeze against access seekers. For this purpose
22 BEREC is referring to the term concentration point for the same access point (see BEREC (2010)). 23 See Ilic, Neumann, Plückebaum (2009a).

Structural models for NBN deployment 33
NRAs shall verify a margin-squeeze situation either by applying an “equally efficient competitor” or a “reasonably-efficient competitor” test.
NRAs can suspend an unbundling remedy if arrangements for co-investment in FTTH between several operators based on multiple fibre lines may lead to a situa-tion of effective competition in a certain geographic area. A certain number of op-erators involved is needed, co-investors shall ensure effective competition on the downstream market and third parties should have access to the infrastructure de-ployed under a co-investment arrangement.
(4) Access obligations in the case of FTTN
To enable competition on FTTN/VDSL, NRAs shall impose an obligation of unbun-dled access to the copper sub-lop. The sub-loop unbundling remedy shall be sup-plemented by backhaul measures and access to facilities for co-location or virtual co-location. To calculate cost-based access prices for such wholesale services, NRAs should not consider the risk profile to be different from that of existing copper infrastructure.
(5) Wholesale broadband access
Wholesale broadband access remedies shall be maintained or amended for exist-ing services and their chain substitutes like broadband access over VDSL as a chain substitute to existing wholesale broadband access over copper-only loops.
Wholesale broadband access products based on fibre are regarded as being more flexible and enhanced compared to copper-based bitstream products. Such service characteristics should be reflected in various regulated NGA products, including business grade services. Bitstream products via a NGA network may be distin-guished in terms of bandwidth, reliability, quality of service or other parameters. Where and when there is a proven track record that functional separation (or other forms of separation) has resulted in fully equivalent access to NGA networks and there are sufficient competitive constraints on the SMP operator, NRAs can leave the price of the bitstream product to the market and only control for anti-competitive behaviour like margin-squeeze.
(6) Migration
The NGA framework shall also give operators currently demanding access to the copper local loop an appropriate migration path to prepare for the changes imposed by the development towards NGA. For that purpose existing SMP obligations should be maintained for a transitional period which is in line with a standard in-vestment period for the ULL which is about 5 years. Alternative operators should be informed no less than five years before any de-commissioning of access points like the MDF. This period may be less if fully equivalent active access is provided.

34 Structural models for NBN deployment
NRAs should put in place a transparent framework for the migration from copper to fibre networks.
2.2.3 State Aid Guidelines
As part of their national broadband strategies various national, regional and local gov-ernments in Europe have provided public funds to support the widespread availability of broadband services and to support the investment in high-speed broadband infrastruc-ture for rural and underserved areas but also to accelerate the deployment of super-fast NGA also in urban areas. On 26 November 2008, the Commission adopted a European Economic Recovery Plan to drive Europe’s recovery from the financial and economic crisis. Part of the Recovery Plan is a broadband strategy which aims to boost EU in-vestment in strategic sectors such as broadband. Under the Recovery Plan the Com-mission has earmarked € 1 billion to help rural areas get online.
The European Union’s competition rules are generally critical towards State aid to sup-port private business.24 State aid is only accepted by the EU Commission under some strict rules and Member States have to apply for permission before they can grant State aid. To provide a general framework on its own State aid decisions and to give orienta-tion to Member States when they are preparing funding programs, the Commission has set up “Community Guidelines for the application of State aid rules in relation to rapid deployment of broadband networks” in September 2009.25 The Guidelines summarize the Commission’s policy in applying the State aid rules to State measures that support the deployment of traditional broadband networks and also address issues of measures to encourage and support the rapid and timely roll-out of NGA networks. In this context we will concentrate on the later ones. The Guidelines outline how public funding can be provided for broadband in line with EU State aid rules. The primary objective is to foster a wide and rapid roll-out of broadband networks while at the same time protecting com-petition in the sector.
The first general principle also to be applied for NGA is the “market economy investor principle”. Under this principle, the conformity of a public investment (equity participation or capital injection into a company) with market terms has to be demonstrated thor-oughly and comprehensively, either by means of a significant participation of private investors or the existence of a sound business plan showing an adequate return on investment. For the NGA context the Commission states that public authorities may undertake some civil works in order to enable NGA investments. If such civil works will
24 According to Article 87 (1) of the EC Treaty, “any aid granted by a Member State or through State resources in any form whatsoever which distorts or threatens to distort competition by favouring cer-tain undertakings or the production of certain goods, shall, in so far as it affects trade between Mem-ber States, be incompatible with the common market”.
25 See EU Commission (2009).

Structural models for NBN deployment 35
not be industry- or sector-specific but open to a variety of potential infrastructure uses, it will fall outside the scope of the State aid provisions.
To assess the compatibility of State aid, the Commission makes a distinction between “white”, “grey” and “black” areas. White areas are those where no NGA networks at present exist and where they are not likely to be built in the next 5 years by private in-vestors. These areas are covered by advanced basic broadband network like ADSL2+. Public authorities are entitled to intervene in such areas and to provide public funding there under certain conditions. State aid in such an area is compatible with the rules of the Treaty. In a white NGA area where one basic broadband network already exists, the grant of aid for NGA networks is subject to the demonstration that the broadband ser-vices provided are not sufficient to satisfy the needs of citizens and business users in the respective area and that there are no less distortive means available.
An area is considered as “NGA grey” where only one NGA network is in place or is be-ing deployed in the coming 5 years and there are no plans by any operator to deploy an additional NGA network in the coming 5 yeas. For grey areas a more detailed analysis on the compatibility with the State aid rules is required. State intervention in such areas risks crowding out existing investors and distorting competition. To be compatible, it has to be demonstrated that the existing or planned NGA network is not or would not be sufficient to satisfy the needs of citizens and business users and that there are no less distortive means. Decision criteria are the level of current NGA broadband prices and demand for new services that cannot be met by the existing NGA network. State aid is also possible if effective network access is not offered to third parties or access condi-tions are not conducive to effective competition.
To minimize potential distortions of competition State aid measures in white and grey areas have to meet a number of conditions. These include the following ones:
• Governments clearly have o identify which geographic areas will be covered by supporting measures and be subject to a proper market analysis.
• Public support can only be granted after an open tender process which ensures transparency for all potential investors equal and non-discriminatory treatment of bidders.
• The tendering process should also identify the bidders with the lowest subsidy requirements.
• The tendering process should not favour a certain technology but be technologi-cally neutral.
• Governments should encourage that bidders take recourse to available existing infrastructure.
36 Structural models for NBN deployment
• Mandating third parties wholesale access is a prerequisite to any subsidisation of infrastructure investment. Wholesale should be offered for at least 7 years.
• To make wholesale access effective, wholesale prices shall not be excessive and meet market benchmarks.
• To ensure that operators will not be over-compensated if demand develops stronger than predicted, a reverse payment mechanism should be accompanied with the provision of public funds.
If more than one NGA network exists in a certain area or are being deployed in the coming 5 years, such area should be considered to be “NGA black”. State support for an additional publicly-funded NGA network in such case would seriously distort compe-tition and is incompatible with the State aid rules.
There is a particular consideration regarding black areas of existing basic broadband covered areas. Here the general assumption is that existing network operators should have enough incentives to upgrade their current broadband networks to NGA and to migrate their existing customers. Therefore no State aid would be necessary or justified. If Governments can show that existing basic broadband operators to not plan to invest in NGA in the coming 5 years, State support for the deployment of NGA networks may be justified under certain safeguard conditions. First of all, all conditions which have to be met in white and grey areas are also decisive in this context. In addition some further conditions have to be met, e.g.:
• The beneficiary should be required to wholesale access for at least 7 years.
• The access obligation imposed should also include the right to use ducts and/or street cabinets.
• Access conditions should be approved or set by the NRA.
• As far as deployment of fibre-based networks is concerned the network should support a P2P multi-fibre architecture or an architecture than can be unbundled.
In 2009 the Commission took 12 decisions regarding the public funding of broadband projects.26 11 of these were found to be compatible with the State aid rules, while one was not considered aid but rather a service of General Economic Interest. The total amount of the aid approved was € 467 million.
26 See EU Commission (2010c), p. 33.

Structural models for NBN deployment 37
3 The NBN approach in worldwide perspective
3.1 Role of the state
While Governments on a worldwide basis withdraw themselves from telecommunica-tions through a policy of privatization and liberalization over the last two decades, the deployment of Next Generation Access networks has initiated a process of re-assessing and re-formulating the role of the state in and for the industry. The Australian Govern-ment took the most radical approach and transformation of its role: By taking over the role of the investor, financier and network operator for the fibre network infrastructure, the Australian State goes back to the organizational model of the industry which pre-vailed in many countries until one or two decades. That traditional organizational model of the industry has also been the one under which the currently dominating copper net-work has been deployed and rolled-out on a nationwide basis in most countries. There remains, however, one important difference between the traditional state-owned indus-try model and the Australian NBN model: The new state-owned network company will only focus on and operate as a wholesale company which is not vertically integrated into the retail business which has been the case in the former state-owned telecommu-nications authority structure. This means that the model is only monopolizing the basic infrastructure level and is relying on private sector initiatives and competition on the upper level of the network, the service and the content layer. The model is even de-signed to avoid barriers to entry and distortions of competition due to the market domi-nance of a vertically integrated entity.
Also in countries where governments do not follow the Australian example, like in Europe and the US, governments are also re-formulating their role in the industry. They are trying to reach somehow similar goals as the Australian Government but are ap-proaching their goals via indirect means which do not fundamentally change the rules of the game of the industry: They set far reaching ultra-fast broadband deployment tar-gets, but basically rely on the investment decisions of the private business entities, pro-vide some (minor) public funds or low interest debt money, try to reduce the deployment cost by various measures and try to incentivise investment by relaxing the regulatory regime.
It is interesting to note, that even in countries where the government follows a less in-terventionistic approach towards NGA deployment at a local or municipal level local governments follow the Australian example in a modified manner: They mandate their local electricity and gas utilities to build fibre access networks. Examples of such initia-tives can be found in France, Switzerland and Germany.
What are the economics of the investment of the Australian Government? The Govern-ment as the sole investor is the full and sole owner of the risk/return profile of the NBN fibre investment. The Government takes all the risk of the investment but will get no
38 Structural models for NBN deployment
economic or financial compensation for this risk because the calculated internal rate of return of the project is close to the refinancing costs of the Government in the form of public bonds. If the Government like any private investor would request an equity (and debt) risk premium, the intended roll-out would not be viable at the current level of cov-erage. That also seems to be the reason why private investors will not be given a role in the NBN Co. Therefore the NBN project is calculated as a risk-free investment project. At least the difference between the risk-free interest rate and a properly risk-adjusted interest rate of the project defines the amount of economic subsidy into the NBN pro-ject. This does not mean, that such a subsidy may not be economically justified. Insofar as the difference between the social return of the NBN project as a general purpose technology exceeds the internal rate of return of the project by the amount of the eco-nomic subsidy, the social rate of return of the project is large enough to make it a profit-able investment from the point of view of the Australian economy. If other economies which realize only a slower and later NGA roll-out and would face a bandwidth bottle-neck, the Australian economy may even get an advantage by avoiding such bottle-necks, by not loosing productivity (gains) and by improving its international competitive-ness compared to other countries.
3.2 Objectives and roll-out plan
Australia has set the path for one of the most if not the most ambitious roll-out plans for fibre deployment in the world in terms of target and speed. Once the NBN plans have been materialized, Australia will have reached a coverage of fibre access within eight years from now which the most advanced ultra-fast broadband countries, Korea and Japan, have reached today (see Table 3-1). It took more than a decade in these two countries to achieve this status.
Although some European countries have fibre deployments which exceed that of Aus-tralia today, it will be relatively clear that none of the European countries will achieve a similar degree of coverage within the next years. The current investment plans of opera-tors and national broadband plans are not compatible with such a deployment growth. In particular we have great doubts that the ultra-fast broadband and fibre deployment targets of the Digital Agenda in the EU, which require a fibre network coverage of around 80% by 2020 in all Member States27, can be achieved at all. These broadband targets are simply not compatible with the current degree of investment and the an-nounced plans of operators in Europe. Furthermore, there is no implementation plan at the horizon in Europe which is focussed on making the targets achievable.
27 See section 2.2.1.

Structural models for NBN deployment 39
Table 3-1: Fibre roll-outs in selected countries, 2009
Country Type
Homes activated
Millions
Homes passed
Millions
Penetration
% homes passed
Homes passed
% total homes
Penetration
% all homes
Japan FTTH 15.0s 46.8 32 93 30
South Korea FTTB/N 7.3 ~18.0 39 92 36
US FTTH 4.4 15.2 29 15 4
Sweden FTTH 0.4 1.0 43 23 10
Italy FTTB 0.3 2.2 15 10 2
Netherlands FTTH 0.2 0.8 28 8 2
Norway FTTH 0.2 0.3 68 13 9
France FTTH 0.2 ~5.5 4 18 1
Denmark FTTH 0.1 0.7 15 20 3
Note: All figures are for June 2009, except Japan and US. Japan homes passed figure is from Septem-ber 2008 (most recent available). Other Japan and US figures are from March 2009.
Source: Japanese Ministry of Internal Affairs and Communications, IDATE, RVA LLC, Analysys Mason; cited from the NBN Implementation Study, p. 239
If Australia really follows its current NBN intentions and plans, it will have caught up with its most advanced peers in Asia in less than 10 years. At the same time it will have overtaken Europe and probable also the USA in fibre deployment and penetration by far.
The deployment of fast and ultra-fast broadband access has become a major field of policy concern in the last two years in many countries around the globe. Governments and Parliaments have formulated far reaching broadband targets, strategies and plans. Table 3-2 gives a flavour of some of the most recent and most known Government pro-grams to foster deployment and take-up of Next Generation Access networks. Many programs either concentrate upon or at least have a clear focus on universal coverage with a basic broadband access. Many national broadband strategies are yet less ambi-tious on ultra-fast broadband networks.
Compared to most European broadband plans the Australian approach is much more ambitious and seems to be much more driven by the perspective to catch up with its most advanced Asian counterparts. Therefore, the Australian strategy is more focussed on ultra-fast broadband access. There is another major difference of the Australian ap-proach and that one of the European peers: Australia is not only competing on targets, it is much more focussed on a clear implementation strategy to implement the policy objectives. Most of the European strategies consist of a bunch of measures mostly only indirectly affecting the implementation of the policy objectives. Public funds in all Euro-
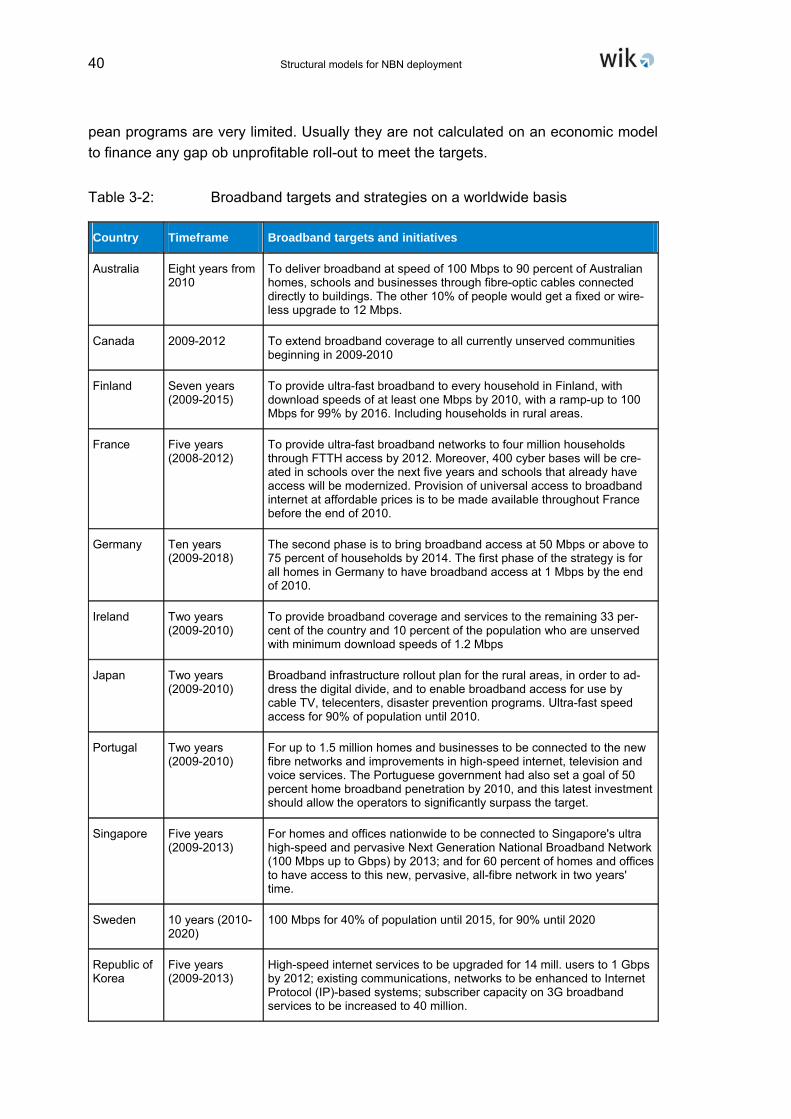
40 Structural models for NBN deployment
pean programs are very limited. Usually they are not calculated on an economic model to finance any gap ob unprofitable roll-out to meet the targets.
Table 3-2: Broadband targets and strategies on a worldwide basis
Country Timeframe Broadband targets and initiatives
Australia Eight years from 2010
To deliver broadband at speed of 100 Mbps to 90 percent of Australian homes, schools and businesses through fibre-optic cables connected directly to buildings. The other 10% of people would get a fixed or wire-less upgrade to 12 Mbps.
Canada 2009-2012 To extend broadband coverage to all currently unserved communities beginning in 2009-2010
Finland Seven years (2009-2015)
To provide ultra-fast broadband to every household in Finland, with download speeds of at least one Mbps by 2010, with a ramp-up to 100 Mbps for 99% by 2016. Including households in rural areas.
France Five years (2008-2012)
To provide ultra-fast broadband networks to four million households through FTTH access by 2012. Moreover, 400 cyber bases will be cre-ated in schools over the next five years and schools that already have access will be modernized. Provision of universal access to broadband internet at affordable prices is to be made available throughout France before the end of 2010.
Germany Ten years (2009-2018)
The second phase is to bring broadband access at 50 Mbps or above to 75 percent of households by 2014. The first phase of the strategy is for all homes in Germany to have broadband access at 1 Mbps by the end of 2010.
Ireland Two years (2009-2010)
To provide broadband coverage and services to the remaining 33 per-cent of the country and 10 percent of the population who are unserved with minimum download speeds of 1.2 Mbps
Japan Two years (2009-2010)
Broadband infrastructure rollout plan for the rural areas, in order to ad-dress the digital divide, and to enable broadband access for use by cable TV, telecenters, disaster prevention programs. Ultra-fast speed access for 90% of population until 2010.
Portugal Two years (2009-2010)
For up to 1.5 million homes and businesses to be connected to the new fibre networks and improvements in high-speed internet, television and voice services. The Portuguese government had also set a goal of 50 percent home broadband penetration by 2010, and this latest investment should allow the operators to significantly surpass the target.
Singapore Five years (2009-2013)
For homes and offices nationwide to be connected to Singapore's ultra high-speed and pervasive Next Generation National Broadband Network (100 Mbps up to Gbps) by 2013; and for 60 percent of homes and offices to have access to this new, pervasive, all-fibre network in two years' time.
Sweden 10 years (2010-2020)
100 Mbps for 40% of population until 2015, for 90% until 2020
Republic of Korea
Five years (2009-2013)
High-speed internet services to be upgraded for 14 mill. users to 1 Gbps by 2012; existing communications, networks to be enhanced to Internet Protocol (IP)-based systems; subscriber capacity on 3G broadband services to be increased to 40 million.

Structural models for NBN deployment 41
Country Timeframe Broadband targets and initiatives
Spain Four years (2009-2012)
To have greater reach of broadband in rural and isolated areas. This is done by focusing on centres with dispersed populations and extending the reach of trunk fibre-optics networks.
USA Ten years (2010-2020)
2015: 100 million U.S. homes should have affordable access to actual download speeds of 50 Mbps and actual upload speeds of 20 Mbps; 2020: 100 million U.S. homes should have affordable access to actual download speeds of at least 100 Mbps and actual upload speeds of at least 50 Mbps.
EU 2010-2020 Basic broadband for all by 2013; coverage of fast broadband at 30 Mbps for 100% of EU population by 2020; 50% subscription of households to ultra-fast broadband (100 Mbps) by 2020
Source: Qiang (2010) and WIK
3.3 Investment and architecture
According to the most recent estimates of the NBN implementation study the necessary investment to provide FTTH coverage for 93% of all Australian homes and businesses amounts to 43 billion AUD. On the basis of 11 million access lines this corresponds to an average of 3,900 AUD (or ca. 2,600 €) per fibre line and home passed. These rela-tive investment requirements look relatively high if compared with corresponding in-vestment numbers in Europe which are in the range of 1,500 and 2,500 €.28 For a na-tionwide FTTH coverage (100%) we have calculated in a detailed modelling approach for Switzerland average investment cost of 3,500 €. If the fibre network coverage would be limited to 80% of population, the average investment cost would decrease to 2,000 €.29
Based on the notion to bring fibre to (nearly) every home in Australia, the basic architec-tural network decision is in favour of an FTTH deployment approach. Bringing the fibre into the customer’s home requires additional investment for fibre inhouse cabling which is usually not available yet. On the other hand, FTTH does not entail the restrictions of FTTB, where the fibre is only deployed to the building, existing inhouse copper wiring is used and the signal usually is transmitted inhouse via DSL. A FTTB approach would have to deal with the capacity and other restrictions of FTTB and VDSL. Such architec-tures have a very limited capability of being upgraded to Gbps applications. Because FTTB relies on a shared medium approach for parts of the fibre link, this architecture does not support full unbundling of the fibre access line and does therefore not support competition models based on unbundling. In that respect the basic architectural de-ployment decision in Australia is rather future oriented and future proof enabling any
28 Such numbers, however, often are derived for roll-outs with a lower degree of coverage. 29 See Ilic, Neumann, Plückebaum (2009a).

42 Structural models for NBN deployment
scalable upgrade of the fibre network capabilities on the electronic part of the network where the economic lifetime of the assets is much shorter than for the passive infra-structure, creating a lot of path dependencies of engineering decisions made in the past. In comparison, it may be worthwhile mentioning that many (not all) fibre projects in Europe rely on deploying FTTB. The main reason for this limited approach relates to the problems which operators are facing with landlords and house owners to deploy fibre inhouse. It seems to be less relevant that they want to save the investment expenditure for inhouse cabling. A state-owned NBN Co will be in a more favourable position to solve such inertia.
In front of this background it is a bit surprising that the Government leaves the second major architectural decision up to a management decision of NBN Co at a later stage: The decision whether to deploy a PON or a Point-to-Point (P2P) architecture. In a PON architecture a fibre between the MPoP and a passive optical splitter is shared between a group of (up to 64) users. Only from a distribution point in the field an individual fibre is dedicated to a single customer. In a P2P architecture on the other hand a separated fibre is dedicated to a single customer from the MPoP. Due to the shared fibre element, a PON architecture is facing capacity constraints to the individual user, while the poten-tial capacity of the P2P architecture is technically unlimited by the passive fibre network architecture and only limited by the electronics applied. The capacity limits of PON which are 2.5 Gbps which have to be shared between up to 64 users may not be a con-straining factor nowadays but depending on future demand growth, it may become rele-vant factor. In that sense a P2P architecture is a more future-proof and flexible architec-ture than PON. Furthermore, P2P is much better supporting unbundling as a competi-tive option than PON. In a PON architecture a competing operator has to build out its own network up to the splitter point, while in the P2P case this network only has to reach the MPoPs. The barriers to entry for competition are therefore much higher (if not prohibitive) in a PON architecture compared to P2P.
The Government leaves it to a business decision of NBN Co to decide on this second fundamental architectural issue. In Europe it is often the incumbents which decide in favour of PON not at least to make life harder for competitors. The open access concept of fibre network is more supported by a P2P architecture. Therefore, it is surprising that the Australian Government is not (yet) following such an approach. It has to be men-tioned that the (initial) investment cost of a P2P architecture are higher than deploying a PON network. According to our model calculations the additional investment costs are in the range of 6% to 10%. A CBA would reveal that the benefits of a P2P architecture are large enough to outbalance the higher investment costs. It is worth mentioning that the two incumbent operators in Europe which are engaged in the largest fibre deploy-ment plans, KPN in the Netherlands and Swisscom in Switzerland, both have decided in favour of a P2P architecture, although both were unconstrained by their Governments or their NRAs on their architecture decision.

Structural models for NBN deployment 43
3.4 Competition and open access
There is a intensive debate ongoing on the proper incentives to invest in NGA and tak-ing care of and initiate more incentives to invest in Europe. Incumbents are heavily in-volved in this debate – but not only they – and request a regulation for fibre networks which is different to the one of the traditional legacy network, regulatory holidays or even question the need for fibre regulation at all. On the other hand, there is a lot of enthusiasm on open access to fibre networks. Often the request for regulatory holidays or a more complete suspension of regulation regarding fibre investment is rather short-term oriented. The arguments are mainly focussed on the first phase of NGA develop-ment. In the first stage, NGA is a new service competing against services provided over the old legacy network infrastructure. It is in an infant industry stage. In the medium and long term, however, a fibre access network infrastructure will substitute the current cop-per access technology. It is the superior technology. The customer base of the current network will be migrated to the new access infrastructure independent of the composi-tion of services end-users are demanding over the infrastructure. Even pure telephony subscribers may under this scenario be served by the fibre network. It is obvious that under this most relevant scenario fibre access will become a competitive bottleneck and the operator of the network will be in a SMP position at a certain point in time. If the (old) incumbent is investing in the fibre access network, it will remain in its previous SMP position. If another operator invests in fibre, he will instead reach the SMP position after some period in time. In same countries (including) Germany not a single fibre op-erator may occur but many with a local or regional focus of operation. Duplication and replicability of the basic fibre access network remains, according to all model calcula-tions of costs, an illusion.30 This does not exclude that in the very few most dense areas replicability may be possible or that duplication of fibre infrastructure temporarily occurs in the first mover competition on becoming the SMP operator. This assessment does also not exclude that we will see some competition on ultra-fast broadband access be-tween HFC cable networks and FTTH networks for some while.
The NBN concept seems to anticipate that situation and makes open access of the fibre infrastructure the constitutional principle of the whole organizational model of the indus-try. NGN Co. although not getting a (formal) monopoly in deploying fibre access net-works will de facto become the sole fibre access provider because of the non-replicability of the investment. This outcome now will be mostly supported by the fact that Telstra has been bought out to support the NBN development with its own useable access network resources. NBN Co will become a wholesale only company and will not provide any retail service at all. Any retail company will be free to buy NBN Co’s whole-sale service under non-discriminatory conditions. For me the somewhat surprising con-cept of open access is only concentrating on a layer 2 bitstream access service. This concept allows and gives a mandate to NBN Co. not only to focus on the passive fibre
30 We have provided some of those model results in section 4.1.1.
44 Structural models for NBN deployment
network but also to invest in the electronics of major parts of the active network. Active wholesale products always generate more technological restrictions to access seekers than passive access product. Insofar as these restrictions are binding and relevant, in-novation at the service or the service quality level is negatively affected. The alternative or at least a complement to bitstream access is unbundling. Unbundling limits the wholesale provision to the passive part of the fibre network. Relevant wholesale prod-ucts based on the unbundling principle are depending on the fibre network architec-ture.31 I can only shortly refer to this context. A point-to-point FTTH architecture offers the best opportunities for unbundling. In this case access seekers have to roll-out their own fibre network up to the Metropolitan Point of Presence; here they get access to the individual fibre access line without any technical constraints. This concept is quite simi-lar to the LLU concept universally applied in today’s copper access network. In case of a shared architecture like PON, access seekers can only get access at a distribution or concentration point of the fibre network where the access line become dedicated to a single user. Such concentration points are much closer to the end-user and could in the extreme case of FTTB even be located within a building. This unbundling concept is somehow comparable to the sub-loop unbundling concept in the copper access net-work. Sub-loop unbundling requires deployment of own fibre by an access seeker to a significant deeper level of the network generating much higher barriers to entry. An un-bundling concept which can be applied independent of the fibre architecture is wave-length unbundling. This concept works in the backbone network but is still in the de-velopment phase regarding the access network.
Unbundling is foreseen in the NBN concept only in the phase after the full deployment of the fibre network or even after the privatization of NBN Co, while in Europe it will be-come the primary concept of fibre access.32 This is surprising for an oversea’s observer insofar as the fibre architecture concept still is an open issue in Australia including P2P FTTH and because excluding unbundling unnecessarily limits the area and scope of competition. It is furthermore surprising because there is no stakeholder opposition against unbundling and it is not an impediment to invest. Unbundled and bitstream ac-cess are by-the-way not mutually exclusive access concept. The first best solution seems to be an optional approach such that access seekers have the choice of the most efficient access products according to their individual needs.
3.5 Cost benefit analysis
While there is a good understanding of the investment and the cost of rolling-out a NGA network, the benefits besides substituting the current copper-based access network is less clear. Although there is a strong believe that current access networks are running
31 A detailed description of unbundling wholesale products in case of fibre networks is provided by BEREC (2010).
32 See the discussion on the NGA Recommendation in section 2.2.2.

Structural models for NBN deployment 45
into capacity bottlenecks regarding bandwidth availability, it seems much more uncer-tain whether end-users are willing to pay more for ultra-fast broadband access com-pared to basic broadband access and/or whether new services generate a sufficient additional revenue potential to cover the higher cost of fibre networks. Even if one does not only consider the private value of an NGA but also the (additional) social value, the uncertainties remain. Nevertheless, there is the case that the social returns of ultra-fast broadband connectivity are potentially (much) larger than the costs of building the net-work and at the same time operators do not invest because their private returns would be lower than the cost of the network.
Structurally, Figure 3-1 describes he decision problem: The benefit/cost margin of the NGA will be lower in the beginning than the margin of the current technology. Only over time the benefit/cost margin of the NGA will exceed the margin of the current technol-ogy. Under this structure the private and social viability of NGA becomes a matter of the relevant discount rate of costs and benefits. Cost-benefits-analysis (CBA) becomes in particular relevant and important if (partial) public or governmental funding is part of the financing approach. As a general rule, public funding is only justified if and up to the point where the (additional) social value of the NGA equals the investment cost.
Figure 3-1: Cost and benefits of the NGA
Current cost
Current benefitNGA cost
NGA Benefit
Cost/benefit
Time
∆B
∆C
Source: Plum (2008)
Ingenious Consulting (2010) has produced an international benchmarking study for as-sessing the trade-off between value of broadband coverage and the profitability of in-vestment, which is of interest in this context because it compares Australia with a vari-ety of European countries. The value of broadband is considered against the classical economic concepts of consumer value, producer value and externalities as illustrated in
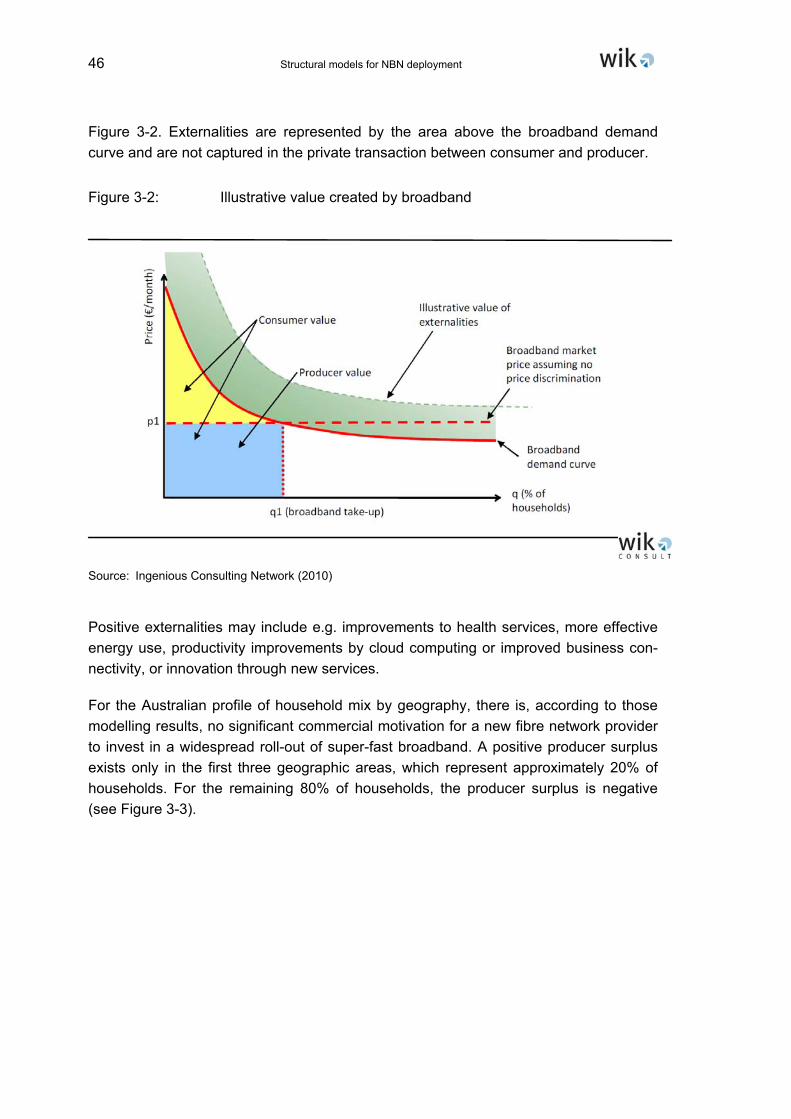
46 Structural models for NBN deployment
Figure 3-2. Externalities are represented by the area above the broadband demand curve and are not captured in the private transaction between consumer and producer.
Figure 3-2: Illustrative value created by broadband
Source: Ingenious Consulting Network (2010)
Positive externalities may include e.g. improvements to health services, more effective energy use, productivity improvements by cloud computing or improved business con-nectivity, or innovation through new services.
For the Australian profile of household mix by geography, there is, according to those modelling results, no significant commercial motivation for a new fibre network provider to invest in a widespread roll-out of super-fast broadband. A positive producer surplus exists only in the first three geographic areas, which represent approximately 20% of households. For the remaining 80% of households, the producer surplus is negative (see Figure 3-3).
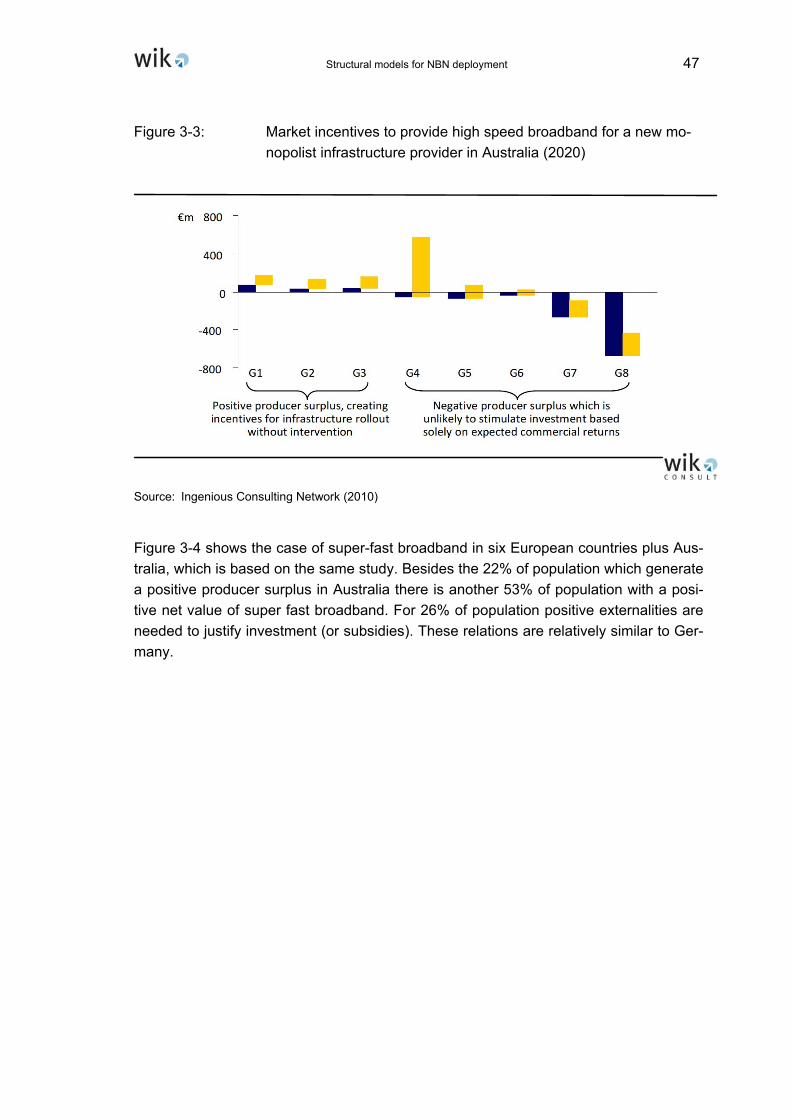
Structural models for NBN deployment 47
Figure 3-3: Market incentives to provide high speed broadband for a new mo-nopolist infrastructure provider in Australia (2020)
Source: Ingenious Consulting Network (2010)
Figure 3-4 shows the case of super-fast broadband in six European countries plus Aus-tralia, which is based on the same study. Besides the 22% of population which generate a positive producer surplus in Australia there is another 53% of population with a posi-tive net value of super fast broadband. For 26% of population positive externalities are needed to justify investment (or subsidies). These relations are relatively similar to Ger-many.
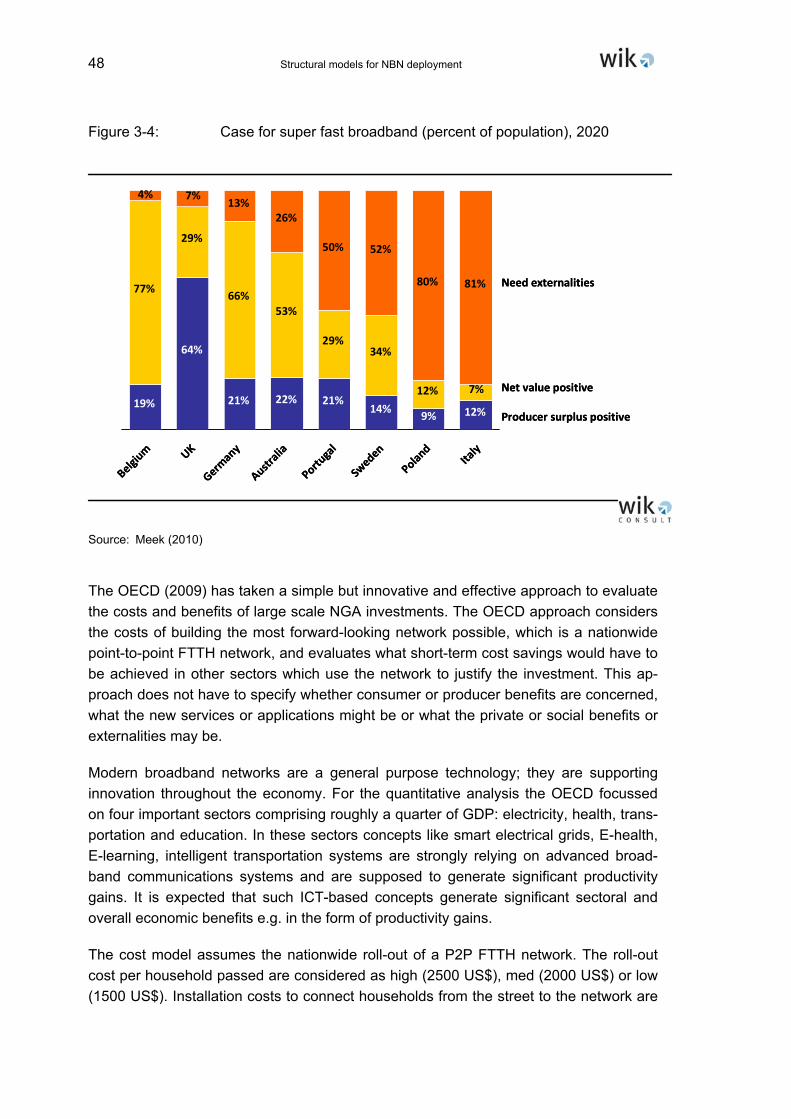
48 Structural models for NBN deployment
Figure 3-4: Case for super fast broadband (percent of population), 2020
19%
64%
21% 22% 21%14%
9% 12%
77%
29%
66%53%
29%34%
12% 7%
4% 7%13%
26%
50% 52%
80% 81%
Belgium UK
Germany
Australia
Portugal
Sweden
Poland
Italy
Need externalities
Net value positive
Producer surplus positive19%
64%
21% 22% 21%14%
9% 12%
77%
29%
66%53%
29%34%
12% 7%
4% 7%13%
26%
50% 52%
80% 81%
Belgium UK
Germany
Australia
Portugal
Sweden
Poland
Italy
Need externalities
Net value positive
Producer surplus positive
Source: Meek (2010)
The OECD (2009) has taken a simple but innovative and effective approach to evaluate the costs and benefits of large scale NGA investments. The OECD approach considers the costs of building the most forward-looking network possible, which is a nationwide point-to-point FTTH network, and evaluates what short-term cost savings would have to be achieved in other sectors which use the network to justify the investment. This ap-proach does not have to specify whether consumer or producer benefits are concerned, what the new services or applications might be or what the private or social benefits or externalities may be.
Modern broadband networks are a general purpose technology; they are supporting innovation throughout the economy. For the quantitative analysis the OECD focussed on four important sectors comprising roughly a quarter of GDP: electricity, health, trans-portation and education. In these sectors concepts like smart electrical grids, E-health, E-learning, intelligent transportation systems are strongly relying on advanced broad-band communications systems and are supposed to generate significant productivity gains. It is expected that such ICT-based concepts generate significant sectoral and overall economic benefits e.g. in the form of productivity gains.
The cost model assumes the nationwide roll-out of a P2P FTTH network. The roll-out cost per household passed are considered as high (2500 US$), med (2000 US$) or low (1500 US$). Installation costs to connect households from the street to the network are

Structural models for NBN deployment 49
considered in addition. Although there is full coverage of the network, the OECD con-siders three different take-up scenarios (25%, 50% and 75% of households). The inter-est rate takes a low value of 5%, but the amortization period is also very low with only 10 years, where the economic lifetime of a fibre network is more than 20 years.
The benefits are represented by savings in total spending in each of the four sectors. Electricity in the OECD corresponds to roughly 4% of GDP, health to 11%, transporta-tion to 5%, and education to another 5%. Spill-overs to other sectors are not considered in this quantitative approach.
Figure 3-5 shows the need for cost savings in each of the sectors to justify (or to fi-nance) the building of a national FTTH network. Depending on the scenario assump-tions on the roll-out costs and the take-up rate, these savings need to be between 0.6% and 1.5% for the OECD average. The corresponding values for Australia are in the same range from 0.57% to 1.47% but always slightly below the OECD average. The lower range is tied to countries with lower-cost roll-outs and the upper range for coun-tries where roll-out costs are closer to 2500US$ per household. Table 3-3 shows that there are significant differences across countries, largely influenced by the size of each and the combined four sectors.
Figure 3-5: Necessary savings to spending in four sectors (OECD average)
Cost per householdTake-up rate
Necessary 10 yearcost savings
Installation to all households
0.00%
0.20%
0.40%
0.60%
0.80%
1.00%
1.20%
1.40%
1.60%
1.80%
$150025%
$150050%
$150075%
$200025%
$200050%
$200075%
$250025%
$250050%
$250075%
OECD averageAustralia
Source: Based on data of OECD (2009)

50 Structural models for NBN deployment
Table 3-3: Necessary savings to spending in four sectors (selected OECD countries); high-cost roll-out and high take-up
1.27%2.93%5.99%6.12%8.74%OEDC
0.86%1.64%5.03%4.10%8.69%United States
1.22%3.31%4.44%5.49%9.18%United Kingdom
1.22%3.32%6.81%5.84%4.95%Sweden
1.60%3.86%7.01%8.91%9.16%Spain
4.72%12.94%30.80%35.42%13.52%Slovak Republic
5.02%15.82%26.64%23.98%17.62%Poland
2.43%7.88%11.34%8.45%12.81%Korea (Rep. of)
1.41%3.39%5.96%8.43%7.69%Italy
3.47%11.95%13.83%19.79%12.24%Hungary
1.69%3.78%7.68%10.90%9.50%Greece
1.60%3.53%7.73%8.56%10.37%Germany
1.27%3.71%6.59%6.36%4.83%Finland
3.34%10.59%17.98%21.54%9.70%Czech Republic
0.97%2.52%6.06%5.53%3.52%Canada
1.23%2.86%5.92%6.39%7.10%Austria
1.21%3.55%5.78%5.69%5.11%Australia
FTTH roll-out costs as % of total
spending (4 sectors)
FTTH roll-out costs as % of health
spending
FTTH roll-out costs as % of transport
spending
FTTH roll-out costs as % of education
spending
FTTH roll-out costs as % of electricity
spending
High-cost roll-out (USD 2 500) / High take up (75%) / Connecting all homes
Source: OECD (2009)
It is worth noting that the NBN implementation study33 did not conduct a comprehensive CBA for the Australian NGN project. The implementation study, however, shows that the internal rate of return of the NGN project is slightly higher than the bond rate under specific assumption made in the study.
4 Demand as a success factor for ultra-fast broadband
Most of the broadband plans on the table so far focus on the supply side of the fibre game: Governments and regulators take care that new fibre networks are rolled-out as deeply and broadly as possible and that competitors get access to the fibre infrastruc-ture to develop competitive models. Also operators deploying fibre are mainly focussing on the roll-out and less on demand for fibre access. Initially, they have no other chance: In a given deployment area fibre can efficiently only be rolled-out such that nearly 100% of the homes passed are also connected to the network independent of the actual de-mand. The supply-driven character of the roll-out also defines the greatest economic risk of a fibre project which is take-up or penetration. Any viable business plan of fibre requires a fibre penetration rate between 50% and 100% of the total potential customer base of all access lines. Demand becomes the critical requirement for profitability. This
33 McKinsey/KPMG (2010).
Structural models for NBN deployment 51
is particular an issue when and as long as customers can choose between copper (ADSL) broadband access and fibre access. Japan as the most advanced country in fibre deployment is a good example of this problem. Although Japan already has a FTTH coverage of more than 90%, the fibre penetration in terms of households cur-rently “only” amounts to 35%. A relevant although declining part of the broadband ac-cess demand in Japan still is satisfied with ADSL access.
Once the roll-out of a NBN is ongoing, all stakeholders, Government, operators, regula-tors and taxpayers, should have an interest, that users actually make use of the capa-bilities of the NBN. Demand for NBN has two components: The willingness to become a NBN subscriber and the willingness to use advanced services provided over the NBN. Also in a NBN context demand for access is interrelated to the demand for services. Only if it is attractive enough to use the services which are only provided over or are provided in a better quality over the NBN, a user decides in favour of an NBN subscrip-tion. The speed of take-up and therefore the viability of the NBN strongly depends on the availability of attractive services provided over the NBN. The Government and all other NBN stakeholders should therefore take care that not only investments in the NBN infrastructure are carried out. It is of similar importance that complementary in-vestments in service development are carried out.
Given the importance of take-up and penetration, some broadband strategies incenti-vise subscription to NGA either through direct financial transfers or tax credits. In par-ticular in areas which are not viable for a profitable roll-out setting incentives for invest-ments directly conducted by users e.g. for inhouse cabling or drop cable investment to a network node would not only expand the area of profitable coverage. Sunk investment conducted by a user to be connected to a NGA provides the strongest incentive to be-come a NBN subscriber.

52 Structural models for NBN deployment
References
BEREC (2010): Next Generation Access – Implementation Issues and Wholesale Products, BEREC Report, BoR (10) 08, March 2010
Chaillou, Valérie (2010): General Overview of FTTx Markets at end 2009, in: Communications & Strategies, 78, 2nd Q. 2010
Crausaz, Débieux (2009): Key drivers and challenges, Geneva carrier’s lunch, 20 February 2009
Elixmann, Dieter; Ilic, Dragan; Neumann, Karl-Heinz; Plückebaum, Thomas (2008): The Eco-nomics of Next Generation Access – Final Report, Study for the European Competitive Telecommunication Association (ECTA), 10. September 2008
European Commission (2010a): Draft Commission Recommendation on regulated access to Next Generation Access Networks (NGA), C(2010), Brussels, 28. April 2010
European Commission (2010b): Communication from the Commission, Europe 2020, A strategy for smart, sustainable and inclusive growth, COM(2010)2020, Brussels, 3.3.2010
European Commission (2010c): Commission staff working document accompanying the com-munication from the Commission to the European Parliament, The Council, The Euro-pean Economic and Social Committee and the Committee of the Regions, Progress re-port on the single European electronic communications market (15th report), COM(2010) 253, SEC(2010) 630 final, Brussels, 25.5.2010
European Commission (2010d): Communication from the Commission to the European Parlia-ment, The Council, The European Economic and Social Committee and The Committee of the Regions, A Digital Agenda for Europe, COM(2010)245, Brussels, 19.05.2010
European Commission (2009): Community Guidelines for the application of State aid rules in relation to rapid deployment of broadband networks, Brussels, 2009
Fibre-to-the-Home Council (2010): FTTH Conference 2010, 24 – 25 February
Gromard, Amaury de (2009): Upgrading the Network with "fibre suisse", Presentation at the Next Generation Telecoms Wholesale 2009 Conference, Berlin 12 – 14 January 2009
IDATE (2008): IDATE for FTTH Council Europe, FTTH European Panorama, December 2008
Ilic, Dragan, Neumann, Karl-Heinz, Plückebaum, Thomas (2009a): Szenarien einer nationalen Glasfaserausbaustrategie in der Schweiz [Scenarios of a national fibre deployment stra-tegy in Switzerland], Study for the Swiss NRA BAKOM, December 2009
Ilic, Dragan, Neumann, Karl-Heinz, Plückebaum, Thomas (2009b): The Economics of Next Gen-eration Access – Addendum, Study for the European Competitive Telecommunications Association ECTA, July 2009
Ingenious Consulting Network (2010): Optimal Investment in Broadband: The Trade-Off Be-tween Coverage & Network Capability, April 2010
McKinsey/KPMG (2010): NBN implementation study, 2010
Meek, Kip (2010): Optimal Investment in Broadband in the UK and elsewhere: The Trade-Off Between Coverage & Network Capability, Paper presented at the International WIK Con-

Structural models for NBN deployment 53
ference “National strategies for ultrabroadband infrastructure deployment: Experiences and challenges”, Berlin, April 2010
OECD (2009): Working Party on Communication Infrastructures and Services Policy, Network Developments in Support of Innovation and User Needs, Directorate for Science, Tech-nology and Industry, Committee for Information, Computer and Communications Policy, DSTI/ICCP/CISP(2009)2/FINAL, December 2009
Plum (2008): A Framework for Evaluating the Value of Next Generation Broadband, Study for the Broadband Stakeholder Group
Qiang, Christine Zhen-Wei (2010): Broadband infrastructure investment in stimulus packages: relevance for developing countries, Telecommunications Policy, Vol. 12 NO.2, 2010