structural design and management of defined … design and management of defined contribution...
TRANSCRIPT
Stuart Brahs – Vice President
Federal Government Relations
May 29-30, 2003
Structural Design and Management of Defined Contribution Programs
Stuart Brahs – Vice President
Federal Government Relations
May 29-30, 2003
Hyderabad, IndiaHyderabad, India
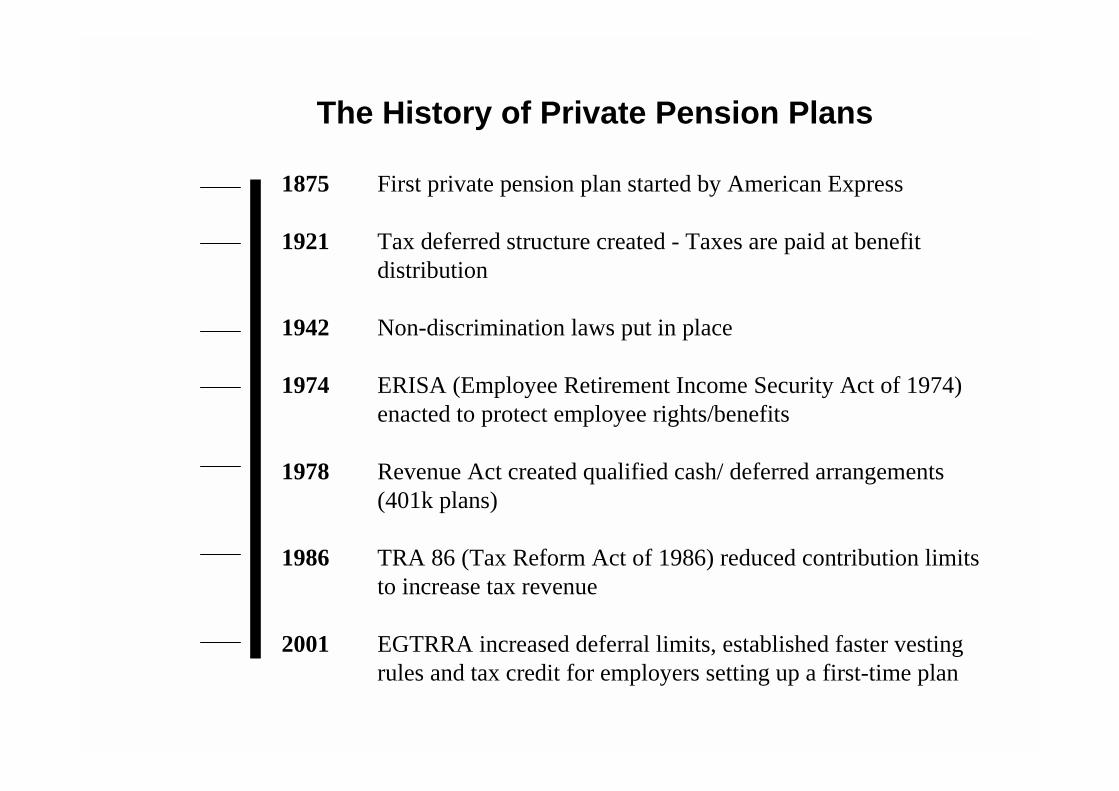
The History of Private Pension Plans
1875 First private pension plan started by American Express
1921 Tax deferred structure created - Taxes are paid at benefit distribution
1942 Non-discrimination laws put in place
1974 ERISA (Employee Retirement Income Security Act of 1974) enacted to protect employee rights/benefits
1978 Revenue Act created qualified cash/ deferred arrangements(401k plans)
1986 TRA 86 (Tax Reform Act of 1986) reduced contribution limits to increase tax revenue
2001 EGTRRA increased deferral limits, established faster vesting rules and tax credit for employers setting up a first-time plan
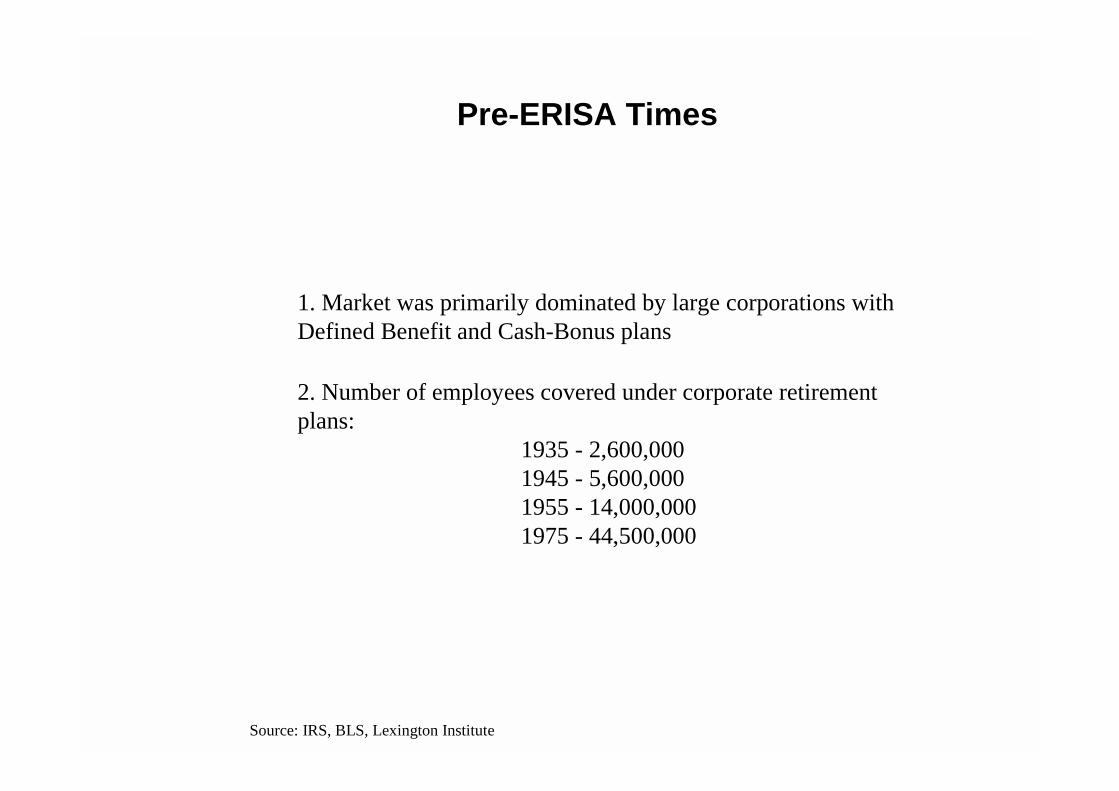
1. Market was primarily dominated by large corporations with Defined Benefit and Cash-Bonus plans
2. Number of employees covered under corporate retirement plans:
1935 - 2,600,000 1945 - 5,600,0001955 - 14,000,0001975 - 44,500,000
Pre-ERISA Times
Source: IRS, BLS, Lexington Institute
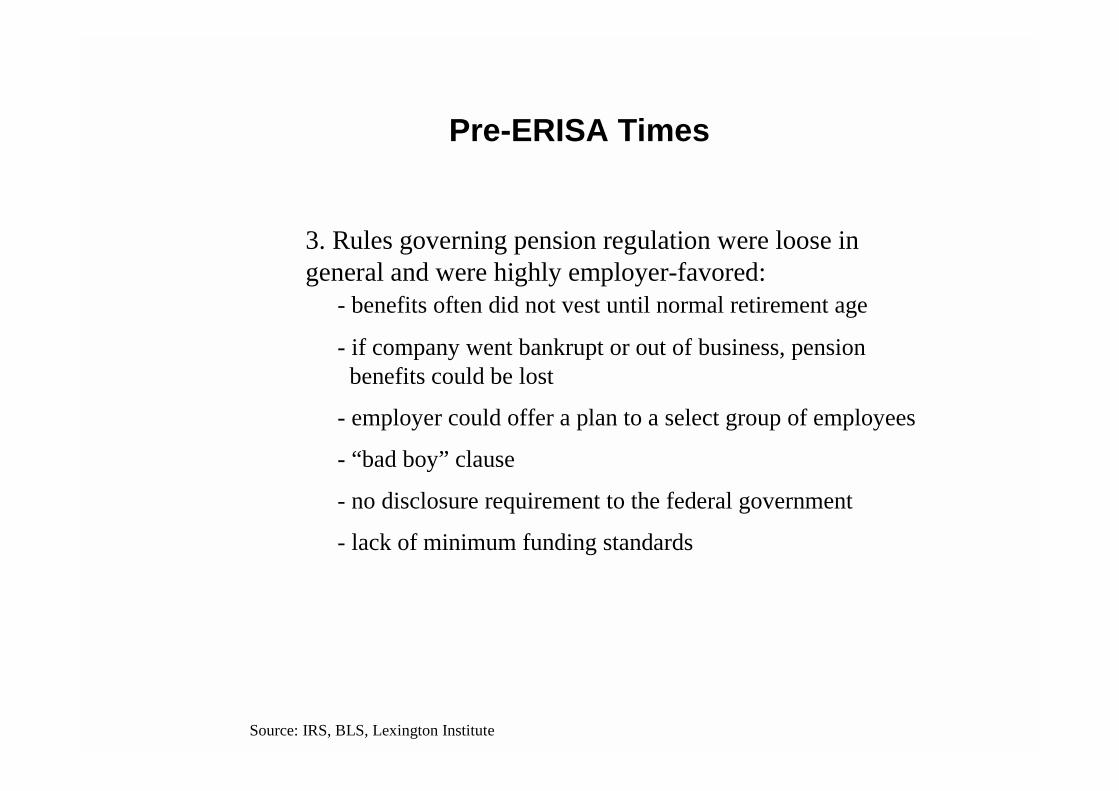
3. Rules governing pension regulation were loose in general and were highly employer-favored:
- benefits often did not vest until normal retirement age
- if company went bankrupt or out of business, pension benefits could be lost
- employer could offer a plan to a select group of employees
- “bad boy” clause
- no disclosure requirement to the federal government
- lack of minimum funding standards
Pre-ERISA Times
Source: IRS, BLS, Lexington Institute
In 1974 the “Employee Retirement Income Security Act” (ERISA) was passed:
- Curtailed employer abuse in retirement programs
- Pension Benefit Guarantee Corporation (PBGC)
- Rules about eligibility, benefit limits, funding, vesting, reporting and disclosure all came into being
- Allowed individual retirement accounts (IRAs) for individuals not covered under an employer-sponsored pension plan
ERISA Times
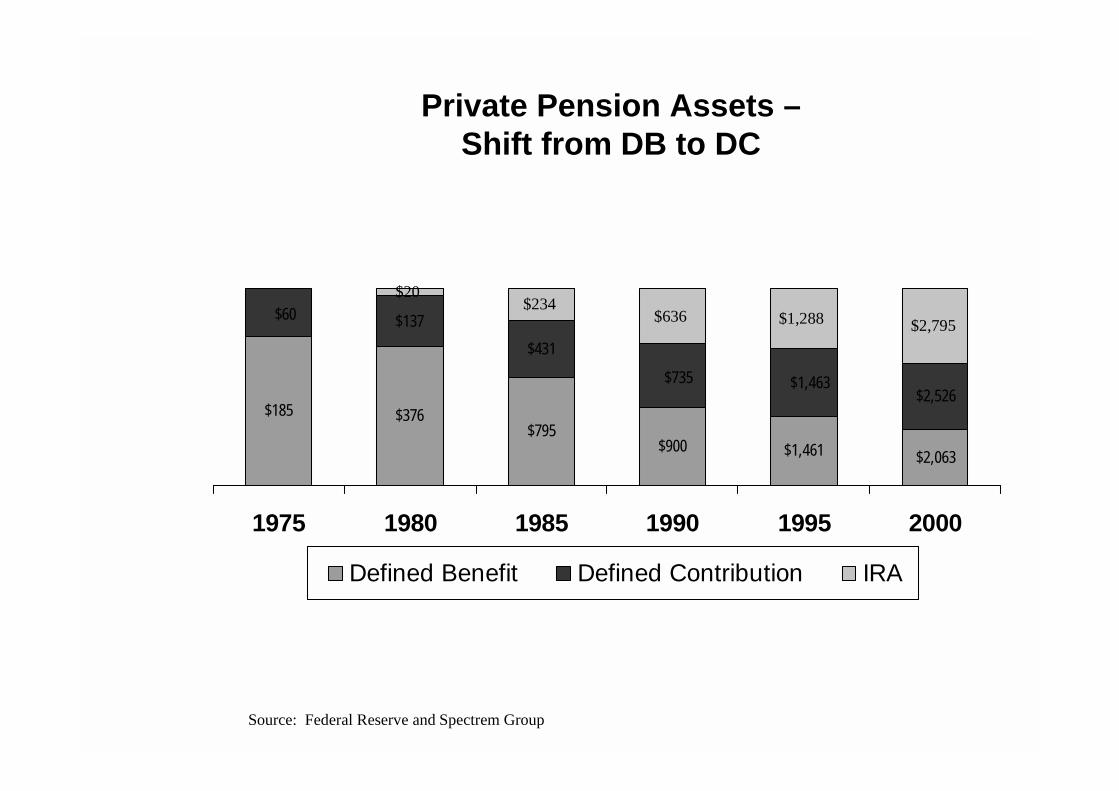
Private Pension Assets –Shift from DB to DC
Source: Federal Reserve and Spectrem Group
$185 $376$795
$900 $1,461 $2,063
$137
$431
$2,526
$20$234
$636 $1,288 $2,795
$1,463$735
$60
1975 1980 1985 1990 1995 2000
Defined Benefit Defined Contribution IRA
• During the 1970’s a number of factors came together to make 401(k) plans considerably more attractive to employers than other types of retirement plans available at that time. The major impetus behind the shift can be shared by four distinct parties which responded to the changes in the external environment:
! Congress - and to a lesser extent the Executive Branch
! Financial Services Firms! Plan Sponsors
! Plan Participants
Key Success Factorsin the Shift from DB to DC Plans:
Societal and Consumer Trends:
The private sector work force of the 70s and 80s represented a dramatic shift from the prior generation.
– No longer considered first employer as their partner for life
– Rampant inflation resulted in employees losing their jobs
– Many Americans became more aggressive savers and investors
– Employees did not see the value in the traditional Defined Benefit structure
Influence of Socio-Economic Trends on Retirement
Business and Economic Trends:In the late 1970s private sector employers in the US were faced with dramatic changes affecting both their work force and their ability and willingness to fund traditional pension schemes.
• DB plans are costly:– High inflation forced higher salary levels and thus increased the liability
for benefits– Equity market returns were below average resulting in plan investment
performance below the expectations used in determining contributions
• An overall shift in jobs from the manufacturing sector to the service sector
• These changes accelerated a desire to create a more economical solution to providing pension benefits to these employees
Influence of Socio-Economic Trends on Retirement
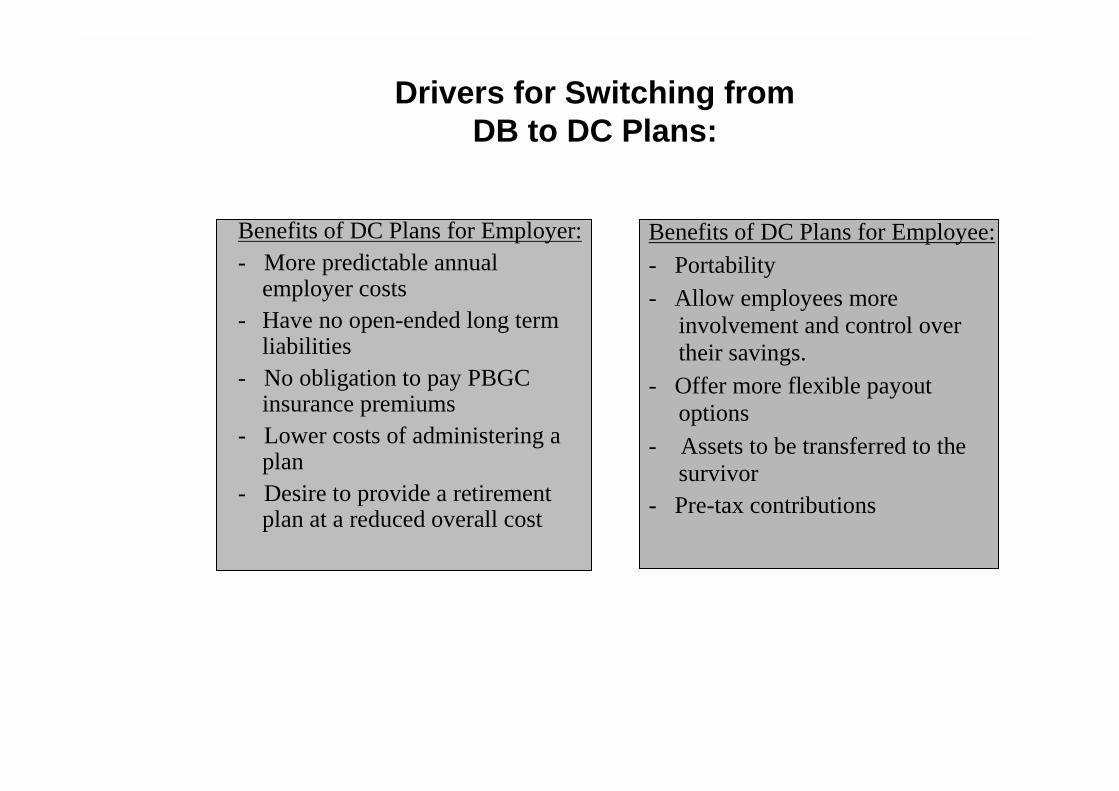
Drivers for Switching from DB to DC Plans:
Benefits of DC Plans for Employer:- More predictable annual
employer costs- Have no open-ended long term
liabilities- No obligation to pay PBGC
insurance premiums- Lower costs of administering a
plan- Desire to provide a retirement
plan at a reduced overall cost
Benefits of DC Plans for Employee:- Portability- Allow employees more
involvement and control over their savings.
- Offer more flexible payout options
- Assets to be transferred to the survivor
- Pre-tax contributions
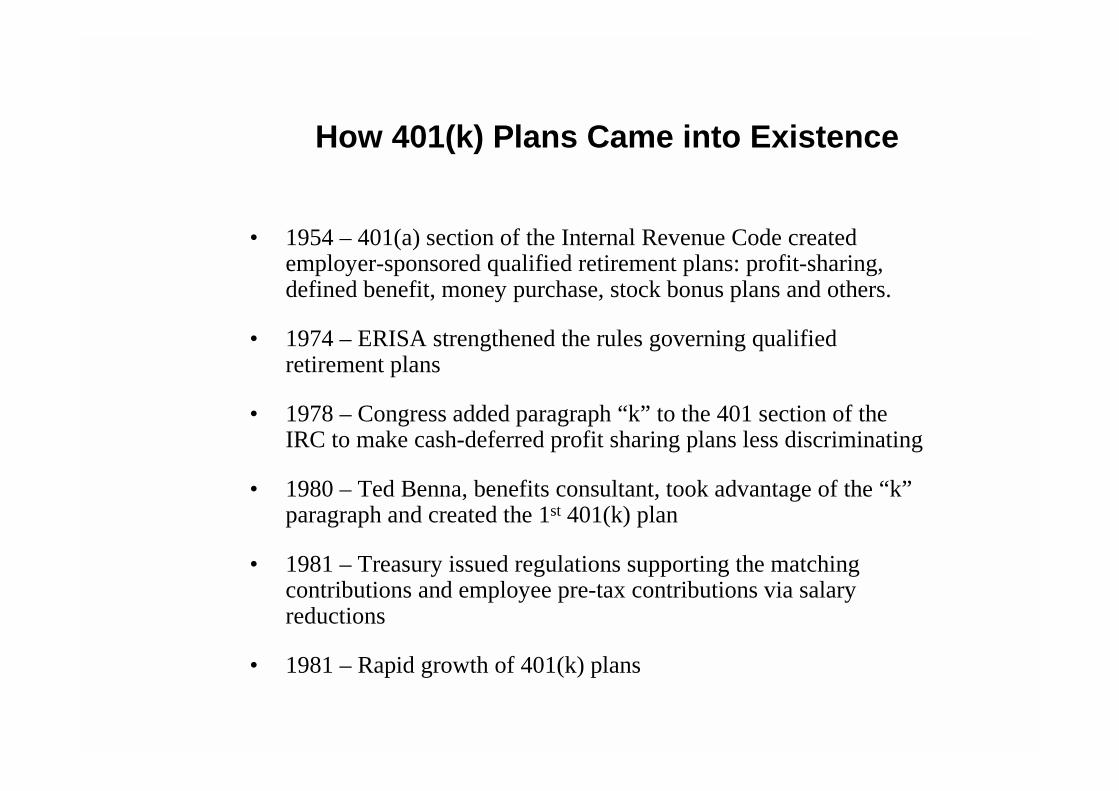
How 401(k) Plans Came into Existence
• 1954 – 401(a) section of the Internal Revenue Code created employer-sponsored qualified retirement plans: profit-sharing, defined benefit, money purchase, stock bonus plans and others.
• 1974 – ERISA strengthened the rules governing qualified retirement plans
• 1978 – Congress added paragraph “k” to the 401 section of the IRC to make cash-deferred profit sharing plans less discriminating
• 1980 – Ted Benna, benefits consultant, took advantage of the “k” paragraph and created the 1st 401(k) plan
• 1981 – Treasury issued regulations supporting the matching contributions and employee pre-tax contributions via salary reductions
• 1981 – Rapid growth of 401(k) plans
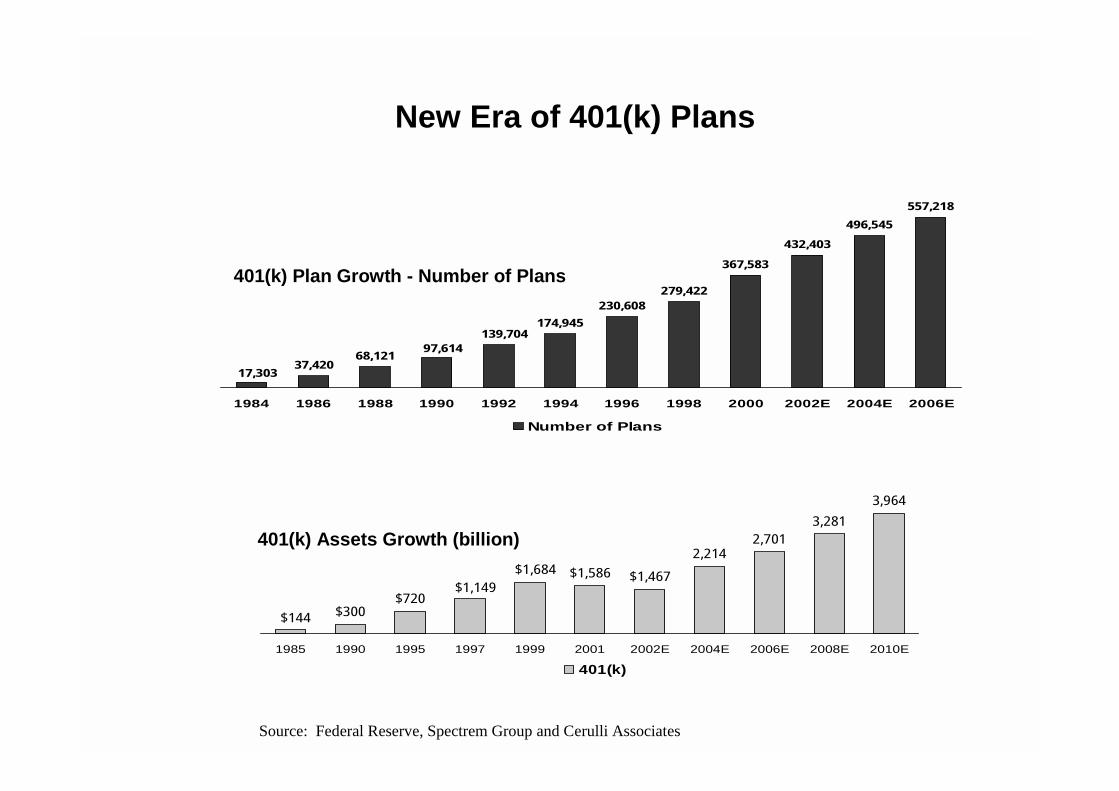
37,42068,121
174,945
230,608279,422
367,583
432,403
496,545
557,218
17,303
97,614139,704
1984 1986 1988 1990 1992 1994 1996 1998 2000 2002E 2004E 2006E
Number of Plans
New Era of 401(k) Plans
401(k) Plan Growth - Number of Plans
Source: Federal Reserve, Spectrem Group and Cerulli Associates
$300$720
$1,586 $1,467
2,2142,701
3,281
3,964
$144
$1,149$1,684
1985 1990 1995 1997 1999 2001 2002E 2004E 2006E 2008E 2010E
401(k)
401(k) Assets Growth (billion)
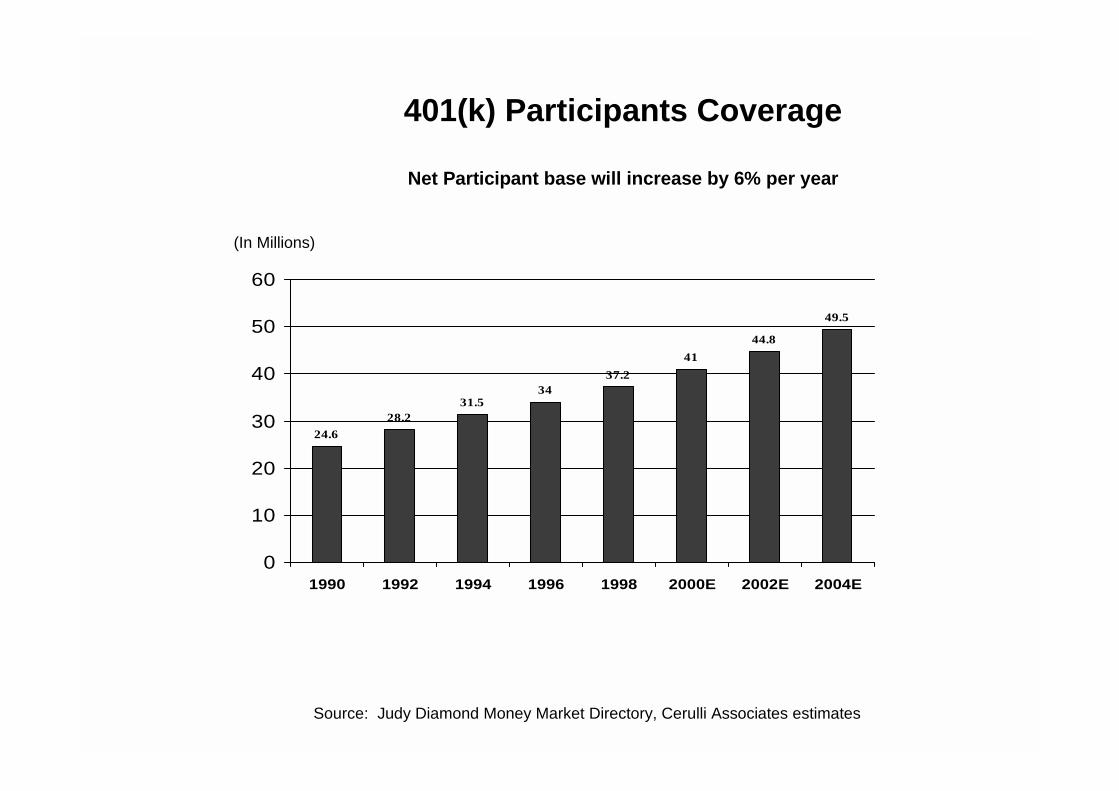
401(k) Participants Coverage
Net Participant base will increase by 6% per year
24.6
28.231.5
3437.2
41
44.8
49.5
0
10
20
30
40
50
60
1990 1992 1994 1996 1998 2000E 2002E 2004E
Source: Judy Diamond Money Market Directory, Cerulli Associates estimates
(In Millions)
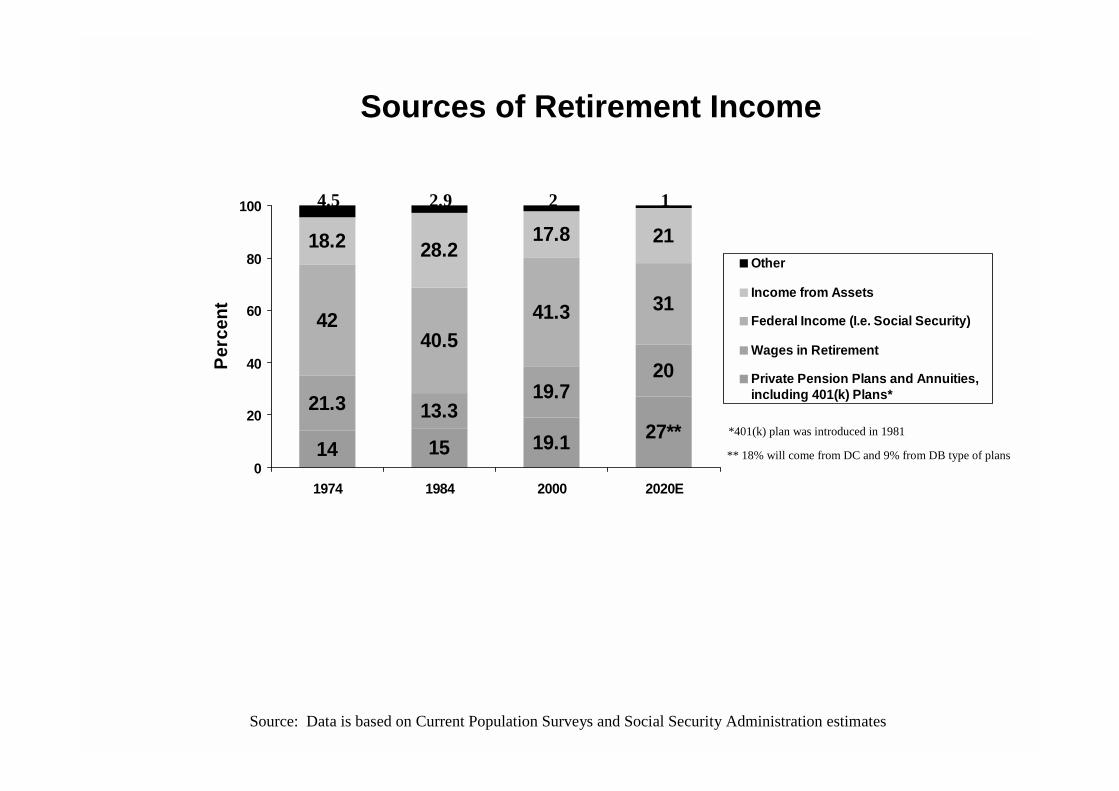
14 15 19.1
21.3 13.319.7
20
4240.5
41.3 31
18.2 28.217.8 21
27**
4.5 2.9 2 1
0
20
40
60
80
100
1974 1984 2000 2020E
Per
cent
Other
Income from Assets
Federal Income (I.e. Social Security)
Wages in Retirement
Private Pension Plans and Annuities,including 401(k) Plans*
Sources of Retirement Income
*401(k) plan was introduced in 1981
** 18% will come from DC and 9% from DB type of plans
Source: Data is based on Current Population Surveys and Social Security Administration estimates
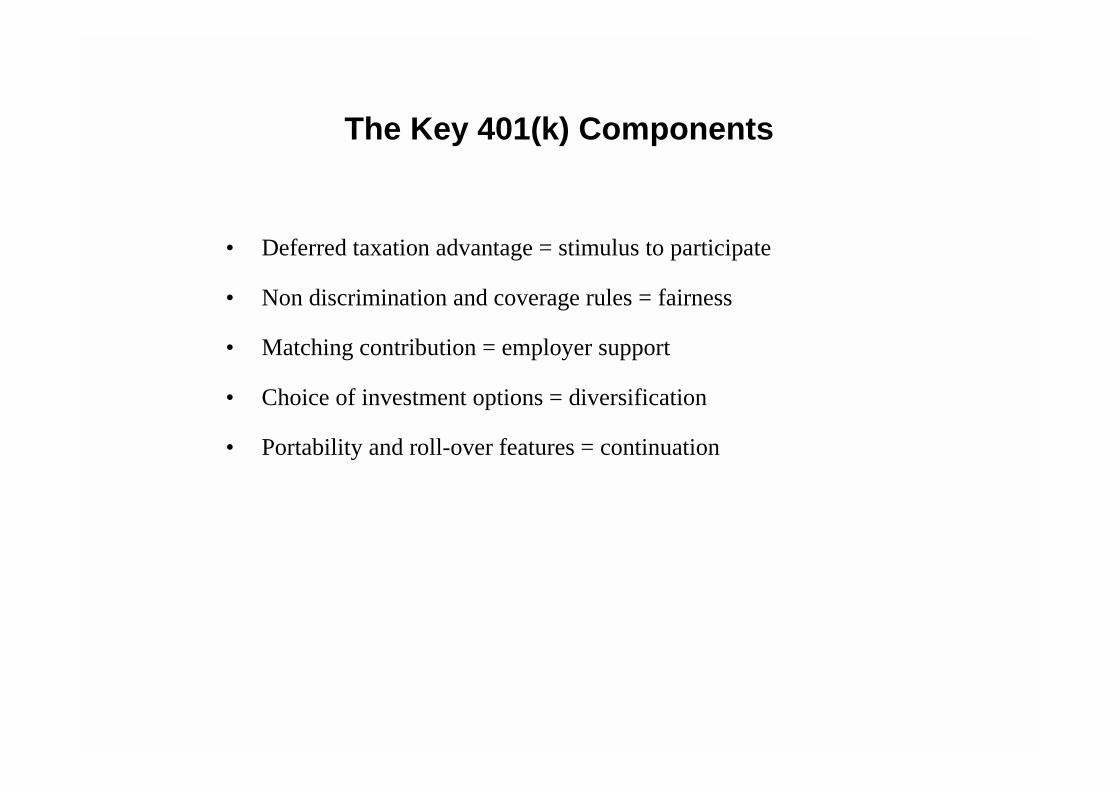
The Key 401(k) Components
• Deferred taxation advantage = stimulus to participate
• Non discrimination and coverage rules = fairness
• Matching contribution = employer support
• Choice of investment options = diversification
• Portability and roll-over features = continuation
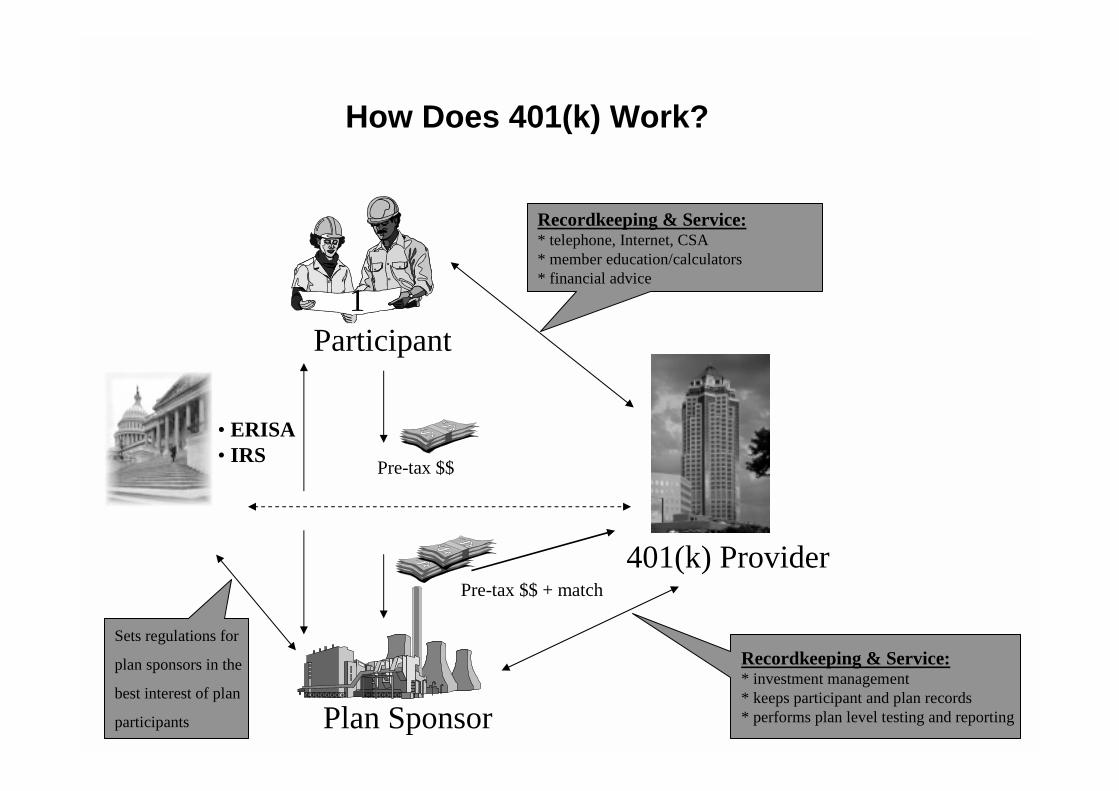
How Does 401(k) Work?
Participant
Plan Sponsor
401(k) Provider
Pre-tax $$
Pre-tax $$ + match
Recordkeeping & Service:* telephone, Internet, CSA* member education/calculators* financial advice
Recordkeeping & Service:* investment management* keeps participant and plan records* performs plan level testing and reporting
• ERISA• IRS
1
Sets regulations for
plan sponsors in the
best interest of plan
participants
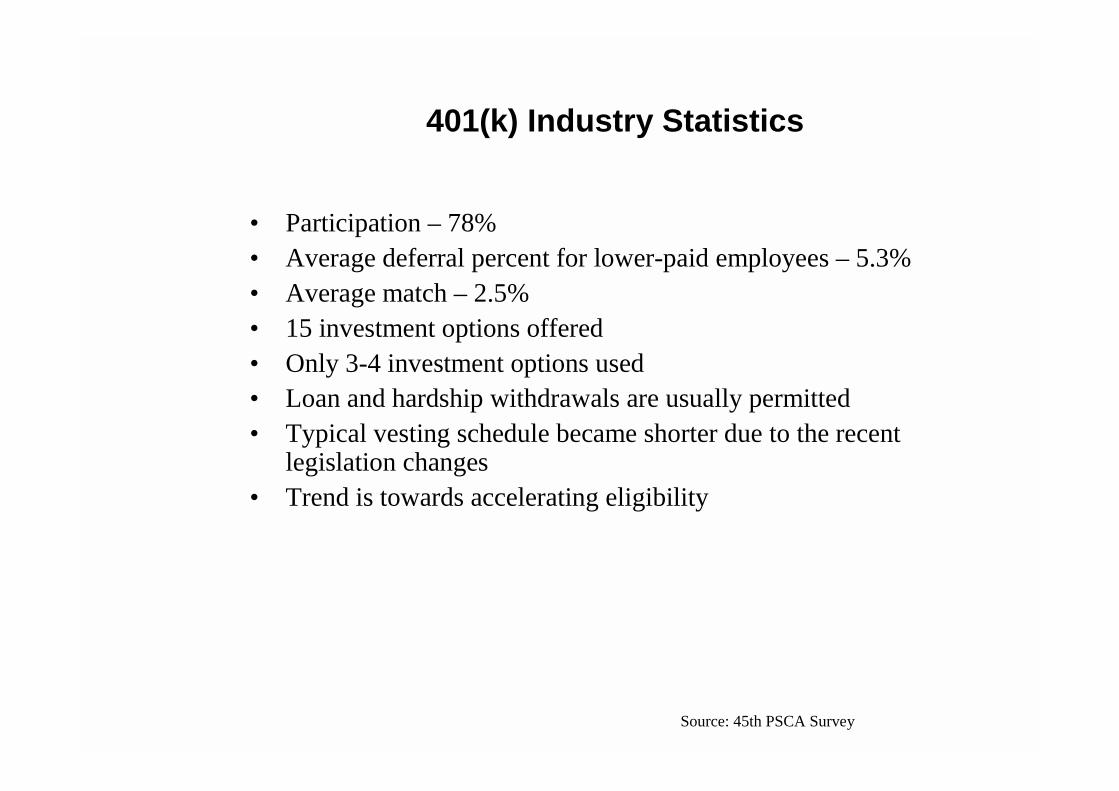
401(k) Industry Statistics
Source: 45th PSCA Survey
• Participation – 78%• Average deferral percent for lower-paid employees – 5.3%• Average match – 2.5%• 15 investment options offered• Only 3-4 investment options used• Loan and hardship withdrawals are usually permitted• Typical vesting schedule became shorter due to the recent
legislation changes• Trend is towards accelerating eligibility
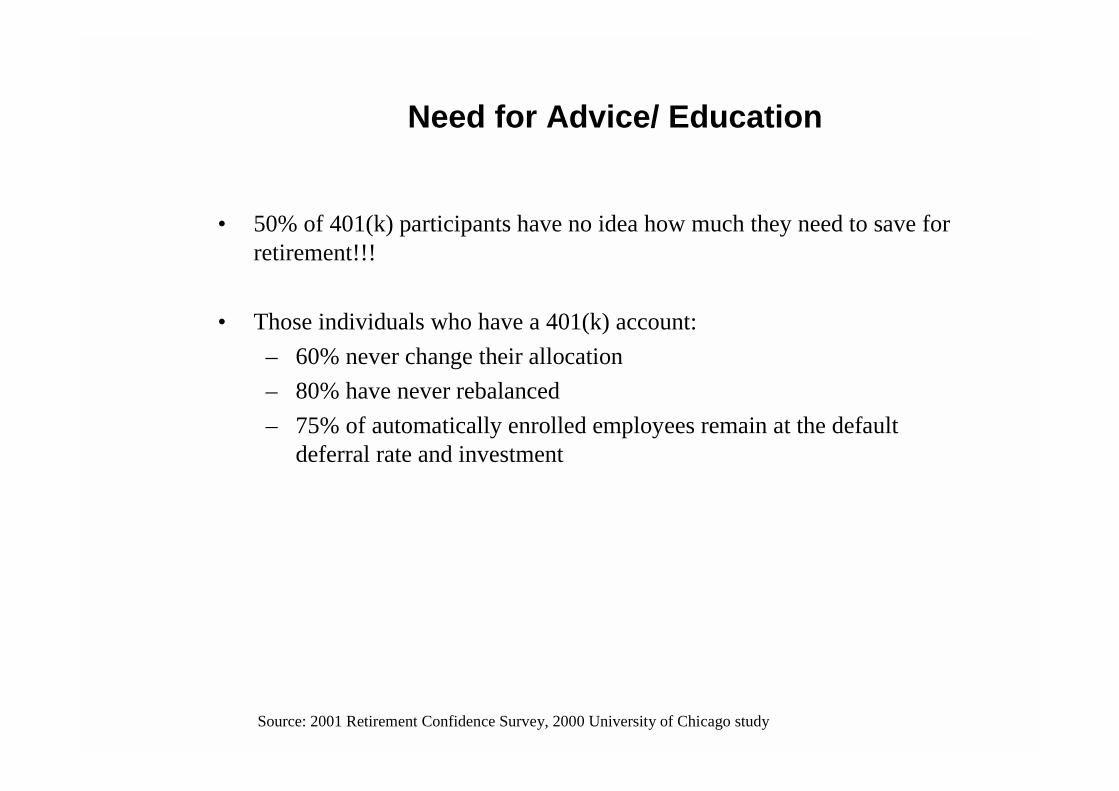
Need for Advice/ Education
Source: 2001 Retirement Confidence Survey, 2000 University of Chicago study
• 50% of 401(k) participants have no idea how much they need to save for retirement!!!
• Those individuals who have a 401(k) account:
– 60% never change their allocation
– 80% have never rebalanced
– 75% of automatically enrolled employees remain at the default deferral rate and investment
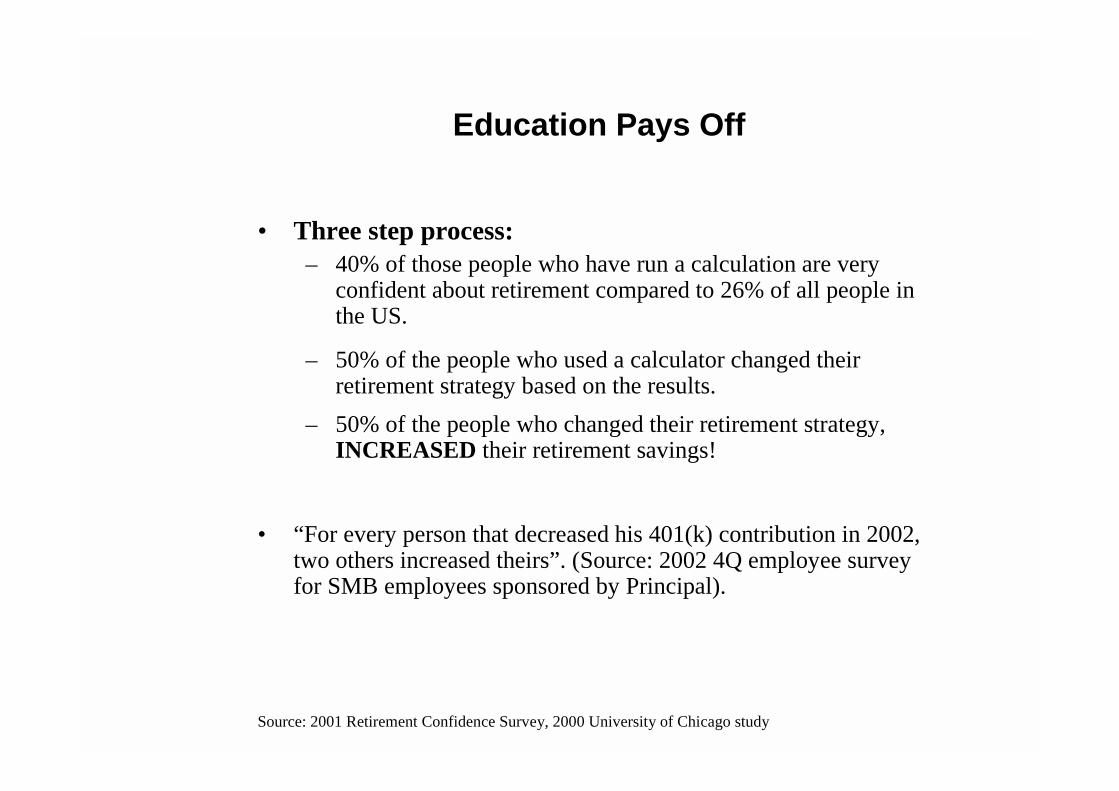
Education Pays Off
• Three step process:– 40% of those people who have run a calculation are very
confident about retirement compared to 26% of all people in the US.
– 50% of the people who used a calculator changed their retirement strategy based on the results.
– 50% of the people who changed their retirement strategy, INCREASED their retirement savings!
• “For every person that decreased his 401(k) contribution in 2002, two others increased theirs”. (Source: 2002 4Q employee survey for SMB employees sponsored by Principal).
Source: 2001 Retirement Confidence Survey, 2000 University of Chicago study
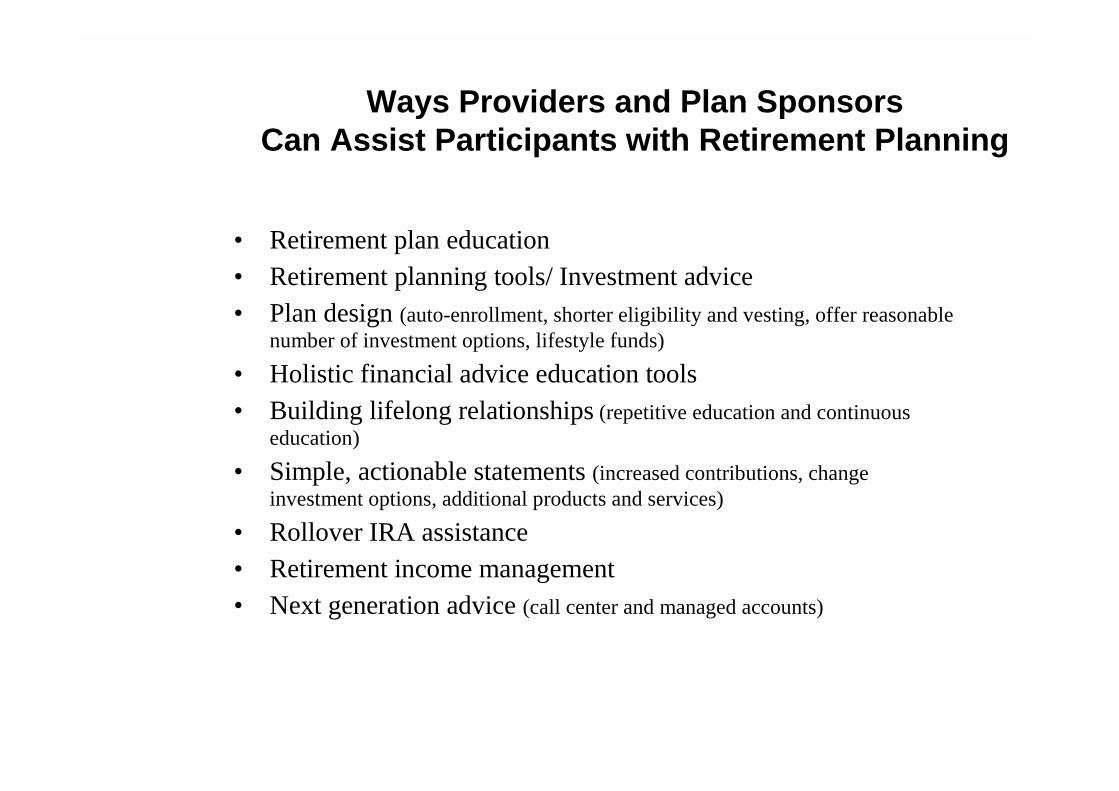
Ways Providers and Plan Sponsors Can Assist Participants with Retirement Planning
• Retirement plan education• Retirement planning tools/ Investment advice• Plan design (auto-enrollment, shorter eligibility and vesting, offer reasonable
number of investment options, lifestyle funds)
• Holistic financial advice education tools• Building lifelong relationships (repetitive education and continuous
education)
• Simple, actionable statements (increased contributions, change investment options, additional products and services)
• Rollover IRA assistance• Retirement income management• Next generation advice (call center and managed accounts)
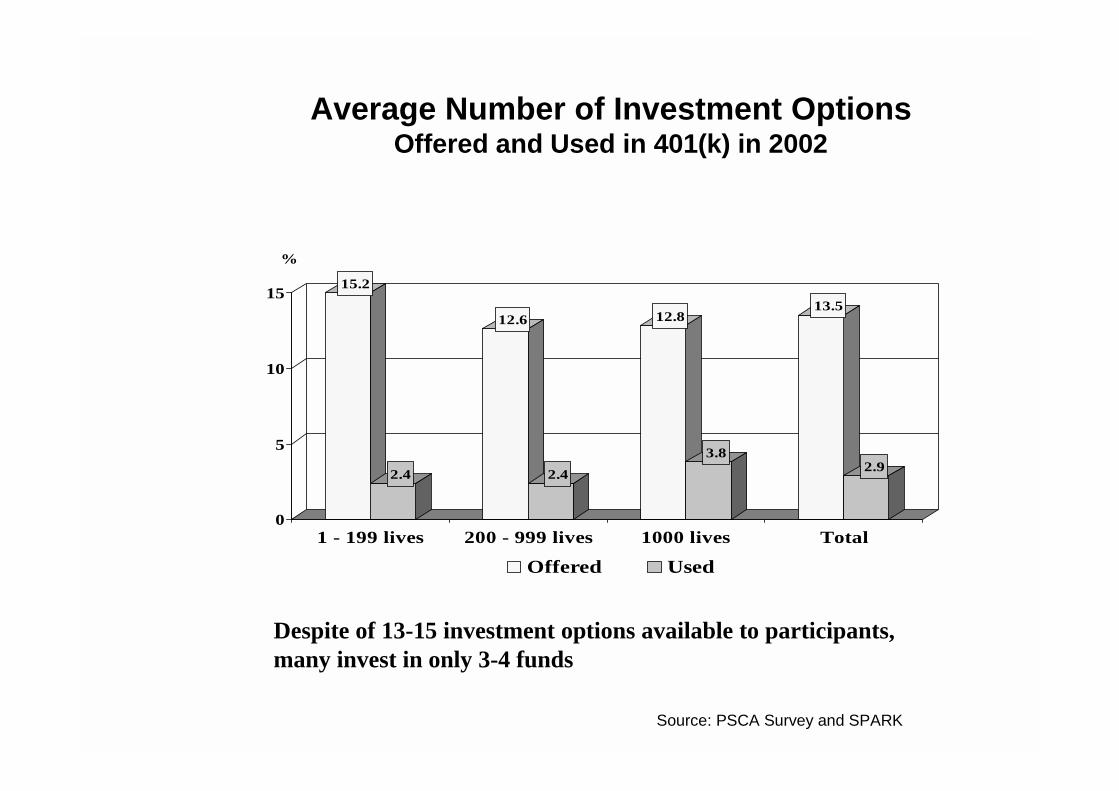
Average Number of Investment Options Offered and Used in 401(k) in 2002
15.2
2.4
12.6
2.4
12.8
3.8
13.5
2.9
0
5
10
15
%
1 - 199 lives 200 - 999 lives 1000 lives Total
Offered Used
Source: PSCA Survey and SPARK
Despite of 13-15 investment options available to participants, many invest in only 3-4 funds
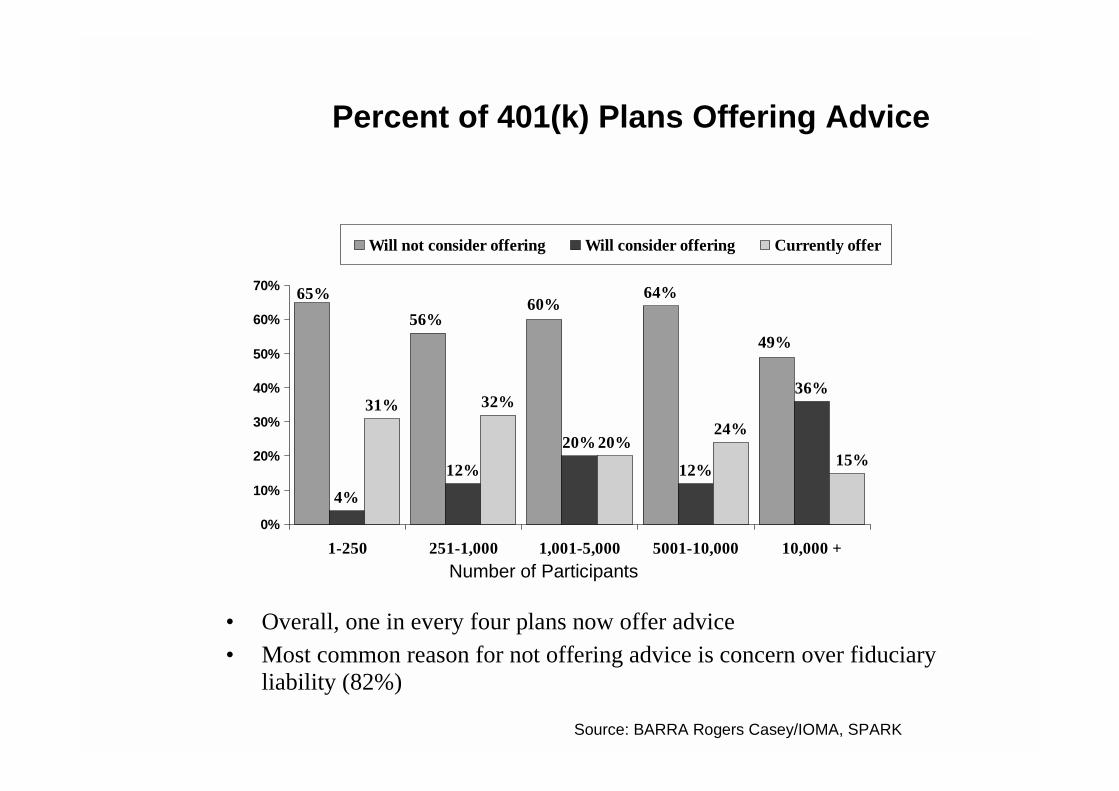
4%
12%
20%
12%
36%31% 32%
20%24%
49%
64%60%
56%
65%
15%
0%
10%
20%
30%
40%
50%
60%
70%
1-250 251-1,000 1,001-5,000 5001-10,000 10,000 +
Will not consider offering Will consider offering Currently offer
• Overall, one in every four plans now offer advice• Most common reason for not offering advice is concern over fiduciary
liability (82%)
Source: BARRA Rogers Casey/IOMA, SPARK
Number of Participants
Percent of 401(k) Plans Offering Advice
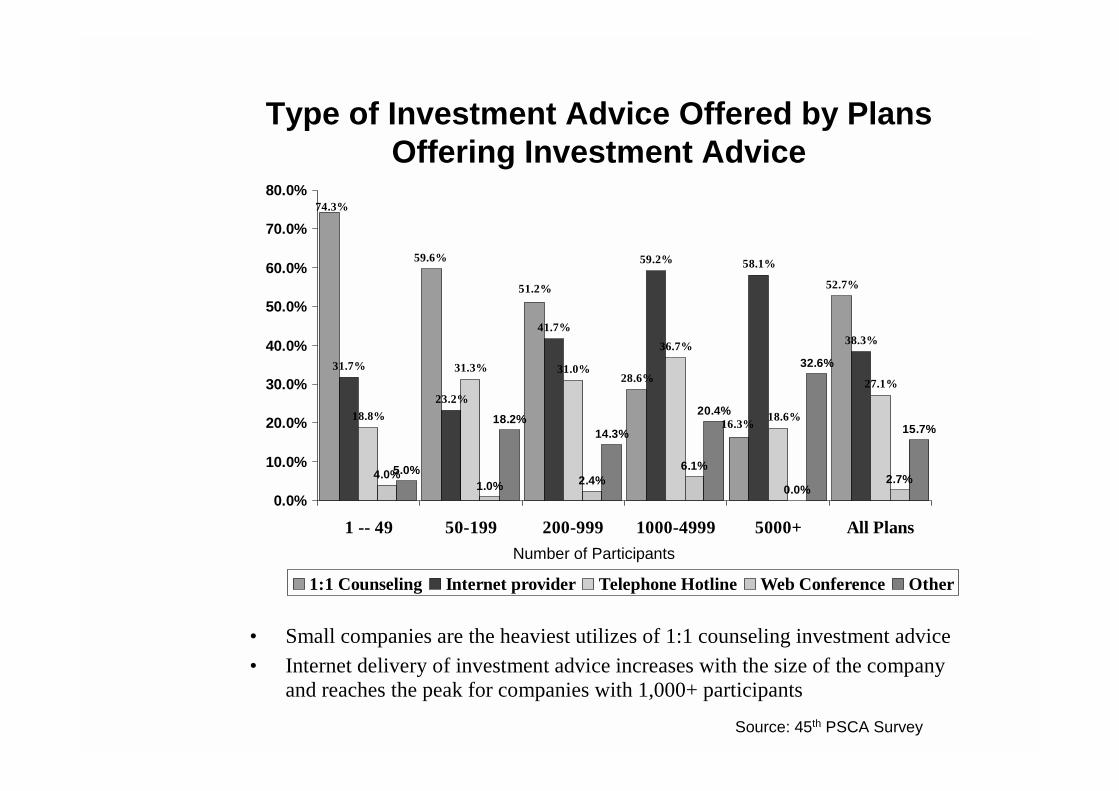
52.7%
31.7%
23.2%
41.7%
59.2% 58.1%
38.3%
18.8%
31.3% 31.0%
36.7%
27.1%
4.0%1.0% 2.4%
6.1%
0.0%2.7%
5.0%
18.2%14.3%
20.4%
32.6%
15.7%16.3%
28.6%
51.2%
59.6%
74.3%
18.6%
0.0%
10.0%
20.0%
30.0%
40.0%
50.0%
60.0%
70.0%
80.0%
1 -- 49 50-199 200-999 1000-4999 5000+ All Plans
1:1 Counseling Internet provider Telephone Hotline Web Conference Other
• Small companies are the heaviest utilizes of 1:1 counseling investment advice• Internet delivery of investment advice increases with the size of the company
and reaches the peak for companies with 1,000+ participants
Number of Participants
Type of Investment Advice Offered by Plans Offering Investment Advice
Source: 45th PSCA Survey
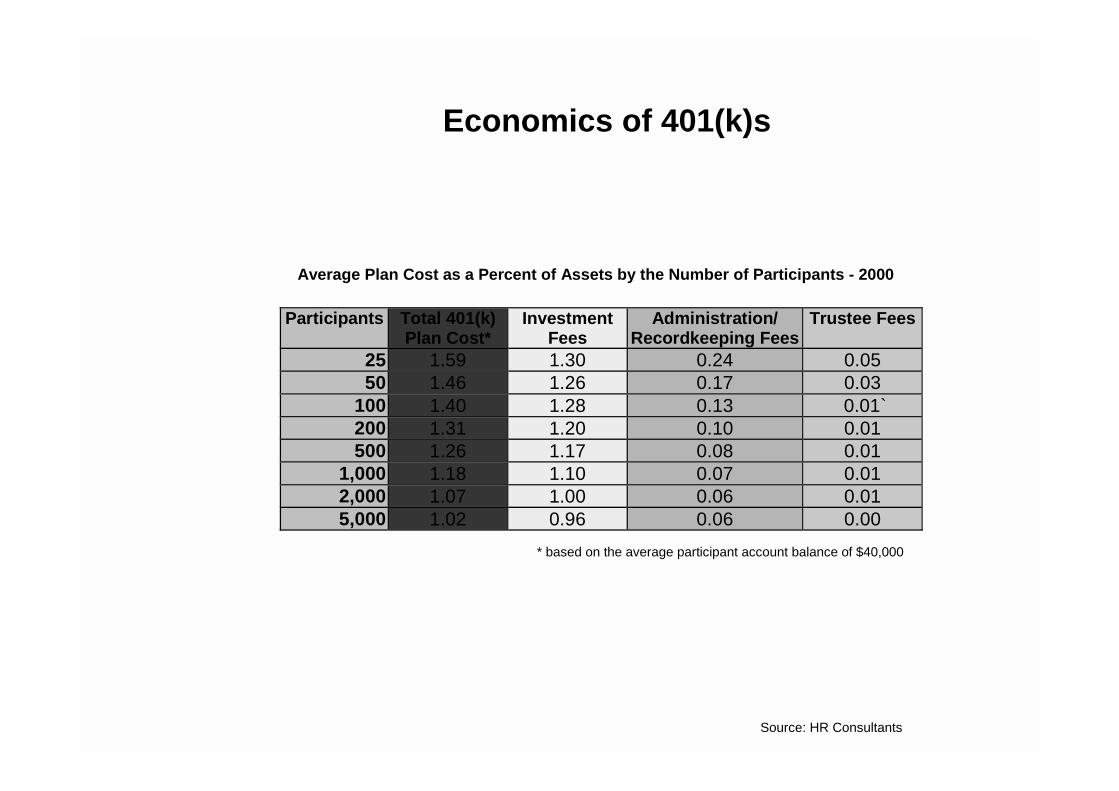
Economics of 401(k)s
Average Plan Cost as a Percent of Assets by the Number of Participants - 2000
Participants Total 401(k)Plan Cost*
InvestmentFees
Administration/Recordkeeping Fees
Trustee Fees
25 1.59 1.30 0.24 0.0550 1.46 1.26 0.17 0.03
100 1.40 1.28 0.13 0.01`200 1.31 1.20 0.10 0.01500 1.26 1.17 0.08 0.01
1,000 1.18 1.10 0.07 0.012,000 1.07 1.00 0.06 0.015,000 1.02 0.96 0.06 0.00
* based on the average participant account balance of $40,000
Source: HR Consultants
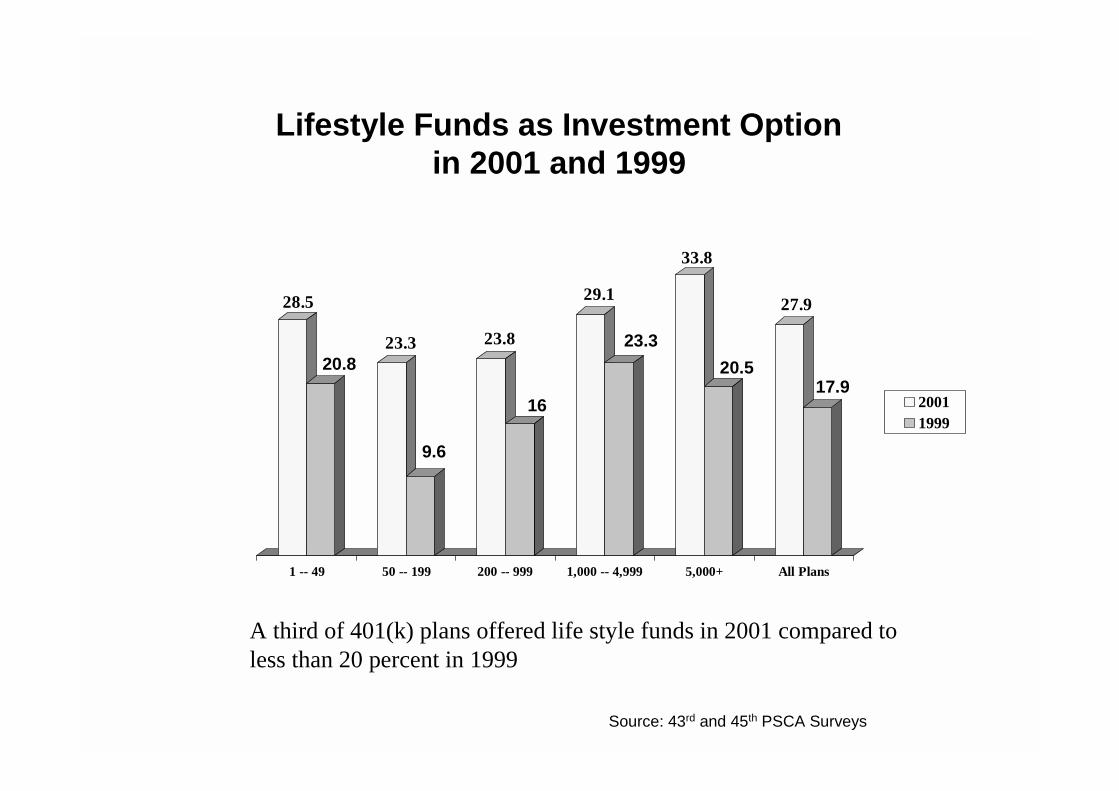
28.5
20.823.3
9.6
23.8
16
29.1
23.3
33.8
20.5
27.9
17.9
1 -- 49 50 -- 199 200 -- 999 1,000 -- 4,999 5,000+ All Plans
20011999
Lifestyle Funds as Investment Option in 2001 and 1999
Source: 43rd and 45th PSCA Surveys
A third of 401(k) plans offered life style funds in 2001 compared to less than 20 percent in 1999
401(k) Providers Control Costs
• Technology
• Economies of scale
• Bundled solutions
• Internet solutions both for plan sponsor and participant
• Investment options reviews
• Variable service model depending on the client's size/profitability
• Outsourcing
• Increased employee efficiencies
• Geographical labor advantages
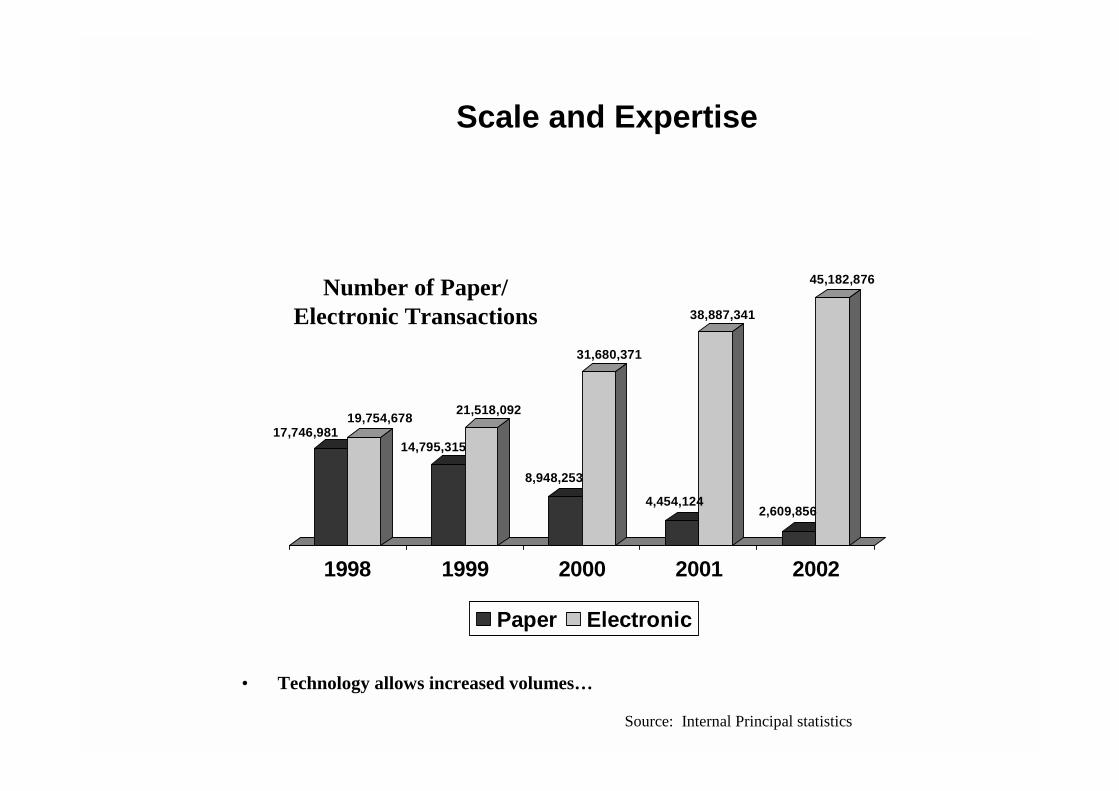
Scale and Expertise
• Technology allows increased volumes…
17,746,98119,754,678
14,795,315
21,518,092
8,948,253
31,680,371
4,454,124
38,887,341
2,609,856
45,182,876
1998 1999 2000 2001 2002
Paper Electronic
Number of Paper/ Electronic Transactions
Source: Internal Principal statistics
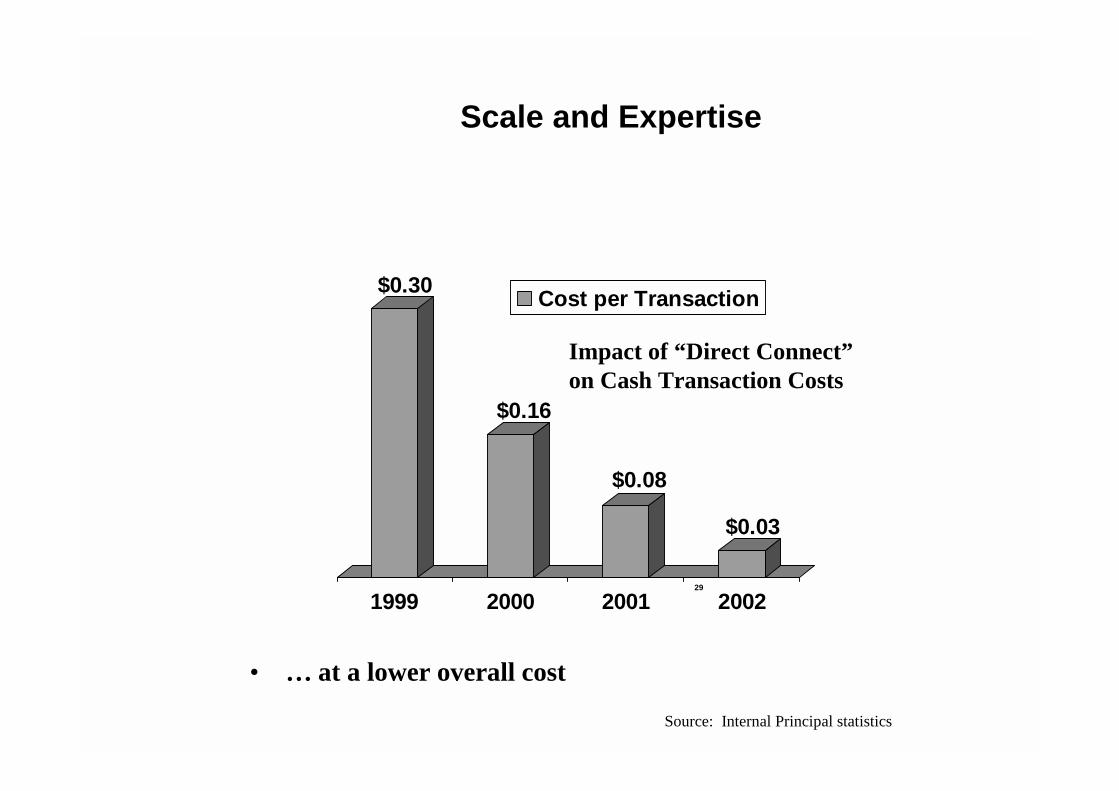
29
$0.30
$0.16
$0.08
$0.03
1999 2000 2001 2002
Cost per Transaction
Scale and Expertise
• … at a lower overall cost
Source: Internal Principal statistics
Impact of “Direct Connect” on Cash Transaction Costs
Best E401(k) Practices in the US
• Pure-play e401(k) providers
These providers have developed e-platforms that automate administrative/ recordkeeping activities and offer feature-rich Web interfaces for plan sponsors and participants. They partner with mutual fund companies and online brokerage firms to integrate investment options into their platforms, and distribute their platforms through alliances or private-label arrangements with traditional providers looking to offer an e401(k) product
• Traditional providers with e401(k) platforms
These providers have either developed e-platforms in-house, or forged partnerships with pure-play e-platform providers. The traditional players will typically integrate their own proprietary funds into these platforms and push the product through their own distribution networks.