structural change, employment and education in … change, employment and education ... the primary...
TRANSCRIPT
Employmentand Labour Market Policies Branch
EMPLOYMENT Working Paper No. 193
Employment Policy Department
2015
Theo SparreboomRoger Gomis
Structural change, employment and education in Ghana
EMPL
OYM
ENT
EMPL
OYM
ENT
EMPL
OYM
ENT
EMPL
OYM
ENT
EMPL
OYM
ENT
Employment Policy Department EMPLOYMENT Working Paper No. 193
2015
Structural change, employment and education in Ghana
Theo Sparreboom and Roger Gomis
Employment and Labour Market Policies Branch
Copyright © International Labour Organization 2015
First published 2015
Publications of the International Labour Office enjoy copyright under Protocol 2 of the Universal Copyright Convention. Nevertheless,
short excerpts from them may be reproduced without authorization, on condition that the source is indicated. For rights of reproduction or translation, application should be made to ILO Publications (Rights and Licensing), International Labour Office, CH-1211 Geneva 22,
Switzerland, or by email: [email protected]. The International Labour Office welcomes such applications.
Libraries, institutions and other users registered with a reproduction rights organization may make copies in accordance with the licences issued to them for this purpose. Visit www.ifrro.org to find the reproduction rights organization in your country.
ILO Cataloguing in Publication Data
Sparreboom, Theo; Gomis, Roger
Structural change, employment and education in Ghana / Theo Sparreboom and Roger Gomis ; International Labour Office, Employment
Policy Department, Employment and Labour Market Policies Branch. - Geneva: ILO, 2015 xi, 50 p. (Employment working paper ; No. 193.)
ISSN 1999-2939 (print); ISSN 1999-2947 (web pdf)
International Labour Office; Employment Policy Department.
structural change / economic growth / employment creation / education / educational development / skill requirements / Ghana 03.02.1
The designations employed in ILO publications, which are in conformity with United Nations practice, and the presentation of material
therein do not imply the expression of any opinion whatsoever on the part of the International Labour Office concerning the legal status of
any country, area or territory or of its authorities, or concerning the delimitation of its frontiers.
The responsibility for opinions expressed in signed articles, studies and other contributions rests solely with their authors, and publication
does not constitute an endorsement by the International Labour Office of the opinions expressed in them.
Reference to names of firms and commercial products and processes does not imply their endorsement by the International Labour Office, and any failure to mention a particular firm, commercial product or process is not a sign of disapproval.
ILO publications and digital products can be obtained through major booksellers and digital distribution platforms, or ordered directly from
[email protected]. For more information, visit our website: www.ilo.org/publns or contact [email protected].
Printed by the ILO, Geneva, Switzerland
iii
Preface
The primary goal of the ILO is to work with member States towards achieving full and
productive employment and decent work for all. This goal is elaborated in the ILO
Declaration 2008 on Social Justice for a Fair Globalization,1 which has been widely
adopted by the international community. Comprehensive and integrated perspectives to
achieve this goal are embedded in the Employment Policy Convention of 1964 (No. 122),
the Global Employment Agenda (2003) and – in response to the 2008 global economic
crisis – the Global Jobs Pact (2009) and the conclusions of the Recurrent Discussion
Reports on Employment (2010 and 2014).
The Employment Policy Department (EMPLOYMENT) is engaged in global
advocacy and in supporting member States in placing more and better jobs at the center of
economic and social policies and growth and development strategies. Policy research and
knowledge generation and dissemination are essential components of the Employment
Policy Department’s activities. The resulting publications include books, country policy
reviews, policy and research briefs, and working papers.2
The Employment Policy Working Paper series is designed to disseminate the main
findings of research on a broad range of topics undertaken by the branches of the
Department. The working papers are intended to encourage the exchange of ideas and to
stimulate debate. The views expressed within them are the responsibility of the authors and
do not necessarily represent those of the ILO.
Azita Berar Awad
Director
Employment Policy Department
_______________________
1 See http://www.ilo.org/global/about-the-ilo/mission-and-objectives/WCMS_099766/lang--en/index.htm
2 See http://www.ilo.org/employment

v
Foreword
Between 2000 and 2013, Ghana’s economy grew at an impressive average annual rate
of 6.6 per cent. However, despite its strong recent record of GDP growth, Ghana’s
economic outlook is not altogether bright. The economy appears to suffer from Dutch
disease, and is heavily dependent on exports of primary commodities. Moreover, in line
with the broad pattern in Sub-Saharan Africa, Ghana’s economic growth has not been
translated into an equally impressive labour market performance. Despite some increase in
the proportion of employees in the country’s labour force between 2006 and 2012, the
large majority of workers remain in vulnerable forms of employment.
It is in this context that this paper by Theo Sparreboom and Roger Gomis explores the
link between structural change and employment on the one hand, and the change in
educational attainment on the other. It aims at better understanding how different patterns
of structural change in the economy and changes in educational intensity and skills profiles
of jobs are related to productivity and the quality of jobs created in Ghana.
Structural change has been an important characteristic of Ghana, with employment
increasingly shifting from the agricultural sector to services, accompanied by clear
productivity gains. However, at the same time, the incidence of vulnerable employment in
services did not improve, pointing to the low quality of much job creation, as confirmed by
the expansion of low quality service employment, in particular in wholesale and retail
trade.
Increases in productivity have been supported by Ghana’s achievements with respect
to raising levels of education. Yet despite these gains, Ghana’s labour force continues to be
characterized by a significant share of workers without educational qualifications and a
low proportion of workers with advanced schooling. This underlines the need for
continued investment in education, including in terms of the quality of education.
Ultimately, the critical challenge for the Ghanaian authorities is to develop economic
policies to support decent employment creation in more innovative activities and dynamic
sectors, as well as to adopt measures to improve working conditions and facilitate the
formalization of the informal economy. Ghana’s recently adopted National Employment
Policy provides a welcome framework for concrete measures to be pursued in support of
this vision.
The analysis in this paper is based on economic and labour market data from the
Ghana Statistical Service, and in particular the Ghana Living Standards Surveys conducted
in 2005/2006 (GLSS 5) and in 2012/2013 (GLSS 6).
Iyanatul Islam
Chief
Employment and Labour Market Policies Branch
Employment Policy Department

vi

vii
Acknowledgements
This paper benefited from comments and suggestions provided by Tariq Haq, Specialist
on Employment Policies at the International Labour Office in Geneva, as well as from comments
by participants at a seminar held in Accra, Ghana on 22 May 2015. Any remaining errors or
omissions are the authors’ own.

ix
Contents
Preface ...................................................................................................................................................... iii
Foreword ................................................................................................................................................... v
Acknowledgements ................................................................................................................................. vii
1. Introduction ........................................................................................................................................... 1
2. Economic growth, employment and productivity ................................................................................. 3
2.1 High levels of employment but few decent jobs ....................................................................... 5
3. Education policies and enrolment rates ............................................................................................... 12
4. Education profile of the labour force................................................................................................... 14
5. Education intensity and economic structure ........................................................................................ 18
6. Qualifications mismatch ...................................................................................................................... 21
7. Returns to education ............................................................................................................................ 24
8. Conclusions and recommendations ..................................................................................................... 26
Bibliography ............................................................................................................................................ 28
Annex A .................................................................................................................................................. 31
Annex B ................................................................................................................................................... 46
B1. Breakdown of the change in the employment-to-population ratio ......................................... 46
B2. Breakdown of productivity growth ........................................................................................ 46
B3. Regression model for returns to education ............................................................................. 47

x
List of Figures
Figure 1. Real GDP growth and per capita GDP ...................................................................................................................... 1
Figure 2. GDP by sector, 2013 ................................................................................................................................................. 3
Figure 3. Structure of output in 2000, 2006 and 2012 (per cent of GDP) ................................................................................. 4
Figure 4. Employment-to-population ratio, 15+ (%) ................................................................................................................ 6
Figure 5. Contribution of each sector to change in the employment-to-population ratio from 2006 to 2012 (percentage
points) ........................................................................................................................................................................ 7
Figure 6. Incidence of vulnerable employment by sector (%) .................................................................................................. 8
Figure 7.a. Productivity by broad sector .................................................................................................................................... 10
Figure 7.b. Productivity by sector .............................................................................................................................................. 10
Figure 8. Evolution of the gross enrolment rate in primary and secondary education (%) ..................................................... 12
Figure 9. Education profile of the labour force (%) ................................................................................................................ 14
Figure 10. Education distribution by broad sector, 2006 (% of sector employment) ................................................................ 16
Figure 11. Education distribution by broad sector, 2012 (% of sector employment) ................................................................ 17
Figure 12. Changes in the occupational distribution in wholesale and retail trade, 2006-2012 (percentage points) ................. 20
Figure 13. Qualifications mismatch, percentage of employment, 2006 and 2012 .................................................................... 22
Figure 14. Qualifications mismatch, percentage of employment by major occupational group, 2006 and 2012 ...................... 22
Figure 15. Changes in qualifications mismatch from 2006 to 2012, non-vulnerable employment by major occupational
group (percentage points) ........................................................................................................................................ 23
Figure A. 1. Structure of output using World Development Indicators data................................................................................ 31
Figure A. 2. Qualifications mismatch, percentage of employment by major occupational group and sex, 2006......................... 40
Figure A. 3. Qualifications mismatch, percentage of employment by major occupational group and sex, 2012......................... 41
Figure A. 4. Qualifications mismatch, percentage of non-vulnerable employment by major occupational group and
sex, 2006 ................................................................................................................................................................. 42
Figure A. 5. Qualifications mismatch, percentage of non-vulnerable employment by major occupational group and
sex, 2012 ................................................................................................................................................................. 44
xi
List of Tables
Table 1. Demand side drivers of growth, selected years (% of GDP) ..................................................................................... 5
Table 2. Annual sectoral growth rates 1994-2012 (%) ............................................................................................................ 5
Table 3. Employment by broad sector (%) .............................................................................................................................. 6
Table 4. Distribution by status in employment (%) ................................................................................................................. 8
Table 5. Education intensity and economic structure ............................................................................................................ 19
Table 6. Returns to education, years of schooling (%) .......................................................................................................... 24
Table 7. Returns to levels of education (%) .......................................................................................................................... 25
Table A 1. Economic structure 1994-2012 (% of GDP) ............................................................................................................ 31
Table A 2. Education intensity and employment by sector ....................................................................................................... 32
Table A 3. Education intensity and non-vulnerable employment by sector .............................................................................. 33
Table A 4. Returns to education, years of schooling – both sexes ............................................................................................ 34
Table A 5. Returns to education, years of schooling - male ...................................................................................................... 35
Table A 6. Returns to education, years of schooling - female ................................................................................................... 36
Table A 7. Returns to educational levels – both sexes .............................................................................................................. 37
Table A 8. Returns to educational levels - male ........................................................................................................................ 38
Table A 9. Returns to educational levels – female .................................................................................................................... 39

1
1. Introduction
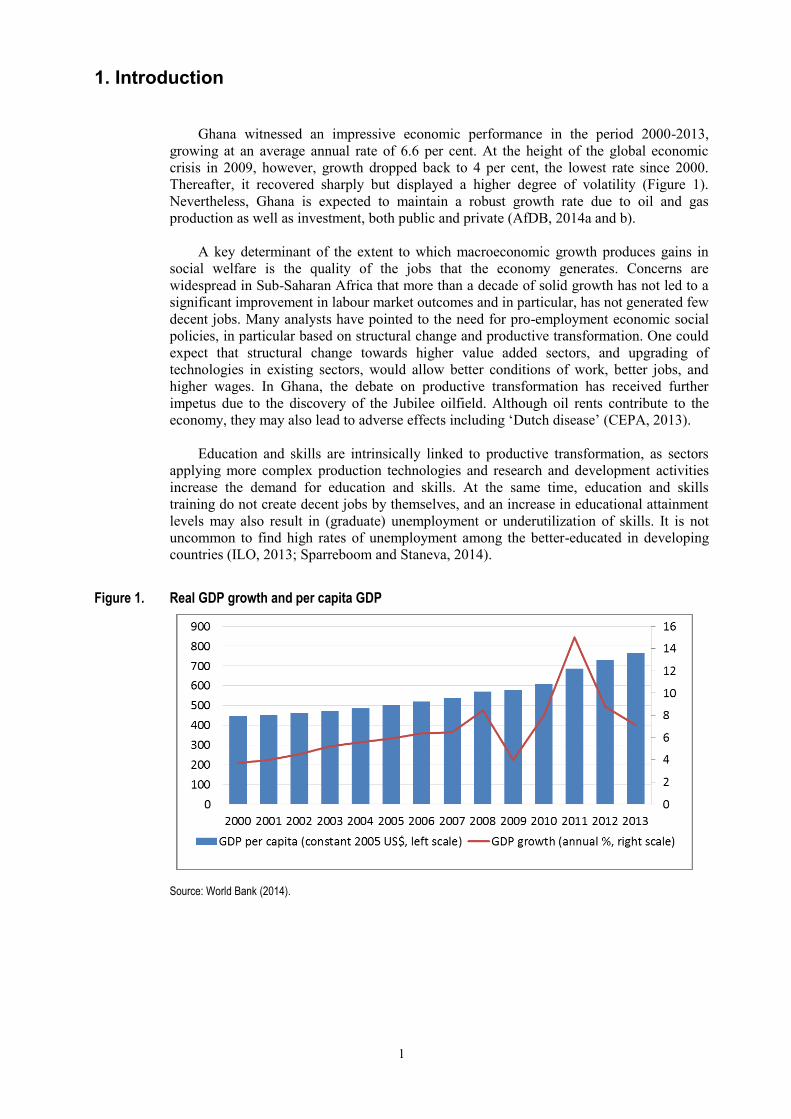
Ghana witnessed an impressive economic performance in the period 2000-2013,
growing at an average annual rate of 6.6 per cent. At the height of the global economic
crisis in 2009, however, growth dropped back to 4 per cent, the lowest rate since 2000.
Thereafter, it recovered sharply but displayed a higher degree of volatility (Figure 1).
Nevertheless, Ghana is expected to maintain a robust growth rate due to oil and gas
production as well as investment, both public and private (AfDB, 2014a and b).
A key determinant of the extent to which macroeconomic growth produces gains in
social welfare is the quality of the jobs that the economy generates. Concerns are
widespread in Sub-Saharan Africa that more than a decade of solid growth has not led to a
significant improvement in labour market outcomes and in particular, has not generated few
decent jobs. Many analysts have pointed to the need for pro-employment economic social
policies, in particular based on structural change and productive transformation. One could
expect that structural change towards higher value added sectors, and upgrading of
technologies in existing sectors, would allow better conditions of work, better jobs, and
higher wages. In Ghana, the debate on productive transformation has received further
impetus due to the discovery of the Jubilee oilfield. Although oil rents contribute to the
economy, they may also lead to adverse effects including ‘Dutch disease’ (CEPA, 2013).
Education and skills are intrinsically linked to productive transformation, as sectors
applying more complex production technologies and research and development activities
increase the demand for education and skills. At the same time, education and skills
training do not create decent jobs by themselves, and an increase in educational attainment
levels may also result in (graduate) unemployment or underutilization of skills. It is not
uncommon to find high rates of unemployment among the better-educated in developing
countries (ILO, 2013; Sparreboom and Staneva, 2014).
Figure 1. Real GDP growth and per capita GDP
Source: World Bank (2014).
2
In that context, this paper explores the link between structural change and employment
on the one hand, and the change in educational attainment on the other. It aims at better
understanding how different patterns of structural change in the economy and changes in
educational intensity and skills profiles of jobs are related to productivity and quality of
jobs created in Ghana. The paper is based on economic and labour market data from the
Ghana Statistical Service, and in particular the Ghana Living Standards Surveys conducted
in 2005/2006 (GLSS 5) and in 2012/2013 (GLSS 6). It summarises recent macroeconomic
indicators and provides a microeconomic analysis of labour market outcomes and returns to
education. Additional insights regarding the role of education and structural change are
gained from an analysis of changes in the distribution of employment across sectors and
other dimensions.
The paper is structured as follows. Section 2 discusses economic growth, employment
and productivity development in Ghana, followed by an overview of education policies and
enrolment rates in Section 3. Section 4 contains an analysis of the educational profile of the
labour force, while educational intensification and structural changes are discussed in
Section 5. Results of an assessment of qualifications mismatch are presented in Section 6.
Section 7 provides estimates of returns to education in Ghana, including disaggregated
results by broad economic sector. Finally, Section 8 concludes and provides some
recommendations.
3
2. Economic growth, employment and productivity
Despite its strong record of economic growth, and expected growth rates for 2014 and
2015 of around 8 per cent (AfDB, 2014a) - among the fastest growth rates in Africa –
Ghana’s economic outlook is not altogether bright. The country is still heavily reliant on
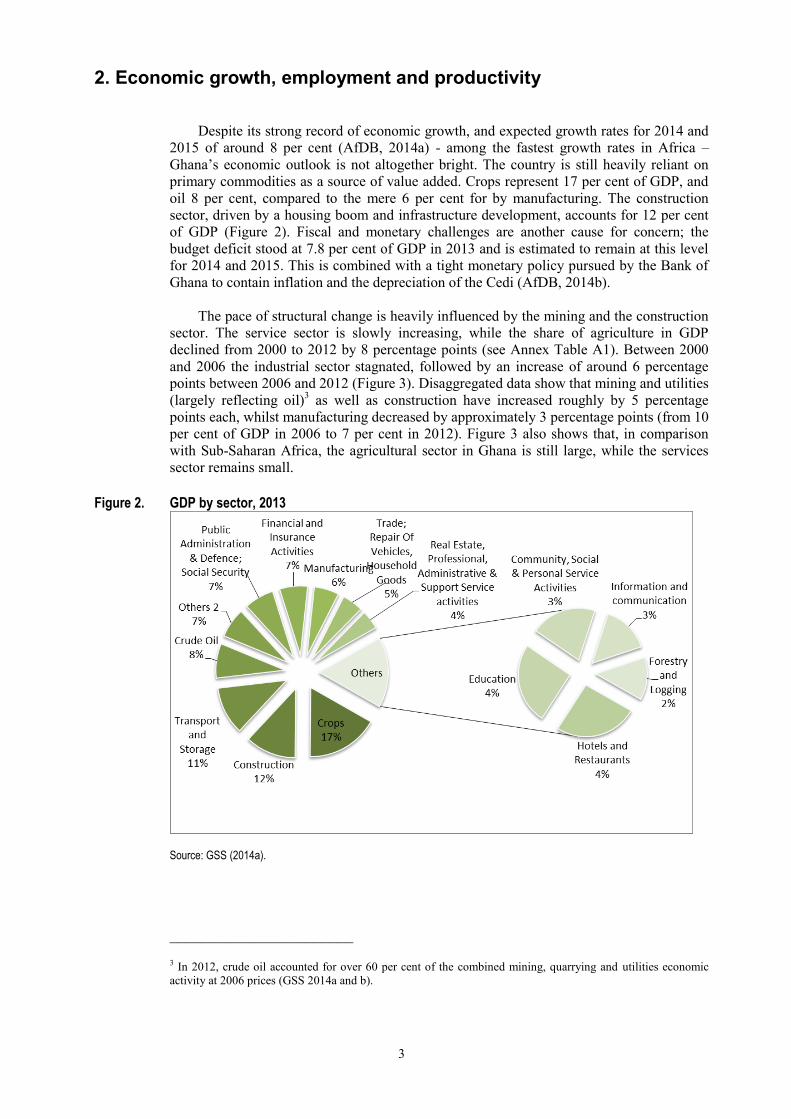
primary commodities as a source of value added. Crops represent 17 per cent of GDP, and
oil 8 per cent, compared to the mere 6 per cent for by manufacturing. The construction
sector, driven by a housing boom and infrastructure development, accounts for 12 per cent
of GDP (Figure 2). Fiscal and monetary challenges are another cause for concern; the
budget deficit stood at 7.8 per cent of GDP in 2013 and is estimated to remain at this level
for 2014 and 2015. This is combined with a tight monetary policy pursued by the Bank of
Ghana to contain inflation and the depreciation of the Cedi (AfDB, 2014b).
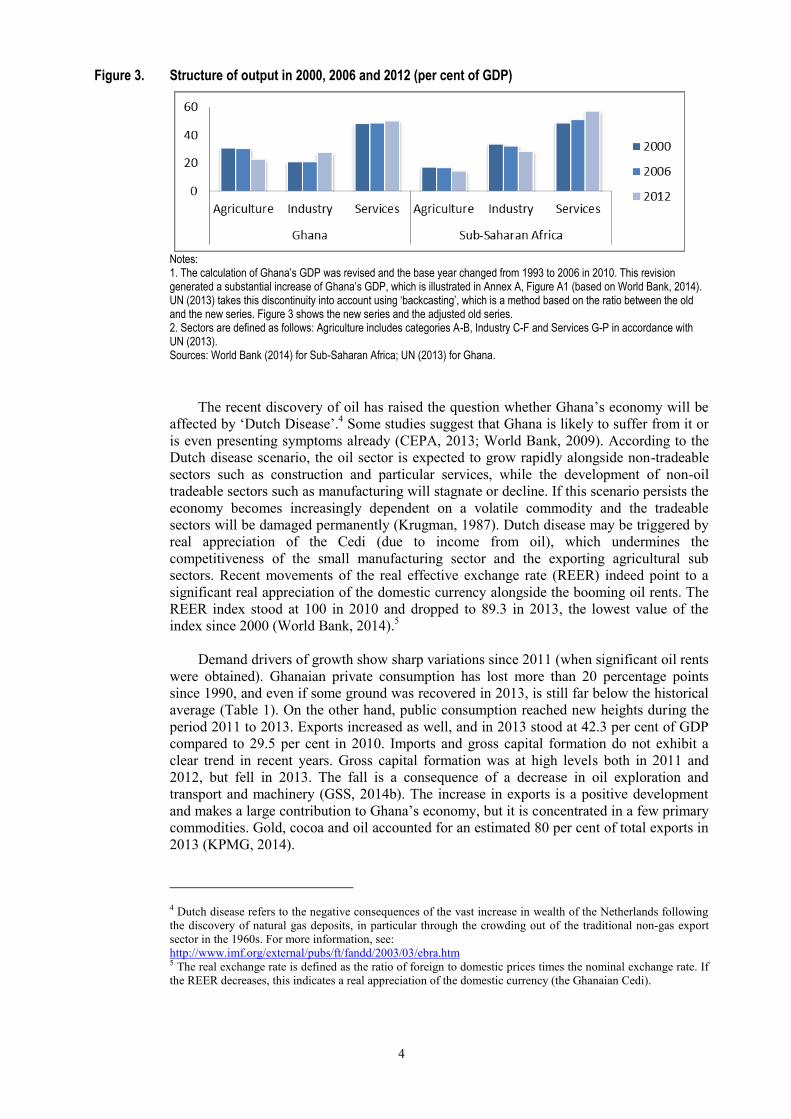
The pace of structural change is heavily influenced by the mining and the construction
sector. The service sector is slowly increasing, while the share of agriculture in GDP
declined from 2000 to 2012 by 8 percentage points (see Annex Table A1). Between 2000
and 2006 the industrial sector stagnated, followed by an increase of around 6 percentage
points between 2006 and 2012 (Figure 3). Disaggregated data show that mining and utilities
(largely reflecting oil)3 as well as construction have increased roughly by 5 percentage
points each, whilst manufacturing decreased by approximately 3 percentage points (from 10
per cent of GDP in 2006 to 7 per cent in 2012). Figure 3 also shows that, in comparison
with Sub-Saharan Africa, the agricultural sector in Ghana is still large, while the services
sector remains small.
Figure 2. GDP by sector, 2013
Source: GSS (2014a).
_______________________
3 In 2012, crude oil accounted for over 60 per cent of the combined mining, quarrying and utilities economic
activity at 2006 prices (GSS 2014a and b).
4
Figure 3. Structure of output in 2000, 2006 and 2012 (per cent of GDP)
Notes: 1. The calculation of Ghana’s GDP was revised and the base year changed from 1993 to 2006 in 2010. This revision generated a substantial increase of Ghana’s GDP, which is illustrated in Annex A, Figure A1 (based on World Bank, 2014). UN (2013) takes this discontinuity into account using ‘backcasting’, which is a method based on the ratio between the old and the new series. Figure 3 shows the new series and the adjusted old series. 2. Sectors are defined as follows: Agriculture includes categories A-B, Industry C-F and Services G-P in accordance with UN (2013). Sources: World Bank (2014) for Sub-Saharan Africa; UN (2013) for Ghana.
The recent discovery of oil has raised the question whether Ghana’s economy will be
affected by ‘Dutch Disease’.4 Some studies suggest that Ghana is likely to suffer from it or
is even presenting symptoms already (CEPA, 2013; World Bank, 2009). According to the
Dutch disease scenario, the oil sector is expected to grow rapidly alongside non-tradeable
sectors such as construction and particular services, while the development of non-oil
tradeable sectors such as manufacturing will stagnate or decline. If this scenario persists the
economy becomes increasingly dependent on a volatile commodity and the tradeable
sectors will be damaged permanently (Krugman, 1987). Dutch disease may be triggered by
real appreciation of the Cedi (due to income from oil), which undermines the
competitiveness of the small manufacturing sector and the exporting agricultural sub
sectors. Recent movements of the real effective exchange rate (REER) indeed point to a
significant real appreciation of the domestic currency alongside the booming oil rents. The
REER index stood at 100 in 2010 and dropped to 89.3 in 2013, the lowest value of the
index since 2000 (World Bank, 2014).5
Demand drivers of growth show sharp variations since 2011 (when significant oil rents
were obtained). Ghanaian private consumption has lost more than 20 percentage points
since 1990, and even if some ground was recovered in 2013, is still far below the historical
average (Table 1). On the other hand, public consumption reached new heights during the
period 2011 to 2013. Exports increased as well, and in 2013 stood at 42.3 per cent of GDP
compared to 29.5 per cent in 2010. Imports and gross capital formation do not exhibit a
clear trend in recent years. Gross capital formation was at high levels both in 2011 and
2012, but fell in 2013. The fall is a consequence of a decrease in oil exploration and
transport and machinery (GSS, 2014b). The increase in exports is a positive development
and makes a large contribution to Ghana’s economy, but it is concentrated in a few primary
commodities. Gold, cocoa and oil accounted for an estimated 80 per cent of total exports in
2013 (KPMG, 2014).
_______________________
4 Dutch disease refers to the negative consequences of the vast increase in wealth of the Netherlands following
the discovery of natural gas deposits, in particular through the crowding out of the traditional non-gas export
sector in the 1960s. For more information, see:
http://www.imf.org/external/pubs/ft/fandd/2003/03/ebra.htm 5 The real exchange rate is defined as the ratio of foreign to domestic prices times the nominal exchange rate. If
the REER decreases, this indicates a real appreciation of the domestic currency (the Ghanaian Cedi).

5
Table 1. Demand side drivers of growth, selected years (% of GDP)
1990 2000 2005 2010 2011 2012 2013
Private Consumption 85.2 84.3 81.0 80.4 59.3 51.0 64.2
Public Consumption 9.3 10.2 15.3 10.4 16.6 21.0 16.7
Gross Capital Formation 14.4 24.0 29.0 25.7 29.6 32.9 24.2
Exports of Goods and Services 16.9 48.8 36.4 29.5 44.1 48.1 42.3
Imports of Goods and Services 25.9 67.2 61.7 45.9 49.7 53.1 47.4
Source: World Bank (2014).
Analysis of growth across broad sector categories provides an insight into the key
driving forces operating in the country (Table 2). Until 2011 the three broad economic
sectors had grown, qualitatively, at a similar pace. Services experienced the strongest
average growth, 6.4 per cent, while industry and agriculture grew on average at 5.5 and 4.3
per cent from 1994 to 2010. After 2011 however, growth in industry and services
accelerated, whereas growth in agriculture stagnated. Consistent with the discussion above,
concerns that the growth in oil related and non-tradeable sectors is achieved at the expense
of other sectors, such as manufacturing but also agriculture, seem justified.
Table 2. Annual sectoral growth rates 1994-2012 (%)
Year 94/2010 1994 1996 1998 2000 2002 2004 2006 2008 2010 2011 2012
Agriculture 4.3 1.8 5.1 5.0 2.1 4.3 6.7 4.4 7.1 5.2 0.8 1.3
Industry 5.5 2.9 4.4 3.2 3.8 4.6 4.7 7.9 14.1 6.7 34.8 6.8
Services 6.4 4.9 4.5 5.7 5.2 5.0 4.9 6.6 7.7 9.4 9.0 9.8
Source: UN (2013), selected years. Note: Growth rates have been calculated based on value added in constant (2005) USD; the interval indicates the average during the period.
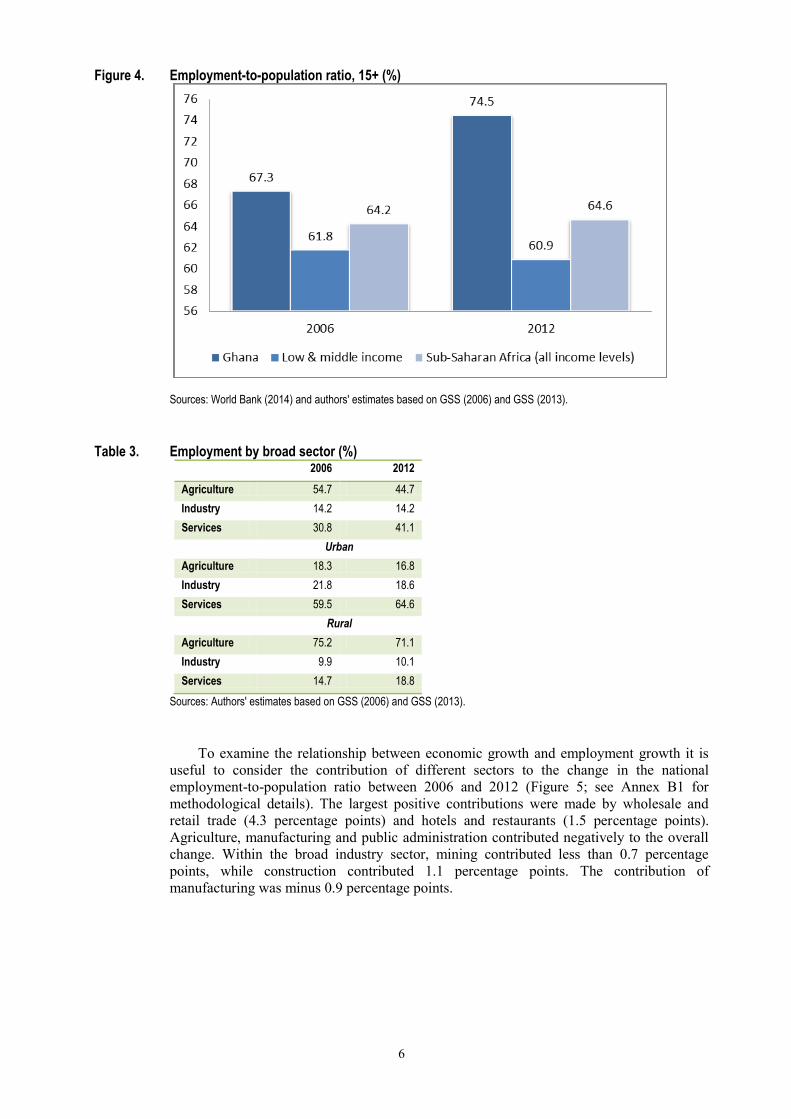
2.1 High levels of employment but few decent jobs
Overall employment levels in Ghana are slightly above the average in Sub-Saharan
Africa, and considerably above the level of low and middle income countries (Figure 4).
Ghana still is strongly dependent on agriculture as a source of employment. Even if the
share of agricultural value added has been steadily declining, agriculture still accounted for
44.7 per cent of employment in 2012. Not surprisingly, agricultural jobs are concentrated in
rural areas where 71 per cent of workers are in this sector, but only 17 per cent in urban
areas. Both in rural and in urban areas the importance of agriculture declined from 2006 to
2012 (Table 3).
Structural change in the Ghanaian economy is to a certain extent reflected in
employment. The share of employment in agriculture declined by 10 percentage points,
while the share of workers in services increased by roughly 10 percentage points. The
strong growth in value added in industry is, however, not visible in employment. As
discussed above, growth in value added in the industry sector has been largely due to oil
extraction, without contributing much to employment growth.
6
Figure 4. Employment-to-population ratio, 15+ (%)
Sources: World Bank (2014) and authors' estimates based on GSS (2006) and GSS (2013).
Table 3. Employment by broad sector (%)
2006 2012
Agriculture 54.7 44.7
Industry 14.2 14.2
Services 30.8 41.1
Urban
Agriculture 18.3 16.8
Industry 21.8 18.6
Services 59.5 64.6
Rural
Agriculture 75.2 71.1
Industry 9.9 10.1
Services 14.7 18.8
Sources: Authors' estimates based on GSS (2006) and GSS (2013).
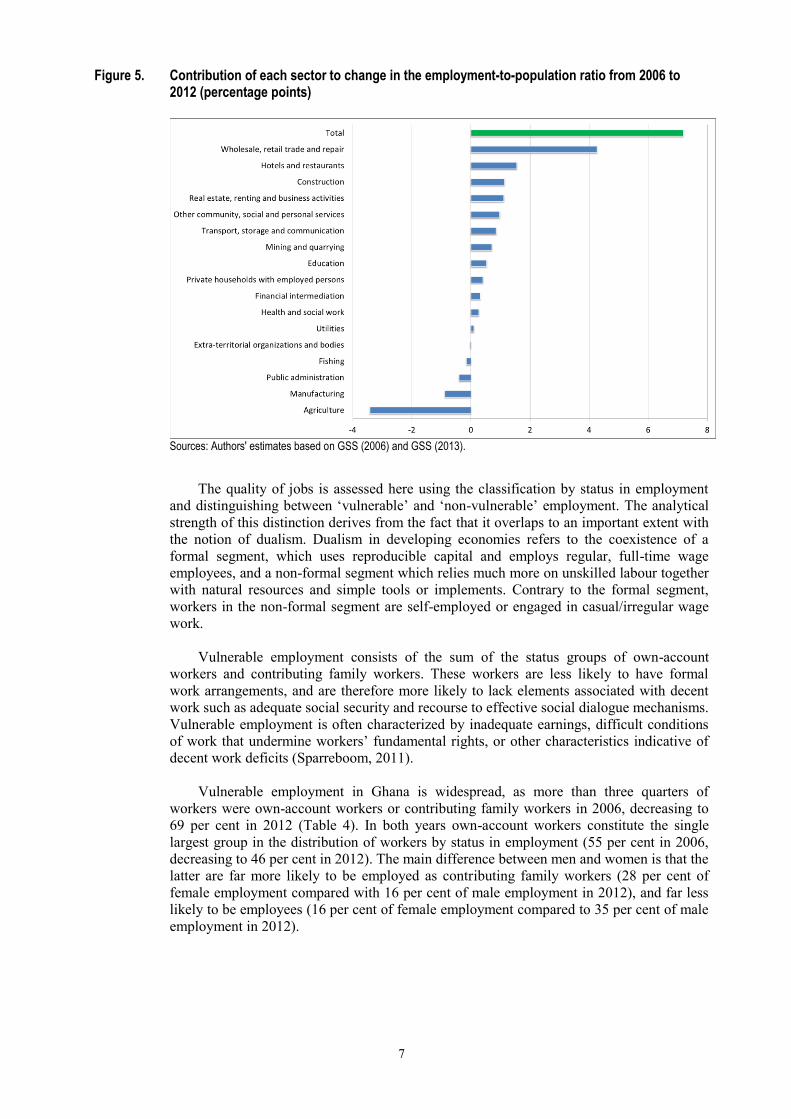
To examine the relationship between economic growth and employment growth it is
useful to consider the contribution of different sectors to the change in the national
employment-to-population ratio between 2006 and 2012 (Figure 5; see Annex B1 for
methodological details). The largest positive contributions were made by wholesale and
retail trade (4.3 percentage points) and hotels and restaurants (1.5 percentage points).
Agriculture, manufacturing and public administration contributed negatively to the overall
change. Within the broad industry sector, mining contributed less than 0.7 percentage
points, while construction contributed 1.1 percentage points. The contribution of
manufacturing was minus 0.9 percentage points.
7
Figure 5. Contribution of each sector to change in the employment-to-population ratio from 2006 to 2012 (percentage points)
Sources: Authors' estimates based on GSS (2006) and GSS (2013).
The quality of jobs is assessed here using the classification by status in employment
and distinguishing between ‘vulnerable’ and ‘non-vulnerable’ employment. The analytical
strength of this distinction derives from the fact that it overlaps to an important extent with
the notion of dualism. Dualism in developing economies refers to the coexistence of a
formal segment, which uses reproducible capital and employs regular, full-time wage
employees, and a non-formal segment which relies much more on unskilled labour together
with natural resources and simple tools or implements. Contrary to the formal segment,
workers in the non-formal segment are self-employed or engaged in casual/irregular wage
work.
Vulnerable employment consists of the sum of the status groups of own-account
workers and contributing family workers. These workers are less likely to have formal
work arrangements, and are therefore more likely to lack elements associated with decent
work such as adequate social security and recourse to effective social dialogue mechanisms.
Vulnerable employment is often characterized by inadequate earnings, difficult conditions
of work that undermine workers’ fundamental rights, or other characteristics indicative of
decent work deficits (Sparreboom, 2011).
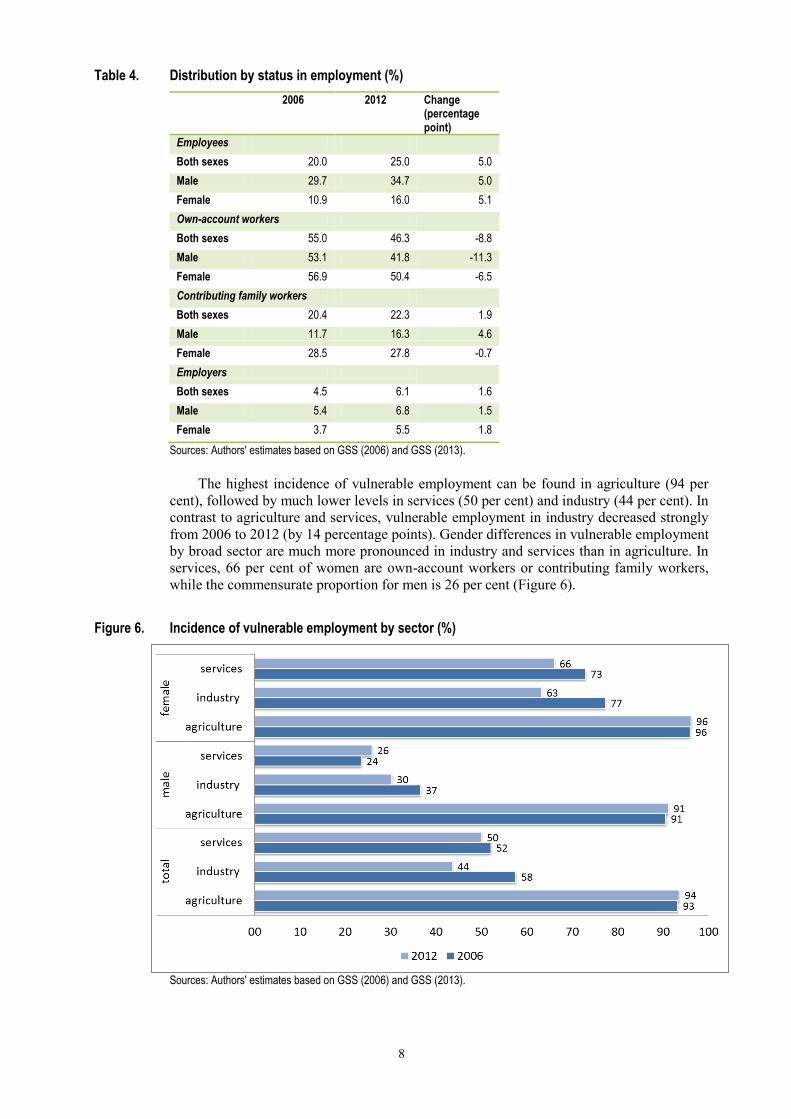
Vulnerable employment in Ghana is widespread, as more than three quarters of
workers were own-account workers or contributing family workers in 2006, decreasing to
69 per cent in 2012 (Table 4). In both years own-account workers constitute the single
largest group in the distribution of workers by status in employment (55 per cent in 2006,
decreasing to 46 per cent in 2012). The main difference between men and women is that the
latter are far more likely to be employed as contributing family workers (28 per cent of
female employment compared with 16 per cent of male employment in 2012), and far less
likely to be employees (16 per cent of female employment compared to 35 per cent of male
employment in 2012).
8
Table 4. Distribution by status in employment (%)
2006 2012 Change (percentage point)
Employees Both sexes 20.0 25.0 5.0
Male 29.7 34.7 5.0
Female 10.9 16.0 5.1
Own-account workers Both sexes 55.0 46.3 -8.8
Male 53.1 41.8 -11.3
Female 56.9 50.4 -6.5
Contributing family workers Both sexes 20.4 22.3 1.9
Male 11.7 16.3 4.6
Female 28.5 27.8 -0.7
Employers Both sexes 4.5 6.1 1.6
Male 5.4 6.8 1.5
Female 3.7 5.5 1.8
Sources: Authors' estimates based on GSS (2006) and GSS (2013).
The highest incidence of vulnerable employment can be found in agriculture (94 per
cent), followed by much lower levels in services (50 per cent) and industry (44 per cent). In
contrast to agriculture and services, vulnerable employment in industry decreased strongly
from 2006 to 2012 (by 14 percentage points). Gender differences in vulnerable employment
by broad sector are much more pronounced in industry and services than in agriculture. In
services, 66 per cent of women are own-account workers or contributing family workers,
while the commensurate proportion for men is 26 per cent (Figure 6).
Figure 6. Incidence of vulnerable employment by sector (%)
Sources: Authors' estimates based on GSS (2006) and GSS (2013).
9
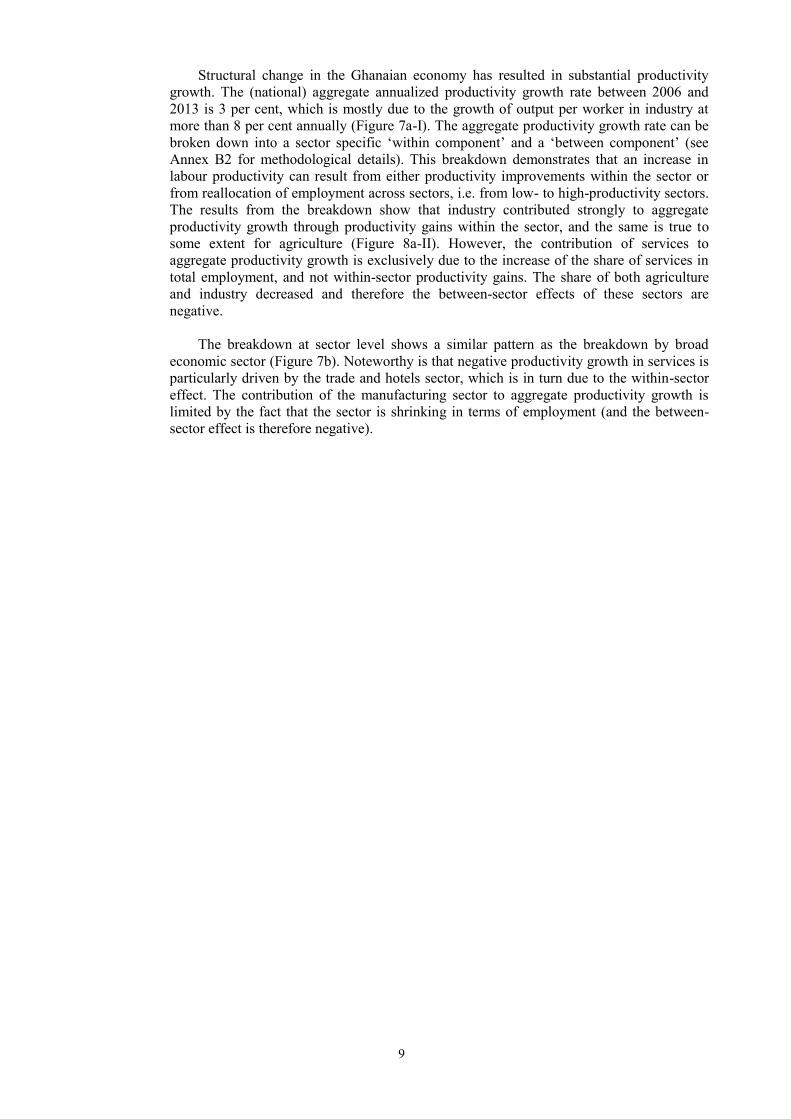
Structural change in the Ghanaian economy has resulted in substantial productivity
growth. The (national) aggregate annualized productivity growth rate between 2006 and
2013 is 3 per cent, which is mostly due to the growth of output per worker in industry at
more than 8 per cent annually (Figure 7a-I). The aggregate productivity growth rate can be
broken down into a sector specific ‘within component’ and a ‘between component’ (see
Annex B2 for methodological details). This breakdown demonstrates that an increase in
labour productivity can result from either productivity improvements within the sector or
from reallocation of employment across sectors, i.e. from low- to high-productivity sectors.
The results from the breakdown show that industry contributed strongly to aggregate
productivity growth through productivity gains within the sector, and the same is true to
some extent for agriculture (Figure 8a-II). However, the contribution of services to
aggregate productivity growth is exclusively due to the increase of the share of services in
total employment, and not within-sector productivity gains. The share of both agriculture
and industry decreased and therefore the between-sector effects of these sectors are
negative.
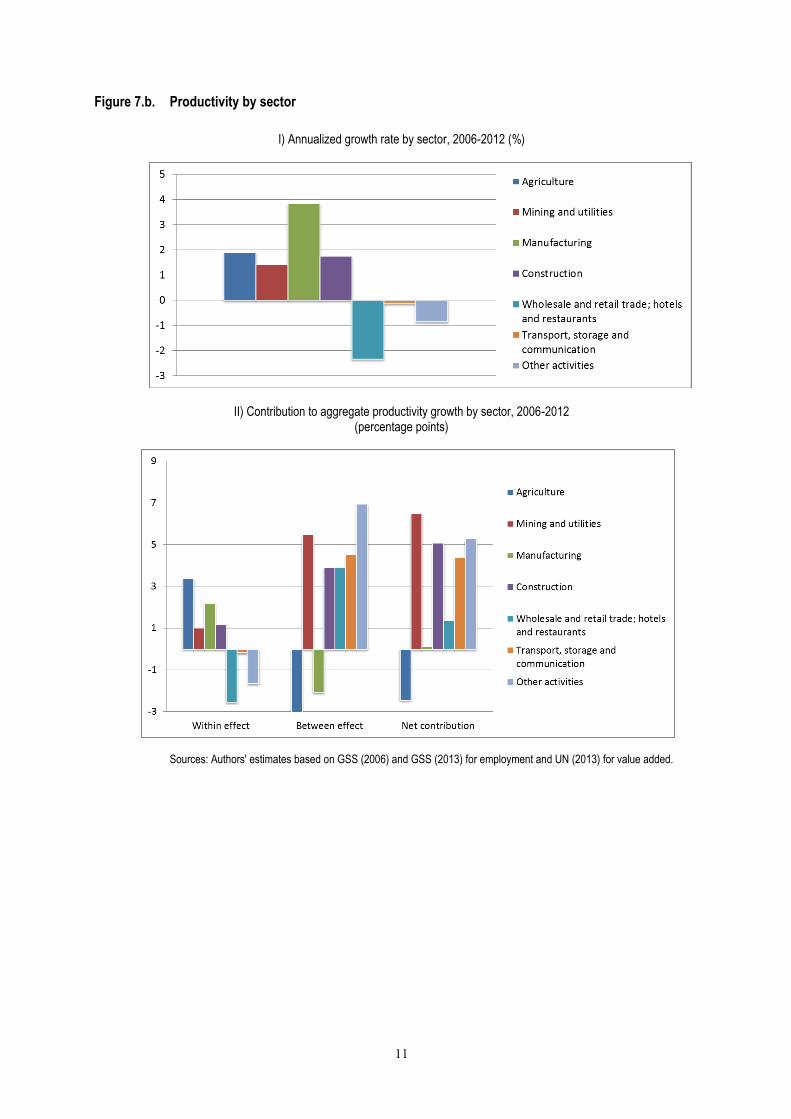
The breakdown at sector level shows a similar pattern as the breakdown by broad
economic sector (Figure 7b). Noteworthy is that negative productivity growth in services is
particularly driven by the trade and hotels sector, which is in turn due to the within-sector
effect. The contribution of the manufacturing sector to aggregate productivity growth is
limited by the fact that the sector is shrinking in terms of employment (and the between-
sector effect is therefore negative).
10
Figure 7.a. Productivity by broad sector
I) Annualized growth rate by broad sector, 2006-2012 (%)
II) Contributions to aggregate productivity growth by broad sector, 2006-2012 (percentage points)
Sources: Authors' estimates based on GSS (2006) and GSS (2013) for employment and UN (2013) for value added.
11
Figure 7.b. Productivity by sector
I) Annualized growth rate by sector, 2006-2012 (%)
II) Contribution to aggregate productivity growth by sector, 2006-2012 (percentage points)
Sources: Authors' estimates based on GSS (2006) and GSS (2013) for employment and UN (2013) for value added.

12
3. Education policies and enrolment rates
Ghana is classified by UNDP’s Human Development Index (HDI) as a ‘medium’
development country. The country’s HDI stands at 0.558 corresponding to a rank of 135
out of 187 countries in 2012 (UNDP, 2013). This HDI is 8 percentage points above the
average for Sub-Saharan Africa (ibid.). Education is one of the human development
dimensions in which Ghana fares better than its regional counterparts, ranking 9th out of 28
in terms of the EFA development index (UNESCO, 2012a).
Since its independence in 1957, Ghana has enacted several education policy
programmes. The Education Act of 1961 introduced free and compulsory education (IBE,
2010). In the late 1970s and early 1980s, participation in basic education declined, in part
due to economic challenges and reduced resources (Allsop et al., 2010). Reforms in the late
1980s aimed to increase enrolment and improve quality, inter alia through better training of
teachers and increased school hours (Thompson and Casely-Hayford, 2008). The 1992
Constitution reinforced the notion of free and compulsory basic education, and stressed the
importance of access to secondary education as well as to adult literacy programmes and
vocational training (IBE, 2010). Following the reforms in 2007, the structure of the basic
educational system in Ghana includes 2 years of kindergarten, 6 years of primary school,
and 3 years of junior secondary education (which complete compulsory education) (IBE,
2010). Despite substantial investment, textbooks and trained teachers remain scarce (Allsop
et al., 2010).
Figure 8. Evolution of the gross enrolment rate in primary and secondary education (%)
Source: UNESCO (2014).
Policy efforts to widen access have been successful, to the extent that from 1990 to
2013 the gross enrolment rate at primary level increased from 72 to 109 per cent, and from
36 to 61 per cent at secondary level (figure 8).6 In addition, net enrolment rates increased
from 65 and 35 per cent for primary and secondary level, respectively, in 2000, to 87 and
51 per cent in 2013 (UNESCO, 2014). Furthermore, the positive evolution of the enrolment
_______________________
6 The gross enrolment rate is defined as the total number of students enrolled at a particular level of education,
regardless of their age, as a percentage of the population in the age group associated with that level; the net
enrolment rate is defined as total number of students enrolled at a particular level of schooling who are of the
age associated with that level of schooling, divided by all persons of the age associated with that level of
schooling.
13
rate has not been at the expense of the survival rate, which increased substantially for both
levels, at roughly 10 percentage points between 1991 and the latest observation.7
The youth (aged 15-24) literacy rate appears to have responded to these improvements
and increased from 71 per cent in 2000 to 86 per cent in 2010 (World Bank, 2014).
Enrolment data also allow for moderate optimism regarding gender equality, with a ratio of
girls to boys of 0.98 and 0.90 for primary and secondary level in 2010, compared to ratios
of 0.93 and 0.82 for Sub-Saharan Africa (UNESCO, 2012b).
Apart from education provision for children and youth, an important policy goal has
been the reduction of adult illiteracy. The National Functional Literacy Programme, which
ran from 1992 to 2007, aimed to provide adults with access to literacy skills (ODI, 2006).
The programme was developed in two phases, the first of which ended in 1997 and enrolled
a total of 1.3 million adults. The second phase, which targeted women and rural poor,
substantially achieved the goal of delivering basic literacy skills to one million adults
(World Bank, 2010). The adult literacy rate (aged 15+) increased from 58 per cent in 2000
to 71.5 per cent in 2010 (World Bank, 2014).
Despite these achievements, a number of substantial educational challenges remain.
Quality of education remains an issue, as only 1 in 4 pupils achieve proficiency in English,
after 6 years of primary education, and 1 in 10 pupils in mathematics (Allsop et al., 2010).
In fact, Hanushek and Wößmann (2007) suggest that only 5 per cent of 15-19 years old are
fully literate. Allsop et al. (2010), based on two surveys (Brookings Institute, 2007, and
World Bank IEG, 2007), attribute this to absenteeism amongst teachers and the limited
school time actually devoted to learning activities. According to these surveys average
teacher absence is 27 per cent, and time devoted to learning activities is not more than 39
per cent of the school year. Another factor negatively affecting the quality of education is
the shortage of adequately trained teachers. In 1999, 72 per cent of teachers in primary
education were trained, whilst that percentage had fallen to 53 per cent in 2013 (World
Bank, 2014). Such a decline is likely to translate into lower average quality of education,
even when outcomes improve due to the expansion of education.
Gender inequality in education outcomes is another issue. Literacy rates for men and
women aged 15 and above were 66 per cent and 50 per cent in the year 2000, respectively,
and by 2010 had increased to 78 and 65 per cent. This means that the gap between men and
women did not narrow much. Youth fare better in this regard, as the gender gap decreased
from 10 percentage points in 2000 to 5 points in 2010 (World Bank, 2014). Given the
evolution in enrolment rates noted before, the gender gap is likely to further decrease.
A final issue worthy of consideration is regional disparities. For instance, the gross
enrolment rate for secondary education in the central region is twice as high as the rate for
the northern region (Higgins, 2009). Access to education in rural regions is hampered by
the higher cost of delivering the courses. According to UNESCO (UNESCO, 2012b)
vocational courses in rural regions can be 20 times more expensive in rural schools than in
urban schools. Overall, Ghana has made significant progress in education over the last
decade. Nonetheless, further efforts are required to improve quality, increase adult literacy,
especially targeting women, and expand education to rural areas.
_______________________
7 For primary level, the latest available data on survival rates in UNESCO (2014) refer to 2008, and in the case
of secondary education to 2013.
14
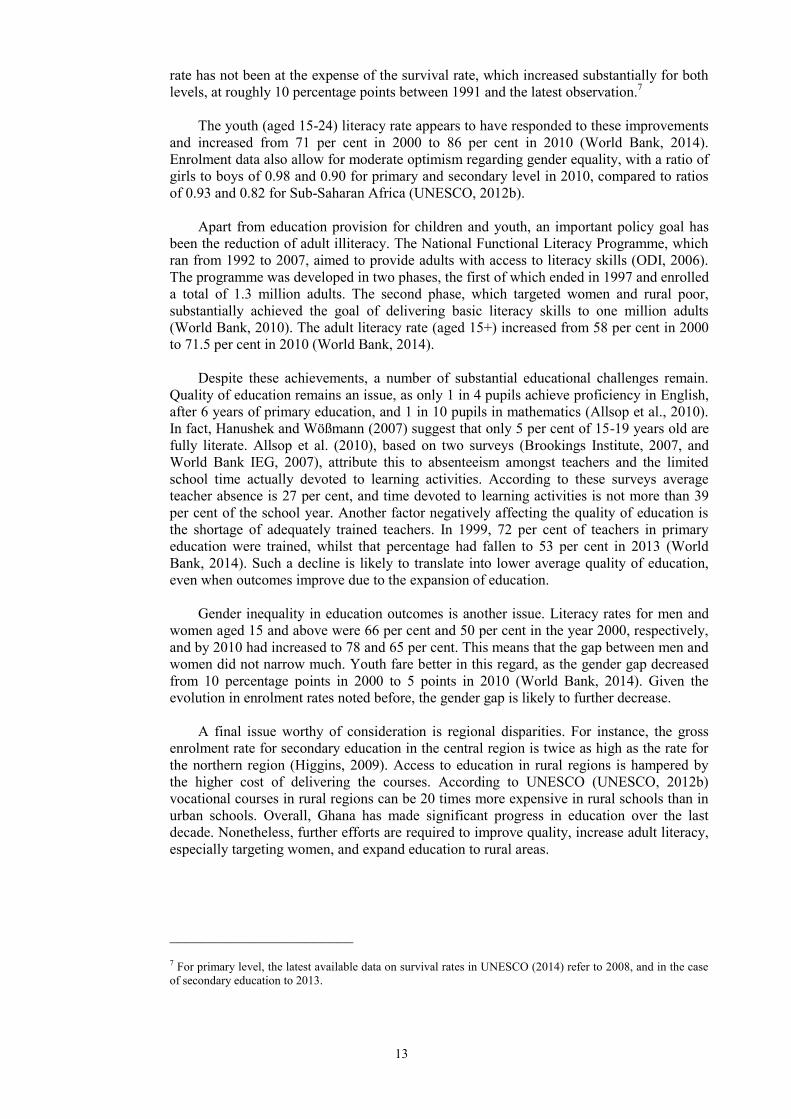
4. Education profile of the labour force
The educational attainment of Ghana's labour force in 2006 is characterized by a large
share of workers with lower secondary education (36 per cent), but also a large share of
workers with no educational qualification (35 per cent) (Figure 9). The share of the labour
force with only primary education is 16 per cent, while higher secondary and tertiary
qualifications are rare and represent at most 10 and 4 per cent respectively of the labour
force. Figure 9 also reveals stark gender differences. The share of women with no
educational qualification is more than 16 percentage points higher than the commensurate
share for men, and the gender gap in lower secondary is almost 11 percentage points. The
share of women with higher secondary and tertiary education is roughly half the
commensurate share of men.
Figure 9. Education profile of the labour force (%)
Sources: Authors' estimates based on GSS (2006) and GSS (2013).
Levels of educational attainment in 2012 are higher across the board. The share of the
labour force without educational qualifications is 10 percentage points lower, and the share
with lower secondary education is 3.7 percentage points higher. The share of the labour
force with higher secondary education increased by a similar amount, to 12.6 per cent, and
the share with tertiary education to 5.6 per cent. Nonetheless gender disparities persist, and
the difference between the male and female share with no educational qualification
decreased by little over 2 percentage points to 14 percentage points. At the higher levels of
educational qualifications the share of women continues to be around half the share of men.
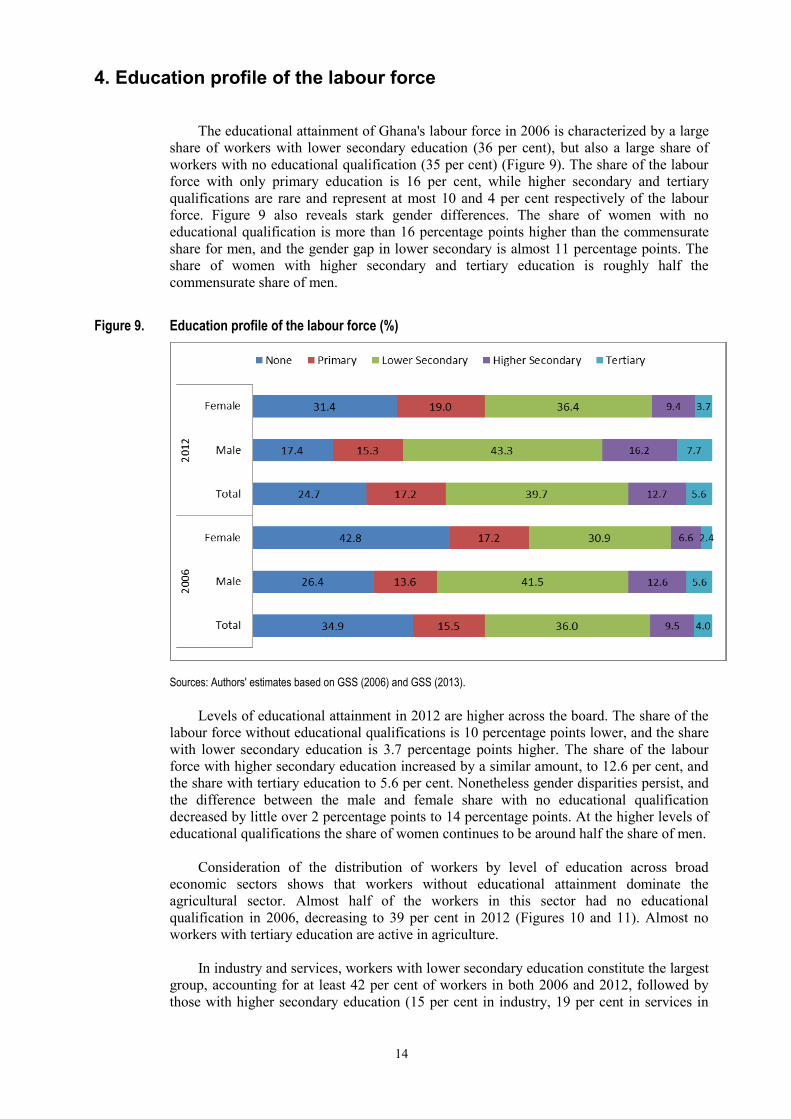
Consideration of the distribution of workers by level of education across broad
economic sectors shows that workers without educational attainment dominate the
agricultural sector. Almost half of the workers in this sector had no educational
qualification in 2006, decreasing to 39 per cent in 2012 (Figures 10 and 11). Almost no
workers with tertiary education are active in agriculture.
In industry and services, workers with lower secondary education constitute the largest
group, accounting for at least 42 per cent of workers in both 2006 and 2012, followed by
those with higher secondary education (15 per cent in industry, 19 per cent in services in

15
2012). The share of workers with no education in industry and services decreased to around
14 per cent in 2012. Services stand out for their much higher share of workers with tertiary
education. In 2012, almost 12 per cent of workers had obtained a tertiary qualification,
compared with less than 4 per cent for workers in industry and less than 1 per cent in
agriculture.
Although the pattern of educational attainment across broad sectors is similar for men
and women, as was mentioned before, the proportion of women with no educational
qualification is much higher.
16
Figure 10. Education distribution by broad sector, 2006 (% of sector employment)
(a) Total employment
(b) Male employment
(c) Female employment
Source: Authors' estimates based on GSS (2006).

17
Figure 11. Education distribution by broad sector, 2012 (% of sector employment)
(a) Total employment
(b) Male employment
(c) Female employment
Source: Authors' estimates based on GSS (2013).
18
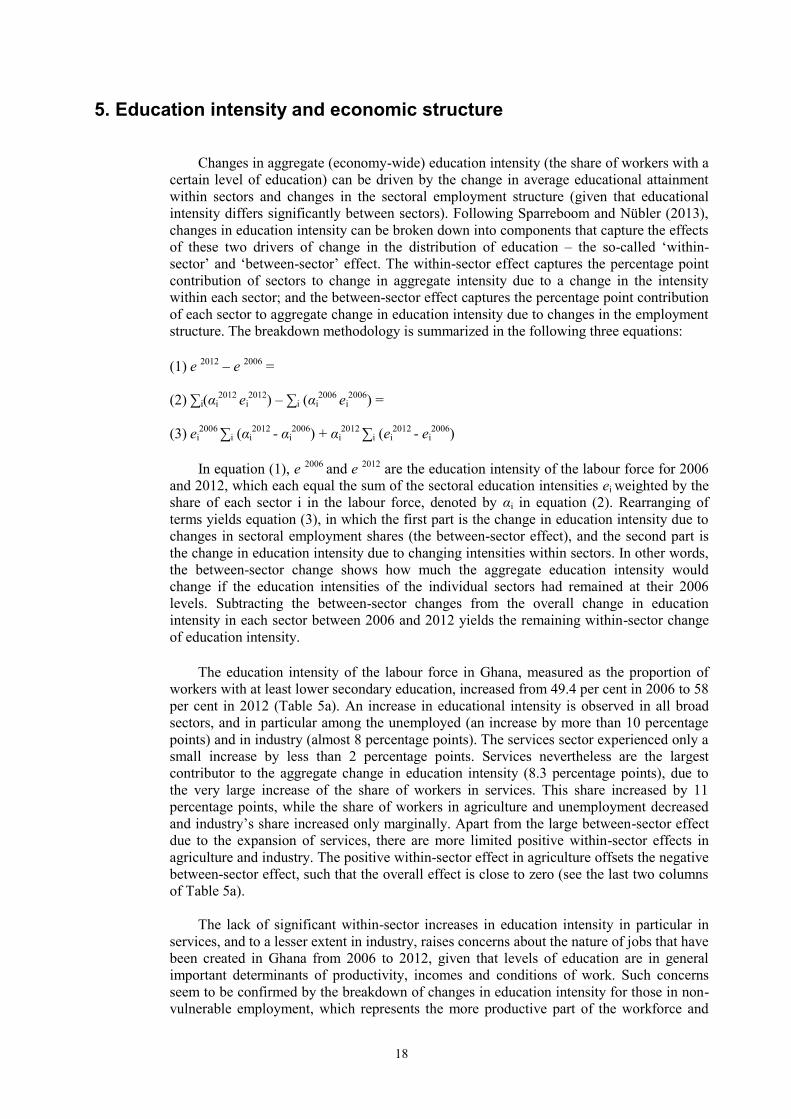
5. Education intensity and economic structure
Changes in aggregate (economy-wide) education intensity (the share of workers with a
certain level of education) can be driven by the change in average educational attainment
within sectors and changes in the sectoral employment structure (given that educational
intensity differs significantly between sectors). Following Sparreboom and Nübler (2013),
changes in education intensity can be broken down into components that capture the effects
of these two drivers of change in the distribution of education – the so-called ‘within-
sector’ and ‘between-sector’ effect. The within-sector effect captures the percentage point
contribution of sectors to change in aggregate intensity due to a change in the intensity
within each sector; and the between-sector effect captures the percentage point contribution
of each sector to aggregate change in education intensity due to changes in the employment
structure. The breakdown methodology is summarized in the following three equations:
(1) e
2012 – e
2006 =
(2) ∑i(αi2012
ei2012
) – ∑i (αi2006
ei2006
) =
(3) ei2006
∑i (αi2012
- αi2006
) + αi2012
∑i (ei2012
- ei2006
)
In equation (1), e
2006 and e
2012 are the education intensity of the labour force for 2006
and 2012, which each equal the sum of the sectoral education intensities ei weighted by the
share of each sector i in the labour force, denoted by αi in equation (2). Rearranging of
terms yields equation (3), in which the first part is the change in education intensity due to
changes in sectoral employment shares (the between-sector effect), and the second part is
the change in education intensity due to changing intensities within sectors. In other words,
the between-sector change shows how much the aggregate education intensity would
change if the education intensities of the individual sectors had remained at their 2006
levels. Subtracting the between-sector changes from the overall change in education
intensity in each sector between 2006 and 2012 yields the remaining within-sector change
of education intensity.
The education intensity of the labour force in Ghana, measured as the proportion of
workers with at least lower secondary education, increased from 49.4 per cent in 2006 to 58
per cent in 2012 (Table 5a). An increase in educational intensity is observed in all broad
sectors, and in particular among the unemployed (an increase by more than 10 percentage
points) and in industry (almost 8 percentage points). The services sector experienced only a
small increase by less than 2 percentage points. Services nevertheless are the largest
contributor to the aggregate change in education intensity (8.3 percentage points), due to
the very large increase of the share of workers in services. This share increased by 11
percentage points, while the share of workers in agriculture and unemployment decreased
and industry’s share increased only marginally. Apart from the large between-sector effect
due to the expansion of services, there are more limited positive within-sector effects in
agriculture and industry. The positive within-sector effect in agriculture offsets the negative
between-sector effect, such that the overall effect is close to zero (see the last two columns
of Table 5a).
The lack of significant within-sector increases in education intensity in particular in
services, and to a lesser extent in industry, raises concerns about the nature of jobs that have
been created in Ghana from 2006 to 2012, given that levels of education are in general
important determinants of productivity, incomes and conditions of work. Such concerns
seem to be confirmed by the breakdown of changes in education intensity for those in non-
vulnerable employment, which represents the more productive part of the workforce and
19
tends to have higher levels of education (Sparreboom and Staneva, 2014). The increase in
education intensity in economy-wide non-vulnerable employment is negative (-0.5
percentage points), and the within-sector effect in both industry and services is also
negative (Table 5b). In other words, much of the increase in educational attainment of the
Ghanaian labour force in the period under review was absorbed by the relatively
unproductive segment of the economy, and services in particular.
Table 5. Education intensity and economic structure
(a) Labour force
Share of labour force (%) Education intensity (%) Between-sector effect
Within-sector effect
Contribution Contribution (%)
2006 2012 Change 2006 2012 Change Agriculture 51.3 43.0 -8.3 33.4 40.2 6.8 -2.77 2.91 0.15 1.7
Industry 13.3 13.7 0.4 62.0 69.8 7.9 0.27 1.08 1.35 15.9
Services 28.9 39.6 10.7 70.6 72.4 1.8 7.57 0.72 8.30 97.2
Unemployed 6.5 3.6 -2.9 56.7 67.1 10.4 -1.64 0.38 -1.26 -14.8
Aggregate 100.0 100.0 49.4 58.0 8.5 3.44 5.10 8.54 100.00
Sources: Authors' estimates based on GSS (2006) and GSS (2013).
(b) Non-vulnerable employment
Share of labour force (%) Education intensity (%) Between-sector effect
Within-sector effect
Contribution Contribution (%)
2006 2012 Change 2006 2012 Change
Agriculture 15.2 9.1 -6.1 48.3 49.4 1.1 -2.94 0.10 -2.84 562.1
Industry 24.6 25.6 1.0 78.1 76.3 -1.8 0.79 -0.46 0.33 -65.1
Services 60.2 65.3 5.1 86.8 83.1 -3.7 4.42 -2.41 2.01 -397.0
Aggregate 100.0 100.0 78.8 78.3 -0.5 2.26 -2.77 -0.51 100.00
Sources: Authors' estimates based on GSS (2006) and GSS (2013).
A more detailed breakdown at the level of individual sectors as opposed to broad
sectors shows that the largest positive contributions to aggregate education intensity are
generated by sectors within broad services (see Table A2). Wholesale and retail trade
represents 40 per cent of the aggregate change in education intensity, followed at a distance
by hotels and restaurants. These contributions are mainly due to the between-sector effects.
Consideration of the more productive segment of non-vulnerable employment shows that
changes in educational intensity in non-vulnerable employment in wholesale and retail
trade, in manufacturing and in fishing were strongly negative, and several other sectors
experienced a decrease in education intensity (Table A3). The decrease in the wholesale
and retail trade, in particular, and the small but negative within-sector effect in non-
vulnerable employment in hotels and restaurants are consistent with the lack of productivity
gains within these sectors as highlighted in Section 2.
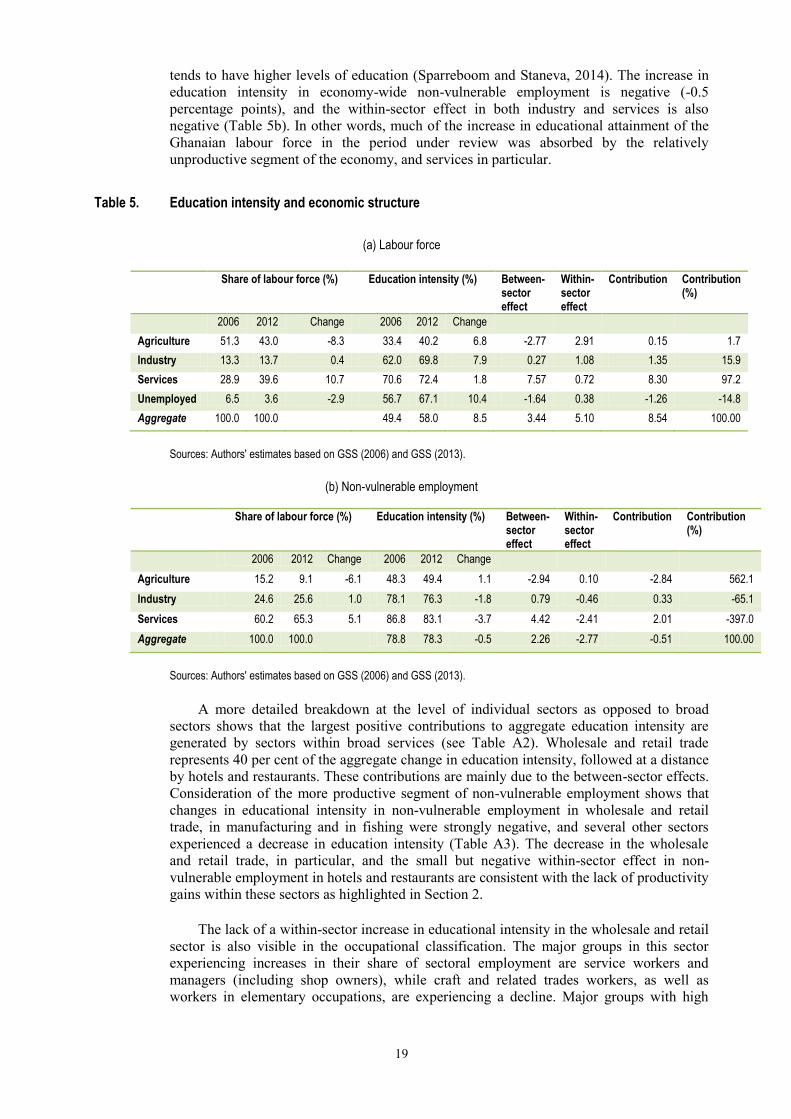
The lack of a within-sector increase in educational intensity in the wholesale and retail
sector is also visible in the occupational classification. The major groups in this sector
experiencing increases in their share of sectoral employment are service workers and
managers (including shop owners), while craft and related trades workers, as well as
workers in elementary occupations, are experiencing a decline. Major groups with high
20
levels of educational attainment and high levels of productivity such as professionals and
technicians remained stagnant from 2006 to 2012 (Figure 12).
Figure 12. Changes in the occupational distribution in wholesale and retail trade, 2006-2012 (percentage points)
Sources: Authors' estimates based on GSS (2006) and GSS (2013).

21
6. Qualifications mismatch
After decades of education policy reforms and efforts which have resulted in gradual
improvements in educational attainment, it is important to consider the extent to which
actual attainment levels match those required by the jobs workers are doing. The issue of
skills mismatch is also relevant as skills contribute to productivity, diversification and
employment, and may be a key factor of success in economies faced with the risk of Dutch
disease (Darvas and Palmer, 2014). The argument is that if the effect of oil revenue is a
decrease in the competitiveness of non-oil tradeable sectors, this decrease can be countered
by an improvement in available skills. Furthermore, if a developing economy is moving
from relative dependence on agricultural production to industrial and service sector
employment, workers need to learn new technical, entrepreneurial and social skills. If the
new demands cannot be met due to inadequate education, this hampers the transfer of
production factors from lower to higher value added activities. Similarly, over-education
and under-use of skills may lead to skills loss and generate greater employee turnover,
which, in turn, is likely to affect firms’ productivity levels.
One way to assess the availability of skills in Ghana is to consider qualifications
mismatch. In this section and the remainder of the paper, qualifications mismatch is
measured in terms of over-education and under-education.8 Over-education and under-
education are quantified following ILO (2014) according to the normative approach based
on the International Classification of Occupations (ISCO). This normative measure starts
from the division of major occupational groups (first-digit ISCO levels) into three groups
and assigns a level of education to each group. In particular, the first three major groups are
assigned tertiary education; major groups 4 to 8 are assigned secondary education (lower or
higher); and major group 9 is assigned primary education (see also ILO, 2012). Workers in
a particular group who have the assigned level of education are considered well-matched.
Those who have a higher (lower) level of education are considered over-educated (under-
educated). For instance, a university graduate working as a clerk is over-educated, while a
secondary school graduate working as an engineer is under-educated.
According to this normative approach, all major groups, except elementary
occupations, are thus linked to levels of education above the primary level. The rationale is
that, for most occupations, the ability to read information, such as instructions, to make
written records of work completed and to accurately perform simple arithmetical
calculations, is essential, and workers are therefore required to possess relatively advanced
literacy and numeracy skills and good interpersonal communication skills. Particularly in
countries such as Ghana, in which there are concerns about the quality of education (see
Section 3), this rationale is reinforced to the extent that additional years of secondary
education are required to achieve the objectives of primary schooling. Furthermore, lower
secondary education is considered vital in the development of foundation and core
employability skills (UNESCO, 2012c).
More than half of workers were underqualified in 2006 (52 per cent) and only 5 per
cent were overqualified; the remainder (43 per cent) were correctly matched (Figure 13).
By 2012, correctly matched workers had become the single largest group (49 per cent), and
the proportion of underqualified workers had decreased to 45 per cent. There are large
differences between men and women in terms of qualifications mismatch. The estimated
share of underqualified women is much higher than the commensurate share of men, and
_______________________
8 See ILO (2014) and Quintini (2011) for a discussion of alternative methods of measurement of skills
mismatch.

22
the difference did not decrease much from 2006 to 2012 (17 and 14 percentage points,
respectively). The share of correctly matched young workers in both years is higher than
that for the employed across all ages, which is mostly due to lower levels of under-
qualification of youth.
Figure 13. Qualifications mismatch, percentage of employment, 2006 and 2012
Sources: Authors' estimates based on GSS (2006) and GSS (2013).
Figure 14. Qualifications mismatch, percentage of employment by major occupational group, 2006 and 2012
(a) 2006
(b) 2012
Sources: Authors' estimates based on GSS (2006) and GSS (2013).
23
Consideration of qualifications mismatch by occupation shows that elementary
occupations and clerks demonstrate the largest share of overqualified workers both in 2006
and in 2012 (Figure 14). In the major group elementary occupations, over-qualification is
the most common status, while in the major group of clerks the share of overqualified
workers increased by almost 10 percentage points in this period. Except in the major group
- clerks, under-qualification is pervasive across all occupations and affects the majority of
workers in the major groups - skilled agricultural workers, technicians and managers in
2012. In five major groups (professionals, clerks, service workers, craft workers and plant
operators), the majority of workers are correctly matched. In all but three groups the
proportion of correctly matched workers increased from 2006 to 2012 (see Annex Figure
A2 and Figure A3 for qualifications mismatch for men and women separately).
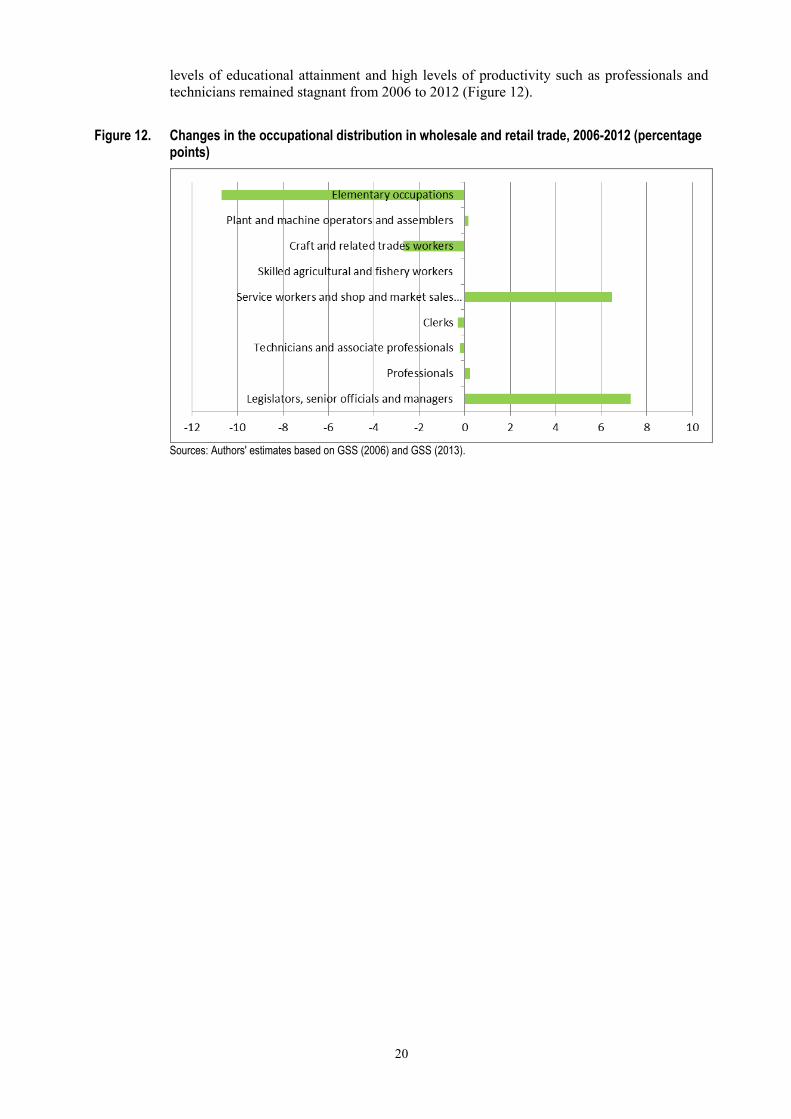
Qualifications mismatch is less prevalent among workers in non-vulnerable
employment. Except for clerks, the proportion of correctly matched workers is higher and
levels of under-qualification are lower in almost all major occupational groups in non-
vulnerable employment (see Annex Figures A4 and A5 for qualifications mismatch in non-
vulnerable employment). Nevertheless, the proportion of correctly matched workers in non-
vulnerable employment showed an improvement from 2006 to 2012 only in elementary
occupations (and marginally in professional occupations), and was stagnant or declined in
the remaining groups (Figure 15). Levels of under-qualification increased in most major
groups, which appears to be consistent with the limited increase in education intensity in
economy-wide non-vulnerable employment noted in Section 5.
Figure 15. Changes in qualifications mismatch from 2006 to 2012, non-vulnerable employment by major occupational group (percentage points)
Sources: Authors' estimates based on GSS (2006) and GSS (2013).
24
7. Returns to education
Rates of return are often high in Sub-Saharan Africa (Psacharopoulos and Patrinos,
2004b; World Bank, 2012), which is perhaps not surprising in view of the generally low
levels of educational attainment. At the same time, returns may decrease over time due to
increasing levels of educational attainment and lack of growth in non-vulnerable or formal
employment. Rate of return analysis over time can therefore help understand the role of
education, including with regard to patterns across sectors and in relation to structural
change.
Returns to education in this paper are estimated using years of schooling and levels of
educational attainment. We adopt a conventional Mincerian earnings function approach for
the calculation of returns to education, which is detailed in Annex B3. The analysis is
limited to workers in paid employment (wage and salaried workers), and conducted by
broad sector as well as separately for men and women.
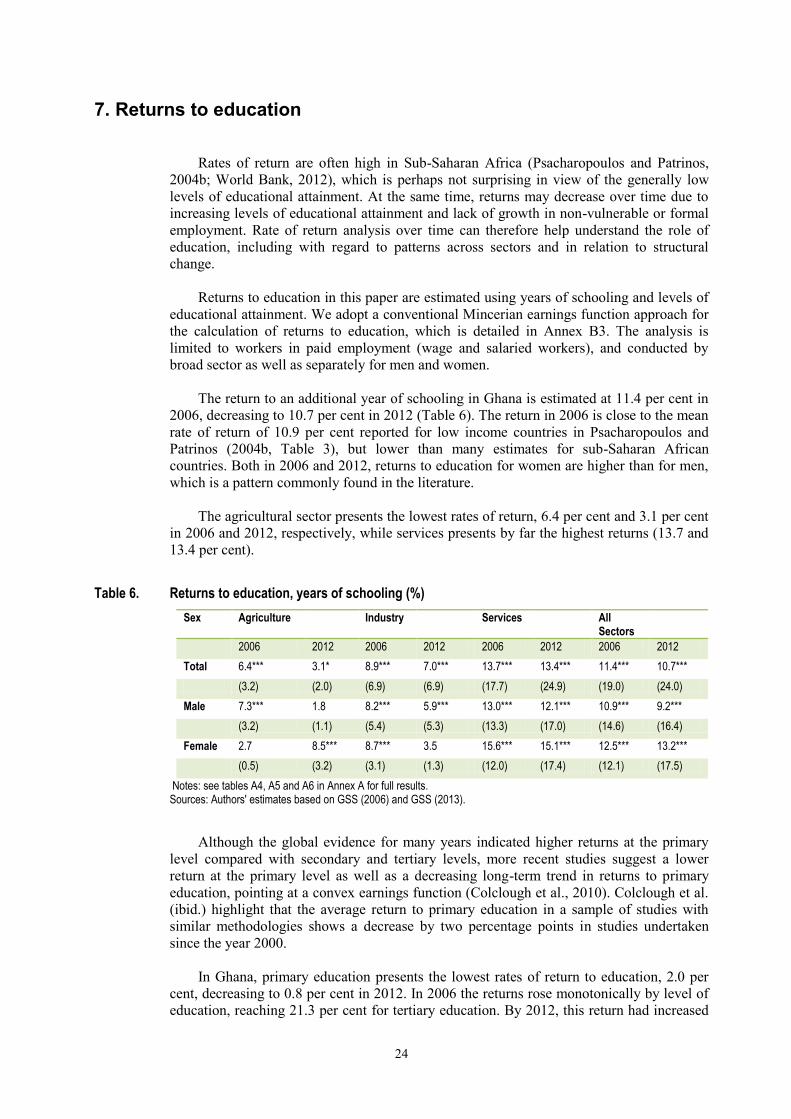
The return to an additional year of schooling in Ghana is estimated at 11.4 per cent in
2006, decreasing to 10.7 per cent in 2012 (Table 6). The return in 2006 is close to the mean
rate of return of 10.9 per cent reported for low income countries in Psacharopoulos and
Patrinos (2004b, Table 3), but lower than many estimates for sub-Saharan African
countries. Both in 2006 and 2012, returns to education for women are higher than for men,
which is a pattern commonly found in the literature.
The agricultural sector presents the lowest rates of return, 6.4 per cent and 3.1 per cent
in 2006 and 2012, respectively, while services presents by far the highest returns (13.7 and
13.4 per cent).
Table 6. Returns to education, years of schooling (%)
Sex Agriculture Industry Services All Sectors
2006 2012 2006 2012 2006 2012 2006 2012
Total 6.4*** 3.1* 8.9*** 7.0*** 13.7*** 13.4*** 11.4*** 10.7***
(3.2) (2.0) (6.9) (6.9) (17.7) (24.9) (19.0) (24.0)
Male 7.3*** 1.8 8.2*** 5.9*** 13.0*** 12.1*** 10.9*** 9.2***
(3.2) (1.1) (5.4) (5.3) (13.3) (17.0) (14.6) (16.4)
Female 2.7 8.5*** 8.7*** 3.5 15.6*** 15.1*** 12.5*** 13.2***
(0.5) (3.2) (3.1) (1.3) (12.0) (17.4) (12.1) (17.5)
Notes: see tables A4, A5 and A6 in Annex A for full results. Sources: Authors' estimates based on GSS (2006) and GSS (2013).
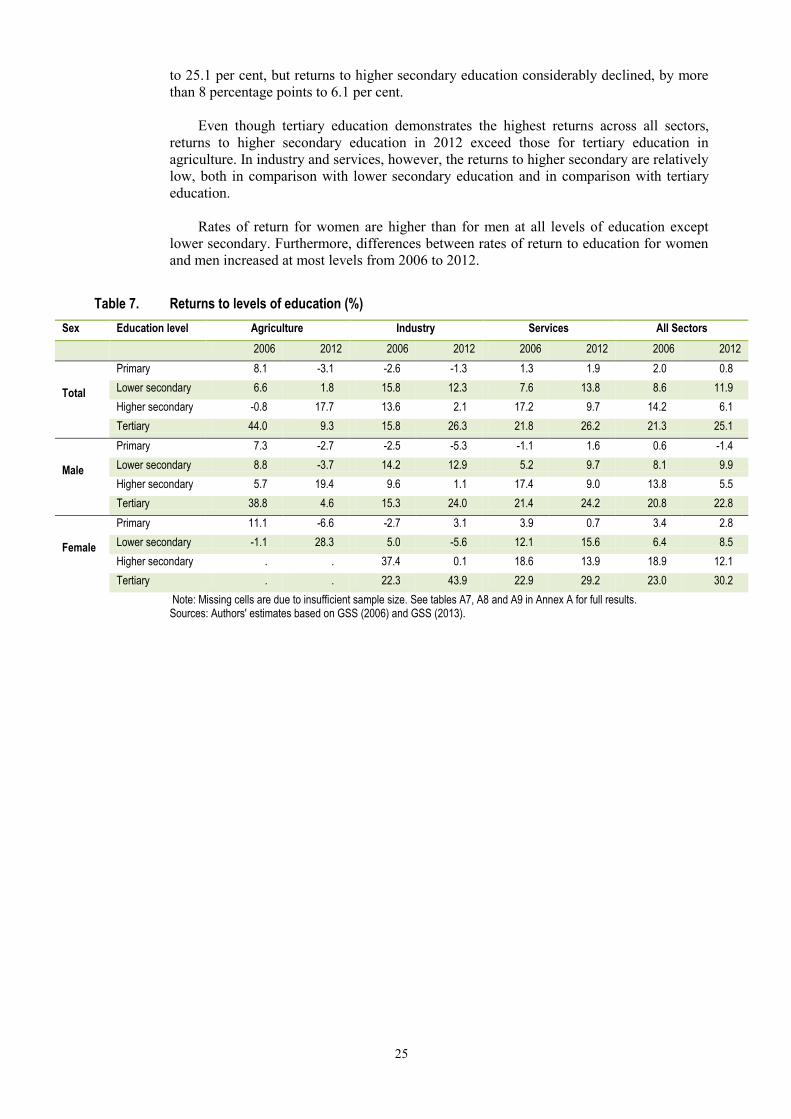
Although the global evidence for many years indicated higher returns at the primary
level compared with secondary and tertiary levels, more recent studies suggest a lower
return at the primary level as well as a decreasing long-term trend in returns to primary
education, pointing at a convex earnings function (Colclough et al., 2010). Colclough et al.
(ibid.) highlight that the average return to primary education in a sample of studies with
similar methodologies shows a decrease by two percentage points in studies undertaken
since the year 2000.
In Ghana, primary education presents the lowest rates of return to education, 2.0 per
cent, decreasing to 0.8 per cent in 2012. In 2006 the returns rose monotonically by level of
education, reaching 21.3 per cent for tertiary education. By 2012, this return had increased
25
to 25.1 per cent, but returns to higher secondary education considerably declined, by more
than 8 percentage points to 6.1 per cent.
Even though tertiary education demonstrates the highest returns across all sectors,
returns to higher secondary education in 2012 exceed those for tertiary education in
agriculture. In industry and services, however, the returns to higher secondary are relatively
low, both in comparison with lower secondary education and in comparison with tertiary
education.
Rates of return for women are higher than for men at all levels of education except
lower secondary. Furthermore, differences between rates of return to education for women
and men increased at most levels from 2006 to 2012.
Table 7. Returns to levels of education (%)
Sex Education level Agriculture Industry Services All Sectors
2006 2012 2006 2012 2006 2012 2006 2012
Total
Primary 8.1 -3.1 -2.6 -1.3 1.3 1.9 2.0 0.8
Lower secondary 6.6 1.8 15.8 12.3 7.6 13.8 8.6 11.9
Higher secondary -0.8 17.7 13.6 2.1 17.2 9.7 14.2 6.1
Tertiary 44.0 9.3 15.8 26.3 21.8 26.2 21.3 25.1
Male
Primary 7.3 -2.7 -2.5 -5.3 -1.1 1.6 0.6 -1.4
Lower secondary 8.8 -3.7 14.2 12.9 5.2 9.7 8.1 9.9
Higher secondary 5.7 19.4 9.6 1.1 17.4 9.0 13.8 5.5
Tertiary 38.8 4.6 15.3 24.0 21.4 24.2 20.8 22.8
Female
Primary 11.1 -6.6 -2.7 3.1 3.9 0.7 3.4 2.8
Lower secondary -1.1 28.3 5.0 -5.6 12.1 15.6 6.4 8.5
Higher secondary . . 37.4 0.1 18.6 13.9 18.9 12.1
Tertiary . . 22.3 43.9 22.9 29.2 23.0 30.2
Note: Missing cells are due to insufficient sample size. See tables A7, A8 and A9 in Annex A for full results. Sources: Authors' estimates based on GSS (2006) and GSS (2013).
26
8. Conclusions and recommendations
Similar to the broad pattern in Sub-Saharan Africa, Ghana’s impressive record of
economic growth has not been translated into an equally impressive labour market
performance. From 2006 to 2012, the proportion of employees in the country’s workforce
increased by 5 percentage points, which is a significant achievement but also leaves the
large majority of workers in vulnerable forms of employment for many years to come.
Furthermore, the economy appears to suffer from Dutch disease, and is increasingly
dependent on exports of commodities.
Structural change has been an important characteristic of Ghana. From 2006 to 2012,
the share of agriculture in employment decreased by 10 percentage points, and employment
in services increased by roughly the same amount. However, at the same time the incidence
of vulnerable employment in services did not improve much (a decrease by 2 percentage
points), pointing to the low quality of much job creation. The incidence of vulnerable
employment did show a strong decrease in industry (14 percentage points), but employment
in industry has been stagnant, and has decreased in the manufacturing sector.
Strong economic growth has been accompanied by sustained increases in productivity,
which are an important determinant of conditions of work. Productivity gains have been
achieved in agriculture and industry, as well as through the expansion of employment in
services. At the same time, the breakdown of productivity growth shows that the
contribution of services is exclusively due to the increase of the share of services in total
employment, and no within-sector productivity gains have been achieved. This appears
consistent with the expansion of low quality service employment, in particular in wholesale
and retail trade. The latter sector made the largest contribution to the increase in the
employment-to-population ratio in Ghana from 2006 to 2012.
Increases in productivity have been supported by Ghana’s achievements with respect
to education. The share of the labour force with at least secondary education increased from
49 per cent in 2006 to 58 per cent in 2012. This allowed for an increase in education
intensity in the three broad economic sectors, despite the structural change and the much
higher education intensity in the expanding service sectors. Nevertheless, the increase in
education intensity in services was small, and decreased strongly in the more productive
segment of non-vulnerable employment. Education intensity also decreased in non-
vulnerable employment in industry. The pattern of education intensity is reflected in
qualifications mismatch, which shows increases in under-qualification in non-vulnerable
employment, despite the strong reduction in economy-wide under-qualification from 2006
to 2012.
Patterns of rates of return appear consistent with the role of education in Ghana’s
economy, and in particular the structural change experienced by the country. In view of the
strong increases in the supply of educated workers an overall decrease in the rate of return
to schooling can be expected. But such a decrease may also reflect the apparent limited use
of educated workers in the more productive segment of the economy, which offsets the
demand for better educated workers in the growing services sectors.
Despite the achievements in raising levels of education, Ghana’s labour force
continues to be characterized by a significant share of workers without educational
qualifications and a low proportion of workers with advanced schooling. This underlines
the need for continued investment in education, including in terms of the quality of
education. The extent of qualifications mismatch also illustrates the need for policies to
widen access to education at higher secondary and tertiary levels. Rate of return analysis in
particular supports the expansion of tertiary education.

27
Improved education and training policies are required not just for skills development,
but also for broadening the social knowledge base. Investment in R&D and transfer of
advanced technologies are also required. In addition, industrial policies that enhance
competitiveness through promotion of an enabling environment, enterprise clusters and
value chains should be pursued.
Successful economic transformation is associated with a movement of labour out of
the rural agricultural sector into the urban industrial and service sectors, leading to higher
productivity levels and progressively rising income levels. To a certain extent this has
happened in Ghana, and services absorb an increasing share of the labour force.
Nevertheless, vulnerable employment remains widespread, in particular in services, and
transformation towards higher value added activities within service sectors seems limited.
Moreover, this is coupled with a deep and pervasive informal economy. Together with the
lack of industrial job creation, this underlines the need for economic policies to support
employment creation in more innovative activities and dynamic sectors, as well as to adopt
measures to improve working conditions and facilitate the formalization of the informal
economy.
Given the growth of extractive industries, if revenues are invested in related higher
value-added downstream and service activities with high employment potential, this would
provide a starting point for activities beyond mere export of commodities. This calls for
both public and private investment. This is not to say, however, that concerted efforts and
adequate resources should not also be directed towards improving productivity, wages and
conditions of work in other segments of the economy. Indeed, the long-standing neglect of
agriculture should also be reversed. Intensification of agriculture needs to be complemented
by an increase in productive non-farm wage employment and successful entrepreneurship
development. Tradeable services such as business services, finance, tourism etc. can also
play an important role in creating productive employment when they complement or
support diversification into higher value added segments in manufacturing.
To accompany the process of structural transformation, labour market policies and
institutions will need to be developed and strengthened to better support and protect
workers. Ghana’s economic diversification will also require policies to attract domestic and
foreign investment that is conducive to generating decent employment, while any
rethinking of Ghana’s fiscal and monetary policies should place employment as a central
consideration. Effective social dialogue and coherence across a broad economic and social
policy agenda will be critical to ensuring the success of such measures. Indeed, Ghana’s
recently adopted National Employment Policy, developed through tripartite dialogue, is a
strong statement of intent to achieve this coherence by establishing mechanisms for multi-
stakeholder coordination and cooperation in the pursuit of a comprehensive, integrated
employment policy framework.

28
Bibliography
AfDB. 2014a. African Economic Outlook 2014. Global value chains and Africa’s
industrialization, African Development Bank, OECD, UNDP and UNECA (Tunis-
Belvedère).
---. 2014b. African Economic Outlook 2014. Global value chains and Africa’s
Industrialization, Country Note Ghana, African Development Bank, OECD, UNDP and
UNECA (Tunis-Belvedère).
Allsop, T., Attah, R.; Cammack, T. and Woods, E. 2010. Mid-term evaluation of the EFA Fast
Track Initiative. Country Case Study: Ghana, Cambridge Education, Mokoro and
Oxford Policy Management (Oxford).
Brookings Institute. 2007. Review of trends in public spending for education and health in
Ghana (2002-2006), Transparency and Accountability Project (Washington, DC).
CEPA. 2013. Ghana Economic Review and Outlook, Center for Policy Analysis (Accra).
Colclough, C.; Kingdon, G. and Patrinos, H. 2010. ‘The changing pattern of wage returns to
education and its implications’, Development Policy Review, Vol. 28, No. 6, pp. 733-
747.
Darvas, P.; Palmer, R. 2014. Demand and supply of skills in Ghana, A World Bank Study
(Washington, DC).
GSS 2006. Ghana Living Standards Survey 5 (microdata), Ghana Statistical service (Accra).
---. 2013. Ghana Living Standards Survey 6 (microdata), Ghana Statistical service (Accra).
---. 2014a. Gross Domestic Product 2014, Ghana Statistical Service (Accra).
---. 2014b. Gross Domestic Product expenditure approach, Ghana Statistical Service (Accra).
Hanushek, E. and Wößmann, L. 2007. Cognitive skills and economic development,
presentation to the Commission on Growth and Development. World Bank Policy
Research Working Paper, No. 4122 ( Washington, D.C.).
Higgins, K. 2009. “Regional inequality and secondary education in Ghana: Policy Brief No 1.”
prepared for the World Development Report 2009, Overseas Development Institute
(London).
IBE. 2010. World Data on Education VII Ed. Ghana, UNESCO (Paris).
ILO. 2012. ISCO-08. Volume 1. International Standard Classification of Occupations.
Structure, group definitions and correspondence tables, International Labour Office
(Geneva).
---. 2013. Global Employment Trends for Youth 2013. A generation at risk, International
Labour Office (Geneva).
---. 2014. Skills mismatch in Europe. Statistics brief, International Labour Office (Geneva).

29
ISCED. 1997. ISCED Mappings. Ghana, UNESCO Institute for Statistics (Montreal).
http://www.uis.unesco.org/Education/ISCEDMappings/Pages/default.aspx
KPMG. 2014. Ghanaian snapshot, 2014Q1 (Accra).
https://www.kpmg.com/Africa/en/KPMG-in-
Africa/Documents/2014%20Q1%20snapshots/KPMG_Ghana%202014Q1.pdf
Krugman, P. 1987. ‘The narrow moving band, the Dutch disease and the competitive
consequences of Mrs. Thatcher. Notes on Trade in the Presence of Dynamic Scale
Economies’, Journal of Development Economics, Vol. 27, pp. 41-55.
ODI. 2006. The National Functional Literacy Program Ghana, Overseas Development
Institute (London).
Psacharopoulos, G. and Patrinos, H.A. 2004a. ‘Human capital and rates of return’, Chapter 1 in
Johnes, G.; Johnes, J. (eds.), International Handbook on the Economics of Education,
Edward Elgar (Cheltenham).
---. 2004b. ‘Returns to investment in education: A further update’, Education Economics, Vol.
12, No. 2, pp. 111-134.
Quintini, G. 2011. ‘Over-qualified or under-skilled: A review of existing literature’, OECD
Social, Employment and Migration Working Papers, No. 121 (Paris).
Sedgwick, R. 2000. Education in Ghana. Practical information, World Education News and
Reviews (New York).
Sparreboom, T. 2011. ‘Vulnerable employment’, chapter 4 in Sparreboom, T.; Albee, A.
Towards Decent Work in sub-Saharan Africa. Monitoring MDG Employment
Indicators, International Labour Office (Geneva).
Sparreboom, T. and Nübler, I. 2013. ‘Productive transformation, employment and education in
Tanzania’, paper presented at the 2013 UNU-WIDER Development Conference on
Learning to Compete: Industrial Development and Policy in Africa, 24-25 June
(Helsinki).
Sparreboom, T. and Staneva, A. 2014. ‘Is education the solution to decent work for youth in
developing economies? Identifying qualifications mismatch from 28 school-to-work
transition surveys’, Work4Youth Publication Series, No. 22, International Labour Office
(Geneva).
Thompson N.M. and Casely-Hayford L. 2008. ‘The financing and outcomes of education in
Ghana’, Research Consortium on Educational Outcomes and Poverty, Working Paper,
No. 16, University of Cambridge (Cambridge).
UN. 2013. National Accounts Main Aggregates Database, United Nations (New York).
https://unstats.un.org/unsd/snaama/Introduction.asp
UNDP. 2013. Human Development Report. The rise of the South: Human progress in a diverse
world. Explanatory note on 2013 HDR composite indices. Ghana (New York).
UNESCO. 2012a. Ghana EFA country profile (Dakar).
---. 2012b. Education for All Global Monitoring Report. Fact sheet. Education in Ghana
(Paris).
30
---. 2012c. Youth and skills: Putting education to work. EFA Global Monitoring Report,
United Nations Educational Scientific and Cultural Organization (Paris).
---. 2014. Institute for Statistics Database (Montreal). http://stats.uis.unesco.org
Walker, I. and Zhu, Y. 2001. ‘The returns to education: Evidence from the labour force
surveys’, Research Report RR313, University of Warwick (Coventry).
World Bank IEG. 2007. Impact Evaluation – The Experience of the Independent Evaluation
Group of the World Bank. Chapter 4: Case Study 1: Improving the quality and quantity
of basic education in Ghana, World Bank Independent Evaluation Group (Washington,
D.C.).
World Bank. 2009. Economy-wide impact of oil discovery in Ghana (Washington, D.C.).
---. 2010. Ghana - Second Phase of the National Functional Literacy Project (Washington,
D.C.).
---. 2012. Jobs. World Development Report 2013 (Washington, D.C.).
---. 2014. World Development Indicators (Washington, D.C.).
http://databank.worldbank.org/
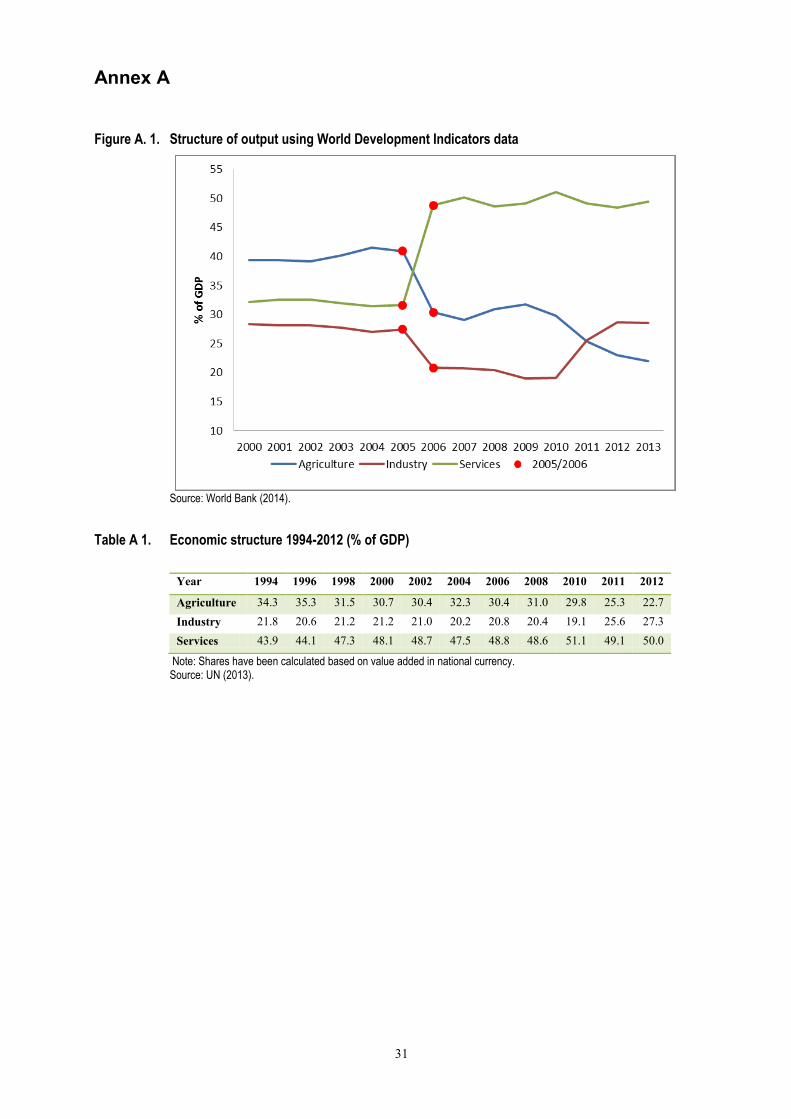
31
Annex A
Figure A. 1. Structure of output using World Development Indicators data
Source: World Bank (2014).
Table A 1. Economic structure 1994-2012 (% of GDP)
Year 1994 1996 1998 2000 2002 2004 2006 2008 2010 2011 2012
Agriculture 34.3 35.3 31.5 30.7 30.4 32.3 30.4 31.0 29.8 25.3 22.7
Industry 21.8 20.6 21.2 21.2 21.0 20.2 20.8 20.4 19.1 25.6 27.3
Services 43.9 44.1 47.3 48.1 48.7 47.5 48.8 48.6 51.1 49.1 50.0
Note: Shares have been calculated based on value added in national currency. Source: UN (2013).

32
Table A 2. Education intensity and employment by sector
Share of labour force (%) Education intensity (%) Between effect
Within effect
Contribution Contribution (%)
2006 2012 Change 2006 2012 Change
Agriculture 49.9 42.1 -7.8 33.6 40.4 6.8 -2.63 2.86 0.23 2.7
Fishing 1.2 0.9 -0.3 27.4 32.1 4.7 -0.08 0.04 -0.03 -0.4
Mining and quarrying 0.7 1.6 0.9 70.5 70.5 0.0 0.61 0.00 0.61 7.2
Manufacturing 10.6 8.8 -1.9 58.0 64.7 6.7 -1.08 0.59 -0.49 -5.8
Electricity, gas and water 0.1 0.3 0.1 93.4 94.0 0.6 0.11 0.00 0.12 1.4
Construction 1.8 3.2 1.4 79.8 81.8 2.0 1.08 0.06 1.14 13.4
Wholesale and retail trade 14.9 19.4 4.5 59.9 63.5 3.7 2.70 0.71 3.40 39.9
Hotels and restaurants 1.9 3.7 1.9 49.8 59.3 9.5 0.94 0.36 1.29 15.2
Transport, storage and communication
2.8 3.7 0.9 83.8 82.4 -1.4 0.77 -0.05 0.72 8.5
Financial intermediation 0.3 0.7 0.4 97.3 98.4 1.1 0.38 0.01 0.39 4.6
Real estate and business activities
0.8 2.2 1.4 88.3 86.6 -1.7 1.23 -0.04 1.19 14.0
Public administration 1.4 0.8 -0.6 93.6 97.0 3.4 -0.57 0.03 -0.54 -6.4
Education 2.9 3.4 0.5 96.1 97.7 1.5 0.47 0.05 0.53 6.2
Health and social work 0.8 1.1 0.3 90.9 91.3 0.4 0.27 0.00 0.27 3.2
Community and social services 2.7 3.8 1.1 78.4 77.5 -0.9 0.85 -0.04 0.81 9.5
Private households 0.3 0.8 0.5 53.2 60.2 7.0 0.27 0.06 0.33 3.8
Extra-territorial bodies 0.0 0.0 0.0 100.0 100.0 0.0 -0.03 0.00 -0.03 -0.4
Unemployed 6.5 3.6 -2.9 56.7 67.1 10.4 -1.63 0.38 -1.25 -14.7
Undefined 0.3 0.0 -0.3 52.4 100.0 47.6 -0.15 0.00 -0.15 -1.8
Aggregate 100.0 100.0 49.5 58.0 8.5 3.50 5.03 8.53 100.00
Sources: Authors' estimates based on GSS (2006) and GSS (2013).

33
Table A 3. Education intensity and non-vulnerable employment by sector
Employment share (%) Education intensity (%) Between effect
Within effect
Contribution Contribution (%)
2006 2012 Change 2006 2012 Change
Agriculture 14.2 8.2 -6.0 49.0 51.6 2.6 -2.92 0.21 -2.71 537.6
Fishing 1.0 0.9 -0.1 37.8 29.7 -8.0 -0.02 -0.07 -0.09 18.8
Mining and quarrying 2.4 4.7 2.3 70.3 74.1 3.8 1.59 0.18 1.77 -351.2
Manufacturing 15.8 12.4 -3.4 77.2 72.6 -4.6 -2.62 -0.57 -3.20 634.9
Electricity, gas and water 0.5 0.7 0.2 91.9 98.4 6.5 0.21 0.05 0.26 -51.5
Construction 5.7 7.8 2.0 82.8 81.6 -1.2 1.69 -0.09 1.60 -317.1
Wholesale and retail trade 13.0 16.3 3.3 81.4 73.2 -8.1 2.71 -1.33 1.38 -274.4
Hotels and restaurants 2.5 4.3 1.8 66.8 61.1 -5.7 1.19 -0.25 0.94 -187.2
Transport, storage and communication
10.7 10.2 -0.6 84.1 82.1 -2.0 -0.47 -0.20 -0.67 133.2
Financial intermediation 1.3 2.2 1.0 100.0 99.0 -1.0 0.95 -0.02 0.93 -184.4
Real estate and business activities
2.8 6.2 3.4 87.7 86.2 -1.6 2.99 -0.10 2.89 -574.8
Public administration 6.0 2.5 -3.4 93.6 97.0 3.4 -3.22 0.09 -3.14 623.2
Education 12.4 10.9 -1.5 96.1 97.8 1.7 -1.44 0.18 -1.26 249.9
Health and social work 3.1 3.4 0.2 96.8 95.7 -1.1 0.22 -0.04 0.18 -35.8
Community and social services
6.7 8.1 1.3 83.2 80.5 -2.7 1.11 -0.21 0.90 -177.8
Private households 1.3 1.3 0.0 59.8 79.6 19.8 0.01 0.25 0.26 -51.2
Extra-territorial bodies 0.2 0.0 -0.1 100.0 100.0 0.0 -0.14 0.00 -0.14 28.1
Undefined 0.5 0.0 -0.5 78.8 100.0 21.2 -0.40 0.00 -0.40 79.7
Aggregate 100.0 100.0 78.8 78.3 -0.5 1.42 -1.92 -0.50 100.00
Sources: Authors' estimates based on GSS (2006) and GSS (2013).
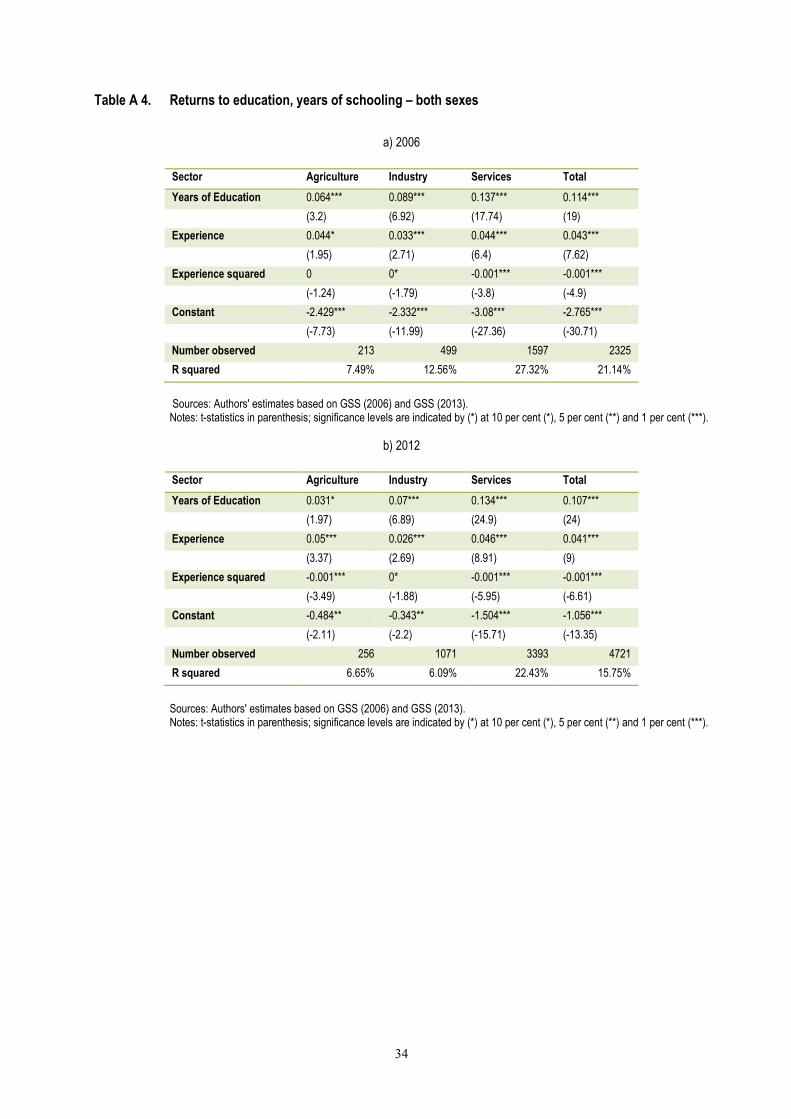
34
Table A 4. Returns to education, years of schooling – both sexes
a) 2006
Sector Agriculture Industry Services Total
Years of Education 0.064*** 0.089*** 0.137*** 0.114***
(3.2) (6.92) (17.74) (19)
Experience 0.044* 0.033*** 0.044*** 0.043***
(1.95) (2.71) (6.4) (7.62)
Experience squared 0 0* -0.001*** -0.001***
(-1.24) (-1.79) (-3.8) (-4.9)
Constant -2.429*** -2.332*** -3.08*** -2.765***
(-7.73) (-11.99) (-27.36) (-30.71)
Number observed 213 499 1597 2325
R squared 7.49% 12.56% 27.32% 21.14%
Sources: Authors' estimates based on GSS (2006) and GSS (2013). Notes: t-statistics in parenthesis; significance levels are indicated by (*) at 10 per cent (*), 5 per cent (**) and 1 per cent (***).
b) 2012
Sector Agriculture Industry Services Total
Years of Education 0.031* 0.07*** 0.134*** 0.107***
(1.97) (6.89) (24.9) (24)
Experience 0.05*** 0.026*** 0.046*** 0.041***
(3.37) (2.69) (8.91) (9)
Experience squared -0.001*** 0* -0.001*** -0.001***
(-3.49) (-1.88) (-5.95) (-6.61)
Constant -0.484** -0.343** -1.504*** -1.056***
(-2.11) (-2.2) (-15.71) (-13.35)
Number observed 256 1071 3393 4721
R squared 6.65% 6.09% 22.43% 15.75%
Sources: Authors' estimates based on GSS (2006) and GSS (2013). Notes: t-statistics in parenthesis; significance levels are indicated by (*) at 10 per cent (*), 5 per cent (**) and 1 per cent (***).

35
Table A 5. Returns to education, years of schooling - male
a) 2006
Sector Agriculture Industry Services Total
Years of Education 0.073*** 0.082*** 0.13*** 0.109***
(3.23) (5.38) (13.32) (14.64)
Experience 0.051** 0.027** 0.037*** 0.037***
(2.07) (2.2) (3.93) (5.07)
Experience squared -0.001 0 0** 0***
(-1.55) (-1.25) (-2.33) (-3.22)
Constant -2.512*** -2.151*** -2.884*** -2.605***
(-7.11) (-10.12) (-20.89) (-23.98)
Number observed 166 406 1131 1716
R squared 9.58% 10.42% 23.75% 18.63%
Sources: Authors' estimates based on GSS (2006) and GSS (2013). Notes: t-statistics in parenthesis; significance levels are indicated by (*) at 10 per cent (*), 5 per cent (**) and 1 per cent (***).
b) 2012
Sector Agriculture Industry Services Total
Years of Education 0.018 0.059*** 0.121*** 0.092***
(1.05) (5.29) (17.03) (16.41)
Experience 0.066*** 0.023** 0.037*** 0.033***
(4.01) (2.34) (5.63) (5.95)
Experience squared -0.001*** 0 -0.001*** 0***
(-4.28) (-1.46) (-4.44) (-4.97)
Constant -0.524** -0.104 -1.14*** -0.68***
(-2.05) (-0.62) (-8.8) (-6.93)
Number observed 215 861 2207 3284
R squared 7.73% 4.87% 17.88% 11.71%
Sources: Authors' estimates based on GSS (2006) and GSS (2013). Notes: t-statistics in parenthesis; significance levels are indicated by (*) at 10 per cent (*), 5 per cent (**) and 1 per cent (***).

36
Table A 6. Returns to education, years of schooling - female
a) 2006
Sector Agriculture Industry Services Total
Years of Education 0.027 0.087*** 0.156*** 0.125***
(0.5) (3.1) (12) (12.12)
Experience -0.005 0.042** 0.051*** 0.051***
(-0.06) (2.03) (5.24) (5.99)
Experience squared 0.001 -0.001*** -0.001*** -0.001***
(0.35) (-2.73) (-2.91) (-3.93)
Constant -1.901* -2.559*** -3.448*** -3.078***
(-1.99) (-6.22) (-17.57) (-18.89)
Number observed 47 93 466 609
R squared 4.59% 13.80% 36.11% 26.94%
Sources: Authors' estimates based on GSS (2006) and GSS (2013). Notes: t-statistics in parenthesis; significance levels are indicated by (*) at 10 per cent (*), 5 per cent (**) and 1 per cent (***).
b) 2012
Sector Agriculture Industry Services Total
Years of Education 0.085*** 0.035 0.151*** 0.132***
(3.22) (1.34) (17.44) (17.48)
Experience 0.043 0.014 0.051*** 0.049***
(1.63) (0.62) (5.37) (6.12)
Experience squared -0.001 0 0** -0.001***
(-1.57) (-0.96) (-2.42) (-3.49)
Constant -0.894** -0.399 -1.959*** -1.685***
(-2.58) (-0.98) (-13.41) (-12.6)
Number observed 41 210 1186 1437
R squared 13.88% 2.80% 30.97% 25.29%
Sources: Authors' estimates based on GSS (2006) and GSS (2013). Notes: t-statistics in parenthesis; significance levels are indicated by (*) at 10 per cent (*), 5 per cent (**) and 1 per cent (***).
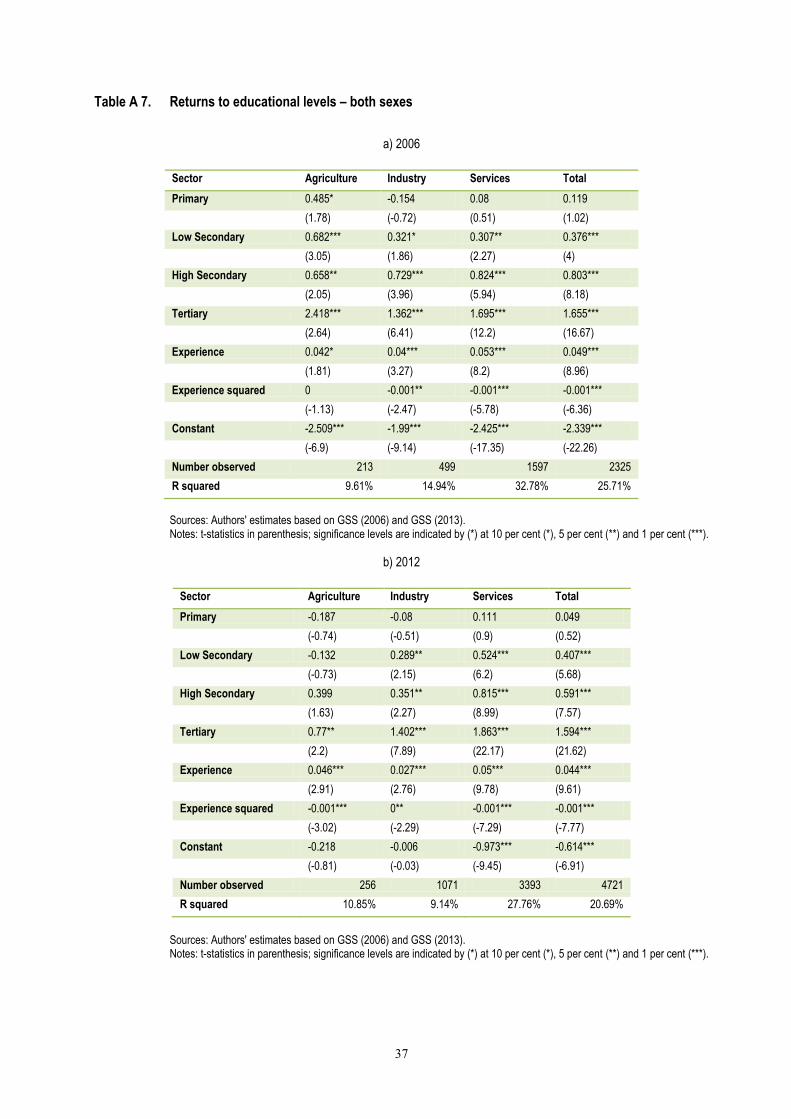
37
Table A 7. Returns to educational levels – both sexes
a) 2006
Sector Agriculture Industry Services Total
Primary 0.485* -0.154 0.08 0.119
(1.78) (-0.72) (0.51) (1.02)
Low Secondary 0.682*** 0.321* 0.307** 0.376***
(3.05) (1.86) (2.27) (4)
High Secondary 0.658** 0.729*** 0.824*** 0.803***
(2.05) (3.96) (5.94) (8.18)
Tertiary 2.418*** 1.362*** 1.695*** 1.655***
(2.64) (6.41) (12.2) (16.67)
Experience 0.042* 0.04*** 0.053*** 0.049***
(1.81) (3.27) (8.2) (8.96)
Experience squared 0 -0.001** -0.001*** -0.001***
(-1.13) (-2.47) (-5.78) (-6.36)
Constant -2.509*** -1.99*** -2.425*** -2.339***
(-6.9) (-9.14) (-17.35) (-22.26)
Number observed 213 499 1597 2325
R squared 9.61% 14.94% 32.78% 25.71%
Sources: Authors' estimates based on GSS (2006) and GSS (2013). Notes: t-statistics in parenthesis; significance levels are indicated by (*) at 10 per cent (*), 5 per cent (**) and 1 per cent (***).
b) 2012
Sector Agriculture Industry Services Total
Primary -0.187 -0.08 0.111 0.049
(-0.74) (-0.51) (0.9) (0.52)
Low Secondary -0.132 0.289** 0.524*** 0.407***
(-0.73) (2.15) (6.2) (5.68)
High Secondary 0.399 0.351** 0.815*** 0.591***
(1.63) (2.27) (8.99) (7.57)
Tertiary 0.77** 1.402*** 1.863*** 1.594***
(2.2) (7.89) (22.17) (21.62)
Experience 0.046*** 0.027*** 0.05*** 0.044***
(2.91) (2.76) (9.78) (9.61)
Experience squared -0.001*** 0** -0.001*** -0.001***
(-3.02) (-2.29) (-7.29) (-7.77)
Constant -0.218 -0.006 -0.973*** -0.614***
(-0.81) (-0.03) (-9.45) (-6.91)
Number observed 256 1071 3393 4721
R squared 10.85% 9.14% 27.76% 20.69%
Sources: Authors' estimates based on GSS (2006) and GSS (2013). Notes: t-statistics in parenthesis; significance levels are indicated by (*) at 10 per cent (*), 5 per cent (**) and 1 per cent (***).
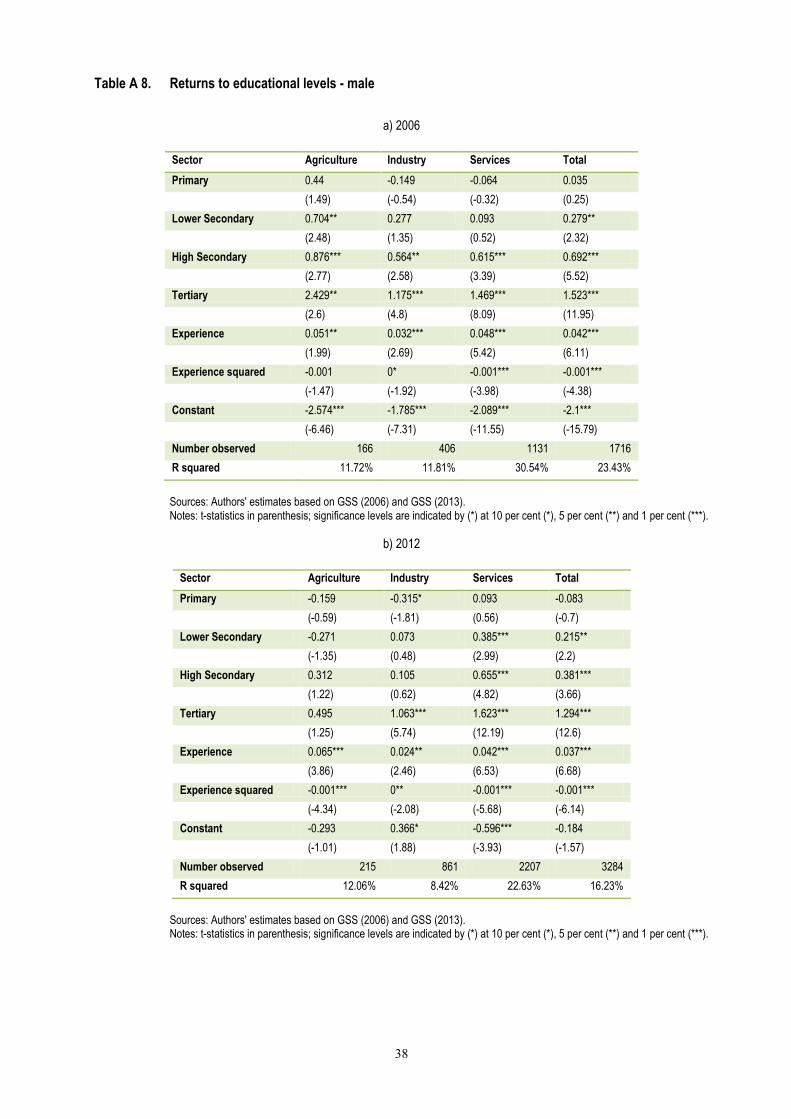
38
Table A 8. Returns to educational levels - male
a) 2006
Sector Agriculture Industry Services Total
Primary 0.44 -0.149 -0.064 0.035
(1.49) (-0.54) (-0.32) (0.25)
Lower Secondary 0.704** 0.277 0.093 0.279**
(2.48) (1.35) (0.52) (2.32)
High Secondary 0.876*** 0.564** 0.615*** 0.692***
(2.77) (2.58) (3.39) (5.52)
Tertiary 2.429** 1.175*** 1.469*** 1.523***
(2.6) (4.8) (8.09) (11.95)
Experience 0.051** 0.032*** 0.048*** 0.042***
(1.99) (2.69) (5.42) (6.11)
Experience squared -0.001 0* -0.001*** -0.001***
(-1.47) (-1.92) (-3.98) (-4.38)
Constant -2.574*** -1.785*** -2.089*** -2.1***
(-6.46) (-7.31) (-11.55) (-15.79)
Number observed 166 406 1131 1716
R squared 11.72% 11.81% 30.54% 23.43%
Sources: Authors' estimates based on GSS (2006) and GSS (2013). Notes: t-statistics in parenthesis; significance levels are indicated by (*) at 10 per cent (*), 5 per cent (**) and 1 per cent (***).
b) 2012
Sector Agriculture Industry Services Total
Primary -0.159 -0.315* 0.093 -0.083
(-0.59) (-1.81) (0.56) (-0.7)
Lower Secondary -0.271 0.073 0.385*** 0.215**
(-1.35) (0.48) (2.99) (2.2)
High Secondary 0.312 0.105 0.655*** 0.381***
(1.22) (0.62) (4.82) (3.66)
Tertiary 0.495 1.063*** 1.623*** 1.294***
(1.25) (5.74) (12.19) (12.6)
Experience 0.065*** 0.024** 0.042*** 0.037***
(3.86) (2.46) (6.53) (6.68)
Experience squared -0.001*** 0** -0.001*** -0.001***
(-4.34) (-2.08) (-5.68) (-6.14)
Constant -0.293 0.366* -0.596*** -0.184
(-1.01) (1.88) (-3.93) (-1.57)
Number observed 215 861 2207 3284
R squared 12.06% 8.42% 22.63% 16.23%
Sources: Authors' estimates based on GSS (2006) and GSS (2013). Notes: t-statistics in parenthesis; significance levels are indicated by (*) at 10 per cent (*), 5 per cent (**) and 1 per cent (***).
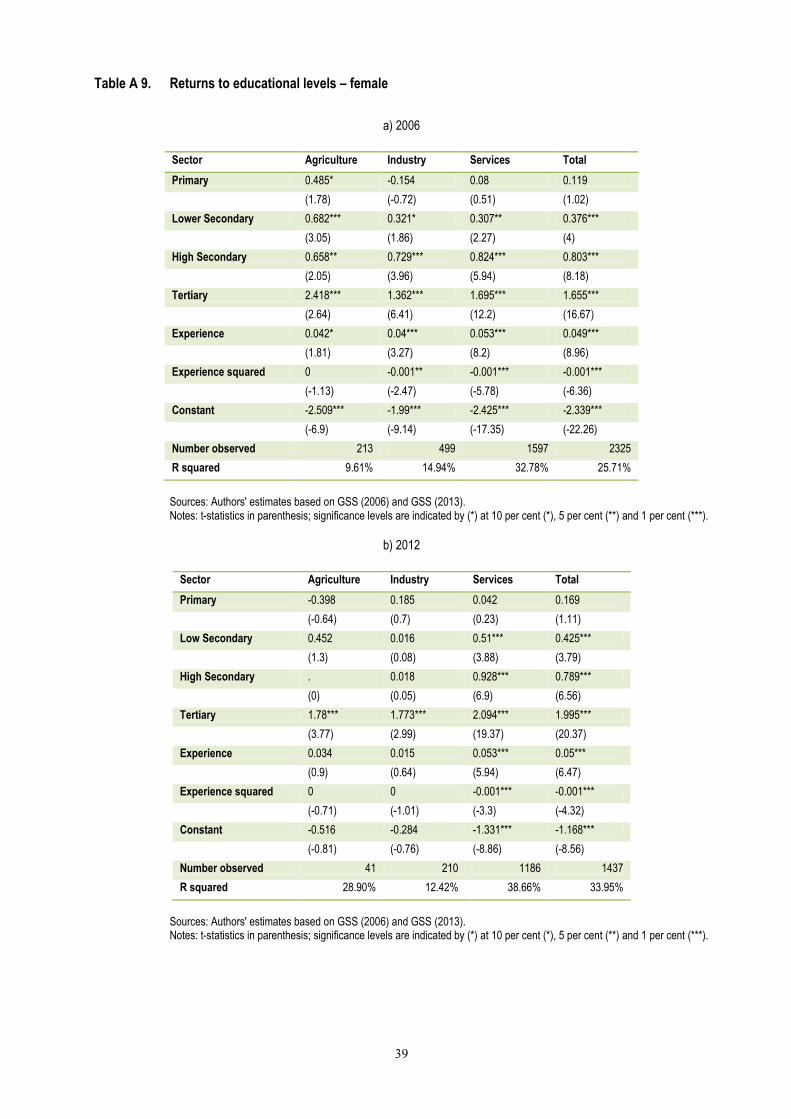
39
Table A 9. Returns to educational levels – female
a) 2006
Sector Agriculture Industry Services Total
Primary 0.485* -0.154 0.08 0.119
(1.78) (-0.72) (0.51) (1.02)
Lower Secondary 0.682*** 0.321* 0.307** 0.376***
(3.05) (1.86) (2.27) (4)
High Secondary 0.658** 0.729*** 0.824*** 0.803***
(2.05) (3.96) (5.94) (8.18)
Tertiary 2.418*** 1.362*** 1.695*** 1.655***
(2.64) (6.41) (12.2) (16.67)
Experience 0.042* 0.04*** 0.053*** 0.049***
(1.81) (3.27) (8.2) (8.96)
Experience squared 0 -0.001** -0.001*** -0.001***
(-1.13) (-2.47) (-5.78) (-6.36)
Constant -2.509*** -1.99*** -2.425*** -2.339***
(-6.9) (-9.14) (-17.35) (-22.26)
Number observed 213 499 1597 2325
R squared 9.61% 14.94% 32.78% 25.71%
Sources: Authors' estimates based on GSS (2006) and GSS (2013). Notes: t-statistics in parenthesis; significance levels are indicated by (*) at 10 per cent (*), 5 per cent (**) and 1 per cent (***).
b) 2012
Sector Agriculture Industry Services Total
Primary -0.398 0.185 0.042 0.169
(-0.64) (0.7) (0.23) (1.11)
Low Secondary 0.452 0.016 0.51*** 0.425***
(1.3) (0.08) (3.88) (3.79)
High Secondary . 0.018 0.928*** 0.789***
(0) (0.05) (6.9) (6.56)
Tertiary 1.78*** 1.773*** 2.094*** 1.995***
(3.77) (2.99) (19.37) (20.37)
Experience 0.034 0.015 0.053*** 0.05***
(0.9) (0.64) (5.94) (6.47)
Experience squared 0 0 -0.001*** -0.001***
(-0.71) (-1.01) (-3.3) (-4.32)
Constant -0.516 -0.284 -1.331*** -1.168***
(-0.81) (-0.76) (-8.86) (-8.56)
Number observed 41 210 1186 1437
R squared 28.90% 12.42% 38.66% 33.95%
Sources: Authors' estimates based on GSS (2006) and GSS (2013). Notes: t-statistics in parenthesis; significance levels are indicated by (*) at 10 per cent (*), 5 per cent (**) and 1 per cent (***).

40
Figure A. 2. Qualifications mismatch, percentage of employment by major occupational group and sex, 2006
(a) Male
(a) Female
Sources: Authors' estimates based on GSS (2006).

41
Figure A. 3. Qualifications mismatch, percentage of employment by major occupational group and sex, 2012
(a) Male
(b) Female
Sources: Authors' estimates based on GSS (2013).
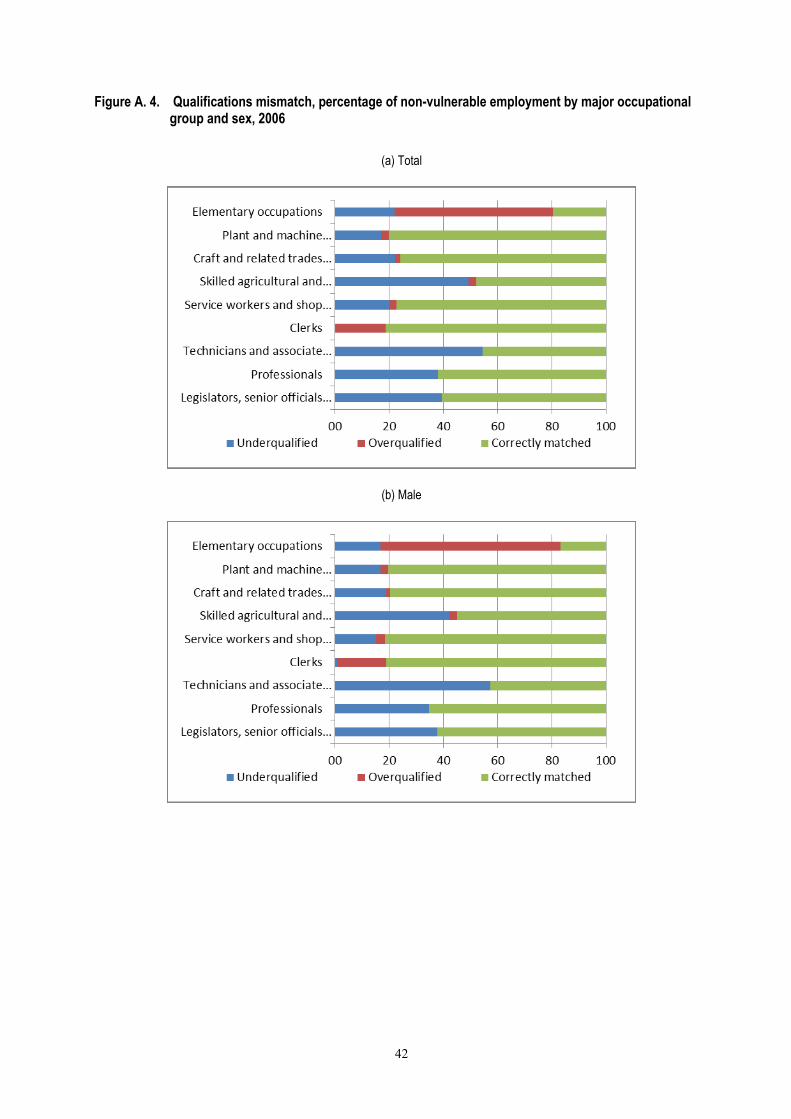
42
Figure A. 4. Qualifications mismatch, percentage of non-vulnerable employment by major occupational group and sex, 2006
(a) Total
(b) Male
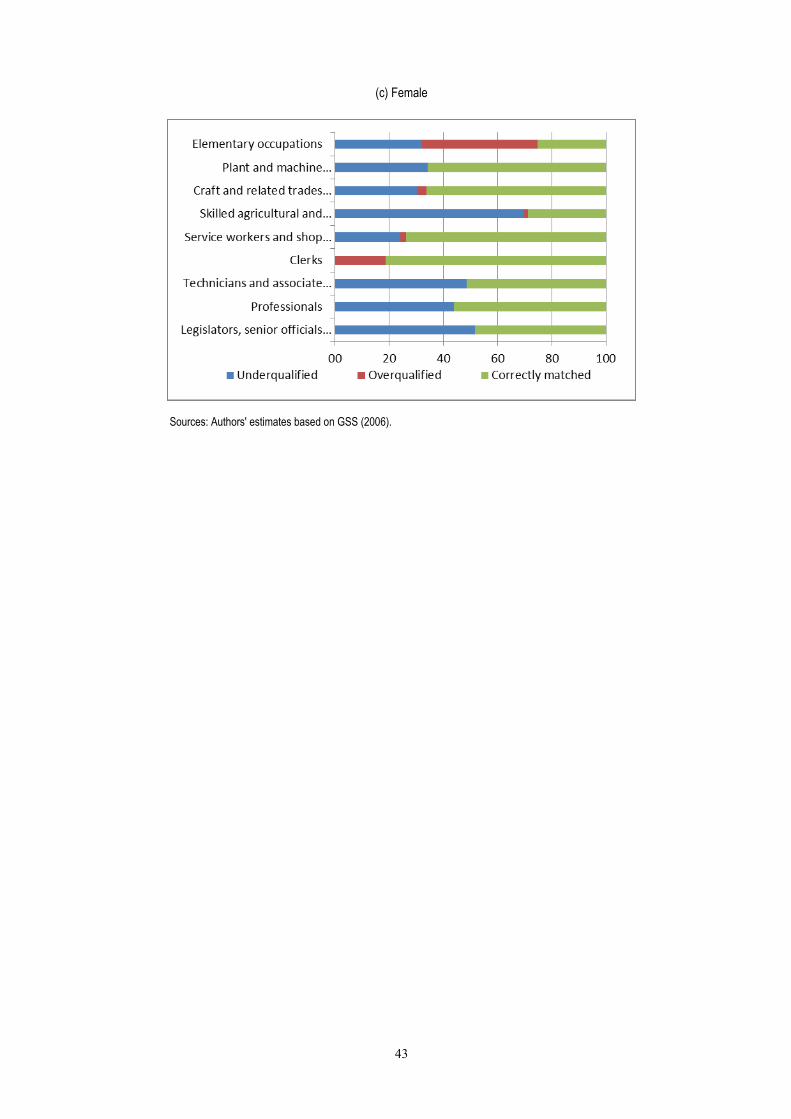
43
(c) Female
Sources: Authors' estimates based on GSS (2006).

44
Figure A. 5. Qualifications mismatch, percentage of non-vulnerable employment by major occupational group and sex, 2012
(a) Total
(b) Male
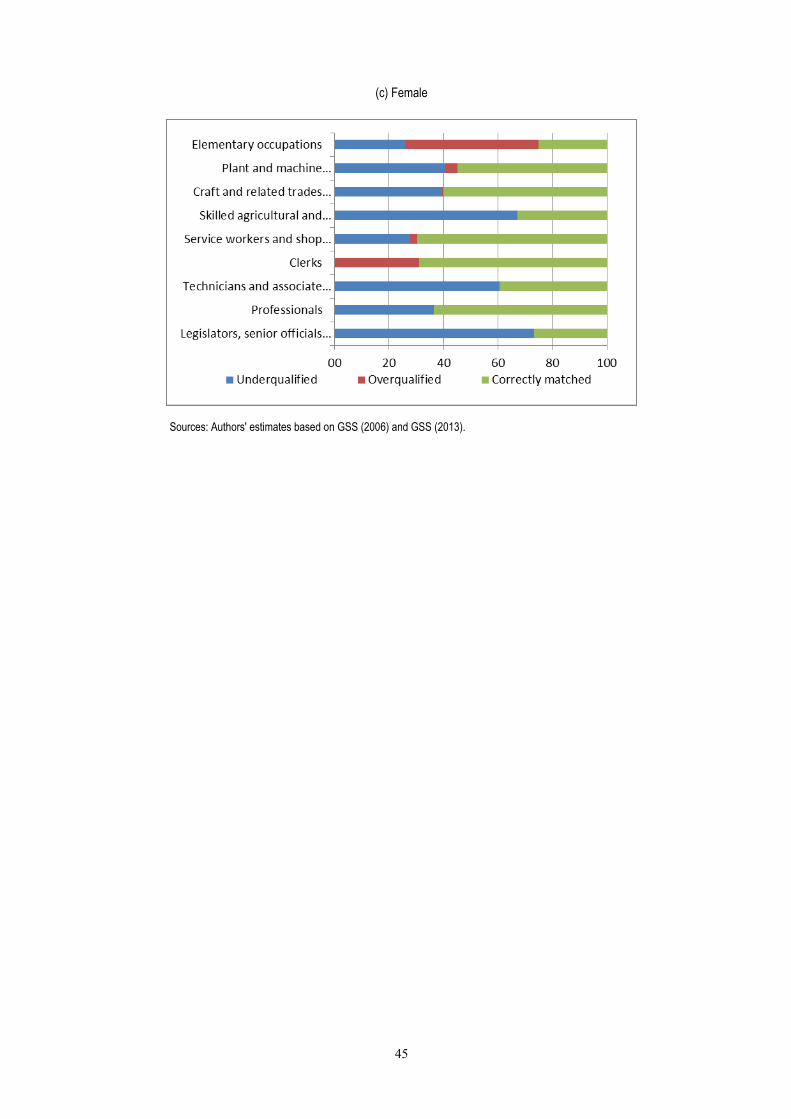
45
(c) Female
Sources: Authors' estimates based on GSS (2006) and GSS (2013).

46
Annex B
B1. Breakdown of the change in the employment-to-population ratio
Figure 5 shows estimates of the contribution of each sector to change in aggregate
employment-to-population ratio (EPR). For this purpose, the change in the EPR is broken
down as follows:
)( 00 i
i
itt EPREPREPREPR
Where:
ttt LEEPR / is the EPR at time t;
tE is total employment;
tL is the working age population;
titit LEEPR / is the ratio of employment in sector i to the working age population.
The term 0iit EPREPR therefore captures the contribution of change in employment
in sector i to total change in the EPR in percentage points.
B2. Breakdown of productivity growth
Labour productivity growth can be broken down into the following components: a) a
within sector term, which captures the growth of productivity within given sectors; and b) a
between term, which captures the contribution of changes in the pattern of employment
across sectors to productivity growth. Labour productivity (A) at time t is given as:
t
ti
iti
ti
it
ti
t
tt
E
E
E
Y
E
Y
E
YA
,
,
,,
Where tY is total gross value added,
tE is total employment, tiY ,is output of sector i and
tiE ,is employment in sector i. The growth rate of aggregate productivity can therefore be
broken down using the following relationship:
(1)
ii
ii
i ii
ii
tti
titi
t
EE
EY
EE
EY
EE
EY
A
AA
)(
)()(
00,
0,0,
00,
0,0,
,
,,
0
0
(2)
ii
ii
ii
ii
t
ti
ii
ii
it
ti
i
i
ti
ti
EE
EY
E
Y
E
E
E
E
EE
EY
E
E
E
Y
E
Y
)(
)(
)(
)(
00,
0,0,
0,
0,
0
0,,
00,
0,0,
,
0,
0,
,
,
Where the first term in (2) captures the within sector effect and the second term
captures the between effect. The within sector effect is due to the difference between
sectoral value-added growth and employment growth (or sectoral productivity growth),

47
weighted by the employment share of the sector (which is held constant). A positive within-
sector effect results when sectoral value added grows faster than sectoral employment. The
between-sector effect is due to changes in sectoral employment shares, weighted by sectoral
productivity (which is held constant). A positive between-sector effect results when sectoral
employment shares increase.
B3. Regression model for returns to education
Rates of return to schooling in Ghana have been calculated based on Mincerian
earnings functions, which are limited to wage employment, and following Psacharopoulos
and Patrinos (2004a) and Walker and Zhu (2001). The log of hourly wages (lnW) is
regressed on years of schooling (S), years of experience in the labour market (EX) as well
as its square (EX 2), using ordinary least squares.
The basic Mincerian earnings function takes the form:
lnWi = α + βSi + γ1EXi + γ2EX 2
i+ εi
In this equation, β can be interpreted as the average private rate of return to one
additional year of schooling, regardless of the educational level this year of schooling refers
to. This method assumes that foregone earnings represent the only cost of education, and so
measure only the private rate of return. It further assumes that individuals have an infinite
time horizon. As the function does not distinguish between levels of schooling, a series of
dummy variables are substituted for S which correspond to discrete educational levels
(primary, secondary and tertiary) to obtain the following equation:
lnWi = α + βpDp + βsDs + βtDt + γ1EXi + γ2EX2
i + εi


Employment Working Papers The Working Papers from 2008 to 2015 are available in
www.ilo.org/employment/Whatwedo/Publications/working-papers
Please scan the code

Employment Policy Department
For more information visit our site: http://www.ilo.org/employment
International Labour Office Employment Policy Department 4, route des Morillons CH-1211 Geneva 22 Email: [email protected]
ISSN 1999-2939
For more information, visit our website http://www.ilo.org/employment
International Labour Office Employment Policy DepartmentRoute des Morillons 4 CH-1211 Geneva 22
Email: [email protected]
Employment Policy Department
EMPL
OYM
ENT