“structural behaviour of steel fabric reinforced concrete ... ijcee-ijens.pdf · “structural...
TRANSCRIPT

International Journal of Civil & Environmental Engineering IJCEE-IJENS Vol:10 No:04 47
101704-9292-IJCEE-IJENS © August 2010 IJENS I J E N S
“Structural Behaviour of Steel Fabric Reinforced
Concrete Wall Panel Under Eccentric Loading”
Ir Ruzitah Supinyeh1, Ir Dr Siti Hawa Hamzah
2
1M.Sc Civil Engr Student, Faculty of Civil Engineering, Universiti Teknologi MARA, 40450, Shah Alam, Malaysia.
([email protected]) 2 Professor, Faculty of Civil Engineering, Universiti Teknologi MARA, 40450 Shah Alam, Malaysia ([email protected])
Abstract-- Recently reinforced concrete walls have gained
greater acceptance from many countries in conjunction with the
Industrialized Building System (IBS). Essentially, the system gives an advantage in reducing the dependency of foreign labour
and a better investment in technologies, techniques and processes
of construction.
Steel fabric reinforced concrete wall panel has been used in
Malaysia in the past few years and can still be considered as a new construction method. This type of wall may require
sequential analysis in making an effective product that gives
advantages in all aspects and gives better performance. This
research involved laboratory experimental work and model by
using a finite element computer program as comparison of the results.
Laboratory works tested eight wall samples with size of 1.0m x
1.5m and 0.75m thick. (Length:Height:Width). The wall samples
reinforced with double layer steel fabric size B7 and concrete
Grade 30. The wall panel tested under axial load with the eccentric t/6 or 12.5mm of wall thickness. Variations of support
condition include of t/6 with pinned or fixed imposed at the top
and bottom of the wall panel.
Experimental result shows due to eccentric loading that all of the
wall panels failed in compression shear which the wall panels shown a single curvature pattern where it bends towards the rear
side. There are no cracks seen on both front and rear surfaces of
the wall panel unless it crushed at top and base of the wall. It is
observed that the ultimate eccentric loads (Pult) of 991.45 kN and
maximum deflection 9.67mm obtained from the experimental works.
The computer analysis shows that the wall panel failed by
compression. Higher stress concentration appears at the upper
and bottom corner of the wall panel. The deflection obtained
over by 18.3% compared with the experimental results. Comparison with the experimental and the computer analysis
results were found in good agreement.
Index Term-- concrete wall panel, steel fabric, eccentric
1.0 INTRODUCTION
A changed in structural design from moment-resisting to
flexible frames with stiff shear resisting elements has occurred
in recent years. In Malaysia the changed starts in late 1990's
when the Government Plan For Zero squatters in Kuala
Lumpur. As such steel tunnel formwork system or Tunnel
form had been used in replacement of conventional sawn
timber formwork. They are a number of generic forms of
shear wall structure or Industrial Building System (IBS)
named as Steel Tunnel Formwork System, Steel Shear Wall
Climbing Formwork System and Steel Wall Panel System
[1].
Shear wall offers efficient means of enclosing and utilizing
space. Thinner walls reduce the cost of buildings as well as
increase the net lettable space of a building. Shear wall did
not require column and beam as structural members. It can act
as column and could transfer load from roof to foundation. A
combination of pile and raft foundation is practically and
economical design when the shear wall floor started at ground
floor.
Shear wall building is commonly built to consist 10 to 35
storey. This is the most suitable construction method to build
apartment units in several blocks and within limited time
frame. The construction speed of the shear wall is normally
controlled by the concreting and subsequent depropping of the
floor slabs. Props should be left in place until the slab has
achieved adequate strength to resist further propping and
construction loads.
Practically the thickness of wall is varies from 100mm to
225mm. Loads on wall are usually in plane axial loads and
lateral load but often they could become accidental eccentric
loads due to constructional imperfections also non uniform
distribution of load on wall panel. As the thickness of the wall
panel is small and the wall is a slender element thus the
analysis of wall panel shall include the considerations of the
stability.
Steel fabric is widely used in reinforce shear wall. In the
specification for steel welded fabric for the reinforcement of
concrete according to Malaysia Standard MS 145:2001
(Second Edition), the steel strength is of grade 510 steel [2].
The substitution of normal rebar to steel fabric expedites faster
installation and considerable costs saving.
1.1 EXPERIMENTAL PROGRAM
The experimental work involved testing of eight (8) wall
panels with the specified material properties. The material
used has been confirmed earlier by conducting cube and steel
fabric strength tests. The structural performance of the wall
panel such as the ultimate strength load, mode of failure and
cracking pattern will be determined. Eight wall panels
reinforced with double layer of steel fabric type B385 (B7)
with a dimension of 75 mm thick (width) x 1000 mm long x
1500 mm high were prepared. For steel fabric type B7 the
main and cross wire are 100mm and 200mm centre to centre
spacing. The aspect ratio (h/L) is 1.5 and the slenderness ratio

International Journal of Civil & Environmental Engineering IJCEE-IJENS Vol:10 No:04 48
101704-9292-IJCEE-IJENS © August 2010 IJENS I J E N S
(h/t) is 20. The specification and dimension of the wall panel
is shown in Figure 1.1 The wall panels were constructed using
concrete Grade 30 Normal Ordinary Portland Cement (OPC)
with a water cement ratio of 0.58. These wall panels were
tested under compressive axial load with 12.5mm
eccentricity. Testing were carried out with two main support
variations; pinned ends (PPe) and pinned-fixed ends (PFe)
also the variations of eccentric for top and bottom support
conditions.
Fig. 1.1. Wall Panel and steel fabric reinforcement detail
According to BS 8110: Part 1: 1997 Clause 3.9.3.3
the eccentricity should be taken as not less than h/20
or 20 mm if less where h is the thickness of the wall
[3]. In this research the eccentricity of tw/6 (12.5
mm) is used according to American Concrete
Institute (ACI 318) [4]. Determination of structural
behaviour includes mode of failure either buckling or
crushing, deflected shape (curvature), stress -strain
and load-displacement relationship. From the
experimental work, graph of stress versus strain and
load versus displacement are plotted and mode of
failure, deflection profile and crack pattern would
determine and will shown accordingly.
This research is expected to provide clear
understanding and knowledge of the structural
behavior and carrying strength capacity of such
system to both researchers, designers and contractors .
2.0 THEORETICAL ANALYSIS OF WALL PANEL
The maximum stress in the wall can be occurred when both
the axial load and the moment are applied. Since the radius of
gyration is defined as:
AIr /
(2-1)
where;
I = moment of inertia and
A = cross section area of wall
The maximum stress can be written in a form called the secant
formula as,
EA
P
r
L
r
ec
A
P
2sec
21max
(2-2)
where;
σ max = Maximum elastic stress
e = Eccentricity of the load P
c = Distance from neutral axis to the outer fiber
A = Cross-sectional area
E = Modulus of elasticity
r = Radius of gyration
I = Moment of inertia
h = Height of wall
L = Length of wall
2.1.1 Design wall Panel using British Standard (BS
8110: 97 Part 1)
In British Concrete Standard (BS8110-97), there’s a section
that deals with the design of plain concrete walls (Section
3.9.4) [3]. This section recommends that the design ultimate
axial force in a plain concrete wall may be calculated on the
assumption that the members transmitting forces on the walls
are simply supported.

International Journal of Civil & Environmental Engineering IJCEE-IJENS Vol:10 No:04 49
101704-9292-IJCEE-IJENS © August 2010 IJENS I J E N S
2.1.2 Determination of Design Ultimate Axial Force
Using Simplified Method
For the determination of design ultimate axial load per unit
length, the equations prescribed for different types of concrete
walls as follows:
cuww fe2t3.0n
… (2-3)
Where nw is the ultimate axial load per unit length of a wall in
compression and fcu is the characteristic compressive cube
strength for concrete in Mpa.
For slender braced plain concrete walls:
cuaxw feehn )22.1(3.0
… (2.4)
where:
ex is the resultant eccentricity of load at right angles to
the plane of the wall (with minimum value h/20).
ea is the additional eccentricity due to deflections which may be taken as le
2/2500h where le is the effective height of
the wall. or unbraced plain walls:
cu1,xww fe2t3.0n
… (2.5)
and cu2,xww fe2t3.0n
… (2.6)
Where ex,1 and ex,2 are the resultant eccentricity calculated at
the top and bottom of the wall respectively.
2.1.3 Effective Height
The effective height of unbraced plain concrete walls is given
as follows:
a. wall supporting at its top a roof or floor slab
spanning at right angles ; le =1.5lo;
b. other walls le=2 lo
lo, may be measured mid-way between eaves
and ridge
The effective heights of braced plain concrete walls
are:
a) where an lateral support resist both rotational
and lateral movements at both ends and le =
0.75L; and for any lateral support resists both
rotational and lateral movements at one end and
the other is free is le = 2.0L.
b) for any lateral support resist only lateral
movements at both ends, le = Lo; and for any
lateral support resists only lateral movement at
one end and the other end is free is le = 2.5Lo.
L is the horizontal distance between centres of lateral
restraints and Lo is clear height of wall between
lateral supports.
2.1.4 Alternative to Design Equation
British Standard outlines an alternative procedure for the
design of reinforced concrete walls in Section 3. The code
calculates the failure load using the following formula;
yscccuw fA67.0Af35.0n
… (2.7)
If the wall is not subjected to a significant moment, due to the
nature of the structure and the arrangement of the structural
elements, the above equation is increased to:
yscccuw fAAfn 75.04.0
… (2.8)
where;
cuf = characteristic strength of concrete
cA = gross area of concrete at a cross section
scA = area of compression reinforcement, per unit
length of wall
yf = characteristic strength of compression
reinforcement
For this alternative design method to be valid, the
slenderness ratio of the wall must satisfy:
a) for braced walls:
le /h ≤ 40, or le /h ≤ 45 if vertical reinforcement
exceeds 1%
b) for unbraced walls:
le /h ≤ 40
The slenderness effects can be ignored for short walls.
Reinforcement are defined as short if the height-to-thickness
ratios are:
a) le /h ≤ 15 for braced walls
b) le /h ≤ 10 for unbraced walls
However, nw is the total design axial load on the wall due to
design ultimate loads. The walls are designed for a uniformly
distributed imposed load and the span on either side of the
wall does not differ by more than 15%.
2.1 GAP OF RESEARCH
The review of literature of the previous researcher gave better
understanding about wall panel behaviour and proposed
parameter in the study area to be confirmed or revised. The
mode of failure for the wall panel were depends on types of
material used, structure behaviour and application of loadings.
It is important to understanding the behaviour of wall panel
reinforced with steel fabric wire mesh with eccentric loading.
The use of steel fabric wire mesh in the wall construction
required attention due to misconceptions or cost factor. The
strength of wall panel depends on the percentage of steel in
concrete and concrete grade used. This study is sought to
investigate the performance of wall using double layer of steel
fabric as normal practice in Malaysia.

International Journal of Civil & Environmental Engineering IJCEE-IJENS Vol:10 No:04 50
101704-9292-IJCEE-IJENS © August 2010 IJENS I J E N S
3.0 SPECIFICATION OF WALL PANEL
The experimental work is conducted based on structural
behaviour of steel fabric reinforced concrete wall panel under
eccentric loading. The loads will be applied at t/6 from the
centre of wall panel. A total number of eight (8) samples of
steel fabric reinforced concrete wall panel were prepared. The
specified characteristic strength of the concrete wall panels is
30 N/mm2 with identical dimension of 75mm thick, 1000mm
length and 1500mm height. The aspect ratio (h/L) and
slenderness ratio (h/w) of the wall panel are 1.5 and 20
respectively, whereas it is classified as normal wall. This wall
panel was subjected to an axial load with an eccentricity of
tw/6 on both top and bottom. The eccentricity specified as by
code (BS8110 Part 1:, 1997) is not to be less than t/6 or 20mm
[3]. The eccentricity for this experiment is 12.5mm from the
cross section of the centroidal axis. The wall sample design
and used properties as stated in BS 8110 Clause 3.9.3.
T ABLE 3.1 SAMPLES SPECIFICATION
Samples No
Set Up No
Eccentricity
Condition
PPe 1 Set up 1 et = t/6
PPe 2 Set up 2 eb=et = t/6
FPe 1&2 Set up 3 et= eb =t/6
PFe 1&2 Set up 4 eb= et =t/6
PP-e Set up 5 eb=-et =t/6
PF-e Set up 6 eb=-et = t/6
Table 3.1 shows the specification of eight wall samples which
tested at different end-condition at both end. Samples PPe1
and PPe with end condition pinned on top and bottom. Sample
FPe with end condition fixed on top and pinned at the bottom
while samples PFe is a reverse of FPe. Samples PP-e with end
condition pinned top and bottom but the eccentric load is on
top reversed position than at the bottom. Sample PF-e with
end condition pinned on top and fixed at bottom and then the
eccentric load was imposed at reverse position at the bottom.
Figure 3.2 shows six different types of experimental set-up
and end condition. Set-up 1 shows the axial load on top with
eccentric of 12.5mm from the centre of wall. Set-up 2, 3 and
4 show the axial load on top and bottom with eccentric of
12.mm imposed at the same site position top and bottom. Set
up 5 and 6 shows the axial load on top with eccentric 12.5mm
and at the bottom the eccentric is at the reverse side.

International Journal of Civil & Environmental Engineering IJCEE-IJENS Vol:10 No:04 51
101704-9292-IJCEE-IJENS © August 2010 IJENS I J E N S
Fig. 3.2. Support set up condition

International Journal of Civil & Environmental Engineering IJCEE-IJENS Vol:10 No:04 52
101704-9292-IJCEE-IJENS © August 2010 IJENS I J E N S
3.1 CONSTRUCTION OF WALL PANEL
A total of eight (8) samples wire fabric reinforced concrete
wall panel of formwork or mould were prepared. The
formwork is designed and built accurately to the desired
shape, size, verticality and horizontally. Plywood with
thickness 10mm and timber 75mm x 50mm were used as
formwork. The formwork prepared in horizontal form due to
the difficulty in compact the concrete during casting of
concrete. The work was fabricated at Fabrication Laboratory
of the Civil Engineering Faculty [4].
A total eight numbers of concrete wall panels reinforced with
double layer of wire mesh type B 385 (B7) with a dimension
of 75x1000x1500mm (Width: Length: Height) were cast at
Concrete Laboratory of Civil Engineering Faculty [4,5]. The
concrete wall panels were constructed using specified material
properties that have been confirmed earlier by conducting
cube and fabric test.
3.2 EXPERIMENTAL SET UP
Reaction frame together with double hydraulic actuator were
used to test wall panel under eccentricity loading. The wall
was anchored to a strong floor and two samples have been
tested in vertical position. Figure 3.4 shows the reaction frame
together with load cell and double actuator which will
imposed vertical loading to wall panel. Figure 3.5 shows the
experimental set-up of wall panel clamped to reaction frame.
Fig. 3.4. Reaction frame used to test wall panel
Fig. 3.5. Experimental Set -up
The concrete wall panel was placed on the center of reaction
frame accurately. The wall has been painted in white color to
ensure the crack pattern could be observed easily. It was
supported by one hydraulic jack with a 2000 kN capacity. The
jacks was transmitted a vertical axial load at the top of the
wall in order to achieve the pinned support at both ends (top
and bottom) of this wall. The boundary condition was set up
using circular rod. The circular rod and the steel plate acted in
transferring the load to the wall panel. Its have been located
with eccentricity of tw/6 on both top and bottom of wall panel.
In this experiment, strain gauges placed at steel fabric to
measure the strain of the wall panels under axial load. The
strain gauges were placed at proper location and mounted on
cleaned and smooth surface of the wall panel. For each wall
panel, four strain gauges were used two at the front
longitudinal bar and two at the rear longitudinal bar as shown
in Figure 3.6. When using strain gauge, it is very important to
make sure that the bond between the gauge and the
reinforcement is tight glue and sealed with electric tape.
Beside strain gauge, linear variable differential transformer
(LVDT) also were used to measure small movements or
deformations of the wall panel. The schematic arrangement of
the LVDT is shown in the Figure 3.7. The instruments were
calibrated and adjusted properly, before applying the load.
Then the load was applied gradually increased until the wall
fail and no more load can be applied. All dimension of width
and lengths crack of crack were measured and necessary data
were recorded automatically by Data Logger which connected
to the computer. The crack pattern was also marked with
marker for at each load stage. Cracks were marked on the
surface of the sample indicating the corresponding load. At

International Journal of Civil & Environmental Engineering IJCEE-IJENS Vol:10 No:04 53
101704-9292-IJCEE-IJENS © August 2010 IJENS I J E N S
each load increment, deflection has been recorded. Figure 3.8
shows the detail location of wall panel, load cell. LVDT and
end condition of the supports. Load cell was attached to
2000kN hydraulic jack for incremental of applied load.
Fig. 3.6. Arrangement of strain gauge on reinforcement of steel fabric
T5
T4
T3
T2
T1
Fig. 3.7. Arrangement of LVDT

International Journal of Civil & Environmental Engineering IJCEE-IJENS Vol:10 No:04 54
101704-9292-IJCEE-IJENS © August 2010 IJENS I J E N S
Fig. 3.8. Detail test set-up in the laboratory
3.3 TESTING PROCEDURE
The experiment work was to complied with all the
specification of material used as stated in the current code of
practice. The testing procedure and set up for the material and
were also loading followed the procedure used in actual
works. The main test set up for the panel testing were the
actual experiment with limitation of the reaction frame. The
lever arm attach to the machine were not contacted directly to
the wall panel. It was acted as a support to prevent the panel
from sway and prevent damage the LVDT. The panel were
casted in horizontal position because it is difficult to prepare
the formwork vertically and compacting of concrete will be
very easy. An incremental of applied load of 10% to wall
panel under vertical loading could easily measure the crack
pattern and lateral displacement. Five LVDT were measured
lateral displacement at different height of wall.
4.0 EXPERIMENTAL RESULTS
The structural behaviour of the panels was observed during
experimental work by measuring the lateral deflections at the
location of LVDT and deformation of strain gauges at the
reinforcement bars. In order to have better understanding the
performance of each panel, the test results were analyzed in
the context of eccentric load bearing capacity, profile -
displacement, load - displacement profile, stress – strain,
cracking pattern and mode of failure.
According to American Concrete Institute (ACI 318), the
ultimate load obtained from the formula for pinned top and
bottom is 528.41 kN. The ACI formula for pinned on top and
fixed on the bottom or otherwise is 649.69 kN. Meanwhile,
British Standard BS 8110: Part 1: 1997 in Clause 3.9.4.16, the
design ultimate load, nw is 324.0 kN for pinned on top and
bottom of wall. For the pinned on top and fixed on bottom or
otherwise the design ultimate load, nw is 355.05 kN. From
these values, it was found out that the ultimate load for PPe1
and PPe2 recorded from experiment is lower than the
proposed equation likes in ACI 318 and BS8110 27.28% and
196.59%, respectively. The FPe samples accounted less
between 27.28% and above 30.44%, from the theoretical
values. Sample PFe1 experienced the higher value between
33.07% and 63.42% but sample PFe2 has lower up to
196.59%. Similarity results obtained for sample PP-e and
PPe2 in the range of lower 192.37% and upper 67.32%. Also
for sample PF-e shown similarity with sample PFe2 of lower
196.59% and upper 1.75%.
According to BS 8110: Part 1: 1997 Clause 3.9.4.16 the value
of nw 324.0 and 355.05 kN is the maximum design ultimate
axial load for slender braced plain wall, where reinforcement
is neglected. An alternative design method is to use Clause
3.8.4.3 value nw 1047.26 kN with limitation of wall assume as
column design and without significant moments. In America
Standard ACI 318 the empirical design formula allowed for a
minimum reinforcement contents. Steel reinforcement
improved the strength of the wall 30% higher ultimate load
than theoretical value.
Table 4.1 compared the experimental and theoretical results of
ultimate load with eccentricity of tw/6. The experimental
results have lower value than the theoretical values. It is
meaning to say that the codes either ACI or BS 8110 have a
upper limit band than the experimental value. Therefore, the
strength capacity of shear wall with double layer has lower
value than as specified in both standards. Further
investigation and improvement should be made to improve

International Journal of Civil & Environmental Engineering IJCEE-IJENS Vol:10 No:04 55
101704-9292-IJCEE-IJENS © August 2010 IJENS I J E N S
their strength so that the actual ultimate value must higher
than the codes.
Figure 4.1 shows ultimate load for each samples from the
experimental, theoretical and maximum deflection. Maximum
deflection measured from the experiment have lower value
than the theoretical.
T ABLE 4.1
EXPERIMENTAL AND THEORETICAL RESULTS
SAMPLE EXPERIMENTAL
ULTIMATE LOAD
(kN)
BASIC REQUIRED BY CODE OF
PRACTICE BS8110 & ACI
(kN)
PERCENTAGE
%
PPe 1 382.12 ACI 318 = 528.41
BS 8110 Cl. 3.9.4.16 = 324.00
BS 8110 Cl. 3.8.4.3 = 1047.26
-38.28
15.20
-174.07
PPe 2 358.20 ACI 318 = 528.41
BS 8110 Cl. 3.9.4.16 = 324.00
BS 8110 Cl. 3.8.4.3 = 1047.26
-47.52
9.55
-192.37
FPe 1 362.03 ACI 318 = 649.69
BS 8110 Cl. 3.9.4.16 = 355.05
BS 8110 Cl. 3.8.4.3 = 1047.26
-79.46
1.93
-189.27
FPe 2 510.46 ACI 318 = 649.69
BS 8110 Cl. 3.9.4.16 = 355.05
BS 8110 Cl. 3.8.4.3 = 1047.26
-27.28
30.44
-105.16
PFe 1 970.70 ACI 318 = 649.69
BS 8110 Cl. 3.9.4.16 = 355.05
BS 8110 Cl. 3.8.4.3 = 1047.26
33.07
63.42
-7.89
PFe 2 353.10 ACI 318 = 649.69
BS 8110 Cl. 3.9.4.16 = 355.05
BS 8110 Cl. 3.8.4.3 = 1047.26
-84.00
-0.55
-196.59
PP-e 991.45 ACI 318 = 528.41
BS 8110 Cl. 3.9.4.16 = 324.00
BS 8110 Cl. 3.8.4.3 = 1047.26
46.79
67.32
-5.63
PF-e 361.36 ACI 318 = 649.7
BS 8110 Cl. 3.9.4.16 = 355.05
BS 8110 Cl. 3.8.4.3 = 1047.26
-79.79
1.746
-189.81
International Journal of Civil & Environmental Engineering IJCEE-IJENS Vol:10 No:04 56
101704-9292-IJCEE-IJENS © August 2010 IJENS I J E N S
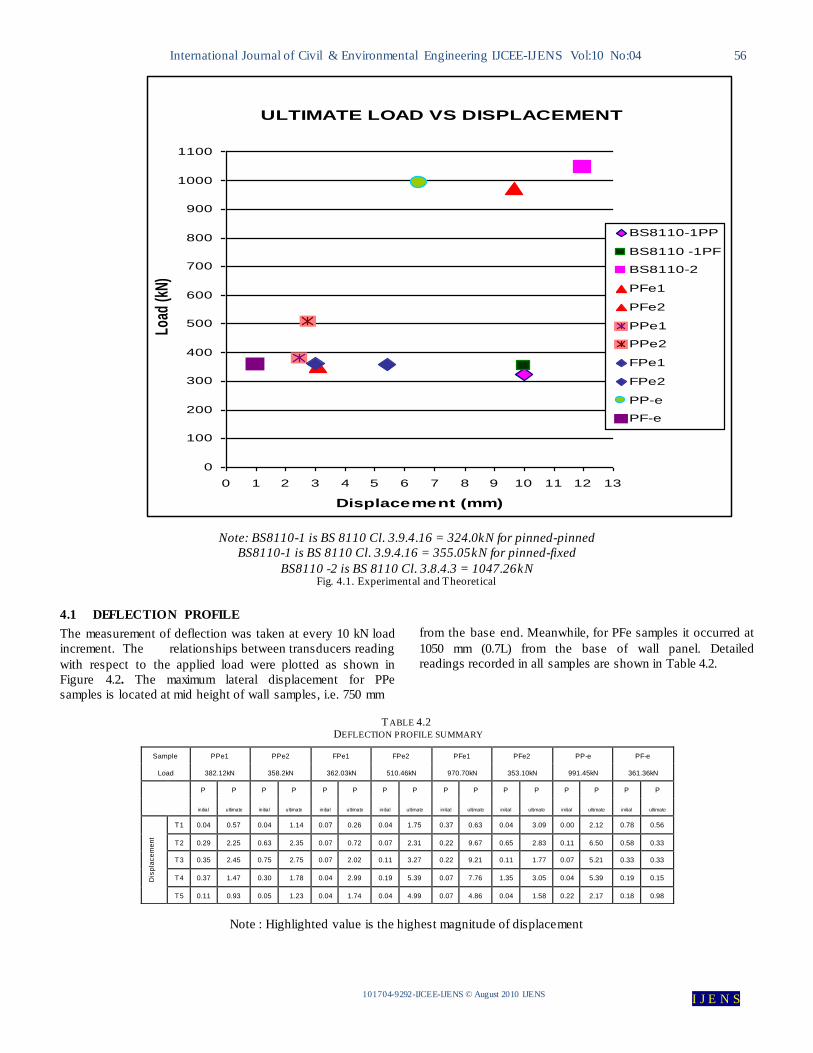
ULTIMATE LOAD VS DISPLACEMENT
0
100
200
300
400
500
600
700
800
900
1000
1100
0 1 2 3 4 5 6 7 8 9 10 11 12 13
Displacement (mm)
Load
(kN
)
BS8110-1PP
BS8110 -1PF
BS8110-2
PFe1
PFe2
PPe1
PPe2
FPe1
FPe2
PP-e
PF-e
Note: BS8110-1 is BS 8110 Cl. 3.9.4.16 = 324.0kN for pinned-pinned
BS8110-1 is BS 8110 Cl. 3.9.4.16 = 355.05kN for pinned-fixed
BS8110 -2 is BS 8110 Cl. 3.8.4.3 = 1047.26kN Fig. 4.1. Experimental and Theoretical
4.1 DEFLECTION PROFILE
The measurement of deflection was taken at every 10 kN load
increment. The relationships between transducers reading
with respect to the applied load were plotted as shown in
Figure 4.2. The maximum lateral displacement for PPe
samples is located at mid height of wall samples, i.e. 750 mm
from the base end. Meanwhile, for PFe samples it occurred at
1050 mm (0.7L) from the base of wall panel. Detailed
readings recorded in all samples are shown in Table 4.2.
T ABLE 4.2 DEFLECTION PROFILE SUMMARY
Note : Highlighted value is the highest magnitude of displacement
Sample PPe1 PPe2 FPe1 FPe2 PFe1 PFe2 PP-e PF-e
Load 382.12kN 358.2kN 362.03kN 510.46kN 970.70kN 353.10kN 991.45kN 361.36kN
P P P P P P P P P P P P P P P P
initial ultimate initial ultimate initial ultimate initial ultimate initial ultimate initial ultimate initial ultimate initial ultimate
Dis
pla
ce
me
nt
T1 0.04 0.57 0.04 1.14 0.07 0.26 0.04 1.75 0.37 0.63 0.04 3.09 0.00 2.12 0.78 0.56
T2 0.29 2.25 0.63 2.35 0.07 0.72 0.07 2.31 0.22 9.67 0.65 2.83 0.11 6.50 0.58 0.33
T3 0.35 2.45 0.75 2.75 0.07 2.02 0.11 3.27 0.22 9.21 0.11 1.77 0.07 5.21 0.33 0.33
T4 0.37 1.47 0.30 1.78 0.04 2.99 0.19 5.39 0.07 7.76 1.35 3.05 0.04 5.39 0.19 0.15
T5 0.11 0.93 0.05 1.23 0.04 1.74 0.04 4.99 0.07 4.86 0.04 1.58 0.22 2.17 0.18 0.98

International Journal of Civil & Environmental Engineering IJCEE-IJENS Vol:10 No:04 57
101704-9292-IJCEE-IJENS © August 2010 IJENS I J E N S
All samples showed a single curvature prevailing buckling
behaviour with maximum deflection dominated at positions
agreeing with the support conditions as mentioned in Euler
buckling theory. The deflection profile and failure pattern for
both PPe and PFe is agreeable and supported by Wang et. al.
(1997) who indicated that wall tested under action of eccentric
load top and bottom of wall deflected with single curvature
[6]. Figure 4.4 has shows the deflection profile of wall panel
at different height and end conditions of support.
WALL PROFILE VS DEFLECTION for ALL SAMPLES
EXPERIMENT
0
100
200
300
400
500
600
700
800
900
1000
1100
1200
1300
1400
1500
0 1 2 3 4 5 6 7 8 9 10 11
Displacement (mm)
He
igh
t (m
m)
PPe1
PPe2
FPe1
FPe2
PFe1
PFe2
PP-e
PF-e
Fig. 4.2. Deflection profile
4.2 CRACK PATTERNS
PPe and PFe sampleswere not crack on the surfaces of the
wall panels based on visual observations absent. However,
the wall panel crushed at the upper and lower ends of the
samples (see Figure 4.3 to 4.5) after yielding of the
reinforcement had occured. The crushed sections at the base
showed complete load distribution took place within the
concrete matrix. Even though all samples were designed with
capping of the steel fabric layers at both upper and lower ends,
the crushed ends showed compression failure of the concrete
initiated the failure of the wall panels. The details for crack
pattern for all walls are shown in Table 4.3 Based on the
visual observation most of spalling of concrete and cracks
were occur at bottom and top of wall panel.
T ABLE 4.3 DESCRIPTION OF AND LOCATION OF CRACKS AT 8 SAMPLES
SAMPLE CRACK LOCATION SIDE CRACK SURFACE
CRACK
PPe1 Crush at top and base of
the wall None None
PPe2 Crush at top and base of
the wall
Crush on left edge at the
base of the wall None
FPe1 Crush at bottom of the
wall None None
FPe2 Crush at bottom of the
wall None None
PFe1 Crush at top of the wall Crush at left and right
edges of the wall None
PFe2 Crush at top of the wall Crush at left and right
edges of the wall None
PP-e Crush at top and base of
the wall None None
PF-e Crush at top and base of
the wall None None

International Journal of Civil & Environmental Engineering IJCEE-IJENS Vol:10 No:04 58
101704-9292-IJCEE-IJENS © August 2010 IJENS I J E N S
Fig. 4.3. PPe1 crushing at both end
(a) (b) (c)
Fig. 4.4. PFe1 crushing at both ends
Fig. 4.5 (a) : PFe2 crushing at base end
4.3 STRESS STRAIN RELATIONS HIP
Figure 4.6 shows stress-strain relationships for wall panel
samples PFe1, PPe1 and FPe1. In the Table 4.4 shows strain
gauge reading on the steel fabric and the stress calculation
using secant formula. All strain in the longitudinal bars
increased linearly with respect to the applied load onto the
wall.
Stress vs Strain for PFe1
0
2000
4000
6000
8000
10000
12000
14000
16000
18000
20000
22000
24000
26000
0 200 400 600 800 1000
Strain (um/m)
Str
es
s (
kN
/m2)
F1
R1
F2
R2
Stress vs Strain for PPe1
0
1000
2000
3000
4000
5000
6000
7000
8000
9000
10000
11000
0 50 100 150 200 250 300 350 400
Strain (um/m)
Str
es
s (
kN
/m2)
F1
F2
R2
R1
Stress vs Strain for FPe1
0
1000
2000
3000
4000
5000
6000
7000
8000
9000
10000
0 50 100 150 200 250 300 350 400
Strain (um/m)
Str
es
s (
kN
/m2)
F1
F2
R1
R2
Fig. 4.8. Stress and strain relationship
T ABLE 4.4 MEASUREMENT ON STEEL FABRIC
Sample Maximum
Stress (kN/m
2)
Strain Longitudinal
wire (µm)
Remark
PPe1 10 189.87
L F 1050 = 0.261
L R 1050 = 0.372
L F 750 = 0.368
LR 750 = 0.313
Maximum stress at middle of
wall height
PPe2 9 553.07
L F 1050 =0.290 L R 1050 =0.273
L F 750 = 0.288
LR 750 = DAMAGE
Maximum stress at middle of
wall height
FPe1 9 654.13 L F 1050 =
0.344 L R 1050 =
Maximum stress at

International Journal of Civil & Environmental Engineering IJCEE-IJENS Vol:10 No:04 59
101704-9292-IJCEE-IJENS © August 2010 IJENS I J E N S
0.242 L F 750 =
0.279 LR 750 =
0.201
three quarter of
wall height
FPe2 13 612.27
L F 1050 = 0.084
L R 1050 = 0.103
L F 750 = 0.130
L R 750 = 0.212
Maximum stress at
three quarter
bottom of wall
height
PFe1 24 343.73
L F 1050 = 1.240
L R 1050 = 1.280
L F 750 = 0.99
L R 750 = 1.00
Maximum stress at
three quarter of
wall height
PFe2 9 416.00
L F 1050 = 0.074
L R 1050 = 0.177
L F 750 = 0.013
LR 750 = 0.056
Maximum stress at
three quarter of
wall height
PP-e 26 438.67
L F 1050 = 0.891
L R 1050 = 0.054
L F 750 = 0.699
LR 750 = 0.924
Maximum stress at
three quarter bottom
and top of wall
height
PF-e 9 636.27
L F 1050 = 0.145
L R 1050 = 0.034
L F 750 = 0.116
LR 750 = 0.239
Maximum stress at
three quarter
bottom of wall
height
Samples PPe1 and PPe2 experienced strain of the range
between 0.261 to 0.372, whereby the PFe samples experienced
in the range of 0.013 to 1.280. Both types of samples shows
similarity in which the PPe samples have and average of 5 %
different between the front to the rear surface at height of 750
mm and 1050 mm respectively. The maximum stress for
PPe1 and PPe2 are 10,189.87 kN/m2
and 9,553.07 kN/m2
respectively. Samples FPe1 and FPe2 show different stress
behaviour at the top and bottom in the range of 0.344 and
0.212 respectively with the average 38% different. Sample PP-
e experienced maximum stress at rear face on the bottom and
front face on top due to symmetrical eccentricity. The
maximum stress for sample PP-e is 26,438.67 kN/m2
and the
support condition is stable. The same experienced to be
shown by sample PF-e but the support condition not stable
compare with sample PP-e the maximum stress is 9 636.27
kN/m2 about the average of the sample PF-e, PPe2, FPe1 and
PFe2 is 9564.86 kN/m2.
From theoretical analysis the maximum stress value
is 14, 437 kN/m2. It is about 33% and 83% difference
between average and the higher. Graph of stress
versus strain of steel fabric at different location
shown for all samples in the Appendix F.
4.4 NUMERICAL ANALYSIS RESULTS
4.4.1 Height versus displacement
The numerical analysis using PROKON software were model
for sample with the support condition top pinned and bottom
fixed (PFe) subject to eccentricity loading of t/6 [7]. The
model was run with 3D linear analysis. The maximum
displacement is measured at the centre of wall or middle node
as per experiment where the location of LVDT location. The
maximum displacement of 11.72mm for load case DL18 or
1000kN were satisfied the code of practice (BS 8110 part 1
1997: Clause 3.9.3.8.2). The maximum displacement sample
PFe1 is 14% different.
The summary of maximum displacement is shown in Table
4.5 and Figure 4.9 shows the wall profile versus displacement
indicated the maximum displacement occurred at 0.7 height of
wall. Figure 4.10 show the displacement for load case DL10.

International Journal of Civil & Environmental Engineering IJCEE-IJENS Vol:10 No:04 60
101704-9292-IJCEE-IJENS © August 2010 IJENS I J E N S
T ABLE 4.5 DISPLACEMENT SUMMARY
Wall LOAD CASE DL1 DL5 DL10 DL12 DL14 DL15 DL17 DL18 DL19
Height LOAD kN 10 50 100 300 500 600 800 900 1000
(mm) Node no. Displacement (mm)
0 10 0 0 0 0 0 0 0 0 0
100 21 0 0.02 0.04 0.11 0.18 0.21 0.28 0.32 0.35
200 32 0.01 0.06 0.13 0.39 0.64 0.77 1.03 1.16 1.26
300 43 0.03 0.13 0.26 0.79 1.32 1.59 2.12 2.38 2.59
400 54 0.04 0.21 0.43 1.29 2.15 2.57 3.43 3.86 4.2
500 65 0.06 0.3 0.61 1.82 3.04 3.64 4.8 5.46 5.95
600 76 0.08 0.39 0.78 2.35 3.92 4.71 6.27 7.06 7.69
700 87 0.09 0.47 0.95 2.84 4.73 5.68 7.57 8.52 9.27
800 98 0.11 0.54 1.08 3.24 5.39 6.47 8.63 9.74 10.57
900 109 0.12 0.58 1.17 3.5 5.8 7 9.33 10.5 11.43
1000 120 0.12 0.6 1.2 3.59 6 7.18 9.57 10.77 11.72
1100 131 0.1 0.58 1.15 3.46 5.79 6.92 9.23 10.32 11.31
1200 142 0.08 0.515 1.03 3.08 5.15 6.15 8.26 9.23 10.05
1300 153 0.05 0.4 0.8 2.39 4 4.78 6.38 7.21 7.81
1400 164 0 0.23 0.46 1.38 2.31 2.75 3.67 4.15 4.5
1500 175 0 0 0 0 0 0 0 0 0
Wall Profile vs Displacement for
NUMERICAL ANALYSIS
PFe
0
100
200
300
400
500
600
700
800
900
1000
1100
1200
1300
1400
1500
0 1 2 3 4 5 6 7 8 9 10 11 12 13
Displacement (mm)
Heig
ht
(mm
) DL1
DL5
DL10
DL12
DL14
DL15
DL17
DL19
DL18
DL19
Max
Max deflection
at 0.7 w all
height or at
1050 mm
Fig. 4.9. Plot graph load versus displacement using PROKON load case DL1
to DL19
Fig. 4.10. Displacement profile for load case DL10
4.4.2 Stress Versus Load
The stress criterion is as Von Misses Stress is concentration at
the support and edge of the wall panel. The experiment has
shown this criteria whereby the sample crushed at top and
bottom support. The maximum stress is much higher than the
experiment. Figure 4.11 show the linear relationship between
stress and load. Figure 4.12 show maximum stress for load
case DL10.

International Journal of Civil & Environmental Engineering IJCEE-IJENS Vol:10 No:04 61
101704-9292-IJCEE-IJENS © August 2010 IJENS I J E N S
STRESS vs LOAD for
NUMERICAL ANALYSIS
PFe
0
15000
30000
45000
60000
75000
90000
105000
120000
135000
150000
0 100 200 300 400 500 600 700 800 900 1000 1100
Load (kN)
Str
ess (
kN
/m2
)
DL1
DL5
DL10
DL12
DL14
DL15
DL17
DL18
DL19
Fig. 4.11. Graph for numerical analysis on stress and different load cases
Fig. 4.12. Stress for load case DL10

International Journal of Civil & Environmental Engineering IJCEE-IJENS Vol:10 No:04 62
101704-9292-IJCEE-IJENS © August 2010 IJENS I J E N S
5.0 CONCLUSION
The experiment results showed that the behaviour of the steel
fabric wire mesh reinforced concrete wall panel have similar
behaviour and characteristic as specified in BS 8110 and ACI
318. The average ultimate load for eight samples of wall
panels are 536.18 kN. By comparing with theoretical results
from ACI 318, BS 8110 Cl. 3.8.4.3 and BS 8110 Cl. 3.9.4.16
the ultimate load record from the experimental were less
84%, 192.37% and more 67.32%, respectively. Therefore, the
average strength capacity of shear wall is less than what is
specified in both of code of practice (ACI and BS 8110).
The deflection profile showed a single curvature pattern where
it bends at rear side. The maximum lateral displacement
ranges is about 9.67 mm and 2.75 mm which occurred at
distance 1050 mm (0.7H) and at 750 mm (0.5H) from the base
of the wall for sample PFe and PPe respectively. It was proved
that the theoretical studies of buckling by Euler with
maximum deflection should occur at center of the wall about
750 mm (0.5H) for pinned ends support.
Whereby, the maximum stress calculated using secant formula
has an average maximum stress record from the experiment
is 14105.50 kN/m2 less than theoretical calculation of 2.3%.
The strain increased linearly with the stress, the strain
recorded found to be very small and below the yield strain.
The steel fabric wire mesh B7 with two layers indicated that
the reinforcement is more adequate.
Beside that, there is no cracking occurrence on surface of wall
panel but the wall panel crushed at top and base of the wall.
Beayoune et all (2005), showed that when the load reached the
ultimate value a violent failure occurred by crushing at either
one or both of the panels [8].
Therefore, it can be conclude that, the objective of this study
has been achieved where the structural behaviour of wire
fabric reinforced concrete wall panel under eccentric loading
has been observed such as mode of failure, crack propagation
and deflection profiles as discussed. The experimental works
have proved the theory with some limitation on the test set up
and sample properties.
Since the wire fabric reinforced concrete wall panel is a new
trend in the construction in our country, this understanding
could provide sustainable development in promoting fast and
economic construction in the future.
5.1 RECOMMENDATION
There are some recommendations that will be useful to get a
better understanding on behaviour of the steel fabric wire
mesh reinforced concrete wall panel under eccentric loading.
i. The one way action or the direct axial load with
eccentric has predicted average agreement with
the theory.
ii. For future experiment on the same topic it is
recommended to look on
the different percentage of steel fabric in the wall
panel and slenderness ratio.
iii. The numerical analysis of different software
such as PROKON, ETAB, STAAD PRO and
LUSAS can be used as the numerical analysis.
iv. Study on the actual constructed wall panel
building could be more valuable inventory to
predict and confirmed the safety of the building.
v. It is recommended that higher reinforcement ratio
1.27% or maximum 4% of the section area as in
column design to be used in shear wall. Double
layer of steel fabric wire is advisable to use in the
construction of multi-storey building.
vi. Lateral cyclic loading test experiment to be
conducted for shear wall to determine the wall
strength subjected to horizontal loading such as
earthquake and wind loading.
REFERENCES
[1] Tunnel Formwork System (2007), Transkon Engineering Sdn Bhd (Brochure).(n.d) Kuala Lumpur.
[2] SIRIM, (2001) MS 145 Specification for Steel Fabric for the
Reinforcement of Concrete, Shah Alam, SIRIM Berhad. [3] British Standards Association (1997), BS 8110: Part 1. Structural
Use of Concrete, British Standard Institution [4] American Concrete Institute (1989), ACI 318 Building Code
Requirement for Reinforced Concrete, USA [5] Hamzah, S.H., Saari, N., Hamzah, A.H. and Marwi, M.S., (2005),
Understanding Reinforced Concrete Through Experiment, UPENA UiTM, ISBN 967-968-185-3, Shah Alam
[6] Hamzah, S.H., Kamarul Zaman, S.B., and Rajin, F., (2007), Wire Fabric Reinforced Concrete Wall Panel , World Housing Congress, Terengganu
[7] Wang, R., Elwi A.E, Hatzinikolas, M.A and Warwawuk, J.,
(1995) Tests on Tall Cavity Wall Subjected to Eccentric Loading”, the Seventh Canadian Mansory Symposium, June 5-7, 1995 Hamilton Ontario, Proceedings Vol 2, pp. 911-922
[8] PROKON (2008), PROKON Calculation Pad design software
Version W2.4.00. [9] Benayoune, A., Samad, A.A.A., Trikha, D.N., Ali, A.A.A. and
Ashrabor, A.A., (2005), Structural behaviour of
eccentrically loaded precast sandwich panels , Construction and Building Materials, 20, 713-724