structural behavior of ultra-high performance …...structural behavior of ultra-high performance...
TRANSCRIPT

Structural Behavior of Ultra-High Performance Concrete Prestressed I-Girders
PUBLICATION NO. FHWA-HRT-06-115 AUGUST 2006
Research, Development, and TechnologyTurner-Fairbank Highway Research Center6300 Georgetown PikeMcLean, VA 22101-2296
FOREWORD We currently are experiencing the initial stages of a significant advancement in the use of structural concrete. Historically, structural forms composed of concrete have relied on the modest compressive strength of concrete to carry compressive loads and internal steel reinforcement to carry tensile forces. Recent advances in concrete technology have allowed for the development of very high compressive strength concretes that also exhibit significant tensile strength and tensile toughness through the use of steel fiber reinforcement. The Federal Highway Administration’s Ultra-High Performance Concrete Research Program has been investigating the use of these types of concrete in the highway infrastructure. This report discusses a series of tests that were completed on prestressed concrete I-girders composed of ultra-high performance concrete (UHPC). Although not structurally optimized to take advantage of the high compressive strength of UHPC, these girders did make use of UHPC’s significant tensile capacity through the elimination of all mild steel reinforcement. The results contained herein show that UHPC can carry all shear forces normally demanded of a prestressed I-girder and also can significantly enhance the flexural capacity of the girder. These results should aid bridge owners in their initial foray into the use of UHPC within the bridge inventory.
Gary Henderson Director, Office of Infrastructure Research and Development
Notice This document is disseminated under the sponsorship of the U.S. Department of Transportation in the interest of information exchange. The U.S. Government assumes no liability for the use of the information contained in this document. This report does not constitute a standard, specification, or regulation.
The U.S. Government does not endorse products or manufacturers. Trademarks or manufacturers’ names appear in this report only because they are considered essential to the objective of the document.
Quality Assurance Statement The Federal Highway Administration (FHWA) provides high-quality information to serve Government, industry, and the public in a manner that promotes public understanding. Standards and policies are used to ensure and maximize the quality, objectivity, utility, and integrity of its information. FHWA periodically reviews quality issues and adjusts its programs and processes to ensure continuous quality improvement.

Form DOT F 1700.7 (8–72)
1. Report No. FHWA–HRT–06–115
2. Government Accession No.
3. Recipient’s Catalog No. 5. Report Date August 2006
4. Title and Subtitle Structural Behavior of Ultra-High Performance Concrete Prestressed I-Girders
6. Performing Organization Code
7. Author(s) Benjamin A. Graybeal
8. Performing Organization Report No.
10. Work Unit No.
9. Performing Organization Name and Address PSI, Inc. 2930 Eskridge Road Fairfax, VA 22031
11. Contract or Grant No. 13. Type of Report and Period Covered Final Report, March 2001–May 2005
12. Sponsoring Agency Name and Address Office of Infrastructure Research and Development Federal Highway Administration 6300 Georgetown Pike McLean, VA 22101-2296
14. Sponsoring Agency Code
15. Supplementary Notes Additional FHWA Contacts—Joseph Hartmann (Technical Advisor), William Wright (COTR) 16. Abstract In the past decade significant advances have been made in the field of high performance concretes (HPC). The next generation of concrete, ultra-high performance concrete (UHPC), exhibits exceptional tensile and compressive strength characteristics that make it well suited for use in highway bridge structures. Prestressed highway bridge girders were cast from this material and tested under flexure and shear loadings. These American Association of State Highway and Transportation Officials (AASHTO) Type II girders contained no mild steel reinforcement, forcing the UHPC and its internal passive fiber reinforcement to carry all secondary tensile forces within the girder. These tests demonstrated that UHPC can carry all shear forces normally demanded of a prestressed I-girder and can also significantly enhance the flexural capacity of the girder. Based on this research, a basic structural design philosophy for bridge I-girder design is proposed. 17. Key Words UHPC, ultra-high performance concrete, fiber- reinforced concrete, AASHTO Type II girder, I-girder, flexure, shear, design philosophy
18. Distribution Statement No restrictions. This document is available to the public through the National Technical Information Service, Springfield, VA 22161.
19. Security Classif. (of this report) Unclassified
20. Security Classif. (of this page) Unclassified
21. No of Pages 104
22. Price
ii
SI* (MODERN METRIC) CONVERSION FACTORS APPROXIMATE CONVERSIONS TO SI UNITS
Symbol When You Know Multiply By To Find Symbol LENGTH
in inches 25.4 millimeters mm ft feet 0.305 meters m yd yards 0.914 meters m mi miles 1.61 kilometers km
AREA in2 square inches 645.2 square millimeters mm2
ft2 square feet 0.093 square meters m2
yd2 square yard 0.836 square meters m2
ac acres 0.405 hectares hami2 square miles 2.59 square kilometers km2
VOLUME fl oz fluid ounces 29.57 milliliters mL gal gallons 3.785 liters L ft3 cubic feet 0.028 cubic meters m3
yd3 cubic yards 0.765 cubic meters m3
NOTE: volumes greater than 1000 L shall be shown in m3
MASS oz ounces 28.35 grams glb pounds 0.454 kilograms kgT short tons (2000 lb) 0.907 megagrams (or "metric ton") Mg (or "t")
TEMPERATURE (exact degrees) oF Fahrenheit 5 (F-32)/9 Celsius oC
or (F-32)/1.8 ILLUMINATION
fc foot-candles 10.76 lux lxfl foot-Lamberts 3.426 candela/m2 cd/m2
FORCE and PRESSURE or STRESS lbf poundforce 4.45 newtons N lbf/in2 poundforce per square inch 6.89 kilopascals kPa
APPROXIMATE CONVERSIONS FROM SI UNITS Symbol When You Know Multiply By To Find Symbol
LENGTHmm millimeters 0.039 inches in m meters 3.28 feet ft m meters 1.09 yards yd km kilometers 0.621 miles mi
AREA mm2 square millimeters 0.0016 square inches in2
m2 square meters 10.764 square feet ft2
m2 square meters 1.195 square yards yd2
ha hectares 2.47 acres ackm2 square kilometers 0.386 square miles mi2
VOLUME mL milliliters 0.034 fluid ounces fl oz L liters 0.264 gallons gal m3 cubic meters 35.314 cubic feet ft3
m3 cubic meters 1.307 cubic yards yd3
MASS g grams 0.035 ounces ozkg kilograms 2.202 pounds lbMg (or "t") megagrams (or "metric ton") 1.103 short tons (2000 lb) T
TEMPERATURE (exact degrees) oC Celsius 1.8C+32 Fahrenheit oF
ILLUMINATION lx lux 0.0929 foot-candles fc cd/m2 candela/m2 0.2919 foot-Lamberts fl
FORCE and PRESSURE or STRESS N newtons 0.225 poundforce lbf kPa kilopascals 0.145 poundforce per square inch lbf/in2
*SI is the symbol for th International System of Units. Appropriate rounding should be made to comply with Section 4 of ASTM E380. e(Revised March 2003)
iii
TABLE OF CONTENTS
CHAPTER 1. INTRODUCTION.............................................................................................1 1.1 INTRODUCTION ........................................................................................................... 1 1.2 OBJECTIVE .................................................................................................................... 1 1.3 SUMMARY OF APPROACH ........................................................................................ 1 1.4 OUTLINE OF REPORT.................................................................................................. 2
CHAPTER 2. BACKGROUND AND PREVIOUS RESEARCH.........................................3 2.1 UHPC CONSTITUENT MATERIALS .......................................................................... 3 2.2 STEAM-TREATED UHPC MATERIAL PROPERTIES .............................................. 3 2.3 STEEL FIBER MATERIAL PROPERTIES................................................................... 4 2.4 RELEVANT BACKGROUND RESEARCH ................................................................. 5
2.4.1 Prestressing Strand Development Length by Steinberg and Lubbers.................. 5 2.4.2 Shear Capacity of AASHTO Type II Girders by Tawfiq .................................... 5 2.4.3 Shear Capacity of Small UHPC Beams by Hegger, et al. ................................... 6 2.4.4 Flexural Capacity of High-Strength Concrete Girders by Russell and Burns ..... 6
CHAPTER 3. GIRDER MATERIAL PROPERTIES ...........................................................9
3.1 TEST SPECIMEN CASTING, HARVESTING, AND PREPARATION ...................... 9 3.2 UHPC COMPRESSION TESTING ................................................................................ 9 3.3 UHPC FLEXURAL PRISM TESTING ........................................................................ 10
CHAPTER 4. GIRDER FABRICATION AND EXPERIMENTAL METHODS.............15 4.1 GIRDER FABRICATION............................................................................................. 15 4.2 TEST MATRIX ............................................................................................................. 15 4.3 TEST SETUP AND SPECIMEN DETAILS................................................................. 16 4.4 INSTRUMENTATION ................................................................................................. 19
4.4.1 Girder 80F.......................................................................................................... 19 4.4.2 Girder 28S.......................................................................................................... 19 4.4.3 Girder 24S.......................................................................................................... 22 4.4.4 Girder 14S.......................................................................................................... 22
4.5 LOADING PROCEDURE............................................................................................. 25
CHAPTER 5. UHPC GIRDER TEST RESULTS ................................................................27
5.1 STATIC FLEXURAL TESTING.................................................................................. 27 5.2 STATIC SHEAR TESTING.......................................................................................... 36
5.2.1 Girder 28S.......................................................................................................... 36 5.2.2 Girder 24S.......................................................................................................... 44 5.2.3 Girder 14S.......................................................................................................... 52
CHAPTER 6. DISCUSSION OF RESULTS.........................................................................59
6.1 LOCAL AND GLOBAL MECHANICAL FAILURE MODES OF UHPC................. 59 6.2 DEVELOPMENT LENGTH OF PRESTRESSING STRAND IN UHPC ................... 60 6.3 ESTIMATION OF PRESTRESS LOSSES IN UHPC GIRDERS................................ 61 6.4 FLEXURAL BEHAVIOR OF PRESTRESSED UHPC GIRDERS ............................. 63
iv
6.4.1 Analytical Predictions of Global Behavior ........................................................ 63 6.4.2 Cracking Behavior ............................................................................................. 65 6.4.3 Effective Moment of Inertia............................................................................... 69 6.4.4 Flexural Stiffness Under Flexural Loading........................................................ 71 6.4.5 Uniaxial Stress-Strain Model of Girder Flexural Behavior ............................... 76
6.5 SHEAR BEHAVIOR OF PRESTRESSED UHPC GIRDERS CONTAINING NO MILD STEEL ................................................................................................................ 82 6.5.1 Predicted Versus Actual Global Behavior ......................................................... 82 6.5.2 Cracking Behavior ............................................................................................. 83 6.5.3 Simplified Model of UHPC Girder Shear Failure ............................................. 84 6.5.4 Strut-and-Tie Model of Girder 28S Failure ....................................................... 86
CHAPTER 7. DESIGN PHILOSOPHY FOR UHPC BRIDGE GIRDERS ......................89 7.1 INTRODUCTION ......................................................................................................... 89 7.2 FLEXURE...................................................................................................................... 89 7.3 SHEAR .......................................................................................................................... 90
CHAPTER 8. CONCLUSIONS AND FUTURE RESEARCH ...........................................93 8.1 INTRODUCTION ......................................................................................................... 93 8.2 CONCLUSIONS............................................................................................................ 93 8.3 ONGOING AND FUTURE RESEARCH..................................................................... 94
REFERENCES .........................................................................................................................95
v
LIST OF FIGURES
Figure 1. Graph. Sample tensile stress-strain response for steel fiber reinforcement. .................5 Figure 2. Graph. Third-point loading response of a 2-inch by 2-inch prism on a 9-inch
span. ......................................................................................................................................14 Figure 3. Illustration. Origin of the four girder specimens, with the south elevation of the
tested configuration shown. ..................................................................................................17 Figure 4. Illustration. AASHTO Type II cross section and strand pattern. ................................18 Figure 5. Illustration. Instrumentation plan for Girder 80F........................................................20 Figure 6. Illustration. Instrumentation plan for Girder 28S........................................................21 Figure 7. Illustration. Instrumentation plan for Girder 24S........................................................23 Figure 8. Illustration. Instrumentation plan for Girder 14S........................................................24 Figure 9. Graph. Load versus midspan deflection response of Girder 80F. ...............................27 Figure 10. Graph. Load-rotation response of Girder 80F. ..........................................................28 Figure 11. Graph. Deflected shape of Girder 80F at selected load levels. .................................28 Figure 12. Graph. Moment-curvature response of Girder 80F. ..................................................29 Figure 13. Graph. Midspan neutral axis depth from the top of Girder 80F................................30 Figure 14. Graph. Principal strains in the web near the west support of Girder 80F. ................30 Figure 15. Graph. Principal strain angles in the web near the west support of Girder 80F........31 Figure 16. Photo. Crack spacing on the bottom flange of Girder 80F at 305 mm midspan
overall girder deflection........................................................................................................33 Figure 17. Photo. Girder 80F after approximately 430 mm (17 inches) of deflection. ..............34 Figure 18. Photo. Girder 80F immediately after failure. ............................................................34 Figure 19. Photo. Failure surface of Girder 80F including (a) overall west failure surface
and (b) closeup of west failure surface showing pulled-out fibers and necked strands........35 Figure 20. Graph. Load-deflection response of Girder 28S. ......................................................37 Figure 21. Graph. Bearing rotation response of Girder 28S.......................................................37 Figure 22. Graph. Deflected shape of Girder 28S. .....................................................................38 Figure 23. Graph. Strand slip in Girder 28S. ..............................................................................38 Figure 24. Graph. Principal tensile strain in the web of Girder 28S...........................................39 Figure 25. Graph. Principal tensile strain angle in the web of Girder 28S.................................39 Figure 26. Graph. Principal compressive strain in the web of Girder 28S. ................................40 Figure 27. Graph. Principal compressive strain angle in the web of Girder 28S. ......................40 Figure 28. Photo. Crack at south base of Girder 28S web at a load of 2,000 kN (450 kips)......41 Figure 29. Photo. Tension failure of top flange and crushing of web at conclusion of test. ......42 Figure 30. Illustration. Crack pattern at failure in Girder 28S....................................................43 Figure 31. Graph. Load-deflection response of Girder 24S. ......................................................44 Figure 32. Graph. Bearing rotation of Girder 24S......................................................................45 Figure 33. Graph. Deflected shape of Girder 24S. .....................................................................45 Figure 34. Graph. Principal tensile strain in the web of Girder 24S...........................................47 Figure 35. Graph. Principal tensile strain angle in the web of Girder 24S.................................47 Figure 36. Graph. Principal compressive strain in the web of Girder 24S. ................................48 Figure 37. Graph. Principal compressive strain angle in the web of Girder 24S. ......................48 Figure 38. Photo. Failure of Girder 24S (a) 1/15 second before failure, (b) 1/30 second
before failure, (c) at failure, and (d) 1/30 second after failure..............................................49 Figure 39. Photo. Failed Girder 24S (a) south elevation and (b) bottom flange near
bearing...................................................................................................................................50
vi
Figure 40. Illustration. Crack pattern at failure in Girder 24S....................................................51 Figure 41. Graph. Load-deflection response for Girder 14S. .....................................................53 Figure 42. Graph. Bearing rotation for Girder 14S.....................................................................53 Figure 43. Graph. Deflected shape for Girder 14S. ....................................................................54 Figure 44. Graph. Strand slip in Girder 14S. ..............................................................................54 Figure 45. Graph. Principal tensile strain in the web of Girder 14S...........................................55 Figure 46. Graph. Principal tensile strain angle in the web of Girder 14S.................................55 Figure 47. Graph. Principal compressive strain in the web of Girder 14S. ................................56 Figure 48. Graph. Principal compressive strain angle in the web of Girder 14S. ......................56 Figure 49. Photo. Girder 14S at (a) peak load and (b) postpeak load of 2,650 kN (595 kips). ..57 Figure 50. Illustration. Crack pattern at failure in Girder 14S....................................................58 Figure 51. Graph. Predicted behavior of girders tested in the configuration of Girder 80F.......65 Figure 52. Graph. Girder 80F midspan bottom flange strain throughout testing. ......................67 Figure 53. Graph. Flexural crack spacing observed on the bottom flange of Girder 80F at
a total applied load of 690 kN (155 kips). ............................................................................67 Figure 54. Graph. Flexural crack spacing related to tensile strain. ............................................68 Figure 55. Equation. Crack spacing as a function of strain. .......................................................68 Figure 56. Graph. Tensile strain related to flexural crack spacing. ............................................68 Figure 57. Equation. Strain as a function of crack spacing. .......................................................69 Figure 58. Equation. Relationship between the midspan vertical deflection of a girder and
its effective moment of inertia. .............................................................................................69 Figure 59. Equation. Relationship between the vertical deflection of a girder and its
effective moment of inertia. ..................................................................................................70 Figure 60. Graph. Effective moment of inertia of Girder 80F....................................................70 Figure 61. Equation. Virtual work relationship between applied moment and deflection. ........71 Figure 62. Equation. Cross-sectional flexural stiffness as a function of applied moment. ........72 Figure 63. Graph. Flexural stiffness of an AASHTO Type II girder..........................................73 Figure 64. Graph. Ratio of predicted deflections and rotations to experimental results. ...........74 Figure 65. Graph. Predicted and observed midspan deflection results.......................................74 Figure 66. Graph. Predicted and observed load point deflection results. ...................................75 Figure 67. Graph. Predicted and observed quarter point deflection results................................75 Figure 68. Graph. Predicted and observed end rotation results. .................................................76 Figure 69. Graph. Experimental strain profile results for midspan of Girder 80F. ....................77 Figure 70. Graph. Analytically derived uniaxial stress-strain behavior of UHPC. ....................79 Figure 71. Graph. Summation of forces on cross section during loading steps. ........................80 Figure 72. Graph. External and internal moments on midspan cross section.............................81 Figure 73. Graph. Internally and externally determined moment of inertia. ..............................81 Figure 74. Equation. Shear capacity as a function of concrete strength. ....................................83 Figure 75. Equation. Fiber contribution to shear strength. .........................................................83 Figure 76. Illustration. Truss model for failure of Girder 28S. ..................................................87 Figure 77. Graph. Sample uniaxial stress-strain behavior for I-girder flexural design. ............90

vii
LIST OF TABLES
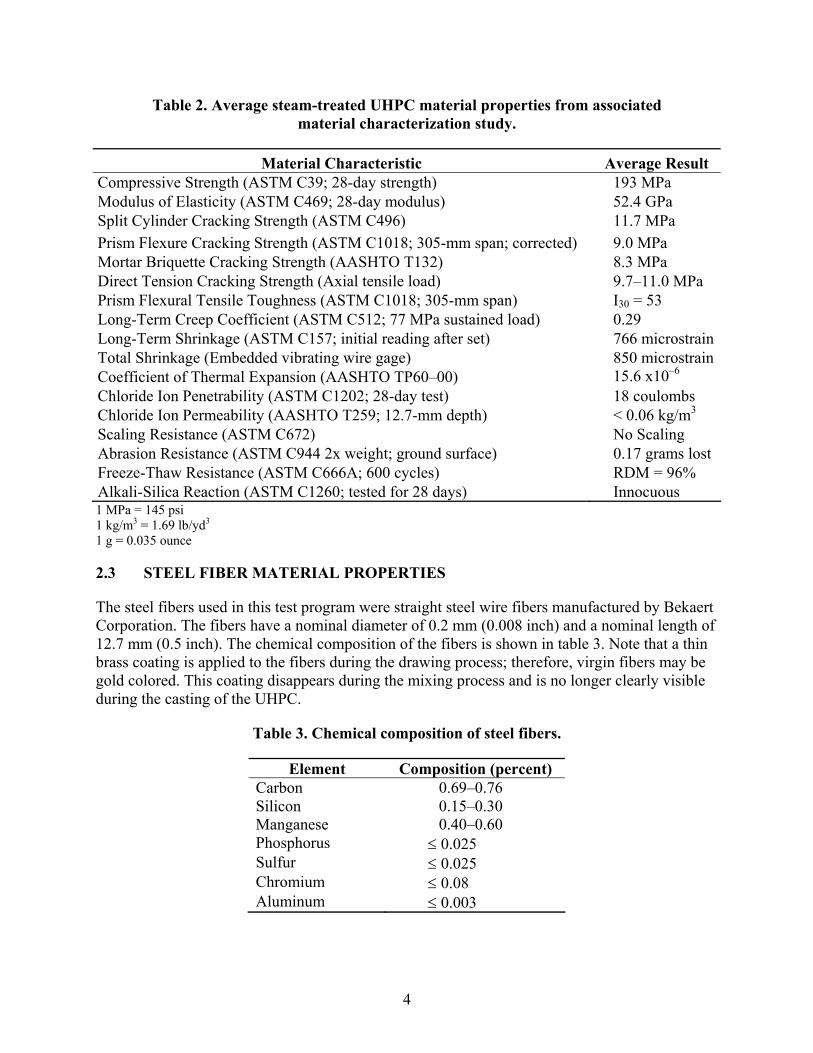
Table 1. Typical UHPC composition............................................................................................3 Table 2. Average steam-treated UHPC material properties from associated material
characterization study. ............................................................................................................4 Table 3. Chemical composition of steel fibers. ............................................................................4 Table 4. Compression test results. ..............................................................................................12 Table 5. Prism flexure test results...............................................................................................13 Table 6. Test matrix. ...................................................................................................................16


1
CHAPTER 1. INTRODUCTION
1.1 INTRODUCTION
Ultra-high performance concrete (UHPC) is a new class of concrete that has been developed in recent decades. When compared with high performance concrete (HPC), UHPC tends to exhibit superior properties such as advanced strength, durability, and long-term stability.
Many researchers around the world have developed concretes that could be classified as UHPC. Although there are differences among types of UHPC, there also are many overall similarities. The Association Française de Génie Civil (AFGC) Interim Recommendations for Ultra High Performance Fibre-Reinforced Concretes indicates that UHPC tends to have the following properties: Compressive strength that is greater than 150 megapascals (MPa) (21.7 kilopounds per square inch (ksi)), internal fiber reinforcement to ensure nonbrittle behavior, and a high binder content with special aggregates.(1) Furthermore, UHPC tends to have a very low water content and can achieve sufficient rheological properties through a combination of optimized granular packing and the addition of high-range water-reducing admixtures.
Characterization of the material behaviors of UHPC has progressed to such an extent that the full-scale structural use of this concrete is on the horizon. In particular, an extensive material characterization study of UHPC was completed in conjunction with the present study.(2) To date, UHPC has been used in the construction of two public highway bridges,(3,4) numerous pedestrian bridges,(5,6) and a wide variety of other projects.(7,8,9) Research and observations to date indicate that UHPC has the potential to expand the use of concrete into new forms that have heretofore been impossible.
This research program focused on determining the behaviors of UHPC because this information is relevant to the highway bridge industry in the United States. Currently, the only UHPC that is commercially available in the United States is Ductal®, which is a product of Lafarge. Therefore, Ductal® was the UHPC product used in this research program.
1.2 OBJECTIVE
The objective of this research is to evaluate the potential use of UHPC in highway bridge girders by characterizing structural behaviors through full-scale girder testing.
1.3 SUMMARY OF APPROACH
The research included an experimental phase and an analytical phase. The experimental phase focused on determining the structural behavior of UHPC prestressed I-girders by completing full-scale girder tests. This testing was conducted on American Association of State Highway and Transportation Officials (AASHTO) Type II prestressed girders. The tests included one flexure test on a 24.4-meter (m) (80-feet (ft)) span girder and three shear tests on shorter span girders. These girders did not contain any mild steel reinforcement; thus, the UHPC was required to carry all secondary (i.e., shear, temperature, shrinkage) tensile forces.
2
In the analytical phase of this research, the results from the experimental phase were analyzed and elaborated upon. This phase included developing a rational philosophy for the flexure and shear design of prestressed UHPC I-girders.
1.4 OUTLINE OF REPORT
This report is divided into eight chapters. Chapters 1 and 2 provide an introduction and relevant background information. Chapter 3 presents the results of the material tests performed on the specimens from the full-scale UHPC girders. Information regarding the fabrication of and experimental method associated with those girders is presented in chapter 4. The full-scale girder test results are presented in chapter 5. Chapter 6 presents analysis and discussion of the experimental results discussed in chapters 3 through 5. A design philosophy for the flexural and shear design of prestressed UHPC I-girders is presented in chapter 7. Finally, chapter 8 presents the conclusions reached as a result of this research program.
3
CHAPTER 2. BACKGROUND AND PREVIOUS RESEARCH
2.1 UHPC CONSTITUENT MATERIALS
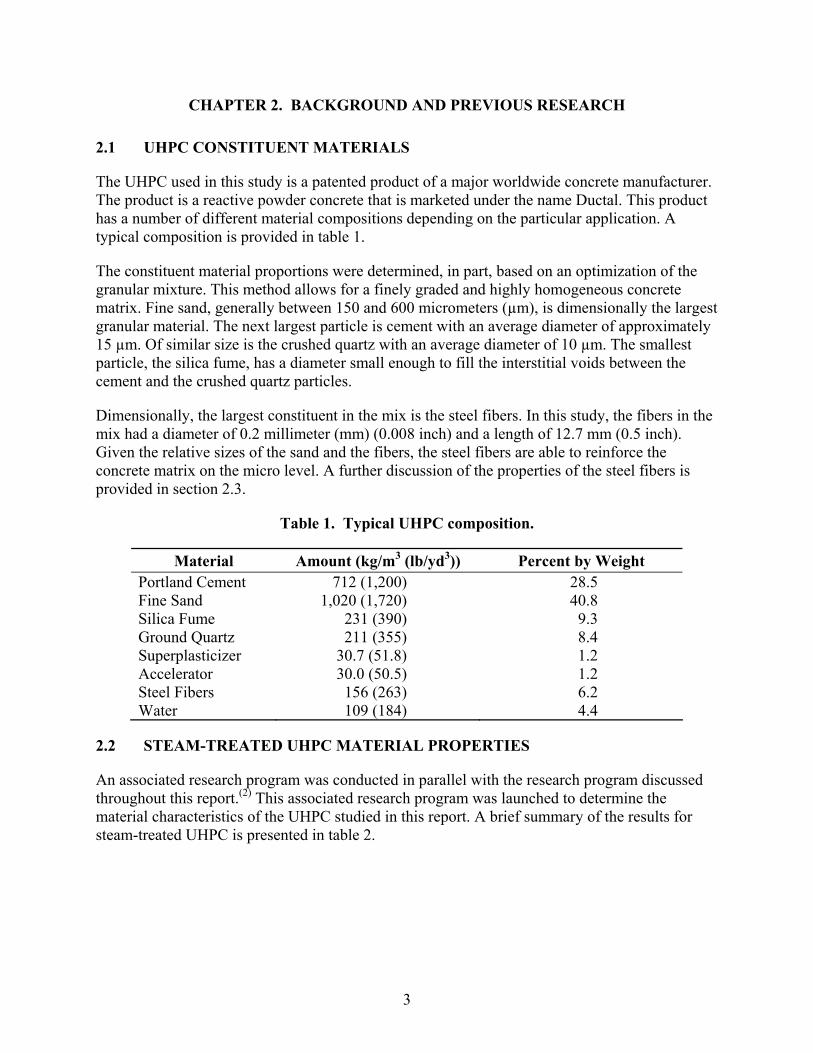
The UHPC used in this study is a patented product of a major worldwide concrete manufacturer. The product is a reactive powder concrete that is marketed under the name Ductal. This product has a number of different material compositions depending on the particular application. A typical composition is provided in table 1.
The constituent material proportions were determined, in part, based on an optimization of the granular mixture. This method allows for a finely graded and highly homogeneous concrete matrix. Fine sand, generally between 150 and 600 micrometers (µm), is dimensionally the largest granular material. The next largest particle is cement with an average diameter of approximately 15 µm. Of similar size is the crushed quartz with an average diameter of 10 µm. The smallest particle, the silica fume, has a diameter small enough to fill the interstitial voids between the cement and the crushed quartz particles.
Dimensionally, the largest constituent in the mix is the steel fibers. In this study, the fibers in the mix had a diameter of 0.2 millimeter (mm) (0.008 inch) and a length of 12.7 mm (0.5 inch). Given the relative sizes of the sand and the fibers, the steel fibers are able to reinforce the concrete matrix on the micro level. A further discussion of the properties of the steel fibers is provided in section 2.3.
Table 1. Typical UHPC composition.
Material Amount (kg/m3 (lb/yd3)) Percent by Weight Portland Cement 712 (1,200) 28.5 Fine Sand 1,020 (1,720) 40.8 Silica Fume 231 (390) 9.3 Ground Quartz 211 (355) 8.4 Superplasticizer 30.7 (51.8) 1.2 Accelerator 30.0 (50.5) 1.2 Steel Fibers 156 (263) 6.2 Water 109 (184) 4.4
2.2 STEAM-TREATED UHPC MATERIAL PROPERTIES
An associated research program was conducted in parallel with the research program discussed throughout this report.(2) This associated research program was launched to determine the material characteristics of the UHPC studied in this report. A brief summary of the results for steam-treated UHPC is presented in table 2.
4
Table 2. Average steam-treated UHPC material properties from associated material characterization study.
Material Characteristic Average Result Compressive Strength (ASTM C39; 28-day strength) 193 MPa Modulus of Elasticity (ASTM C469; 28-day modulus) 52.4 GPa Split Cylinder Cracking Strength (ASTM C496) 11.7 MPa Prism Flexure Cracking Strength (ASTM C1018; 305-mm span; corrected) 9.0 MPa Mortar Briquette Cracking Strength (AASHTO T132) 8.3 MPa Direct Tension Cracking Strength (Axial tensile load) 9.7–11.0 MPa Prism Flexural Tensile Toughness (ASTM C1018; 305-mm span) I30 = 53 Long-Term Creep Coefficient (ASTM C512; 77 MPa sustained load) 0.29 Long-Term Shrinkage (ASTM C157; initial reading after set) 766 microstrainTotal Shrinkage (Embedded vibrating wire gage) 850 microstrainCoefficient of Thermal Expansion (AASHTO TP60–00) 15.6 x10⁻⁶ Chloride Ion Penetrability (ASTM C1202; 28-day test) 18 coulombs Chloride Ion Permeability (AASHTO T259; 12.7-mm depth) < 0.06 kg/m3 Scaling Resistance (ASTM C672) No Scaling Abrasion Resistance (ASTM C944 2x weight; ground surface) 0.17 grams lost Freeze-Thaw Resistance (ASTM C666A; 600 cycles) RDM = 96% Alkali-Silica Reaction (ASTM C1260; tested for 28 days) Innocuous 1 MPa = 145 psi 1 kg/m3 = 1.69 lb/yd3 1 g = 0.035 ounce 2.3 STEEL FIBER MATERIAL PROPERTIES
The steel fibers used in this test program were straight steel wire fibers manufactured by Bekaert Corporation. The fibers have a nominal diameter of 0.2 mm (0.008 inch) and a nominal length of 12.7 mm (0.5 inch). The chemical composition of the fibers is shown in table 3. Note that a thin brass coating is applied to the fibers during the drawing process; therefore, virgin fibers may be gold colored. This coating disappears during the mixing process and is no longer clearly visible during the casting of the UHPC.
Table 3. Chemical composition of steel fibers.
Element Composition (percent) Carbon 0.69–0.76 Silicon 0.15–0.30 Manganese 0.40–0.60 Phosphorus ≤ 0.025 Sulfur ≤ 0.025 Chromium ≤ 0.08 Aluminum ≤ 0.003

5
The intended function of these fibers within UHPC requires that the fibers have a very high tensile strength. The manufacturer’s specified minimum tensile strength is 2,600 MPa (377 ksi), and tension tests are performed as a means of quality control on the fiber production. The results from three of these tests are presented in figure 1. The average yield strength of these fibers as calculated by the 0.2-percent offset method is 3,156 MPa (457.7 ksi). The modulus of elasticity is 205.4 gigapascals (GPa) (29790 ksi) and the ultimate strength is 3,268 MPa (474.0 ksi).
1 MPa = 145 psi 1 GPa = 145 ksi
Figure 1. Graph. Sample tensile stress-strain response for steel fiber reinforcement.
2.4 RELEVANT BACKGROUND RESEARCH
2.4.1 Prestressing Strand Development Length by Steinberg and Lubbers
Researchers at Ohio University recently completed a study of the force transfer behavior of prestressing strand in UHPC.(10) This research program focused on determining the development length of 12.7-mm, 1,860-MPa (0.5-inch, 270-ksi) low-relaxation prestressing strands in UHPC, similar to that studied in the present research program. Predefined lengths of strands were cast into blocks of UHPC, then the strands were pulled until slip or strand rupture occurred. Embedment lengths of 305, 457, and 610 mm (12, 18, and 24 inches) were investigated. In all tests, fracture of the strand occurred before significant slip of the strand could occur. These results indicate that the development length of this type of strand in UHPC is less than 305 mm (12 inches).
2.4.2 Shear Capacity of AASHTO Type II Girders by Tawfiq
In the early 1990s the Florida Department of Transportation sponsored a research program focused on determining the shear capacity of high-strength concrete bridge girders. This research, performed by Tawfiq, experimentally determined the shear capacity of AASHTO Type II girders composed of 55-, 69-, and 83-MPa (8-, 10-, and 12-ksi) concrete.(11,12) The AASHTO Type II girder cross section tested included 16 strands in the bottom flange, 2 in the top flange, and a 0.2-m by 1.07-m (8-inches by 42-inches) composite deck cast onto the top of the girder.
0500
100015002000250030003500
0.000 0.005 0.010 0.015 0.020Strain
Stre
ss (M
Pa)
Yield Stress = 3150 MPaMaximum Stress = 3250 MPaModulus of Elasticity = 210 GPa

6
Six tests were completed, with two at each compressive strength level. The loading arrangement for the test included offset three-point loading with a shear span-to-depth ratio of approximately 2.5. The shear reinforcement in these girders was designed according the AASHTO Standard Specifications for Highway Bridges.(13) Two #4 stirrups were spaced every 152 mm (6 inches) for the first 0.92 m (4 ft) from the bearing, then two #4 stirrups for every 203 mm (8 inches) for the next 0.92 m (4 ft). The remainder of the span had single #4 stirrups at 203- and 305-mm (8- and 12-inch) spacings.
The overall shear capacity of these girders is the primary result from these tests that is applicable to the UHPC girder tests performed as part of the current research program. On average, the shear capacity exhibited in each of the six tests was approximately 1,200 kilonewtons (kN) (270 kilopounds (kips)). The shear capacity was not significantly influenced by the compressive strength of the concrete.
2.4.3 Shear Capacity of Small UHPC Beams by Hegger, et al.
Researchers at the Institute of Structural Concrete at RWTH Aachen University have recently completed several tests investigating the shear capacity of UHPC beams. This research focused on determining the shear capacity of a 305-mm-deep (12-inch-deep) prestressed concrete beams containing no mild steel shear reinforcement.(14) The UHPC used in this research program was similar to the UHPC discussed throughout this report, although it did contain a slightly larger percentage of steel fiber reinforcement (2.5 percent).
The cross section of the I-beams tested in this research program contained eight 7-wire, 15.2-mm (0.6-inch) prestressing strands in the bottom flange. The bottom flange of the beam was 292 mm (11.5 inches) wide and the top flange was 221 mm (8.7 inches) wide. The web of the beam was 150 mm (5.9 inches) tall and 71 mm (2.8 inches) thick. The overall beam length was 3.5 m (11.5 ft) and each beam was loaded in four-point bending.
The average ultimate shear capacity of these UHPC beams was 273 kN (61.4 kips). Given the size of these beams, this result is very similar to the shear capacities that were observed in the full-scale AASHTO Type II shear tests that are presented in chapters 5 and 6. The analytical procedure presented in section 6.5.3 indicates that the average tensile stress carried by the UHPC across the shear failure plane was approximately 14 MPa (2 ksi).
2.4.4 Flexural Capacity of High-Strength Concrete Girders by Russell and Burns
Russell and Burns investigated the behavior of prestressed concrete girders composed of high-strength concrete.(15) In particular, this study focused on the static and fatigue behaviors of composite bridge girders under flexure and shear loadings. The girder flexural test completed in this research is of most interest to the present study.
This research was completed on Texas Type C girders, which are of similar shape but slightly shallower than AASHTO Type III girders. The tested girder was 1.02 m (40 inches) deep, with a 203 mm (8 inches) deep composite deck cast on top. The deck was 1.82 m (72 inches) wide and composed of 42-MPa (6-ksi) concrete. The girder was composed of 69-MPa (10-ksi) concrete and spanned 14.6 m (48 ft). The flexural test girder contained twenty-eight 12.7-mm, 1,860-MPa
7
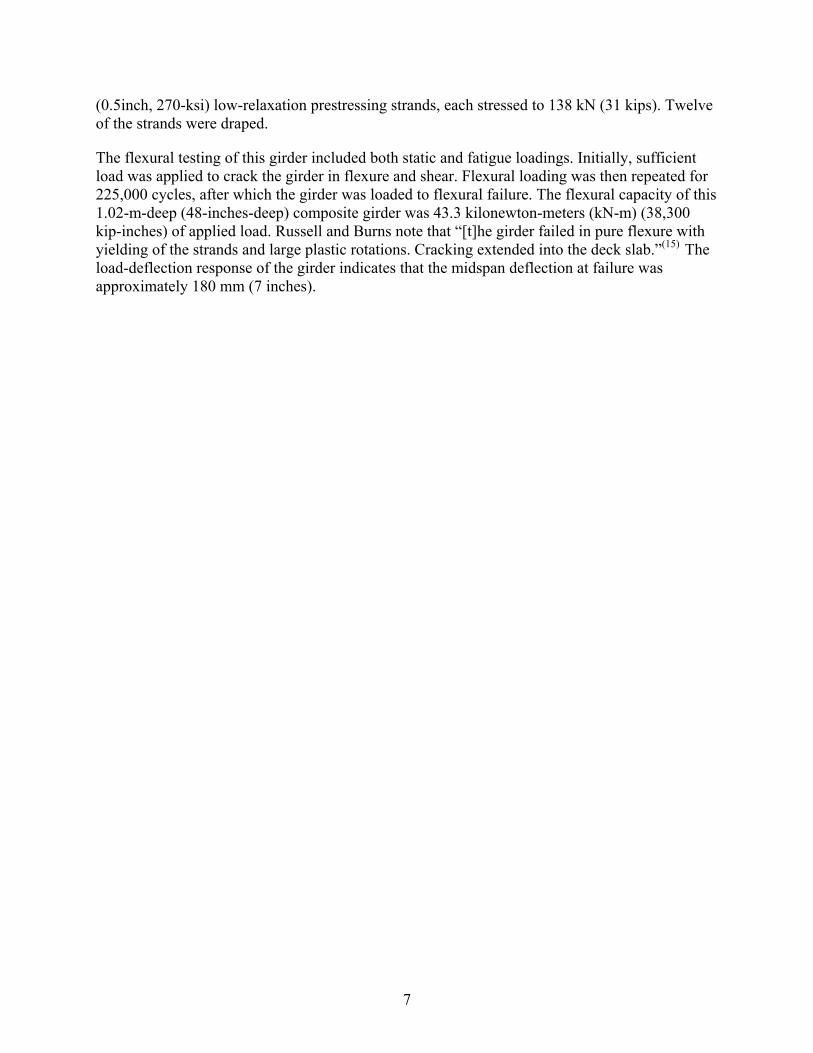
(0.5inch, 270-ksi) low-relaxation prestressing strands, each stressed to 138 kN (31 kips). Twelve of the strands were draped.
The flexural testing of this girder included both static and fatigue loadings. Initially, sufficient load was applied to crack the girder in flexure and shear. Flexural loading was then repeated for 225,000 cycles, after which the girder was loaded to flexural failure. The flexural capacity of this 1.02-m-deep (48-inches-deep) composite girder was 43.3 kilonewton-meters (kN-m) (38,300 kip-inches) of applied load. Russell and Burns note that “[t]he girder failed in pure flexure with yielding of the strands and large plastic rotations. Cracking extended into the deck slab.”(15) The load-deflection response of the girder indicates that the midspan deflection at failure was approximately 180 mm (7 inches).


9
CHAPTER 3. GIRDER MATERIAL PROPERTIES
3.1 TEST SPECIMEN CASTING, HARVESTING, AND PREPARATION
The initial UHPC AASHTO Type II girder test program included a limited amount of work on material characterization. During the casting of the two girders, which will be discussed in chapter 4, three cylinders and three prisms were cast for future testing. The cylinders had a 76-mm (3-inches) diameter, and the prisms were 51 by 51 by 279 mm (2 by 2 by 11 inches). The limited availability of test specimens increased the importance of each specimen. It also forced the use of specimens harvested from undamaged areas of the girders after the girder tests were completed. Both the cores and prisms were cut from the girders. The method used is described below.
The cast cylinders and prism molds were filled according to standard fiber reinforced concrete casting methods. These specimens were treated to the same curing environment that was used for the girders throughout the fabrication process. The prisms required no special preparation, while the cylinders had their ends cut and ground to ensure parallel loading surfaces. This process resulted in 76-mm (3-inches) diameter cylinders with approximately 127-mm (5-inches) lengths.
After the girder tests were complete, cores and prisms were harvested from Girder 28S. The web and top flange at the east end of Girder 28S were not damaged during either the testing of this girder or of its parent girder, Girder 80F. Six cores with approximately 102-mm (4-inches) diameters were obtained by drilling vertically through the top flange of the girder between the strands. An additional 16 prisms were cut from the web of the girder. These prisms had a nominal cross section of 51 mm by 51 mm (2 inches by 2 inches), were approximately 406 mm (16 inches) long, and had a long axis that ran parallel to the length of the girder. Finally, five additional cores were drilled from the web of the girder. These cores had diameters of 70 mm (2.75 inches).
The preparation of the harvested cores included grinding the ends of the cores, measuring the cores to ensure parallel ends, and measuring their lengths and diameters. This method was similar to the method used within the larger material characterization program. The preparation of the harvested prisms was somewhat more extensive than would be expected for cast prisms. Because these prisms were cut from a large block of UHPC using a diamond saw, the cross-sectional dimensions of the prisms varied and had to be measured. The cut prisms were measured at eight locations along their lengths on all four faces of the prism. The average cross-sectional dimensions for each prism were then calculated.
3.2 UHPC COMPRESSION TESTING
In total, 14 compression tests were completed on cylinders or cores composed of UHPC that was associated with the 2 AASHTO Type II girders. In general, these compression tests were performed in a 4,450-kN (1,000-kip) capacity Forney test machine. The lone exception was cylinder “3,” which was tested in a 1,780-kN (400-kip) capacity Universal testing machine. The cylinders were all loaded at approximately 240 kPa/sec (35 psi/sec) as specified in American Society for Testing and Materials (ASTM) C39.(16) The cylinders were all loaded directly to
10
failure. The cores underwent two unloads between 40 percent and 10 percent of their projected strengths before being loaded to failure.
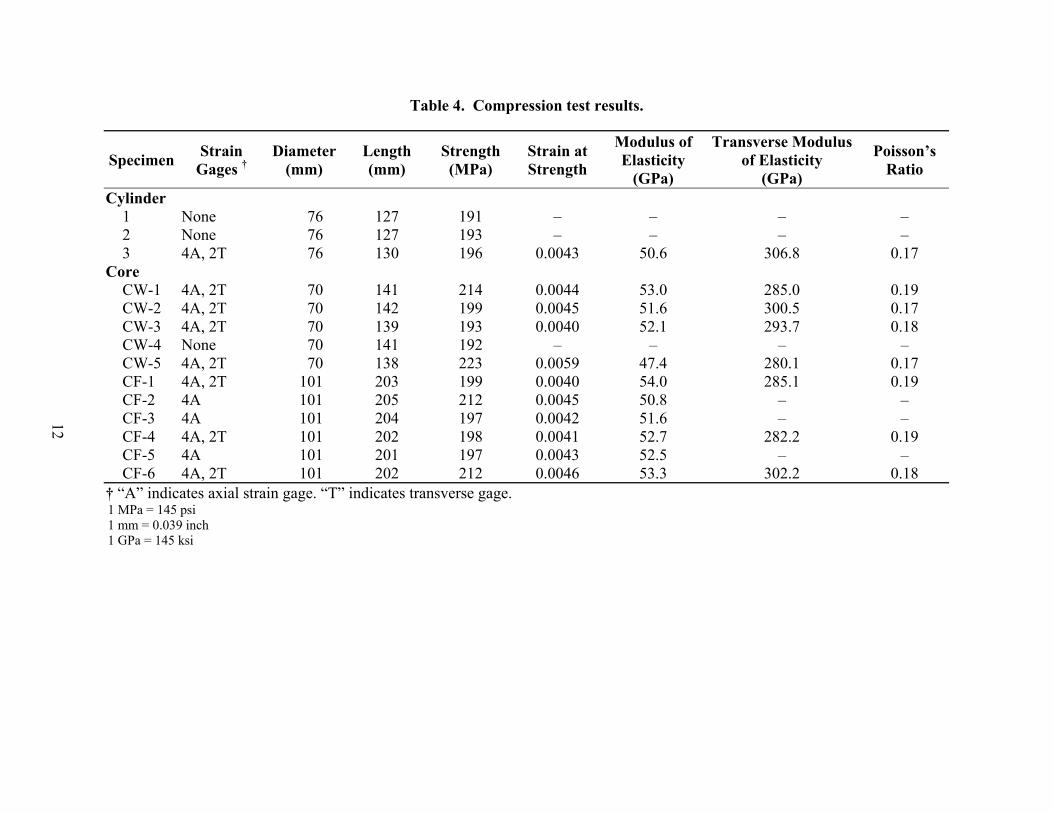
Most of the compression specimens were instrumented with resistance-based strain gages prior to testing. These gages were applied either axially or circumferentially on the outside of the cylinder. In general, four axial gages and two transverse gages were used on each specimen to capture the strain response while eliminating errors caused by uneven loading. Table 4 lists the strain gage configuration applied to each specimen. Gages with a 12.7-mm (0.5-inch) length were used in all instances except for cylinder “3,” which had axial gages with a 25.4-mm (1-inches) length.
Table 4 provides the results from the cylinder and core tests. With the exception of core CW–5, the results show relatively little scatter. These results indicate that the compressive strength is 200 MPa (29 ksi), the modulus of elasticity is 52.4 GPa (7,600 ksi), and the strain at peak strength is 0.0043. In terms of transverse behavior, the Poisson’s ratio is 0.18 with a transverse modulus of elasticity of 29.4 GPa (42,600 ksi).
These UHPC compression tests also reiterated a number of the qualitative findings reported in the associated UHPC material characterization report.(2) Namely, the cores and cylinders tended to exhibit a dramatic decrease in load-carrying capacity soon after the peak load was reached. However, the specimens remained largely intact throughout the failure. Again, this is due to the presence of the steel fiber reinforcement.
3.3 UHPC FLEXURAL PRISM TESTING
Monotonic flexural prism testing was successfully completed on two cast and six cut prisms associated with the AASHTO Type II girders. The prisms all were tested in four-point bending in MTS load frames. As previously mentioned, the prisms all had nominal cross section dimensions of approximately 51 by 51 mm (2 by 2 inches). The span lengths ranged from 152 to 305 mm (6 to 12 inches). The cast prisms were oriented in the load frame such that the top and bottom of the prism as cast became the back and front of the prism as tested.
The load rate varied depending on the particular specimen being tested. Some prisms underwent essentially static loading wherein the load level was increased slowly enough so that it took minutes before the cracking load was reached. Other prisms were loaded much more rapidly, at up to 6.7 kN/sec (1,500 lb/sec).
All prisms were instrumented with at least two resistance-based, bonded strain gages on their top and bottom flanges. The gages had either a 12.7-mm (0.5-inch) or a 25.4-mm (1.0-inch) gage length and were centered on the midspan of the loading. The gages on the bottom flange served the dual purpose of indicating the strain level before first cracking and recording the first cracking event.
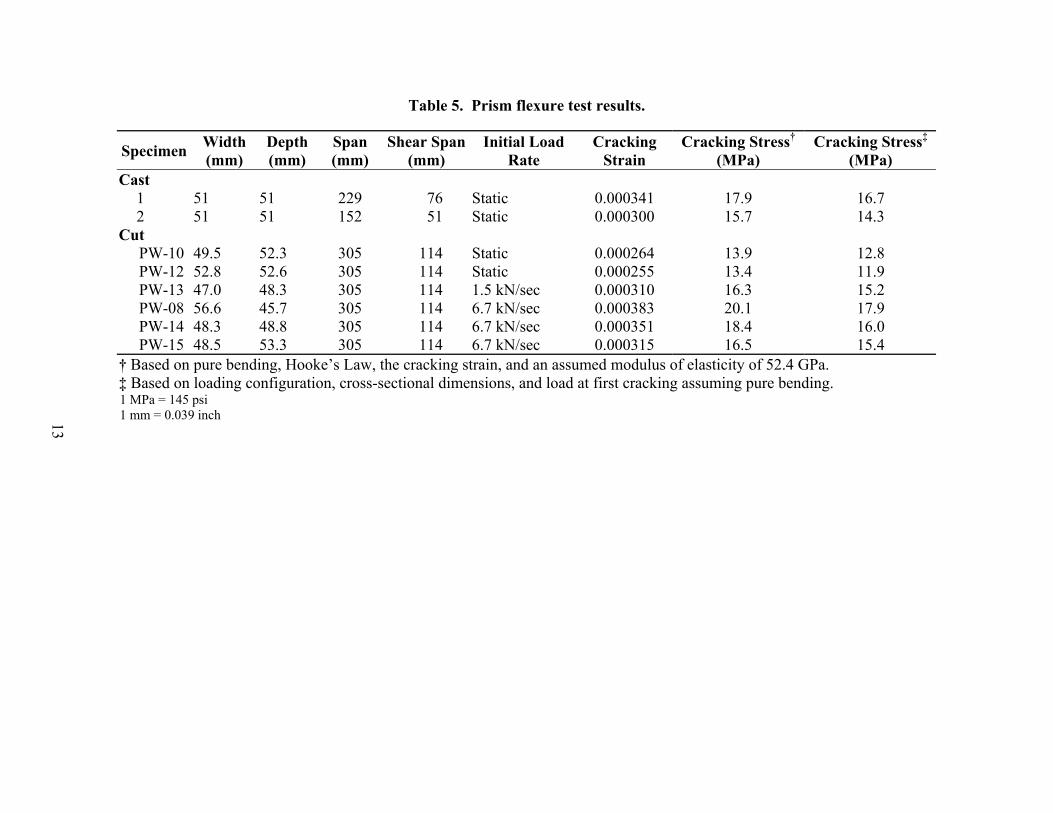
The results from these tests are presented in table 5. The cracking strain listed is the average strain recorded in the tension flange of the prism at first cracking. The two values of cracking stress shown are calculated via different, but equally viable, methods. In the left column, the cracking stress is calculated using the cracking strain and the assumptions of pure bending and the applicability of Hooke’s law. The right column calculates the cracking stress based on the
11
load at cracking, the cross-sectional dimensions, the loading configuration, and the assumption of pure bending. The value presented in the right column corresponds to the tensile stress that would be calculated based on the ASTM standard test methods for prism flexure testing.(17,18) Because these prisms all were tested on relatively short spans, it is unlikely that either of these methods of calculating the cracking stress is truly accurate. The cracking strain results show that the strain at first cracking is approximately 0.0003. The cracking stress results indicate that an average cracking stress between 15 and 16.5 MPa (2.2 and 2.4 ksi) could be expected depending on the method used to calculate the result.
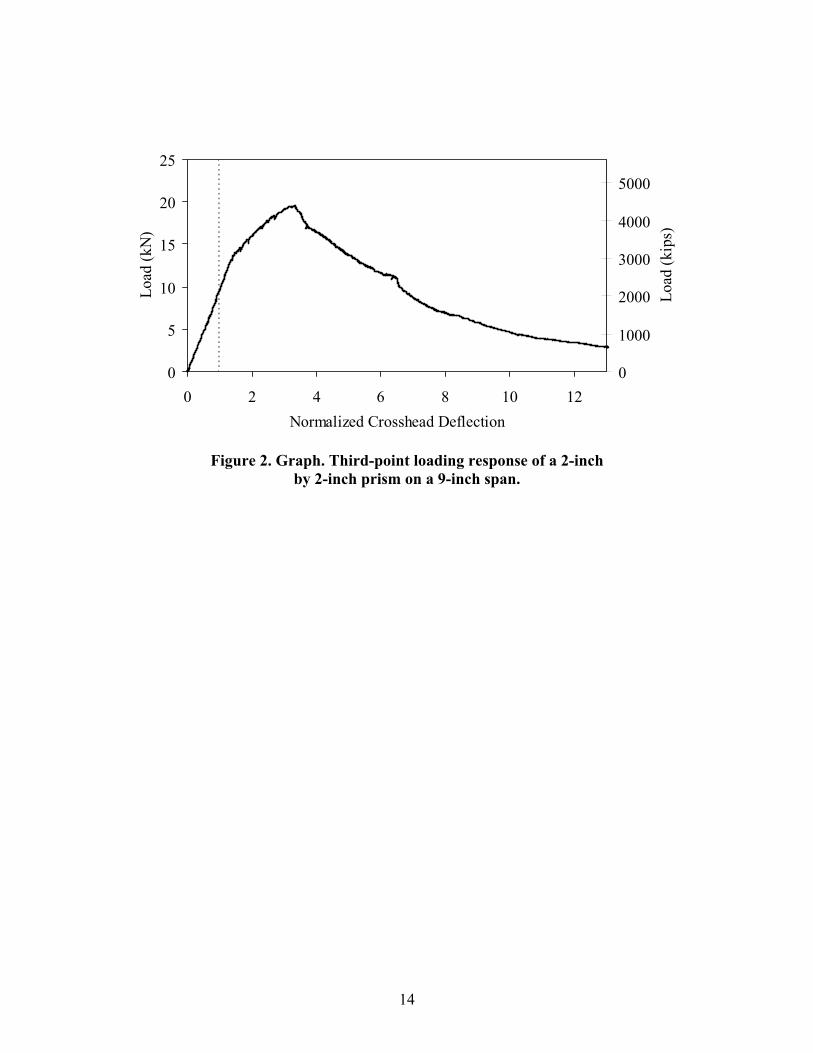
Because these prism flexure tests were not controlled based on the actual deflection of the prisms, direct comparisons from postcracking results obtained here cannot be compared with the results presented in the associated UHPC material characterization report.(2) However, these results are still relevant because they provide information related to the qualitative postcracking response of UHPC. The load versus crosshead deflection response of cast prism “1” is shown in figure 2. The deflection is normalized based on the deflection at first cracking. Note the continued increase in load after first cracking occurs, until a peak load greater than twice the cracking load is reached. In general, the shape of this load-deflection response is very similar to the responses presented in the prism testing section of the associated report.(2)
12
Table 4. Compression test results.
Specimen Strain Gages †
Diameter (mm)
Length (mm)
Strength (MPa)
Strain at Strength
Modulus of Elasticity
(GPa)
Transverse Modulus of Elasticity
(GPa)
Poisson’s Ratio
Cylinder 1 None 76 127 191 – – – – 2 None 76 127 193 – – – – 3 4A, 2T 76 130 196 0.0043 50.6 306.8 0.17
Core CW-1 4A, 2T 70 141 214 0.0044 53.0 285.0 0.19 CW-2 4A, 2T 70 142 199 0.0045 51.6 300.5 0.17 CW-3 4A, 2T 70 139 193 0.0040 52.1 293.7 0.18 CW-4 None 70 141 192 – – – – CW-5 4A, 2T 70 138 223 0.0059 47.4 280.1 0.17 CF-1 4A, 2T 101 203 199 0.0040 54.0 285.1 0.19 CF-2 4A 101 205 212 0.0045 50.8 – – CF-3 4A 101 204 197 0.0042 51.6 – – CF-4 4A, 2T 101 202 198 0.0041 52.7 282.2 0.19 CF-5 4A 101 201 197 0.0043 52.5 – – CF-6 4A, 2T 101 202 212 0.0046 53.3 302.2 0.18
† “A” indicates axial strain gage. “T” indicates transverse gage. 1 MPa = 145 psi 1 mm = 0.039 inch 1 GPa = 145 ksi
13
Table 5. Prism flexure test results.
Specimen Width (mm)
Depth (mm)
Span (mm)
Shear Span(mm)
Initial Load Rate
Cracking Strain
Cracking Stress† (MPa)
Cracking Stress‡ (MPa)
Cast 1 51 51 229 76 Static 0.000341 17.9 16.7 2 51 51 152 51 Static 0.000300 15.7 14.3
Cut PW-10 49.5 52.3 305 114 Static 0.000264 13.9 12.8 PW-12 52.8 52.6 305 114 Static 0.000255 13.4 11.9 PW-13 47.0 48.3 305 114 1.5 kN/sec 0.000310 16.3 15.2 PW-08 56.6 45.7 305 114 6.7 kN/sec 0.000383 20.1 17.9 PW-14 48.3 48.8 305 114 6.7 kN/sec 0.000351 18.4 16.0 PW-15 48.5 53.3 305 114 6.7 kN/sec 0.000315 16.5 15.4
† Based on pure bending, Hooke’s Law, the cracking strain, and an assumed modulus of elasticity of 52.4 GPa. ‡ Based on loading configuration, cross-sectional dimensions, and load at first cracking assuming pure bending. 1 MPa = 145 psi 1 mm = 0.039 inch
14
Figure 2. Graph. Third-point loading response of a 2-inch by 2-inch prism on a 9-inch span.
0
5
10
15
20
25
0 2 4 6 8 10 12Normalized Crosshead Deflection
Load
(kN
)
0
1000
2000
3000
4000
5000
Load
(kip
s)

15
CHAPTER 4. GIRDER FABRICATION AND EXPERIMENTAL METHODS
The experimental program—from the girder fabrication through the methods used to test the full-scale UHPC girders—is described in this chapter. The girder fabrication process is described first, followed by a discussion of the test matrix and the test setup. The specific details of each girder specimen and the instrumentation plan for each girder are then presented. Finally, the loading procedure implemented in each test is described.
4.1 GIRDER FABRICATION
Two AASHTO Type II girders were fabricated at Prestress Services of Kentucky, Inc., in Lexington, KY. Normal AASHTO Type II formwork was used in the casting of the girders. The 24.4-m (80-ft) and the 9.2-m (30-ft) girders were cast end-to-end such that the same strands were stretched through both formworks. These girders did not contain any mild steel reinforcement.
The concrete premix was delivered to the fabricator in large bags that contained all of the nonliquid and nonsteel concrete constituents. These constituents then were combined with the water and superplasticizer following the manufacturer’s recommendations. During the final stage of mixing, the steel fiber reinforcement was added. The overall mixing procedure was very similar to the procedures discussed within the presentation of the UHPC material characterization study results.
The fresh UHPC was transported to the formwork in standard ready-mix concrete trucks and then was poured into the formwork. The 24.4-m (80-ft) girder required approximately 6 m3 (8 yd3) of concrete and was placed in three lifts. The 9.2-m (30-ft) girder required approximately 2.3 m3 (3 yd3) of concrete and was cast in a similar fashion. The placement of the UHPC into the form for the shorter girder was completed in approximately 12 minutes. The girders were externally vibrated on an intermittent basis using a formwork vibrator during the casting. Immediately after casting, the exposed surface on top of the girder was covered with plastic.
The curing and steam treatment of the girders was completed during the week after casting. The girders remained covered and were allowed to cure in the ambient atmosphere until they had gained sufficient strength to resist the forces imparted by strand release. After the strands were released, the girders were steam treated for at least 48 hours. The steam treatment was completed through the use of the precast plant’s steam generation system, which is integral to each casting bed. After treatment, the girders were ready for shipment.
4.2 TEST MATRIX
As stated in chapter 1, the objective of this research was to determine the applicability of UHPC to highway bridge superstructure applications. The test matrix, presented in table 6, was developed to address this objective. As shown in the table, four girder specimens were tested, all with different overall spans and shear spans. The girder designations shown in the table will be used throughout this text. These designations provide a general indication of the overall span length (in feet) and whether the test focused on shear or flexural behavior.

16
Table 6. Test matrix.
Girder Designation
Behavioral Focus Girder Section Overall Span
m (ft) Shear Span
m (ft) 80F Flexure AASHTO Type II 23.9 (78.5) 11.10 (36.25)28S Shear AASHTO Type II 8.54 (28) 1.98 (6.5)24S Shear AASHTO Type II 7.32 (24) 2.29 (7.5)14S Shear AASHTO Type II 4.27 (14) 1.83 (6.0)
4.3 TEST SETUP AND SPECIMEN DETAILS
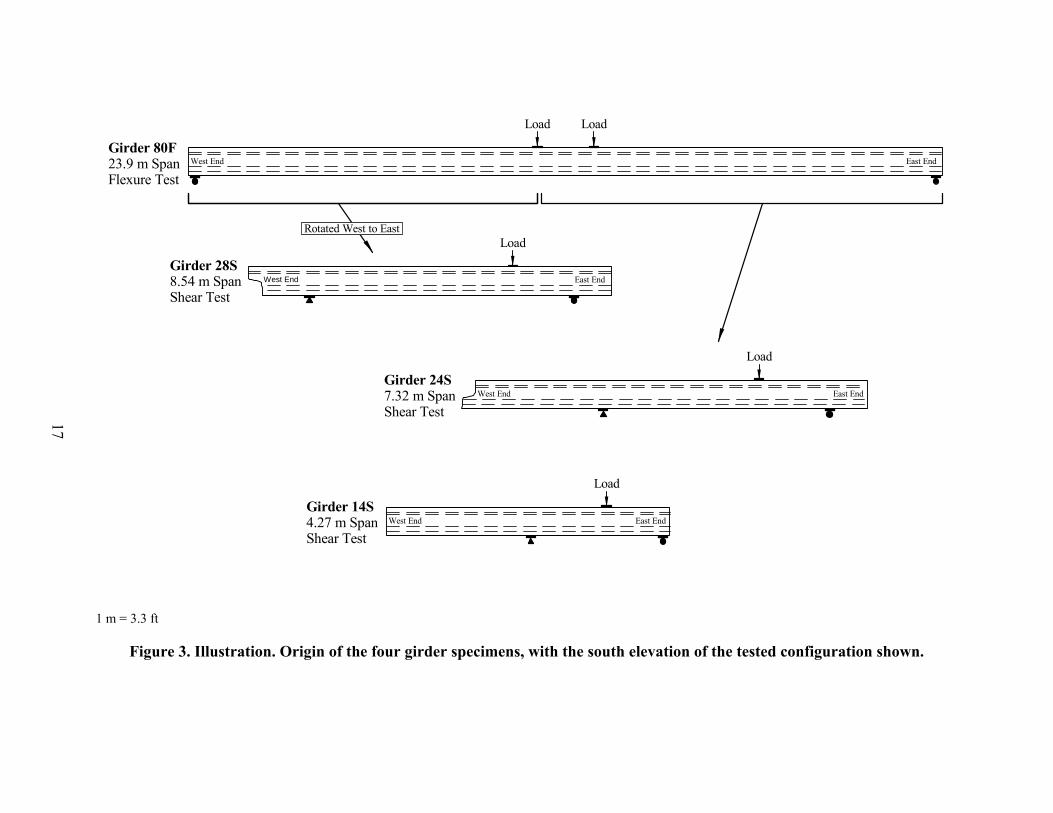
The test specimens detailed in the test matrix above were not originally four separate specimens. As described in the girder fabrication account, two AASHTO Type II girders with lengths of 24.4 and 9.2 m (80 and 30 ft) were originally cast. The four tests were completed in the same order that the specimens are listed in table 6, thus allowing the broken pieces from the flexure test to be used in the subsequent two shear tests. The final shear test used a portion of the 9.2-m (30-ft) girder. Figure 3 provides a schematic indicating the origin of the four girder specimens from the original two girders.
The cross section of an AASHTO Type II girder is shown in figure 4. This AASHTO shape is 0.91 m (36 inches) deep and has a 305-mm-wide (12-inch-wide) top and a 457-mm (18-inches) bottom flange. The girder web is 381 mm (15 inches) deep and is 152 mm (6 inches) thick. These girders each contained twenty-six 12.7-mm (0.5-inch) diameter, 1860-MPa (270-ksi), low-relaxation prestressing strands. Twenty-four of these strands are located in the bottom flange, spaced in a grid pattern on 51-mm (2-inches) spacing. Alternating strands in the bottom flange are debonded for a length of 0.91 m (36 inches) from each end of the original two girders.
Generally, AASHTO Type II girders contain significant amounts of mild steel reinforcement, primarily in the form of stirrups and possibly temperature and shrinkage steel. The girders tested in this study contained no mild steel reinforcement. These girders were designed to carry tensile flexural forces primarily via the prestressing strand and to carry tensile shear forces via the fiber-reinforced concrete matrix.
Two basic loading configurations were used: One for the flexural test and one for the shear tests. In both configurations, the girder was simply supported and the load was applied vertically downward through the top flange of the girder. Hydraulic jacks applied the loads.
Girder 80F was loaded symmetrically by two-point loads each located 0.91 m (3 ft) from midspan. The simple supports, each located 12 m (39.25 ft) from midspan, were rollers that allowed for independent movement of the ends of the girder. The bearings were centered 229 mm (9 inches) from the ends of the girder. Before testing, this girder had a camber of approximately 65 mm (2.5 inches) at midspan.
17
1 m = 3.3 ft
Figure 3. Illustration. Origin of the four girder specimens, with the south elevation of the tested configuration shown.
West End East EndGirder 80F23.9 m SpanFlexure Test
Girder 28S8.54 m SpanShear Test
Girder 24S7.32 m SpanShear Test
Girder 14S4.27 m SpanShear Test
Rotated West to East
West End East End
West End East End
West End East End
LoadLoad
Load
Load
Load

18
1 m = 3.3 ft 1 mm = 0.039 inch
Figure 4. Illustration. AASHTO Type II cross section and strand pattern.
The three shear tests were each loaded by a point load located closer to the east end of the girder. The simple supports included a roller at the east end and a rocker bearing at the west end. The rocker was implemented to alleviate safety concerns emanating from the nonsymmetric application of load. In girder tests 28S and 24S, the roller bearing was centered 1.22 m (4 ft) from the east end of the girder. In girder test 14S, the roller bearing was centered 152 mm
51 mm
51 mm
51 mm
51 mm
51 mm
51 mm51 mm
51 mm
51 mm
51 mm
T4N4
T3N4
T4N3
T3N3
T4N2
T3N2
T4N1
T3N1
T2N3T2N2T2N1
T1N1
CN
indicates debonded strand
1860 MPa 12.7 mm lowrelaxation prestressing strand
0.91 m
152 mm
152 mm
381 mm
76 mm
152 mm
152 mm
76 mm
0.30 m
0.46 m
19
(6 inches) from the east end of the girder. This girder’s setup allowed for a determination of the effect of strand debonding on the shear strength of the girder.
4.4 INSTRUMENTATION
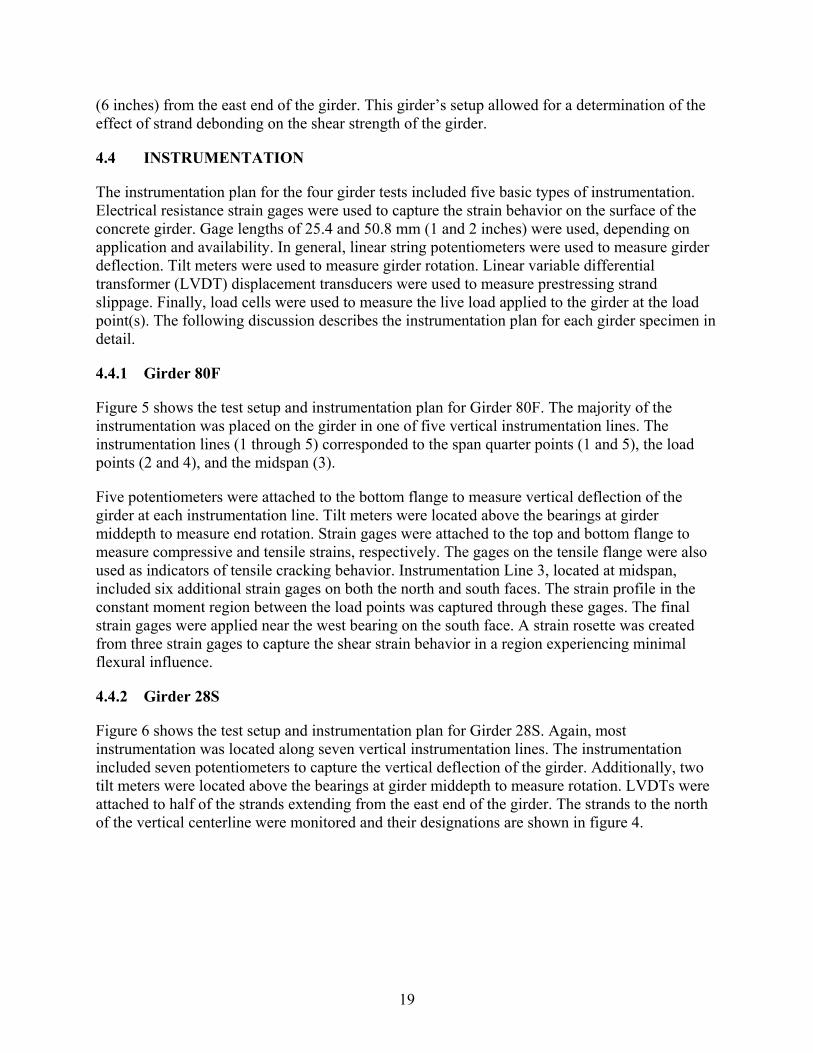
The instrumentation plan for the four girder tests included five basic types of instrumentation. Electrical resistance strain gages were used to capture the strain behavior on the surface of the concrete girder. Gage lengths of 25.4 and 50.8 mm (1 and 2 inches) were used, depending on application and availability. In general, linear string potentiometers were used to measure girder deflection. Tilt meters were used to measure girder rotation. Linear variable differential transformer (LVDT) displacement transducers were used to measure prestressing strand slippage. Finally, load cells were used to measure the live load applied to the girder at the load point(s). The following discussion describes the instrumentation plan for each girder specimen in detail.
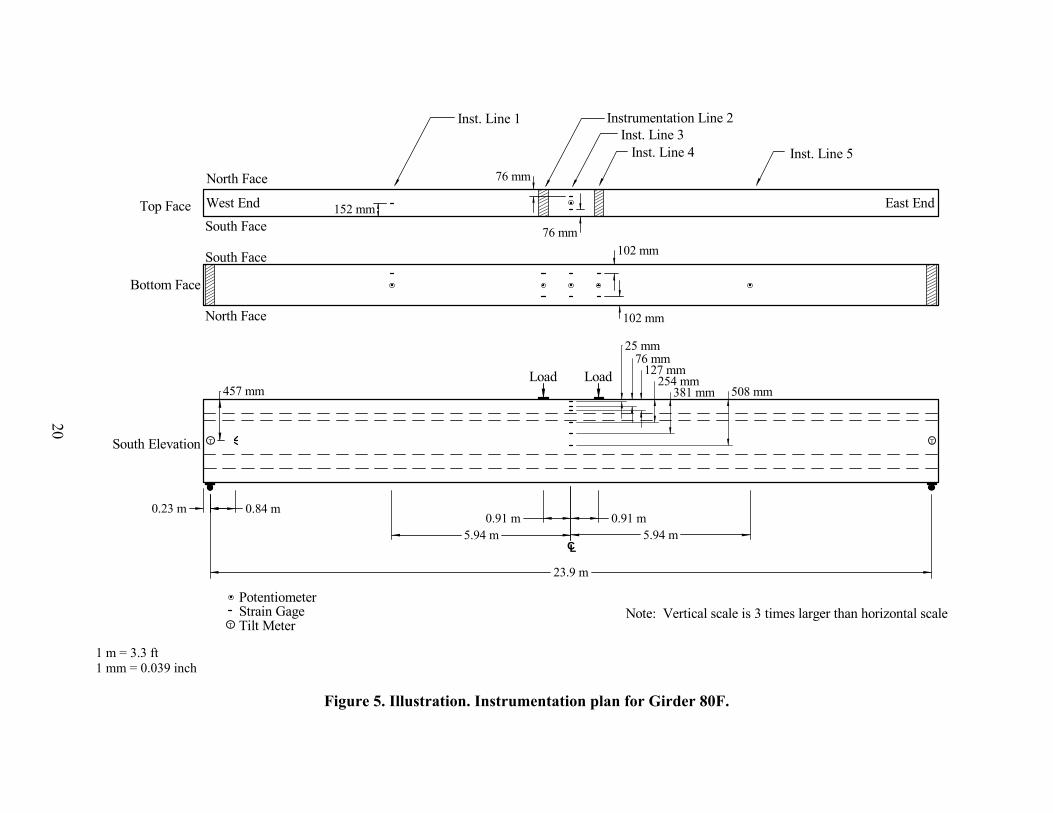
4.4.1 Girder 80F
Figure 5 shows the test setup and instrumentation plan for Girder 80F. The majority of the instrumentation was placed on the girder in one of five vertical instrumentation lines. The instrumentation lines (1 through 5) corresponded to the span quarter points (1 and 5), the load points (2 and 4), and the midspan (3).
Five potentiometers were attached to the bottom flange to measure vertical deflection of the girder at each instrumentation line. Tilt meters were located above the bearings at girder middepth to measure end rotation. Strain gages were attached to the top and bottom flange to measure compressive and tensile strains, respectively. The gages on the tensile flange were also used as indicators of tensile cracking behavior. Instrumentation Line 3, located at midspan, included six additional strain gages on both the north and south faces. The strain profile in the constant moment region between the load points was captured through these gages. The final strain gages were applied near the west bearing on the south face. A strain rosette was created from three strain gages to capture the shear strain behavior in a region experiencing minimal flexural influence.
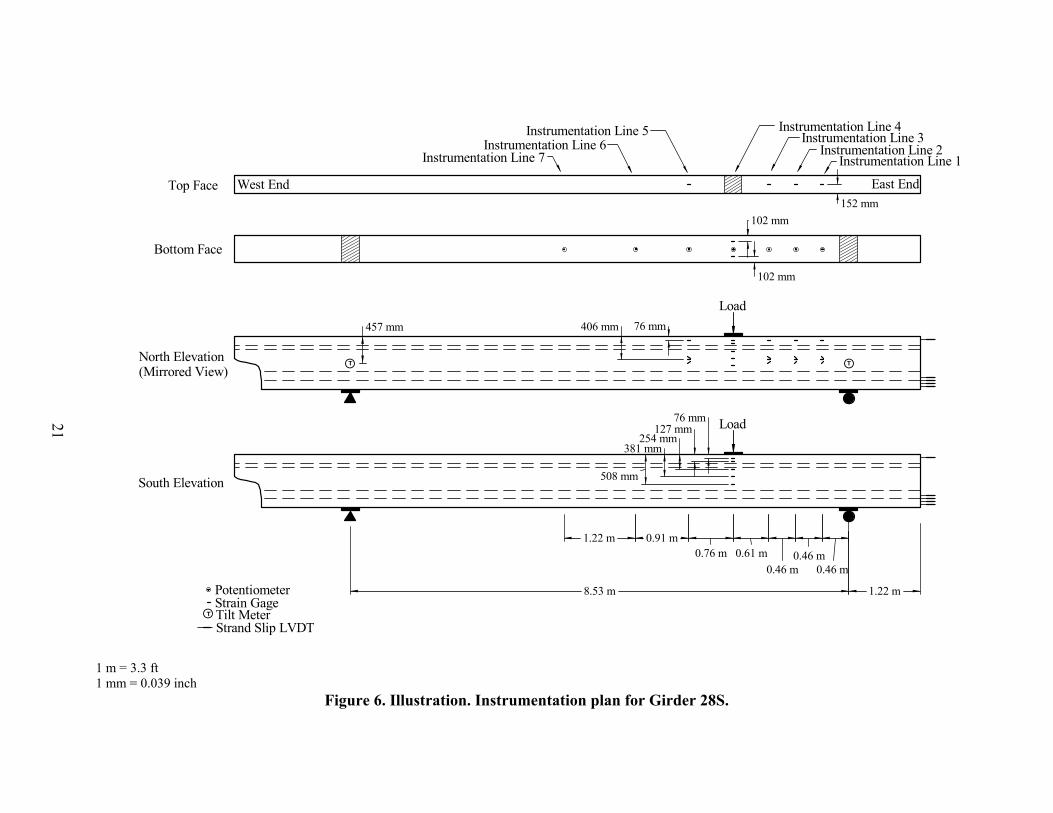
4.4.2 Girder 28S
Figure 6 shows the test setup and instrumentation plan for Girder 28S. Again, most instrumentation was located along seven vertical instrumentation lines. The instrumentation included seven potentiometers to capture the vertical deflection of the girder. Additionally, two tilt meters were located above the bearings at girder middepth to measure rotation. LVDTs were attached to half of the strands extending from the east end of the girder. The strands to the north of the vertical centerline were monitored and their designations are shown in figure 4.
20
1 m = 3.3 ft 1 mm = 0.039 inch
Figure 5. Illustration. Instrumentation plan for Girder 80F.
Load Load
23.9 m
0.91 m 0.91 m5.94 m
CL
0.84 m
Top Face
Bottom Face
South Elevation
West End East End152 mm
76 mm
76 mm
102 mm
102 mm
457 mm
25 mm
127 mm76 mm
254 mm381 mm
0.23 m
T T
T
5.94 m
PotentiometerStrain GageTilt Meter
South Face
North Face
South Face
North Face
Inst. Line 1 Instrumentation Line 2Inst. Line 3
Inst. Line 4 Inst. Line 5
508 mm
Note: Vertical scale is 3 times larger than horizontal scale
21
1 m = 3.3 ft 1 mm = 0.039 inch
Figure 6. Illustration. Instrumentation plan for Girder 28S.
West End East End
Load
Top Face
Bottom Face
South Elevation
PotentiometerStrain GageTilt MeterT
Load
North Elevation(Mirrored View)
T T
8.53 m 1.22 m
0.46 m0.46 m
0.46 m0.61 m0.76 m
0.91 m1.22 m
102 mm
102 mm
457 mm
76 mm127 mm
254 mm381 mm
508 mm
406 mm 76 mm
152 mm
Instrumentation Line 1Instrumentation Line 2
Instrumentation Line 3Instrumentation Line 4
Instrumentation Line 7Instrumentation Line 6
Instrumentation Line 5
Strand Slip LVDT
22
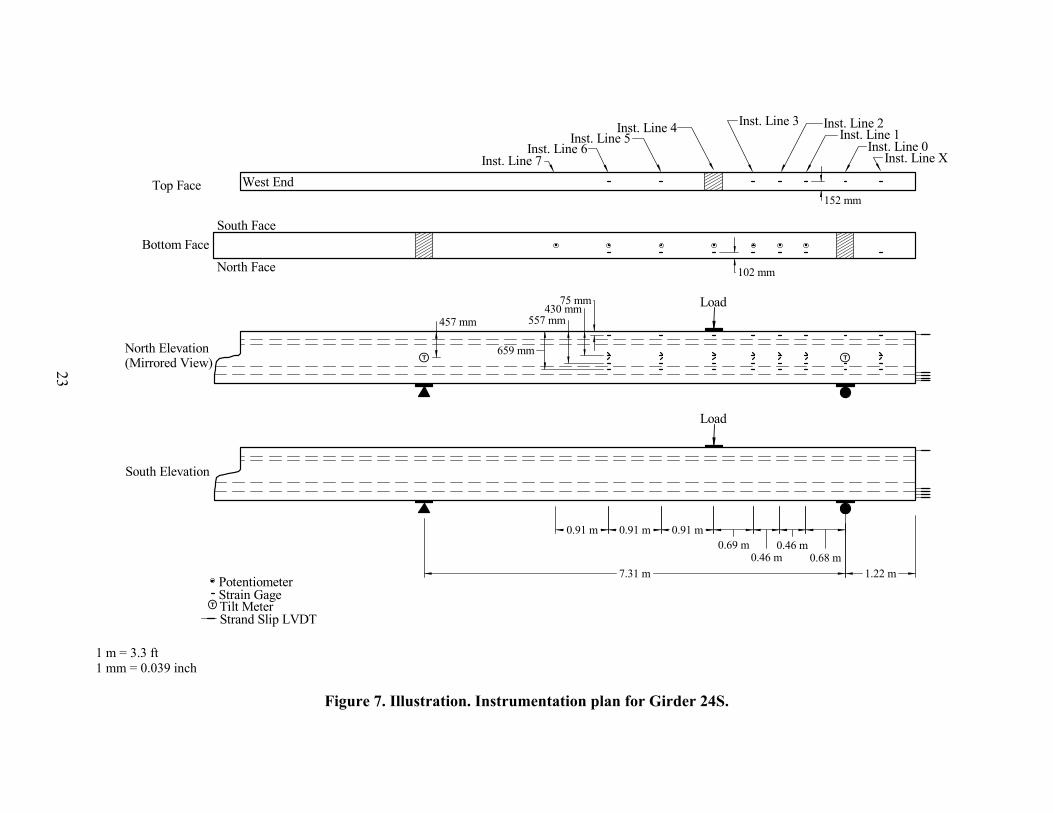
4.4.3 Girder 24S
Figure 7 shows the test setup and instrumentation plan for Girder 24S. The instrumentation plan for this test was similar to but more extensive than that implemented for the testing of Girder 28S. This change resulted from the behaviors observed during the testing of Girder 28S. Most instrumentation was located along nine vertical instrumentation lines (Instrumentation Lines X, 0, 1, …, 7). Note that Instrumentation Lines 1 through 7 are in similar locations in the previous test, while lines 0 and X are located above the east support and at midlength of the east end overhang.
Strain gages were used at various locations on the surface of the girder to monitor local tensile and compressive strains. Strain gages were applied to the top and bottom flanges to capture similar behaviors to those observed in the testing of Girder 80F. Gages were also applied along the depth of the cross section under the load point to capture the strain profile on the cross section. Four additional strain gages were applied to the north face of the top flange block to capture the compressive strains and to monitor the development of a compression strut as the test progressed. Finally, strain rosettes were created at three locations in the center of the web on the north face. These rosettes allowed for monitoring the principal compressive and tensile stresses in the web in both the shorter and longer shear spans.
Seven potentiometers were used to capture the vertical deflection behavior of the girder. Again, two potentiometers captured the rotation of the girder above the support points. In an identical fashion to the setup for the previous test, LVDTs were used to measure the strand slip.
Strain gages were placed on the top and bottom of the girder and on the north face to capture the axial and shear strain behavior. Seven rosettes were applied to the web in this test, with the additional rosettes capturing the strain behavior in the east overhang, at the load point, and farther into the longer shear span. Strain gages were again placed on the north face of the compression flange. Additional gages were placed along the transition at the bottom of the web. Cracking along this transition had influenced the girder behavior on the previous test, so these gages were intended to capture localized strain aberrations occurring across this plane at the base of the web.
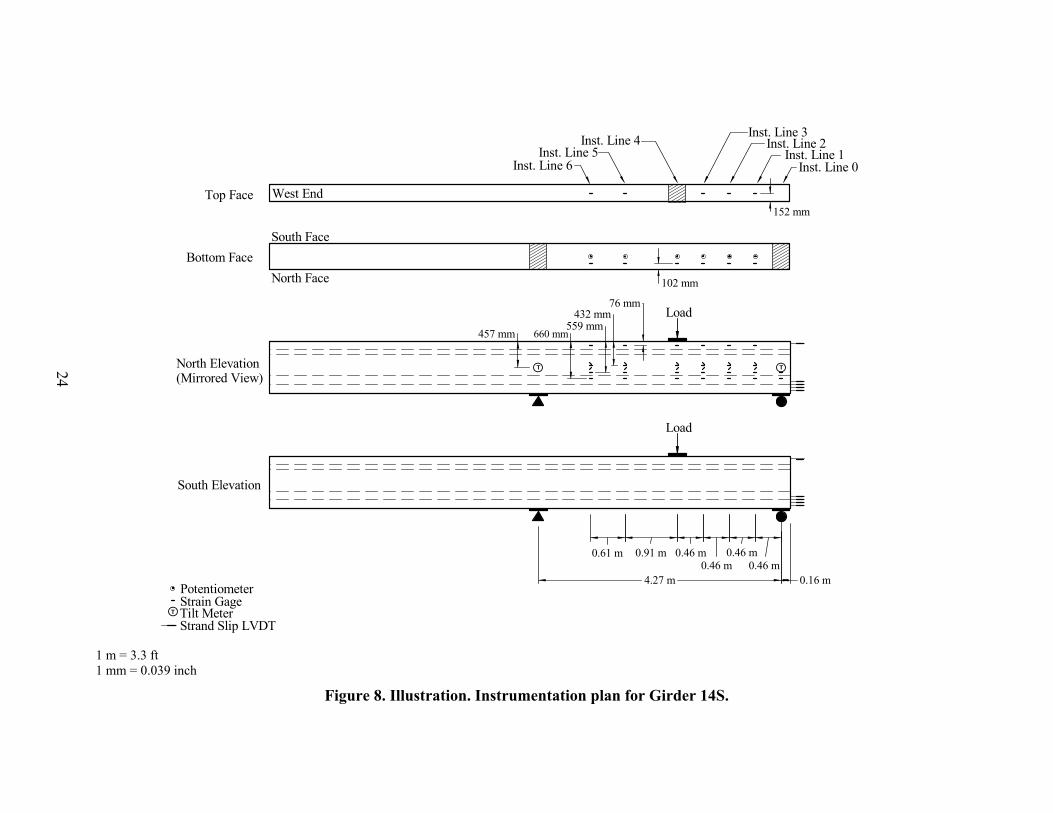
4.4.4 Girder 14S
Figure 8 shows the test setup and instrumentation plan for Girder 14S. This instrumentation plan was very similar to that implemented for Girder 24S. The primary difference is that the 1.22-m (4-ft) overhang on the east end was eliminated, thus so was Instrumentation Line X. In addition, Instrumentation Line 7 was eliminated due to the shorter overall span.
23
1 m = 3.3 ft 1 mm = 0.039 inch
Figure 7. Illustration. Instrumentation plan for Girder 24S.
West End
Load
Top Face
Bottom Face
South Elevation
PotentiometerStrain GageTilt MeterT
Load
North Elevation(Mirrored View) T T
7.31 m 1.22 m0.68 m
0.46 m0.46 m
0.69 m0.91 m0.91 m0.91 m
102 mm
457 mm
152 mm
Inst. Line 1Inst. Line 2Inst. Line 3Inst. Line 4
Inst. Line 5Inst. Line 6
Inst. Line 7
430 mm75 mm
557 mm
659 mm
Inst. Line XInst. Line 0
South Face
North Face
Strand Slip LVDT
24
1 m = 3.3 ft 1 mm = 0.039 inch
Figure 8. Illustration. Instrumentation plan for Girder 14S.
West End
Load
Top Face
Bottom Face
South Elevation
PotentiometerStrain GageTilt MeterT
Load
North Elevation(Mirrored View)
T T
4.27 m 0.16 m0.46 m
0.46 m0.46 m
0.46 m0.91 m0.61 m
102 mm
457 mm
152 mm
Inst. Line 1Inst. Line 2
Inst. Line 3Inst. Line 4Inst. Line 5
Inst. Line 6
432 mm76 mm
559 mm
Inst. Line 0
North Face
South Face
Strand Slip LVDT
660 mm
25
4.5 LOADING PROCEDURE
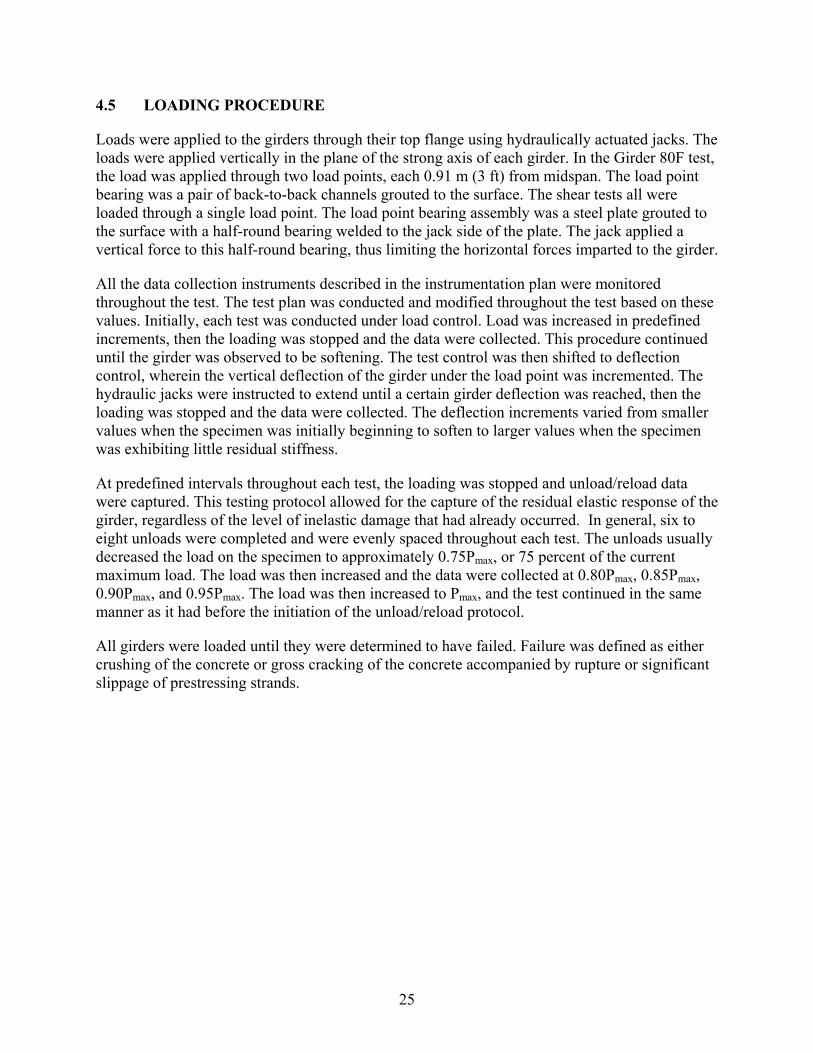
Loads were applied to the girders through their top flange using hydraulically actuated jacks. The loads were applied vertically in the plane of the strong axis of each girder. In the Girder 80F test, the load was applied through two load points, each 0.91 m (3 ft) from midspan. The load point bearing was a pair of back-to-back channels grouted to the surface. The shear tests all were loaded through a single load point. The load point bearing assembly was a steel plate grouted to the surface with a half-round bearing welded to the jack side of the plate. The jack applied a vertical force to this half-round bearing, thus limiting the horizontal forces imparted to the girder.
All the data collection instruments described in the instrumentation plan were monitored throughout the test. The test plan was conducted and modified throughout the test based on these values. Initially, each test was conducted under load control. Load was increased in predefined increments, then the loading was stopped and the data were collected. This procedure continued until the girder was observed to be softening. The test control was then shifted to deflection control, wherein the vertical deflection of the girder under the load point was incremented. The hydraulic jacks were instructed to extend until a certain girder deflection was reached, then the loading was stopped and the data were collected. The deflection increments varied from smaller values when the specimen was initially beginning to soften to larger values when the specimen was exhibiting little residual stiffness.
At predefined intervals throughout each test, the loading was stopped and unload/reload data were captured. This testing protocol allowed for the capture of the residual elastic response of the girder, regardless of the level of inelastic damage that had already occurred. In general, six to eight unloads were completed and were evenly spaced throughout each test. The unloads usually decreased the load on the specimen to approximately 0.75Pmax, or 75 percent of the current maximum load. The load was then increased and the data were collected at 0.80Pmax, 0.85Pmax, 0.90Pmax, and 0.95Pmax. The load was then increased to Pmax, and the test continued in the same manner as it had before the initiation of the unload/reload protocol.
All girders were loaded until they were determined to have failed. Failure was defined as either crushing of the concrete or gross cracking of the concrete accompanied by rupture or significant slippage of prestressing strands.


27
CHAPTER 5. UHPC GIRDER TEST RESULTS
This chapter presents detailed results from the four UHPC girder tests. The results from the flexure test on the 24.4-m (80-ft) AASHTO Type II girder are presented first, followed by the results from the three full-scale shear tests.
5.1 STATIC FLEXURAL TESTING
As discussed in chapter 4, Girder 80F was a 24.4-m (80-ft) AASHTO Type II prestressed girder. The girder was loaded in four-point bending by point loads located 0.91 m (3 ft) from the centerline and by roller supports located 12.0 m (39.25 ft) from the centerline. The girder contained twenty-six 12.7-mm, 1860-MPa (0.5-inch, 270-ksi), low-relaxation strands and no mild steel.
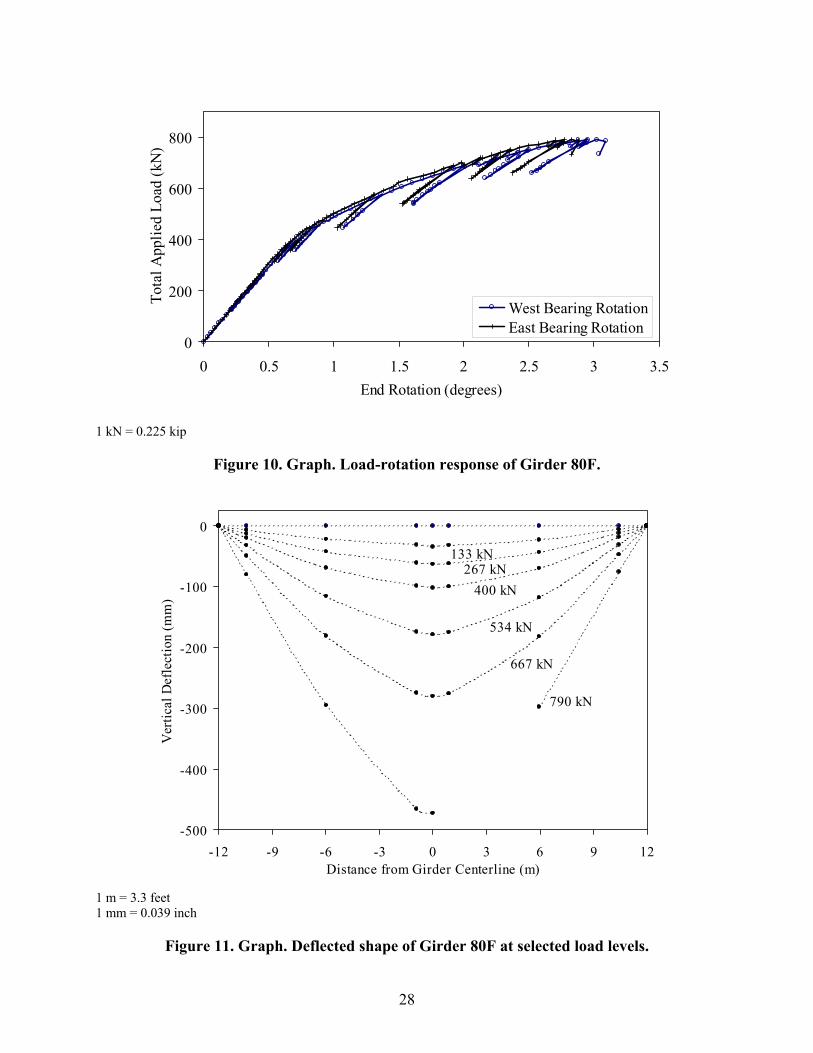
Figure 9 shows the applied load versus the vertical deflection response for this girder. The deflection is measured from the girder’s bottom flange at the midspan centerline. The load-deflection response shows that the girder began to soften between 310 and 355 kN (70 and 80 kips) at a deflection of approximately 75 mm (3 inches). The girder exhibited significant additional capacity, reaching a peak load of 790 kN (178 kips) at a deflection of 470 mm (18.5 inches). A similar response can be observed in figure 10, which shows the applied load versus rotation at the girder support. Figure 11 provides a plot of the deflected shape of the girder at seven load steps throughout the test. Note that the data points closest to the supports were derived from the support rotation values.
1 mm = 0.039 inch 1 kN = 0.225 kip
Figure 9. Graph. Load versus midspan deflection response of Girder 80F.
0
200
400
600
800
0 100 200 300 400 500Deflection (mm)
App
lied
Load
(kN
)
Peak Load = 790 kN
28
1 kN = 0.225 kip
Figure 10. Graph. Load-rotation response of Girder 80F.
1 m = 3.3 feet 1 mm = 0.039 inch
Figure 11. Graph. Deflected shape of Girder 80F at selected load levels.
-500
-400
-300
-200
-100
0
-12 -9 -6 -3 0 3 6 9 12Distance from Girder Centerline (m)
Ver
tical
Def
lect
ion
(mm
)
790 kN
667 kN
534 kN
400 kN267 kN
133 kN
0
200
400
600
800
0 0.5 1 1.5 2 2.5 3 3.5End Rotation (degrees)
Tota
l App
lied
Load
(kN
)
West Bearing RotationEast Bearing Rotation
29
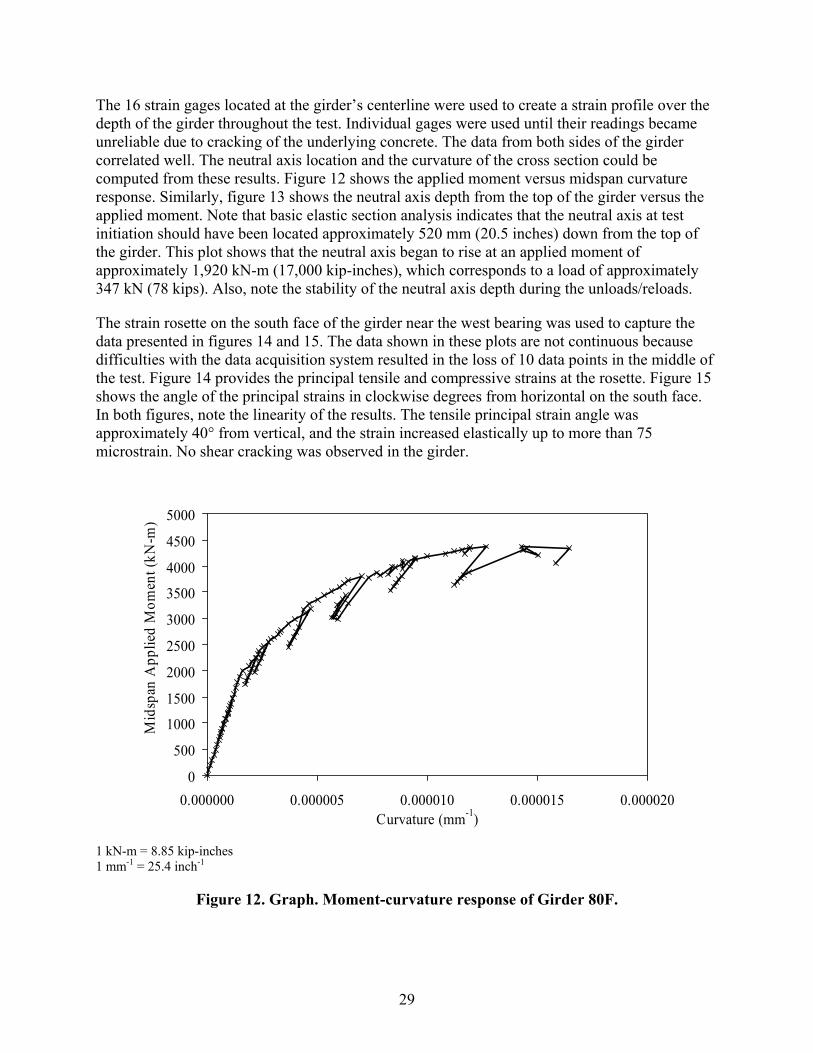
The 16 strain gages located at the girder’s centerline were used to create a strain profile over the depth of the girder throughout the test. Individual gages were used until their readings became unreliable due to cracking of the underlying concrete. The data from both sides of the girder correlated well. The neutral axis location and the curvature of the cross section could be computed from these results. Figure 12 shows the applied moment versus midspan curvature response. Similarly, figure 13 shows the neutral axis depth from the top of the girder versus the applied moment. Note that basic elastic section analysis indicates that the neutral axis at test initiation should have been located approximately 520 mm (20.5 inches) down from the top of the girder. This plot shows that the neutral axis began to rise at an applied moment of approximately 1,920 kN-m (17,000 kip-inches), which corresponds to a load of approximately 347 kN (78 kips). Also, note the stability of the neutral axis depth during the unloads/reloads.
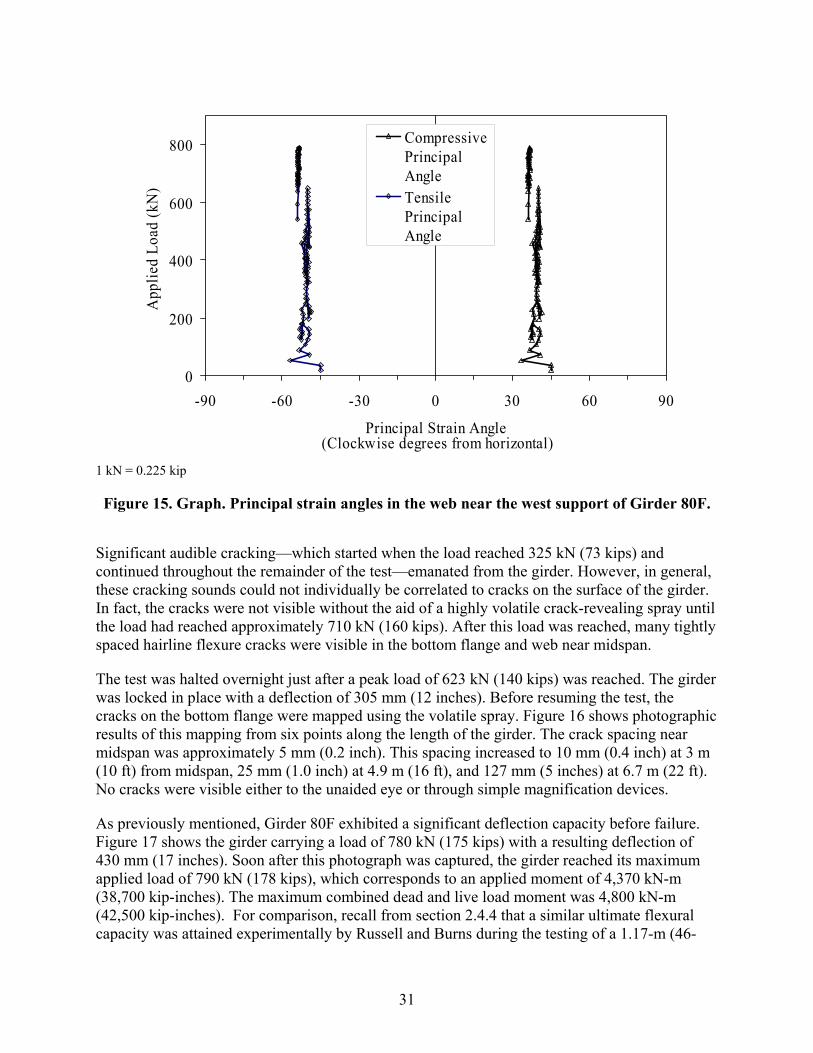
The strain rosette on the south face of the girder near the west bearing was used to capture the data presented in figures 14 and 15. The data shown in these plots are not continuous because difficulties with the data acquisition system resulted in the loss of 10 data points in the middle of the test. Figure 14 provides the principal tensile and compressive strains at the rosette. Figure 15 shows the angle of the principal strains in clockwise degrees from horizontal on the south face. In both figures, note the linearity of the results. The tensile principal strain angle was approximately 40° from vertical, and the strain increased elastically up to more than 75 microstrain. No shear cracking was observed in the girder.
1 kN-m = 8.85 kip-inches 1 mm-1 = 25.4 inch-1
Figure 12. Graph. Moment-curvature response of Girder 80F.
0
500
1000
1500
2000
2500
3000
3500
4000
4500
5000
0.000000 0.000005 0.000010 0.000015 0.000020Curvature (mm-1)
Mid
span
App
lied
Mom
ent (
kN-m
)

30
1 mm = 0.039 inch 1 kN-m = 8.85 kip-inches
Figure 13. Graph. Midspan neutral axis depth from the top of Girder 80F.
1 kN = 0.225 kip
Figure 14. Graph. Principal strains in the web near the west support of Girder 80F.
0
100
200
300
400
500
6000 1000 2000 3000 4000 5000
Midspan Applied Moment (kN-m)
Neu
tral A
xis
Dep
th (m
m)
0
200
400
600
800
-120 -90 -60 -30 0 30 60 90 120Microstrain
App
lied
Load
(kN
)
Tensile Principal StrainCompressive Principal Strain
31
1 kN = 0.225 kip
Figure 15. Graph. Principal strain angles in the web near the west support of Girder 80F.
Significant audible cracking—which started when the load reached 325 kN (73 kips) and continued throughout the remainder of the test—emanated from the girder. However, in general, these cracking sounds could not individually be correlated to cracks on the surface of the girder. In fact, the cracks were not visible without the aid of a highly volatile crack-revealing spray until the load had reached approximately 710 kN (160 kips). After this load was reached, many tightly spaced hairline flexure cracks were visible in the bottom flange and web near midspan.
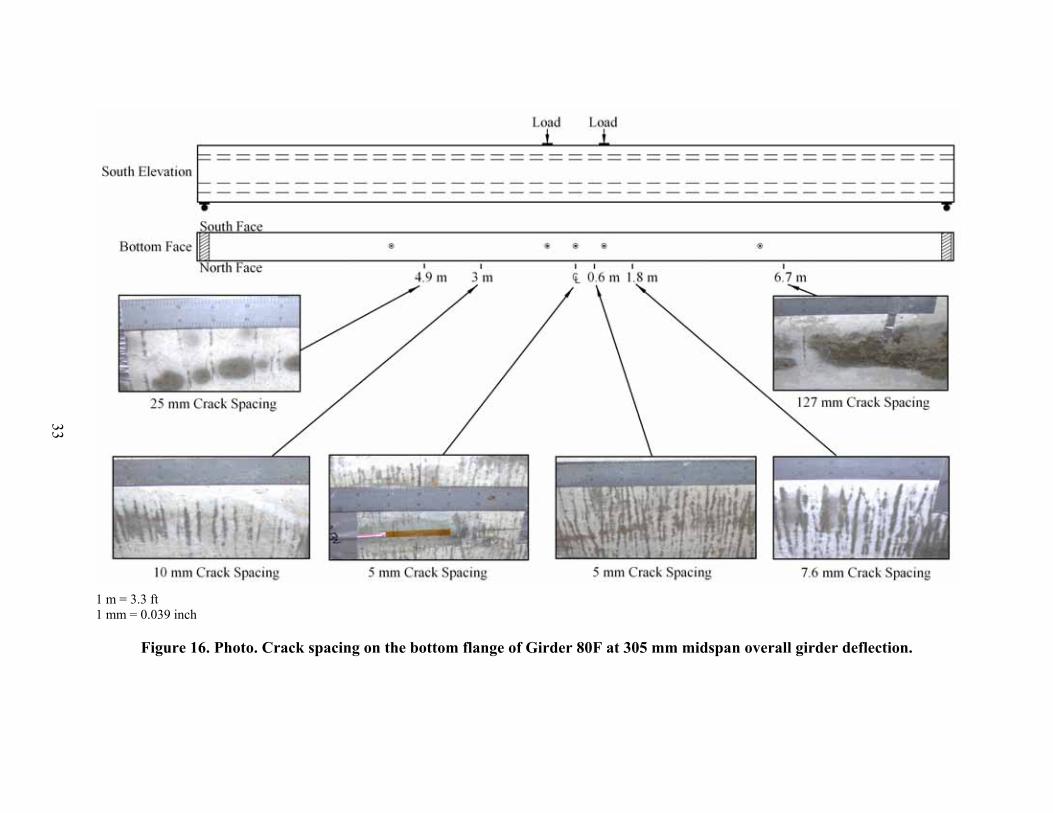
The test was halted overnight just after a peak load of 623 kN (140 kips) was reached. The girder was locked in place with a deflection of 305 mm (12 inches). Before resuming the test, the cracks on the bottom flange were mapped using the volatile spray. Figure 16 shows photographic results of this mapping from six points along the length of the girder. The crack spacing near midspan was approximately 5 mm (0.2 inch). This spacing increased to 10 mm (0.4 inch) at 3 m (10 ft) from midspan, 25 mm (1.0 inch) at 4.9 m (16 ft), and 127 mm (5 inches) at 6.7 m (22 ft). No cracks were visible either to the unaided eye or through simple magnification devices.
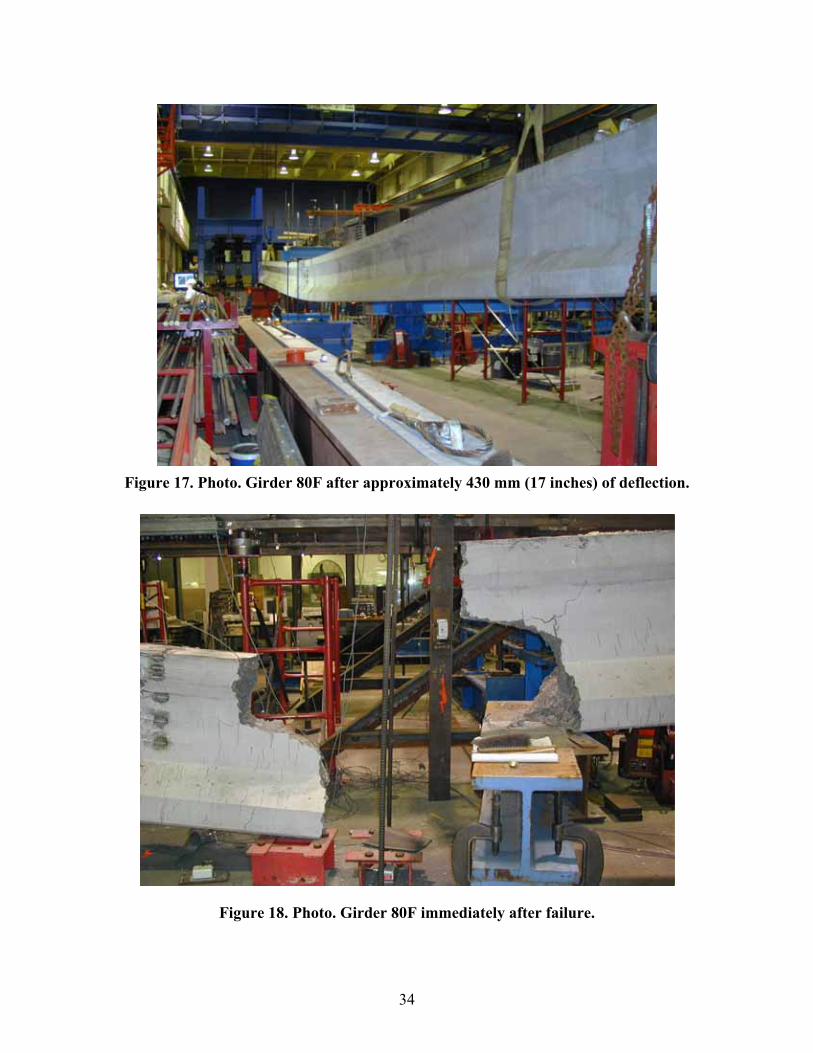
As previously mentioned, Girder 80F exhibited a significant deflection capacity before failure. Figure 17 shows the girder carrying a load of 780 kN (175 kips) with a resulting deflection of 430 mm (17 inches). Soon after this photograph was captured, the girder reached its maximum applied load of 790 kN (178 kips), which corresponds to an applied moment of 4,370 kN-m (38,700 kip-inches). The maximum combined dead and live load moment was 4,800 kN-m (42,500 kip-inches). For comparison, recall from section 2.4.4 that a similar ultimate flexural capacity was attained experimentally by Russell and Burns during the testing of a 1.17-m (46-
0
200
400
600
800
-90 -60 -30 0 30 60 90
Principal Strain Angle
App
lied
Load
(kN
)CompressivePrincipalAngleTensilePrincipalAngle
(Clockwise degrees from horizontal)

32
inch) deep decked I-girder.(15) That girder had a 41-MPa (6-ksi), 1.83-m (72-inch) wide top flange, and was prestressed with twenty-eight 12.7-mm (0.5-inch) strands.
After the maximum load was reached, the girder began to exhibit drastically decreased stiffness. The loading was stopped at this point. As the girder softened the load decreased, because the loading apparatus was hydraulically actuated. Approximately 1 minute before failure, a single gross crack was observed growing up from the bottom flange at the west load point. Unlike any other cracks in the girder, this crack was clearly visible to observers from a distance of 4.6 m (15 ft). Failure of the girder was dramatic, with the girder fracturing into two unconnected pieces. Failure occurred due to a combined tensile failure of the concrete matrix and the prestressing strands. At the failure location, the fibers pulled out and all the strands necked and ruptured. Figure 18 shows the north elevation after failure, and figure 19 shows the west failure surface.
33
1 m = 3.3 ft 1 mm = 0.039 inch
Figure 16. Photo. Crack spacing on the bottom flange of Girder 80F at 305 mm midspan overall girder deflection.
34
Figure 17. Photo. Girder 80F after approximately 430 mm (17 inches) of deflection.
Figure 18. Photo. Girder 80F immediately after failure.

35
Figure 19. Photo. Failure surface of Girder 80F including (a) overall west failure surface and
(b) closeup of west failure surface showing pulled-out fibers and necked strands.
(a) (b)
36
5.2 STATIC SHEAR TESTING
The results from three shear tests of full-scale AASHTO Type II prestressed UHPC girders are presented in this section.
5.2.1 Girder 28S
The first shear test was completed on Girder 28S. The test specimen had an overall span of 8.54 m (28 ft) and a shear span of 1.98 m (6.5 ft) resulting in a shear span-to-depth ratio of 2.17. The east bearing on this girder was placed 1.22 m (4 ft) from the end of the girder to minimize the effect that the debonding of the strands would have on the test results.
As shown in figure 3, Girder 28S was originally the west end of Girder 80F. Before the Girder 28S test, the girder was examined for damage that may have resulted from the Girder 80F test. Significant flexural cracking was observed toward the midspan of Girder 80F (i.e., the west end of Girder 28S). Additionally, a longitudinal hairline crack was observed along the base of the web that went from 0.3 m (1 ft) east of the east bearing to just west of the load point. This crack may have either occurred due to the failure of Girder 80F or during fabrication or shipping of the girder.
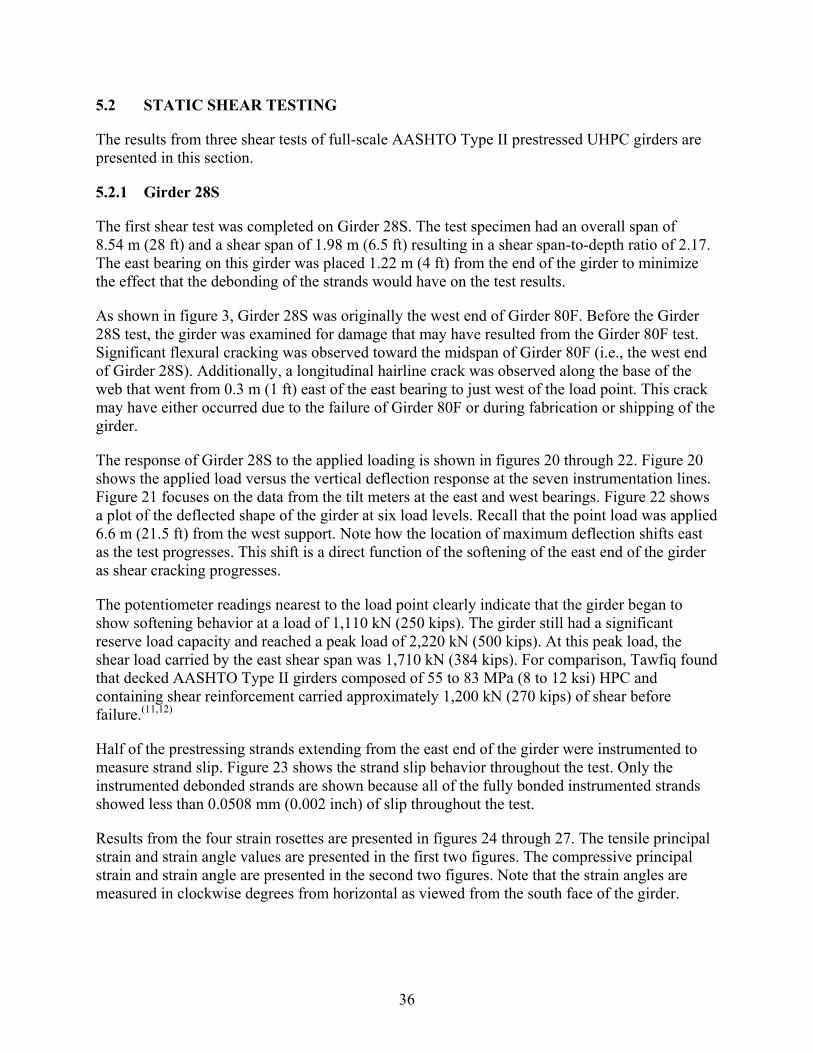
The response of Girder 28S to the applied loading is shown in figures 20 through 22. Figure 20 shows the applied load versus the vertical deflection response at the seven instrumentation lines. Figure 21 focuses on the data from the tilt meters at the east and west bearings. Figure 22 shows a plot of the deflected shape of the girder at six load levels. Recall that the point load was applied 6.6 m (21.5 ft) from the west support. Note how the location of maximum deflection shifts east as the test progresses. This shift is a direct function of the softening of the east end of the girder as shear cracking progresses.
The potentiometer readings nearest to the load point clearly indicate that the girder began to show softening behavior at a load of 1,110 kN (250 kips). The girder still had a significant reserve load capacity and reached a peak load of 2,220 kN (500 kips). At this peak load, the shear load carried by the east shear span was 1,710 kN (384 kips). For comparison, Tawfiq found that decked AASHTO Type II girders composed of 55 to 83 MPa (8 to 12 ksi) HPC and containing shear reinforcement carried approximately 1,200 kN (270 kips) of shear before failure.(11,12)
Half of the prestressing strands extending from the east end of the girder were instrumented to measure strand slip. Figure 23 shows the strand slip behavior throughout the test. Only the instrumented debonded strands are shown because all of the fully bonded instrumented strands showed less than 0.0508 mm (0.002 inch) of slip throughout the test.
Results from the four strain rosettes are presented in figures 24 through 27. The tensile principal strain and strain angle values are presented in the first two figures. The compressive principal strain and strain angle are presented in the second two figures. Note that the strain angles are measured in clockwise degrees from horizontal as viewed from the south face of the girder.

37
1 kN = 0.225 kip
Figure 20. Graph. Load-deflection response of Girder 28S.
1 kN = 0.225 kip
Figure 21. Graph. Bearing rotation response of Girder 28S.
0
400
800
1200
1600
2000
2400
0 5 10 15 20 25 30 35 40
Deflection (mm)
App
lied
Load
(kN
)
Pot 1 Pot 2Pot 3 Pot 4Pot 5 Pot 6Pot 7
0
400
800
1200
1600
2000
2400
0.0 0.1 0.2 0.3 0.4 0.5 0.6
Rotation (degrees)
App
lied
Load
(kN
)
East Bearing Rotation
WestBearing Rotation
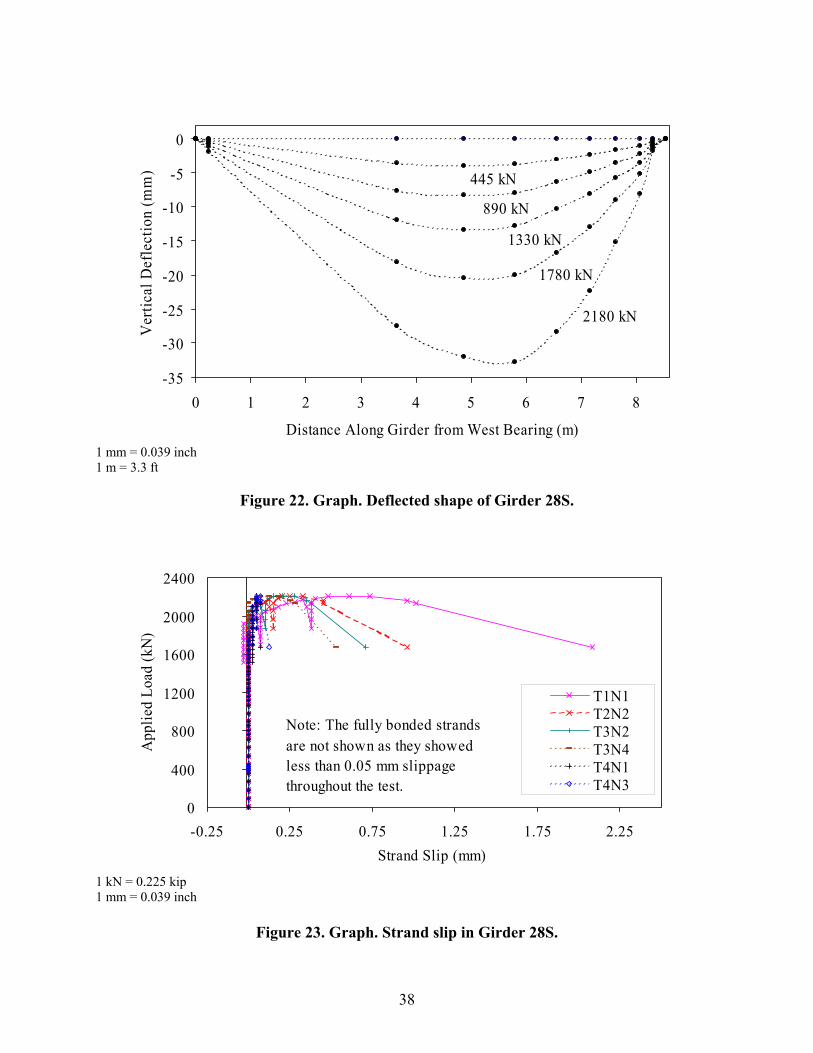
38
1 mm = 0.039 inch 1 m = 3.3 ft
Figure 22. Graph. Deflected shape of Girder 28S.
1 kN = 0.225 kip 1 mm = 0.039 inch
Figure 23. Graph. Strand slip in Girder 28S.
-35
-30
-25
-20
-15
-10
-5
0
0 1 2 3 4 5 6 7 8
Distance Along Girder from West Bearing (m)
Ver
tical
Def
lect
ion
(mm
)
2180 kN
1780 kN
1330 kN
890 kN
445 kN
0
400
800
1200
1600
2000
2400
-0.25 0.25 0.75 1.25 1.75 2.25Strand Slip (mm)
App
lied
Load
(kN
)
T1N1T2N2T3N2T3N4T4N1T4N3
Note: The fully bonded strands are not shown as they showed less than 0.05 mm slippage throughout the test.
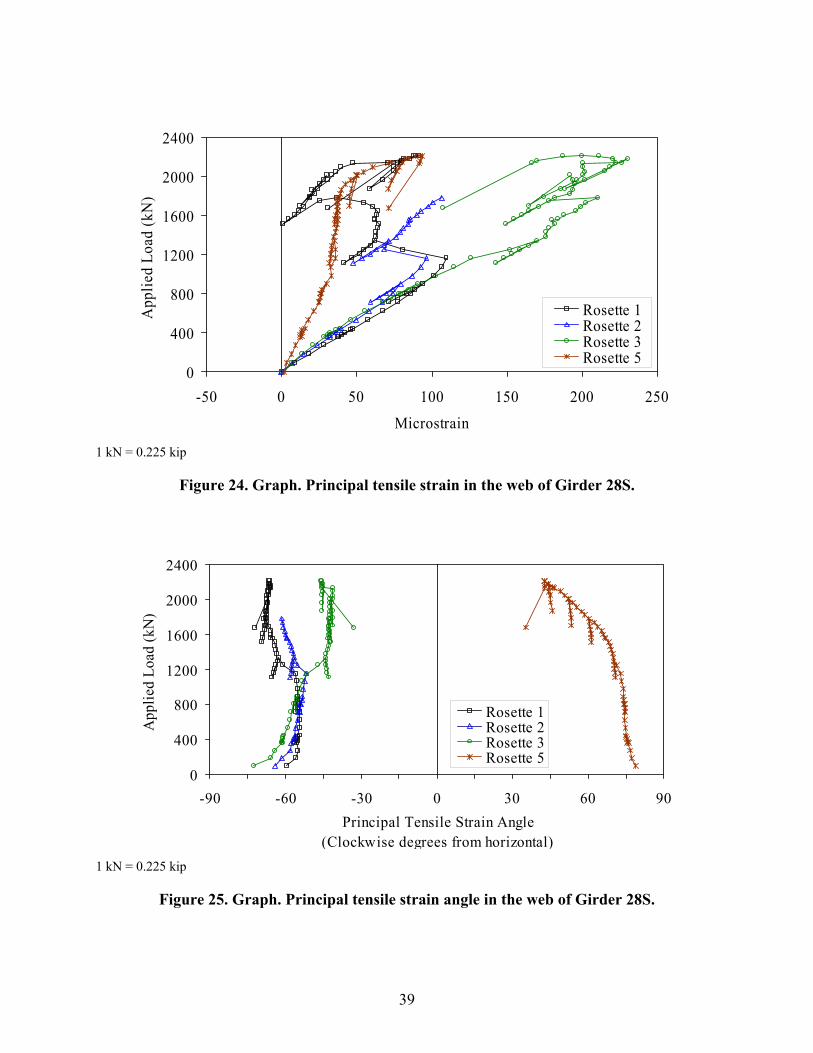
39
1 kN = 0.225 kip
Figure 24. Graph. Principal tensile strain in the web of Girder 28S.
1 kN = 0.225 kip
Figure 25. Graph. Principal tensile strain angle in the web of Girder 28S.
0
400
800
1200
1600
2000
2400
-50 0 50 100 150 200 250
Microstrain
App
lied
Load
(kN
)
Rosette 1Rosette 2Rosette 3Rosette 5
0
400
800
1200
1600
2000
2400
-90 -60 -30 0 30 60 90Principal Tensile Strain Angle
App
lied
Load
(kN
)
Rosette 1Rosette 2Rosette 3Rosette 5
(Clockwise degrees from horizontal)
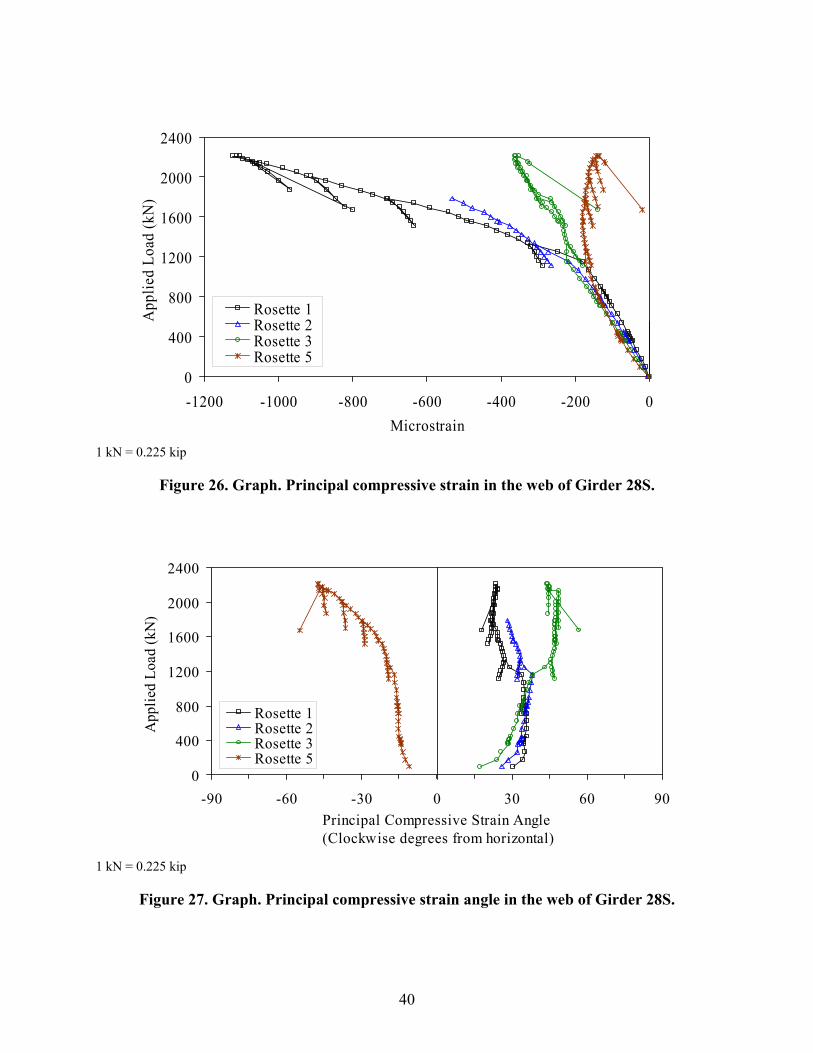
40
1 kN = 0.225 kip
Figure 26. Graph. Principal compressive strain in the web of Girder 28S.
1 kN = 0.225 kip
Figure 27. Graph. Principal compressive strain angle in the web of Girder 28S.
0
400
800
1200
1600
2000
2400
-1200 -1000 -800 -600 -400 -200 0Microstrain
App
lied
Load
(kN
)
Rosette 1Rosette 2Rosette 3Rosette 5
0
400
800
1200
1600
2000
2400
-90 -60 -30 0 30 60 90Principal Compressive Strain Angle
App
lied
Load
(kN
)
Rosette 1Rosette 2Rosette 3Rosette 5
(Clockwise degrees from horizontal)
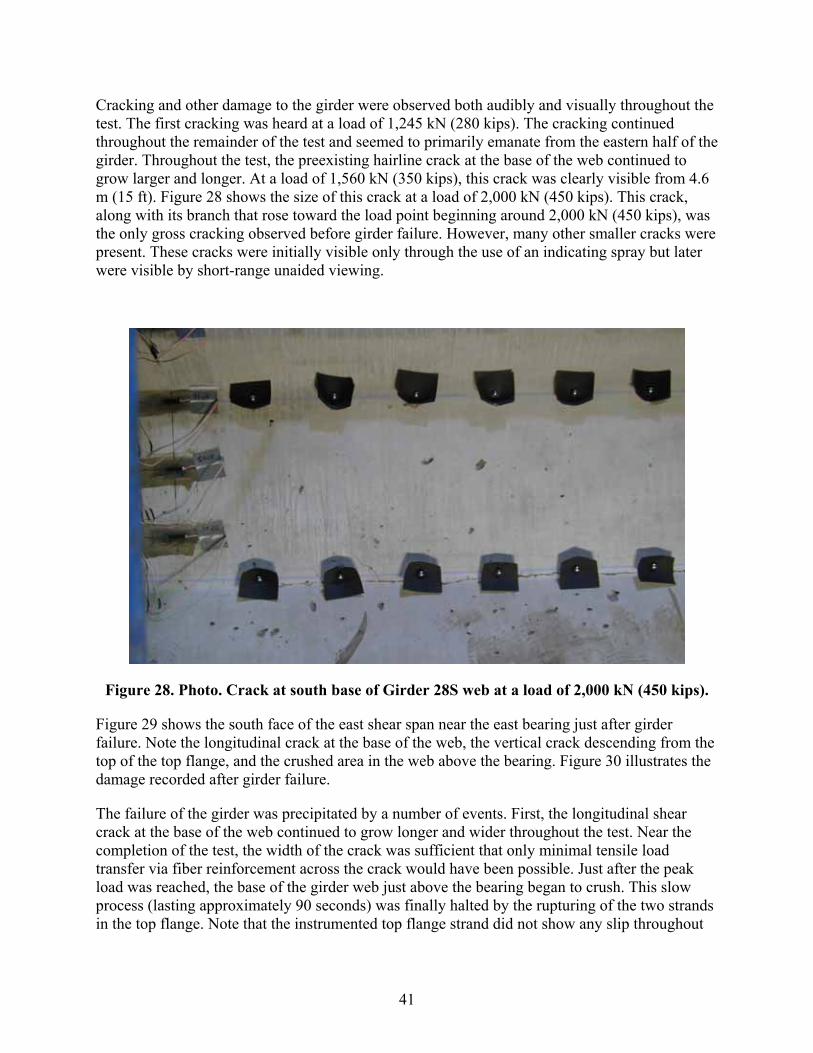
41
Cracking and other damage to the girder were observed both audibly and visually throughout the test. The first cracking was heard at a load of 1,245 kN (280 kips). The cracking continued throughout the remainder of the test and seemed to primarily emanate from the eastern half of the girder. Throughout the test, the preexisting hairline crack at the base of the web continued to grow larger and longer. At a load of 1,560 kN (350 kips), this crack was clearly visible from 4.6 m (15 ft). Figure 28 shows the size of this crack at a load of 2,000 kN (450 kips). This crack, along with its branch that rose toward the load point beginning around 2,000 kN (450 kips), was the only gross cracking observed before girder failure. However, many other smaller cracks were present. These cracks were initially visible only through the use of an indicating spray but later were visible by short-range unaided viewing.
Figure 28. Photo. Crack at south base of Girder 28S web at a load of 2,000 kN (450 kips).
Figure 29 shows the south face of the east shear span near the east bearing just after girder failure. Note the longitudinal crack at the base of the web, the vertical crack descending from the top of the top flange, and the crushed area in the web above the bearing. Figure 30 illustrates the damage recorded after girder failure.
The failure of the girder was precipitated by a number of events. First, the longitudinal shear crack at the base of the web continued to grow longer and wider throughout the test. Near the completion of the test, the width of the crack was sufficient that only minimal tensile load transfer via fiber reinforcement across the crack would have been possible. Just after the peak load was reached, the base of the girder web just above the bearing began to crush. This slow process (lasting approximately 90 seconds) was finally halted by the rupturing of the two strands in the top flange. Note that the instrumented top flange strand did not show any slip throughout
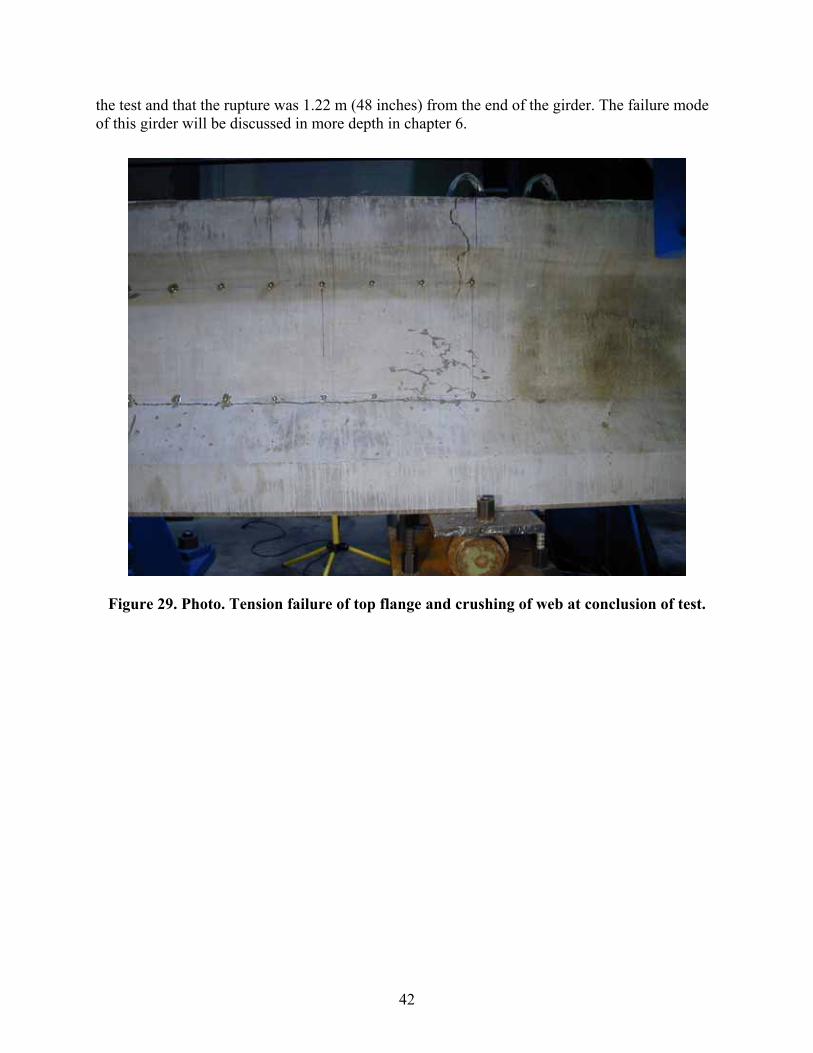
42
the test and that the rupture was 1.22 m (48 inches) from the end of the girder. The failure mode of this girder will be discussed in more depth in chapter 6.
Figure 29. Photo. Tension failure of top flange and crushing of web at conclusion of test.
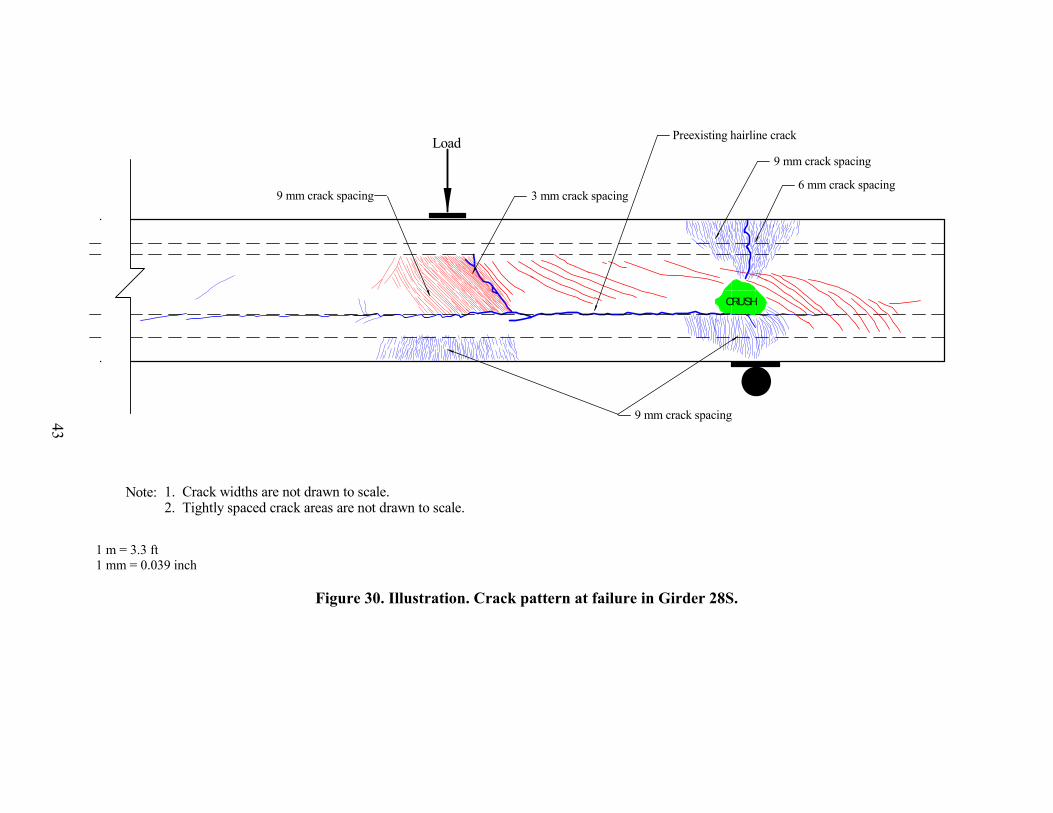
43
1 m = 3.3 ft 1 mm = 0.039 inch
Figure 30. Illustration. Crack pattern at failure in Girder 28S.
CRUSH
Load
9 mm crack spacing
6 mm crack spacing
9 mm crack spacing
3 mm crack spacing9 mm crack spacing
Note: 1. Crack widths are not drawn to scale.2. Tightly spaced crack areas are not drawn to scale.
Preexisting hairline crack
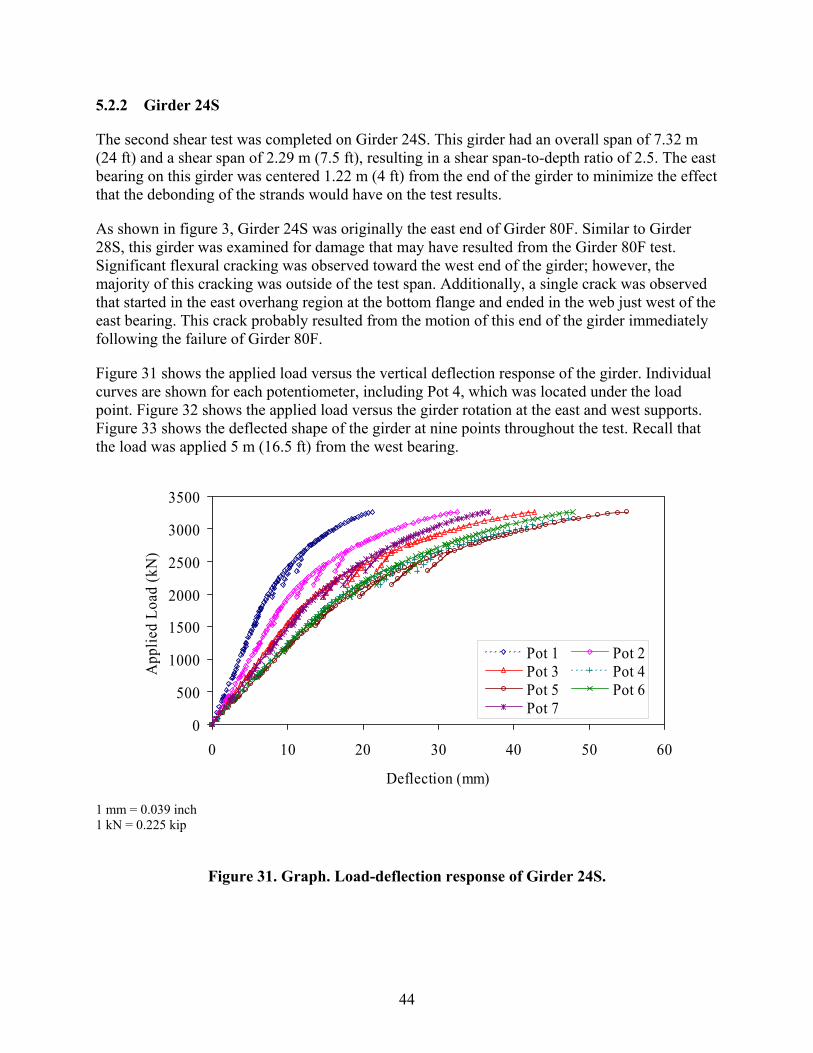
44
5.2.2 Girder 24S
The second shear test was completed on Girder 24S. This girder had an overall span of 7.32 m (24 ft) and a shear span of 2.29 m (7.5 ft), resulting in a shear span-to-depth ratio of 2.5. The east bearing on this girder was centered 1.22 m (4 ft) from the end of the girder to minimize the effect that the debonding of the strands would have on the test results.
As shown in figure 3, Girder 24S was originally the east end of Girder 80F. Similar to Girder 28S, this girder was examined for damage that may have resulted from the Girder 80F test. Significant flexural cracking was observed toward the west end of the girder; however, the majority of this cracking was outside of the test span. Additionally, a single crack was observed that started in the east overhang region at the bottom flange and ended in the web just west of the east bearing. This crack probably resulted from the motion of this end of the girder immediately following the failure of Girder 80F.
Figure 31 shows the applied load versus the vertical deflection response of the girder. Individual curves are shown for each potentiometer, including Pot 4, which was located under the load point. Figure 32 shows the applied load versus the girder rotation at the east and west supports. Figure 33 shows the deflected shape of the girder at nine points throughout the test. Recall that the load was applied 5 m (16.5 ft) from the west bearing.
1 mm = 0.039 inch 1 kN = 0.225 kip
Figure 31. Graph. Load-deflection response of Girder 24S.
0
500
1000
1500
2000
2500
3000
3500
0 10 20 30 40 50 60
Deflection (mm)
App
lied
Load
(kN
)
Pot 1 Pot 2Pot 3 Pot 4Pot 5 Pot 6Pot 7
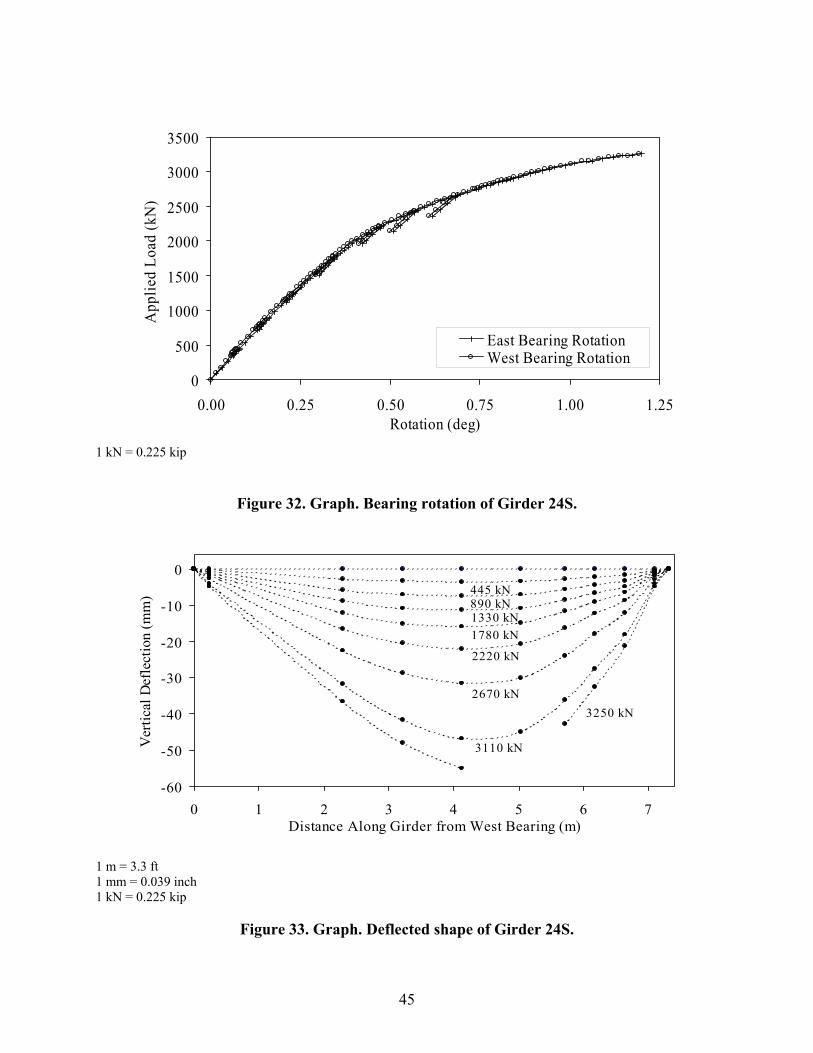
45
1 kN = 0.225 kip
Figure 32. Graph. Bearing rotation of Girder 24S.
1 m = 3.3 ft 1 mm = 0.039 inch 1 kN = 0.225 kip
Figure 33. Graph. Deflected shape of Girder 24S.
0
500
1000
1500
2000
2500
3000
3500
0.00 0.25 0.50 0.75 1.00 1.25Rotation (deg)
App
lied
Load
(kN
)
East Bearing RotationWest Bearing Rotation
-60
-50
-40
-30
-20
-10
0
0 1 2 3 4 5 6 7Distance Along Girder from West Bearing (m)
Ver
tical
Def
lect
ion
(mm
)
3250 kN
3110 kN
2670 kN
2220 kN
1780 kN1330 kN890 kN445 kN
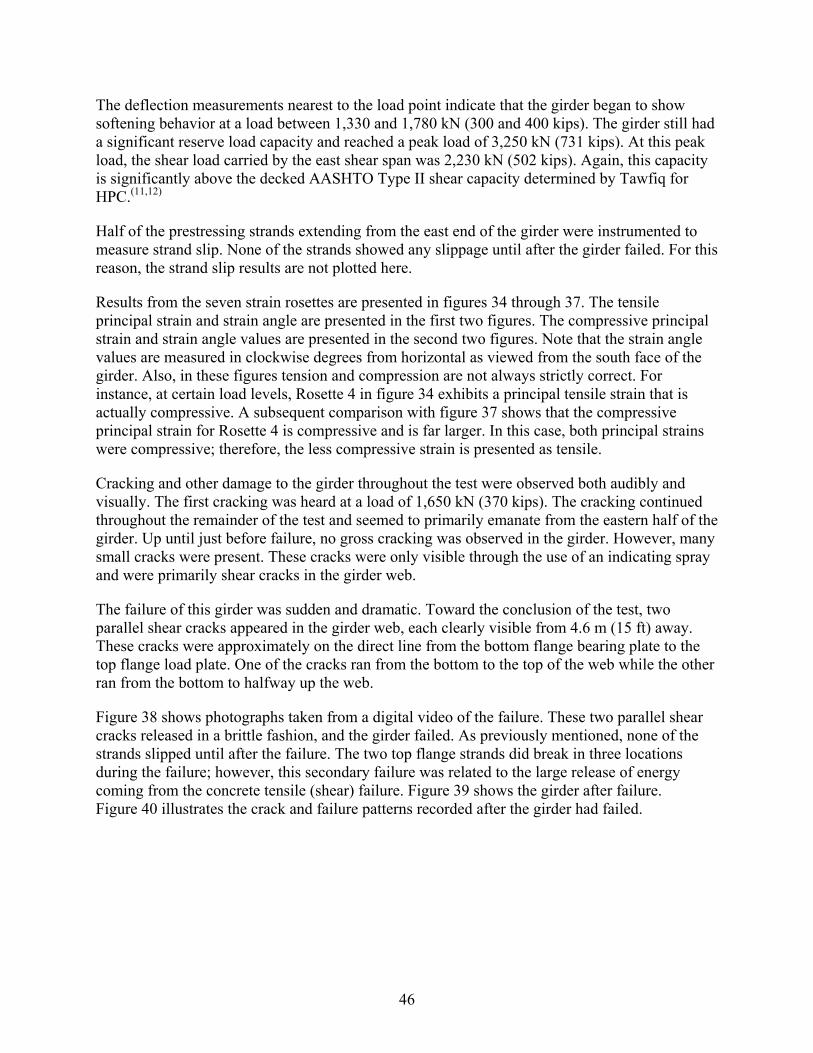
46
The deflection measurements nearest to the load point indicate that the girder began to show softening behavior at a load between 1,330 and 1,780 kN (300 and 400 kips). The girder still had a significant reserve load capacity and reached a peak load of 3,250 kN (731 kips). At this peak load, the shear load carried by the east shear span was 2,230 kN (502 kips). Again, this capacity is significantly above the decked AASHTO Type II shear capacity determined by Tawfiq for HPC.(11,12)
Half of the prestressing strands extending from the east end of the girder were instrumented to measure strand slip. None of the strands showed any slippage until after the girder failed. For this reason, the strand slip results are not plotted here.
Results from the seven strain rosettes are presented in figures 34 through 37. The tensile principal strain and strain angle are presented in the first two figures. The compressive principal strain and strain angle values are presented in the second two figures. Note that the strain angle values are measured in clockwise degrees from horizontal as viewed from the south face of the girder. Also, in these figures tension and compression are not always strictly correct. For instance, at certain load levels, Rosette 4 in figure 34 exhibits a principal tensile strain that is actually compressive. A subsequent comparison with figure 37 shows that the compressive principal strain for Rosette 4 is compressive and is far larger. In this case, both principal strains were compressive; therefore, the less compressive strain is presented as tensile.
Cracking and other damage to the girder throughout the test were observed both audibly and visually. The first cracking was heard at a load of 1,650 kN (370 kips). The cracking continued throughout the remainder of the test and seemed to primarily emanate from the eastern half of the girder. Up until just before failure, no gross cracking was observed in the girder. However, many small cracks were present. These cracks were only visible through the use of an indicating spray and were primarily shear cracks in the girder web.
The failure of this girder was sudden and dramatic. Toward the conclusion of the test, two parallel shear cracks appeared in the girder web, each clearly visible from 4.6 m (15 ft) away. These cracks were approximately on the direct line from the bottom flange bearing plate to the top flange load plate. One of the cracks ran from the bottom to the top of the web while the other ran from the bottom to halfway up the web.
Figure 38 shows photographs taken from a digital video of the failure. These two parallel shear cracks released in a brittle fashion, and the girder failed. As previously mentioned, none of the strands slipped until after the failure. The two top flange strands did break in three locations during the failure; however, this secondary failure was related to the large release of energy coming from the concrete tensile (shear) failure. Figure 39 shows the girder after failure. Figure 40 illustrates the crack and failure patterns recorded after the girder had failed.

47
1 kN = 0.225 kip
Figure 34. Graph. Principal tensile strain in the web of Girder 24S.
1 kN = 0.225 kip
Figure 35. Graph. Principal tensile strain angle in the web of Girder 24S.
0
500
1000
1500
2000
2500
3000
3500
-200 0 200 400 600 800 1000 1200 1400 1600 1800 2000Microstrain
App
lied
Load
(kN
)
Rosette X Rosette 1Rosette 2 Rosette 3Rosette 4 Rosette 5Rosette 6
0
500
1000
1500
2000
2500
3000
3500
-90 -60 -30 0 30 60 90Principal Tensile Strain Angle
App
lied
Load
(kN
)
Rosette X Rosette 1Rosette 2 Rosette 3Rosette 4 Rosette 5Rosette 6
(Clockwise degrees from horizontal)
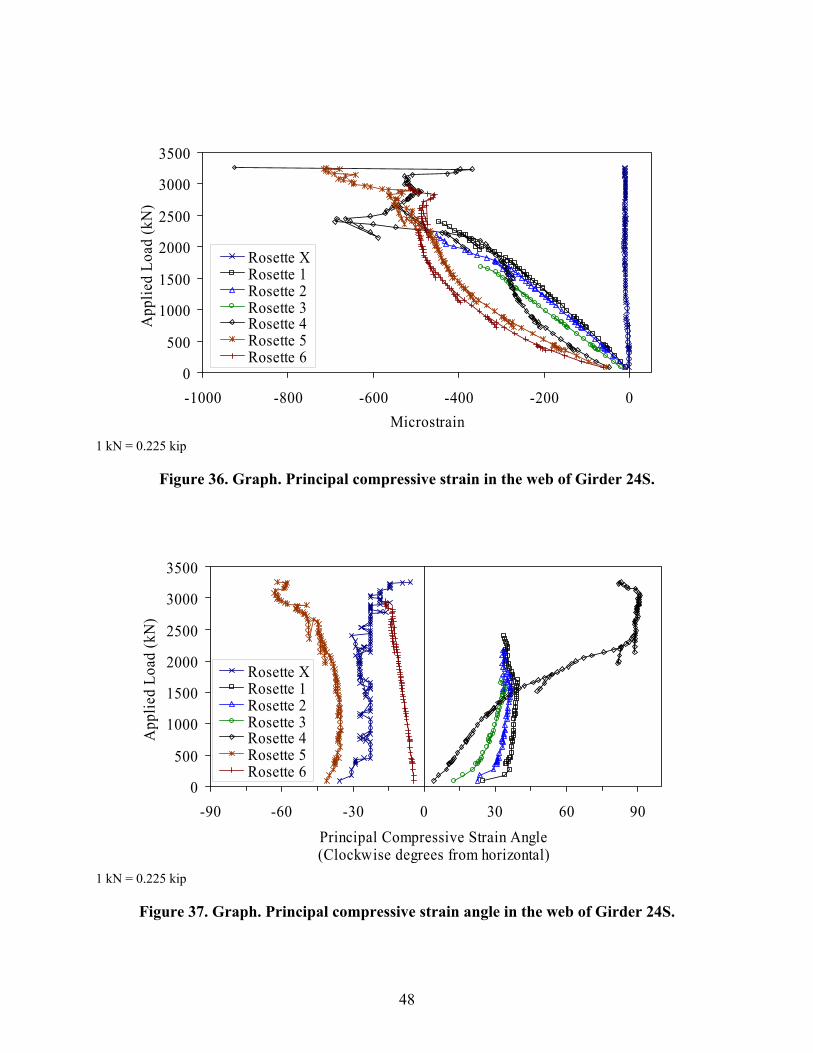
48
1 kN = 0.225 kip
Figure 36. Graph. Principal compressive strain in the web of Girder 24S.
1 kN = 0.225 kip
Figure 37. Graph. Principal compressive strain angle in the web of Girder 24S.
0
500
1000
1500
2000
2500
3000
3500
-1000 -800 -600 -400 -200 0Microstrain
App
lied
Load
(kN
)
Rosette XRosette 1Rosette 2Rosette 3Rosette 4Rosette 5Rosette 6
0
500
1000
1500
2000
2500
3000
3500
-90 -60 -30 0 30 60 90Principal Compressive Strain Angle
App
lied
Load
(kN
)
Rosette XRosette 1Rosette 2Rosette 3Rosette 4Rosette 5Rosette 6
(Clockwise degrees from horizontal)
49
Figure 38. Photo. Failure of Girder 24S (a) 1/15 second before failure, (b) 1/30 second before failure, (c) at failure, and (d) 1/30 second after failure.
(a) (b)
(d) (c)
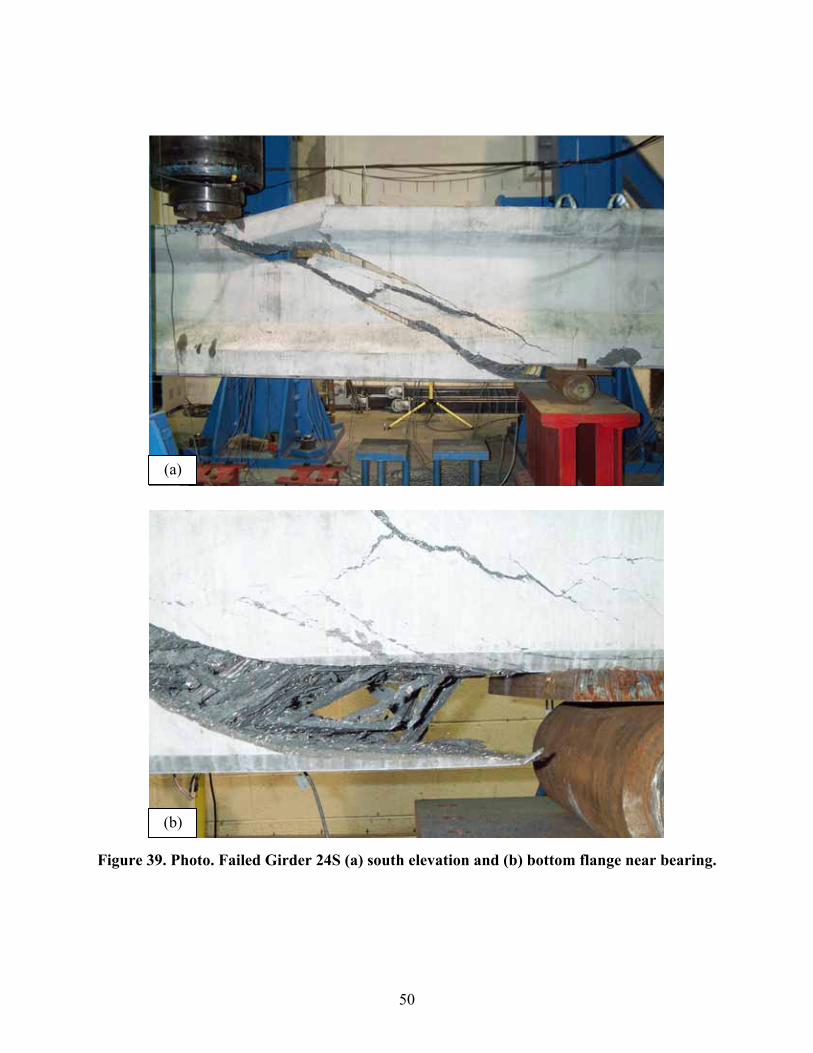
50
Figure 39. Photo. Failed Girder 24S (a) south elevation and (b) bottom flange near bearing.
(b)
(a)

51
1 mm = 0.039 inch
Figure 40. Illustration. Crack pattern at failure in Girder 24S.
Load
Note: 1. Crack widths are not drawn to scale.2. Tightly spaced crack areas are not drawn to scale.
3 mm crack spacing
6 mm crack spacing
18 mm crack spacing
Initial failure surfaceSubsequent failure surface
Subsequent failure surface
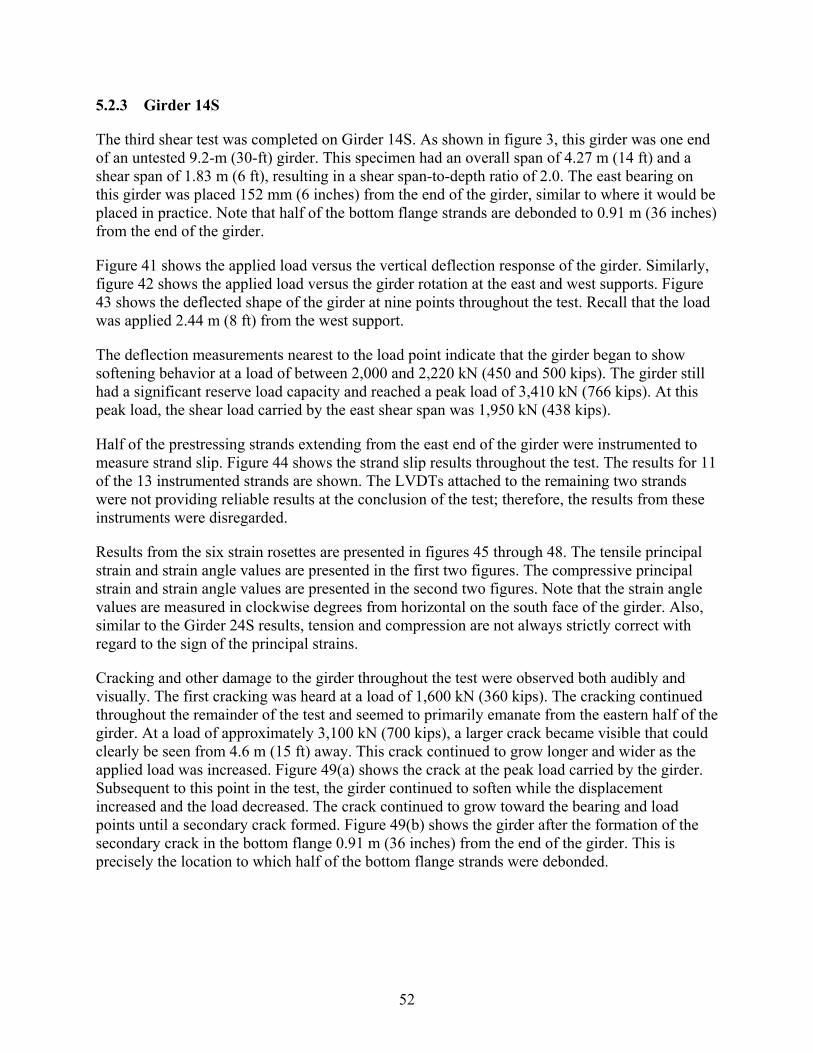
52
5.2.3 Girder 14S
The third shear test was completed on Girder 14S. As shown in figure 3, this girder was one end of an untested 9.2-m (30-ft) girder. This specimen had an overall span of 4.27 m (14 ft) and a shear span of 1.83 m (6 ft), resulting in a shear span-to-depth ratio of 2.0. The east bearing on this girder was placed 152 mm (6 inches) from the end of the girder, similar to where it would be placed in practice. Note that half of the bottom flange strands are debonded to 0.91 m (36 inches) from the end of the girder.
Figure 41 shows the applied load versus the vertical deflection response of the girder. Similarly, figure 42 shows the applied load versus the girder rotation at the east and west supports. Figure 43 shows the deflected shape of the girder at nine points throughout the test. Recall that the load was applied 2.44 m (8 ft) from the west support.
The deflection measurements nearest to the load point indicate that the girder began to show softening behavior at a load of between 2,000 and 2,220 kN (450 and 500 kips). The girder still had a significant reserve load capacity and reached a peak load of 3,410 kN (766 kips). At this peak load, the shear load carried by the east shear span was 1,950 kN (438 kips).
Half of the prestressing strands extending from the east end of the girder were instrumented to measure strand slip. Figure 44 shows the strand slip results throughout the test. The results for 11 of the 13 instrumented strands are shown. The LVDTs attached to the remaining two strands were not providing reliable results at the conclusion of the test; therefore, the results from these instruments were disregarded.
Results from the six strain rosettes are presented in figures 45 through 48. The tensile principal strain and strain angle values are presented in the first two figures. The compressive principal strain and strain angle values are presented in the second two figures. Note that the strain angle values are measured in clockwise degrees from horizontal on the south face of the girder. Also, similar to the Girder 24S results, tension and compression are not always strictly correct with regard to the sign of the principal strains.
Cracking and other damage to the girder throughout the test were observed both audibly and visually. The first cracking was heard at a load of 1,600 kN (360 kips). The cracking continued throughout the remainder of the test and seemed to primarily emanate from the eastern half of the girder. At a load of approximately 3,100 kN (700 kips), a larger crack became visible that could clearly be seen from 4.6 m (15 ft) away. This crack continued to grow longer and wider as the applied load was increased. Figure 49(a) shows the crack at the peak load carried by the girder. Subsequent to this point in the test, the girder continued to soften while the displacement increased and the load decreased. The crack continued to grow toward the bearing and load points until a secondary crack formed. Figure 49(b) shows the girder after the formation of the secondary crack in the bottom flange 0.91 m (36 inches) from the end of the girder. This is precisely the location to which half of the bottom flange strands were debonded.
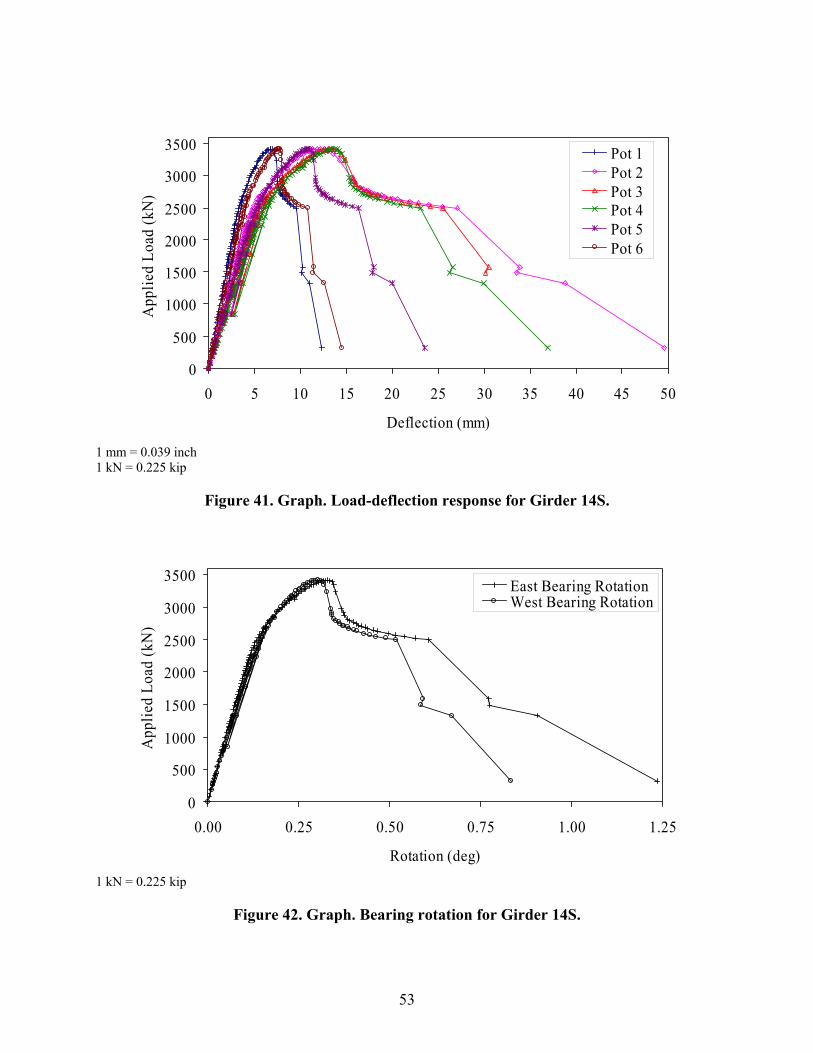
53
1 mm = 0.039 inch 1 kN = 0.225 kip
Figure 41. Graph. Load-deflection response for Girder 14S.
1 kN = 0.225 kip
Figure 42. Graph. Bearing rotation for Girder 14S.
0
500
1000
1500
2000
2500
3000
3500
0 5 10 15 20 25 30 35 40 45 50
Deflection (mm)
App
lied
Load
(kN
)Pot 1Pot 2Pot 3Pot 4Pot 5Pot 6
0
500
1000
1500
2000
2500
3000
3500
0.00 0.25 0.50 0.75 1.00 1.25
Rotation (deg)
App
lied
Load
(kN
)
East Bearing RotationWest Bearing Rotation
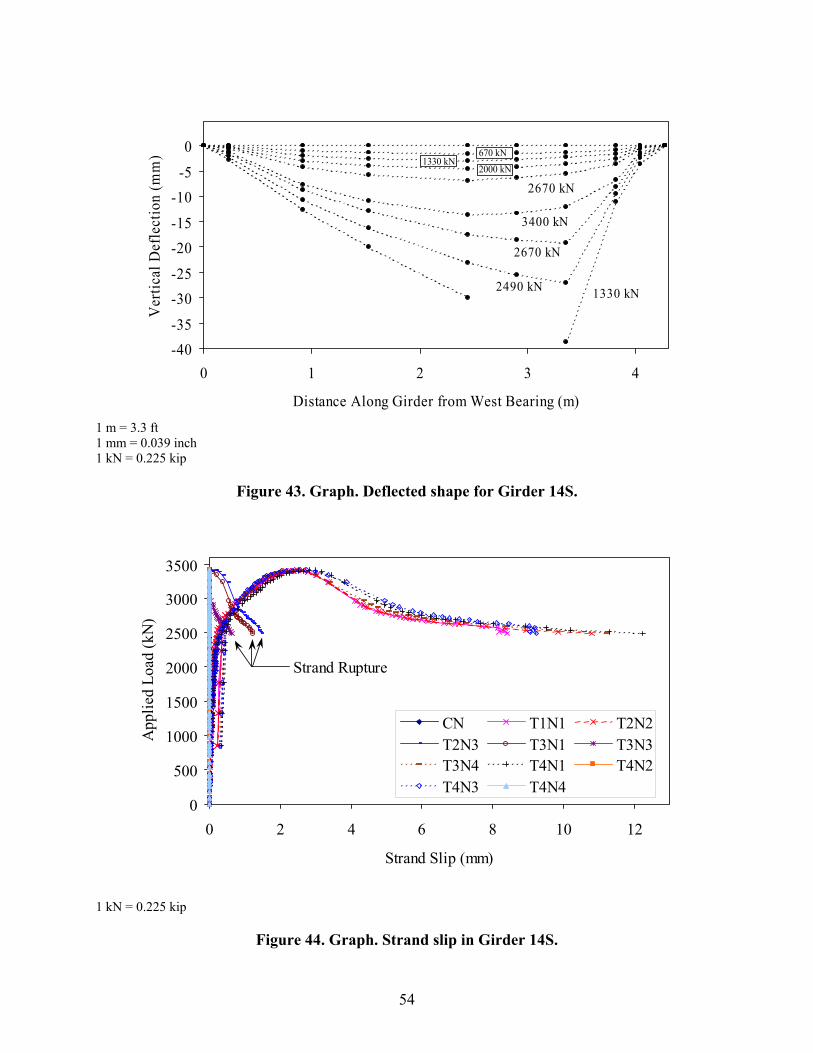
54
1 m = 3.3 ft 1 mm = 0.039 inch 1 kN = 0.225 kip
Figure 43. Graph. Deflected shape for Girder 14S.
1 kN = 0.225 kip
Figure 44. Graph. Strand slip in Girder 14S.
-40-35
-30-25
-20-15
-10-5
0
0 1 2 3 4
Distance Along Girder from West Bearing (m)
Ver
tical
Def
lect
ion
(mm
)
1330 kN2490 kN
2670 kN
3400 kN
2670 kN
670 kN2000 kN
1330 kN
0
500
1000
1500
2000
2500
3000
3500
0 2 4 6 8 10 12
Strand Slip (mm)
App
lied
Load
(kN
)
CN T1N1 T2N2T2N3 T3N1 T3N3T3N4 T4N1 T4N2T4N3 T4N4
Strand Rupture
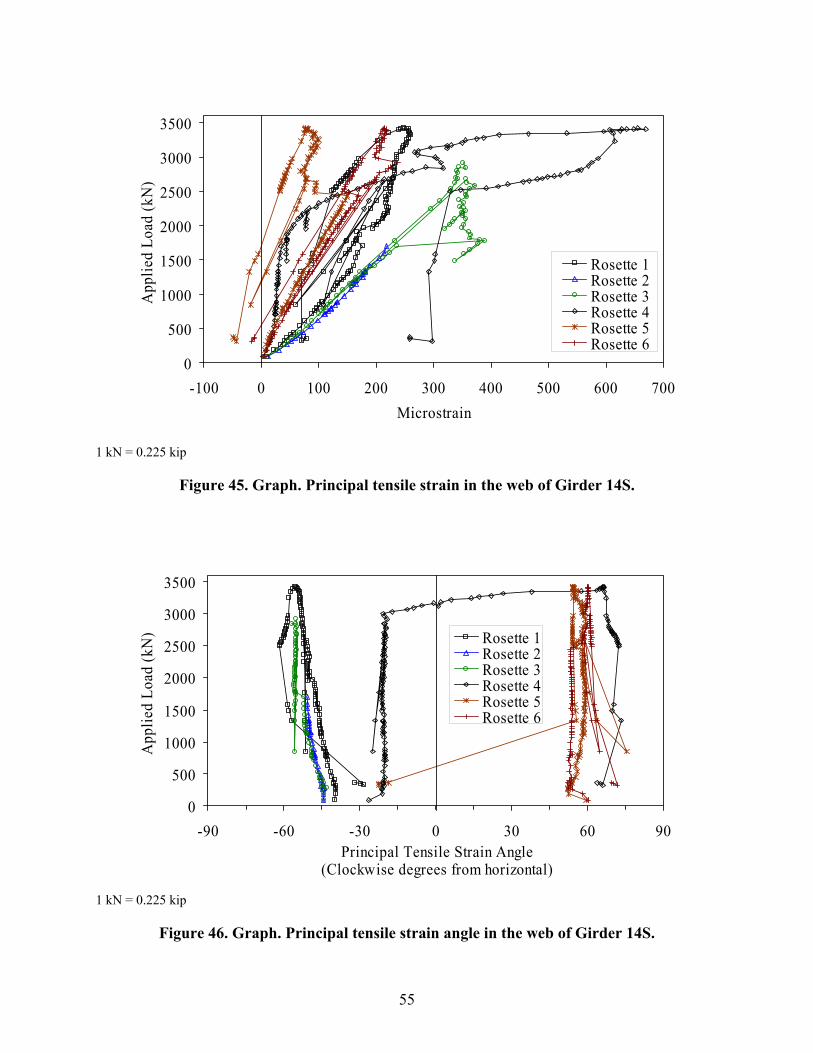
55
1 kN = 0.225 kip
Figure 45. Graph. Principal tensile strain in the web of Girder 14S.
1 kN = 0.225 kip
Figure 46. Graph. Principal tensile strain angle in the web of Girder 14S.
0
500
1000
1500
2000
2500
3000
3500
-100 0 100 200 300 400 500 600 700Microstrain
App
lied
Load
(kN
)
Rosette 1Rosette 2Rosette 3Rosette 4Rosette 5Rosette 6
0
500
1000
1500
2000
2500
3000
3500
-90 -60 -30 0 30 60 90Principal Tensile Strain Angle
App
lied
Load
(kN
) Rosette 1Rosette 2Rosette 3Rosette 4Rosette 5Rosette 6
(Clockwise degrees from horizontal)

56
1 kN = 0.225 kip
Figure 47. Graph. Principal compressive strain in the web of Girder 14S.
1 kN = 0.225 kip
Figure 48. Graph. Principal compressive strain angle in the web of Girder 14S.
0
500
1000
1500
2000
2500
3000
3500
-700 -600 -500 -400 -300 -200 -100 0 100 200 300 400Microstrain
App
lied
Load
(kN
)
Rosette 1Rosette 2Rosette 3Rosette 4Rosette 5Rosette 6
0
500
1000
1500
2000
2500
3000
3500
-90 -60 -30 0 30 60 90 120 150Principal Compressive Strain Angle
App
lied
Load
(kN
)
Rosette 1Rosette 2Rosette 3Rosette 4Rosette 5Rosette 6
(Clockwise degrees from horizontal)

57
Figure 49. Photo. Girder 14S at (a) peak load and (b) postpeak load of 2,650 kN (595 kips).
Failure of the girder occurred when prestressing strands in the bottom flange began to rupture. The vertical crack in the bottom flange at the end of the debonding length continued to widen as, sequentially, the fully bonded strands broke. As more displacement was imparted into the girder, more strands ruptured until all 12 fully bonded bottom flange strands had ruptured. Figure 50 illustrates the crack and failure patterns that were recorded after girder failure.
(b)
(a)

58
1 mm = 0.039 inch
Figure 50. Illustration. Crack pattern at failure in Girder 14S.
Load
3 mm crack spacing
6 mm crackspacing3 mm crack
spacing
6 mm crackspacing
12 mm crackspacing6 mm crack
spacing
12 mm crackspacing
3 mm crack spacing
Failure crackPhotoelastic sheet
Note: 1. Crack widths are not drawn to scale.2. Tightly spaced crack areas are not drawn to scale.
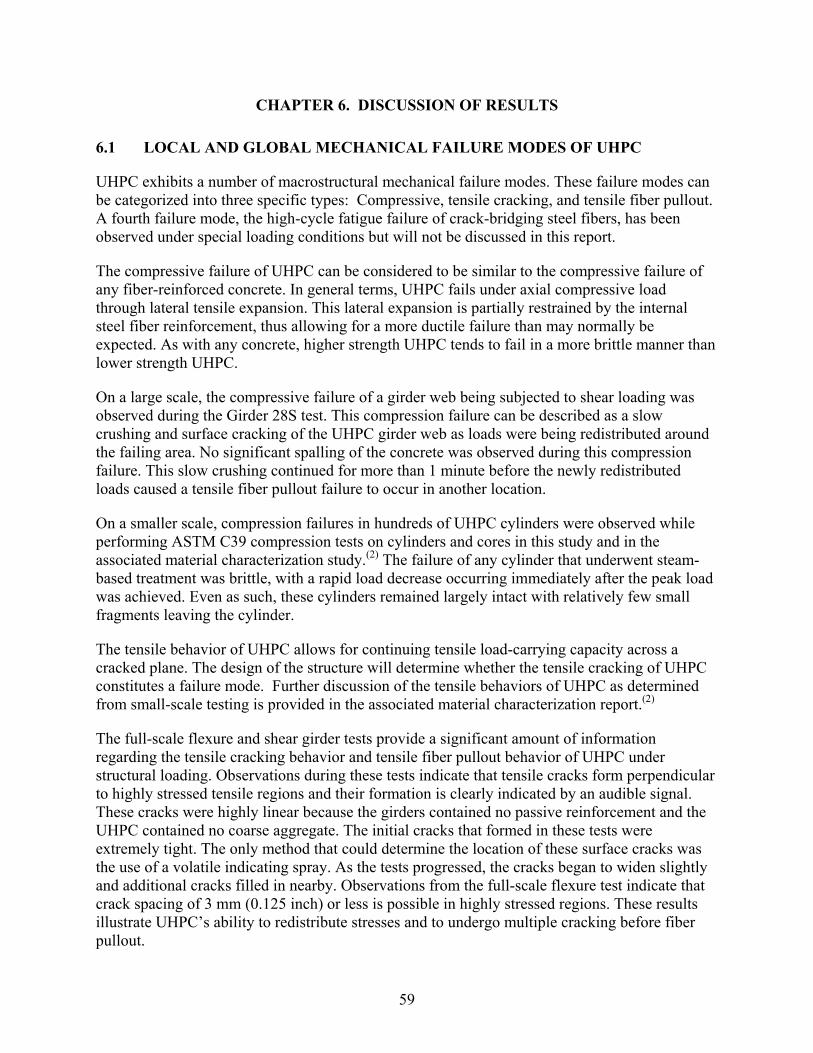
59
CHAPTER 6. DISCUSSION OF RESULTS
6.1 LOCAL AND GLOBAL MECHANICAL FAILURE MODES OF UHPC
UHPC exhibits a number of macrostructural mechanical failure modes. These failure modes can be categorized into three specific types: Compressive, tensile cracking, and tensile fiber pullout. A fourth failure mode, the high-cycle fatigue failure of crack-bridging steel fibers, has been observed under special loading conditions but will not be discussed in this report.
The compressive failure of UHPC can be considered to be similar to the compressive failure of any fiber-reinforced concrete. In general terms, UHPC fails under axial compressive load through lateral tensile expansion. This lateral expansion is partially restrained by the internal steel fiber reinforcement, thus allowing for a more ductile failure than may normally be expected. As with any concrete, higher strength UHPC tends to fail in a more brittle manner than lower strength UHPC.
On a large scale, the compressive failure of a girder web being subjected to shear loading was observed during the Girder 28S test. This compression failure can be described as a slow crushing and surface cracking of the UHPC girder web as loads were being redistributed around the failing area. No significant spalling of the concrete was observed during this compression failure. This slow crushing continued for more than 1 minute before the newly redistributed loads caused a tensile fiber pullout failure to occur in another location.
On a smaller scale, compression failures in hundreds of UHPC cylinders were observed while performing ASTM C39 compression tests on cylinders and cores in this study and in the associated material characterization study.(2) The failure of any cylinder that underwent steam-based treatment was brittle, with a rapid load decrease occurring immediately after the peak load was achieved. Even as such, these cylinders remained largely intact with relatively few small fragments leaving the cylinder.
The tensile behavior of UHPC allows for continuing tensile load-carrying capacity across a cracked plane. The design of the structure will determine whether the tensile cracking of UHPC constitutes a failure mode. Further discussion of the tensile behaviors of UHPC as determined from small-scale testing is provided in the associated material characterization report.(2)
The full-scale flexure and shear girder tests provide a significant amount of information regarding the tensile cracking behavior and tensile fiber pullout behavior of UHPC under structural loading. Observations during these tests indicate that tensile cracks form perpendicular to highly stressed tensile regions and their formation is clearly indicated by an audible signal. These cracks were highly linear because the girders contained no passive reinforcement and the UHPC contained no coarse aggregate. The initial cracks that formed in these tests were extremely tight. The only method that could determine the location of these surface cracks was the use of a volatile indicating spray. As the tests progressed, the cracks began to widen slightly and additional cracks filled in nearby. Observations from the full-scale flexure test indicate that crack spacing of 3 mm (0.125 inch) or less is possible in highly stressed regions. These results illustrate UHPC’s ability to redistribute stresses and to undergo multiple cracking before fiber pullout.

60
Final tensile failure of UHPC generally occurs when the steel fiber reinforcement begins to debond from and to pull out of the UHPC matrix. Because fibers are randomly distributed and oriented in the UHPC, individual fiber loads vary at any particular global load level. Mechanically, pullout occurs when the load carried by an individual fiber overcomes the ability of the UHPC to grip the fiber. Pullout by any fibers increases the load that other nearby fibers must carry. Multiple pullouts in a specific location that require gross load redistribution through alternate load paths can be defined as fiber pullout failure.
The full-scale flexure test on Girder 80F and the shear test on Girder 24S provide clear indications of the effect of fiber pullout on global girder behavior. In Girder 80F, hundreds of tightly spaced cracks carried significant flexural tensile forces in the bottom bulb of the girder. At the peak load carried by the girder, the fibers at one specific cross section began to pull out. This crack quickly became significantly wider than any other crack in the girder and placed large additional strains on the prestressing strands at this location. Because the strands could not sustain this large strain, the strands ruptured and the girder failed.
In Girder 24S, many tightly spaced cracks formed perpendicular to the diagonal tensile forces being carried by the web of the girder. As the loads on the girder increased, more cracks formed and the fibers bridging the existing cracks became more highly stressed. Eventually, the fibers bridging a very highly stressed crack began to pull out. Because this girder contained no mild steel reinforcement to aid in load redistribution, the girder abruptly failed.
In both girder tests discussed above, the failure of the girder as a whole was precipitated by the local bond failure between the fibers and the UHPC matrix. These results indicate that unless significant mild or prestressing steel redundancy exists in the UHPC member, fiber pullout will result in member failure.
6.2 DEVELOPMENT LENGTH OF PRESTRESSING STRAND IN UHPC
Results from two of the UHPC girder shear tests provide an indication of the development length of 1,860 MPa (270 ksi) low-relaxation prestressing strand in this type of concrete. In both tests, sufficient stresses were placed onto prestressing strands with 1.2 m (4 ft) or less of embedment length to cause the strands to rupture.
Section 5.2.1 presents the results from the testing of Girder 28S. Recall that this three-point-loading test setup included a 8.54 m (28 ft) total span, a 2.0 m (6.5 ft) shear span, and a 1.2 m (4 ft) overhang beyond the shear span. This overhanging portion of the girder allowed for the partial to full development of the prestressing strands outside of the region of the girder that traditionally encounters high stresses from flexure or shear. Figure 30 shows the distress that was apparent in this girder at failure. As mentioned in chapter 5, the failure of this girder included the simultaneous rupturing of the two strands in the top flange of the girder directly over the bearing. Because no slip was observed in the instrumented top strand before rupture, it is clear that the full development length of these strands was less than the 1.2 m (48 inches) of embedment between the rupture location and the end of the girder.
The failure of Girder 14S provides further information regarding the development length of this prestressing strand in UHPC. Recall that this three-point-loading test setup included a 4.3 m
61
(14 ft) total span, a 1.8 m (6 ft) shear span, and no overhang (i.e., the bearing was centered 152 mm (6 inches) from the end of the girder). As with all of the girders, half of the strands in the bottom flange were debonded for 0.9 m (3 ft) from the end of the girder. The sequential rupture of the 12 fully bonded strands in the bottom flange defined the failure of this girder. Figure 50 illustrates the distress apparent in the girder at failure, with the strand ruptures occurring at the second large bottom flange crack from the right end of the girder. Note that this crack was 0.94 m (37 inches) from the east end of the girder at the precise location where the full complement of strands became bonded.
Figure 4 shows the strand slip behavior for five of the fully bonded strands in the bottom flange and for five of the debonded strands in the bottom flange, along with one of the top flange strands. The debonded strands all behaved very similarly, showing initial slip at an applied girder load of 2,200 kN (500 kips), 2.5 mm (0.1 inch) of slip at the peak girder load of 3,410 kN (766 kips), and between 8.9 and 12.7 mm (0.35 and 0.5 inch) of slip when the fully bonded strands began to rupture. Of the five fully bonded strands that were monitored, the two in the bottom row of strands showed no slippage before rupture. The three in the second and third rows from the bottom of the girder showed less that 1.5 mm (0.06 inch) of slippage, with the slippage beginning at the girder’s peak load capacity and ceasing when these strands ruptured. The results from these five instrumented strands indicate that the development length of UHPC under realistic shear loading conditions is less than 0.94 m (37 inches).
The girder test results discussed above indicate that the development length of 12.7-mm, 1,860-MPa (0.5-inch 270-ksi) low-relaxation prestressing strand in UHPC under realistic full-scale loading conditions is less than 0.94 m (37 inches). In total, one monitored strand ruptured prior to slipping while being subjected to a flexural tensile loading with 1.2 m (48 inches) of embedment, two monitored strands ruptured prior to slipping while spanning 0.94 m (37 inches) through a heavily distressed shear region, and three strands ruptured after a slight slippage while spanning 0.94 m (37 inches) through a heavily distressed shear region. This result is consistent with the findings of Steinberg and Lubbers as discussed in section 2.4.1.(10)
6.3 ESTIMATION OF PRESTRESS LOSSES IN UHPC GIRDERS
The loss of prestressing force due to instantaneous and long-term effects is an inherent part of pretensioning concrete. In prestressed concrete, the primary instantaneous effect is elastic shortening of the concrete member. The long-term effects comprise concrete shrinkage, concrete creep, and relaxation of the prestressing strand.
This section focuses on determining the prestress losses that occurred in the AASHTO Type II girders. The experimental results for these girders were presented in chapter 5. The AASHTO Load and Resistance Factor Design (LRFD) Bridge Design Specification defines the total loss of prestress as comprising the four effects mentioned above.(19) The specification provides empirical relationships that can be used to estimate these losses. However, these estimations are based on conventional concrete technology; thus, more accurate estimations of UHPC girder behavior can be achieved through the use of the experimental results presented in the associated UHPC material characterization report.(2)

62
The AASHTO Type II girders discussed in chapters 4 and 5 were each prestressed with 24 strands in the bottom bulb and 2 strands in the top bulb. The fabricator stressed these 1,860-MPa (270-ksi) low-relaxation strands to 55 percent of their ultimate strength, or 1,030 MPa (149 ksi). The strand stressing was completed within 1 day before the casting of the UHPC. After casting, approximately 3 days passed before each girder was stressed. The girders then were steam treated.
The time-dependent prestress loss due to shrinkage of the UHPC can be approximated based on the experimental results determined in the associated UHPC material characterization study.(2) The early age unrestrained shrinkage of UHPC was determined to be approximately 500 microstrain at 3 days after casting. The final stabilized asymptotic shrinkage value after steam treatment was determined to be approximately 850 microstrain. Thus, 350 microstrain of shrinkage can be expected to occur after the stressing of the girder. The strands can be assumed to have a stiffness of 197 GPa (28,500 ksi); therefore, this shrinkage will reduce the stress in the strand by 69 MPa (10.0 ksi).
The time-dependent prestress loss due to creep of the UHPC also can be approximated based on the experimental results determined in the associated UHPC material characterization study.(2) An elastic analysis of the UHPC girders at transfer indicates that the stress in the concrete at the centroid of the prestress is approximately 21 MPa (3.0 ksi). The strength of the concrete at transfer would have been at least 69 MPa (10 ksi) and would have continued to increase both before and during steaming until the final compressive strength of 193 MPa (28 ksi) was achieved. Based on this information, the level of stress on the concrete was clearly at or below 30 percent of the compressive strength.
The creep coefficient for UHPC can vary depending on the age of the concrete and the curing treatment that has been applied. The associated UHPC material characterization study(2) found that a creep coefficient of 0.3 can be expected after the steam treatment, but that the creep coefficient could be as high as 0.78 if untreated UHPC is subjected to a compressive stress equal to 67 percent of its compressive strength. Based on these results, a reasonably conservative aggregate value for the long-term creep coefficient of UHPC stressed as described above is estimated to be 0.5.
Additionally, this analysis requires an estimation of the modulus of elasticity of the UHPC throughout the timeframe during which creep is occurring. Experimental results have indicated that the modulus of elasticity can range from 42.7 to 52.7 GPa (6,200 to 7,650 ksi) for the 28-day untreated to steam-treated UHPC, respectively.(2) Also, early age modulus of elasticity testing has indicated that the modulus of elasticity for 69 MPa (10 ksi) UHPC will be approximately 34.5 GPa (5,000 ksi). Conservatively, the modulus of elasticity for this analysis is assumed to be 41.4 GPa (6,000 ksi) because a smaller modulus will result in larger overall creep losses.
The goal of this creep analysis is to determine the stress loss in the strands resulting from the creep strain imparted into the concrete. The creep strain in the concrete is calculated by multiplying the creep coefficient by the initial concrete strain at prestress transfer. This concrete strain can be approximated to equal the 21 MPa (3.0 ksi) initial prestress divided by the modulus of elasticity of 41.4 GPa (6,000 ksi). Thus, the creep strain in the concrete is 240 microstrain, and the resulting loss of prestress in the strands is 48 MPa (6.9 ksi).
63
The elastic shortening loss in the UHPC girder was calculated based on a strain compatibility analysis of the girder cross section. All prestressing strands were considered separately; thus, strands at different distances from the neutral axis exhibited different levels of stress. The modulus of elasticity of the UHPC was assumed to equal 34.5 GPa (5,000 ksi) at transfer. The elastic shortening of the UHPC girder at the center of gravity of the prestressing strands is 540 microstrain. Multiplying this value by the modulus of elasticity of the strands results in an average elastic shortening loss in the strands of 106 MPa (15.4 ksi).
Finally, the time-dependent losses due to strand relaxation after transfer were calculated based on the relationship provided in the AASHTO LRFD Bridge Design Specifications.(19) The calculation estimates the relaxation loss by relating it to the other three losses detailed above. Specifically, this loss equals 41 MPa (6 ksi) minus 12 percent of the elastic shortening loss minus 6 percent of the creep and shrinkage losses. In total, the strand relaxation loss for the UHPC girder described above is 21.4 MPa (3.1 ksi).
The total prestress losses for this prestressed girder equal 245 MPa (35.6 ksi). This value includes the time-dependent 69 MPa (10.0 ksi) shrinkage loss, the 48 MPa (6.9 ksi) creep loss, and the 21.4 MPa (3.1 ksi) strand relaxation loss. It also includes the 106 MPa (15.4 ksi) elastic shortening loss that occurs at the stressing of the girder. Because the girders were only stressed to 55 percent of the ultimate strand strength, the time-dependent losses total 14 percent of the strand jacking stress and the instantaneous elastic losses total 10 percent of the strand jacking stress.
These losses are of similar magnitude to the losses that normally occur in prestressed concrete girders, which seems to indicate that UHPC provides minimal benefit in terms of prestress loss behaviors. However, it must be noted that the low level of initial jacking stress results in a significantly larger percentage of stress loss than would occur with a higher initial jacking stress. Also, the stressing of the girder when the UHPC compressive strength is 69 MPa (10 ksi) results in much higher losses than would occur if the UHPC had reached 103 MPa (15 ksi) or more without steam treatment or had reached 193 MPa (28 ksi) with steam treatment. These higher compressive strengths would result in decreased shrinkage strains, decreased creep strains, and a higher modulus of elasticity that would reduce elastic shortening.
6.4 FLEXURAL BEHAVIOR OF PRESTRESSED UHPC GIRDERS
The static loading of Girder 80F provided significant information regarding the full-scale flexural behavior of UHPC girders. The results of this test are presented in section 5.1. The following sections provide an indepth analysis of these test results with a focus on modeling the global girder behaviors.
6.4.1 Analytical Predictions of Global Behavior
Simple, accepted analytical methods exist for the prediction of the flexural behavior of prestressed concrete girders. These methods are based both on structural mechanics and on empirical relationships. In general, these empirical relationships approximate the nonlinear stress-strain behaviors of normal reinforced concrete. Although these analytical methods cannot
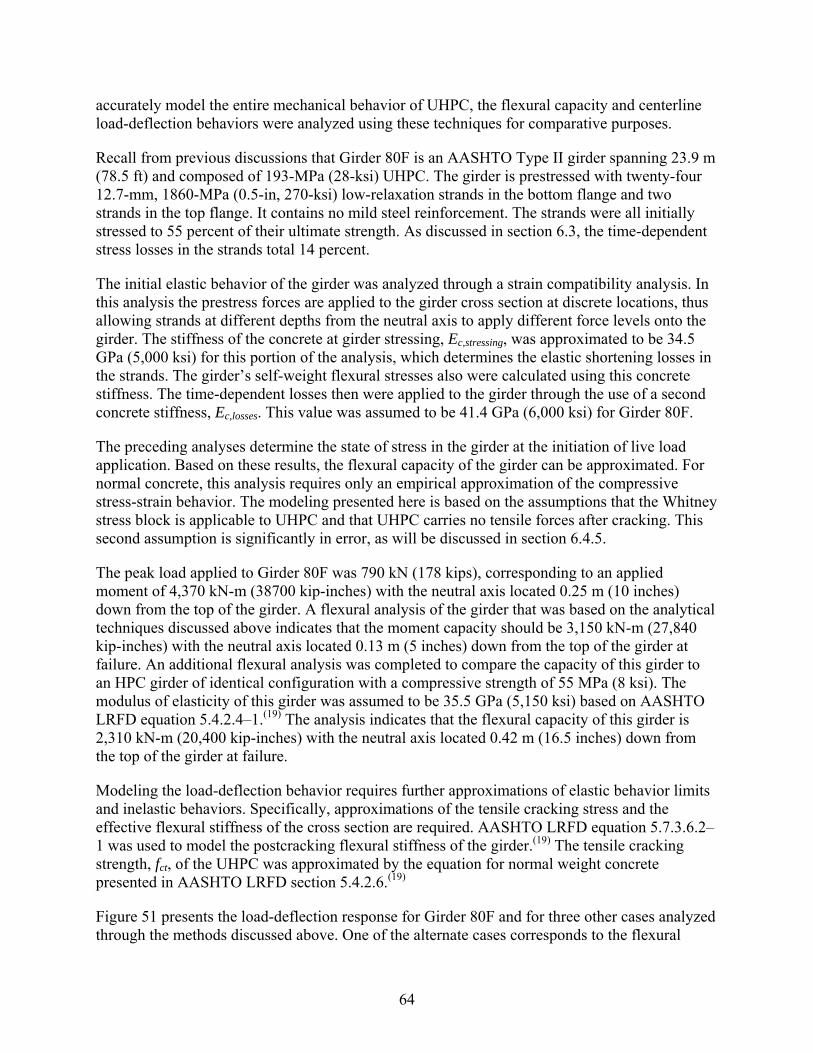
64
accurately model the entire mechanical behavior of UHPC, the flexural capacity and centerline load-deflection behaviors were analyzed using these techniques for comparative purposes.
Recall from previous discussions that Girder 80F is an AASHTO Type II girder spanning 23.9 m (78.5 ft) and composed of 193-MPa (28-ksi) UHPC. The girder is prestressed with twenty-four 12.7-mm, 1860-MPa (0.5-in, 270-ksi) low-relaxation strands in the bottom flange and two strands in the top flange. It contains no mild steel reinforcement. The strands were all initially stressed to 55 percent of their ultimate strength. As discussed in section 6.3, the time-dependent stress losses in the strands total 14 percent.
The initial elastic behavior of the girder was analyzed through a strain compatibility analysis. In this analysis the prestress forces are applied to the girder cross section at discrete locations, thus allowing strands at different depths from the neutral axis to apply different force levels onto the girder. The stiffness of the concrete at girder stressing, Ec,stressing, was approximated to be 34.5 GPa (5,000 ksi) for this portion of the analysis, which determines the elastic shortening losses in the strands. The girder’s self-weight flexural stresses also were calculated using this concrete stiffness. The time-dependent losses then were applied to the girder through the use of a second concrete stiffness, Ec,losses. This value was assumed to be 41.4 GPa (6,000 ksi) for Girder 80F.
The preceding analyses determine the state of stress in the girder at the initiation of live load application. Based on these results, the flexural capacity of the girder can be approximated. For normal concrete, this analysis requires only an empirical approximation of the compressive stress-strain behavior. The modeling presented here is based on the assumptions that the Whitney stress block is applicable to UHPC and that UHPC carries no tensile forces after cracking. This second assumption is significantly in error, as will be discussed in section 6.4.5.
The peak load applied to Girder 80F was 790 kN (178 kips), corresponding to an applied moment of 4,370 kN-m (38700 kip-inches) with the neutral axis located 0.25 m (10 inches) down from the top of the girder. A flexural analysis of the girder that was based on the analytical techniques discussed above indicates that the moment capacity should be 3,150 kN-m (27,840 kip-inches) with the neutral axis located 0.13 m (5 inches) down from the top of the girder at failure. An additional flexural analysis was completed to compare the capacity of this girder to an HPC girder of identical configuration with a compressive strength of 55 MPa (8 ksi). The modulus of elasticity of this girder was assumed to be 35.5 GPa (5,150 ksi) based on AASHTO LRFD equation 5.4.2.4–1.(19) The analysis indicates that the flexural capacity of this girder is 2,310 kN-m (20,400 kip-inches) with the neutral axis located 0.42 m (16.5 inches) down from the top of the girder at failure.
Modeling the load-deflection behavior requires further approximations of elastic behavior limits and inelastic behaviors. Specifically, approximations of the tensile cracking stress and the effective flexural stiffness of the cross section are required. AASHTO LRFD equation 5.7.3.6.2–1 was used to model the postcracking flexural stiffness of the girder.(19) The tensile cracking strength, fct, of the UHPC was approximated by the equation for normal weight concrete presented in AASHTO LRFD section 5.4.2.6.(19)
Figure 51 presents the load-deflection response for Girder 80F and for three other cases analyzed through the methods discussed above. One of the alternate cases corresponds to the flexural
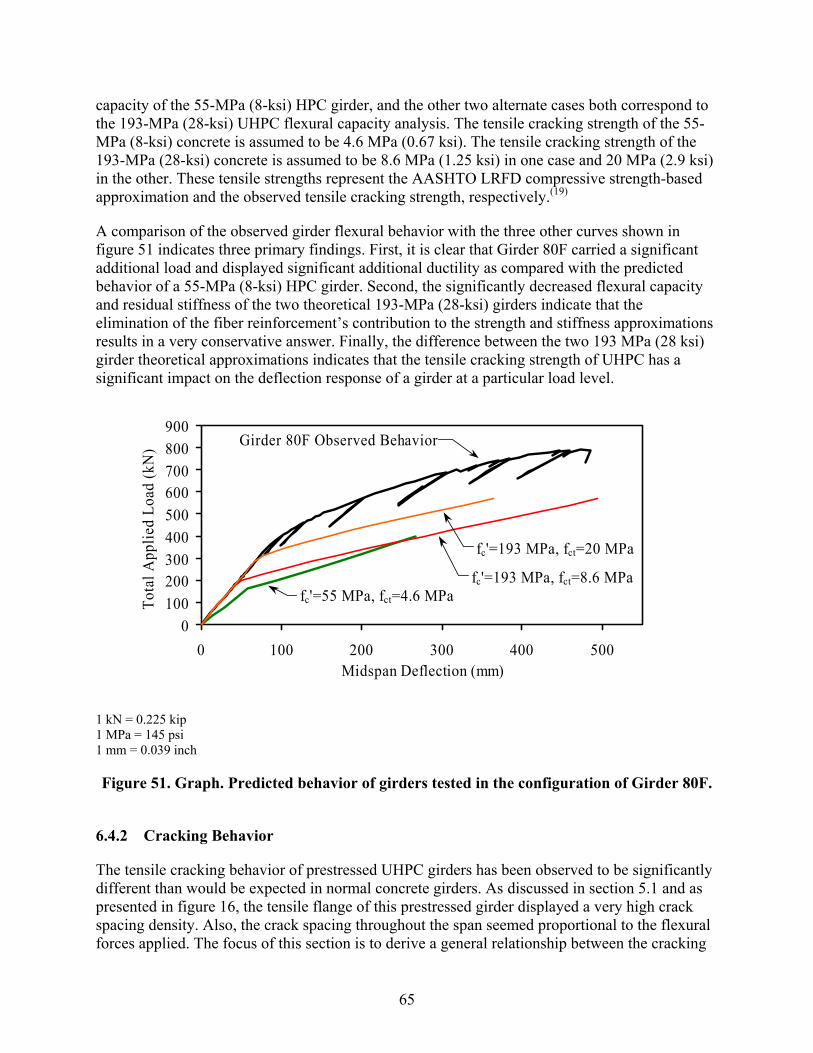
65
capacity of the 55-MPa (8-ksi) HPC girder, and the other two alternate cases both correspond to the 193-MPa (28-ksi) UHPC flexural capacity analysis. The tensile cracking strength of the 55-MPa (8-ksi) concrete is assumed to be 4.6 MPa (0.67 ksi). The tensile cracking strength of the 193-MPa (28-ksi) concrete is assumed to be 8.6 MPa (1.25 ksi) in one case and 20 MPa (2.9 ksi) in the other. These tensile strengths represent the AASHTO LRFD compressive strength-based approximation and the observed tensile cracking strength, respectively.(19)
A comparison of the observed girder flexural behavior with the three other curves shown in figure 51 indicates three primary findings. First, it is clear that Girder 80F carried a significant additional load and displayed significant additional ductility as compared with the predicted behavior of a 55-MPa (8-ksi) HPC girder. Second, the significantly decreased flexural capacity and residual stiffness of the two theoretical 193-MPa (28-ksi) girders indicate that the elimination of the fiber reinforcement’s contribution to the strength and stiffness approximations results in a very conservative answer. Finally, the difference between the two 193 MPa (28 ksi) girder theoretical approximations indicates that the tensile cracking strength of UHPC has a significant impact on the deflection response of a girder at a particular load level.
1 kN = 0.225 kip 1 MPa = 145 psi 1 mm = 0.039 inch
Figure 51. Graph. Predicted behavior of girders tested in the configuration of Girder 80F.
6.4.2 Cracking Behavior
The tensile cracking behavior of prestressed UHPC girders has been observed to be significantly different than would be expected in normal concrete girders. As discussed in section 5.1 and as presented in figure 16, the tensile flange of this prestressed girder displayed a very high crack spacing density. Also, the crack spacing throughout the span seemed proportional to the flexural forces applied. The focus of this section is to derive a general relationship between the cracking
0100200300400500600700800900
0 100 200 300 400 500Midspan Deflection (mm)
Tota
l App
lied
Load
(kN
) Girder 80F Observed Behavior
fc'=55 MPa, fct=4.6 MPafc'=193 MPa, fct=8.6 MPa
fc'=193 MPa, fct=20 MPa
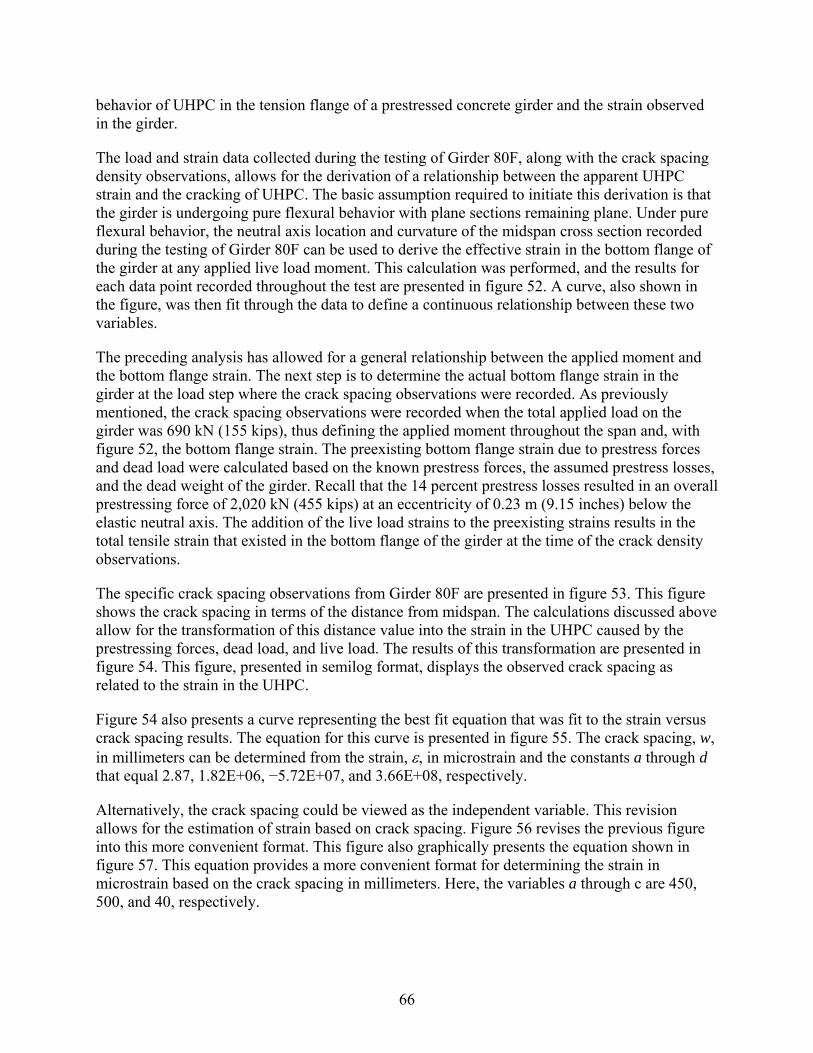
66
behavior of UHPC in the tension flange of a prestressed concrete girder and the strain observed in the girder.
The load and strain data collected during the testing of Girder 80F, along with the crack spacing density observations, allows for the derivation of a relationship between the apparent UHPC strain and the cracking of UHPC. The basic assumption required to initiate this derivation is that the girder is undergoing pure flexural behavior with plane sections remaining plane. Under pure flexural behavior, the neutral axis location and curvature of the midspan cross section recorded during the testing of Girder 80F can be used to derive the effective strain in the bottom flange of the girder at any applied live load moment. This calculation was performed, and the results for each data point recorded throughout the test are presented in figure 52. A curve, also shown in the figure, was then fit through the data to define a continuous relationship between these two variables.
The preceding analysis has allowed for a general relationship between the applied moment and the bottom flange strain. The next step is to determine the actual bottom flange strain in the girder at the load step where the crack spacing observations were recorded. As previously mentioned, the crack spacing observations were recorded when the total applied load on the girder was 690 kN (155 kips), thus defining the applied moment throughout the span and, with figure 52, the bottom flange strain. The preexisting bottom flange strain due to prestress forces and dead load were calculated based on the known prestress forces, the assumed prestress losses, and the dead weight of the girder. Recall that the 14 percent prestress losses resulted in an overall prestressing force of 2,020 kN (455 kips) at an eccentricity of 0.23 m (9.15 inches) below the elastic neutral axis. The addition of the live load strains to the preexisting strains results in the total tensile strain that existed in the bottom flange of the girder at the time of the crack density observations.
The specific crack spacing observations from Girder 80F are presented in figure 53. This figure shows the crack spacing in terms of the distance from midspan. The calculations discussed above allow for the transformation of this distance value into the strain in the UHPC caused by the prestressing forces, dead load, and live load. The results of this transformation are presented in figure 54. This figure, presented in semilog format, displays the observed crack spacing as related to the strain in the UHPC.
Figure 54 also presents a curve representing the best fit equation that was fit to the strain versus crack spacing results. The equation for this curve is presented in figure 55. The crack spacing, w, in millimeters can be determined from the strain, ε, in microstrain and the constants a through d that equal 2.87, 1.82E+06, −5.72E+07, and 3.66E+08, respectively.
Alternatively, the crack spacing could be viewed as the independent variable. This revision allows for the estimation of strain based on crack spacing. Figure 56 revises the previous figure into this more convenient format. This figure also graphically presents the equation shown in figure 57. This equation provides a more convenient format for determining the strain in microstrain based on the crack spacing in millimeters. Here, the variables a through c are 450, 500, and 40, respectively.
67
1 kN-m = 8.85 kip-inches
Figure 52. Graph. Girder 80F midspan bottom flange strain throughout testing.
1 m = 3.3 ft 1 mm = 0.039 inch
Figure 53. Graph. Flexural crack spacing observed on the bottom flange of Girder 80F at a total applied load of 690 kN (155 kips).
0
2000
4000
6000
8000
10000
12000
0 1000 2000 3000 4000Applied Live Load Moment (kN-m)
Botto
m F
lang
e St
rain
(m
icro
stra
in) Best-fit Equation
0
25
50
75
100
125
150
0 1 2 3 4 5 6 7 8Distance from Midspan of Girder 80F (m)
Crac
k Sp
acin
g (m
m)

68
1 mm = 0.039 inch
Figure 54. Graph. Flexural crack spacing related to tensile strain.
Figure 55. Equation. Crack spacing as a function of strain.
1 mm = 0.039 inch
Figure 56. Graph. Tensile strain related to flexural crack spacing.
1
10
100
1000
0 1000 2000 3000 4000 5000
Bottom Flange Tensile Strain (microstrain)
Crac
k Sp
acin
g (m
m)
Equation in Figure 55
0
1000
2000
3000
4000
5000
1 10 100 1000Crack Spacing (mm)
Botto
m F
lang
e Te
nsile
Stra
in
(mic
rost
rain
)
Equation in Figure 57
25.1lnεε
εdcbaw +
++=
69
Figure 57. Equation. Strain as a function of crack spacing.
6.4.3 Effective Moment of Inertia
Elastic flexural analysis was used to determine the stiffness of Girder 80F, including both before and after flexural cracking of the girder. The testing of Girder 80F included periodic partial unloading cycles. During these cycles, approximately 30 percent of the load was removed from the girder before being reapplied incrementally. The data collected during the reloading cycles allow for the analysis of the residual elastic behavior of the girder. This analysis focuses on the load-deflection behavior of the girder.
The load and deflection behaviors recorded during the initial loading of the girder and during eight unloadings were analyzed. This analysis assumed pure flexural behavior and a constant UHPC modulus of elasticity, E, of 55.8 GPa (8,100 ksi). Vertical deflections of the girder were recorded at six locations: Midspan (bottom and top flange), both load points, and both quarter points. The slope of the load-deflection behavior at each potentiometer was determined for each loading or reloading cycle using a best fit linear approximation.
These slopes were then used to determine the effective moment of inertia, Ieff, of the girder as a whole. A revision of standard flexural deflection relationships allows for the calculation of Ieff through the use of the known geometry of the loading. The equation in figure 58 provides the relationship between the slope of the load deflection response, mP/Δ, and the load, P, and Ieff for deflections measured at the centerline of the girder. This equation includes variables for the girder span, L, the distance from the bearing to the load point, a, the dead load of the girder, ω, and the initial uncracked moment of inertia of the cross section, Iuncracked. This analysis accounts for the effects of the dead load on the residual stiffness of the girder.
Figure 58. Equation. Relationship between the midspan vertical deflection of a girder and its effective moment of inertia.
2
4.254.25 ⎟⎠⎞
⎜⎝⎛
++=wc
wbaε
( )
uncrackedP
eff
IL
mPE
LaLPaI4
/
422
5384
5438ωω
+⎟⎟⎠
⎞⎜⎜⎝
⎛+−
=
Δ
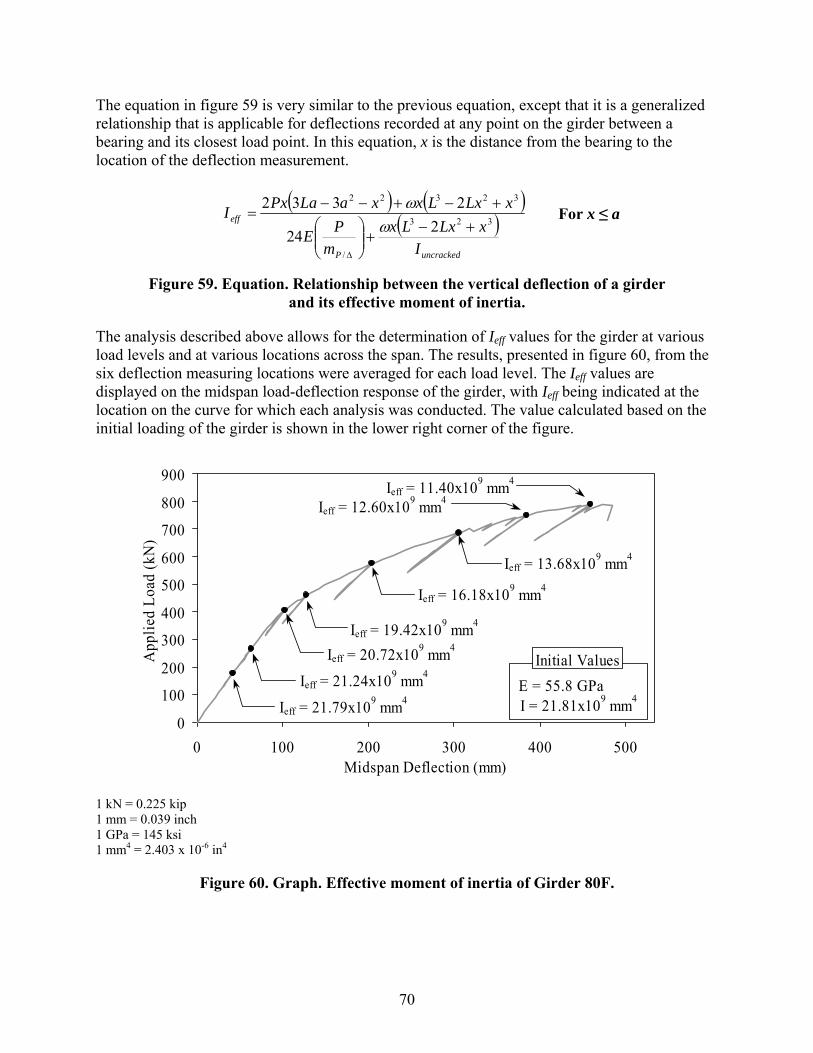
70
The equation in figure 59 is very similar to the previous equation, except that it is a generalized relationship that is applicable for deflections recorded at any point on the girder between a bearing and its closest load point. In this equation, x is the distance from the bearing to the location of the deflection measurement.
Figure 59. Equation. Relationship between the vertical deflection of a girder and its effective moment of inertia.
The analysis described above allows for the determination of Ieff values for the girder at various load levels and at various locations across the span. The results, presented in figure 60, from the six deflection measuring locations were averaged for each load level. The Ieff values are displayed on the midspan load-deflection response of the girder, with Ieff being indicated at the location on the curve for which each analysis was conducted. The value calculated based on the initial loading of the girder is shown in the lower right corner of the figure.
1 kN = 0.225 kip 1 mm = 0.039 inch 1 GPa = 145 ksi 1 mm4 = 2.403 x 10⁻⁶ in4
Figure 60. Graph. Effective moment of inertia of Girder 80F.
0
100
200
300
400
500
600
700
800
900
0 100 200 300 400 500Midspan Deflection (mm)
App
lied
Load
(kN
)
Ieff = 11.40x109 mm4
Ieff = 12.60x109 mm4
Ieff = 13.68x109 mm4
Ieff = 16.18x109 mm4
Ieff = 19.42x109 mm4
Ieff = 21.79x109 mm4
Ieff = 21.24x109 mm4
Ieff = 20.72x109 mm4
E = 55.8 GPa I = 21.81x109 mm4
Initial Values
( ) ( )( )
uncrackedP
eff
IxLxLx
mPE
xLxLxxaLaPxI323
/
32322
224
2332+−
+⎟⎟⎠
⎞⎜⎜⎝
⎛+−+−−
=
Δ
ωω
For x ≤ a
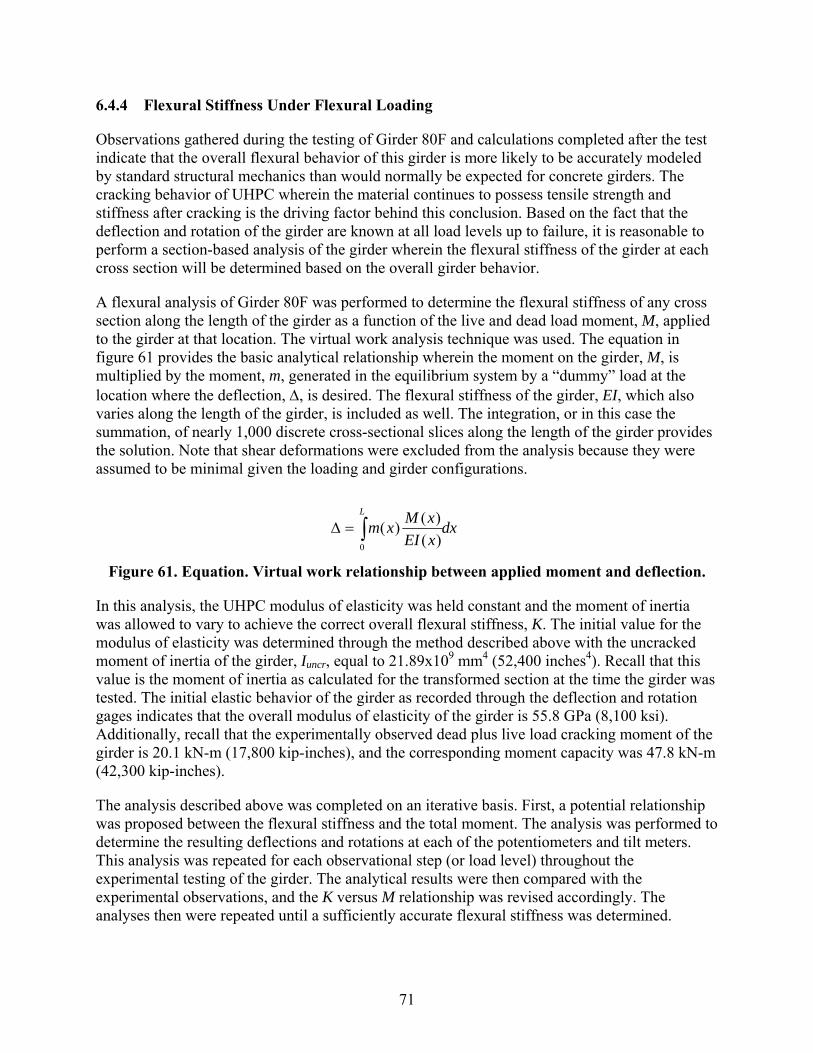
71
6.4.4 Flexural Stiffness Under Flexural Loading
Observations gathered during the testing of Girder 80F and calculations completed after the test indicate that the overall flexural behavior of this girder is more likely to be accurately modeled by standard structural mechanics than would normally be expected for concrete girders. The cracking behavior of UHPC wherein the material continues to possess tensile strength and stiffness after cracking is the driving factor behind this conclusion. Based on the fact that the deflection and rotation of the girder are known at all load levels up to failure, it is reasonable to perform a section-based analysis of the girder wherein the flexural stiffness of the girder at each cross section will be determined based on the overall girder behavior.
A flexural analysis of Girder 80F was performed to determine the flexural stiffness of any cross section along the length of the girder as a function of the live and dead load moment, M, applied to the girder at that location. The virtual work analysis technique was used. The equation in figure 61 provides the basic analytical relationship wherein the moment on the girder, M, is multiplied by the moment, m, generated in the equilibrium system by a “dummy” load at the location where the deflection, Δ, is desired. The flexural stiffness of the girder, EI, which also varies along the length of the girder, is included as well. The integration, or in this case the summation, of nearly 1,000 discrete cross-sectional slices along the length of the girder provides the solution. Note that shear deformations were excluded from the analysis because they were assumed to be minimal given the loading and girder configurations.
Figure 61. Equation. Virtual work relationship between applied moment and deflection.
In this analysis, the UHPC modulus of elasticity was held constant and the moment of inertia was allowed to vary to achieve the correct overall flexural stiffness, K. The initial value for the modulus of elasticity was determined through the method described above with the uncracked moment of inertia of the girder, Iuncr, equal to 21.89x109 mm4 (52,400 inches4). Recall that this value is the moment of inertia as calculated for the transformed section at the time the girder was tested. The initial elastic behavior of the girder as recorded through the deflection and rotation gages indicates that the overall modulus of elasticity of the girder is 55.8 GPa (8,100 ksi). Additionally, recall that the experimentally observed dead plus live load cracking moment of the girder is 20.1 kN-m (17,800 kip-inches), and the corresponding moment capacity was 47.8 kN-m (42,300 kip-inches).
The analysis described above was completed on an iterative basis. First, a potential relationship was proposed between the flexural stiffness and the total moment. The analysis was performed to determine the resulting deflections and rotations at each of the potentiometers and tilt meters. This analysis was repeated for each observational step (or load level) throughout the experimental testing of the girder. The analytical results were then compared with the experimental observations, and the K versus M relationship was revised accordingly. The analyses then were repeated until a sufficiently accurate flexural stiffness was determined.
dxxEIxMxm
L
∫=Δ0 )(
)()(
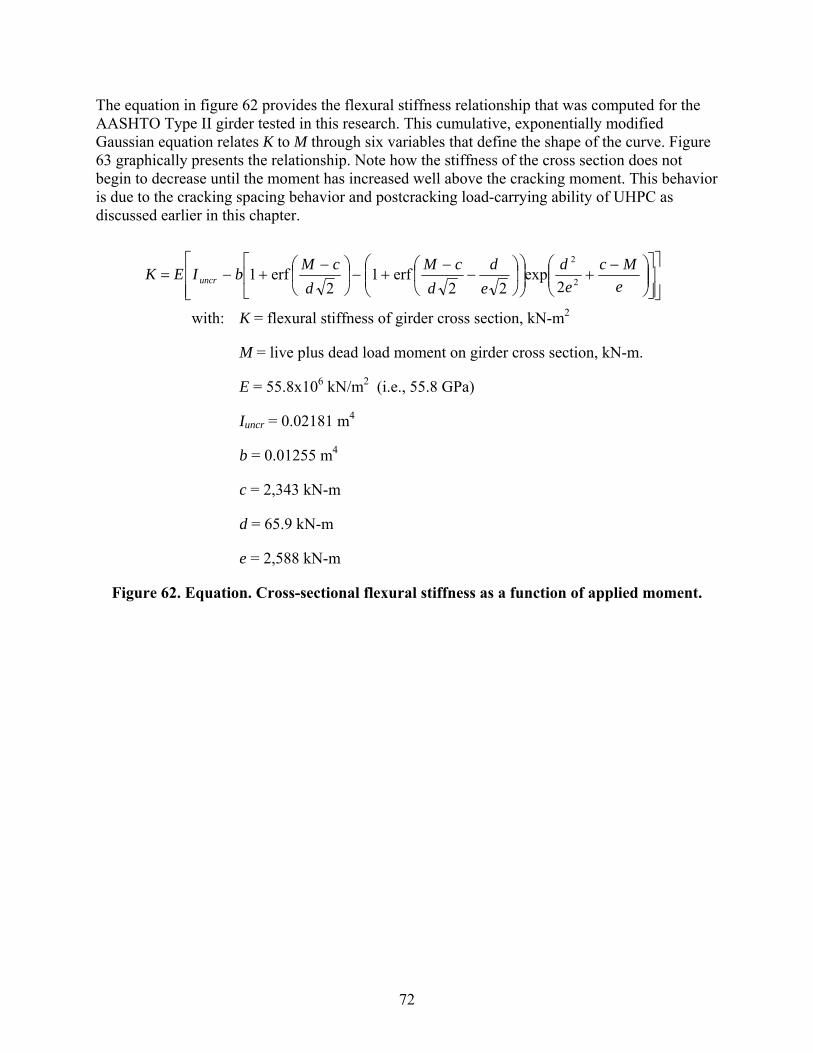
72
The equation in figure 62 provides the flexural stiffness relationship that was computed for the AASHTO Type II girder tested in this research. This cumulative, exponentially modified Gaussian equation relates K to M through six variables that define the shape of the curve. Figure 63 graphically presents the relationship. Note how the stiffness of the cross section does not begin to decrease until the moment has increased well above the cracking moment. This behavior is due to the cracking spacing behavior and postcracking load-carrying ability of UHPC as discussed earlier in this chapter.
with: K = flexural stiffness of girder cross section, kN-m2
M = live plus dead load moment on girder cross section, kN-m.
E = 55.8x10⁶ kN/m2 (i.e., 55.8 GPa)
Iuncr = 0.02181 m4
b = 0.01255 m4
c = 2,343 kN-m
d = 65.9 kN-m
e = 2,588 kN-m
Figure 62. Equation. Cross-sectional flexural stiffness as a function of applied moment.
⎥⎥⎦
⎤
⎢⎢⎣
⎡⎥⎦
⎤⎢⎣
⎡⎟⎟⎠
⎞⎜⎜⎝
⎛ −+⎟⎟
⎠
⎞⎜⎜⎝
⎛⎟⎠
⎞⎜⎝
⎛−
−+−⎟
⎠
⎞⎜⎝
⎛ −+−=
eMc
ed
ed
dcM
dcMbIEK uncr 2
2
2exp
22erf1
2erf1
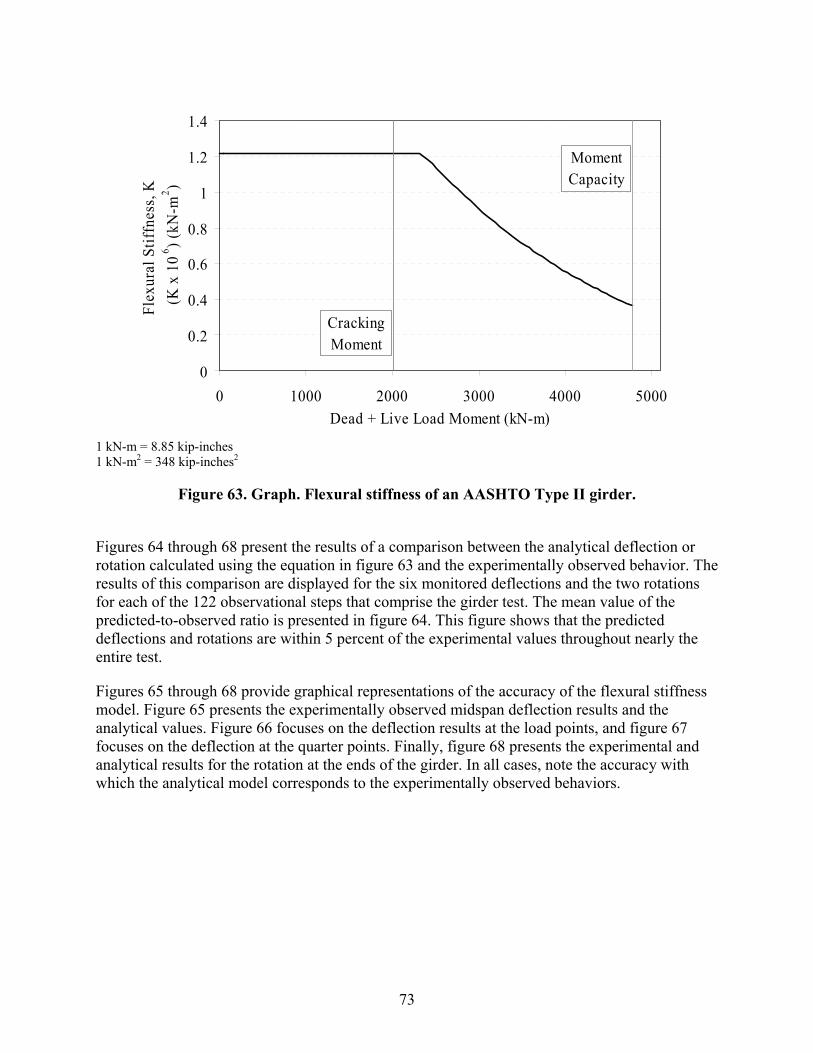
73
1 kN-m = 8.85 kip-inches 1 kN-m2 = 348 kip-inches2
Figure 63. Graph. Flexural stiffness of an AASHTO Type II girder.
Figures 64 through 68 present the results of a comparison between the analytical deflection or rotation calculated using the equation in figure 63 and the experimentally observed behavior. The results of this comparison are displayed for the six monitored deflections and the two rotations for each of the 122 observational steps that comprise the girder test. The mean value of the predicted-to-observed ratio is presented in figure 64. This figure shows that the predicted deflections and rotations are within 5 percent of the experimental values throughout nearly the entire test.
Figures 65 through 68 provide graphical representations of the accuracy of the flexural stiffness model. Figure 65 presents the experimentally observed midspan deflection results and the analytical values. Figure 66 focuses on the deflection results at the load points, and figure 67 focuses on the deflection at the quarter points. Finally, figure 68 presents the experimental and analytical results for the rotation at the ends of the girder. In all cases, note the accuracy with which the analytical model corresponds to the experimentally observed behaviors.
0
0.2
0.4
0.6
0.8
1
1.2
1.4
0 1000 2000 3000 4000 5000Dead + Live Load Moment (kN-m)
Flex
ural
Stif
fnes
s, K
(K x
106 ) (
kN-m
2 )
Cracking Moment
Moment Capacity
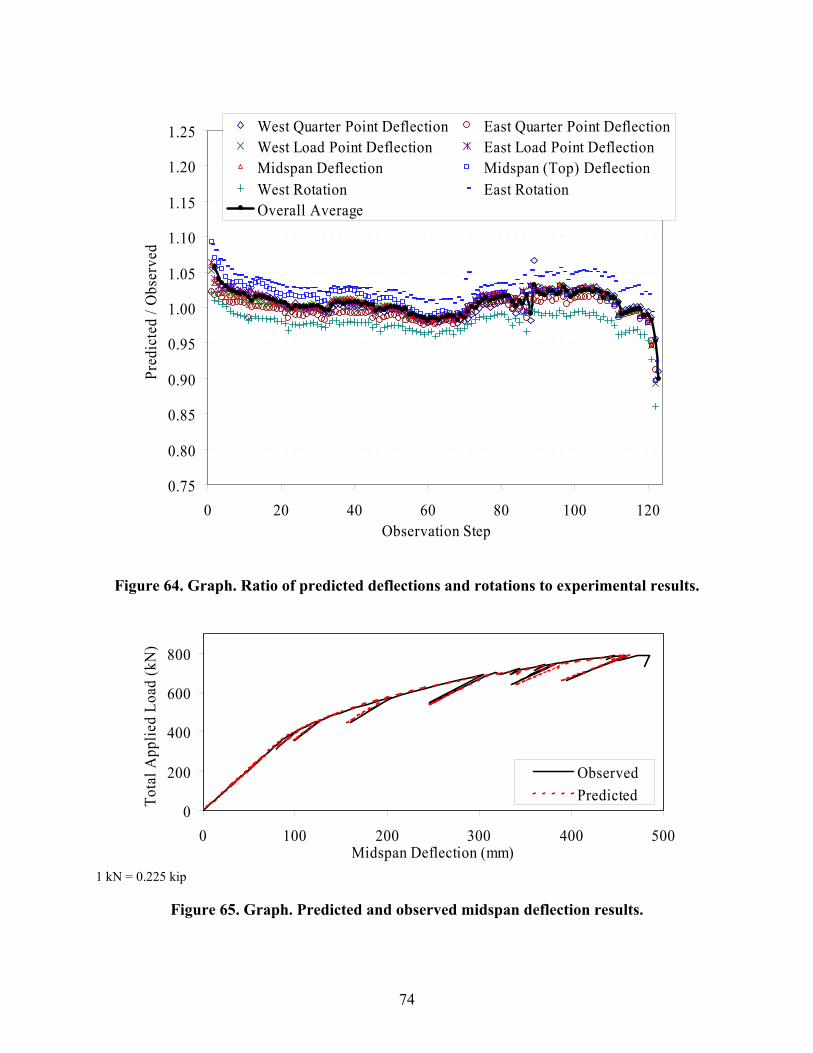
74
Figure 64. Graph. Ratio of predicted deflections and rotations to experimental results.
1 kN = 0.225 kip
Figure 65. Graph. Predicted and observed midspan deflection results.
0.75
0.80
0.85
0.90
0.95
1.00
1.05
1.10
1.15
1.20
1.25
0 20 40 60 80 100 120Observation Step
Pred
icte
d / O
bser
ved
West Quarter Point Deflection East Quarter Point DeflectionWest Load Point Deflection East Load Point DeflectionMidspan Deflection Midspan (Top) DeflectionWest Rotation East RotationOverall Average
0
200
400
600
800
0 100 200 300 400 500Midspan Deflection (mm)
Tota
l App
lied
Load
(kN
)
ObservedPredicted
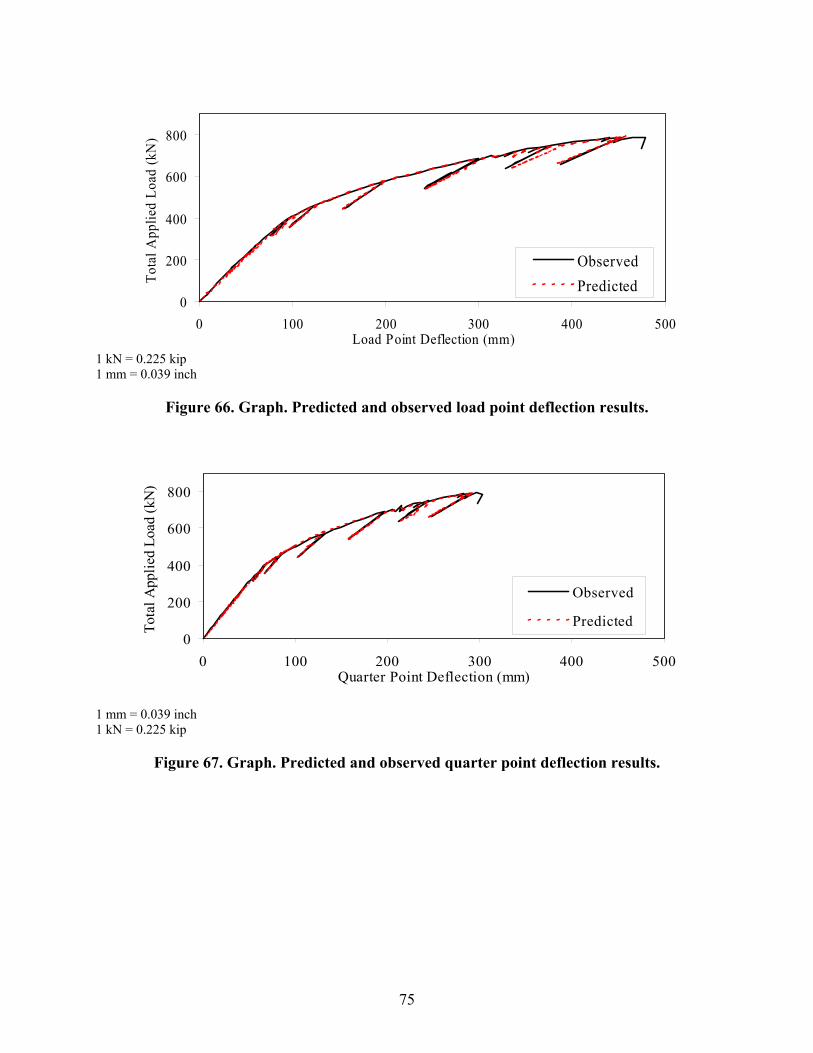
75
1 kN = 0.225 kip 1 mm = 0.039 inch
Figure 66. Graph. Predicted and observed load point deflection results.
1 mm = 0.039 inch 1 kN = 0.225 kip
Figure 67. Graph. Predicted and observed quarter point deflection results.
0
200
400
600
800
0 100 200 300 400 500Load Point Deflection (mm)
Tota
l App
lied
Load
(kN
)
ObservedPredicted
0
200
400
600
800
0 100 200 300 400 500Quarter Point Deflection (mm)
Tota
l App
lied
Load
(kN
)
Observed
Predicted
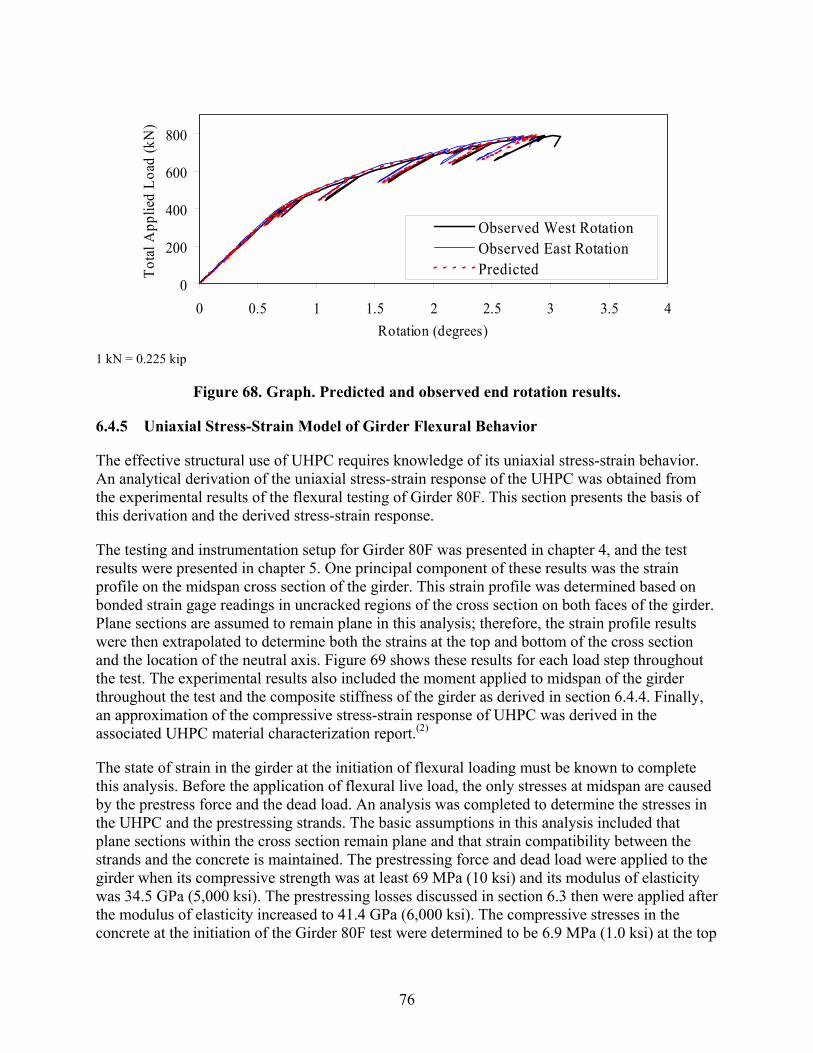
76
1 kN = 0.225 kip
Figure 68. Graph. Predicted and observed end rotation results.
6.4.5 Uniaxial Stress-Strain Model of Girder Flexural Behavior
The effective structural use of UHPC requires knowledge of its uniaxial stress-strain behavior. An analytical derivation of the uniaxial stress-strain response of the UHPC was obtained from the experimental results of the flexural testing of Girder 80F. This section presents the basis of this derivation and the derived stress-strain response.
The testing and instrumentation setup for Girder 80F was presented in chapter 4, and the test results were presented in chapter 5. One principal component of these results was the strain profile on the midspan cross section of the girder. This strain profile was determined based on bonded strain gage readings in uncracked regions of the cross section on both faces of the girder. Plane sections are assumed to remain plane in this analysis; therefore, the strain profile results were then extrapolated to determine both the strains at the top and bottom of the cross section and the location of the neutral axis. Figure 69 shows these results for each load step throughout the test. The experimental results also included the moment applied to midspan of the girder throughout the test and the composite stiffness of the girder as derived in section 6.4.4. Finally, an approximation of the compressive stress-strain response of UHPC was derived in the associated UHPC material characterization report.(2)
The state of strain in the girder at the initiation of flexural loading must be known to complete this analysis. Before the application of flexural live load, the only stresses at midspan are caused by the prestress force and the dead load. An analysis was completed to determine the stresses in the UHPC and the prestressing strands. The basic assumptions in this analysis included that plane sections within the cross section remain plane and that strain compatibility between the strands and the concrete is maintained. The prestressing force and dead load were applied to the girder when its compressive strength was at least 69 MPa (10 ksi) and its modulus of elasticity was 34.5 GPa (5,000 ksi). The prestressing losses discussed in section 6.3 then were applied after the modulus of elasticity increased to 41.4 GPa (6,000 ksi). The compressive stresses in the concrete at the initiation of the Girder 80F test were determined to be 6.9 MPa (1.0 ksi) at the top
0
200
400
600
800
0 0.5 1 1.5 2 2.5 3 3.5 4Rotation (degrees)
Tota
l App
lied
Load
(kN
)
Observed West RotationObserved East RotationPredicted
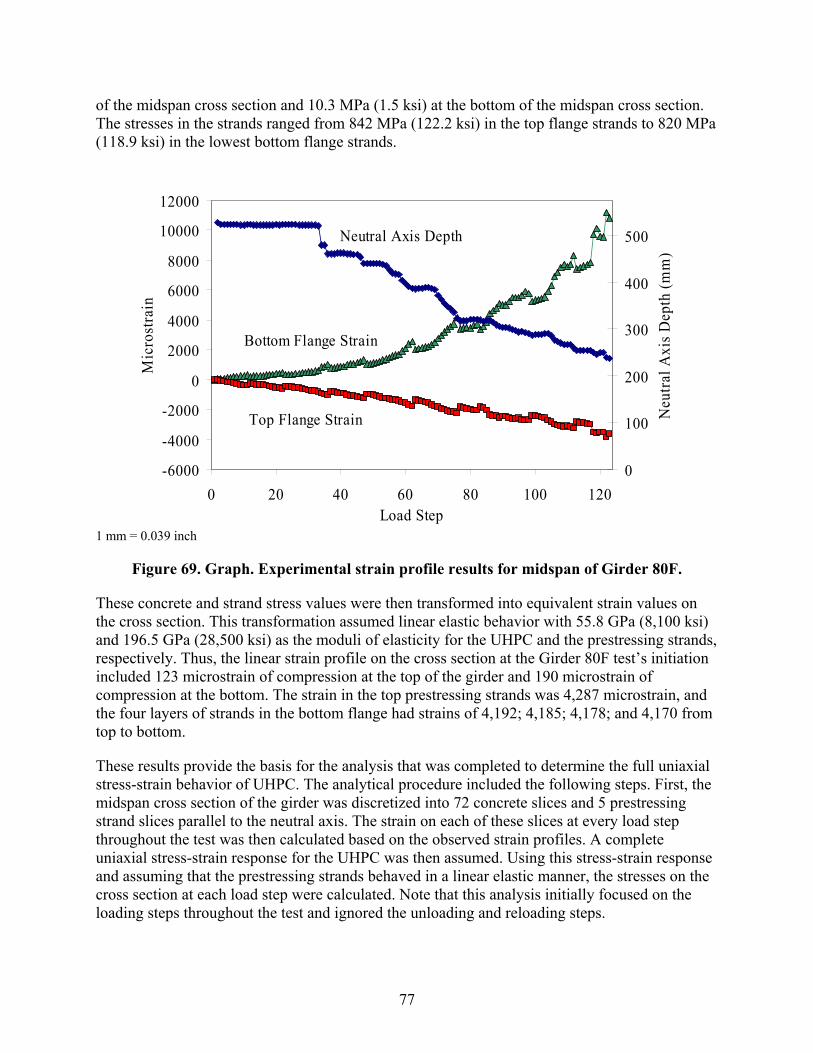
77
of the midspan cross section and 10.3 MPa (1.5 ksi) at the bottom of the midspan cross section. The stresses in the strands ranged from 842 MPa (122.2 ksi) in the top flange strands to 820 MPa (118.9 ksi) in the lowest bottom flange strands.
1 mm = 0.039 inch
Figure 69. Graph. Experimental strain profile results for midspan of Girder 80F.
These concrete and strand stress values were then transformed into equivalent strain values on the cross section. This transformation assumed linear elastic behavior with 55.8 GPa (8,100 ksi) and 196.5 GPa (28,500 ksi) as the moduli of elasticity for the UHPC and the prestressing strands, respectively. Thus, the linear strain profile on the cross section at the Girder 80F test’s initiation included 123 microstrain of compression at the top of the girder and 190 microstrain of compression at the bottom. The strain in the top prestressing strands was 4,287 microstrain, and the four layers of strands in the bottom flange had strains of 4,192; 4,185; 4,178; and 4,170 from top to bottom.
These results provide the basis for the analysis that was completed to determine the full uniaxial stress-strain behavior of UHPC. The analytical procedure included the following steps. First, the midspan cross section of the girder was discretized into 72 concrete slices and 5 prestressing strand slices parallel to the neutral axis. The strain on each of these slices at every load step throughout the test was then calculated based on the observed strain profiles. A complete uniaxial stress-strain response for the UHPC was then assumed. Using this stress-strain response and assuming that the prestressing strands behaved in a linear elastic manner, the stresses on the cross section at each load step were calculated. Note that this analysis initially focused on the loading steps throughout the test and ignored the unloading and reloading steps.
-6000
-4000
-2000
0
2000
4000
6000
8000
10000
12000
0 20 40 60 80 100 120Load Step
Mic
rost
rain
0
100
200
300
400
500
Neu
tral A
xis D
epth
(mm
)
Neutral Axis Depth
Bottom Flange Strain
Top Flange Strain
78
The summation of the stresses in the concrete and the strands then were compared to ensure that the internal forces on the cross section were in equilibrium at every load step. The assumed UHPC uniaxial stress-strain response was repeatedly modified, and the calculations were recomputed until the internal forces on the cross section were sufficiently coincident. Figure 70 shows the uniaxial stress-strain response that was derived through this analytical technique. Figure 71 shows the force in the concrete, the force in the strands, and the ratio of the two values for each load step. On all loading steps the concrete and strand forces are within 7 percent of one another. This result is considered sufficiently accurate, given the experimental variability inherent in the test results that are the basis for these calculations.
Figure 70 is composed of four separate curves. Each curve defines a portion of the behavior. In compression, the UHPC follows the relationship defined in the associated UHPC material characterization report with a modulus of elasticity of 55.8 GPa (8,100 ksi).(2) The initial tensile behavior of UHPC is considered to be linear elastic with an 55.8-GPa (8,100-ksi) modulus of elasticity. The postcracking behavior of UHPC also is shown in figure 70, with an initial modulus of elasticity of 34.5 GPa (5,000 ksi). The final portion of the behavior is the tensile transition zone during the initial cracking of the concrete. This transition allows the UHPC to transform from an uncracked, elastic material into a significantly cracked material that is still capable of carrying tensile loads.
Note that the UHPC has to carry 20.7 MPa (3.0 ksi) of tensile stress before the cross section becomes sufficiently cracked to cause the stress-carrying capacity to decrease. This value is well above the tensile cracking strength that was determined in the UHPC material property characterization testing, because those tests focused on first cracking while the girder test focused on sufficient cracking to change global behaviors. Small-scale tensile tests tend to limit the load path redundancy, thus allowing initial crack(s) to grow longer and wider before other cracks form. Full-scale prestressed girders offer redundancy in two ways. First, the prestressing strands tend to help maintain tight cracks. Second, the large scale of the girder eliminates the localized stiffness effects caused by single cracks on prism flexure specimens.
To complete this analysis, the unloading and reloading behaviors of UHPC were investigated. Similar to most structural materials, after UHPC undergoes inelastic deformation, subsequent unloading and reloading of the concrete causes it to behave in a linear elastic manner with a reduced modulus of elasticity. This continues until new strain levels are attained. In this analysis, UHPC not experiencing peak tensile or compressive strains was assumed to behave in a linear elastic manner with a stiffness equal to the secant modulus of elasticity of the peak strain ever attained. This assumption was used both in tension and compression. For the postcracking tensile behaviors, as shown in figure 70, the origin for the secant modulus was shifted to the location where the red curve is shown to intersect the x-axis. In the tensile cracking transition region, the secant moduli were calculated just before and after the transition region. The secant values in the transition region were then linearly interpolated from these end values.
The results of this analysis are presented in figure 72. This figure shows the experimentally captured external moments that were applied to the midspan cross section. The figure also shows the internal moments on the cross section caused by the assumed stress-strain response at every

79
1 MPa = 145 psi
Figure 70. Graph. Analytically derived uniaxial stress-strain behavior of UHPC.
-200
-150
-100
-50
0
50
-4000 -2000 0 2000 4000 6000 8000 10000Microstrain
Stre
ss (M
Pa)
-10
0
10
20
30
-500 0 500 1000 1500 2000Microstrain
Stre
ss (M
Pa)
Post Cracking Behavior
Transitional Behavior
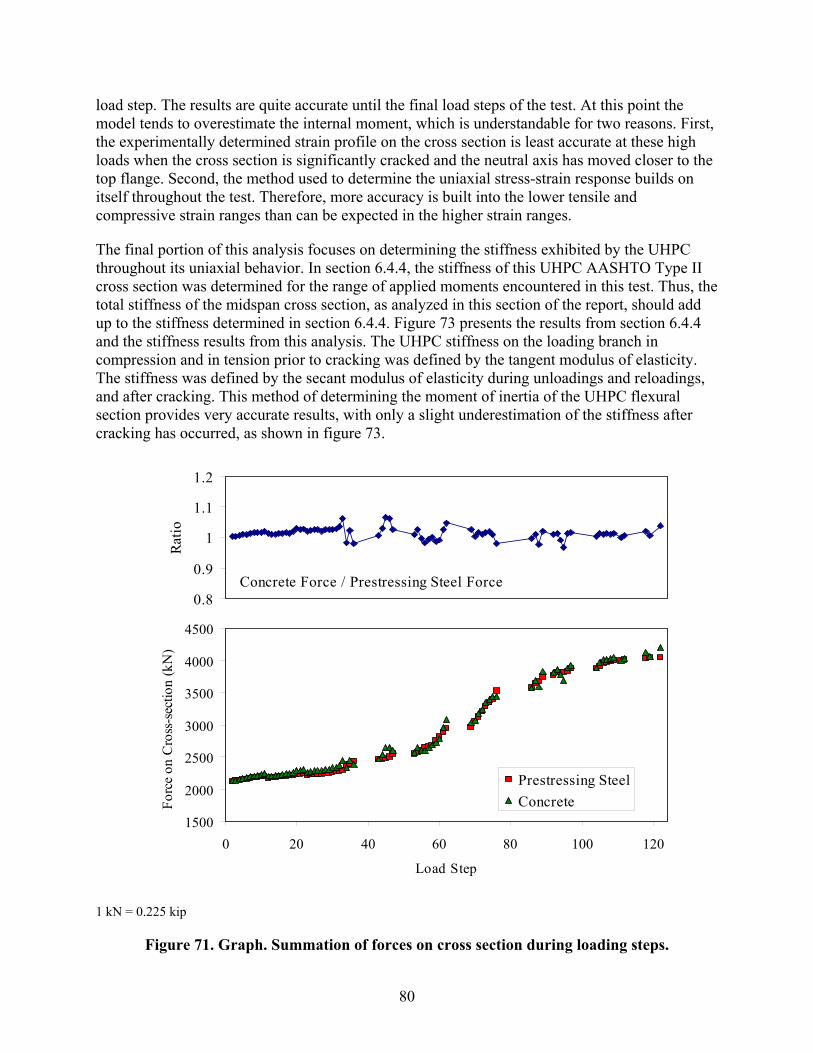
80
load step. The results are quite accurate until the final load steps of the test. At this point the model tends to overestimate the internal moment, which is understandable for two reasons. First, the experimentally determined strain profile on the cross section is least accurate at these high loads when the cross section is significantly cracked and the neutral axis has moved closer to the top flange. Second, the method used to determine the uniaxial stress-strain response builds on itself throughout the test. Therefore, more accuracy is built into the lower tensile and compressive strain ranges than can be expected in the higher strain ranges.
The final portion of this analysis focuses on determining the stiffness exhibited by the UHPC throughout its uniaxial behavior. In section 6.4.4, the stiffness of this UHPC AASHTO Type II cross section was determined for the range of applied moments encountered in this test. Thus, the total stiffness of the midspan cross section, as analyzed in this section of the report, should add up to the stiffness determined in section 6.4.4. Figure 73 presents the results from section 6.4.4 and the stiffness results from this analysis. The UHPC stiffness on the loading branch in compression and in tension prior to cracking was defined by the tangent modulus of elasticity. The stiffness was defined by the secant modulus of elasticity during unloadings and reloadings, and after cracking. This method of determining the moment of inertia of the UHPC flexural section provides very accurate results, with only a slight underestimation of the stiffness after cracking has occurred, as shown in figure 73.
1 kN = 0.225 kip
Figure 71. Graph. Summation of forces on cross section during loading steps.
1500
2000
2500
3000
3500
4000
4500
0 20 40 60 80 100 120
Load Step
Forc
e on
Cro
ss-s
ectio
n (k
N)
Prestressing SteelConcrete
0.8
0.9
1
1.1
1.2
Ratio
Concrete Force / Prestressing Steel Force
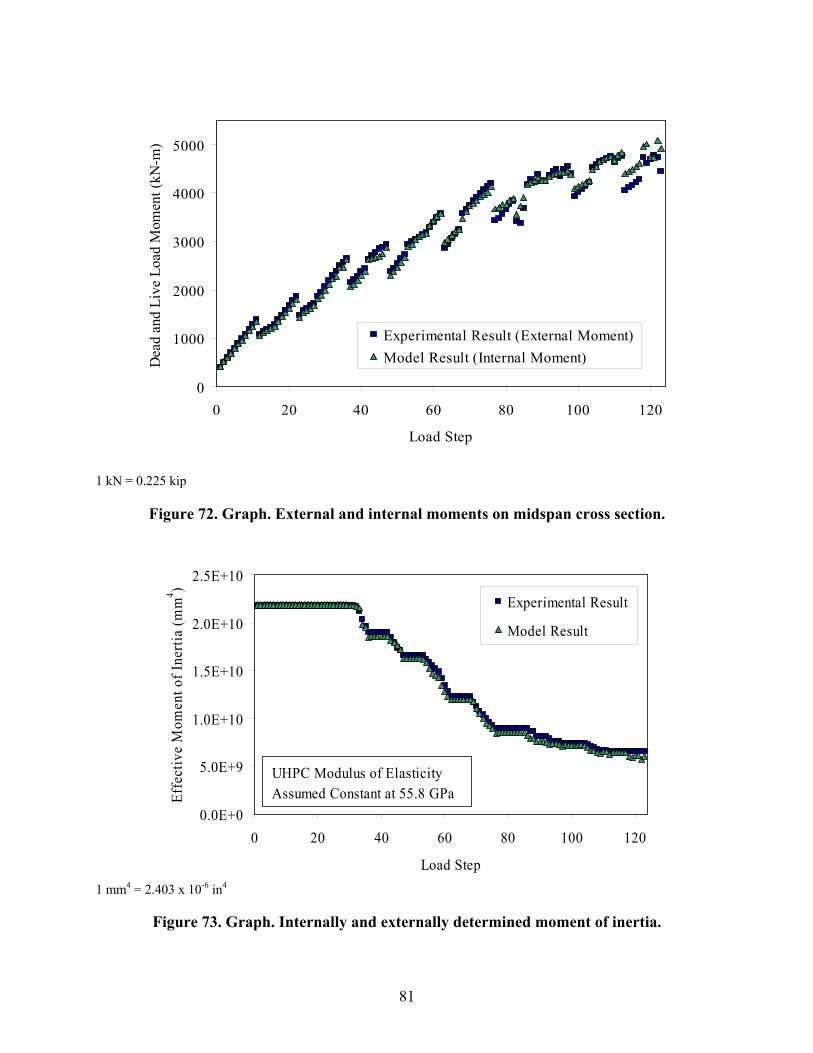
81
1 kN = 0.225 kip
Figure 72. Graph. External and internal moments on midspan cross section.
1 mm4 = 2.403 x 10⁻⁶ in4
Figure 73. Graph. Internally and externally determined moment of inertia.
0
1000
2000
3000
4000
5000
0 20 40 60 80 100 120
Load Step
Dea
d an
d Li
ve L
oad
Mom
ent (
kN-m
)
Experimental Result (External Moment)Model Result (Internal Moment)
0.0E+0
5.0E+9
1.0E+10
1.5E+10
2.0E+10
2.5E+10
0 20 40 60 80 100 120
Load Step
Effe
ctiv
e M
omen
t of I
nerti
a (m
m4 )
Experimental Result
Model Result
UHPC Modulus of Elasticity Assumed Constant at 55.8 GPa
82
6.5 SHEAR BEHAVIOR OF PRESTRESSED UHPC GIRDERS CONTAINING NO MILD STEEL
Three AASHTO Type II prestressed UHPC girders were failed in shear as part of this research program. The results of these tests were presented in chapter 5. This section combines the results from these three tests. First, the shear capacity results are compared with the predicted capacity calculation results. Second, the shear cracking behavior of UHPC is discussed. The final part of this section focuses on a truss model developed to explain the behaviors observed in one particular shear test.
6.5.1 Predicted Versus Actual Global Behavior
The primary goal of the three full-scale shear tests was to determine the shear capacity of prestressed UHPC girders. To summarize the results presented in chapter 5, Girder 28S had a shear capacity of 1,710 kN (384 kips) and failed due to a preexisting horizontal crack at the base of the web. Girder 24S had a shear capacity of 2,230 kN (502 kips) and failed due to diagonal tension in the shear region. Girder 14S had a shear capacity of 1,950 kN (438 kips) and failed due to a combination of diagonal tension and strand slip. These results indicate that the shear capacity of a 0.91-m-deep (36-inch-deep) prestressed concrete girder can be as high as 2,230 kN (500 kips) without any standard shear reinforcement. Under a normal loading condition, in which strand slip might be expected, a shear capacity of more than 1,780 kN (400 kips) still can be expected.
Predicting the shear capacity of these UHPC girders can be attempted through the use of standard structural design procedures. However, because UHPC exhibits strengths well beyond the limits of most structural design codes, those code provisions cannot necessarily predict the shear behavior of UHPC girders. Most codes predict the shear capacity of prestressed concrete girders by dividing the shear resistance into three terms. These terms include the contributions from the concrete, the mild reinforcing steel, and the prestressing strands. Because these UHPC girders contained no mild steel and no draped strands, the only relevant term is the concrete resistance to shear forces.
For comparative purposes, an AASHTO Type II girder, similar to those discussed in this report, was analyzed to determine its shear resistance. This prestressed girder was composed of 55-MPa (8-ksi) concrete and contained #4 stirrups at a 102-mm (4-inch) spacing. According to the AASHTO Standard Specifications for Highway Bridges, this girder would have exhibited a nominal shear capacity of approximately 1,110 kN (250 kips), with half of the capacity coming from the concrete and half from the stirrups.(13) Although this level of shear capacity is significant for this depth of girder, it also illustrates the high level of shear capacity achieved with the UHPC girders.
The Association Française de Génie Civil (AFGC) Interim Recommendations for Ultra High Performance Fibre-Reinforced Concretes is one design aid that does directly address the contribution of fiber reinforcement to shear capacity.(1) In this document, the ultimate shear strength of the cross section is defined as the composed portions contributed by the concrete, the standard steel reinforcement, and the fiber reinforcement. For the UHPC girders tested in this study, the concrete contribution to the shear capacity, VRb, is given by the equation in figure 74.

83
In this equation, γEγb is a safety factor defined to equal 1.5. The compressive strength is fc’, b0 is the web width, and z is the lever arm at the ultimate moment. The lever arm is assumed to equal the distance from the center of the compression block to the center of the strands, or 0.67 m (26.5 inches) for these girders. Thus, the design value for the concrete contribution to the shear capacity is 227 kN (51 kips). Alternatively, because this equation is being used to model experimentally observed behaviors, setting the factor of safety terms to equal 1.0 results in a concrete contribution to the shear capacity of 343 kN (77 kips).
Figure 74. Equation. Shear capacity as a function of concrete strength.
The fiber contribution, Vf, within the AFGC recommended provisions is defined by the equation in figure 75. The variable S is the area of the shear plane being considered. This variable is assumed to equal 90 percent of the web width multiplied by the depth to the centroid of the prestressing strands. βu is the angle of the compression struts in the shear area as measured from the horizontal. The assumption that the angle is 40° is a conservative estimate of the angle based on the prestressed concrete girder behavior. The variable γbf defines a factor of safety that is set equal to 1.3. Finally, σp defines the average residual tensile stress carried by the fibers across a shear crack from cracking until a limiting strain value is achieved. This value is normally based on experimental tension test results. In this case, based on the results presented in section 6.4 and the associated material characterization report, the residual tensile stress will be assumed to be 6.9 MPa (1.0 ksi).(2) Thus, the design value for the fiber contribution to the UHPC shear capacity is 695 kN (156 kips). Alternatively, setting the factor of safety terms again to 1.0 results in a fiber contribution to the shear capacity of 760 kN (170 kips).
Figure 75. Equation. Fiber contribution to shear strength.
These girders contain no mild steel reinforcement and the prestressing strands are not draped; therefore, the concrete and fiber contributions are the only two items relevant to determining the shear capacity. In total, the AFGC recommendations indicate that the ultimate design shear capacity of the AASHTO Type II prestressed girders tested in this study is 921 kN (207 kips). Eliminating the factor of safety terms produces the true AFGC estimate of the shear capacity, which is 1,100 kN (247 kips). Although this method of estimating the shear capacity of UHPC girders is more rigorous than many shear capacity calculations, the method still clearly significantly underestimates the shear capacity of these UHPC girders.
6.5.2 Cracking Behavior
The shear cracking of the UHPC girders during the shear tests is again indicative of the structural cracking behaviors associated with UHPC. First, this section discusses the cracking behaviors
zbfV cbE
Rb 0'24.0
γγ=
ubf
pf
SV
βγσtan
=
84
observed during the shear tests. Then the cracking behavior of Girder 24S is analyzed to determine the effective prestress force applied to the girder.
Girders 24S and 14S both exhibited diagonal web shear cracking that eventually led to the failure of the girders. Girder 24S first exhibited shear cracking at a shear load of 1,130 kN (254 kips). The cracking initiated in the portion of the shear span closer to the load point, because this location experienced both high shear stresses and larger flexural forces. The angle of the shear cracks at this location was approximately 35° from the horizontal. Girder 14S first exhibited shear cracking at a shear load of 912 kN (205 kips). Again, shear cracking initiated in the web close to the load point with an angle of 38° from the horizontal.
The number of shear cracks in both girders increased as the shear load increased. Initially, the cracks were spaced approximately 25 mm (1 inch) apart throughout the web from the load point to the bearing. As the test progressed, the crack spacing decreased as more cracks appeared until the crack spacing had decreased to 6 mm (0.25 inch) or less in some locations.
As presented in chapter 4, Girder 24S failed when the fibers bridging a highly stressed shear crack began to pull out. In this girder, the loss of tensile capacity across the shear crack resulted in immediate failure because the shear forces could not be redistributed around the crack. The cracking and eventual fiber pullout across a crack in Girder 14S resulted in a different type of failure. In this girder, the shear capacity and girder stiffness decreased simultaneously as the fibers pulled out and the strands slipped, thus allowing for a slow decrease in shear capacity until more than one-fourth of the shear load had been shed.
The first cracking behavior of a prestressed girder is indicative of both the tensile cracking strength and the level of prestress applied to the girder. The method used to test Girder 24S resulted in the prestressing strands fully transferring their stress into the girder outside of the highly stressed shear region. The analysis of this girder enabled the verification of the prestress force and tensile cracking strength values that were discussed previously. Shear and flexural strains at cracking on an element in the web of this girder located under the rosette strain gage closest to the load point indicate that 161 microstrain of tension caused cracking. If the tensile cracking strain of UHPC is assumed to be 200 microstrain, the effective prestress force on this girder would be 2,025 kN (455 kips), which was determined in section 6.3. Note that a 200-microstrain tensile cracking strain would correspond to a 55.2-GPa (8000-ksi) modulus of elasticity with linear elastic behavior through cracking at 11 MPa (1.6 ksi). This tensile cracking behavior is consistent with the behaviors discussed in the associated UHPC material characterization report.(2)
6.5.3 Simplified Model of UHPC Girder Shear Failure
The girder shear behaviors observed during the testing of Girders 24S and 14S indicate that the shear behavior of a UHPC I-girder containing no mild steel shear reinforcement is less complex than is normally associated with a concrete girder. For example, determination of the shear capacity of a concrete girder could involve the estimation of the capacity provided by the concrete alone, the capacity provided by the mild steel reinforcement alone, and the capacity that results from the interaction of the mild steel reinforcement to enhance the concrete capacity. The terms associated with concrete behavior are normally difficult to ascertain and frequently are
85
approximated through empirical relationships. Observations from the UHPC girder tests indicate that the shear behaviors of a UHPC girder as failure is approached are significantly less complicated and lend themselves to basic modeling and approximation procedures.
The descriptions of the failure of Girder 24S, in particular the photographs shown in figure 38, clearly illustrate that the failure of this girder was caused by diagonal tensile forces in the highly stressed shear region of the girder. Because this UHPC girder contained no mild steel, this tensile failure of the concrete was not influenced by reinforcing bars bridging the cracks. Also, because UHPC has a very fine granular structure, it is not anticipated that any significant level of aggregate interlock could be present in a UHPC girder. All indications—including the observations of many tightly spaced cracks parallel to the eventual tensile failure plane—lead to the conclusion that simply determining the vertical component of the tensile stress capacity over the expected shear failure plane would provide an indication of the shear capacity of the girder.
This simple analytical procedure is conceptually equivalent to the fiber contribution to shear capacity (detailed in the AFGC recommended provisions and discussed in section 6.5.1). In the AFGC design procedure, the fiber contribution to the shear capacity is composed of terms representing the average tensile capacity of UHPC at failure, the angle of the failure plane relative to the girder, and a partial depth of the cross section. Algebraic manipulation shows that the AFGC equation actually estimates the shear failure plane area, multiplies it by the average estimated tensile stress over the failure plane, and converts the result into a vertical component that is useful for shear calculations.
Thus, the knowledge of two girder-specific properties and one material property allows for the estimation of the shear capacity of the girder. During design, the angle of the failure plane can be estimated based on the level of prestress in the girder. The area of the failure plane is more difficult to estimate. However, it should be able to be bounded based on the thickness of the web, the height of the web and web transitions, and the angle of the failure plane. Finally, the average tensile stress exhibited by UHPC prior to fiber pullout must be estimated based on prior knowledge of the material behavior.
Test results from Girders 24S and 14S can be used to illustrate the capabilities of this simple analytical procedure. The failure plane angles in these two girders were measured to be 28° and 25° from the horizontal, respectively. The peak shear loads carried by these girders before the fiber pullout were 2,225 and 1,950 kN (500 and 438 kips), respectively. The depth of the cross section that the failure plane traverses can be estimated to be between the depth of the web, 0.38 m (15 inches), and the AFGC recommended depth, 0.71 m (28 inches). Observed shear cracking behaviors during the tests indicate that most diagonal tensile shear loads were carried by the girders within the web and a small part of the web transitions. Thus, for this analysis the depth of the failure plane is assumed to be 0.48 m (19 inches). By assuming this depth of failure plane over the width of the web at the failure plane angles mentioned above, the geometry of the failure surface has been defined. Using these values, the average tensile stress in Girder 24S is determined to be 15.9 MPa (2.3 ksi). In Girder 14S the value is determined to be 12.4 MPa (1.8 ksi).
These average tensile stress values before fiber pullout are reasonable approximations of UHPC behavior based on results presented elsewhere in this report. The tensile stress-strain behavior derived in section 6.4.5 and presented in figure 70 is of greater relevance for this discussion. In
86
that analysis of the flexural loading of a prestressed girder, the figure shows that the average tensile stress prior to fiber pullout was more than 17.2 MPa (2.5 ksi). Because the shear regions in Girders 24S and 14S were not supplementally reinforced by prestressing strands like the bottom flange of a prestressed girder, it is understandable that the average stress across the failure plane might be lower prior to fiber pullout. Regardless, this analytical procedure clearly provides a reasonable interpretation of shear failure behavior based on sound engineering principles without reverting to empirical relationships.
6.5.4 Strut-and-Tie Model of Girder 28S Failure
The fiber-reinforced concrete matrix is capable of carrying and dispersing both tensile and compressive loads. Therefore, in general, truss modeling of UHPC behavior is likely to be less useful than truss modeling on normal or HPC behavior. Thus, the tension ties that are a major part of most truss models become significantly less relevant with UHPC.
However, the final failure of Girder 28S involved crushing of the web concrete and tensile rupture of the top flange. These behaviors were not expected in a girder shear test, which leads to the development of a truss model to explain the global behavior at failure. Recall that this girder test included the development of a shearing plane along the base of the web in the highly stressed shear region.
Figure 76 displays the truss system that was developed to model the failure of Girder 28S. In this figure, the brown dashed lines indicate compression struts while the solid green lines indicate tension ties. The design of this model includes a complete delamination of the web from the bottom flange within the highly stressed shear region, which ensures that no forces were able to transfer across this boundary.
At failure, the applied load on this girder was 2,225 kN (500 kips), with 1,710 kN (384 kips) being carried by the east support. Given this loading, the forces in kN in the compression struts of the truss model include: A = –1,109, B = –1,598, C = –338, D = –1,455, E = –1,046, H = –1,041, J = –2,092, K = –156, P = –3,493, Q = –2,407, S = –1,486, and T = –3,582. The forces in the tension ties include: F = 1,068, G = 1,099, I = 961, L = 1,210, and N = 2,861.
Although truss models provide an upper bound to the solution, an examination of this answer indicates that it is a reasonable solution. In particular, a detailed analysis shows that the node connecting seven compression struts just above the bearing is the critical node. As was observed in the girder test, the compression forces shown in the struts would create a compression failure of this 193-MPa (28-ksi) UHPC at this node. This model also reasonably predicts the subsequent tensile failure of the top flange above the bearing. Tension tie L shown in figure 76 carries 1,210 kN (272 kips). This load is large enough to cause tensile cracking of the UHPC top flange and to initiate fiber pullout leading to strain localization in the strands and strand rupture.
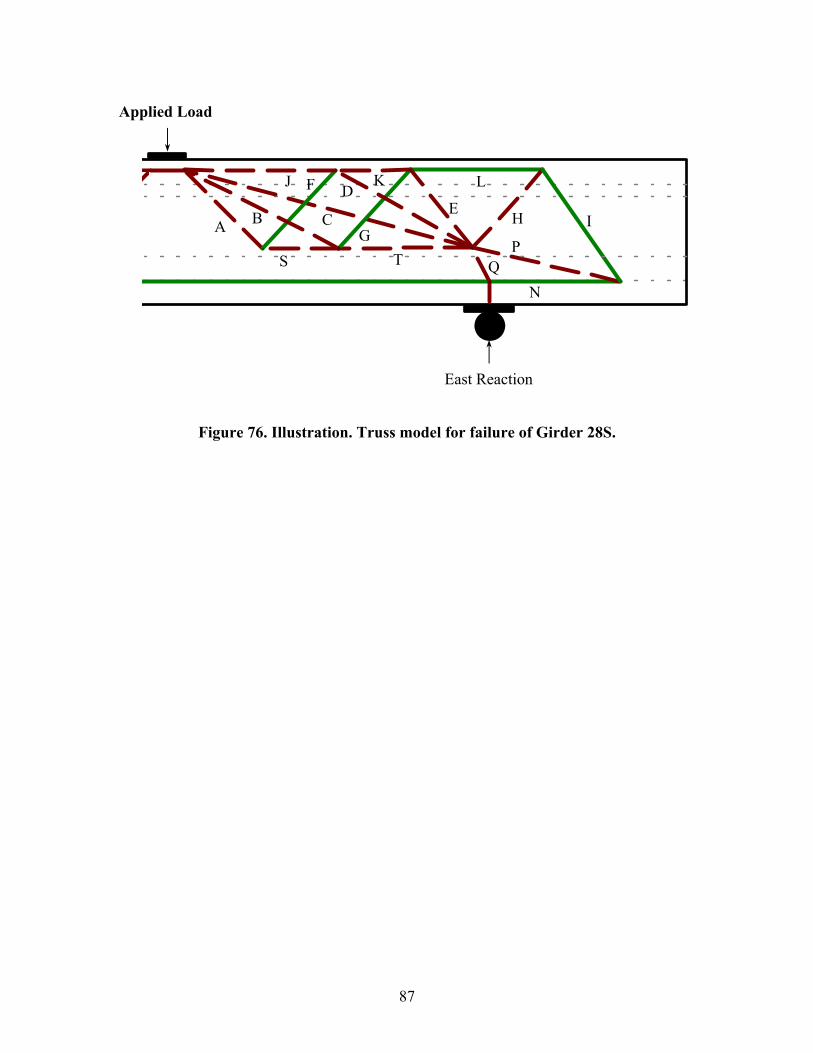
87
Figure 76. Illustration. Truss model for failure of Girder 28S.
A B C
D E
F
G H I
J K L
N
P Q S T
Applied Load
East Reaction


89
CHAPTER 7. DESIGN PHILOSOPHY FOR UHPC BRIDGE GIRDERS
7.1 INTRODUCTION
The experimental research and associated analyses undertaken in this research program provide significant insight into the potential structural behavior of UHPC bridge girders. The design of prestressed concrete I-girders normally focuses on flexural and shear behaviors. The results of this research program indicate that the flexural and shear behaviors of prestressed I-girders that are composed of UHPC can be modeled through straightforward analytical procedures. Therefore, rational design of UHPC I-girders based on these same analytical principles is possible. This chapter presents a rational design philosophy for prestressed UHPC I-girders.
7.2 FLEXURE
The flexural behavior of an AASHTO Type II UHPC girder has been extensively discussed in this report. The behavior of this girder from initial elastic loading through failure was analyzed to determine the contribution of the UHPC to the overall flexural behaviors of the girder. Figure 70 provides the analytically determined uniaxial stress-strain response of UHPC within the girder during the test. With this knowledge, the flexural design for other prestressed I-girders is possible.
The design of a prestressed UHPC I-girder for flexure requires only two factors. First, a conservative approximation of the UHPC’s uniaxial stress-strain response must be applied to the cross section. Second, the occurrence of the expected flexural behaviors must be ensured. A primary factor must be taken into consideration in an I-girder to ensure the expected UHPC behavior: Sufficient prestressing strands or mild steel reinforcement must exist in the primary flexural tensile regions so that cracks in the UHPC remain tightly closed and closely spaced. Without sufficient gross reinforcement restraining the tensile flexural regions, individual cracks will begin to widen as the fibers pull out, and the tightly spaced cracking, shown in figure 16, probably will not occur.
Determining a sufficiently conservative approximation of UHPC uniaxial stress-strain behavior depends on the structure and on the prescribed design limits. In a situation where cracking of the girder is not allowed at service loads, the girder can easily be designed using normal design procedures with the known modulus of elasticity and tensile cracking strength of UHPC. In a situation where a minimal amount of cracking will be allowed at service loads, a postcracking uniform tensile stress capacity will need to be assumed. Finally, for the ultimate load state, a full compressive and tensile stress-strain response will be required. This response will include an effective tensile strain that causes fiber pullout, a limiting tensile capacity relevant at any strain below the fiber pullout strain, and a limiting compressive strength.
A conservative uniaxial stress-strain response for UHPC could be described by the following three conditions. First, the UHPC could be assumed to behave in a linear elastic manner in compression up to 0.85 times the compressive strength. Second, in tension, the UHPC could be assumed to behave in a rigid-plastic fashion at a conservative percentage of the postcracking tensile capacity at strains below the tensile pullout strain. Third, based on the results presented in this report, sample values could include 165 MPa (24 ksi) for the compressive strength, 10.3

90
MPa (1.5 ksi) for the tensile capacity, and 0.007 for the limiting tensile strain. Figure 77 graphically presents this sample stress-strain behavior.
1 MPa = 145 psi
Figure 77. Graph. Sample uniaxial stress-strain behavior for I-girder flexural design.
Determining the flexural capacity of a UHPC I-girder using a stress-strain response such as the one shown in figure 77 can be completed using basic mechanics of materials concepts. A number of iterations on the neutral axis depth and on the limiting strain condition will likely be needed before a final solution is reached.
7.3 SHEAR
The shear behavior of prestressed UHPC I-girders also was extensively discussed in this report. Three AASHTO Type II prestressed girders that did not contain any mild steel shear reinforcement or any draped prestressing strands were tested to determine their shear capacities. The shear capacities exhibited by these girders were very large in comparison to normal AASHTO Type II girders. The behaviors also were very consistent with the mechanics of materials concepts of the flow of tensile and compressive forces in the shear region of a bridge girder.
A basic design philosophy, based on these results, is proposed to aid in the shear design of UHPC girders. The results presented in section 6.5 indicate that a reasonable estimate of the shear capacity can be determined by assuming that all shear forces are carried by diagonal tension and compression in the web of the girder. Given the high compressive strength of UHPC, the limiting value will be the postcracking tensile stress capacity. The shear capacity of a UHPC girder can be conservatively estimated with the area of the web as a variable and an approximated angle of the diagonal tensile failure plane in the girder. A conservative estimate of the average tensile stress capacity of UHPC must be known before the fiber pullout.
The analyses discussed in section 6.5 indicate that the average tensile strengths in the unreinforced webs of two AASHTO I-girders were 12.4 MPa (1.8 ksi) and 15.9 MPa (2.3 ksi). In
-180
-160
-140
-120
-100
-80
-60
-40
-20
0
20
-0.004 -0.002 0 0.002 0.004 0.006 0.008
Strain
Stre
ss (M
Pa)

91
both cases, conservatively large shear areas were assumed so that the average tensile strength determined was minimized. Regardless, a conservative estimate of the available average tensile strength of UHPC could be set at a reasonable percentage of the observed strengths. From this value, the shear failure plane area required can be determined, which leads directly to the necessary dimensions of the girder web.
To ensure that the expected shear behaviors occur, the girder must be detailed to allow for tight crack spacing and small crack widths in the highly stressed shear region. Therefore, to ensure this cracking behavior, the shear region must be restrained by the top and bottom flanges of the girder. Additionally, draped prestressing strands that pass through highly stressed shear regions will likely help to retard crack growth. However, even with these details, the crack-restraining actions in the web will not be as efficient as the ones that occur in the bottom flange of a prestressed girder. Thus, the tensile stress and strain capacities, discussed in section 7.2, are not expected to be applicable in this situation.
Finally, determining the state of stress in the girder web under prestressing and dead loads is important when designing a prestressed girder for shear. The significant compressive forces in the web could possibly delay the onset of tensile cracking and the eventual tensile fiber pullout behaviors.

93
CHAPTER 8. CONCLUSIONS AND FUTURE RESEARCH
8.1 INTRODUCTION
UHPC is a new type of concrete that exhibits properties of enhanced strength, durability, and long-term stability. The objective of this research was to evaluate the potential use of UHPC in highway bridge girders. This objective was achieved through full-scale structural testing of UHPC AASHTO Type II bridge girders.
The research included an experimental phase and an analytical phase. The experimental phase focused on determining the structural behavior of UHPC prestressed I-girders by completing full-scale girder tests. The tests included one flexure test on a 24.4-m (80-foot) girder and three shear tests on shorter span girders. These girders did not contain any mild steel reinforcement; thus, the UHPC was required to carry all secondary (i.e., shear, temperature, shrinkage) tensile forces. The analytical phase of this research analyzed and elaborated upon the results from the experimental phase. This phase included developing a rational philosophy for the flexure and shear design of prestressed UHPC I-girders.
The conclusions of this study are presented in section 8.2. A brief discussion of ongoing and potential future research topics follows in section 8.3.
8.2 CONCLUSIONS
The following conclusions are based on the research presented in this report.
1. UHPC is a viable substitute for normal concrete and HPC in prestressed I-girders.
2. UHPC I-girders can be designed to more efficiently carry flexure and shear forces. A conservative estimate of the full UHPC tensile and compressive stress-strain behavior could be used to predict the flexural capacity of an I-girder. A conservative estimate of the postcracking tensile capacity could be used to predict the diagonal tensile capacity of UHPC in the shear region of a girder.
3. Placing UHPC in an I-girder formwork can be completed very rapidly with little need for supplemental vibration. UHPC was observed to be nearly self-placing. The ability of UHPC to be reinforced internally by fiber reinforcement allows for the reduction or elimination of most mild steel reinforcement, which greatly simplifies the I-girder formwork preparation. Without taking any special precautions to release the formwork during setting, no shrinkage cracks were observed in the girders.
4. The shear capacities of UHPC AASHTO Type II girders that did not contain any mild steel shear reinforcement or any draped prestressing strands were between 1,690 kN and 2,225 kN (380 kips and 500 kips). Traditional shear failure of the girder web without any strand slippage occurred in one girder at 2,225 kN (500 kips). Two other girders failed at lower loads due to strand slippage and to horizontal debonding of the web from the bottom flange, which resulted from a preexisting defect.

94
5. The live-load flexural capacity of a UHPC AASHTO Type II girder containing twenty-four 12.7-mm, 1,860-MPa (0.5-inch, 270-ksi) prestressing strands was 4,370 kN-m (38,700 kip-inches). This increased flexural capacity compared with normal concrete and HPC is primarily the result of the sustained postcracking tensile capacity of UHPC.
6. The failure of bridge girders composed of UHPC was observed to be precipitated by the pullout of fibers that were bridging tension cracks in the concrete. Flexural failure of an AASHTO Type II girder occurred when the UHPC at a particular cross section began to lose tensile capacity due to fiber pullout. This loss of the UHPC tensile capacity necessitated the transfer of those internal flexural tensile forces onto the prestressing strands, culminating in the rupture of the strands. The traditional shear failure of a similar girder also was caused by the loss of tensile capacity of the UHPC due to fiber pullout. In this loading configuration, the girder could not redistribute the tensile shear forces through any other load path; thus, the girder rapidly lost all load-carrying capacity. A different girder’s shear failure in combination with strand slip demonstrated that fibers tend to pull out gradually over a short timeframe and that in the presence of an alternate load path the girder can continue to maintain some load-carrying capacity.
7. UHPC that is subjected to large tensile strains will exhibit tightly spaced cracking in a restrained region of a structural member. Crack spacing as small as 3 mm (0.125 inch) was observed during the structural testing of bridge girders. The tensile flange of a prestressed girder allows for the very tight crack spacing due to the prestressing strands ensuring tight cracks and allowing for the redistribution of some local strain irregularities. The web region of an I-girder is sufficiently restrained by the top and bottom flanges to exhibit relatively tight crack spacing, but the web region spacing is not as tight as that in the tension flange under flexural loading.
8. The development length of 12.7-mm, 1,860-MPa (0.5-inch, 270-ksi) low-relaxation prestressing strands in UHPC is less than 0.94 m (37 inches). The AASHTO Type II girder shear tests indicate that in a heavily distressed shear region, the prestressing strands will rupture after only minimal slip if they are embedded at least 0.94 m (37inches) into the UHPC.
8.3 ONGOING AND FUTURE RESEARCH
The findings from this report suggest a number of potential topics for future research:
1. Develop optimized bridge girders that take advantage of the material properties of UHPC. These bridge girders should use the tensile and compressive capacities of UHPC, while also enhancing the design life of the bridge as a whole by eliminating many of the less durable components of a normal bridge.
2. Fabricate full-scale, optimized UHPC bridge girders to resolve problems associated with casting slender concrete members with fiber-reinforced concrete.
3. Conduct full-scale flexure and shear testing to verify the design philosophies presented in this report.
95
REFERENCES
1. Association Française de Génie Civil, Interim Recommendations for Ultra High Performance Fibre-Reinforced Concretes, 2002.
2. Graybeal, B.A., Material Property Characterization of Ultra-High Performance Concrete, FHWA-HRT-06-103, Federal Highway Administration, U.S. Department of Transportation, 2006.
3. Hajar, Z., A. Simon, D. Lecointre, and J. Petitjean, “Construction of the First Road Bridges Made of Ultra-High-Performance Concrete,” Proceedings, 2003 International Symposium on High Performance Concrete, Orlando, FL, October 2003, 18 pp.
4. Cavill, B., and G. Chirgwin, “The World’s First RPC Road Bridge at Shepherds Gully Creek, NSW,” Proceedings of the Fifth Austroads Bridge Conference, Hobart, Australia, May 2004.
5. Blais, P.Y., and M. Couture, “Precast, Prestressed Pedestrian Bridge—World’s First Reactive Powder Concrete Structure,” PCI Journal, September–October 1999, pp. 60–71.
6. Behloul, M., K.C. Lee, and D. Etienne, “Seonyu Ductal® Footbridge,” In Concrete Structures: The Challenge of Creativity, FIB Symposium 2004 Proceedings, April 26–28, Avignon, France: Association Française de Génie Civil, 6 pp.
7. Semioli, W.J., “The New Concrete Technology,” Concrete International, Nov. 2001, pp. 75–79.
8. Acker, P., and M. Behloul, “Ductal® Technology: A Large Spectrum of Properties, A Wide Range of Applications,” Proceedings of the International Symposium on Ultra High Performance Concrete, Kassel, Germany, September 13–15, 2004, pp. 11–23.
9. Buitelaar, P., “Heavy Reinforced Ultra High Performance Concrete,” Proceedings of the International Symposium on Ultra High Performance Concrete, Kassel, Germany, September 13–15, 2004, pp. 25–35.
10. Steinberg, E., and A. Lubbers, “Bond of Prestressing Strands in UHPC,” Proceedings, 2003 International Symposium on High Performance Concrete, Orlando, FL, October 2003, 15 pp.
11. Tawfiq, K., “Cracking and Shear Capacity of High Strength Concrete Bridge Girders,” FL/DOT/RMC/612(1)–4269, Jan. 1995, 145 pp.
12. Tawfiq, K., “Cracking and Shear Capacity of High Strength Concrete Bridge Girders Under Fatigue Loading,” FL/DOT/RMC/612-7896, Nov. 1996, 127 pp.
13. American Association of State Highway and Transportation Officials, AASHTO Standard Specifications for Highway Bridges, 15th ed., 1992.
14. Hegger, J., D. Tuchlinski, and B. Kommer, “Bond Anchorage Behavior and Shear Capacity of Ultra High Performance Concrete Beams,” Proceedings of the International Symposium on Ultra High Performance Concrete, Kassel, Germany, September 13–15, 2004, pp. 351–360.
15. Russell, B.W., and N.H. Burns, “Static and Fatigue Behavior of Pretensioned Composite Bridge Girders Made with High Strength Concrete,” PCI Journal, V. 38, No. 3, May–June 1993, pp. 116–128.
16. ASTM C39, “Standard Test Method for Compressive Strength of Cylindrical Concrete Specimens,” American Society for Testing and Materials Standard Practice C39, Philadelphia, PA, 1994.

96
17. ASTM C78, “Standard Test Method for Flexural Strength of Concrete (Using Simple Beam with Third-Point Loading),” American Society for Testing and Materials Standard Practice C78, Philadelphia, PA, 1994.
18. ASTM C1018, “Standard Test Method for Flexural Toughness and First-Crack Strength of Fiber-Reinforced Concrete (Using Beam With Third-Point Loading),” American Society for Testing and Materials Standard Practice C1018, Philadelphia, PA, 1997.
19. American Association of State Highway and Transportation Officials, AASHTO LRFD Bridge Design Specifications, 2002.