structural and functional investigations on multi-site
TRANSCRIPT

Structural and functional investigations on multi-site metallo enzymes of the biological sulfur cycle
Dissertation submitted to
Fachbereich Biologie, Universität Konstanz, Germany
for the degree of
Doctor of Natural Sciences
presented by
Dipl.-Chem. Alexander Schiffer Konstanz, November 2003
Examiner: Prof. Dr. P.M.H. Kroneck
Coexaminer: PD Dr. U. Ermler

Dissertation der Universität Konstanz
Datum der mündlichen Prüfung: 16.01.2004
Referenten: Prof. Dr. P. M. H. Kroneck
Priv. Doz. Dr. U. Ermler

für Alicia

I
Table of contents
ZUSAMMENFASSUNG VI
SUMMARY IX
1 INTRODUCTION 1
1.1 BIOGEOCHEMICAL SULFUR CYCLE 1
1.2 EVOLUTIONARY ASPECTS OF DISSIMILATORY SULFATE REDUCTION 1
1.3 PHYLOGENY OF SULFATE-REDUCING BACTERIA 2
1.4 ENZYMES INVOLVED IN DISSIMILATORY SULFATE REDUCTION 3
1.5 ADENYLYLSULFATE (APS) REDUCTASES 4
1.5.1 Assimilatory APS reductase 4
1.5.2 Dissimilatory APS reductase 5
1.6 SULFITE REDUCTASES 6
1.6.1 Assimilatory sulfite reductase 6
1.6.2 Dissimilatory sulfite reductase 7
1.7 HIGH-SPIN IRON CLUSTERS IN BIOLOGICAL SYSTEMS 8
1.8 PROTEIN CRYSTALLOGRAPHY 9
1.9 SCOPE OF THE STUDY AND RESEARCH OBJECTIVES 10
2 MATERIALS AND METHODS 11
2.1 CHEMICALS 11
2.2 PROTEIN BIOCHEMISTRY 12
2.2.1 Organism and cultivation 12
2.2.2 Preparation of cell fractions 12

II
2.2.3 Purification protocols 12
2.2.3.1 APS reductase of Archaeoglobus fulgidus 12
2.2.3.2 Dissimilatory sulfite reductase of Archaeoglobus fulgidus 13
2.2.4 Analytical methods 13
2.2.4.1 Protein determination 13
2.2.4.2 Determination of iron 14
2.2.4.3 Denaturing polyacrylamide gel electrophoresis 14
2.2.5 Experiments under exclusion of dioxygen 14
2.2.6 Enzymatic activities 15
2.2.6.1 Photometric determination of APS reductase activity 15
2.2.6.2 Photometric determination of sulfite reductase activity 15
2.2.7 Spectroscopic methods 16
2.2.7.1 UV/Vis absorption spectroscopy 16
2.2.7.2 Electron paramagnetic resonance spectroscopy 16
2.2.8 Titrations 17
2.3 PROTEIN CRYSTALLOGRAPHY 17
2.3.1 Theoretical background 17
2.3.1.1 Crystal growth 18
2.3.1.2 Crystals 18
2.3.1.3 X-ray diffraction by crystals 18
2.3.1.4 The electron density function 20
2.3.1.5 The phase problem 21
2.3.2 Protein crystallization 22
2.3.2.1 APS reductase 22
2.3.2.2 Sulfite reductase 22
2.3.3 Substrate complexes of APS reductase 22
2.3.4 Preparation of derivatives of sulfite reductase crystals 22
2.3.5 Cryocrystallography 23
2.3.5.1 APS reductase 23
2.3.5.2 Sulfite reductase 23
2.3.6 Measurement of datasets 23

III
2.3.6.1 Sulfite reductase 24
2.3.7 Data processing 24
2.3.8 Substructure solution and phase calculations 24
2.3.9 Density modifications 24
2.3.10 Molecular replacement using experimental phases 25
2.3.11 Interpretation of electron density maps 25
2.3.12 Model building and refinement 25
2.3.13 Structure comparison 25
2.3.14 Graphical representation 27
3 RESULTS 29
3.1 APS REDUCTASE FROM ARCHAEOGLOBUS FULGIDUS 29
3.1.1 Crystallization and diffraction analysis 29
3.1.2 Data collection 29
3.1.3 Overall molecular structure 30
3.1.4 The α-subunit 31
3.1.4.1 Fold description 31
3.1.4.2 Comparison to structurally related proteins 32
3.1.5 The β-subunit 36
3.1.6 Structure based enzyme mechanism 38
3.1.6.1 Structures of APS reductase in different states 38
3.1.6.2 APSR-red state 38
3.1.6.3 APSR-sulfite state 39
3.1.6.4 APSR-ox state 40
3.1.6.5 APSR-d-red state 41
3.1.6.6 APSR-amp state 42
3.1.6.7 APSR-aps state 46
3.2 SULFITE REDUCTASE FROM ARCHAEOGLOBUS FULGIDUS 48
3.2.1 Purification 48

IV
3.2.2 Enzyme properties 48
3.2.3 UV/Vis spectroscopy 49
3.2.3.1 Oxido-reduction experiments 49
3.2.3.2 Binding of substrates and products 50
3.2.4 EPR spectroscopy 53
3.2.4.1 Sulfite reductase as isolated 53
3.2.4.2 Oxidized sulfite reductase 60
3.2.4.3 Sulfite reductase with sulfide 68
3.2.5 Crystallization and diffraction analysis 69
3.2.5.1 Data collection 69
3.2.5.2 Structure determination 71
3.2.5.3 Phase calculations 72
3.2.5.4 Electron density modifications 73
3.2.5.5 Arrangement of the cofactors 73
4 DISCUSSION 77
4.1 APS REDUCTASE FROM ARCHAEOGLOBUS FULGIDUS 77
4.1.1 Comparison with structurally related flavin containing enzymes 77
4.1.1.1 Comparison of the α-subunit fold of APS reductase with the flavoprotein
subunit of fumarate reductase 77
4.1.1.2 Comparison of the FAD domain of APS reductase with that of other FAD
dependent reductases. 80
4.1.1.3 Comparison of the active site and substrate binding in APS reductase with
that in other members of the succinate dehydrogenase family 81
4.1.2 Structure based enzyme mechanism 83
4.1.2.1 The reaction of APS reductase 83
4.1.2.2 Catalytic mechanism 84
4.1.2.3 The electron transfer 88
4.2 SULFITE REDUCTASE FROM ARCHAEOGLOBUS FULGIDUS 90
4.2.1 Molecular and catalytic properties of sulfite reductase 90
4.2.2 Spectroscopic properties of sulfite reductase 91

V
4.2.2.1 High-spin S=5/2 signals 91
4.2.2.2 High-spin S=9/2 signals 91
4.2.2.3 Coupling of redox centers 93
4.2.2.4 Origin of the S=9/2 signals in sulfite reductase 93
4.2.2.5 Redox states and substrate binding 94
4.2.3 Crystallization and structure determination of sulfite reductase 96
4.2.3.1 Crystallization 96
4.2.3.2 Data collection and reduction 96
4.2.3.3 Structure determination 97
4.2.3.4 Cofactors of sulfite reductase 98
5 REFERENCES 101
6 APPENDIX 119
6.1 ABBREVIATIONS 119
6.2 EQUATIONS USED IN X-RAY CRYSTALLOGRAPHY 120
6.3 CURRICULUM VITAE 121
6.4 PUBLICATIONS 122
6.5 CONFERENCE ABSTRACTS 123
7 ACKNOWLEDGEMENTS 124
VI
Zusammenfassung
In dieser Dissertation wurden die strukturellen, funktionellen und spektroskopischen
Eigenschaften zweier Schlüsselenzyme der dissimilatorischen Sulfatreduktion untersucht.
1. Kristallstruktur der APS Reduktase aus Archaeoglobus fulgidus
Das Eisen-Schwefel Flavoprotein Adenylylsulfat (Adenosin 5’-phosphosulfat, APS)
Reduktase katalysiert die reversible Reduktion von APS zu Sulfit und AMP. Die Struktur der
APS Reduktase aus dem hyperthermophilen Organismus Archaeoglobus fulgidus wurde in
der Zweielektronen- reduzierten Form mit einer Auflösung von 1.6 Å bestimmt (Proc Natl
Acad Sci USA. 2002; 99:1836-1841).
Die α-Untereinheit der APS Reduktase war strukturell sehr ähnlich zur Flavoprotein-
Untereinheit der Fumarat Reduktase Familie. Es wurde deshalb vorgeschlagen, dass sich die
α-Untereinheiten aus einem gemeinsamen der archaealen APS Reduktase ähnlichen Vorläufer
entwickelt haben.
Die strukturelle Ähnlichkeit spiegelt sich nicht in der Sequenz-Ähnlichkeit wieder. Der
Sequenz-Vergleich zeigte, dass es nur eine einzige konservierte Aminosäure in der gesamten
FAD-Bindedomäne gab. Obwohl die gleiche Aminosäure Histidin eine zentrale aber
unterschiedliche Rolle in der Katalyse spielt, war dieses Histidin nicht konserviert. Der
Bereich des Proteins, der für die FAD Bindung zuständig ist, wurde bereits in der großen
Familie strukturell charakterisierter FAD abhängiger Reduktasen beobachtet (Flavins and
Flavoproteins 14th ed. (2002), pp. 69-75).
Die beiden für die APS Reduktion benötigten Elektronen werden von der Oberfläche des
Proteins über zwei [4Fe-4S] Zentren I und II zum FAD übertragen. Der ungewöhnlich große
Unterschied der Redox Potentiale dieser beiden Zentren (Zentrum I -60 und Zentrum II
-500 mV) konnte durch die Wechselwirkungen der Proteinumgebung mit den Zentren erklärt
werden.
2. Aus der 3D- Struktur hergeleiteter Katalyse-Mechanismus der APS Reduktase
Um den Reaktions-Mechanismus der APS Reductase aufzuklären, wurden verschiedene
Zustände des Enzyms entlang der Reaktionskoordinate strukturell charakterisiert. Ein FAD-
Sulfit Addukt wurde gefunden, nach Inkubation der Kristalle mit APS. Dies ist ein Indiz dafür
dass das Enzym im Kristall funktionsfähig war. Der Kanal zum Aktivzentrum, der durch eine
Gruppe hydrophober Aminosäuren stabilisiert wurde, bildete die Substratbindestelle. Die

VII
Bindung des Substrats APS hatte eine gespannte Konformation des FAD im aktiven Zentrum
zur Folge. Die Reaktion wurde durch den nukleophilen Angriff des Flavin N5 Atoms am
Schwefel des APS eingeleitet. Zur S-O Bindungsspaltung bzw. S-N Bindungsausbildung war
nur eine Bewegung des Schwefels um 1 Å hin zum FAD notwendig. His A398 und Arg A265
waren für die Stabilisierung der zusätzlichen Ladungen des entstehenden FAD-Sulfit
Adduktes und des AMPs wichtig. In diesem Zustand wurde eine kleine weitreichende
Konformationsänderung des Proteins gefunden, die vermutlich das Redoxpotential des [4Fe-
4S] Zentrums I und den Elektronenfluss zum FAD beeinflusste. Die Protonierung des Sulfit
O3 Atoms durch aktivierte Wassermoleküle erleichterte den vor der Reduktion des FAD
letzten Schritt im Reaktionszyklus, die Spaltung des FAD-Sulfit Adduktes.
3. Biochemische und spektroskopische Charakterisierung der Sulfit Reduktase aus
Archaeoglobus fulgidus
Die dissimilatorische Sulfit Reduktase aus dem hyperthermophilen Organismus A. fulgidus
wurde unter striktem Luftsauerstoffausschluss in N2/H2 Atmosphäre isoliert und gereinigt.
Das aktive Enzym enthielt eine α-Untereinheit (51 kDa) und eine β-Untereinheit (45 kDa), die
ein α2β2-Heterotetramer bildeten. Die Eisenbestimmung durch ICP-MS ergab einen
Eisengehalt von 12-14 Eisen pro α2β2-Heterotetramer. Die Sulfit Reduktase wurde in einem
gemischten Redox Zustand isoliert, bei dem das Sirohäm-[4Fe-4S] Zentrum oxidiert und
mindestens eines der insgesamt drei Eisen-Schwefel Zentren im reduzierten Zustand vorlag.
In diesem Zustand wurde mit UV/Vis Spektroskopie sowohl Substrat- als auch
Produktbindung an das Enzym nachgewiesen.
High-Spin Fe(III) EPR Signale wurden im oxidierten Zustand und im Zustand wie isoliert des
Enzyms beobachtet. Im oxidierten Zustand wurde ein einzelnes S=9/2 Signal mit g-Werten
von 17.5 und 9.7 beobachtet. Es wurde hauptsächlich ein einzelnes S=5/2 Signal des Sirohäm-
[4Fe-4S] Zentrums mit g-Werten von 6.7 und 5.1 gefunden. Außerdem war ein S=1/2 Signal
(gx=1.978, gy=2.007, gz=2.03) vorhanden. Low-Spin Häm Signale wurden im EPR Spektrum
der Sulfit Reduktase nicht gefunden. Die EPR Spektren wurden simuliert und die
Nullfeldaufspaltungen wurden bestimmt. Der Wert, der durch die Erniedrigung der
Besetzungszahlen des | ±1/2 > Dubletts bei thermischer Anregung bestimmt wurde, war in der
Größenordnung von 4 cm-1 sowohl für das S=9/2 System mit E/D=0.154 als auch für das
S=5/2 Signal mit E/D=0.036. Die Simulation des S=9/2 Systems ergab eine
Nullfeldaufspaltung von nur 2 cm-1. Die Halbsättigungs-Leistung (P1/2) der High-Spin Signale
bei 6 K lag bei ca. 1 mW Mikrowellen-Leistung.
VIII
4. Kristallisation und Röntgenstrukturanalyse der Sulfit Reduktase
Die Sulfit Reduktase aus A. fulgidus wurde unter Ausschluss von Luftsauerstoff mit Hilfe der
Methode des hängenden Tropfens kristallisiert. Die Kristallisation wurde bei 18°C mit PEG
4000 als Präzipitanz durchgeführt. Die grün-braunen Kristalle gehörten der Raumgruppe P21
an und hatten die Einheitszellenparameter a= 94.8, b= 69.4, c= 148.3 Å und β= 106.9°. Die
asymmetrische Einheit enthielt zwei αβ-Einheiten. Die Kristalle streuten bis 2.5 Å und
eigneten sich zur Röntgenkristallstrukturbestimmung.
Die Auswertung des anomalen Streuverhaltens an der Eisen-Absorptionskante ergab, dass der
α2β2-Heterotetramer der Sulfit Reduktase sechs Eisen-Schwefel Zentren und zwei Häm-Eisen
enthielt. Vier der Zentren bestanden aus vier Eisen Atomen und weitere zwei Zentren
enthielten drei oder vermutlich vier Eisen Atome. In einer αβ-Einheit war die Entfernung
zwischen dem Häm-Eisen und dem nächstgelegenen Eisen-Schwefel Zentrum 3.5-4.0 Å. Von
diesem Zentrum aus waren die beiden anderen Zentren 15 bzw. 38 Å entfernt. Die Entfernung
zwischen Zentren die durch nicht-kristallographische Symmetrie ineinander Überführbar
waren, war in der Größenordnung von 30 Å.
IX
Summary
In this Ph.D. thesis the structural, functional and spectroscopic properties of two key enzymes
of dissimilatory sulfate reduction were investigated.
1. Crystal structure of APS reductase from Archaeoglobus fulgidus
The iron-sulfur flavoenzyme adenylylsulfate (adenosine 5’-phosphosulfate, APS) reductase
catalyzes reversibly the reduction of APS to sulfite and AMP. The structure of APS reductase
from the hyperthermophilic A. fulgidus in the two-electron reduced state was reported at 1.6 Å
resolution (Proc Natl Acad Sci USA. 2002; 99:1836-41).
The α-subunit of APS reductase had a high structural similarity to the flavoprotein subunit of
the fumarate reductase family. Therefore it was proposed that the α-subunits originated from a
common ancestor resembling archaeal APS reductase.
The structural similarity was not reflected in the sequence similarity as the alignment showed
only a single conserved amino acid in the FAD-binding domain. In addition, there was no
conservation of catalytic residues although the amino acid histidine always played a crucial
but different role in catalysis. Moreover, the fold of the domain involved in FAD binding was
observed in a large family of structurally characterized FAD dependent reductases (Flavins
and Flavoproteins 14th ed. (2002), pp. 69-75).
2. Structure based catalytic mechanism of APS reductase
To elucidate the reaction cycle of APS reductase various states of the enzyme along the
reaction coordinate were structurally characterized. A FAD-sulfite adduct was detected after
soaking the crystals with APS indicating functionally intact enzyme in the crystal state. The
active site channel that was stabilized by a hydrophobic cluster of residues constituted the
substrate-binding site. APS binding resulted in a strained conformation of the active site FAD.
The reaction was initiated by the nucleophillic attack of the N5 atom of the flavin on the
sulfur of APS. The S-O bond was cleaved with the shift of the sulfur 1 Å towards the FAD
and the S-N bond was formed. His A398 and Arg A265 were essential for compensating the
additional negative charges of the generated FAD-sulfite adduct and AMP. In this state a
small long-range conformational change was observed that probably influenced the redox
potential of cluster I and the electron flow to the FAD. After leaving of the AMP only the
FAD-sulfite adduct had to be cleaved. This was promoted by protonation of the sulfite O3
atom by activated water molecules.

X
3. Biochemical and spectroscopic characterization of sulfite reductase from
Archaeoglobus fulgidus
Dissimilatory sulfite reductase from the hyperthermophilic archaeon A. fulgidus was isolated
and purified under strict exclusion of dioxygen in a N2/H2 (95/5 %) atmosphere. The enzyme
was active and composed of an α-subunit (51 kDa) and a β-subunit (45 kDa) arranged as α2β2-
heterotetramer. Iron determination by ICP-MS indicated the presence of 12-14 irons per α2β2.
Sulfite reductase was isolated in a mixed redox state with the siroheme-[4Fe-4S] center
oxidized and at least one out of three iron-sulfur clusters reduced. In this state binding of
substrate and product to sulfite reductase was observed by UV/Vis spectroscopy.
High-spin Fe(III) signals were observed by EPR spectroscopy in the oxidized state and in the
as isolated state of the enzyme. In the oxidized state, a single S=9/2 signal with g-values of
17.5 and 9.7 was observed. A single dominating S=5/2 signal with g-values of 6.7 and 5.1
from the high-spin siroheme-[4Fe-4S] cofactor was found. In addition, one major S=1/2 signal
was present. There were no signals deriving from low-spin heme. The EPR spectra were
simulated and the zero-field splittings were determined. The value from thermal depopulation
was in the order of 4 cm-1 for the S=9/2 system with E/D=0.154 as well as for the S=5/2
system with E/D=0.0036. Simulation of the S=9/2 system yielded in a zero-field splitting of
only 2 cm-1. The high-spin Fe(III) signals saturated at around 1 mW microwave power (P1/2)
at 6 K.
4. Crystallization and X-ray analysis of sulfite reductase
Sulfite reductase from A. fulgidus was crystallized under exclusion of dioxygen using the
hanging drop vapor diffusion method. The crystallization was carried out at 18°C using PEG
4000 as precipitant. The green-brown crystals grew in the space group P21 with unit cell
parameters a= 94.8, b= 69.4, c= 148.3 Å and β= 106.9°. The asymmetric unit contained two
αβ-units. The crystals diffracted beyond 2.5 Å resolution and were suitable for X-ray structure
analysis.
Analysis of the anomalous scattering at the iron absorption edge revealed the presence of six
iron-sulfur clusters and two heme iron centers. Four of the clusters contained four irons and
two clusters contained three or probably four irons. In one αβ-unit the distance between the
heme iron and the closest cluster was 3.5-4.0 Å. From this cluster the other two were 15 and
38 Å away. The distances between non-crystallographically related clusters were in the order
of 30 Å.

Introduction 1
1 Introduction
1.1 Biogeochemical sulfur cycle
Sulfur is about 1000 times less abundant in nature than oxygen. The three most abundant
forms are elemental sulfur (S0), sulfate and sulfide (Hollemann & Wiberg, 1985). The
reduction of sulfate to sulfide and the oxidation of reduced inorganic sulfur compounds are
widespread biological processes in our environment. Close to 75 % of the sulfur in the earth
crust is converted in the biogeochemical sulfur cycle. Microorganisms play a central role in
this process. Plants can also reduce sulfate for the purpose of biosynthesis of amino acids and
cofactors (Brunold, 2000). Animals as well as plants can oxidize reduced sulfur compounds to
sulfate (Peck & Bramlett, 1982).
The reduction of sulfate to sulfide is divided in two processes: the reduction of sulfate for
biosynthesis of amino acids and cofactors and the reduction of sulfate to sulfide in sulfate
respiration (Postgate, 1984). The assimilatory process in plants and bacteria is used to provide
the reduced sulfur compounds.
The dissimilatory sulfate reduction is used for energy conservation by strict anaerobic sulfate
reducing bacteria and archaea. The redox equivalents that are generated by the oxidation of
organic compounds are transferred to sulfate as terminal electron acceptor (‘sulfate
respiration’).
The ability to use sulfate as a terminal electron acceptor for energy conservation is
characteristic of several bacterial lineages and one hyperthermophilic genus of archaea. These
organisms include gram-positive (Desulfotomaculum) and gram-negative (Desulfovibrio,
Desulfobulbus, Desulfobacter, Desulfobacterium, Desulfococcus and Desulfosarcina) sulfate
reducing eubacteria (Deuereux et al., 1989) and the sulfate reducing archaeon Archaeoglobus
fulgidus (Stetter et al., 1987).
1.2 Evolutionary aspects of dissimilatory sulfate reduction
Several data from recent studies suggest that the ability to reduce sulfate was developed early
during prokaryotic evolution. As life may have originated in hot environments (Achenbach-
Richter et al., 1987; Wächtershäuser, 1988), the occurrences of sulfate-reducing prokaryotes
among hyperthermophilic archaea (Archaeoglobus fulgidus, Archaeoglobus profundus,
Archaeoglobus veneficus; the latter organism however is unable to reduce sulfate but forms
H2S from thiosulfate or sulfite (Dahl & Trüper, 2001) and deep-branching thermophilic

Introduction 2
bacteria (Thermodesulfovibrio yellowstonii, Thermodesulfobacterium commune) indicate an
early origin of this process (Wagner et al., 1998; Hipp et al., 1997). Isotopic data suggest that
dissimilatory sulfate reduction began 2.8 to 3.1 billion years ago (Schidlowski et al., 1983;
Schidlowski, 1986; Postgate, 1984) but acquired global significance only after sulfate
concentrations had considerably increased in the Precambrian oceans approximately 2.35
billion years ago (Cameron, 1982). The isotopic data are reasonably consistent with a recent
estimate of the time of domain divergence, approximately 3.1 to 3.6 billion years ago, based
on sequence comparisons of a large number of different proteins (Feng et al., 1997, Feng &
Doolitle, 1997). The results of a comparative sequence analysis of dissimilatory sulfite
reductase genes, a key enzyme involved in sulfate reduction (Steuber & Kroneck, 1998),
show that their inferred evolutionary relationships are nearly identical to those inferred on the
basis of 16S rRNA (Wagner et al., 1998).
1.3 Phylogeny of sulfate-reducing bacteria
Sulfate-reducing bacteria constitute a diverse group of prokaryotes that contribute to a variety
of essential functions in many anaerobic environments. In addition to their obvious
importance to the sulfur cycle, sulfate-reducing bacteria are important regulators of a variety
of processes in wetland soils, including organic matter turnover, biodegradation of chlorinated
aromatic pollutants in anaerobic soils and sediments, and mercury methylation (Postgate,
1984). Sulfate-reducing bacteria may be divided into four distinct groups: gram-negative
mesophilic sulfate-reducing bacteria; gram-positive spore forming sulfate-reducing bacteria;
thermophilic bacterial sulfate-reducing bacteria; and thermophilic archaeal sulfate-reducing
bacteria (Dahl et al., 1994). All of these groups are characterized by their use of sulfate as
terminal electron acceptor during anaerobic respiration.
Gram-negative sulfate-reducing bacteria are located within the delta subdivision of the
Proteobacteria. At some point in their evolutionary history, the delta subdivision diverged
from other Proteobacteria from a common ancestral phototroph. The Desulfovibrionaceae,
including the genera Desulfovibrio and Desulfomicrobium have been proposed within the δ-
Proteobacteria. The most well characterized species in the group of bacterial thermophilic
sulfate-reducing bacteria are Thermodesulfovibrio yellowstonii and Thermodesulfobacterium
commune. They possess optimal growth temperatures lower than those of archaeal sulfate-
reducing bacteria but higher than those described for other sulfate-reducing bacteria. The
group of archaeal thermophilic sulfate-reducing bacteria (Archaeoglobus fulgidus,
Archaeoglobus profundus, Archaeoglobus veneficus, the latter organism however is unable to
Introduction 3
reduce sulfate but forms H2S from thiosulfate or sulfite, substrates that can also serve as
electron acceptors to the other two species (Dahl & Trüper, 2001) exhibits optimal growth
temperatures above 80°C. Today, A. fulgidus is thought to have evolved from methanogenic
ancestors (Castro et al., 2000). The members of the genus Archaeoglobus are closely related
to the Methanosarcinales and represent a missing link between methanogens and sulfur-
metabolizing archaea. In contrast with methanogens, A. fulgidus does not produce methane, as
it is devoid of coenzyme M, coenzyme B, coenzyme F430 (Hansen, 1994), and methyl-
coenzyme M reductase genes (Brüggemann et al., 2000). Note that this organism contains
other methanogenic cofactors such as methanofuran, methanopterin, and coenzyme F420
(Adams, 1993).
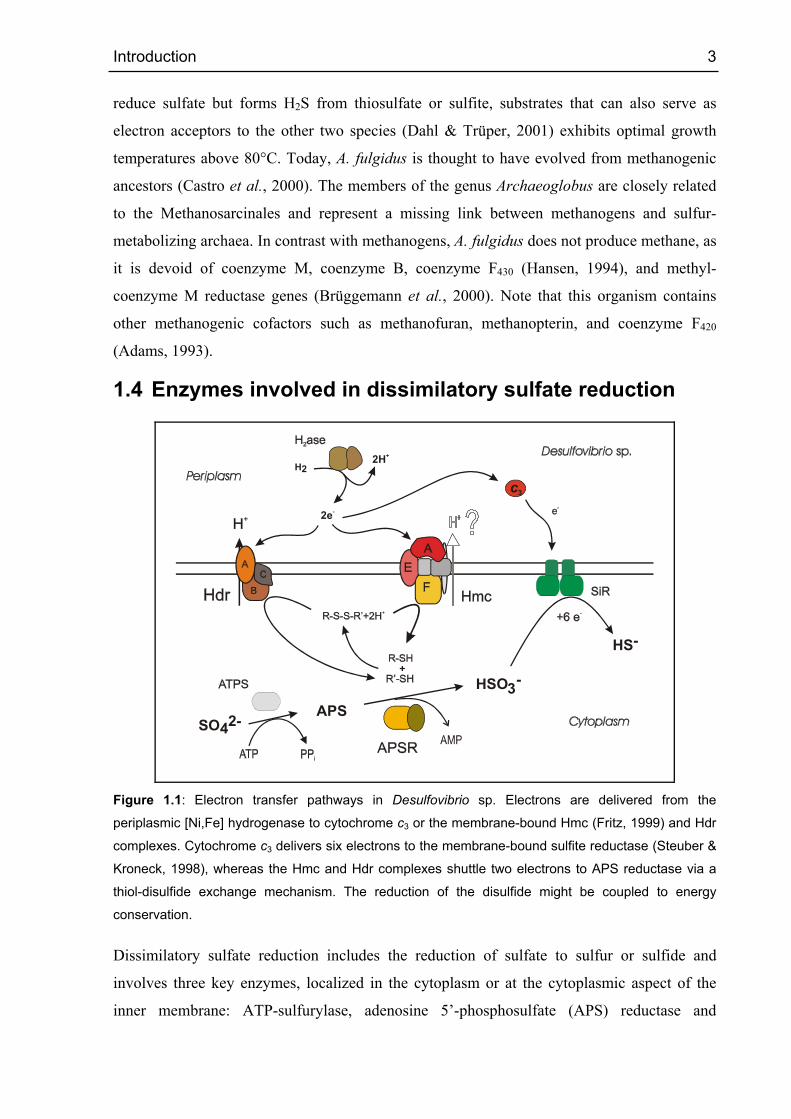
1.4 Enzymes involved in dissimilatory sulfate reduction
+
H22H+
2e-
SO42- APS
HSO3-
HS-
Figure 1.1: Electron transfer pathways in Desulfovibrio sp. Electrons are delivered from the
periplasmic [Ni,Fe] hydrogenase to cytochrome c3 or the membrane-bound Hmc (Fritz, 1999) and Hdr
complexes. Cytochrome c3 delivers six electrons to the membrane-bound sulfite reductase (Steuber &
Kroneck, 1998), whereas the Hmc and Hdr complexes shuttle two electrons to APS reductase via a
thiol-disulfide exchange mechanism. The reduction of the disulfide might be coupled to energy
conservation.
Dissimilatory sulfate reduction includes the reduction of sulfate to sulfur or sulfide and
involves three key enzymes, localized in the cytoplasm or at the cytoplasmic aspect of the
inner membrane: ATP-sulfurylase, adenosine 5’-phosphosulfate (APS) reductase and

Introduction 4
dissimilatory sulfite reductase (LeGall & Fauque, 1988). Because of its low redox potential
(E°’ = -516 mV), sulfate cannot be directly reduced by H2 or organic acids (Thauer et al.,
1977). Sulfate has to be activated to adenosine 5’-phosphosulfate (APS) in a reaction
catalyzed by ATP-sulfurylase (Dahl et al., 1990), whereby the redox potential (APS/AMP +
HSO3-) is shifted to E°’ = -60 mV (Thauer et al., 1977). The formation of APS is endergonic
and probably driven by the subsequent hydrolysis of pyrophosphate and the favorable APS
reduction. Therefore, the activation of sulfate to APS is assumed to consume two ATP
equivalents (Peck, 1959). The enzyme APS reductase catalyzes the reduction of APS to sulfite
and AMP. The natural electron donor for APS reductase is still unknown. As a final step, the
dissimilatory sulfite reductase finally catalyzes the six-electron reduction of sulfite to sulfide
(Dahl & Trüper, 2001). The mechanism how a proton gradient is generated in sulfate-
reducing bacteria is still unclear.
The electrons for sulfate reduction are provided by an electron transport chain consisting of
periplasmic hydrogenases (H2/2H+, E°’ = -414 mV), several cytochromes, and other
membrane-bound and cytoplasmic redox enzymes (Odom & Peck, 1981). Oxidation of
hydrogen in the periplasmic space and electron transfer across the cytoplasmic membrane
liberates two protons. From H+/H2 ratios greater than two, Fitz and Cypionka (Fitz &
Cypionka, 1991; Fitz & Cypionka, 1989; Cypionka & Pfennig, 1986) concluded that in
Desulfovibrio sp. the proton gradient is generated by proton translocation and vectorial
electron transport. Recent sequence data support the idea that the Hmc complex generates a
proton motive force. This transmembrane complex found in Desulfovibrio sp. comprises
subunits with high sequence homology to archaeal heterodisulfide reductase, which is coupled
to proton translocation in methanogenic archaea (Deppenmeier et al., 1990; 1991; 1996;
Peinemann et al., 1990). All redox enzymes in sulfate-reducing organisms contain iron-sulfur
centers as prosthetic groups.
1.5 Adenylylsulfate (APS) reductases
1.5.1 Assimilatory APS reductase
Archaea, bacteria, fungi, and plants reduce sulfate to sulfide, but they do so for different
purposes. The sulfate assimilation pathways serve for the synthesis of sulfur compounds
necessary for growth and development. In all organisms, sulfate assimilation begins with the
enzyme ATP sulfurylase that catalyzes the adenylation of sulfate to adenosine 5’-
phosphosulfate (APS), which is then reduced by adenosine 5’-phosphosulfate reductase to
sulfite and AMP in plants and some bacteria. In other bacteria and fungi, APS is further
Introduction 5
phosphorylated at the 3’-position by APS kinase forming 3’-phosphoadenosine 5’-
phosphosulfate (PAPS) before either being reduced by PAPS reductase (CysH) in a
thioredoxin-dependent reaction to sulfite or being used for sulfatation. Ferredoxin-dependent
sulfite reductase completes the reduction of sulfite to sulfide. Cysteine is formed when sulfide
reacts with O-acetylserine mediated by O-acetylserine thiol-lyase (Bick & Leustek, 1998).
Plant APS reductase is unique in that it is able to use reduced glutathione at physiological
concentrations as a source of electrons. Glutathione is thus the most likely physiological
electron donor for APS reduction. By contrast, PAPS reductase requires thioredoxin or
glutaredoxin as reductant. The glutathione-dependency of plant APS reductase is probably
mediated through a carboxyl terminal domain that functions as a glutaredoxin, which is
lacking in the bacterial and fungal enzymes (Weber et al., 2000).
Plant APS reductase from two species, Arabidopsis thaliana and Catharanthus roseus,
overexpressed in E. coli was described as lacking prosthetic groups or cofactors. However,
the enzyme was isolated from Lemna minor as a yellow protein indicating the presence of a
cofactor, possibly FAD and/or iron-sulfur centers (Suter et al., 2000).
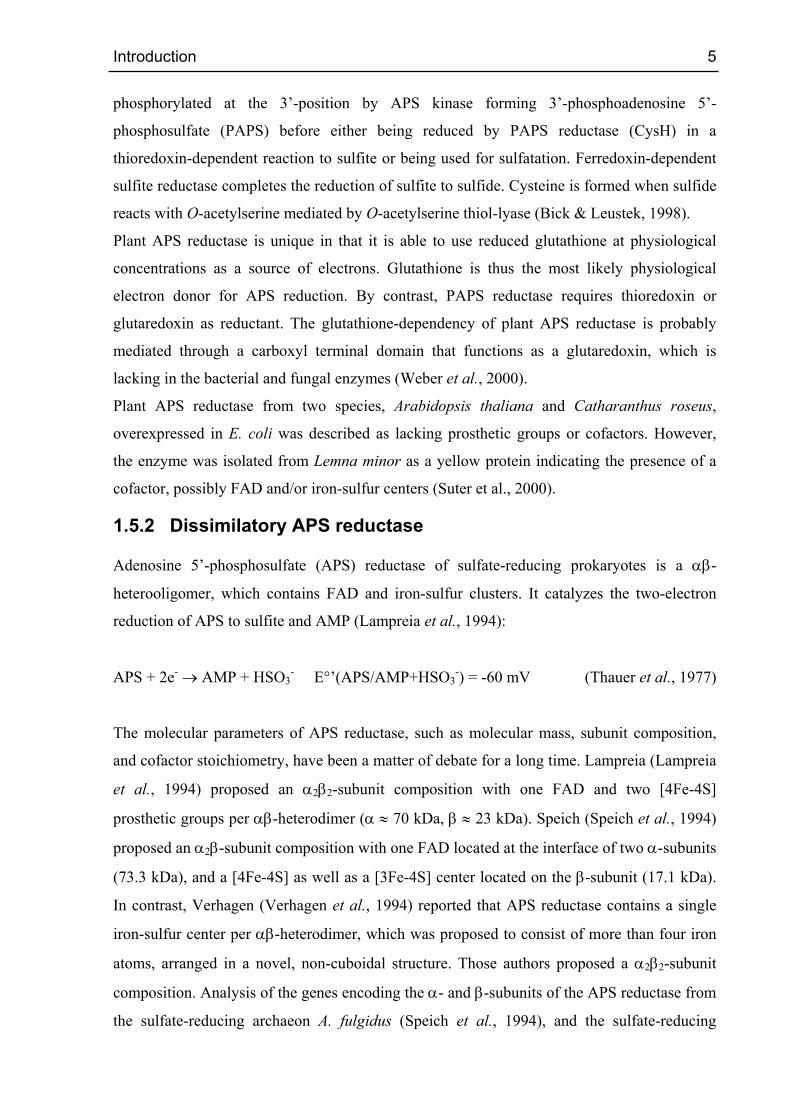
1.5.2 Dissimilatory APS reductase
Adenosine 5’-phosphosulfate (APS) reductase of sulfate-reducing prokaryotes is a αβ-
heterooligomer, which contains FAD and iron-sulfur clusters. It catalyzes the two-electron
reduction of APS to sulfite and AMP (Lampreia et al., 1994):
APS + 2e- → AMP + HSO3- E°’(APS/AMP+HSO3
-) = -60 mV (Thauer et al., 1977)
The molecular parameters of APS reductase, such as molecular mass, subunit composition,
and cofactor stoichiometry, have been a matter of debate for a long time. Lampreia (Lampreia
et al., 1994) proposed an α2β2-subunit composition with one FAD and two [4Fe-4S]
prosthetic groups per αβ-heterodimer (α ≈ 70 kDa, β ≈ 23 kDa). Speich (Speich et al., 1994)
proposed an α2β-subunit composition with one FAD located at the interface of two α-subunits
(73.3 kDa), and a [4Fe-4S] as well as a [3Fe-4S] center located on the β-subunit (17.1 kDa).
In contrast, Verhagen (Verhagen et al., 1994) reported that APS reductase contains a single
iron-sulfur center per αβ-heterodimer, which was proposed to consist of more than four iron
atoms, arranged in a novel, non-cuboidal structure. Those authors proposed a α2β2-subunit
composition. Analysis of the genes encoding the α- and β-subunits of the APS reductase from
the sulfate-reducing archaeon A. fulgidus (Speich et al., 1994), and the sulfate-reducing
Introduction 6
bacterium D. vulgaris revealed a putative FAD-binding domain on the α-subunit and iron-
sulfur binding motifs on the β-subunit. The N-terminal part of the β-subunit is highly
homologous to 2[4Fe-4S] ferredoxins. It contains eight conserved cysteinyl residues, with
four of them arranged in a conventional Cys-x1-x2-Cys-x3-x4-Cys... Pro-Cys (xn = variable
amino acid) binding motif. The other four cysteinyl residues are arranged in a modified Cys-
x1-x2-Cys-x3-...-x9-Cys...Cys-Pro motif, where five additional residues are inserted (Hipp et
al., 1997).
The catalytic mechanism of APS reductases has not been studied in detail so far. Micheals
(Micheals et al., 1970) observed the formation of a sulfite-adduct at the N(5) position of the
isoalloxazine ring of FAD, and proposed it as an intermediate during catalysis. However, his
data is not very strong because flavin N(5)-sulfite adducts have been described as a
characteristic feature of numerous flavin-dependent oxidases (Müller & Massey, 1969;
Massey et al., 1969) that catalyze the reduction of molecular dioxygen.
1.6 Sulfite reductases
1.6.1 Assimilatory sulfite reductase
Assimilatory sulfite reductases in bacteria, fungi, algae and plants provide the reduced sulfur
(oxidation state –2) necessary for incorporation into biomolecules required by themselves and
other higher organisms (Cole & Ferguson, 1988; Murphy & Siegel, 1973). Sulfite reductase
generates sulfide from sulfite for subsequent cysteine biosynthesis in the terminal step of the
3’-phosphoadenylyl sulfate (PAPS) pathway.
The E. coli assimilatory sulfite reductase (E.C. 1.8.1.2) is an oligomer of eight 66-kDa
flavoprotein (SirFP) and four 64-kDa hemoprotein (SirHP) subunits. In vivo, SirFP transfers
electrons from NADPH to SirHP. Each SirFP has one FAD and one FMN binding site the
SirFP octamer binds only four FAD and four FMN cofactors (Ostrowski et al., 1989). Isolated
SirHP, when provided with suitable electron donors can reduce SO32- to HS- and NO2
- to
NH4+ without releasing intermediates (Siegel & Davis, 1974). SirHP accommodates an
electron at the siroheme with a redox potential of -340 mV and at the Fe4S4 cluster with an '0E of –405 mV (Siegel et al., 1982; Jannick & Siegel, 1982). Reduction of SirHP enhances
substrate binding and dissociation rates 105 times, suggesting a link between cofactor
electronic states and protein conformation (Janick et al., 1983). The crystal structure revealed
how the protein utilizes underlying twofold symmetry to associate cofactors and enhance their
Introduction 7
reactivity for catalysis. The saddle-shaped siroheme shares a cysteine thiolate ligand with the
Fe4S4 cluster and ligates the substrate sulfite (Crane et al., 1995).
1.6.2 Dissimilatory sulfite reductase
Dissimilatory sulfite reductases or desulfoviridins catalyze the six-electron reduction of sulfite
to sulfide in sulfate respiration (LeGall & Fauque, 1988):
HSO3- + 6e- + 6H+ → HS- + 3H2O E°’ (HSO3
-/HS-) = -116 mV (Odom & Peck, 1981)
This enzyme has been described as α2β2γmδn-multimers with α ≈ 50 kDa, β ≈ 45 kDa, γ ≈ 11
kDa, δ ≈ 8 kDa, and a total molecular mass of approximately 200 kDa (Steuber & Kroneck,
1998; Steuber et al., 1995). Dissimilatory sulfite reductase has been isolated from D. vulgaris
(Lee et al., 1973), D. gigas (Lee et al., 1971), D. baculatus (Moura et al., 1988) and A.
fulgidus (Dahl et al., 1993). The γ- and δ-subunits are only loosely bound in some organisms
and even completely absent in the A. fulgidus enzyme. The structure of the γ-subunit from
Pyrobaculum aerophilium as well as the δ subunit from D. vulgaris has been characterized.
The γ-subunit from Pyrobaculum aerophilium reveals a novel fold with an orthogonal helix
bundle with a β hairpin resembling the helix-turn-helix motif involved in DNA-binding. A
flexible seven residue c-terminal arm with a c-terminal cysteine is suggested to be involved in
interaction with the α2β2-tetramer (Cort et al., 2001). The δ-subunit from D. vulgaris contains
a winged helix motif suggesting that it is involved in DNA binding (Mizuno et al., 2003). It
has been suggested that it binds sulfate or sulfite (Karkhoff-Schweizer et al., 1995) and
indeed 5 sulfates are found in the crystal structure, but previous studies had already ruled out
physiological binding of sulfate or sulfite (Hittel & Voordouw, 2000).
Found throughout the three domains of living organisms, many of these enzymes employ a
siroheme that is located right next to an iron-sulfur cluster (Crane et al., 1995; 1997a; 1997b).
EPR signals at high g-values are found in dissimilatory sulfite reductases with the highest
apparent g-values at g = 17 and g = 9, which are proposed to result from an S = 9/2 system.
Those EPR signals at high g-values are found in dissimilatory sulfite reductases and were
assigned to a novel type of iron-sulfur cluster (Pierik & Hagen, 1991; Marritt & Hagen,
1996).
Introduction 8
1.7 High-spin iron clusters in biological systems
The most commonly found iron clusters in biology are low-spin (S=1/2) or diamagnetic
systems depending on the redox state. They are classified according to the number of irons
and their redox state. Apart from these ‘classical’ iron sulfur clusters there are clusters with
unusual properties, which can be divided, into two groups: clusters with more than four iron
ions and clusters with one to four irons but unusual spin in the ground state.
On a [2Fe-2S] cluster of a 2Fe ferredoxin from Clostridium pasteurianum one of the cysteine
ligands has been mutated to serine with the surprising result of a [2Fe-2S]+ cluster with an
S=9/2 valence-delocalized ground state (Grouse et al., 1995; Achim et al., 1996). This is of
interest as this is the first report of existence of a fragment is used to describe the magnetic
properties of [4Fe-4S], [3Fe-4S] and [8Fe-7S] clusters.
This fragment is also used to rationalize the properties in the [3Fe-4S]- situation where an
S=5/2 ground state is observed. A valence delocalized S=9/2 [2Fe-2S]+ fragment couples
antiferromagnetically with a valence localized S=2 Fe2+ site.
Nitrogenase is the protein with the most unusual metal cofactors known. It contains three
types of iron clusters.
The Fe protein of nitrogenase from Azotobacter Vinelandii has a regular [4Fe-4S] cluster that
can be reduced to the all ferrous state (Watt & Reddy, 1994) (cluster charge=0) and has an
integer spin S=4 ground state (Angove et al., 1997; Yoo et al., 1999). In contrast to other
[4Fe-4S] clusters it was proposed that this cluster is capable of two-electron transfer that
might be needed for the six-electron reduction of molecular nitrogen to ammonia.
The active site of nitrogen reduction is the Fe Mo cofactor, which is a [Mo-7Fe-8S-N] cluster
(Einsle et al., 2002). It has been extracted and characterized as an S=3/2 system (Rawlings et
al., 1978; Burgess et al., 1980).
The third cluster in nitrogenase is the P-cluster it is used for the electron transfer from the Fe
protein to the Fe Mo cofactor active site. It has two high spin ground states depending on the
redox state. It is diamagnetic in the reduced state, in the one-electron oxidized state it is most
probably S=3 and the oxidized state has a spin admixed S=1/2 S=7/2 ground state (Chan,
1999).

Introduction 9
1.8 Protein crystallography
The first protein structures solved to almost atomic resolution by three-dimensional Fourier
synthesis of X-ray diffraction patterns of single crystals were the ones of hemoglobin (Perutz
et al., 1960) and myoglobin (Kendrew et al., 1960). Seven years earlier, fiber diffraction
experiments were used to unravel the three-dimensional structure of deoxyribose nucleic acid
(Watson & Crick, 1953).
Since then, protein crystallography has developed into a well-established and reliable
technique with a wide range of possible applications. Driven by rapid progress in molecular
biology and biochemistry and the advance of computer hard- and software in the last 20 years,
this has led to a total number of more than 20939 protein structures deposited in the Protein
Data Bank by the end of 2003. More than 18100 of those structures were solved by X-ray
diffraction and around 2830 by multidimensional nuclear magnetic resonance spectroscopy
(NMR). This ratio emphasizes the central role of protein crystallography in the field of
structural biology.
Structure solution by NMR complements protein crystallography in several ways. It provides
information on protein dynamics that cannot be obtained from the rather rigid environment of
a crystal lattice and it is also not dependent on the availability of protein crystals.

Introduction 10
1.9 Scope of the study and research objectives
Subject of the presented dissertation were the structural and functional studies on key
enzymes of the dissimilatory sulfate reduction. Adenylylsulfate (APS) reductase and sulfite
reductase from the hyperthermophilic archaeon Archaeoglobus fulgidus were used as model
systems.
The iron-sulfur flavoenzyme APS reductase was already biochemically and spectroscopically
extensively characterized and the overall structure was recently established (Schiffer, 2000;
Fritz, Roth, Schiffer et al., 2002). The investigations were then directed to explore the
enzymatic mechanism of the multi-step reaction on an atomic level. Accordingly, the enzyme
from A. fulgidus had to be purified and crystallized under exclusion of dioxygen. Afterwards
the crystals were soaked with diverse reagents in order to structurally characterize the enzyme
in different redox states, in complex with substrate and products and in intermediate states.
Subsequently a dataset of each state was collected at high resolution using synchrotron
radiation. The derived structures were then refined to extract also minute differences between
the states.
The siroheme containing enzyme dissimilatory sulfite reductase is of extraordinary
biochemical and biophysical interest but so far no detailed structural information is available.
Consequently, a purification procedure for the enzyme from A. fulgidus was worked out. Both
purification and crystallization experiments were performed under strict exclusion of
molecular oxygen. Assuming that X-ray suitable crystals could be obtained an X-ray structure
analysis was intended. In parallel, the purified sulfite reductase was characterized with
biochemical and spectroscopic (UV/Vis and EPR) techniques. Again the ultimate goal was to
understand the reaction mechanism and the unusual electronic properties of the enzyme on an
atomic level.

Materials and Methods 11
2 Materials and Methods
2.1 Chemicals
All chemicals were obtained in p.a. quality and were used without further purification.
Buffers
TRIS (trishydroxymethylaminomethane), BICINE (N,N-bis-(2-hydroxyethyl)-glycine), Roth;
K2HPO4, NaH2PO4, Merck; KH2PO4, Na-citrate dihydrate, Riedel-de-Haën.
Chromatographic resins
Q Sepharose Fast Flow, Resource Q, Amersham Pharmacia Biotech; Chelex® 100 Chelating
Ion Exchange Resin, Bio-Rad.
Dyes
Coomassie Brilliant Blue G250, methyl viologen, Serva; flavin adenine dinucleotide (FAD),
Fluka.
Gas
N2, N2/CO2 (80:20 v/v), H2, N2/H2 (94:6 v/v) Sauerstoffwerk Friedrichshafen; Argon 4.8,
Argon 4.9, Helium 4.6, Messer Griesheim.
General chemicals
Zn-acetate, Na2SO4, Na2S·xH2O (35 % Na2S), CaCl2·2H2O, acetone, 70 % trichloroacetic
acid, methanesulfonic acid, acetonitrile, 37.5 % HCl, Merck; MgCl2·6H2O, NaCl, NaOH,
NH4Cl, CuSO4·5H2O, FeCl3·6H2O, Riedel-de-Haën; Na-ethylmercurythiosalicylate, Serva.
Proteins and enzymes
Low molecular mass standards (PAGE), BioRad; gelfiltration molecular mass markers,
Sigma; desoxyribonuclease I, Fluka.
Reagents
Bicinchoninic acid solution (BCA), Sigma.
5-Deaza-10-methyl-3-sulfopropyl-isoalloxazine potassium salt (5-deazaflavin) was
synthesized and kindly provided by K. Sulger, Universität Konstanz.
Crystal screen solutions were obtained from Hampton Research (USA).
JB screen solutions were obtained from Jena Bioscience (Germany).
Adenosine 5'-phosphosulfate (APS) was obtained from Sigma or was synthesized and kindly
provided by Dr. T. Büchert, Universität Konstanz.
β-Methyleno-adenosine 5'-phosphosulfate (βmAPS) was obtained from JenaBioScience
GmbH (Germany).

Materials and Methods 12
2.2 Protein biochemistry
2.2.1 Organism and cultivation
The cultivation of Archaeoglobus fulgidus (DSM 4304T) was carried out as previously
described (Stetter et al., 1987) by H. Huber, Universität Regensburg.
2.2.2 Preparation of cell fractions
All manipulations were carried out in an anaerobic chamber (95 % N2, 5 % H2; Coy) in the
absence of dioxygen.
Frozen cells were brought into the anaerobic chamber, suspended in 1-2 volumes of 20 mM
potassium phosphate buffer, pH 7.0 containing a few crystals of desoxyribonuclease I and
5 mM MgCl2·6H2O and filled into a French press (Aminco). Cells were broken by one
passage in a French press (138 MPa; Aminco). The cell lysate was collected in a N2/H2
containing glass bottle sealed with a rubber septum. The cell lysate was brought again into the
anaerobic chamber and filled into dioxygen-free centrifuge tubes. The lysate was centrifuged
for 120 min at 100,000 g (4°C) giving the soluble fraction as supernatant, containing both
periplasmic and cytoplasmic proteins. The black pellet was referred to as membrane fraction.
2.2.3 Purification protocols
In order to minimize protein denaturation by thermal-induced unfolding or by protease
activity, each purification was performed within 48 h.
2.2.3.1 APS reductase of Archaeoglobus fulgidus
APS reductase was isolated in the absence of dioxygen on a FPLC system (Amersham
Pharmacia Biotech). All chromatographic steps were performed at 18°C in an anaerobic
chamber (95 % N2, 5 % H2; Coy).
After centrifugation, the soluble fraction was applied to a Q Sepharose Fast Flow column (5.0
× 5.0 cm; Amersham Pharmacia Biotech) equilibrated with 20 mM potassium phosphate
buffer, pH 7.0. APS reductase was eluted in a linear gradient (0-1.0 M KCl) at about 0.10 M
KCl. Fractions containing APS reductase were combined and desalted by ultrafiltration (cut-
off 30 kDa; Amicon) with subsequent dilution with 20 mM potassium phosphate buffer, pH
7.0, 5 % (v/v) glycerol. The desalted protein was loaded onto a Resource Q15 column
(1.6 cm × 14 cm; Amersham Pharmacia Biotech) equilibrated with 20 mM potassium
phosphate, pH 7.0, 5 % (v/v) glycerol. A linear gradient (0-0.5 M KCl) led to elution of APS
reductase at 0.15 M KCl. Fractions containing APS reductase were combined. The combined

Materials and Methods 13
fractions were concentrated by ultrafiltration (cut-off 30 kDa; Amicon) and loaded onto a
Superdex 200 HiLoad 26/60 gelfiltration column (2.6 × 60 cm; Amersham Pharmacia
Biotech) equilibrated with 50 mM potassium phosphate buffer, pH 7.0, 150 mM KCl,
5 % (v/v) glycerol.
2.2.3.2 Dissimilatory sulfite reductase of Archaeoglobus fulgidus
Sulfite reductase was isolated in the absence of dioxygen on a FPLC system (Amersham
Pharmacia Biotech). All chromatographic steps were performed at 18°C in an anaerobic
chamber (95 % N2, 5 % H2; Coy).
After centrifugation, the soluble fraction was applied to a Q Sepharose Fast Flow column (1.6
× 10.0 cm; Amersham Pharmacia Biotech) equilibrated with 20 mM potassium phosphate
buffer, pH 7.0. Sulfite reductase was eluted in a linear gradient (0-1.0 M KCl) at about
0.54 M KCl. Fractions containing sulfite reductase were combined and desalted by
ultrafiltration (cut-off 30 kDa; Amicon) with subsequent dilution with 20 mM potassium
phosphate buffer, pH 7.0, 5 % (v/v) glycerol. The desalted protein was loaded onto a
Resource Q15 column (1.0 cm × 13 cm; Amersham Pharmacia Biotech) equilibrated with
20 mM potassium phosphate buffer, pH 7.0, 5 % (v/v) glycerol. A linear gradient (0-1 M
KCl) led to elution of sulfite reductase at about 0.27 M KCl. Fractions containing sulfite
reductase were combined. The combined fractions were concentrated by ultrafiltration (cut-
off 30 kDa; Amicon) and loaded onto a Superdex 200 HiLoad 26/60 gelfiltration column
(2.6 × 60 cm; Amersham Pharmacia Biotech) equilibrated with 50 mM potassium phosphate
buffer, pH 7.0, 150 mM NaCl, 5 % (v/v) glycerol.
2.2.4 Analytical methods
2.2.4.1 Protein determination
Protein was determined by the bicinchoninic acid method according to Smith (Smith et al.,
1985). 100 µl unknown sample (5-20 µg protein) and 1 ml 50:1 (v/v) BCA / 4 % (w/v)
CuSO4·5H2O were mixed and incubated for 25 min at 60°C. After incubation, the samples
were cooled on ice, mixed and centrifuged for 5 min at 9,500 g. The absorbance at 562 nm
was measured on a HP 8452 A diode array spectrophotometer (Hewlett Packard) and the
concentration calculated using a calibration curve (5-20 µg BSA).
The microbiuret method (Goa, 1953) was performed with the following modifications: 700 µl
unknown sample (100-400 µg protein) were precipitated by subsequent addition of 0.0125 %
(w/v) Na-deoxycholate and 5.8 % (w/v) trichloroacetic acid (Bensadoun & Weinstein 1976).

Materials and Methods 14
After centrifugation for 5 min at 9,500 g, the pellet was dissolved in 700 µl 3 % (w/v) NaOH
at 45°C for 10 min. After addition of 35 µl biuret reagent and vigorous mixing for 10 s, the
samples were incubated for 15 min at room temperature in the dark. The absorbance at
545 nm and 330 nm was measured on a HP 8452 A diode array spectrophotometer (Hewlett
Packard) and the concentration calculated using a calibration curve (60-450 µg BSA). The
biuret reagent was prepared by adding 0.221 g anhydrous CuSO4 in 6 ml H2O to 3.46g
Na-citrate dihydrate / 2.0 g NaCO3 in 12 ml H2O and adjusting the final volume to 20 ml.
2.2.4.2 Determination of iron
Iron determinations by inductively coupled plasma mass spectroscopy (ICP-MS) were
performed by Spurenanalytisches Laboratorium Dr. Heinrich Baumann, Maxhütte-Haidhof,
Germany.
2.2.4.3 Denaturing polyacrylamide gel electrophoresis
SDS-PAGE was carried out with the Hoefer Mighty Small II SE 250 System (80 × 70 × 0.75
mm; Hoefer Scientific Instruments), or the BioRad MiniProtean 3 System (80 × 70 × 0.75
mm; BioRad) using glycine buffered 12.5 % polyacrylamide gels (Laemmli, 1970) and tricine
buffered 16 % acrylamide gels (Schägger & von Jagow, 1987). The molecular mass of the
subunits was estimated using Low Range SDS-PAGE Molecular Weight Standards (BioRad).
Gels were stained with Coomassie Brilliant Blue G250 (Zehr et al., 1989) or silver
(Rabilloud, 1990).
2.2.5 Experiments under exclusion of dioxygen
Experiments under exclusion of dioxygen were carried in an anaerobic chamber (95 % N2, 5
% H2; Coy) equipped with a Palladium catalyst type K-0242 (0.5 % Pd/Al2O3; ChemPur) to
remove traces of dioxygen. The content of dioxygen in the anaerobic chamber was < 1 ppm,
which was experimentally confirmed according to Beinert (Beinert et al., 1978). Glass and
plastic ware was stored in the anaerobic chamber for at least 24 h prior to use.
Dioxygen from buffers and solutions was removed by 6-8 cycles of degassing and flushing
with Argon 4.9 (Messer Griesheim) (Beinert et al., 1978). Traces of dioxygen were removed
from Argon 4.9 via passage through a glass/copper system filled with BTS Catalyst R3-11
(BASF). Buffers were stored for at least 24 h in the anaerobic chamber prior to use, in order
to equilibrate with the N2/H2 atmosphere.

Materials and Methods 15
2.2.6 Enzymatic activities
2.2.6.1 Photometric determination of APS reductase activity
APS reductase activity can be followed photometrically as described (Büchert, 2001). In the
reductive reaction (APS + 2e-→ AMP + HSO3-), reduced methyl viologen served as electron
donor.
All steps were performed under exclusion of dioxygen in an anaerobic chamber (95 % N2,
5 % H2; Coy). The following chemicals were added directly to a cuvette (final volume 1 ml):
500 µl 200 mM potassium phosphate buffer, pH 7.6 (final concentration 100 mM); 160 µl
250 mM Na-oxalate (final concentration 40 mM); 150 µl 5 mM methyl viologen (final
concentration 0.75 mM); 5 µl 5 mM 5-deazaflavin (final concentration 25 µM); 30 µl
1.58 mM APS (final concentration 47 µM); 105 µl H2O. The cuvette was sealed with a Suba
Seal 9 red rubber septum (Sigma) and the solution was thoroughly mixed. APS reductase
(0.2 mg/ml) was diluted 1:1 with 12 mg/ml BSA in 100 mM potassium phosphate buffer,
pH 7.6. This solution was transferred to a glass vial sealed with a rubber septum. The cuvettes
and the vial containing APS reductase were transferred outside the anaerobic chamber just
prior to use. Methyl viologen was reduced photochemically by irradiation in a modified slide
projector with a thermostatted cell holder. After 60 s of irradiation the absorbance at 732 nm
was measured. About 30-35 % of the methyl viologen was reduced and the absorbance at
732 nm was 0.80 ± 0.05. After reduction, the cuvettes were tempered for 5 min (80-85°C).
After the rate without enzyme was recorded, the reaction was started by addition of 50 µl APS
reductase (final concentration 53 pM) using a gas-tight syringe (Hamilton). The oxidation of
methyl viologen was followed at 732 nm (ε732 =3,150 M-1·cm-1) in a Cary 50 conc
Spectrophotometer (Varian) with thermostatted cell holder (80-85°C). After the rate
determination, the cuvette was opened and the temperature was directly measured in the
solution with a resistance thermometer (Digitalthermometer 500; MAWI). The specific
activity was calculated as µmol APS reduced per min and mg APS reductase.
2.2.6.2 Photometric determination of sulfite reductase activity
Sulfite reductase activity can be followed photometrically as described (Büchert, 2001). In the
reductive reaction (HSO3- + 6e-→ HS-), reduced methyl viologen served as electron donor.
All steps were performed under exclusion of dioxygen in an anaerobic chamber (95 % N2,
5 % H2; Coy). The following chemicals were added directly to a cuvette (final volume 1 ml):
200 µl 250 mM potassium phosphate buffer, pH 7.0 (final concentration 50 mM); 160 µl

Materials and Methods 16
250 mM Na-oxalate (final concentration 40 mM); 150 µl 5 mM methyl viologen (final
concentration 0.75 mM); 20 µl 0.5 mM 5-deazaflavin (final concentration 10 µM); 420 µl
H2O. The cuvette was sealed with a Suba Seal 9 red rubber septum (Sigma) and the solution
was thoroughly mixed. Sulfite reductase (5-10 mg/ml) was diluted 1:1 with 12 mg/ml BSA in
100 mM potassium phosphate buffer, pH 7.6. This solution was transferred to a glass vial
sealed with a rubber septum. The cuvettes and the vials containing sulfite and sulfite reductase
were transferred outside the anaerobic chamber just prior to use. Methyl viologen was
reduced photochemically by irradiation in a modified slide projector with a thermostatted cell
holder. After 90 s of irradiation the absorbance at 732 nm was measured. About 30-35 % of
the methyl viologen was reduced and the absorbance at 732 nm was 0.80 ± 0.1. After
reduction, the cuvettes were tempered for 5 min (80-85°C). Then 50 µl 60 mM Na2SO3 (final
concentration 3 mM) was added using a gas-tight syringe (Hamilton). After the rate without
enzyme was recorded, the reaction was started by addition of 50 µl sulfite reductase (final
concentration 53 pM) using a gas-tight syringe (Hamilton). The oxidation of methyl viologen
was followed at 732 nm (ε732 =3,150 M-1·cm-1) in a Cary 50 conc Spectrophotometer (Varian)
with thermostatted cell holder. The specific activity was calculated as µmol sulfite reduced
per min and mg sulfite reductase.
2.2.7 Spectroscopic methods
2.2.7.1 UV/Vis absorption spectroscopy
UV/Vis absorption spectra were obtained with a Cary 50 conc Spectrophotometer (Varian),
with a Perkin Elmer Lambda 16 Spectrophotometer (Perkin Elmer), or with a HP 8452 A
Diode Array Spectrophotometer (Hewlett Packard). All spectrophotometers except the HP
8452 A Diode Array Spectrophotometer were equipped with thermostatted cell holders.
Measurements with the HP 8452 A Diode Array Spectrophotometer were performed at room
temperature.
2.2.7.2 Electron paramagnetic resonance spectroscopy
X-band EPR spectra were recorded with a Bruker Elexsys 500 with an ER 049X microwave
bridge (Bruker). The system was equipped with an Oxford ESR 900 helium cryostat
controlled by an ITC 503 temperature controller (Oxford Instruments). The modulation
frequency was 100 kHz and the modulation amplitude was typically 0.1-1 mT. The
measurements were performed with a Bruker 4122 SHQE cavity in the perpendicular field
mode in which the resonance frequency was ≈ 9.38 GHz. The sample tubes were Suprasil
Materials and Methods 17
quartz tubes with a diameter of 2-3 mm. The sample volume was 250 µl. The g-values were
calculated according to the resonance equation:
h·ν = g·β·H
with h = 6.6262·10-34 J·s (Planck’s constant)
β = 9.274096·10-24 J·T-1 (Bohr Magneton)
ν = microwave frequency in Hz
H = magnetic field in T.
The simulation of the spectra was performed with the program WEPR (Neese, 1995).
2.2.8 Titrations
Titrations with reductants, oxidants or substrates were carried out in a modified Thunberg
cuvette with two rubber septa. The reactant was added in steps of 2-10 µl using a gas-tight
syringe (Hamilton). A spectrum was recorded immediately after addition and after incubation
with the reactant. The cuvette was filled and the syringe was pierced through the septa in an
anaerobic chamber (95 % N2, 5 % H2; Coy).
2.3 Protein crystallography
A detailed discussion of protein crystallography was beyond the scope of this work and can
be found in relevant textbooks (Blundell & Johnson, 1994; Drenth, 1994; Massa, 1994;
McRee, 1993) and in Meth. Enzymol. 276.
2.3.1 Theoretical background
The maximum attainable resolution of any microscopic technique is limited by the applied
wavelength. The radiation needed to analyze atomic distances (e.g. 1.54 Å for a carbon-
carbon σ-bond) lies within the spectral range of X-rays. However, while light or electron
microscopy uses lenses to merge the waves diffracted by an object into an enlarged image,
there are no such lenses available for X-rays. Max von Laue realized in 1912, that the three-
dimensionally ordered lattice arrangement of a crystal will cause interference of the diffracted
photons resulting in discrete maxima whose intensity can be measured in an appropriate
experimental setup.

Materials and Methods 18
2.3.1.1 Crystal growth
The process of crystal formation is in principle thermodynamically favored, driven by the
gain of entropy through the loss of the proteins' ordered hydratation shell. A solution of the
protein is slowly brought into a state of supersaturation – usually by evaporation of water –
until ordered crystals are formed. Mechanistically, the crystallization process can be divided
into two stages, seed formation and crystal growth. Supersaturation of the system – defined as
the difference of the chemical potentials of solution and crystal – is a prerequisite for both
stages. Seed formation occurs in equilibrium of formation and dissolving of small aggregates,
determined by the free energy ∆G. It will have a maximum at a critical radius, meaning that
aggregates with a radius smaller than the critical radius will redissolve, while for those bigger
than the critical radius further crystal growth means a decrease of ∆G. The critical cluster size
for protein crystals is between 10 and 200 molecules.
2.3.1.2 Crystals
A crystal can be regarded as a three-dimensional repetition of a single building block, the unit
cell. Within the unit cell, a crystal can contain further symmetry elements, dividing it into
several asymmetric units, which form the most basic structural element within the crystal. The
geometry of the unit cell together with the possible symmetry operations defines the space
group of the crystal. Although there are 230 space groups in seven crystal systems (triclinic,
monoclinic, orthorhombic, tetragonal, trigonal, hexagonal and cubic), only 65 are
enantiomorphic and are thus feasible for chiral molecules such as proteins. Identification of
the correct space group is essential for correct indexing of diffraction patterns and therefore
the first step of understanding a crystal structure.
2.3.1.3 X-ray diffraction by crystals
Upon interaction with the atoms in a crystal, the oscillating electrical field of an X-ray photon
induces an oscillation of equal frequency in the electron hull of the atom. The electrons act as
oscillating dipoles emitting secondary radiation of the same frequency as the incident
radiation, but with a phase difference of 180°. In this elastic or coherent diffraction, the phase
shifts between single waves originating from any point of finite electron density sum up to a
total intensity of the secondary radiation of zero (destructive interference), except if the path
difference between the waves is an integer multiple of their wavelength (constructive
interference). Given the correct orientation of the crystal, this condition is fulfilled for
corresponding positions in all unit cells. Diffraction of X-rays on the real lattice of a crystal
thus creates another three-dimensional lattice of diffraction maxima. As the geometric
Materials and Methods 19
properties of this lattice are inverse to those of the real crystal, it is referred to as the
reciprocal lattice. A convenient way to describe diffraction by a crystal lattice is to imagine
every single diffraction spot to be a reflection of the incident beam on an imaginary lattice
plane, which is identified by the Miller indices (h,k,l). The normal vectors Sr
of those lattice
planes then build up the reciprocal lattice, their length reflecting the reciprocal distance of the
planes.
θd
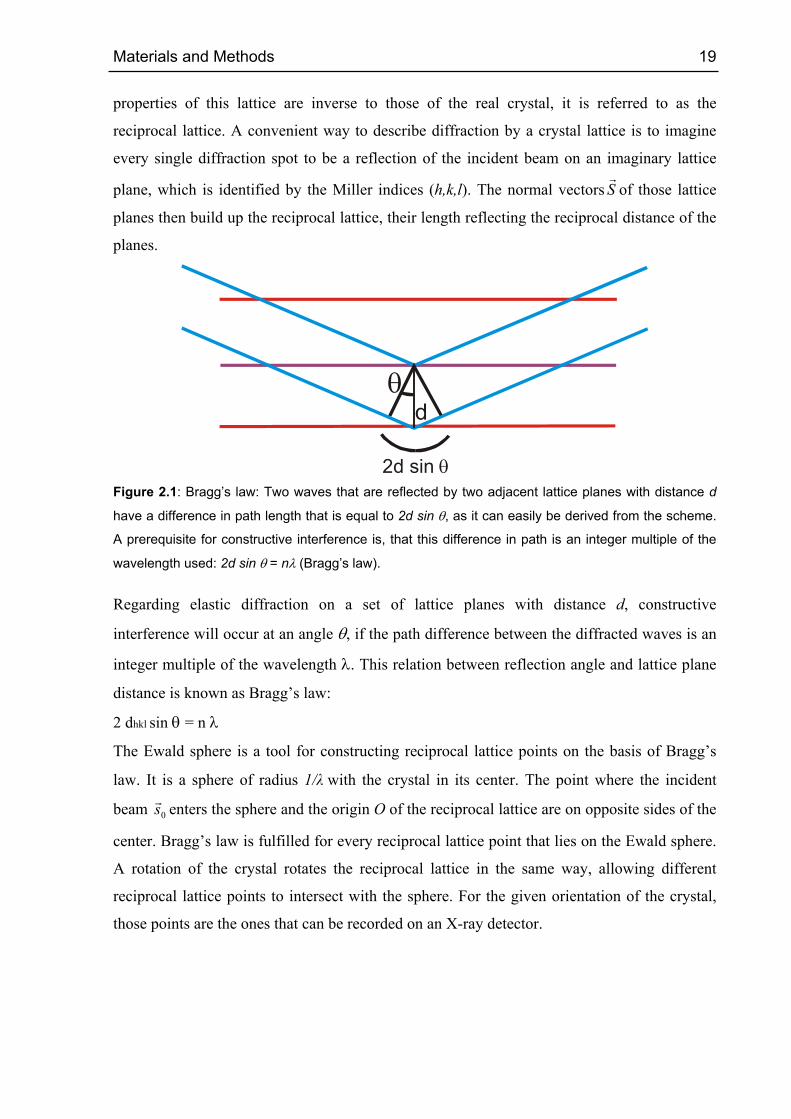
2d sin θ Figure 2.1: Bragg’s law: Two waves that are reflected by two adjacent lattice planes with distance d
have a difference in path length that is equal to 2d sin θ, as it can easily be derived from the scheme.
A prerequisite for constructive interference is, that this difference in path is an integer multiple of the
wavelength used: 2d sin θ = nλ (Bragg’s law).
Regarding elastic diffraction on a set of lattice planes with distance d, constructive
interference will occur at an angle θ, if the path difference between the diffracted waves is an
integer multiple of the wavelength λ. This relation between reflection angle and lattice plane
distance is known as Bragg’s law:
2 dhkl sin θ = n λ
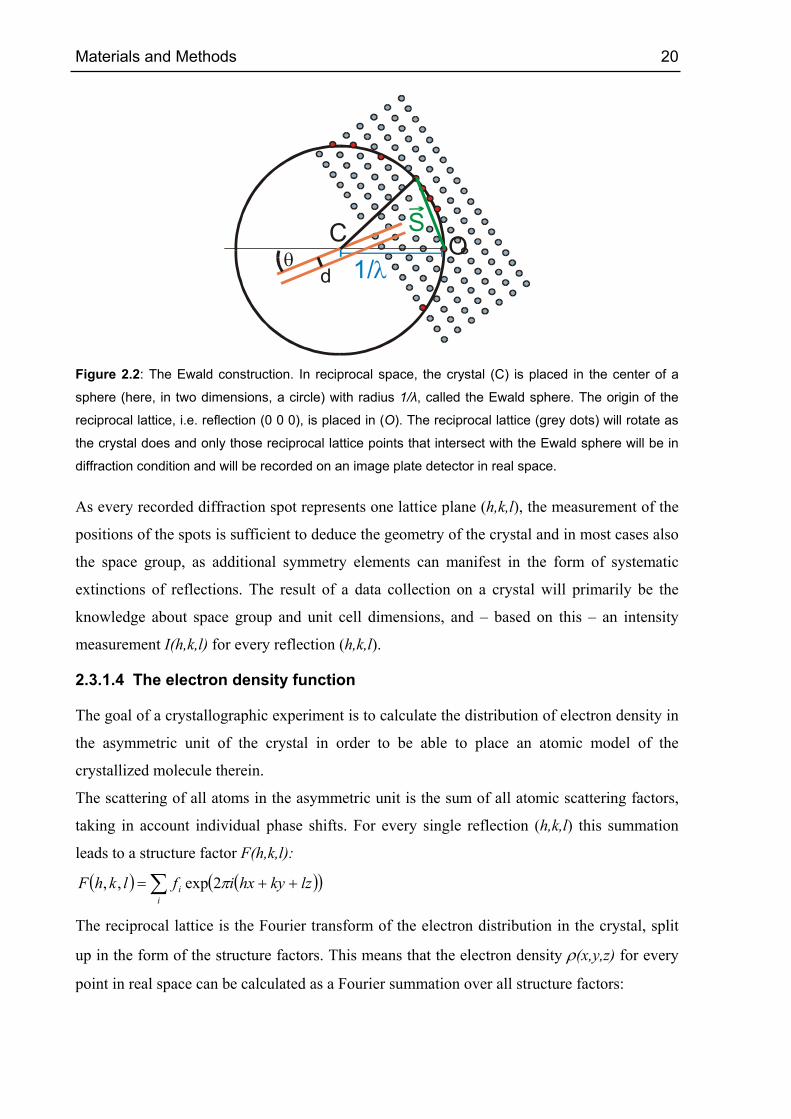
The Ewald sphere is a tool for constructing reciprocal lattice points on the basis of Bragg’s
law. It is a sphere of radius 1/λ with the crystal in its center. The point where the incident
beam 0sr enters the sphere and the origin O of the reciprocal lattice are on opposite sides of the
center. Bragg’s law is fulfilled for every reciprocal lattice point that lies on the Ewald sphere.
A rotation of the crystal rotates the reciprocal lattice in the same way, allowing different
reciprocal lattice points to intersect with the sphere. For the given orientation of the crystal,
those points are the ones that can be recorded on an X-ray detector.
Materials and Methods 20
Cd
θ 1/λ
SO
Figure 2.2: The Ewald construction. In reciprocal space, the crystal (C) is placed in the center of a
sphere (here, in two dimensions, a circle) with radius 1/λ, called the Ewald sphere. The origin of the
reciprocal lattice, i.e. reflection (0 0 0), is placed in (O). The reciprocal lattice (grey dots) will rotate as
the crystal does and only those reciprocal lattice points that intersect with the Ewald sphere will be in
diffraction condition and will be recorded on an image plate detector in real space.
As every recorded diffraction spot represents one lattice plane (h,k,l), the measurement of the
positions of the spots is sufficient to deduce the geometry of the crystal and in most cases also
the space group, as additional symmetry elements can manifest in the form of systematic
extinctions of reflections. The result of a data collection on a crystal will primarily be the
knowledge about space group and unit cell dimensions, and – based on this – an intensity
measurement I(h,k,l) for every reflection (h,k,l).
2.3.1.4 The electron density function
The goal of a crystallographic experiment is to calculate the distribution of electron density in
the asymmetric unit of the crystal in order to be able to place an atomic model of the
crystallized molecule therein.
The scattering of all atoms in the asymmetric unit is the sum of all atomic scattering factors,
taking in account individual phase shifts. For every single reflection (h,k,l) this summation
leads to a structure factor F(h,k,l):
( ) ( )( )∑ ++=i
i lzkyhxiflkhF π2exp,,
The reciprocal lattice is the Fourier transform of the electron distribution in the crystal, split
up in the form of the structure factors. This means that the electron density ρ(x,y,z) for every
point in real space can be calculated as a Fourier summation over all structure factors:
Materials and Methods 21
( ) ( ) ( )( )∑ ++=lkh
lzkyhxilkhFV
zyx,,
2exp,,1,, πρ
2.3.1.5 The phase problem
Approaching from the side of the diffraction experiment, each structure factor F(h,k,l) also
represents a reflection by one lattice plane. It is described by a wave function with amplitude
and phase angle. The structure factor amplitude can be obtained experimentally, as it is in
principle the square root of the measured intensity.
While the structure factor amplitude can be derived from the measured intensity, information
about the phase angle is lost. Without correct phase angles, the calculation of an interpretable
electron density is impossible, a dilemma commonly referred to as the phase problem of
crystallography. Four approaches to overcome this problem are applicable today:
• Molecular Replacement (MR)
• Multiple Isomorphous Replacement (MIR)
• Multiple-wavelength Anomalous Dispersion (MAD)
• Direct Methods
The method of Molecular Replacement depends on the availability of a sufficiently
homologous model structure, which is oriented by Patterson search techniques and then used
for initial phase calculations (Hoppe, 1957; Huber, 1965; Rossmann & Blow, 1962). Without
any previous knowledge of the structure, multiple isomorphous replacement is still the most
commonly used method. Herein it is attempted to place heavy atoms on specific sites in the
protein – either by soaking or by cocrystallization – and to identify their positions by
comparing the data collected from a native crystal with that of a derived one (Green et al.,
1954). MAD depends on precisely tunable synchrotron radiation, which has only been
available for the last years, but is becoming more and more standard (Hendrickson et al.,
1988).
Direct methods are the common way to determine phases in small molecule crystallography,
but due to the high number of atoms per asymmetric unit and the limited resolution that is
obtained from most protein crystals, this approach has rarely been successful for large
biomolecules. Most recently the number of protein structures solved by direct methods is
increasing and the development is promising, but small molecule size, high resolution and
good data quality are still a prerequisite.
Materials and Methods 22
2.3.2 Protein crystallization
Protein crystals were grown by the method of vapor diffusion, where the protein solution was
mixed with a precipitant solution and equilibrated against a higher concentrated precipitant
reservoir in a closed environment. Under regular conditions, using non-volatile precipitants
such as polyethylene glycol or salts, equilibrium was reached by diffusion of water from the
protein drop to the reservoir, thus slowly increasing the concentration of all components in the
drop (McPherson, 1982). Sitting drop experiments were carried out in Cryschem plates
(Charles Supper Company, Natick, USA), hanging drop setups in Costar Model 3424 plates
with siliconized cover slides (Hampton Research, Laguna Hills, USA).
2.3.2.1 APS reductase
Crystals of APS reductase from A. fulgidus were prepared as previously described
(Roth et al., 2000). Briefly the enzyme was crystallized using the hanging-drop vapor-
diffusion method performed in an anaerobic chamber (95 % N2, 5 % H2). The most suitable
crystals were obtained at 4°C using reservoir conditions of 4-6 % PEG 4000, 0.1 M NaAc
pH 4.8 and 0.2 M NaCl.
2.3.2.2 Sulfite reductase
Initial crystallization experiments included a screening of single precipitants at different pH
values. The precipitant concentration was raised in small steps until the protein crystallized,
aggregated or denatured. In order to screen large numbers of more complex precipitant
solutions, the method of sparse matrix sampling was applied (Carter Jr. & Carter, 1979;
Jancarik & Kim, 1991) to obtain promising starting conditions, which could then be refined
further.
2.3.3 Substrate complexes of APS reductase
In order to examine the binding of different substrates, intermediates and products to the
active site of APS reductase, crystals were transferred into a harvesting buffer containing the
respective compound. After incubation for a sufficient time to allow for binding, the crystals
were flash frozen and measured.
2.3.4 Preparation of derivatives of sulfite reductase crystals
In order to solve the structure of sulfite reductase mercury derivatives were prepared. Crystals
were transferred from the mother liquor into the reservoir solution containing
50 µM Na-ethylmercurythiosalicylate (‘Thimerosal’) and incubated for 30-60 minutes. The

Materials and Methods 23
concentration of Thimerosal was raised to 100 µM followed by 10-12 hour incubation. Finally
the concentration was adjusted to 0.3-0.5 mM Thimerosal and incubated for 3-7 hours. Then
the crystals were transferred into the cryoprotectant solution for 30 s to 1 min, flash frozen
and measured.
2.3.5 Cryocrystallography
A commonly observed problem in protein crystallography was damaging of crystals in the X-
ray beam, especially if intense synchrotron radiation was used. This damage was mainly
caused by the formation of water radicals by the X-ray photons, which in turn react with the
protein molecules, destroying the order of the crystal lattice. To minimize crystal degradation,
crystals were cooled to 100 K with a nitrogen stream cooling system (Oxford Instruments),
reducing the mobility of solvent radicals significantly. The addition of cryoprotectant was
necessary to successfully flash freeze protein crystals for data collection.
2.3.5.1 APS reductase
Crystals of APS reductase from A. fulgidus were frozen as previously described
(Roth et al., 2000): All measurements were achieved under flash-freezing conditions after
soaking the crystals in a cryoprotectant solution containing 6 % PEG 4000, 0.1 M NaCl,
0.1 M NaAc pH 4.8 and 25 % glycerol.
2.3.5.2 Sulfite reductase
Sulfite reductase crystals were frozen with glycerol as cryoprotectant. Crystals were
transferred from the mother liquor into a buffer containing 100 mM sodium citrate pH 6.5,
20 % PEG 4000, 0.1 M NaCl, 5 % 2-Propanol, 15 % glycerol and incubated for 2-5 minutes.
The crystals were then flash-frozen and measured or stored in N2(l) for further use.
2.3.6 Measurement of datasets
Data collection was performed using synchrotron radiation at different beamlines:
Max-Planck wiggler beamline 6 (BW6) of the German electron synchrotron DESY, Hamburg,
with a Mar Research CCD detector.
JSBG undulator beamline ID 14.4 of the European Synchroton Radiation Facility ESRF,
Grenoble with a Quantum ADSC Q4 CCD detector.
JSBG undulator beamline ID 29 of the ESRF, Grenoble with a Quantum ADSC Q210 CCD
detector.

Materials and Methods 24
2.3.6.1 Sulfite reductase
For the structure solution of sulfite reductase several datasets each from a single crystal were
collected. The crystal was approximately 100-500 × 100 × 30 µm3 in size. It was cooled as
described above. An X-ray fluorescence scan was carried out around the K-shell absorption
edge of iron to determine the optimal wavelengths for data collection. This procedure was
necessary, because although element-specific absorption edges can be calculated according to
the theory of Cromer and Liberman (Cromer & Liberman, 1970), the interaction of the
scattering atom with its chemical neighbors influences the scattering behavior considerably.
The strategy for data collection of the mercury derivatives was to get complete multiple-
wavelength anomalous dispersion (MAD) datasets for the iron as well as the mercury
absorption edge from a single crystal. Therefore an X-ray fluorescence scan was carried out
around the K-shell absorption edge of iron and the L3-shell absorption edge of mercury to
determine the optimal wavelengths for data collection.
2.3.7 Data processing
The computational work was done on a Linux PC workstation equipped with stereo display
capabilities.
The data sets were indexed, integrated and reduced using the programs XDS (Kabsch, 1993)
as well as DENZO and SCALEPACK (Otwinowski & Minor, 1996). For all further steps of
structure solution, data sets were converted with XSCALE, XDSCONV (Kabsch, 1993);
F2MTZ, TRUNCATE and MTZ2VARIOUS (Collaborative Computational Project No. 4,
1994) from intensities to structure factor amplitudes and to suitable file formats.
2.3.8 Substructure solution and phase calculations
For the determination of the heavy atom positions XPREP (Bruker-AXS) and SHELXD
(Schneider & Sheldrick, 2002) were used. The refinement of the heavy atom positions was
carried out using MLPHARE (Collaborative Computational Project No. 4, 1994) and SHARP
(La Fortelle & Bricogne, 1997).
2.3.9 Density modifications
The modification of the calculated Fourier synthesis were based on:
Solvent flattening, i.e. determination of a constant value for the solvent area (Cowtan & Main,
1996).
Real-space averaging, i.e. averaging of the Fourier synthesis of areas related by non-
crystallographic symmetry (Chapman & Blanc, 1997).
Materials and Methods 25
Histogram matching, i.e. the estimation of the frequency distribution of the correct Fourier
synthesis in the protein area.
These methods were implemented in the programs SOLOMON (Abrahams & Leslie, 1996),
DM (Collaborative Computational Project No. 4 1994) and RESOLVE (Terwilliger, 2001),
which were used for density modification.
2.3.10 Molecular replacement using experimental phases
The model of the assimilatory sulfite reductase from E. coli (PDB ID 1AOP) was used by
MOLREP (Collaborative Computational Project No. 4 1994) along with diffraction data
including the phase information from SHARP after density modification.
2.3.11 Interpretation of electron density maps
The electron density maps were calculated from measured amplitudes and density modified
phases with the program FFT (Collaborative Computational Project No. 4 1994). O (Jones et
al., 1998) was used to visually inspect the electron density maps.
2.3.12 Model building and refinement
Atomic protein models were built into the density modified electron density map with the
program O (Jones et al., 1998). Later 2fo-fc and fo-fc Fourier synthesis with the phase
information form the existing model was used.
Protein structures were refined with individual temperature factors using CNS
(Brünger et al., 1998). The refinement was controlled by the separation of a set of reflections,
which were only used for the calculation of quality indices (Brünger, 1992; Brünger, 1993).
2.3.13 Structure comparison
Sequence and structural comparison studies were performed with the programs BLASTP
(Zhang & Madden, 1997), CLUSTALX (Thompson et al., 1997) and LSQMAN (Kleywegt,
1996).
Rearrangements of the protein matrix in the different substrate / product bound structures of
APS reductase were identified and quantified by the program NCSGROUPS (Diederichs,
2003).
The Cα atoms of the α-subunit of APS reductase were superimposed with other known
structures and the r.m.s.-deviation for a certain number of residues was calculated.
Comparisons within the succinate dehydrogenase / fumarate reductase family:

Materials and Methods 26
1CHU - L-aspartate oxidase (Mattevi et al., 1999), 1L0V - fumarate reductase (Iverson et al.,
1999), 1QLA - fumarate reductase (Lancaster et al., 1999), 1QO8 - flavocytochrome c3
(Bamford et al., 1999), 1QJD - flavocytochrome c3 (Taylor et al., 1999), 1D4C -
flavocytochrome c3 (Leys et al., 1999) and 1JNR - APS reductase (Fritz et al., 2002b).
rmsd [Å] 1jnr 1chu 1l0v 1qla 1qjd 1qo8
1jnr 0 1.689 1.805 1.808 1.825 1.590
1chu 0 1.599 1.623 1.408 1.602
1l0v 0 1.252 1.380 1.195
1qla 0 1.396 1.341
1qjd 0 1.264
1go8 0
Table 2.1: r.m.s.-deviation for the Cα atoms between the structures within the succinate
dehydrogenase / fumarate reductase structural family.
cα [%] 1jnr 1chu 1l0v 1qla 1qjd 1qo8
1jnr 100 43 58 55 43 36
1chu 100 73 74 49 59
1l0v 100 91 54 48
1qla 100 45 44
1qjd 100 69
1qo8 100
Table 2.2: Percentage of the Cα atoms used for the calculation of the rms deviation for the Cα atoms
between the structures within the succinate dehydrogenase / fumarate reductase structural family.
Comparisons with other structurally related proteins:
1GER, 3GRS - glutathione reductase (Karplus & Schulz, 1987), 1PBE - p-hydroxybenzoate
hydroxylase (Schreuder et al., 1989), 1GOS monoamine oxidase (Binda et al., 2001) and
1GV4 programmed cell death protein 8 (aif) (Mate et al., 2002).

Materials and Methods 27
rmsd [Å] 1jnr 1chu 1l0v 1qla 1qjd 1qo8 1ger 3grs 1gos 1gv4 1pbe
1jnr 0 1.599 1.601 1.600 1.635 1.576 1.546 1.504 1.529 1.452 1.847
1chu 0 1.404 1.528 1.392 1.387 1.469 1.407 1.840 1.299 1.508
1l0v 0 1.098 1.259 1.145 1.287 1.309 1.471 1.355 1.523
1qla 0 1.308 1.225 1.385 1.320 1.614 1.303 1.629
1qjd 0 0.995 1.473 1.484 1.631 1.347 1.571
1qo8 0 1.422 1.569 1.601 1.420 1.569
1ger 0 0.943 1.547 1.404 1.426
3grs 0 1.582 1.544 1.320
1pbe 1.457 1.535 0
Table 2.3: r.m.s.-deviation for the Cα atoms between the structures within and beyond the succinate
dehydrogenase / fumarate reductase structural family.
Cα [%] 1jnr 1chu 1l0v 1qla 1qjd 1qo8 1ger 3grs 1gos 1gv4 1pbe
1jnr 100 52 75 74 61 65 31 30 33 34 32
1chu 100 86 88 88 86 45 45 45 48 52
1l0v 100 97 83 83 34 34 37 43 39
1qla 100 77 77 34 32 35 36 38
1qjd 100 94 37 37 38 40 39
1qo8 100 35 36 40 40 40
1ger 100 97 50 62 47
3grs 100 46 64 44
1pbe 33 34 100
Table 2.4: Percentage of the Cα atoms used for the calculation of the rms deviation for the Cα atoms
between the structures within and beyond the succinate dehydrogenase / fumarate reductase
structural family.
2.3.14 Graphical representation
Illustrations of structures were prepared using MOLSCRIPT (Kraulis, 1991), BOBSCRIPT
(Esnouf, 1997) or DSVIEWER (Accelrys Ltd, UK) and in some cases rendered with
RASTER3D (Merritt & Bacon, 1997). Surface illustrations were prepared with DINO
(Philippsen, 2002) or DEEP-VIEW (Guex & Peitsch, 1996)

Materials and Methods 28
Results 29
3 Results
3.1 APS reductase from Archaeoglobus fulgidus
3.1.1 Crystallization and diffraction analysis
The crystallization of the functionally intact enzyme was performed under anaerobic
conditions at a temperature of 277 K. Yellow-brownish colored rod shaped crystals with
dimensions of 0.2 x 0.4 x 0.7 mm3 appeared within 2-3 d. The crystals belonged to the space
group P212121, with unit-cell parameters a = 72.4, b = 113.2, c = 194.0 Å. The packing
densities VM of 4.2 and 2.1 Å3 Da-1 were compatible with one or two heterodimers per
asymmetric unit, respectively. The derived solvent contents were calculated to be 70 % and
40 %, respectively, which were both in the range for water-soluble proteins (Matthews, 1968).
Self-rotation calculations, however, supported the presence of two heterodimers per
asymmetric unit. The crystals diffracted to beyond 2 Å resolution.
3.1.2 Data collection
A native data set has been collected at the Max-Planck beamline BW6 to 1.6 Å resolution at a
wavelength of 1.05 Å. 665153 reflections were measured and reduced to 196086 unique
reflections, which corresponds to a completeness of 92.6 % in the resolution range 30.0-1.6
Å. The Rsym value was determined to be 6.3 % in this range.

Results 30
Data set APSR- red
APSR-sulfite
APSR- ox
APSR- aps
APSR- d-red
APSR-amp
Wavelength 1.05 1.05 1.05 1.05 1.05 1.05
Resolution [Å] 1.6 2.5 1.8 2.0 1.85 1.7
Completeness [%] 92.6 79.2 92.6 93.0 87.2 95.0
Multiplicity 3.4 2.6 3.1 5.0 5.0 2.7
Rsym [%] 6.3 8.0 3.8 5.0 5.4 4.6
Rcryst [%] 17.6 16.0 16.6 17.7 15.7 16.8
Rfree [%] 19.8 19.9 19.2 20.9 18.2 19.2
rmsd bond length [Å] 0.010 0.008 0.009 0.010 0.007 0.007
rmsd bond angles [°] 1.4 1.5 1.3 1.4 1.3 1.3
rmsd from APSR-red 0.000 0.112 0.040 0.084 0.083 0.125
State FAD
mainly
reduced
FAD-
sulfite
adduct
FAD
oxidized
FAD
oxidized
+ APS
FAD-
sulfite
adduct
FAD-sulfite
adduct +
AMP
Table 3.1: Data-collection and refinement statistics for different redox states and substrate complexes
of APS reductase. The rmsd from APSR-red was calculated for residues A2-A643 except for APSR-
amp, where residues C2-C643 (subunit α’) were used (cf. section 3.1.6.6).
3.1.3 Overall molecular structure
The structure of two-electron reduced APS reductase (APSR-red) was solved at 1.6 Å. There
were two αβ-heterodimers in the asymmetric unit, which formed a tight α2β2-heterotetramer
(Figure 3.1). Investigations of the enzyme using dynamic light scattering and gel filtration
indicated that APS reductase from several organisms formed an αβ-heterodimer in solution
(Fritz et al., 2000). The difference between solution and crystal state was most likely due to
the protein concentration and the buffer conditions. Thus, the functionally essential unit was
the αβ-heterodimer. The heterodimer had a compact shape with dimensions of 56 Å x 65 Å x
70 Å. The globular part of the β-subunit was embedded into a shallow hollow of the α-subunit
whereas its long tail wrapped around the α-subunit (Figure 3.1).

Results 31
Figure 3.1: The domain structure of APS reductase. Stereo view of the αβ-heterodimer. The α-subunit
was colored according to the domain structure. The FAD-binding domain that binds a non-covalently
attached FAD is shown in blue, the capping domain in cyan, and the helical domain in light blue. The
β-subunit that harbors two [4Fe-4S] clusters is shown in red.
3.1.4 The α-subunit
3.1.4.1 Fold description
The structure of the α-subunit could be grouped into the so-called FAD-binding, helical and
capping domains (Figure 3.1) as originally proposed by Mattevi et al. (1999) for aspartate
oxidase. Accordingly, the FAD-binding domain constituted the center; the helical and the
capping domain formed the periphery of the α-subunit. Whereas the helical domain was
firmly attached to the FAD-binding domain the capping domain was partly exposed from the
core region. However, the capping domain was anchored by a large number of interactions to
the α-subunit core and the β-subunit such that conformational flexiblity couldn’t be predicted
a priori. The fold of the FAD-binding domain (α2 - α261 and α394 - α487) was composed of
a central five-stranded parallel β-sheet flanked by four α-helices on one side and by a four-
stranded mixed β-sheet on the other (Figure 3.1). This folding motif classified the FAD-
binding domain of APS reductase as member of the glutathione reductase structure family
(Schulz et al., 1978). The FAD-binding domain harbored the prosthetic group FAD that was
embedded in an extended conformation into a shallow cavity. FAD mainly interacted with the
C-terminal end of the central β-sheet except for the isoalloxazine and the adenine rings. The
isoalloxazine ring accommodated into a pocket formed by loop segments of the FAD-binding
domain (α64 - α75, α234 - α236), the capping domain (α397 - α399), and the β-subunit
Results 32
(β48 - β48), which completely shielded its si-side but not the re-side from bulk solvent. The
helical domain (α488 - α643) was primarily composed of five long α-helices, which mainly
built up the interface region between the two αβ-heterodimers. The capping domain (α262 -
α393) that was inserted into the polypeptide chain of the FAD-binding domain consisted of a
three-stranded antiparallel β-sheet surrounded by six mostly short α-helices (Figure 3.1).
3.1.4.2 Comparison to structurally related proteins
The global fold of the α-subunit was reminiscent to that of the fumarate reductase structure
family. Since the anaerobic sulfur metabolism evolved very early during evolution the three-
dimensional structure of the α-subunit of APS reductase most likely resembled the ancestor of
this group of flavoenzymes.
For an overview of the structurally characterized proteins related to APS reductase a FSSP
(Holm & Sander, 1996) search was performed (Table 3.2). For this search the coordinates of
the α-subunit (1jnrA) were used.

Results 33
STRID Z rmsd LALI LSEQ %IDE PROTEIN
1jnrA 78.0 0.0 642 642 100 adenylylsulfate reductase fragment, reduced
1jnzA 75.0 0.1 642 642 100 adenylylsulfate reductase fragment, substrate
1chuA 34.0 3.9 452 478 20 L-aspartate oxidase
1qlaA 27.5 3.0 442 655 18 Fumarate reductase flavoprotein subunit
1qjdA 23.1 2.7 314 568 19 flavocytochrome c3
1hyuA 13.7 3.6 179 521 20 alkyl hydroperoxide reductase subunit f (ahpf)
1gosA 12.7 3.8 234 497 13 monoamine oxidase
1lvl 12.2 4.3 202 458 19 dihydrolipoamide dehydrogenase
1nhp 11.9 4.5 201 447 11 NADH peroxidase (npx) mutant
1fcdA 11.7 3.0 203 401 17 flavocytochrome c sulfide dehydrogenase
1trb 11.5 3.0 148 315 25 thioredoxin reductase mutant
1d7yA 10.6 5.0 198 401 14 ferredoxin reductase
1gv4A 10.6 4.4 188 490 15 programmed cell death protein 8 (aif)
3grs 10.6 3.2 151 461 22 glutathione reductase, oxidized Form
1gteD 10.4 3.3 189 1014 16 dihydropyrimidine dehydrogenase
1b37B 10.4 3.1 140 462 13 polyamine oxidase fragment
1gnd 9.9 4.1 187 430 11 guanine nucleotide dissociation inhibitor
1fohA 9.6 5.3 205 649 13 phenol hydroxylase
1b8sA 9.2 4.5 226 498 8 cholesterol oxidase Mutant
1pbe 9.0 5.2 196 391 15 p-hydroxybenzoate hydroxylase (phbh)
1i8tA 8.8 3.9 183 367 13 UDP-galactopyranose mutase
1cjcA 8.4 3.6 144 455 14 adrenodoxin reductase
1an9A 6.8 4.9 177 340 9 D-amino acid oxidase
2tmdA 6.6 5.9 127 729 12 trimethylamine dehydrogenase
1el5A 6.2 4.9 172 385 12 sarcosine oxidase
Table 3.2: FSSP search results for 1jnrA. The enzymes that will be discussed in detail are printed in
boldface. STRID: PDB identifiers of search structure and aligned structure with chain identifier,
Z: Z-score, i.e., strength of structural similarity in standard deviations above expected, RMSD:
positional root mean square deviation of superimposed CA atoms in Angstroms, LALI: total number of
equivalenced residues, LSEQ: length of the entire chain of the equivalenced structure, %IDE:
percentage of sequence identity over equivalenced positions.
The α-subunit was composed of three domains: the FAD-binding, the helical and the capping
domain. Structural classification of proteins (SCOP) could be used to get a better idea which
domain of APS reductase can be found in other protein structures. The proteins in Table 3.2
could be grouped into the following families:
• succinate dehydrogenase / fumarate reductase (1JNR, 1CHU, 1QLA, 1QJD).
The following flavin binding domains could be identified:
Results 34
• FAD/NAD linked reductases (1HYU, 1LVL, 1NHP, 1FCD, 1TRB, 1GV4, 3GRS, 1B37,
1FOH, 1B8S, 1PBE, 1EL5),
• FAD linked reductases (1GOS),
• adrenoxin reductases (1D7Y, 1GTE, 1CJC, 2TMD),
• guanidine dissociation inhibitor (1GND).
There were only 2 proteins namely UDP-galactopyranose mutase (1I8T) and D-amino acid
oxidase (1AN9) that did not belong to any of these families. The overall similarity was
obviously the highest within the succinate dehydrogenase / fumarate reductase family.
The structural family succinate dehydrogenase included the four proteins L–aspartate oxidase,
fumarate reductase, flavocytochrome c3 and APS reductase. Structural information was
available for one L–aspartate oxidase (1CHU; Mattevi et al., 1999), two fumarate reductases
(1L0V - Iverson et al., 1999; 1QLA - Lancaster et al., 1999), three flavocytochrome c3
(1QO8 - Bamford et al., 1999; 1QJD - Taylor et al., 1999; 1D4C - Leys et al., 1999) and one
APS reductase (1JNR - Fritz et al., 2002).
The three domains of APS reductase (N-terminal, FAD binding, C-terminal) were all part of
the respective succinate dehydrogenase / fumarate reductase family.
The program LSQMAN (Kleywegt, 1996) was used to superimpose the Cα atoms of the α-
subunit of APS reductase and the other known structures and calculate the r.m.s.-deviation for
a certain number of residues. These numbers were tabulated in section 2.3.13.
The helical domain belonged to the succinate dehydrogenase / fumarate reductase C-terminal
domain structure family with a spectrin repeat-like fold and was part of the class all alpha
proteins. The only other members of this group were succinate dehydrogenase from E. coli,
fumarate reductase from E. coli and W. succinogenes.
The capping domains was part of the succinate dehydrogenase / fumarate reductase catalytic
domain structure family. It had an unusual fold with mainly antiparallel β-sheets and was part
of the class alpha and beta proteins (a+b). Other than the helical domain this domain was also
found in respiratory fumarate reductases with an additional multiheme domain so-called
flavocytochrome c3.
The flavin binding domain was part of the succinate dehydrogenase / fumarate reductase N-
terminal domain structure family. The core of the fold consists of three layers β / β / α, a
central parallel β-sheet of 5 strands and a top antiparallel β-sheet of 3 strands and was part of
the class alpha and beta proteins (a/b).
The flavin-binding domain of APS reductase belonged to a large group of flavoproteins.
There were 5 different families of FAD/NAD(P) binding domains: the N-terminal and central
Results 35
domains of FAD/NAD linked reductases, the N-terminal domain of FAD linked reductases,
the domain of the guanidine dissociation inhibitors, the C-terminal domain of adrenoxin
reductases, and of course the N-terminal domain of succinate dehydrogenases / fumarate
reductases.
Three proteins with the highest similarities to APS reductase apart from the succinate
dehydrogenase family were used for a comparison.
As an example, glutathione reductase a FAD/NAD linked reductase (1GER, 3GRS; Karplus
& Schulz, 1987) and p-hydroxybenzoate hydroxylase a FAD linked reductase (1PBE;
Schreuder et al., 1989) were used to illustrate the characteristic structural features in
comparison to APS reductase. These three enzymes each represented a different structural
subfamily.
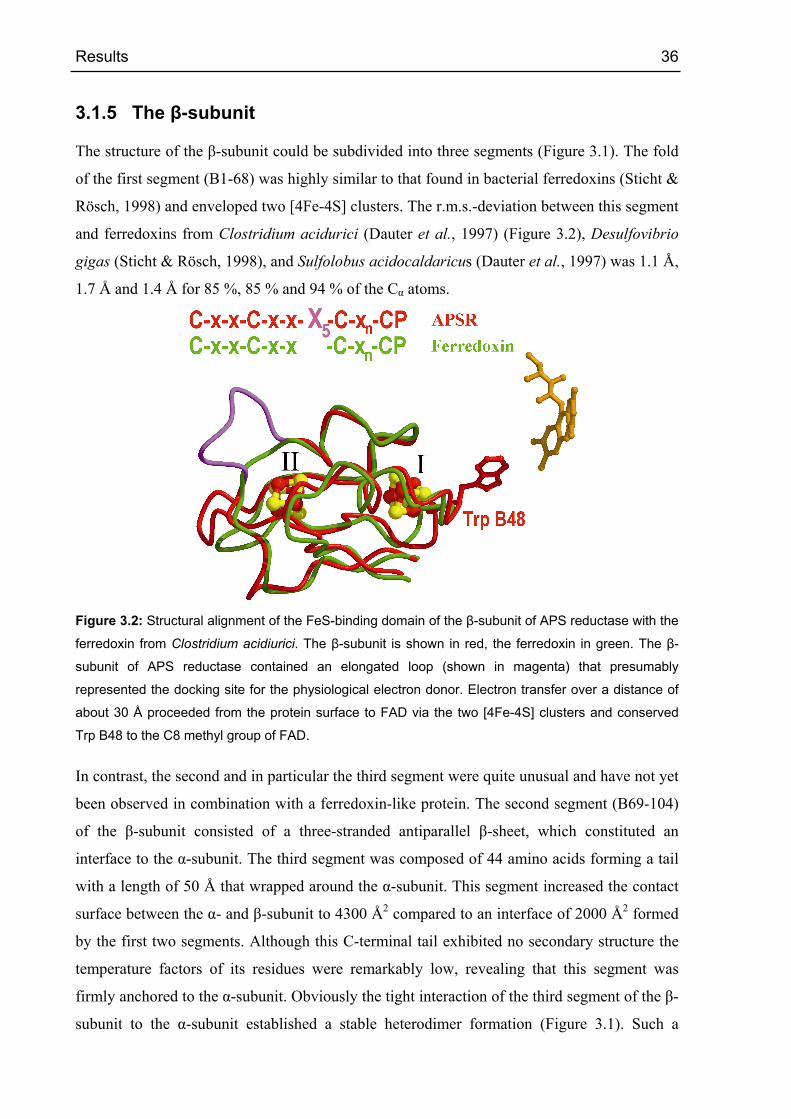
Results 36
3.1.5 The β-subunit
The structure of the β-subunit could be subdivided into three segments (Figure 3.1). The fold
of the first segment (B1-68) was highly similar to that found in bacterial ferredoxins (Sticht &
Rösch, 1998) and enveloped two [4Fe-4S] clusters. The r.m.s.-deviation between this segment
and ferredoxins from Clostridium acidurici (Dauter et al., 1997) (Figure 3.2), Desulfovibrio
gigas (Sticht & Rösch, 1998), and Sulfolobus acidocaldaricus (Dauter et al., 1997) was 1.1 Å,
1.7 Å and 1.4 Å for 85 %, 85 % and 94 % of the Cα atoms.
Figure 3.2: Structural alignment of the FeS-binding domain of the β-subunit of APS reductase with the
ferredoxin from Clostridium acidiurici. The β-subunit is shown in red, the ferredoxin in green. The β-
subunit of APS reductase contained an elongated loop (shown in magenta) that presumably
represented the docking site for the physiological electron donor. Electron transfer over a distance of
about 30 Å proceeded from the protein surface to FAD via the two [4Fe-4S] clusters and conserved
Trp B48 to the C8 methyl group of FAD.
In contrast, the second and in particular the third segment were quite unusual and have not yet
been observed in combination with a ferredoxin-like protein. The second segment (B69-104)
of the β-subunit consisted of a three-stranded antiparallel β-sheet, which constituted an
interface to the α-subunit. The third segment was composed of 44 amino acids forming a tail
with a length of 50 Å that wrapped around the α-subunit. This segment increased the contact
surface between the α- and β-subunit to 4300 Å2 compared to an interface of 2000 Å2 formed
by the first two segments. Although this C-terminal tail exhibited no secondary structure the
temperature factors of its residues were remarkably low, revealing that this segment was
firmly anchored to the α-subunit. Obviously the tight interaction of the third segment of the β-
subunit to the α-subunit established a stable heterodimer formation (Figure 3.1). Such a

Results 37
tightening of the subunit interaction by a rather unordered segment was also observed in the
structure of the human electron transfer flavoprotein (Roberts et al., 1993).
By comparison with most ferredoxins the two [4Fe-4S] centers of APS reductase differed
significantly in their reduction potentials, –60 mV for cluster I and approximately –500 mV
for cluster II (Fritz et al., 1999; Fritz et al., 2002a). Both [4Fe-4S] clusters had the shape of a
distorted cube and the iron-iron, the iron-sulfur and the sulfur-sulfur distances were similar
compared to each other, and to values of other ferredoxins (Dauter et al., 1997; Fujii et al.,
1996). However, the environment of the two clusters was significantly different (Figure 3.3).
Figure 3.3 The [4Fe-4S] electron transfer sites of APS reductase. Schematic representation of the two
[4Fe-4S] cluster binding sites. Clusters I and II were covalently linked to the sulfhydryl group of four
cysteines. The substantially increased number of polar interactions between cluster I compared to
cluster II and the protein matrix could explain the differences in redox potential.
Recent studies indicated that local dipoles in close proximity to the cluster largely modulated
the reduction potential. Upon electron uptake the extra negative charge will be localized
predominantly on both the acid-labile sulfur and the cysteinyl sulfur atoms (Li et al., 1998).
The reduced state was stabilized by NH - S hydrogen bonds (Denke et al., 1998) and
backbone amide dipoles (Chen et al., 1999) shifting the reduction potential to more positive
values. The sulfur atoms of cluster I exhibited seventeen interactions with backbone amides at
a distance of less than 3.5 Å, vs. seven amides in the proximity of the sulfur atoms of cluster
II. In addition, one acid-labile sulfur of cluster II came very close (3.0 Å) to the carboxylate
oxygen of Asp B11, which provided a negatively charged surrounding, appropriate to
stabilize the oxidized state (Figure 3.3). This feature had not been observed so far in the
known structures of ferredoxins. Thus, the substantially increased number of polar
interactions between cluster I compared to cluster II and the protein matrix could explain the
high reduction potential of cluster I of -60 mV, and the low potential of cluster II of about -
500 mV.

Results 38
3.1.6 Structure based enzyme mechanism
3.1.6.1 Structures of APS reductase in different states
In order to understand the mechanism of reduction from APS to sulfite on an atomic basis
different enzyme states were structurally characterized. Crystals were taken directly from the
anaerobic chamber (APSR-red), after soaking with K3Fe(CN)6 (APSR-ox), with APS (APSR-
sulfite), with dithionite (APSR-d-red), with AMP and sulfite (APSR-amp) with K3Fe(CN)6
and APS (APSR-aps) (Table 3.3). Redox state of FAD
Compound Conc. used[mM]
Soaking time [h]
dmin [Å]
Dataset name
Reduced 1.6 APSR-red
Reduced APS 5 10 2.5 APSR-sulfite
Reduced AMP+Na2SO3 5 10 1.7 APSR-amp
Oxidized K3Fe(CN)6 5 2 1.8 APSR-ox
Oxidized K3Fe(CN)6 + APS 5 24 2.0 APSR-aps
Reduced Na2S2O4 5 2 1.85 APSR-d-red
Table 3.3: Conditions used for soaking APS reductase crystals to obtain different redox states and
substrate complexes of APS reductase for structural characterization.
Hereafter, crystals were flash frozen and crystallographically analyzed (Roth et al., 2000).
The detailed soaking conditions, data quality and refinement statistics as well as the rms
deviation from the APSR-red state were listed in Table 3.1. The high-resolution data as well
as the small differences between the crystals allowed the discussion of coordinate shifts in the
order of 0.2 Å. In most crystal states of APS reductase analyzed the two αβ-units per
asymmetric unit showed only small differences due to different crystal contacts. We will only
describe significant differences when they seemed to be biologically relevant.
3.1.6.2 APSR-red state
The APSR-red state of APS reductase has been characterized to 1.6 Å resolution and contains
FAD most likely in the reduced FADH2 state (Fritz et al., 2002b). A pronounced feature in the
APSR-red structure was the substantial bend of the isoalloxazine ring along the N5-N10 axis
due to a shift of the dimethyl- and the pyrimidine rings towards the si-face of FAD by an
angle of 25° (Figure 3.4). This butterfly arrangement was better compatible with FAD in the
reduced state (Denke et al., 1998). According to molecular orbital calculations, the optimal
bending angle was 15-30o for the reduced and 0-10o for the oxidized isoalloxazine ring.
Distortions from this optimal bending angle were energetically not expensive, in particular not

Results 39
for the reduced form of FAD (Chen et al., 1999; Lennon et al., 1999) but they could affect the
reduction potential (Dixon et al., 1979).
Figure 3.4: The reduced FAD of APS reductase. The isoalloxazine of FAD was present in a bent
conformation (25°) that was mainly enforced by the protein environment, in particular Asn A74, Leu
A70, and Trp A234. View along the N5 – N10 axis of FAD; the FAD and the residues are shown in
stick type and as transparent van der Waals spheres.
Thus, the adjacent protein matrix can presumably exert a considerable influence on the
bending angle whereby a flat conformation of FAD favored the oxidized, a bent conformation
the reduced state, respectively. The butterfly conformation of the isoalloxazine ring in APS
reductase was enforced by several polar and hydrophobic van der Waals contacts to the
polypeptide chain. On the re-face Asn A74 and Trp A234 pushed the pyrimidine ring and
dimethylbenzene ring of isoalloxazine, whereas Leu A70 on the si-face of FAD pointed
towards the pyrazine ring. The induced stabilization of the reduced form of FAD agreed well
with the reduction potential of -45 mV of FAD in APS reductase (Fritz et al., 2002a) vs. ≈ -
20 mV of free FAD.
The isoalloxazine ring was located in the interior of the protein and was solvent accessible
through a 17 Å long channel. In this channel a number (~ 35) of tightly bound water
molecules were found.
3.1.6.3 APSR-sulfite state
The APSR-sulfite state of APS reductase contained a FAD-sulfite adduct. In addition, there
was an electron density tentatively assigned to a binding site for AMP, which was only partly
occupied (Fritz et al., 2002b) after soaking the crystals with APS. Obviously, the reaction
proceeded in the solid matrix indicating that crystal-packing effects did not disturb the
catalytic competence of APS reductase.
The isoalloxazine ring in the APSR-sulfite state showed the butterfly conformation, (27°).
The APSR-sulfite structure showed a sulfite molecule covalently linked to the N5 atom of the

Results 40
isoalloxazine ring. Since the N5 atom was in an sp3 configuration the sulfite was positioned
out of the ring plane towards the re-face of FAD (Figure 3.5). The sulfite moiety was
presumably unprotonated, which was compatible with its sulfate character and with the type
of the contacting atoms (Figure 3.5). Sulfite oxygen atom O1 was hydrogen bonded to the
side chain amide nitrogen of Asn A74, the oxygen atom O2 forms a strong salt bridge to His
A398, and the oxygen atom O3 was connected via a water molecule to Arg A265 and Trp
A234.
Figure 3.5: The FAD-sulfite adduct of APS reductase. Interactions between the sulfite moiety of the
FAD-sulfite adduct and the protein. All three sulfite oxygens were strongly hydrogen bonded to the
polypeptide surrounding; His A398 and Arg A265 were the key residues involved in substrate binding
and catalysis.
Structure analysis revealed identical conformations of the sulfite adduct and its environment
compared to APSR-amp. However, the subtle differences of the polypeptide chain compared
to APSR-red structure could not be identified due to the low resolution (2.5 Å). Partial
binding of AMP was reflected in the alternate conformations of Arg A317 whereby the
‘arginine out’ conformation was dominant in the APSR-sulfite state.
3.1.6.4 APSR-ox state
The APSR-ox state of APS reductase revealed a structure nearly identical to the ASPR-red
state. Even the flavin was in a bent conformation with an identical angle. This was unexpected
as a coplanar orientation of the three aromatic rings in the oxidized state would have been
energetically favorable (Dixon et al., 1979; Hall et al., 1987). For example, thioredoxin
reductase adopted a roughly planar conformation (Waksman, 1994) in the oxidized and a bent
conformation (bending angle 34°) in the reduced state (Lennon et al., 1999). In APS
reductase, obviously, Leu A70, Asn A74 and Trp A234 were strongly fixed at their position to
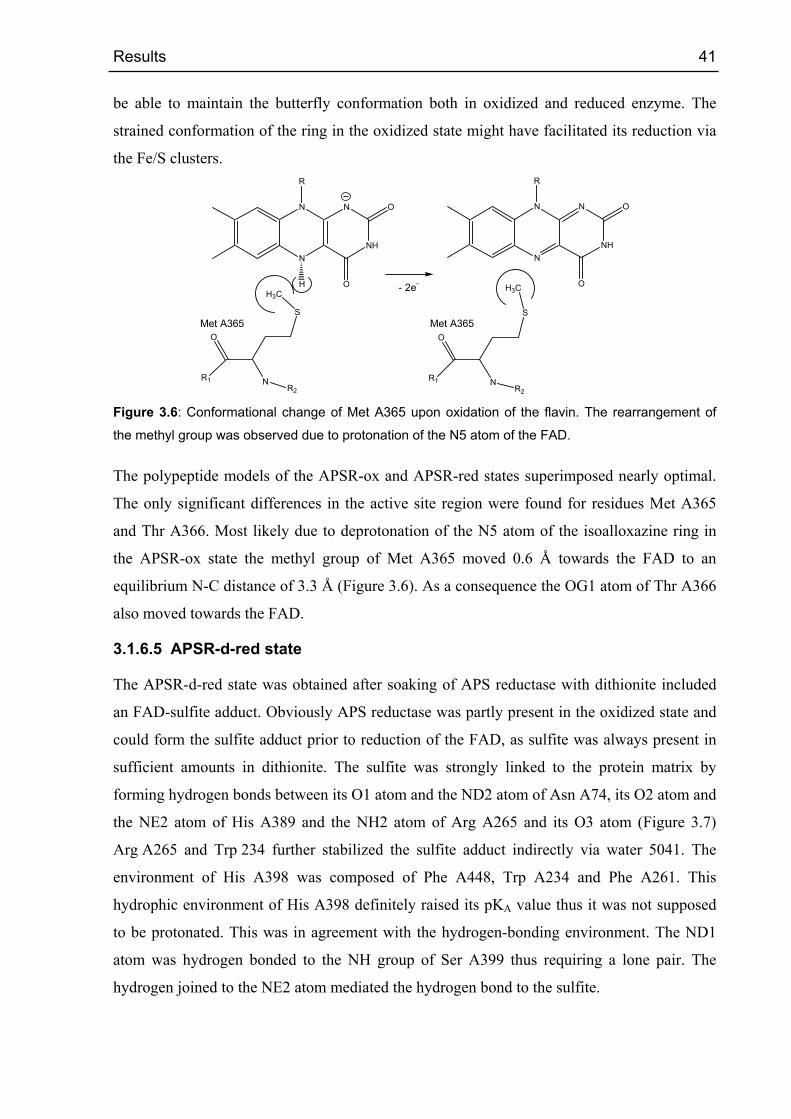
Results 41
be able to maintain the butterfly conformation both in oxidized and reduced enzyme. The
strained conformation of the ring in the oxidized state might have facilitated its reduction via
the Fe/S clusters.
N
N
NH
N
R
O
O
N
N
NH
N
R
O
O
O
N
S
H3C
R1R2
H
O
N
S
H3C
R1R2
Met A365 Met A365
- 2e-
Figure 3.6: Conformational change of Met A365 upon oxidation of the flavin. The rearrangement of
the methyl group was observed due to protonation of the N5 atom of the FAD.
The polypeptide models of the APSR-ox and APSR-red states superimposed nearly optimal.
The only significant differences in the active site region were found for residues Met A365
and Thr A366. Most likely due to deprotonation of the N5 atom of the isoalloxazine ring in
the APSR-ox state the methyl group of Met A365 moved 0.6 Å towards the FAD to an
equilibrium N-C distance of 3.3 Å (Figure 3.6). As a consequence the OG1 atom of Thr A366
also moved towards the FAD.
3.1.6.5 APSR-d-red state
The APSR-d-red state was obtained after soaking of APS reductase with dithionite included
an FAD-sulfite adduct. Obviously APS reductase was partly present in the oxidized state and
could form the sulfite adduct prior to reduction of the FAD, as sulfite was always present in
sufficient amounts in dithionite. The sulfite was strongly linked to the protein matrix by
forming hydrogen bonds between its O1 atom and the ND2 atom of Asn A74, its O2 atom and
the NE2 atom of His A389 and the NH2 atom of Arg A265 and its O3 atom (Figure 3.7)
Arg A265 and Trp 234 further stabilized the sulfite adduct indirectly via water 5041. The
environment of His A398 was composed of Phe A448, Trp A234 and Phe A261. This
hydrophic environment of His A398 definitely raised its pKA value thus it was not supposed
to be protonated. This was in agreement with the hydrogen-bonding environment. The ND1
atom was hydrogen bonded to the NH group of Ser A399 thus requiring a lone pair. The
hydrogen joined to the NE2 atom mediated the hydrogen bond to the sulfite.
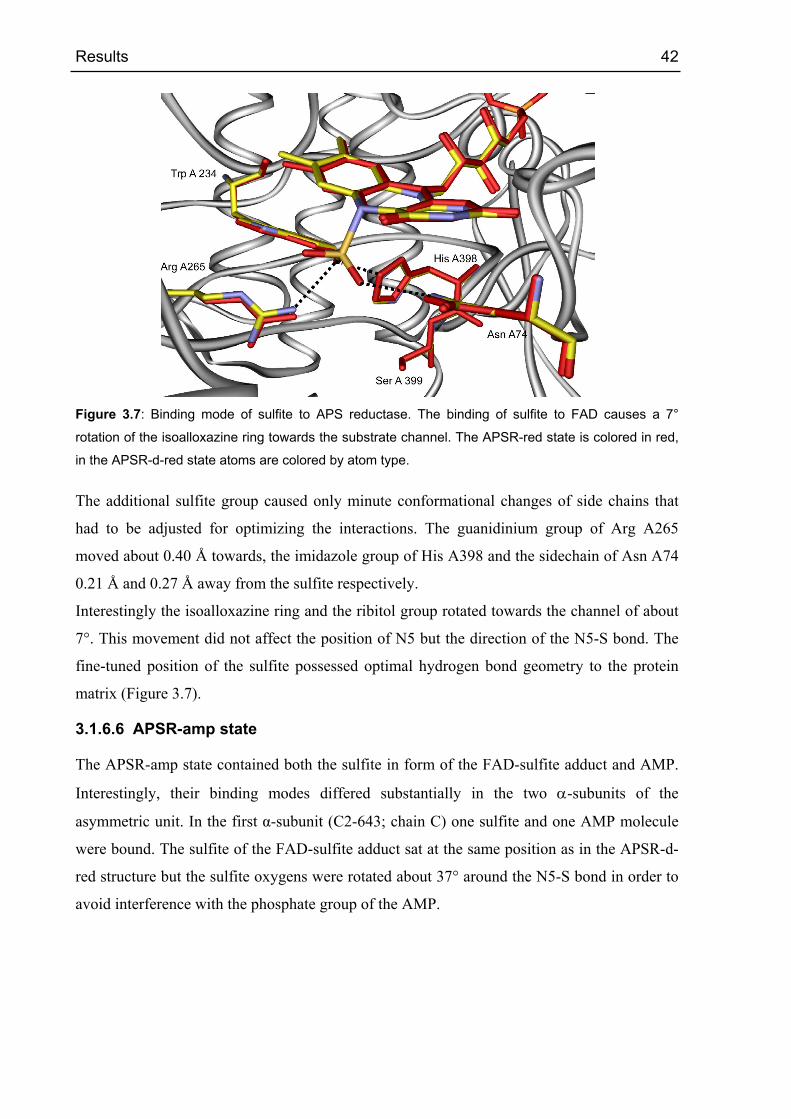
Results 42
Figure 3.7: Binding mode of sulfite to APS reductase. The binding of sulfite to FAD causes a 7°
rotation of the isoalloxazine ring towards the substrate channel. The APSR-red state is colored in red,
in the APSR-d-red state atoms are colored by atom type.
The additional sulfite group caused only minute conformational changes of side chains that
had to be adjusted for optimizing the interactions. The guanidinium group of Arg A265
moved about 0.40 Å towards, the imidazole group of His A398 and the sidechain of Asn A74
0.21 Å and 0.27 Å away from the sulfite respectively.
Interestingly the isoalloxazine ring and the ribitol group rotated towards the channel of about
7°. This movement did not affect the position of N5 but the direction of the N5-S bond. The
fine-tuned position of the sulfite possessed optimal hydrogen bond geometry to the protein
matrix (Figure 3.7).
3.1.6.6 APSR-amp state
The APSR-amp state contained both the sulfite in form of the FAD-sulfite adduct and AMP.
Interestingly, their binding modes differed substantially in the two α-subunits of the
asymmetric unit. In the first α-subunit (C2-643; chain C) one sulfite and one AMP molecule
were bound. The sulfite of the FAD-sulfite adduct sat at the same position as in the APSR-d-
red structure but the sulfite oxygens were rotated about 37° around the N5-S bond in order to
avoid interference with the phosphate group of the AMP.
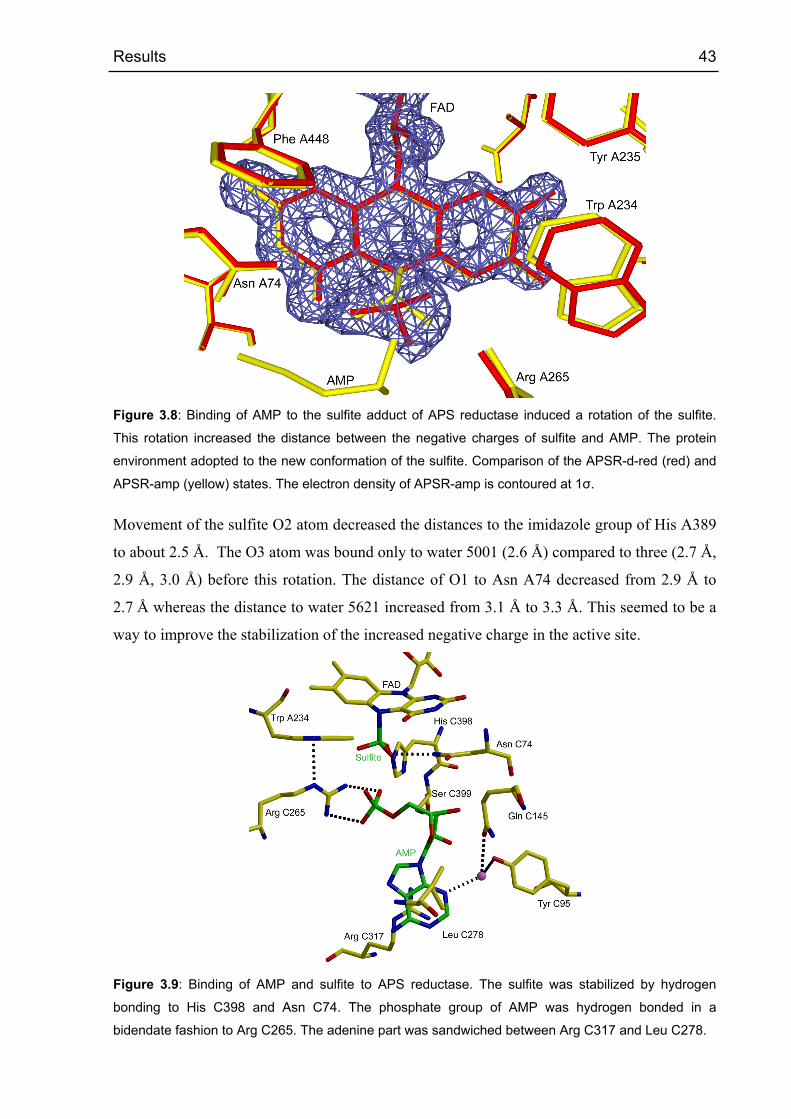
Results 43
Figure 3.8: Binding of AMP to the sulfite adduct of APS reductase induced a rotation of the sulfite.
This rotation increased the distance between the negative charges of sulfite and AMP. The protein
environment adopted to the new conformation of the sulfite. Comparison of the APSR-d-red (red) and
APSR-amp (yellow) states. The electron density of APSR-amp is contoured at 1σ.
Movement of the sulfite O2 atom decreased the distances to the imidazole group of His A389
to about 2.5 Å. The O3 atom was bound only to water 5001 (2.6 Å) compared to three (2.7 Å,
2.9 Å, 3.0 Å) before this rotation. The distance of O1 to Asn A74 decreased from 2.9 Å to
2.7 Å whereas the distance to water 5621 increased from 3.1 Å to 3.3 Å. This seemed to be a
way to improve the stabilization of the increased negative charge in the active site.
Figure 3.9: Binding of AMP and sulfite to APS reductase. The sulfite was stabilized by hydrogen
bonding to His C398 and Asn C74. The phosphate group of AMP was hydrogen bonded in a
bidendate fashion to Arg C265. The adenine part was sandwiched between Arg C317 and Leu C278.
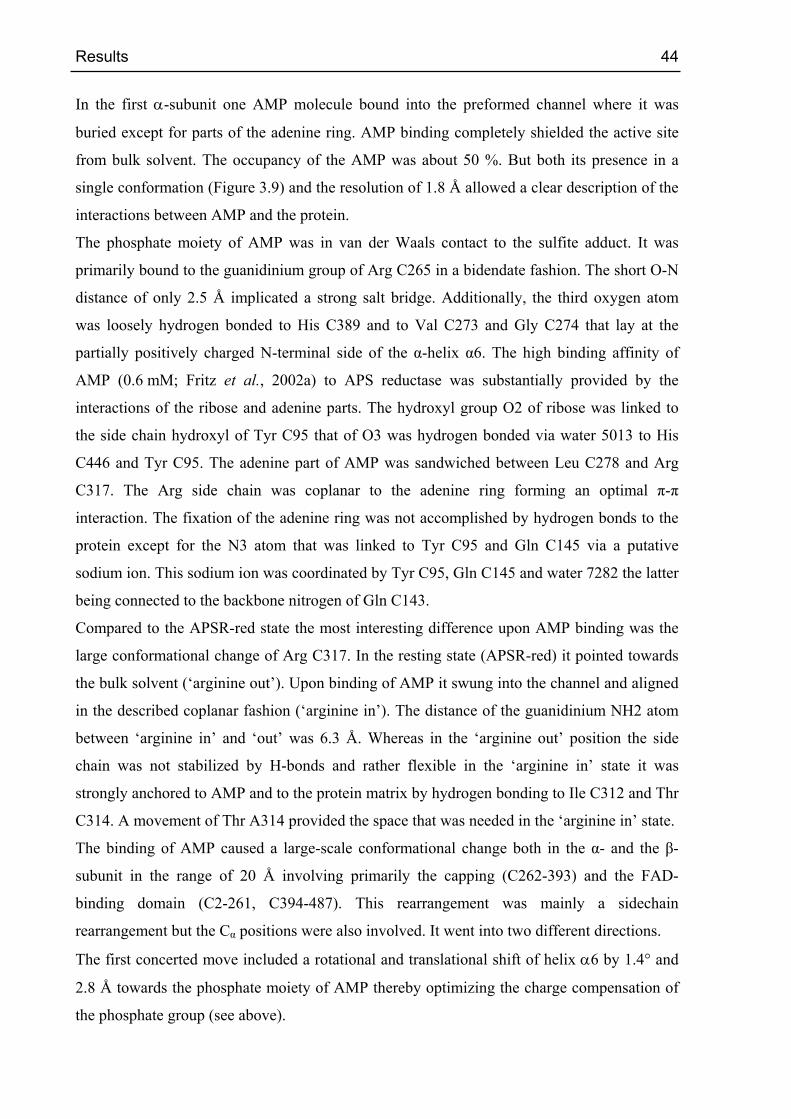
Results 44
In the first α-subunit one AMP molecule bound into the preformed channel where it was
buried except for parts of the adenine ring. AMP binding completely shielded the active site
from bulk solvent. The occupancy of the AMP was about 50 %. But both its presence in a
single conformation (Figure 3.9) and the resolution of 1.8 Å allowed a clear description of the
interactions between AMP and the protein.
The phosphate moiety of AMP was in van der Waals contact to the sulfite adduct. It was
primarily bound to the guanidinium group of Arg C265 in a bidendate fashion. The short O-N
distance of only 2.5 Å implicated a strong salt bridge. Additionally, the third oxygen atom
was loosely hydrogen bonded to His C389 and to Val C273 and Gly C274 that lay at the
partially positively charged N-terminal side of the α-helix α6. The high binding affinity of
AMP (0.6 mM; Fritz et al., 2002a) to APS reductase was substantially provided by the
interactions of the ribose and adenine parts. The hydroxyl group O2 of ribose was linked to
the side chain hydroxyl of Tyr C95 that of O3 was hydrogen bonded via water 5013 to His
C446 and Tyr C95. The adenine part of AMP was sandwiched between Leu C278 and Arg
C317. The Arg side chain was coplanar to the adenine ring forming an optimal π-π
interaction. The fixation of the adenine ring was not accomplished by hydrogen bonds to the
protein except for the N3 atom that was linked to Tyr C95 and Gln C145 via a putative
sodium ion. This sodium ion was coordinated by Tyr C95, Gln C145 and water 7282 the latter
being connected to the backbone nitrogen of Gln C143.
Compared to the APSR-red state the most interesting difference upon AMP binding was the
large conformational change of Arg C317. In the resting state (APSR-red) it pointed towards
the bulk solvent (‘arginine out’). Upon binding of AMP it swung into the channel and aligned
in the described coplanar fashion (‘arginine in’). The distance of the guanidinium NH2 atom
between ‘arginine in’ and ‘out’ was 6.3 Å. Whereas in the ‘arginine out’ position the side
chain was not stabilized by H-bonds and rather flexible in the ‘arginine in’ state it was
strongly anchored to AMP and to the protein matrix by hydrogen bonding to Ile C312 and Thr
C314. A movement of Thr A314 provided the space that was needed in the ‘arginine in’ state.
The binding of AMP caused a large-scale conformational change both in the α- and the β-
subunit in the range of 20 Å involving primarily the capping (C262-393) and the FAD-
binding domain (C2-261, C394-487). This rearrangement was mainly a sidechain
rearrangement but the Cα positions were also involved. It went into two different directions.
The first concerted move included a rotational and translational shift of helix α6 by 1.4° and
2.8 Å towards the phosphate moiety of AMP thereby optimizing the charge compensation of
the phosphate group (see above).

Results 45
The second large-scale change induced by AMP binding comprised a shift of the
dimethylbenzene and the pyrazine rings away from AMP. This movement was propagated to
Trp C234 and concomitantly to segment C218-239 that passed on the information across the
subunit contact to segment D40-46. ND2 of Asn D41 was 3.47 Å from the S3 of [4Fe-4S]
cluster I and moved 0.16 Å towards it upon AMP binding. Therefore, AMP binding modified
the surrounding of the [4Fe-4S] cluster I, which will influence its redox potential, and the
electron flow to FAD. Whether the electron transfer from the iron-sulfur clusters to the FAD
was influenced remained an open question.
Figure 3.10: Electrostatic surface representation of the two AMP binding sites in APS reductase. View
into the active site channel. In the distal binding site (right molecule) AMP was bound due to
hydrophobic interactions of the adenine ring and polar interactions of the phosphate group. The
interactions of AMP to the protein in the proximal binding site are described in detail in Figure 3.9.
Areas with positive and negative electrostatic potential are colored in blue and red respectively.
In the active site of the second α-subunit (A2-643; chain A) the AMP had two distinct
alternate positions (Figure 3.10). The first so-called proximal binding site was identical to that
in the first α-subunit, however, with a lower occupancy. But in a second binding site the
adenine ring was located at the edge of the channel about 3 Å apart from its proximal
position. It was anchored via hydrophobic interactions to Phe A264 and Phe A277 and
constituted a distal binding position with lower affinity. The ribose and phosphate groups
could point either towards the bulk solvent or towards the proximal binding site. However, the
electron density of this part was clear enough to indicate but not to prove these positions. The
side chain of Arg A317 was located in a similar position as in the APSR-red state (‘arginine
out’).
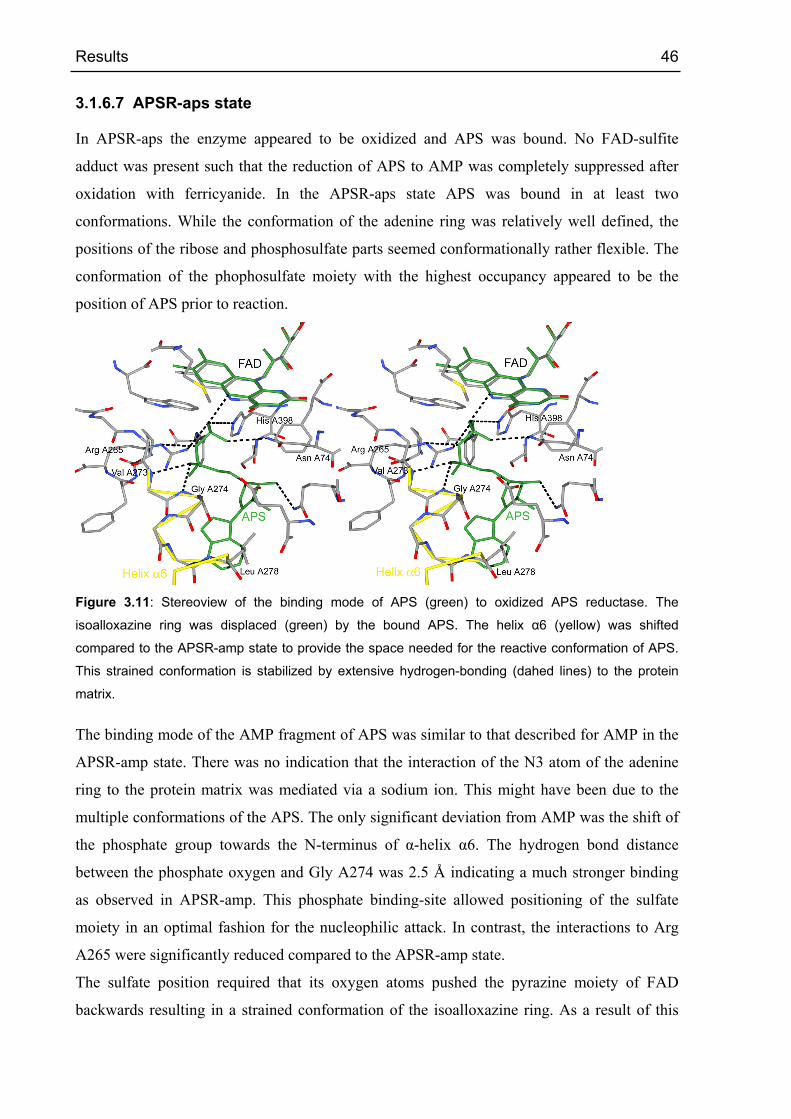
Results 46
3.1.6.7 APSR-aps state
In APSR-aps the enzyme appeared to be oxidized and APS was bound. No FAD-sulfite
adduct was present such that the reduction of APS to AMP was completely suppressed after
oxidation with ferricyanide. In the APSR-aps state APS was bound in at least two
conformations. While the conformation of the adenine ring was relatively well defined, the
positions of the ribose and phosphosulfate parts seemed conformationally rather flexible. The
conformation of the phophosulfate moiety with the highest occupancy appeared to be the
position of APS prior to reaction.
Figure 3.11: Stereoview of the binding mode of APS (green) to oxidized APS reductase. The
isoalloxazine ring was displaced (green) by the bound APS. The helix α6 (yellow) was shifted
compared to the APSR-amp state to provide the space needed for the reactive conformation of APS.
This strained conformation is stabilized by extensive hydrogen-bonding (dahed lines) to the protein
matrix.
The binding mode of the AMP fragment of APS was similar to that described for AMP in the
APSR-amp state. There was no indication that the interaction of the N3 atom of the adenine
ring to the protein matrix was mediated via a sodium ion. This might have been due to the
multiple conformations of the APS. The only significant deviation from AMP was the shift of
the phosphate group towards the N-terminus of α-helix α6. The hydrogen bond distance
between the phosphate oxygen and Gly A274 was 2.5 Å indicating a much stronger binding
as observed in APSR-amp. This phosphate binding-site allowed positioning of the sulfate
moiety in an optimal fashion for the nucleophilic attack. In contrast, the interactions to Arg
A265 were significantly reduced compared to the APSR-amp state.
The sulfate position required that its oxygen atoms pushed the pyrazine moiety of FAD
backwards resulting in a strained conformation of the isoalloxazine ring. As a result of this
Results 47
conformational change Leu A70 was shifted 0.5 Å away from the pyrazine ring. Obviously,
the sulfate of APS was positioned very close to the N5 atom such that the reaction could
immediately start after FAD reduction.
APS binding to ATP sulfurylase
The crystal structure of yeast ATP sulfurylase was reported in complex with its product APS
(Ullrich et al., 2001). The binding of APS in a L-shaped conformation to ATP sulfurylase was
typical for the binding of nucleotides to nucleotidylyl transferases. The conformation of APS
bound to ATP sulfurylase was quite similar to that in APS reductase. The angle between the
adenine and the ribose rings was twisted by 18° and the phosphosulfate moiety had an
enantiotopic conformation.
Although the APS conformation was rather similar – the APS protein interactions were rather
different. The adenine ring was mainly stabilized by polar interactions the N1, N6 and N7
directly to the protein or mediated via water molecules. It was only held in place for optimal
hydrogen bonding by a phenylalanine and a leucine (although the authors describe this
differently) and there were no π-π interactions. The ribose part was coordinated by the protein
backbone and a histidine, also the phosphate group was hydrogen bonded to the protein. The
second remarkable difference was the tight hydrogen bonding of the sulfate group - there was
no conformational flexibility in contrast to APS reductase.

Results 48
3.2 Sulfite reductase from Archaeoglobus fulgidus
3.2.1 Purification
Sulfite reductase from A. fulgidus was isolated under the exclusion of dioxygen for the first
time. The enzyme was purified by a modified procedure (Dahl et al., 1993) including three
chromatographic steps performed at 291 K in the anaerobic chamber. In order to minimize
protein denaturation by thermally induced unfolding or by protease activity, the complete
purification was performed within 36-48 h. On the SDS-PAGE gel only two bands (subunits α
and β) were visible. The yield of pure sulfite reductase was very high (83 - 96 mg per 10 g
frozen cells).
Purification step Protein
[mg]
Activity
[nmol·min-1]
Specific activity
[nmol sulfite·min-1·mg-1]
Purification
factor
Soluble fraction 928 5300 5.7 1
Resource Q 15 111 910 8.2 1.4
Superdex 200 46.2 2230 48.2 8.5
Table 3.4 Purification of sulfite reductase from A. fulgidus (5.3 g frozen cells). Specific activities were
determined at 82°C.
3.2.2 Enzyme properties
The pure protein had an activity of 48.2 nmol min-1 mg-1, which was the first specific activity
reported for purified sulfite reductase from A. fulgidus (Dahl et al., 1993).
The iron content of sulfite reductase was determined with ICP-MS to be 12.4 ± 1.8 Fe per
α2β2. This was quite surprising as sulfite reductase from A. fulgidus was expected to contain
26 Fe per α2β2 (Dahl et al., 1993).

Results 49
3.2.3 UV/Vis spectroscopy
3.2.3.1 Oxido-reduction experiments
The UV/Vis spectrum of sulfite reductase as isolated, recorded under exclusion of dioxygen,
showed maxima at 280 nm (ε280 = 393,000 M-1·cm-1), 392 nm (ε391 = 176,000 M-1·cm-1), 544
nm (ε544 = 39,000 M-1·cm-1), and 583 nm (ε583 = 40,000 M-1·cm-1), as well as a weak band
around 710 nm (Büchert, 2001). Upon reduction the soret peak shifted to 393 nm and UV/Vis
difference spectra revealed a decrease in absorption with maximum decrease at 382 nm, 459
nm, 540 nm, 584 nm and 707 nm. The intensity around 614 nm increased. The weak band
around 710 nm disappeared upon reduction.
300 400 500 600 700 800
0.0
0.2
0.4
0.6
0.8
1.0A B
Abs
orba
nce
Wavelength [nm]300 400 500 600 700 800
-0.08
-0.06
-0.04
-0.02
0.00
0.02
0.04
∆ A
bsor
banc
e
Wavelength [nm] Figure 3.12: UV/Vis spectra of sulfite reductase (3.09 µM) from A. fulgidus in 20 mM potassium
phosphate buffer pH 7.0. A Sulfite reductase as isolated (black line); after reduction with 5-deazaflavin
/ sodium oxalate (grey line); after reduction and reoxidation with ferricyanide (grey dotted line). B
UV/Vis difference spectrum [reduced enzyme] – [enzyme as isolated].
On the basis of this experiment the redox state of the siroheme could be determined. With
respect to the soret band sulfite reductase was isolated in the oxidized state. The absorbance in
the α/β region as well as the band around 710 nm of sulfite reductase as isolated was higher
than that of reoxidized sulfite reductase. This was probably due to a baseline shift, but it
cannot be excluded that sulfite reductase was not completely reoxidized.

Results 50
3.2.3.2 Binding of substrates and products
3.2.3.2.1 Enzyme as isolated
300 400 500 600 700 8000.0
0.3
0.6
0.9
1.2
1.5A B
x3
Abs
orba
nce
Wavelength [nm]300 400 500 600 700 800
-0.12
-0.08
-0.04
0.00
0.04
∆ A
bsor
banc
e
Wavelength [nm] Figure 3.13: UV/Vis spectra of sulfite reductase (5.79 µM) from A. fulgidus in 20 mM potassium
phosphate buffer pH 7.0. A Sulfite reductase as isolated (black line); with 0.42 mM sodium sulfite
(grey line). B UV/Vis difference spectrum [enzyme in 0.42 mM sulfite] – [enzyme as isolated].
Upon binding of the substrate sulfite to sulfite reductase as isolated the soret band decreased
and the absorbance in the α/β region broadened. The band around 710 nm disappeared. In the
difference spectrum the maximum decrease in absorbance was at 384 nm. At 710 nm there
was also a slight decrease. The absorption increased around 424 nm, 564 nm, 605 nm, 669 nm
and 742 nm. When taking a closer look at the spectra from 650 nm to 750 nm the increase in
absorption around 669 nm and 742 nm were actually only due to a baseline shift. The change
in the absorption spectrum in that region upon binding of sulfite was solely a decrease in
absorption around 710 nm
300 400 500 600 700 8000.0
0.2
0.4
0.6
0.8
1.0A B
x3
Abso
rban
ce
Wavelength [nm]300 400 500 600 700 800
0.00
0.02
0.04
0.06
0.08
0.10
∆ Ab
sorb
ance
Wavelength [nm] Figure 3.14: UV/Vis spectra of sulfite reductase (6.86 µM) from A. fulgidus in 20 mM potassium
phosphate buffer pH 7.0. A Sulfite reductase as isolated (black line); with 0.98 mM sodium sulfide
(grey line). B UV/Vis difference spectrum [enzyme in 0.98 mM sulfide] – [enzyme as isolated].
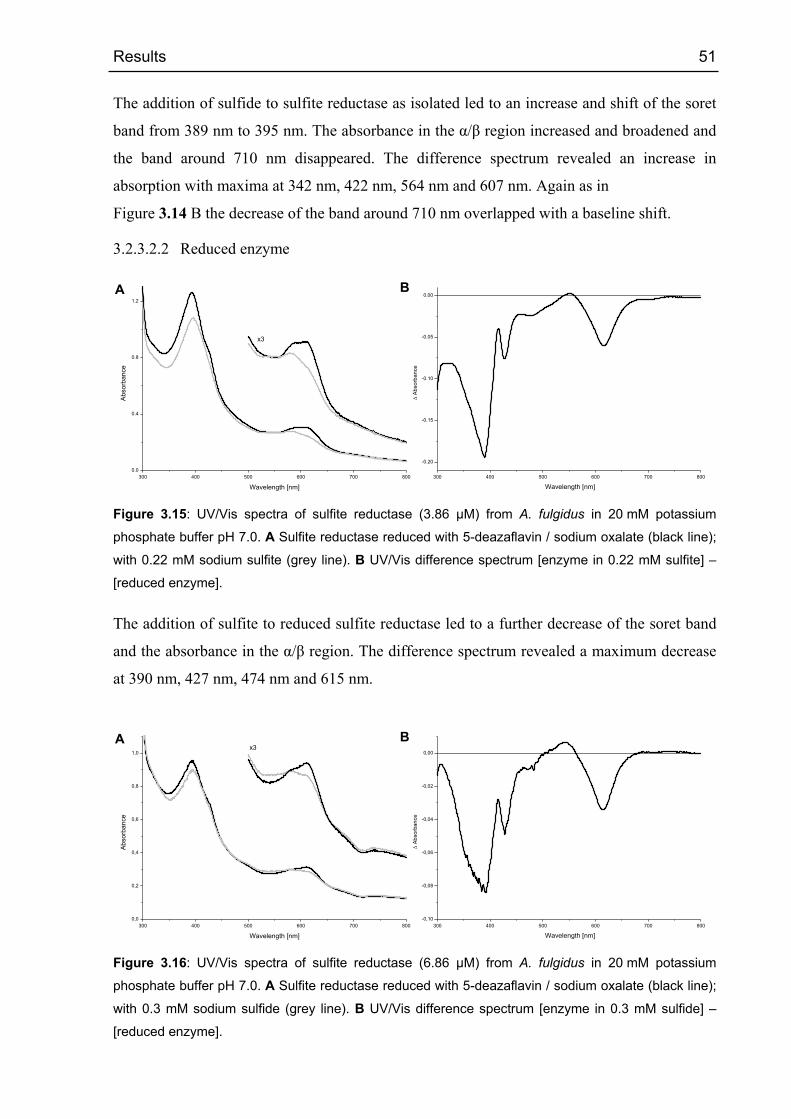
Results 51
The addition of sulfide to sulfite reductase as isolated led to an increase and shift of the soret
band from 389 nm to 395 nm. The absorbance in the α/β region increased and broadened and
the band around 710 nm disappeared. The difference spectrum revealed an increase in
absorption with maxima at 342 nm, 422 nm, 564 nm and 607 nm. Again as in
Figure 3.14 B the decrease of the band around 710 nm overlapped with a baseline shift.
3.2.3.2.2 Reduced enzyme
300 400 500 600 700 8000.0
0.4
0.8
1.2
A B
x3
Abs
orba
nce
Wavelength [nm]300 400 500 600 700 800
-0.20
-0.15
-0.10
-0.05
0.00
∆ A
bsor
banc
e
Wavelength [nm] Figure 3.15: UV/Vis spectra of sulfite reductase (3.86 µM) from A. fulgidus in 20 mM potassium
phosphate buffer pH 7.0. A Sulfite reductase reduced with 5-deazaflavin / sodium oxalate (black line);
with 0.22 mM sodium sulfite (grey line). B UV/Vis difference spectrum [enzyme in 0.22 mM sulfite] –
[reduced enzyme].
The addition of sulfite to reduced sulfite reductase led to a further decrease of the soret band
and the absorbance in the α/β region. The difference spectrum revealed a maximum decrease
at 390 nm, 427 nm, 474 nm and 615 nm.
300 400 500 600 700 8000,0
0,2
0,4
0,6
0,8
1,0
A Bx3
Abso
rban
ce
Wavelength [nm]300 400 500 600 700 800
-0,10
-0,08
-0,06
-0,04
-0,02
0,00
∆ Ab
sorb
ance
Wavelength [nm] Figure 3.16: UV/Vis spectra of sulfite reductase (6.86 µM) from A. fulgidus in 20 mM potassium
phosphate buffer pH 7.0. A Sulfite reductase reduced with 5-deazaflavin / sodium oxalate (black line);
with 0.3 mM sodium sulfide (grey line). B UV/Vis difference spectrum [enzyme in 0.3 mM sulfide] –
[reduced enzyme].

Results 52
Interestingly, the reaction of reduced sulfite reductase with sulfide produced the same spectral
changes as the reaction of the enzyme with sulfite: a reduction of the soret band and in the α/β
region. The difference spectrum was qualitatively the same with a maximum decrease at
393 nm, 428 nm, 472 nm and 615 nm.
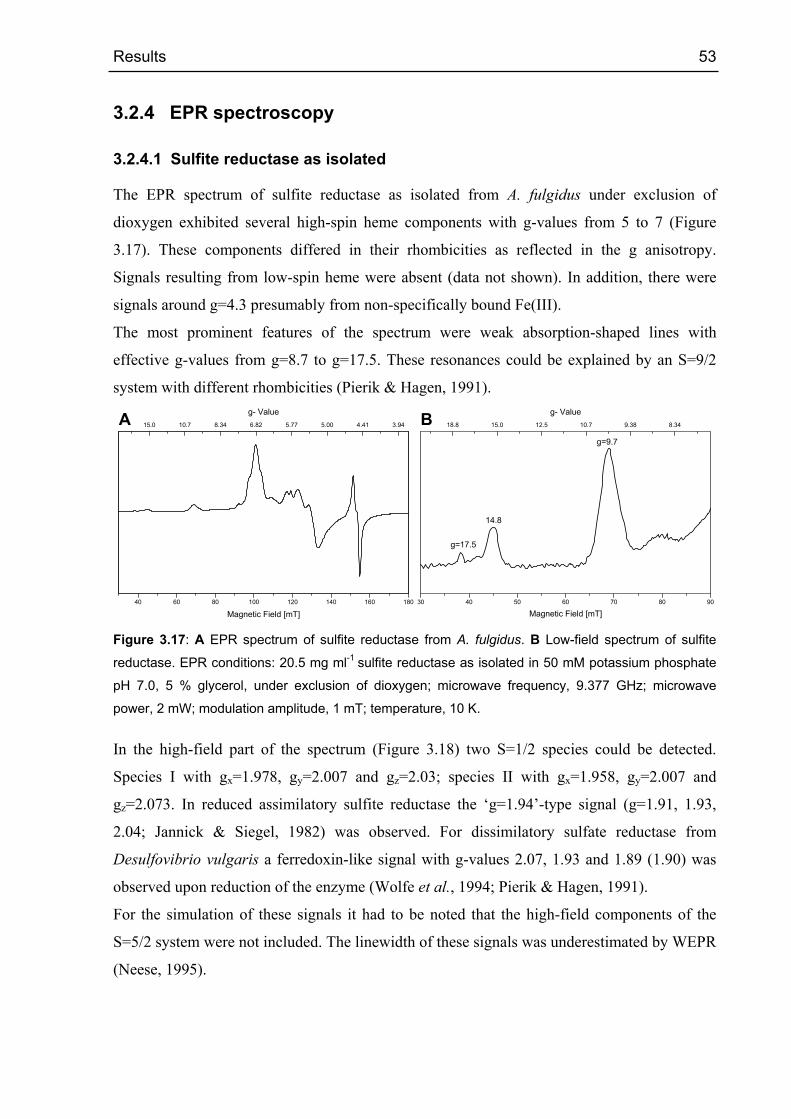
Results 53
3.2.4 EPR spectroscopy
3.2.4.1 Sulfite reductase as isolated
The EPR spectrum of sulfite reductase as isolated from A. fulgidus under exclusion of
dioxygen exhibited several high-spin heme components with g-values from 5 to 7 (Figure
3.17). These components differed in their rhombicities as reflected in the g anisotropy.
Signals resulting from low-spin heme were absent (data not shown). In addition, there were
signals around g=4.3 presumably from non-specifically bound Fe(III).
The most prominent features of the spectrum were weak absorption-shaped lines with
effective g-values from g=8.7 to g=17.5. These resonances could be explained by an S=9/2
system with different rhombicities (Pierik & Hagen, 1991).
40 60 80 100 120 140 160 180
14.8
g=17.5
Magnetic Field [mT]
15.0 10.7 8.34 6.82 5.77 5.00 4.41 3.94
g- Value
30 40 50 60 70 80 90
A Bg=9.7
Magnetic Field [mT]
18.8 15.0 12.5 10.7 9.38 8.34
g- Value
Figure 3.17: A EPR spectrum of sulfite reductase from A. fulgidus. B Low-field spectrum of sulfite
reductase. EPR conditions: 20.5 mg ml-1 sulfite reductase as isolated in 50 mM potassium phosphate
pH 7.0, 5 % glycerol, under exclusion of dioxygen; microwave frequency, 9.377 GHz; microwave
power, 2 mW; modulation amplitude, 1 mT; temperature, 10 K.
In the high-field part of the spectrum (Figure 3.18) two S=1/2 species could be detected.
Species I with gx=1.978, gy=2.007 and gz=2.03; species II with gx=1.958, gy=2.007 and
gz=2.073. In reduced assimilatory sulfite reductase the ‘g=1.94’-type signal (g=1.91, 1.93,
2.04; Jannick & Siegel, 1982) was observed. For dissimilatory sulfate reductase from
Desulfovibrio vulgaris a ferredoxin-like signal with g-values 2.07, 1.93 and 1.89 (1.90) was
observed upon reduction of the enzyme (Wolfe et al., 1994; Pierik & Hagen, 1991).
For the simulation of these signals it had to be noted that the high-field components of the
S=5/2 system were not included. The linewidth of these signals was underestimated by WEPR
(Neese, 1995).

Results 54
300 310 320 330 340 350 360 370 380
Magnetic Field [mT]
2.21 2.14 2.08 2.02 1.97 1.91 1.87 1.82 1.77
g- Value
Figure 3.18: Upper trace: high-field spectrum of sulfite reductase from A. fulgidus. Lower trace:
simulation. EPR conditions: 20.5 mg ml-1 sulfite reductase as isolated in 50 mM potassium phosphate
pH 7.0, 5 % glycerol, under exclusion of dioxygen; microwave frequency, 9.377 GHz; microwave
power, 2 mW; modulation amplitude, 1 mT; temperature, 10 K.
The low and mid field part of the EPR spectrum of sulfite reductase as isolated (Figure 3.19)
was simulated as a sum of four species with S=9/2 and six species with S=5/2. Additionally,
non-specifically bound Fe(III) was simulated with S=5/2.
40 60 80 100 120 140 160 180
g- Value
Magnetic Field [mT]
15.6 8.27 5.63 4.26 3.43 2.87 2.47 2.16 1.93 1.74
30 40 50 60 70 80 90
A B
Magnetic Field [mT]
g- Value
20.1 17.1 14.9 13.3 11.9 10.8 9.9 9.13 8.47 7.9
Figure 3.19: A Upper trace: EPR spectrum of sulfite reductase from A. fulgidus. Lower trace:
simulation. B Upper trace: low-field spectrum of sulfite reductase. Lower trace: simulation. EPR
conditions: 20.5 mg ml-1 sulfite reductase as isolated in 50 mM potassium phosphate pH 7.0, 5 %
glycerol, under exclusion of dioxygen; microwave frequency, 9.379 GHz; microwave power, 2 mW;
modulation amplitude, 1 mT; temperature, 6 K.
The low field part of the spectrum with g-values higher than g=8 was identified as part of an
S=9/2 system. The contributions of the components with different rhombicity were shown in
Figure 3.20. The line at g=17.5 originated from the | ± 1/2 > doublet with E/D=0.154. Its
| ± 3/2 > doublet was responsible for the line at g=9.7. The line at g=16.2 was from a | ± 1/2 >
doublet with E/D=0.08. The line at g=14.8 was from a | ± 1/2 > doublet with E/D=0.052. The
weak signal at g=8.4 was from a | ± 3/2 > doublet with E/D=0.117. Its | ± 1/2 > doublet
contributed to the signal at g=17.5 with an effective g-value of 16.97.

Results 55
The S=5/2 system was very complex with overlapping intensities. It could be simulated with
E/D parameters of 0, 0.013, 0.018, 0.0265, 0.036 and 0.057 (Figure 3.20B).
Finally, enzyme-bound ferric iron was simulated as S=5/2 system with E/D= 0.33.
30 40 50 60 70 80 90
Magnetic Field [mT]
20.1 17.1 14.9 13.3 11.9 10.8 9.9 9.13 8.47 7.9
e
d
c
b
a
g-Value
90 105 120 135 150 165
g
f
e
d
c
ba
A B
Magnetic Field [mT]
7.4 6.7 6.11 5.63 5.21 4.85 4.54 4.26 4.02
g- Value
Figure 3.20: Contribution of the simulated sub spectra to the EPR-spectrum of sulfite reductase from
A. fulgidus. A Low-field part of the spectrum with the S=9/2 signals and a E/D=0.117 b E/D=0.08
c E/D=0.154 d E/D=0.052 e EPR-spectrum of sulfite reductase. B Part of the spectrum with S=5/2
signals with a E/D=0.00 b E/D=0.013 c E/D=0.018 d E/D=0.0265 e E/D=0.036 and f E/D=0.057.
g EPR-spectrum of sulfite reductase. EPR conditions: 20.5 mg ml-1 sulfite reductase as isolated in 50
mM potassium phosphate pH 7.0, 5 % glycerol, under exclusion of dioxygen; microwave frequency,
9.37 GHz; microwave power, 2 mW; modulation amplitude, 1 mT; temperature, 6 K.
3.2.4.1.1 Temperature dependence and zero field splitting
The EPR spectrum of sulfite reductase as isolated showed the following behavior with
increasing temperature:
(i) the signals at g=14-17.5 (38-45 mT) decreased,
(ii) the signals at g=8.5 and 9.7 (69 and 80 mT) displayed their maximum intensity at 8K
(iii) the S=5/2 signals from g=5.0 to g=7.5 (90 to 135 mT) decreased.
The ferredoxin-like signals had their maximum intensity at 10K. As shown in Figure 3.24 the
signals were not saturated at the conditions used.
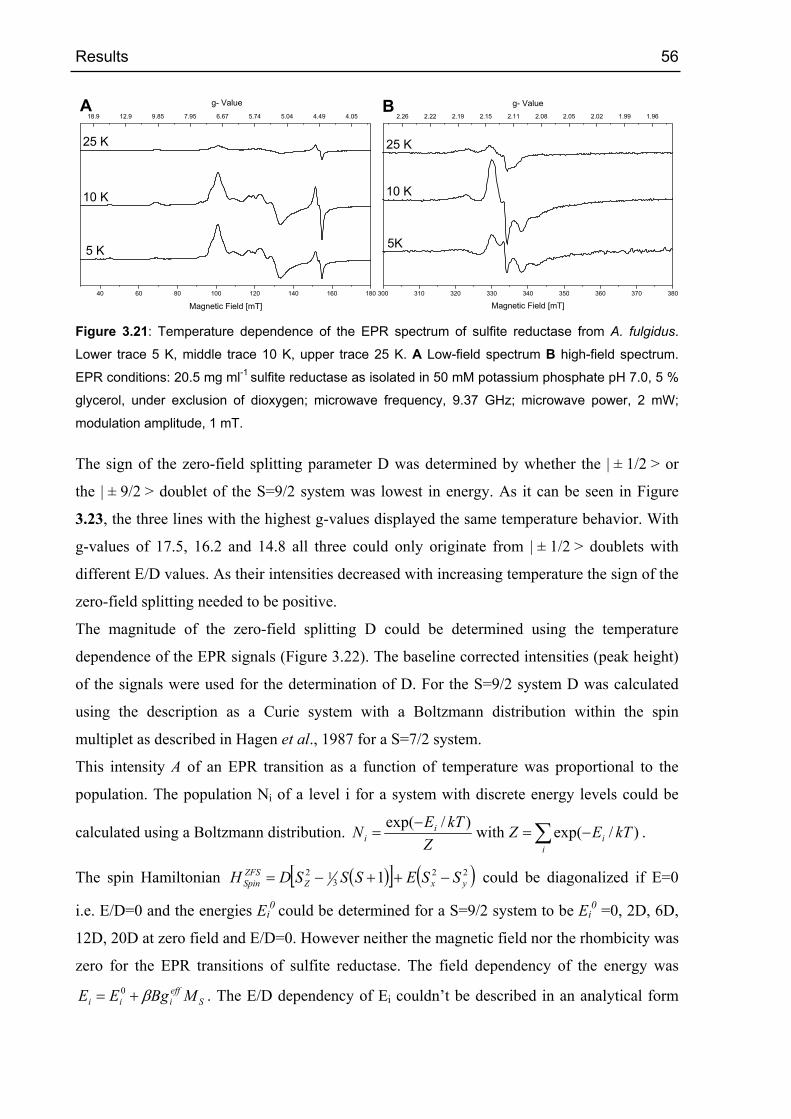
Results 56
40 60 80 100 120 140 160 180
Magnetic Field [mT]
18.9 12.9 9.85 7.95 6.67 5.74 5.04 4.49 4.05
25 K 25 K
10 K10 K
5 K 5K
g- Value
300 310 320 330 340 350 360 370 380
Magnetic Field [mT]
2.26 2.22 2.19 2.15 2.11 2.08 2.05 2.02 1.99 1.96
g- ValueA B
Figure 3.21: Temperature dependence of the EPR spectrum of sulfite reductase from A. fulgidus.
Lower trace 5 K, middle trace 10 K, upper trace 25 K. A Low-field spectrum B high-field spectrum.
EPR conditions: 20.5 mg ml-1 sulfite reductase as isolated in 50 mM potassium phosphate pH 7.0, 5 %
glycerol, under exclusion of dioxygen; microwave frequency, 9.37 GHz; microwave power, 2 mW;
modulation amplitude, 1 mT.
The sign of the zero-field splitting parameter D was determined by whether the | ± 1/2 > or
the | ± 9/2 > doublet of the S=9/2 system was lowest in energy. As it can be seen in Figure
3.23, the three lines with the highest g-values displayed the same temperature behavior. With
g-values of 17.5, 16.2 and 14.8 all three could only originate from | ± 1/2 > doublets with
different E/D values. As their intensities decreased with increasing temperature the sign of the
zero-field splitting needed to be positive.
The magnitude of the zero-field splitting D could be determined using the temperature
dependence of the EPR signals (Figure 3.22). The baseline corrected intensities (peak height)
of the signals were used for the determination of D. For the S=9/2 system D was calculated
using the description as a Curie system with a Boltzmann distribution within the spin
multiplet as described in Hagen et al., 1987 for a S=7/2 system.
This intensity A of an EPR transition as a function of temperature was proportional to the
population. The population Ni of a level i for a system with discrete energy levels could be
calculated using a Boltzmann distribution. ∑ −=−
=i
ii
i kTEZZ
kTEN )/exp(with)/exp( .
The spin Hamiltonian ( )[ ] ( )223
12 1 yxZZFSSpin SSESSSDH −++−= could be diagonalized if E=0
i.e. E/D=0 and the energies Ei0 could be determined for a S=9/2 system to be Ei
0 =0, 2D, 6D,
12D, 20D at zero field and E/D=0. However neither the magnetic field nor the rhombicity was
zero for the EPR transitions of sulfite reductase. The field dependency of the energy was
Seffiii MBgEE β+= 0 . The E/D dependency of Ei couldn’t be described in an analytical form

Results 57
but the Ei values at a certain magnetic field and rhombicity were numerically determined. For
a transition from a | ± 1/2 > doublet the intensity
1
12/92/72/52/3
1 −
−−−−−
++++∝ TeeeeA kT
EkTE
kTE
kTE
and from the | ± 3/2 > doublet the
intensity 12/3
−∝ TeA kTE
could be fitted to the temperature dependence of the respective signal.
0.02 0.04 0.06 0.08 0.10 0.12 0.14 0.16 0.18 0.20
0.0
0.4
0.8
1.2
1.6
|±3/2>
|±1/2>Sig
nal I
nten
sity
1/Temperature [K-1]0.02 0.04 0.06 0.08 0.10 0.12 0.14 0.16 0.18 0.20
0.0
0.4
0.8
1.2
1.6BA
E/D=0.052 |±1/2>
E/D=0.08 |±1/2>
E/D=0.117 |±3/2>
1/Temperature [K-1]
Sig
nal I
nten
sity
Figure 3.22: Determination of the zero-field splitting D for the S=9/2 system of sulfite reductase from
A. fulgidus. The baseline corrected intensities were fitted to the corresponding Curie corrected
Boltzmann distribution. A The lines at g=17.5 (▲) and 9.7 (■) were fitted to a | ± 1/2 > and | ± 3/2 >
system with E/D=0.154. B The lines at g=16.2 (▲), 14.8 (●) and 8.4 (■) were fitted to a | ± 1/2 >
system with E/D=0.08, a | ± 1/2 > system with E/D=0.052 and a | ± 3/2 > system with E/D=0.117.
All the lines with g-value >8 were used for the determination of D for the S=9/2 system. The
fitting of the temperature dependence of a signal from a | ± 3/2 > doublet was much more
precise than the ones from a | ± 1/2 > doublet as reflected in the estimated standard error
(±D)(Table 3.5). Thus for further simulations of the S=9/2 system a D-value of 1.5 was used,
except for E/D=0.154 where a D-value of 3.0 was used. g-Value E/D Doublet χ2 D ±D
17.5 0.154 1/2 0.00099 1.5 7.1
9.7 0.154 3/2 0.02950 2.98 0.56
8.4 0.117 3/2 0.00001 1.52 0.13
16.2 0.080 1/2 0.00026 1.4 4.8
14.8 0.052 1/2 0.00314 1.4 4.1
Table 3.5: Zero-field splitting parameters of the S=9/2 system of sulfite reductase from A. fulgidus.
The estimated error (±D) of the zero-field splitting (D) does not include the experimental error.
The temperature dependence of the EPR-spectrum for the S=9/2 system was simulated using
the parameters in Table 3.6. The total intensity (double integral) of the simulated spectra had
to be determined. Therefore a curie system was assumed ( 1−∝ TI ) and the simulated spectra

Results 58
were scaled accordingly. This resulted in a good agreement between the measured spectra
(trace a-e) and the simulated spectra as shown in Figure 3.23.
30 40 50 60 70 80 90
sim
sim
sim
sim
sim
e
d
c
b
a
Magnetic Field [mT]30 40 50 60 70 80 90
Magnetic Field [mT]
20.1 17.1 14.9 13.3 11.9 10.8 9.9 9.13 8.47 7.9
g- Value
Figure 3.23: Temperature dependence of the resonances at low field of sulfite reductase from A.
fulgidus. a sulfite reductase at 6K, b sulfite reductase at 8K, c sulfite reductase at 15K, d sulfite
reductase at 20K, e sulfite reductase at 30K. EPR conditions: 20.5 mg ml-1 sulfite reductase as
isolated in 50 mM potassium phosphate pH 7.0, 5 % glycerol, under exclusion of dioxygen; microwave
frequency, 9.378 GHz; microwave power, 2 mW; modulation amplitude, 1 mT.
The simulation of the spectra revealed that for both the S=9/2 and S=5/2 system there were
two to three major components. The S=9/2 system was dominated by a signal with E/D=0.052
and a signal with E/D=0.154. The S=5/2 system had major components with E/D=0.0265 and
E/D=0.036 as well as E/D=0.018.
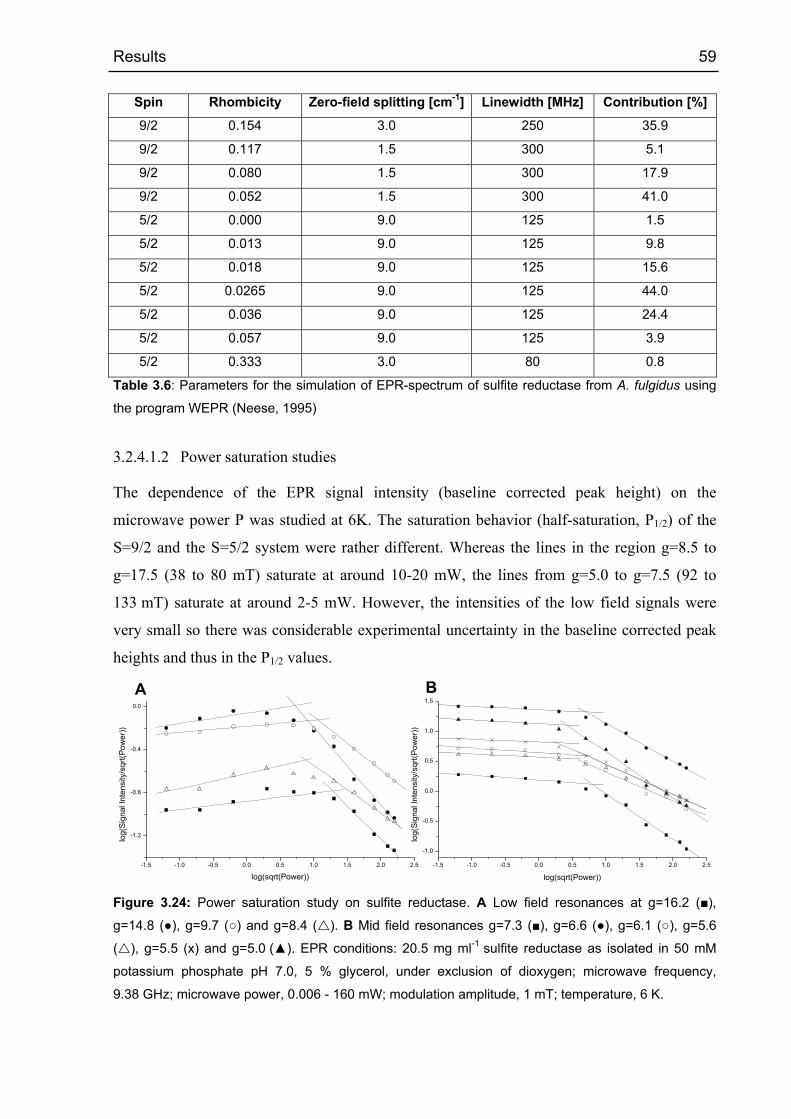
Results 59
Spin Rhombicity Zero-field splitting [cm-1] Linewidth [MHz] Contribution [%]
9/2 0.154 3.0 250 35.9
9/2 0.117 1.5 300 5.1
9/2 0.080 1.5 300 17.9
9/2 0.052 1.5 300 41.0
5/2 0.000 9.0 125 1.5
5/2 0.013 9.0 125 9.8
5/2 0.018 9.0 125 15.6
5/2 0.0265 9.0 125 44.0
5/2 0.036 9.0 125 24.4
5/2 0.057 9.0 125 3.9
5/2 0.333 3.0 80 0.8
Table 3.6: Parameters for the simulation of EPR-spectrum of sulfite reductase from A. fulgidus using
the program WEPR (Neese, 1995)
3.2.4.1.2 Power saturation studies
The dependence of the EPR signal intensity (baseline corrected peak height) on the
microwave power P was studied at 6K. The saturation behavior (half-saturation, P1/2) of the
S=9/2 and the S=5/2 system were rather different. Whereas the lines in the region g=8.5 to
g=17.5 (38 to 80 mT) saturate at around 10-20 mW, the lines from g=5.0 to g=7.5 (92 to
133 mT) saturate at around 2-5 mW. However, the intensities of the low field signals were
very small so there was considerable experimental uncertainty in the baseline corrected peak
heights and thus in the P1/2 values.
-1.5 -1.0 -0.5 0.0 0.5 1.0 1.5 2.0 2.5
-1.0
-0.5
0.0
0.5
1.0
1.5BA
log(
Sig
nal I
nten
sity
/sqr
t(Pow
er))
log(sqrt(Power))-1.5 -1.0 -0.5 0.0 0.5 1.0 1.5 2.0 2.5
-1.2
-0.8
-0.4
0.0
log(sqrt(Power))
log(
Sig
nal I
nten
sity
/sqr
t(Pow
er))
Figure 3.24: Power saturation study on sulfite reductase. A Low field resonances at g=16.2 (■),
g=14.8 (●), g=9.7 (○) and g=8.4 ( ). B Mid field resonances g=7.3 (■), g=6.6 (●), g=6.1 (○), g=5.6
( ), g=5.5 (x) and g=5.0 (▲). EPR conditions: 20.5 mg ml-1 sulfite reductase as isolated in 50 mM
potassium phosphate pH 7.0, 5 % glycerol, under exclusion of dioxygen; microwave frequency,
9.38 GHz; microwave power, 0.006 - 160 mW; modulation amplitude, 1 mT; temperature, 6 K.

Results 60
The details of the half-saturation power determination were taken from Figure 3.24 and listed
in Table 3.7. g-Value Field [mT] Spin Rhombicity P1/2 [mW]
16.2 41 9/2 0.154 19
14.8 45 9/2 0.052 5.3
9.7 69 9/2 0.154 11
8.4 80 9/2 0.117 7.7
7.3 92 5/2 0.057 6.2
6.6 101 5/2 0.0265 5.0
6.1 109 5/2 0.0 5.2
5.6 120 5/2 0.018 3.6
5.5 123 5/2 0.052 1.9
5.0 133 5/2 0.036 2.7
Table 3.7: Power saturation parameters of sulfite reductase from A. fulgidus at 6 K.
Summarizing the results above: in sulfite reductase as isolated there were four S=9/2 species
with E/D= 0.154, 0.117 0.08 and 0.052. The determination of the zero-field splitting
parameter D was with the method of thermal depopulation only reliable for the | ± 3/2 >
doublets and agreed with the value from the simulation. The zero-field splitting for the
E/D=0.154 component was D = 3.0 ± 0.6 cm-1 (3.0 cm-1 by simulation), for the other
components D= 1.5 ± 0.1 cm-1 (1.5 cm-1 by simulation). The value of the half-saturation
power was not very reliable due to the small signals and the use of peak height instead of peak
area.
In addition, there were six S=5/2 species with E/D= 0.057, 0.036, 0.0265, 0.018, 0.013 and
0.0. Due to the many species, some with only very low and overlapping intensity
determination of the zero-field splitting was not feasible. Furthermore simulation of D was
not possible due to the observability of only the | ± 1/2 > doublet. The power saturation
studies for these signals were reliable and P1/2 was in the range of 2-6 mW for the different
components.
3.2.4.2 Oxidized sulfite reductase
Sulfite reductase as isolated was reacted with potassium ferricyanide under exclusion of
dioxygen. This resulted in rather unexpected EPR spectral changes (Figure 3.25). In the low
field part there were only 2 absorption shaped lines at g=17.5 and 9.7. Also the mid field part
was dominated by a single component with g=6.65 and g=5.1.
Although a quantitation was not performed, it was clearly visible that the intensity of the
signals was much higher than in sulfite reductase as isolated, even more if a correction factor

Results 61
for the concentration was introduced (conditions for the comparison of the normalized
spectra: microwave power, 0.6 mW; modulation amplitude, 1 mT; temperature, 10 K).
Interestingly the relative intensity of the S=9/2 signals compared to the S=5/2 signals
decreased from the state as isolated to the oxidized state.
40 60 80 100 120 140 160 180
A
Magnetic Field [mT]
15.0 11.3 9.07 7.57 6.49 5.68 5.06 4.55 4.14 3.80
g- Value
30 40 50 60 70 80 90
Magnetic Field [mT]
18.0 15.0 12.9 11.3 10.1 9.07 8.25 7.57Bg- Value
Figure 3.25: A EPR spectrum of sulfite reductase from A. fulgidus. B Low-field spectrum of sulfite
reductase. EPR conditions: 15 mg ml-1 oxidized sulfite reductase in 100 mM potassium phosphate pH
7.0, 5 % glycerol, under exclusion of dioxygen; microwave frequency, 9.38 GHz; microwave power,
0.6 mW; modulation amplitude, 1 mT; temperature, 10 K.
At high magnetic field (Figure 3.26) there were still resonances from two species present:
species I with gx=1.978, gy=2.007, gz=2.03, species II with gx=1.958, gy=2.007, gz=2.073. The
relative contribution of the two changed. In the spectrum of the enzyme as isolated their
relative contribution was approximately equal. After the reaction with ferricyanide the relative
contributions were about 10:1. This was consistent with the assumption of species II being a
[4Fe-4S] cluster of the ferredoxin type. It was partly reduced in the enzyme as isolated and
was then almost completely oxidized to the S=0 [4Fe-4S]2+ form.
300 320 340 360 380
Magnetic Field [mT]
2.21 2.14 2.09 2.03 1.98 1.93 1.88 1.83 1.79
g- Value
Figure 3.26: Upper trace: high-field spectrum of sulfite reductase from A. fulgidus. Lower trace:
simulation. EPR conditions: 15 mg ml-1 oxidized sulfite reductase in 100 mM potassium phosphate pH

Results 62
7.0, 5 % glycerol, under exclusion of dioxygen; microwave frequency, 9.38 GHz; microwave power,
0.6 mW; modulation amplitude, 1 mT; temperature, 10 K.
At low and medium magnetic field the EPR spectrum of oxidized sulfite reductase (Figure
3.27) was simulated as a sum of one species with S=9/2 and four species with S=5/2. In
comparison with the enzyme as isolated the signal of adventitiously bound Fe(III) was
reduced.
40 60 80 100 120 140 160 180
g- Value
Magnetic Field [mT]
15.0 11.3 9.07 7.57 6.49 5.68 5.06 4.55 4.14 3.80
30 40 50 60 70 80 90
A B
Magnetic Field [mT]
g- Value
18.0 15.0 12.9 11.3 10.1 9.07 8.25 7.57
Figure 3.27: A Upper trace: EPR spectrum of sulfite reductase from A. fulgidus. Lower trace:
simulation. B Upper trace: low-field spectrum of oxidized sulfite reductase. Lower trace: simulation.
EPR conditions: 15 mg ml-1 oxidized sulfite reductase in 100 mM potassium phosphate pH 7.0, 5 %
glycerol, under exclusion of dioxygen; microwave frequency, 9.38 GHz; microwave power, 2 mW;
modulation amplitude, 1 mT; temperature, 6 K.
The simulation of the low and mid field part of the spectrum resulted in a rather accurate fit.
The low-field part (Figure 3.28A) could be simulated with a single S=9/2 system with
E/D=0.153. The line at g=17.5 originated from the | ± 1/2 > doublet, the | ± 3/2 > doublet was
responsible for the line at g=9.7.
The dominating S=5/2 component (Figure 3.28B) was simulated with E/D=0.036. One might
have argued about the E/D value of this component in view of the offset of 27 mT between
the observed and simulated position of the absorption shaped line. It was not possible with
any E/D to get the absorption shaped as well as the derivative shaped line to coincide with the
measured data. Usually one would have claimed that this was due to deviations from the
weak-field first order perturbation approach as a result of small zero-field splitting. However,
the simulation program WEPR diagonalized the spin Hamiltonian of the S=5/2 system so this
couldn’t be the reason for the deviation. In addition, even with the low D between 2.4 and 4.9
(Table 3.8) the weak-field limit seemed appropriate. The reason for this deviation was most
likely mixing of the S=5/2 with other spin states (Burdinsky et al., 2001). This typical
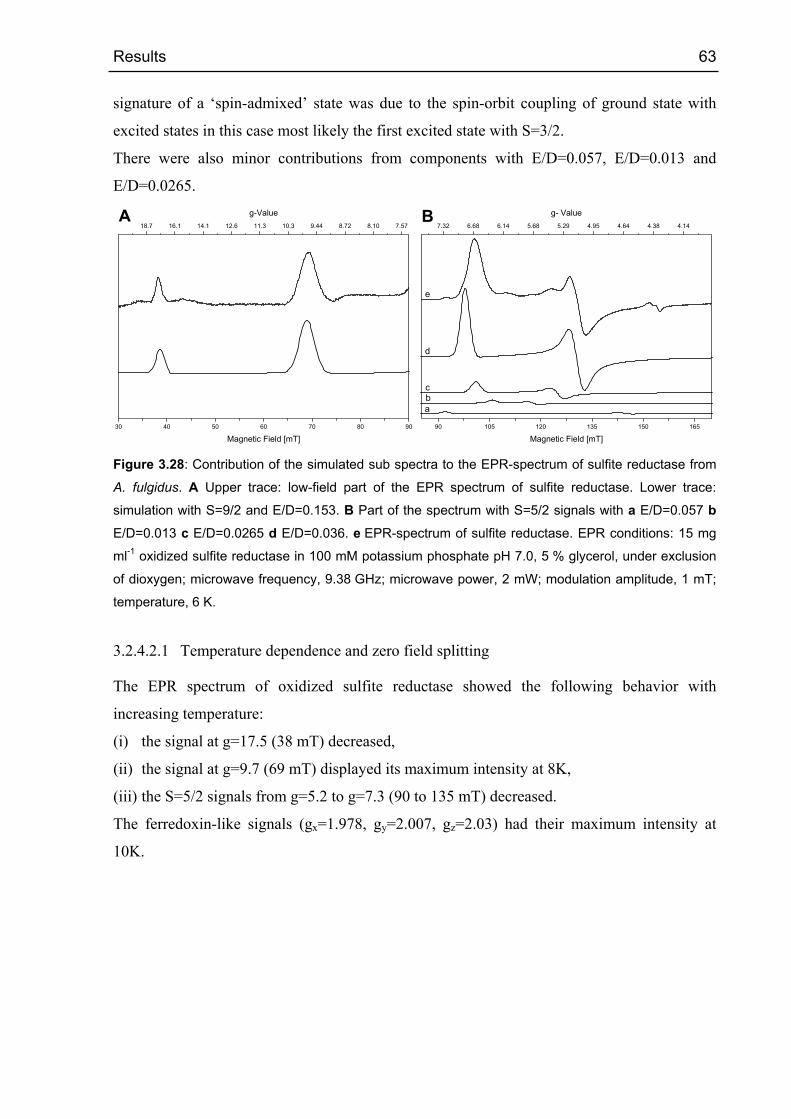
Results 63
signature of a ‘spin-admixed’ state was due to the spin-orbit coupling of ground state with
excited states in this case most likely the first excited state with S=3/2.
There were also minor contributions from components with E/D=0.057, E/D=0.013 and
E/D=0.0265.
30 40 50 60 70 80 90
Magnetic Field [mT]90 105 120 135 150 165
Magnetic Field [mT]
18.7 16.1 14.1 12.6 11.3 10.3 9.44 8.72 8.10 7.57A B
e
c
d
ba
g-Value7.32 6.68 6.14 5.68 5.29 4.95 4.64 4.38 4.14
g- Value
Figure 3.28: Contribution of the simulated sub spectra to the EPR-spectrum of sulfite reductase from
A. fulgidus. A Upper trace: low-field part of the EPR spectrum of sulfite reductase. Lower trace:
simulation with S=9/2 and E/D=0.153. B Part of the spectrum with S=5/2 signals with a E/D=0.057 b
E/D=0.013 c E/D=0.0265 d E/D=0.036. e EPR-spectrum of sulfite reductase. EPR conditions: 15 mg
ml-1 oxidized sulfite reductase in 100 mM potassium phosphate pH 7.0, 5 % glycerol, under exclusion
of dioxygen; microwave frequency, 9.38 GHz; microwave power, 2 mW; modulation amplitude, 1 mT;
temperature, 6 K.
3.2.4.2.1 Temperature dependence and zero field splitting
The EPR spectrum of oxidized sulfite reductase showed the following behavior with
increasing temperature:
(i) the signal at g=17.5 (38 mT) decreased,
(ii) the signal at g=9.7 (69 mT) displayed its maximum intensity at 8K,
(iii) the S=5/2 signals from g=5.2 to g=7.3 (90 to 135 mT) decreased.
The ferredoxin-like signals (gx=1.978, gy=2.007, gz=2.03) had their maximum intensity at
10K.
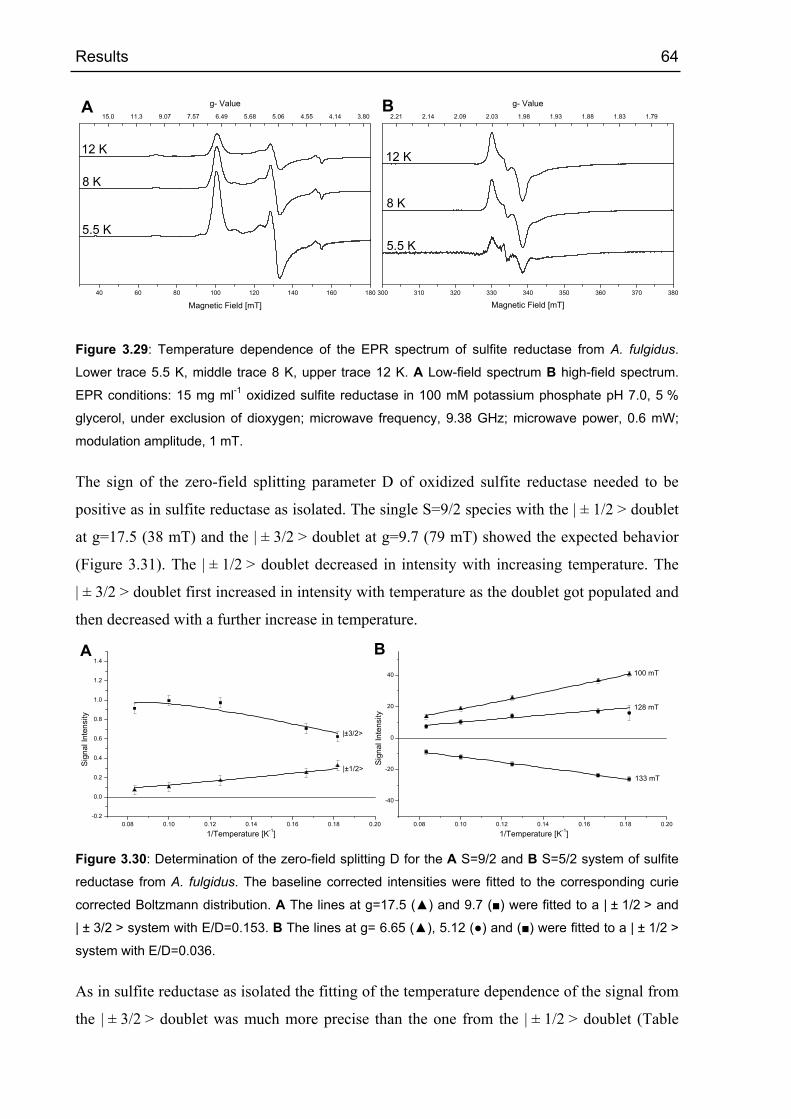
Results 64
40 60 80 100 120 140 160 180
A B
Magnetic Field [mT]
15.0 11.3 9.07 7.57 6.49 5.68 5.06 4.55 4.14 3.80
12 K
8 K
5.5 K
12 K
8 K
5.5 K
g- Value
300 310 320 330 340 350 360 370 380
Magnetic Field [mT]
2.21 2.14 2.09 2.03 1.98 1.93 1.88 1.83 1.79
g- Value
Figure 3.29: Temperature dependence of the EPR spectrum of sulfite reductase from A. fulgidus.
Lower trace 5.5 K, middle trace 8 K, upper trace 12 K. A Low-field spectrum B high-field spectrum.
EPR conditions: 15 mg ml-1 oxidized sulfite reductase in 100 mM potassium phosphate pH 7.0, 5 %
glycerol, under exclusion of dioxygen; microwave frequency, 9.38 GHz; microwave power, 0.6 mW;
modulation amplitude, 1 mT.
The sign of the zero-field splitting parameter D of oxidized sulfite reductase needed to be
positive as in sulfite reductase as isolated. The single S=9/2 species with the | ± 1/2 > doublet
at g=17.5 (38 mT) and the | ± 3/2 > doublet at g=9.7 (79 mT) showed the expected behavior
(Figure 3.31). The | ± 1/2 > doublet decreased in intensity with increasing temperature. The
| ± 3/2 > doublet first increased in intensity with temperature as the doublet got populated and
then decreased with a further increase in temperature.
0.08 0.10 0.12 0.14 0.16 0.18 0.20-0.2
0.0
0.2
0.4
0.6
0.8
1.0
1.2
1.4
|±3/2>
|±1/2>Sig
nal I
nten
sity
1/Temperature [K-1]0.08 0.10 0.12 0.14 0.16 0.18 0.20
-40
-20
0
20
40
BA100 mT
133 mT
128 mT
1/Temperature [K-1]
Sig
nal I
nten
sity
Figure 3.30: Determination of the zero-field splitting D for the A S=9/2 and B S=5/2 system of sulfite
reductase from A. fulgidus. The baseline corrected intensities were fitted to the corresponding curie
corrected Boltzmann distribution. A The lines at g=17.5 (▲) and 9.7 (■) were fitted to a | ± 1/2 > and
| ± 3/2 > system with E/D=0.153. B The lines at g= 6.65 (▲), 5.12 (●) and (■) were fitted to a | ± 1/2 >
system with E/D=0.036.
As in sulfite reductase as isolated the fitting of the temperature dependence of the signal from
the | ± 3/2 > doublet was much more precise than the one from the | ± 1/2 > doublet (Table

Results 65
3.8). The value of 4.1 ± 0.4 was in agreement with the value for sulfite reductase as isolated.
In the case of oxidized sulfite reductase it was also possible to determine the zero field
splitting of the S=5/2 system. This was due to the fact of the reduced number of components
contributing to the EPR spectrum. The value of around 3.5 was rather low for a siroheme
(Pierik & Hagen, 1991). Spin g-Value E/D Doublet χ2 D ±D
9/2 17.5 0.153 1/2 0.00062 1.0 12.4
9/2 9.7 0.153 3/2 0.00438 4.1 0.4
5/2 6.65 0.036 1/2 0.364 3.4 1.0
5/2 5.12 0.036 1/2 1.18 10.1 7.8
5/2 5.12 0.036 1/2 0.242 3.8 1.1
Table 3.8: Zero-field splitting parameters of oxidized sulfite reductase from A. fulgidus. The Error in D
does not include the experimental error.
The temperature dependence of the EPR spectrum for the S=9/2 system was simulated using
the parameters in Table 3.9.
For the S=9/2 system both the lines from the | ± 1/2 > and the | ± 3/2 > doublet were observed.
The zero-field splitting influenced their relative intensity. In addition these lines were
observed at different temperatures. The temperature behavior was also dependent on the zero-
field splitting. The value of D from depopulation (Table 3.8) did not reflect the correct
relative intensities for the | ± 1/2 > and the | ± 3/2 > doublet. The simulation calculated the
correct transition probabilities for the | ± 1/2 > and the | ± 3/2 > doublet. Therefore a D value
was used that fitted best with the relative intensities for the | ± 1/2 > and the | ± 3/2 > doublet.
It had to be noted that it was difficult to simulate the temperature dependence as the simulated
spectra (Figure 3.31) were normalized with respect to the total second integral. This integral
could be treated as a Curie system. In order to determine its value at various temperatures its
value at 0 K had to be known. With the used cryostat it was only possible to go as low as
4.5 K. On the other hand the EPR spectrum of the S=9/2 system (Figure 3.31 traces a-e) was
highly temperature dependent. Small deviations from the selected temperature resulted in
large deviations from the expected intensity and even larger deviations from the correct zero-
field splitting.
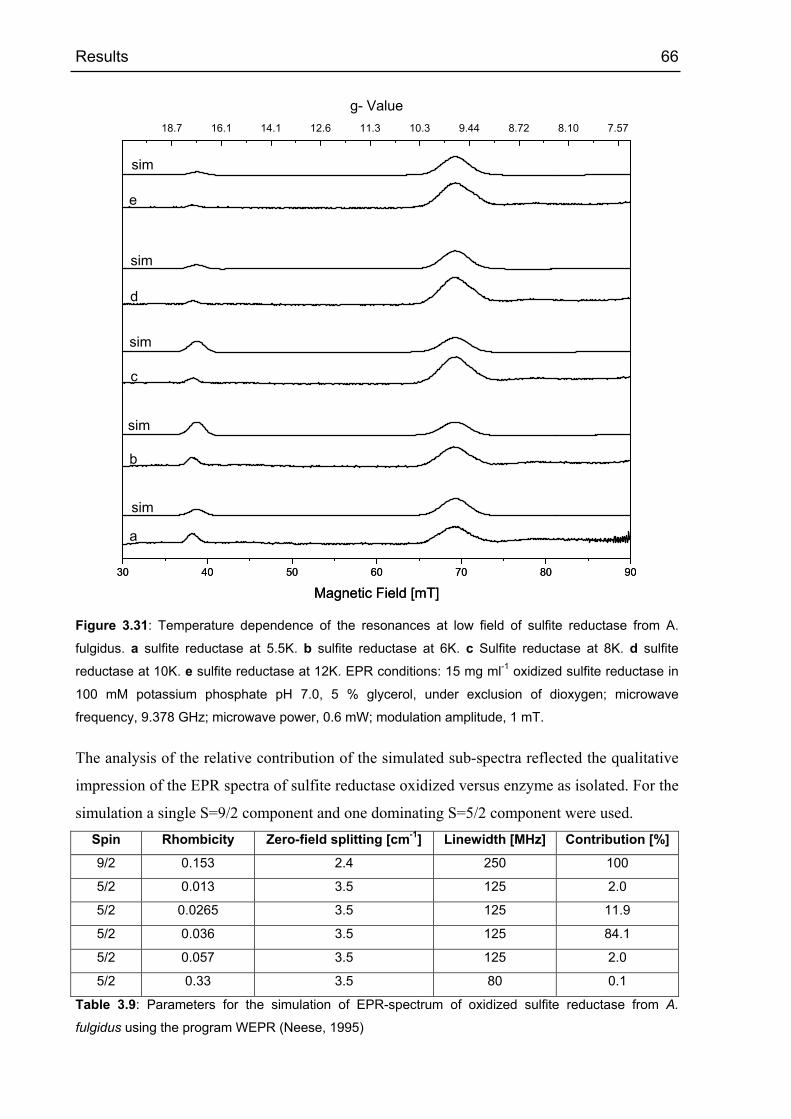
Results 66
30 40 50 60 70 80 90
sim
sim
sim
sim
sim
e
d
c
b
a
Magnetic Field [mT]30 40 50 60 70 80 90
Magnetic Field [mT]
18.7 16.1 14.1 12.6 11.3 10.3 9.44 8.72 8.10 7.57
g- Value
Figure 3.31: Temperature dependence of the resonances at low field of sulfite reductase from A.
fulgidus. a sulfite reductase at 5.5K. b sulfite reductase at 6K. c Sulfite reductase at 8K. d sulfite
reductase at 10K. e sulfite reductase at 12K. EPR conditions: 15 mg ml-1 oxidized sulfite reductase in
100 mM potassium phosphate pH 7.0, 5 % glycerol, under exclusion of dioxygen; microwave
frequency, 9.378 GHz; microwave power, 0.6 mW; modulation amplitude, 1 mT.
The analysis of the relative contribution of the simulated sub-spectra reflected the qualitative
impression of the EPR spectra of sulfite reductase oxidized versus enzyme as isolated. For the
simulation a single S=9/2 component and one dominating S=5/2 component were used. Spin Rhombicity Zero-field splitting [cm-1] Linewidth [MHz] Contribution [%]
9/2 0.153 2.4 250 100
5/2 0.013 3.5 125 2.0
5/2 0.0265 3.5 125 11.9
5/2 0.036 3.5 125 84.1
5/2 0.057 3.5 125 2.0
5/2 0.33 3.5 80 0.1
Table 3.9: Parameters for the simulation of EPR-spectrum of oxidized sulfite reductase from A.
fulgidus using the program WEPR (Neese, 1995)
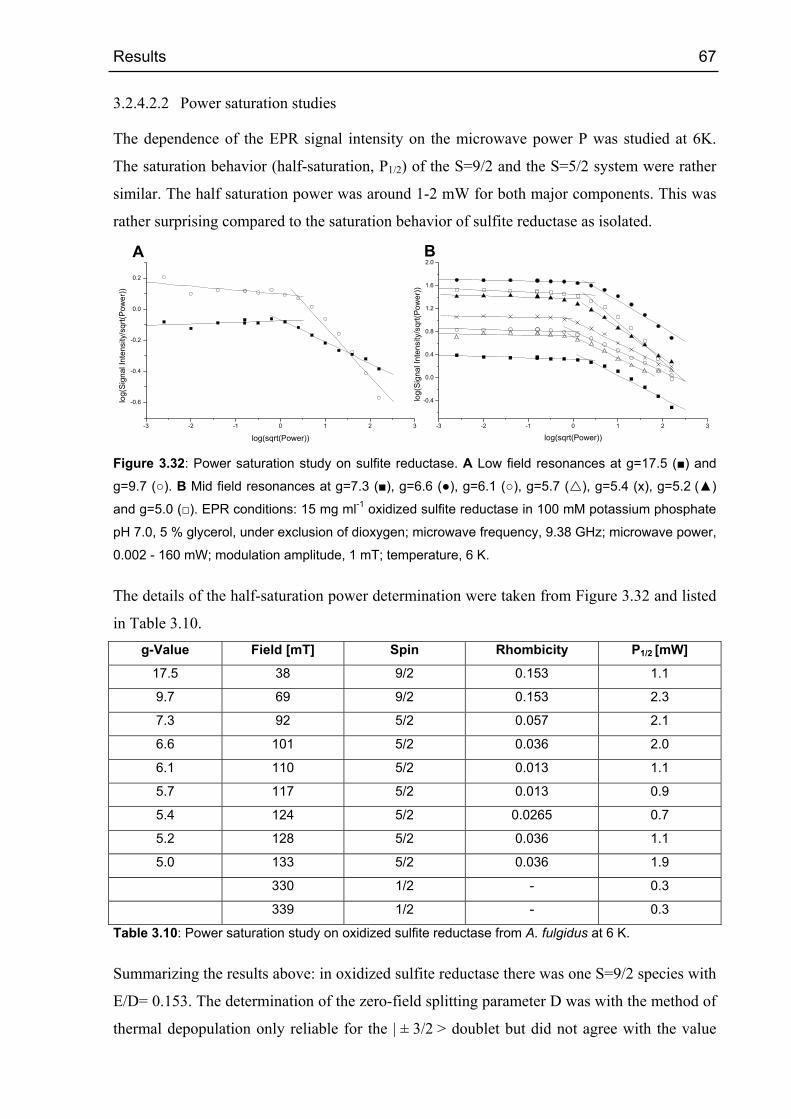
Results 67
3.2.4.2.2 Power saturation studies
The dependence of the EPR signal intensity on the microwave power P was studied at 6K.
The saturation behavior (half-saturation, P1/2) of the S=9/2 and the S=5/2 system were rather
similar. The half saturation power was around 1-2 mW for both major components. This was
rather surprising compared to the saturation behavior of sulfite reductase as isolated.
-3 -2 -1 0 1 2 3
-0.6
-0.4
-0.2
0.0
0.2
A B
log(
Sig
nal I
nten
sity
/sqr
t(Pow
er))
log(
Sig
nal I
nten
sity
/sqr
t(Pow
er))
log(sqrt(Power))-3 -2 -1 0 1 2 3
-0.4
0.0
0.4
0.8
1.2
1.6
2.0
log(sqrt(Power)) Figure 3.32: Power saturation study on sulfite reductase. A Low field resonances at g=17.5 (■) and
g=9.7 (○). B Mid field resonances at g=7.3 (■), g=6.6 (●), g=6.1 (○), g=5.7 ( ), g=5.4 (x), g=5.2 (▲)
and g=5.0 (□). EPR conditions: 15 mg ml-1 oxidized sulfite reductase in 100 mM potassium phosphate
pH 7.0, 5 % glycerol, under exclusion of dioxygen; microwave frequency, 9.38 GHz; microwave power,
0.002 - 160 mW; modulation amplitude, 1 mT; temperature, 6 K.
The details of the half-saturation power determination were taken from Figure 3.32 and listed
in Table 3.10. g-Value Field [mT] Spin Rhombicity P1/2 [mW]
17.5 38 9/2 0.153 1.1
9.7 69 9/2 0.153 2.3
7.3 92 5/2 0.057 2.1
6.6 101 5/2 0.036 2.0
6.1 110 5/2 0.013 1.1
5.7 117 5/2 0.013 0.9
5.4 124 5/2 0.0265 0.7
5.2 128 5/2 0.036 1.1
5.0 133 5/2 0.036 1.9
330 1/2 - 0.3
339 1/2 - 0.3
Table 3.10: Power saturation study on oxidized sulfite reductase from A. fulgidus at 6 K.
Summarizing the results above: in oxidized sulfite reductase there was one S=9/2 species with
E/D= 0.153. The determination of the zero-field splitting parameter D was with the method of
thermal depopulation only reliable for the | ± 3/2 > doublet but did not agree with the value
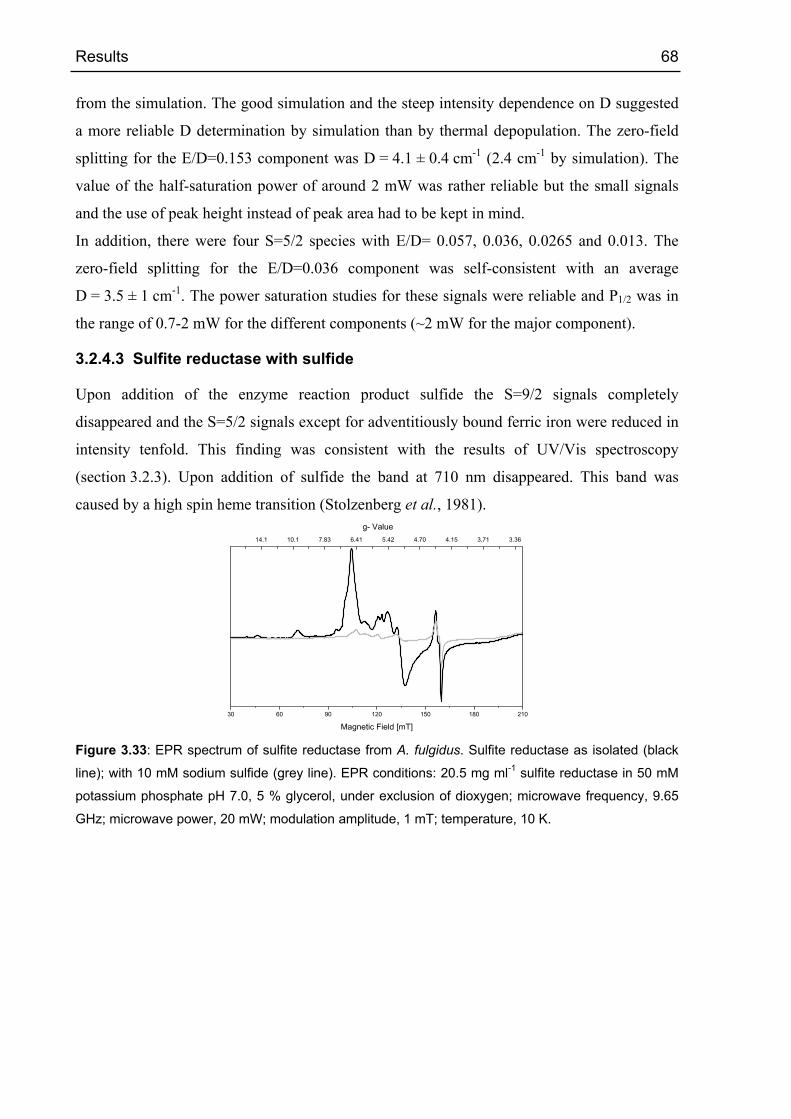
Results 68
from the simulation. The good simulation and the steep intensity dependence on D suggested
a more reliable D determination by simulation than by thermal depopulation. The zero-field
splitting for the E/D=0.153 component was D = 4.1 ± 0.4 cm-1 (2.4 cm-1 by simulation). The
value of the half-saturation power of around 2 mW was rather reliable but the small signals
and the use of peak height instead of peak area had to be kept in mind.
In addition, there were four S=5/2 species with E/D= 0.057, 0.036, 0.0265 and 0.013. The
zero-field splitting for the E/D=0.036 component was self-consistent with an average
D = 3.5 ± 1 cm-1. The power saturation studies for these signals were reliable and P1/2 was in
the range of 0.7-2 mW for the different components (~2 mW for the major component).
3.2.4.3 Sulfite reductase with sulfide
Upon addition of the enzyme reaction product sulfide the S=9/2 signals completely
disappeared and the S=5/2 signals except for adventitiously bound ferric iron were reduced in
intensity tenfold. This finding was consistent with the results of UV/Vis spectroscopy
(section 3.2.3). Upon addition of sulfide the band at 710 nm disappeared. This band was
caused by a high spin heme transition (Stolzenberg et al., 1981).
30 60 90 120 150 180 210
Magnetic Field [mT]
14.1 10.1 7.83 6.41 5.42 4.70 4.15 3.71 3.36
g- Value
Figure 3.33: EPR spectrum of sulfite reductase from A. fulgidus. Sulfite reductase as isolated (black
line); with 10 mM sodium sulfide (grey line). EPR conditions: 20.5 mg ml-1 sulfite reductase in 50 mM
potassium phosphate pH 7.0, 5 % glycerol, under exclusion of dioxygen; microwave frequency, 9.65
GHz; microwave power, 20 mW; modulation amplitude, 1 mT; temperature, 10 K.

Results 69
3.2.5 Crystallization and diffraction analysis
Figure 3.34: Crystals of sulfite reductase from Archaeoglobus fulgidus. The dimensions of these
brown crystals were 0.05 x 0.4 x 0.7 mm.
The crystallization of the functionally intact enzyme was performed under anaerobic
conditions at a temperature of 291 K. Green to brown (depending on the thickness) colored
plate shaped crystals with dimensions of 0.05 x 0.4 x 0.7 mm appeared within 5-7 d (Figure
3.34). The crystals belonged to the space group P21, with unit-cell parameters a= 94.8,
b= 69.4, c= 148.3 Å and β= 106.9°. The packing density VM of 2.6 A3 Da-1 was compatible
with two heterodimers per asymmetric unit. The derived solvent content was calculated to be
53 %, which was in the range for water-soluble proteins (Matthews, 1968). The crystals
diffracted to beyond 2.5 Å resolution.
3.2.5.1 Data collection
A native MAD data set has been collected at ID29 in Grenoble to 2.2 Å resolution for the
remote wavelength of 1.39 Å. This rather unusual wavelength was chosen to maximize beam
intensity and on the other hand to enable an SAD approach with f’’=2.7 (peak f’’=4.0).
554943 reflections were measured and reduced to 179004 unique reflections, which
corresponds to a completeness of 99.0 % in the resolution range 40.0 - 2.2 Å. The Rsym value
was determined to be 13.0 % in this range (Table 3.11).
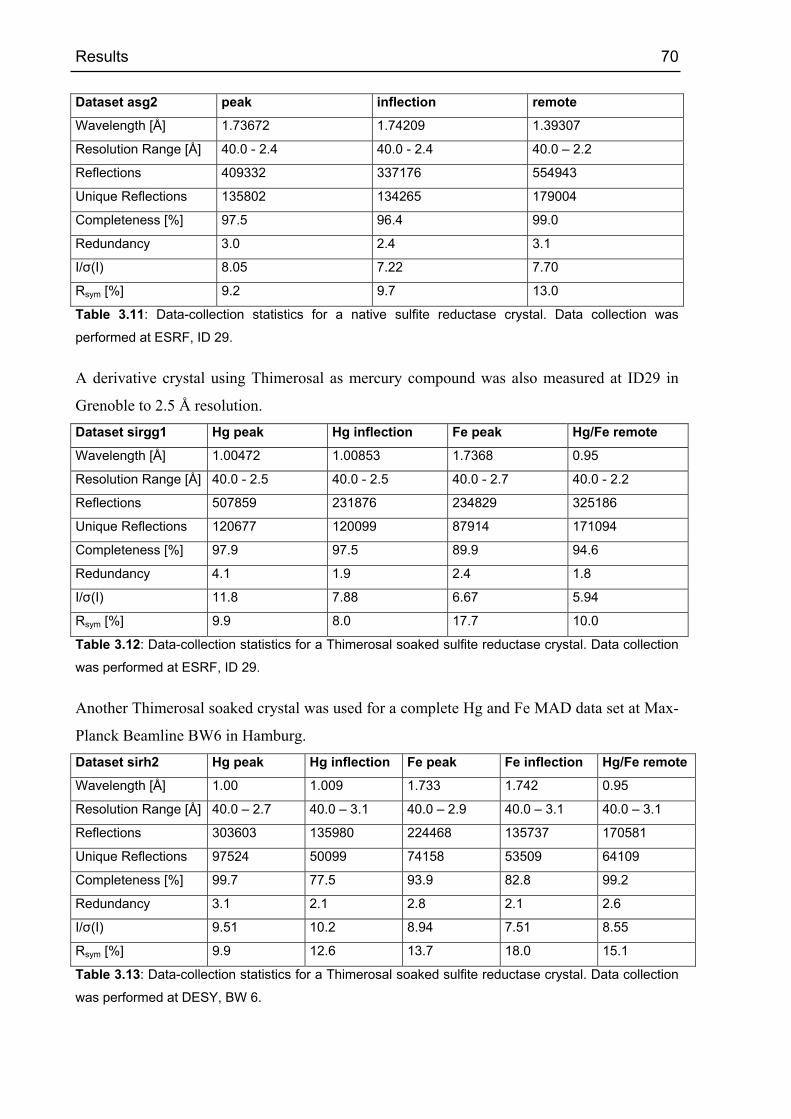
Results 70
Dataset asg2 peak inflection remote
Wavelength [Å] 1.73672 1.74209 1.39307
Resolution Range [Å] 40.0 - 2.4 40.0 - 2.4 40.0 – 2.2
Reflections 409332 337176 554943
Unique Reflections 135802 134265 179004
Completeness [%] 97.5 96.4 99.0
Redundancy 3.0 2.4 3.1
I/σ(I) 8.05 7.22 7.70
Rsym [%] 9.2 9.7 13.0
Table 3.11: Data-collection statistics for a native sulfite reductase crystal. Data collection was
performed at ESRF, ID 29.
A derivative crystal using Thimerosal as mercury compound was also measured at ID29 in
Grenoble to 2.5 Å resolution. Dataset sirgg1 Hg peak Hg inflection Fe peak Hg/Fe remote
Wavelength [Å] 1.00472 1.00853 1.7368 0.95
Resolution Range [Å] 40.0 - 2.5 40.0 - 2.5 40.0 - 2.7 40.0 - 2.2
Reflections 507859 231876 234829 325186
Unique Reflections 120677 120099 87914 171094
Completeness [%] 97.9 97.5 89.9 94.6
Redundancy 4.1 1.9 2.4 1.8
I/σ(I) 11.8 7.88 6.67 5.94
Rsym [%] 9.9 8.0 17.7 10.0
Table 3.12: Data-collection statistics for a Thimerosal soaked sulfite reductase crystal. Data collection
was performed at ESRF, ID 29.
Another Thimerosal soaked crystal was used for a complete Hg and Fe MAD data set at Max-
Planck Beamline BW6 in Hamburg. Dataset sirh2 Hg peak Hg inflection Fe peak Fe inflection Hg/Fe remote
Wavelength [Å] 1.00 1.009 1.733 1.742 0.95
Resolution Range [Å] 40.0 – 2.7 40.0 – 3.1 40.0 – 2.9 40.0 – 3.1 40.0 – 3.1
Reflections 303603 135980 224468 135737 170581
Unique Reflections 97524 50099 74158 53509 64109
Completeness [%] 99.7 77.5 93.9 82.8 99.2
Redundancy 3.1 2.1 2.8 2.1 2.6
I/σ(I) 9.51 10.2 8.94 7.51 8.55
Rsym [%] 9.9 12.6 13.7 18.0 15.1
Table 3.13: Data-collection statistics for a Thimerosal soaked sulfite reductase crystal. Data collection
was performed at DESY, BW 6.

Results 71
3.2.5.2 Structure determination
3.2.5.2.1 Location of the iron positions
Direct Methods for solution of the phase problem could be used for the determination of the
heavy atom substructure of metalloproteins and heavy atom derivatives.
For the determination of the 26 iron positions comprising of 6 [4Fe-4S] clusters and 2 heme
irons SHELXD (Schneider & Sheldrick, 2002) was used. XPREP (Bruker-AXS) was used to
prepare the data for multiple-wavelength anomalous dispersion (MAD) and single-wavelength
anomalous dispersion (SAD) analysis.
As the sulfite reductase crystals only diffracted to 2.5 – 3.0 Å resolution the anomalous
scattering information in the data sets only extended to 4.0 – 5.0 Å. Therefore it was not
possible to detect the individual irons of the iron-sulfur clusters. Resolution [Å] 8.0 6.0 5.8 5.6 5.4 5.2 5.0 4.8 4.6 4.4 4.2 4.0
Fe peak 4.46 2.51 1.90 2.00 1.81 1.76 1.62 1.53 1.38 1.31 1.29 1.26
Fe inflection 3.33 1.74 1.49 1.40 1.32 1.27 1.27 1.19 1.26 1.18 1.16 1.14
Hg peak 2.10 1.60 1.52 1.39 1.32 1.37 1.29 1.26 1.16 1.18 1.15 1.13
Hg inflection 2.47 1.62 1.42 1.36 1.32 1.27 1.26 1.17 1.20 1.18 1.08 1.09
Hg/Fe remote 1.92 1.37 1.21 1.28 1.12 1.11 1.17 1.19 1.03 0.99 1.04 1.07
Table 3.14: Anomalous signal to noise ratio in the dataset sirh2. Calculated with XPREP
The search of the six [4Fe-4S] clusters and two heme irons performed with SHELXD was
successful for data sets asg2, sirgg1 and sirh2 when using the anomalous signal of the Fepeak
or of combined data comprising Fepeak, Feinfection and Feremote of the sirh2 dataset. The
correlation coefficients were 22.55 for all and 15.18 for weak reflections. Site x y z Occupancy
1 0.668495 0.096817 0.114579 1.0000
2 0.537224 0.498894 0.383599 0.7720
3 0.560097 0.109734 0.176957 0.7598
4 0.475052 0.437408 0.271546 0.7262
5 0.685188 0.094437 0.143494 0.6795
6 0.552559 0.417572 0.394921 0.5557
7 0.941483 0.520172 0.242089 0.4199
8 0.944405 0.308723 0.436433 0.3867
Table 3.15: Iron positions of sulfite reductase in fractional coordinates

Results 72
3.2.5.2.2 Location of the mercury positions
The positions of the mercury atoms were also located with SHELXD (Schneider & Sheldrick,
2002) using the dataset sirh2 Hgpeak for calculation. The corresponding correlation
coefficients were 16.98 and 8.88 for this SAD dataset. Site x y z Occupancy
1 0.973465 0.155876 0.471426 1.0000
2 1.447601 0.135239 0.433088 0.6394
3 1.044518 -0.061691 0.387175 0.6245
4 0.974831 -0.000923 0.270750 0.6193
5 0.940132 -0.325768 0.026106 0.6124
6 0.969055 0.113777 0.436216 0.5337
Table 3.16 Mercury positions of sulfite reductase (sirh2 dataset) in fractional coordinates
This indicated the presence of 6 mercury atoms in the Thimerosal soaked crystal of sulfite
reductase. However, the heavy atom refinement in SHARP (La Fortelle & Bricogne, 1997)
revealed that there were only two significant sites.
3.2.5.3 Phase calculations
The positions of the 6 [4Fe-4S] clusters and 2 heme irons were used in SHARP (La Fortelle &
Bricogne, 1997) to calculate phases and the electron density map. In the first step the [4Fe-4S]
clusters were modeled as a single iron atom with four-fold occupancy and high anisotropic
temperature factor. The resulting electron density was not good enough for building a protein
model.
The most important improvement was the use of spherically averaged clusters as implemented
in SHARP. Instead of a single atom with high temperature factor the relative positions of the
irons of a typical [4Fe-4S] cluster were used to calculate the structure factor of the cluster.
Due to the unknown orientation of the cluster the structure factor was spherically averaged
and used for phase calculation. The resulting electron density allowed the modeling of all 26
individual iron positions using O (Jones et al., 1998) with the help of a model of an iron sulfur
cluster. The model of the assimilatory sulfite reductase from E. coli helped to find the
individual positions of the cluster next to the heme iron. The cluster coordinates were added
one by one into MLPHARE (Collaborative Computational Project No. 4 1994) and refined
against the Fepeak dataset. The refined positions were then transferred into SHARP (La
Fortelle & Bricogne, 1997) and the procedure was repeated. Finally the datasets at the other
wavelengths were added. Finally, an electron density map was calculated in which, after
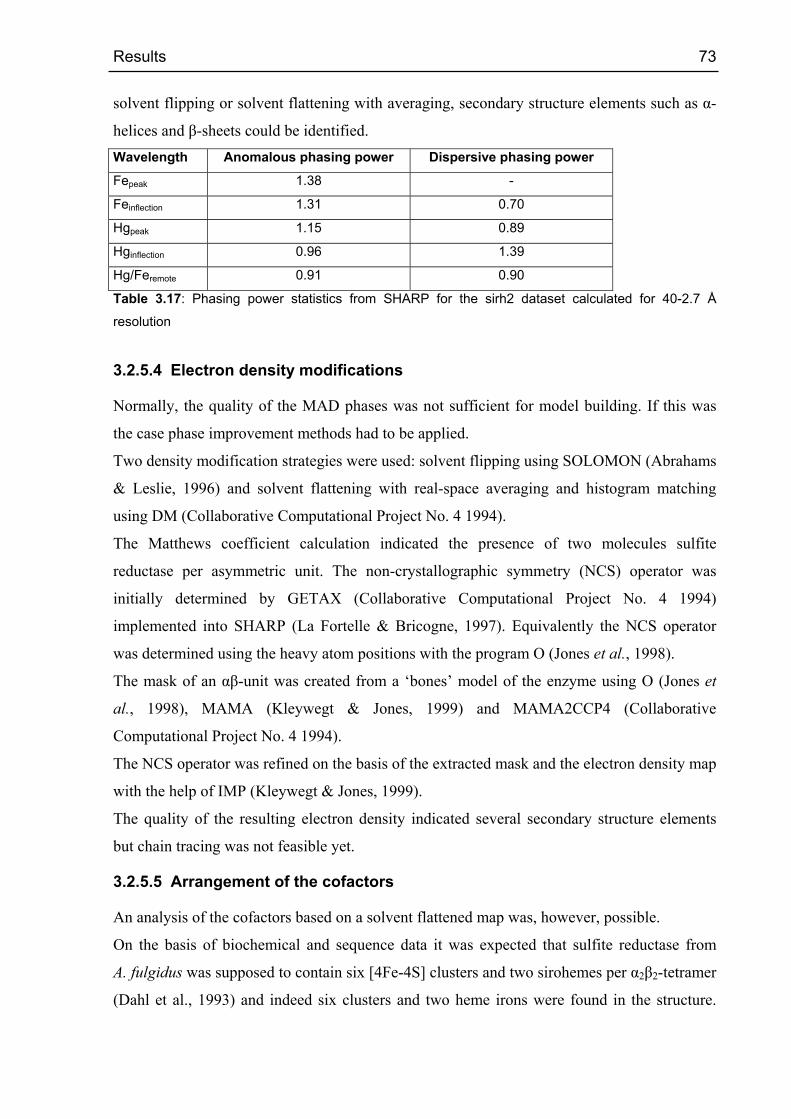
Results 73
solvent flipping or solvent flattening with averaging, secondary structure elements such as α-
helices and β-sheets could be identified. Wavelength Anomalous phasing power Dispersive phasing power
Fepeak 1.38 -
Feinflection 1.31 0.70
Hgpeak 1.15 0.89
Hginflection 0.96 1.39
Hg/Feremote 0.91 0.90
Table 3.17: Phasing power statistics from SHARP for the sirh2 dataset calculated for 40-2.7 Å
resolution
3.2.5.4 Electron density modifications
Normally, the quality of the MAD phases was not sufficient for model building. If this was
the case phase improvement methods had to be applied.
Two density modification strategies were used: solvent flipping using SOLOMON (Abrahams
& Leslie, 1996) and solvent flattening with real-space averaging and histogram matching
using DM (Collaborative Computational Project No. 4 1994).
The Matthews coefficient calculation indicated the presence of two molecules sulfite
reductase per asymmetric unit. The non-crystallographic symmetry (NCS) operator was
initially determined by GETAX (Collaborative Computational Project No. 4 1994)
implemented into SHARP (La Fortelle & Bricogne, 1997). Equivalently the NCS operator
was determined using the heavy atom positions with the program O (Jones et al., 1998).
The mask of an αβ-unit was created from a ‘bones’ model of the enzyme using O (Jones et
al., 1998), MAMA (Kleywegt & Jones, 1999) and MAMA2CCP4 (Collaborative
Computational Project No. 4 1994).
The NCS operator was refined on the basis of the extracted mask and the electron density map
with the help of IMP (Kleywegt & Jones, 1999).
The quality of the resulting electron density indicated several secondary structure elements
but chain tracing was not feasible yet.
3.2.5.5 Arrangement of the cofactors
An analysis of the cofactors based on a solvent flattened map was, however, possible.
On the basis of biochemical and sequence data it was expected that sulfite reductase from
A. fulgidus was supposed to contain six [4Fe-4S] clusters and two sirohemes per α2β2-tetramer
(Dahl et al., 1993) and indeed six clusters and two heme irons were found in the structure.
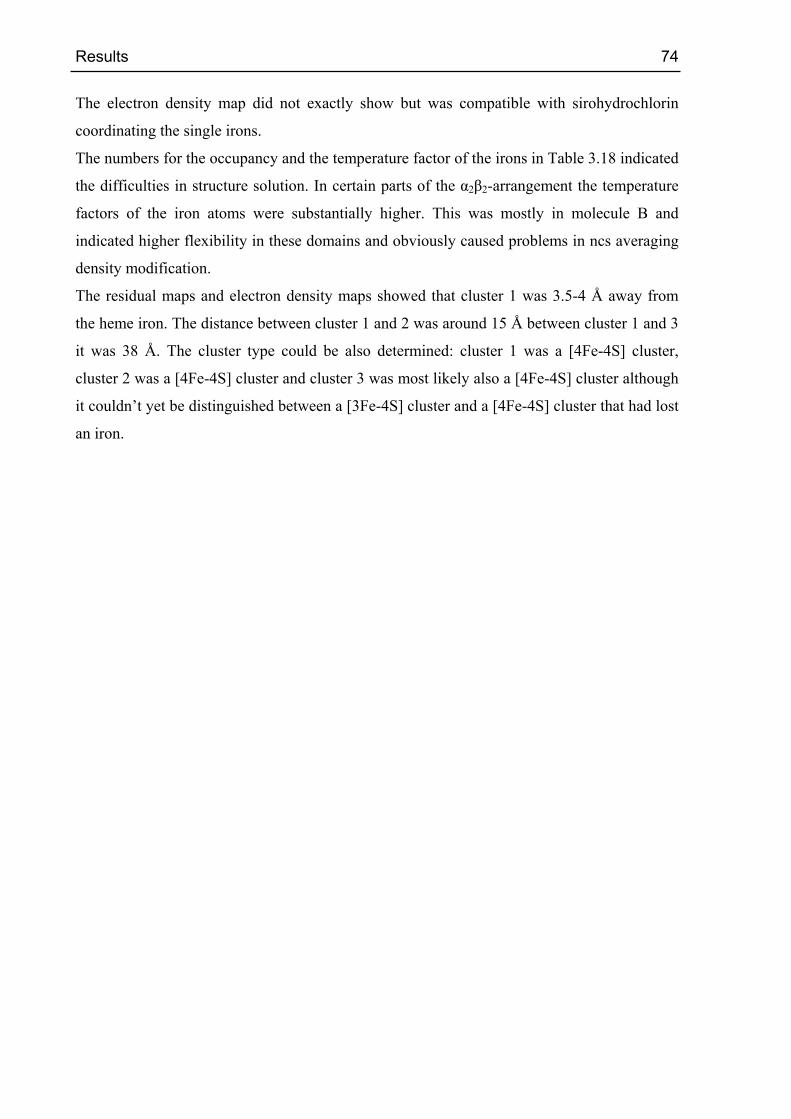
Results 74
The electron density map did not exactly show but was compatible with sirohydrochlorin
coordinating the single irons.
The numbers for the occupancy and the temperature factor of the irons in Table 3.18 indicated
the difficulties in structure solution. In certain parts of the α2β2-arrangement the temperature
factors of the iron atoms were substantially higher. This was mostly in molecule B and
indicated higher flexibility in these domains and obviously caused problems in ncs averaging
density modification.
The residual maps and electron density maps showed that cluster 1 was 3.5-4 Å away from
the heme iron. The distance between cluster 1 and 2 was around 15 Å between cluster 1 and 3
it was 38 Å. The cluster type could be also determined: cluster 1 was a [4Fe-4S] cluster,
cluster 2 was a [4Fe-4S] cluster and cluster 3 was most likely also a [4Fe-4S] cluster although
it couldn’t yet be distinguished between a [3Fe-4S] cluster and a [4Fe-4S] cluster that had lost
an iron.
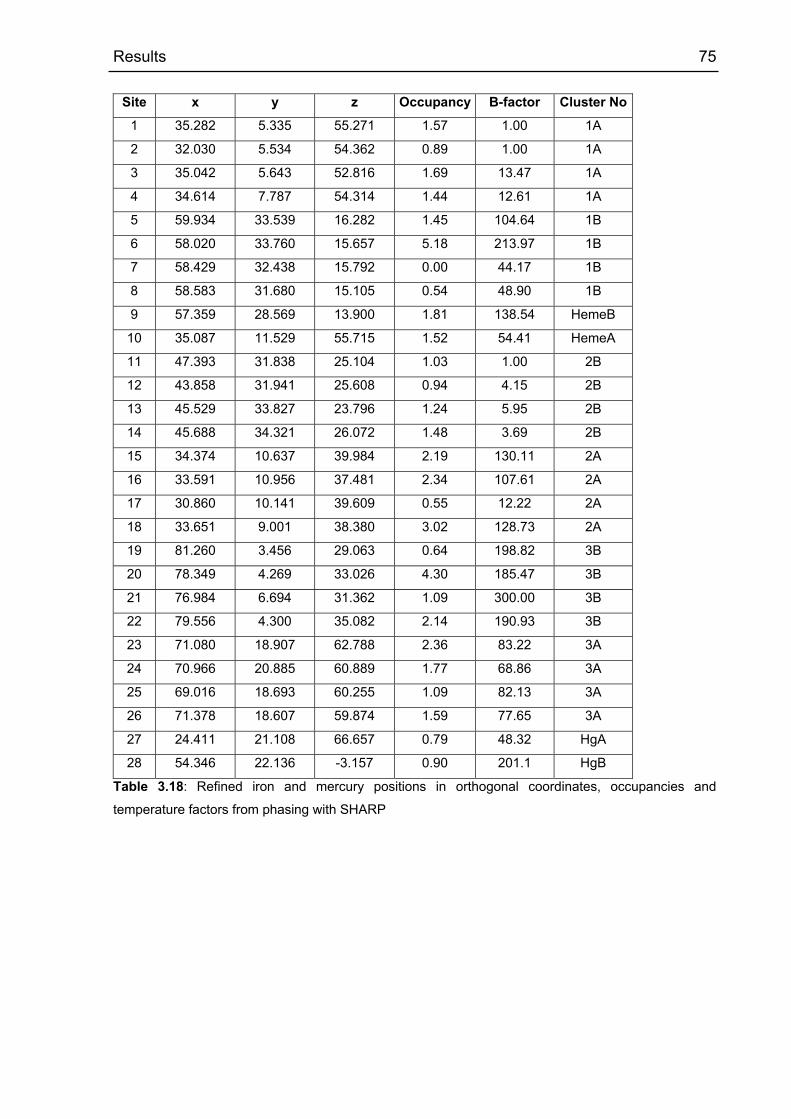
Results 75
Site x y z Occupancy B-factor Cluster No
1 35.282 5.335 55.271 1.57 1.00 1A
2 32.030 5.534 54.362 0.89 1.00 1A
3 35.042 5.643 52.816 1.69 13.47 1A
4 34.614 7.787 54.314 1.44 12.61 1A
5 59.934 33.539 16.282 1.45 104.64 1B
6 58.020 33.760 15.657 5.18 213.97 1B
7 58.429 32.438 15.792 0.00 44.17 1B
8 58.583 31.680 15.105 0.54 48.90 1B
9 57.359 28.569 13.900 1.81 138.54 HemeB
10 35.087 11.529 55.715 1.52 54.41 HemeA
11 47.393 31.838 25.104 1.03 1.00 2B
12 43.858 31.941 25.608 0.94 4.15 2B
13 45.529 33.827 23.796 1.24 5.95 2B
14 45.688 34.321 26.072 1.48 3.69 2B
15 34.374 10.637 39.984 2.19 130.11 2A
16 33.591 10.956 37.481 2.34 107.61 2A
17 30.860 10.141 39.609 0.55 12.22 2A
18 33.651 9.001 38.380 3.02 128.73 2A
19 81.260 3.456 29.063 0.64 198.82 3B
20 78.349 4.269 33.026 4.30 185.47 3B
21 76.984 6.694 31.362 1.09 300.00 3B
22 79.556 4.300 35.082 2.14 190.93 3B
23 71.080 18.907 62.788 2.36 83.22 3A
24 70.966 20.885 60.889 1.77 68.86 3A
25 69.016 18.693 60.255 1.09 82.13 3A
26 71.378 18.607 59.874 1.59 77.65 3A
27 24.411 21.108 66.657 0.79 48.32 HgA
28 54.346 22.136 -3.157 0.90 201.1 HgB
Table 3.18: Refined iron and mercury positions in orthogonal coordinates, occupancies and
temperature factors from phasing with SHARP

Discussion 77
4 Discussion
4.1 APS reductase from Archaeoglobus fulgidus
4.1.1 Comparison with structurally related flavin containing enzymes
4.1.1.1 Comparison of the α-subunit fold of APS reductase with the flavoprotein subunit of fumarate reductase
The sequences of APS reductase and the other members of the succinate dehydrogenase
family had a sequence identity of 23–25 % and a sequence similarity of 37–40 %.
Surprisingly, the sequence of iron(III)–induced flavocytochrome c3 from Shewanella
frigidimarina was the most closely related to APS reductase whereas tetraheme
flavocytochrome c3 from S. frigidimarina showed no significant sequence similarity.
Interestingly, despite the high structural relationship there was no recognition motif in the
primary structure of this family. A glycine about 5 Å apart from FAD was the only residue
conserved in all members of the family (Figure 4.1).

Discussion 78
Figure 4.1: Sequence alignment for the FAD-binding domain of members of the fumarate reductase
family (1JNR, APS reductase from A. fulgidus; 1QO8, iron–induced flavocytochrome c3 from S.
frigidimarina; 1QLA, fumarate reductase from W. succinogenes; 1CHU, aspartate oxidase from E. coli;
1L0V, fumarate reductase from E. coli; 1QJD, flavocytochrome c3 from S. frigidimarina).
Structural alignments of the α-subunit of APS reductase with several members of the fumarate
reductase family revealed a highly similar fold for the FAD binding domain (Figure 4.2). The
structure and the orientation of the helical domain were well conserved between the fumarate
reductases, aspartate oxidase and APS reductase.
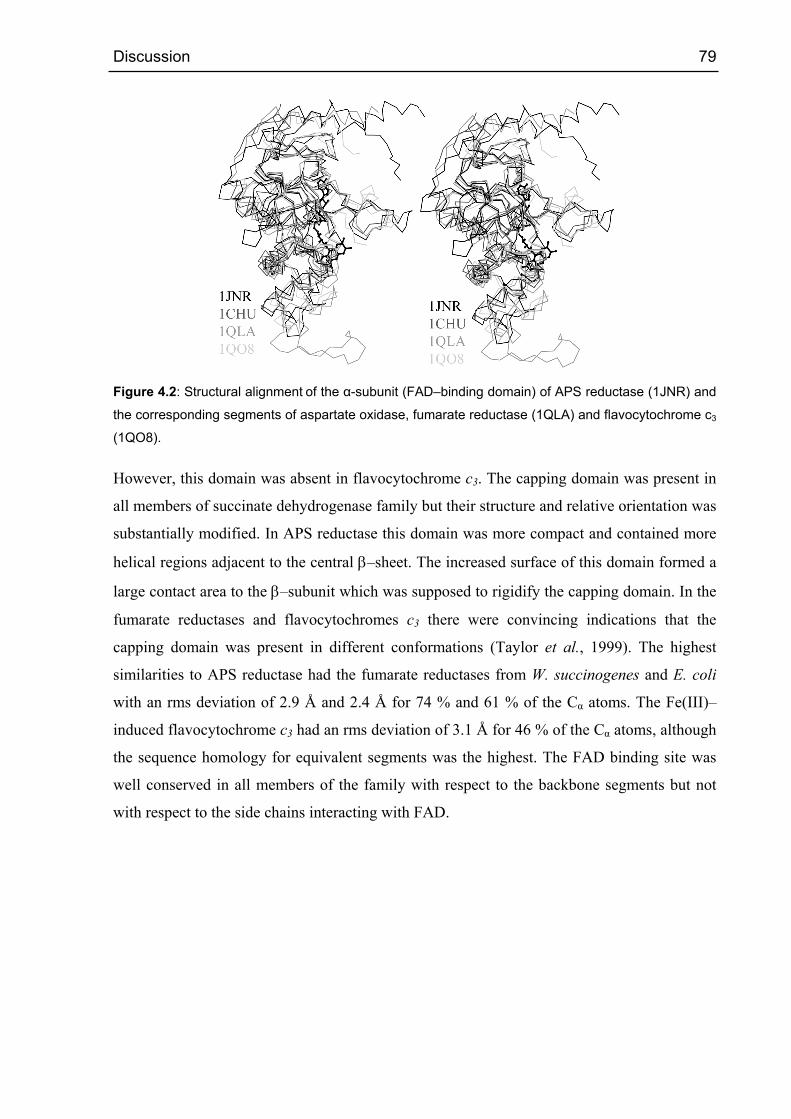
Discussion 79
Figure 4.2: Structural alignment of the α-subunit (FAD–binding domain) of APS reductase (1JNR) and
the corresponding segments of aspartate oxidase, fumarate reductase (1QLA) and flavocytochrome c3
(1QO8).
However, this domain was absent in flavocytochrome c3. The capping domain was present in
all members of succinate dehydrogenase family but their structure and relative orientation was
substantially modified. In APS reductase this domain was more compact and contained more
helical regions adjacent to the central β–sheet. The increased surface of this domain formed a
large contact area to the β–subunit which was supposed to rigidify the capping domain. In the
fumarate reductases and flavocytochromes c3 there were convincing indications that the
capping domain was present in different conformations (Taylor et al., 1999). The highest
similarities to APS reductase had the fumarate reductases from W. succinogenes and E. coli
with an rms deviation of 2.9 Å and 2.4 Å for 74 % and 61 % of the Cα atoms. The Fe(III)–
induced flavocytochrome c3 had an rms deviation of 3.1 Å for 46 % of the Cα atoms, although
the sequence homology for equivalent segments was the highest. The FAD binding site was
well conserved in all members of the family with respect to the backbone segments but not
with respect to the side chains interacting with FAD.
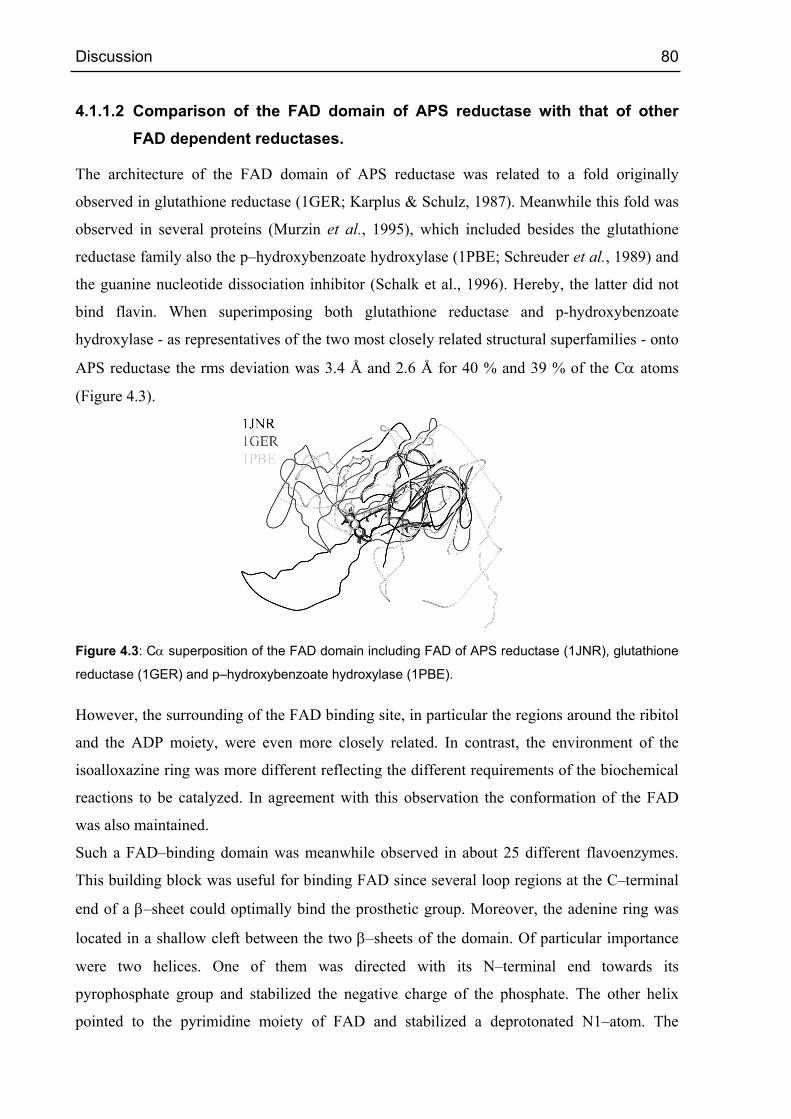
Discussion 80
4.1.1.2 Comparison of the FAD domain of APS reductase with that of other FAD dependent reductases.
The architecture of the FAD domain of APS reductase was related to a fold originally
observed in glutathione reductase (1GER; Karplus & Schulz, 1987). Meanwhile this fold was
observed in several proteins (Murzin et al., 1995), which included besides the glutathione
reductase family also the p–hydroxybenzoate hydroxylase (1PBE; Schreuder et al., 1989) and
the guanine nucleotide dissociation inhibitor (Schalk et al., 1996). Hereby, the latter did not
bind flavin. When superimposing both glutathione reductase and p-hydroxybenzoate
hydroxylase - as representatives of the two most closely related structural superfamilies - onto
APS reductase the rms deviation was 3.4 Å and 2.6 Å for 40 % and 39 % of the Cα atoms
(Figure 4.3).
Figure 4.3: Cα superposition of the FAD domain including FAD of APS reductase (1JNR), glutathione
reductase (1GER) and p–hydroxybenzoate hydroxylase (1PBE).
However, the surrounding of the FAD binding site, in particular the regions around the ribitol
and the ADP moiety, were even more closely related. In contrast, the environment of the
isoalloxazine ring was more different reflecting the different requirements of the biochemical
reactions to be catalyzed. In agreement with this observation the conformation of the FAD
was also maintained.
Such a FAD–binding domain was meanwhile observed in about 25 different flavoenzymes.
This building block was useful for binding FAD since several loop regions at the C–terminal
end of a β–sheet could optimally bind the prosthetic group. Moreover, the adenine ring was
located in a shallow cleft between the two β–sheets of the domain. Of particular importance
were two helices. One of them was directed with its N–terminal end towards its
pyrophosphate group and stabilized the negative charge of the phosphate. The other helix
pointed to the pyrimidine moiety of FAD and stabilized a deprotonated N1–atom. The

Discussion 81
negative charge was delocalized over the entire ring, which enhanced the nucleophilicity of
the N5 atom facilitating both a nucleophilic attack as in APS reductase or a hydride transfer as
in most flavoenzymes.
4.1.1.3 Comparison of the active site and substrate binding in APS reductase with that in other members of the succinate dehydrogenase family
When comparing the substrate binding sites and active sites of the structurally known
members of the fumarate reductase family a highly similar architecture was found for
aspartate oxidase and the fumarate reductases in contrast to that observed in APS reductase.
Obviously, the catalytic requirements of the hydride transferring reaction and the reductive
cleavage of a FAD–substrate adduct were in principle different. The structural rearrangements
included specific amino acids exchanges but, in particular, also unpredictable conformational
changes of loops regions whereas the overall scaffold of the protein was maintained. The
large number of alterations involved the conformation of the flavin ring, the size and the
shape of the substrate channel due to the different substrates and the key residues for
catalysis. Although in both types of reactions arginines and histidines played an essential role
none of them was conserved. These residues pointed from special loop positions to bring their
side chains into the optimal conformation for substrate binding or for catalysis. A remarkable
example was the conformational change of the loop, which carried the catalytically relevant
His A398 in APS reductases, and a histidine that was involved in substrate binding in
hydride–transferring enzymes. In summary, the succinate dehydrogenase family provided an
instructive example how different biochemical reactions could be accomplished by highly
conserved scaffold mainly through a redesign of loops in the catalytically relevant regions.
Structural alignments of the α-subunit of APS reductase with several members of the fumarate
reductase family revealed a highly similar overall fold between the two classes of enzymes.
Major changes were observed in the loops carrying the active site residues of both enzymes,
which were responsible for substrate binding, catalysis and the FAD conformation (Figure
4.2). In particular, the isoalloxazine in fumarate reductase was planar compared to the bent
isoalloxazine in APS reductase. In view of the similarity of the α-subunits of APS reductase
and fumarate reductase, it was tempting to suggest that both subunits had a common ancestor
resembling archaeal APS reductase. The insertion of a seven residue long loop that was
strictly conserved in fumarate reductases, into the active site of an ancestral APS reductase
might have had a pronounced impact on the conformation of the isoalloxazine ring. In APS
reductase from A. fulgidus, such an inserted loop would have caused His A398 to move
towards a position occupied by His A369 in the case of fumarate reductase (numbering

Discussion 82
according to W. succinogenes). Consequently, movement of His A398 would have displaced
Trp A234, one of the residues in APS reductase, which kept the isoalloxazine moiety in its
bent conformation (Figure 4.2).
Thus, the introduction of a seven amino acid loop into the active site of an ancestral APS
reductase could result in a planar isoalloxazine ring, concomitant with a negative shift in
reduction potential as required for fumarate reduction (Turner et al., 1999). The comparison
of APS and fumarate reductases provided an instructive example by which means different
biochemical reactions were accomplished by highly similar protein scaffolds mainly through
the redesign of loop structures.
In conclusion, the three-dimensional structure of APS reductase presented here added
important information to our understanding of how the reduction potential and the reactivity
of FAD and FeS centers were finely tuned by the protein structure.
Discussion 83
4.1.2 Structure based enzyme mechanism
4.1.2.1 The reaction of APS reductase
The active site of APS reductase was deeply buried into the protein interior and was only
accessible from the outside through a 17 Å long channel with a diameter of about 10 Å
(Figure 4.6). The channel was formed at the interface between the FAD-binding and capping
domains. The presented structural studies indicated that the substrate-binding channel was
pre-built prior to substrate binding. It could be deduced that a hydrophobic cluster of residues
(Trp A144, Tyr A95, Phe A448, Trp A234, Phe A261, Tyr A599, Phe A264, Phe A277) was
responsible for the stability of the channel in the substrate free enzyme. The fact that in APS
reductase the active site was already pre-built was important for catalysis. Sulfate reducing
organisms depended on an efficient transformation of sulfate to sulfide for energy
conservation, without the accumulation of intermediates such as toxic sulfite or thionats
(Kroder, 1997). Minor changes upon binding of substrate afforded only low reorganization
energy – a prerequisite for fast and efficient catalysis.
Substrate binding in APS reductase was a multi-step process (Figure 3.10). At first a patch of
positively charged residues (Arg A83, Lys A281, Lys A283, Arg A317) around the entrance
of the substrate channel guided negatively charged molecules. Moreover two solvent-exposed
phenylalanine side chains of A264 and A277 interacted with the adenine ring and provided a
distal binding site (Figure 3.10). The size and form of the entrance of the channel was
supposed to exclude larger molecules such as ATP. On the other hand, Arg A317 might not
have guided smaller aromatic molecules to the proximal binding site (Figure 3.11).
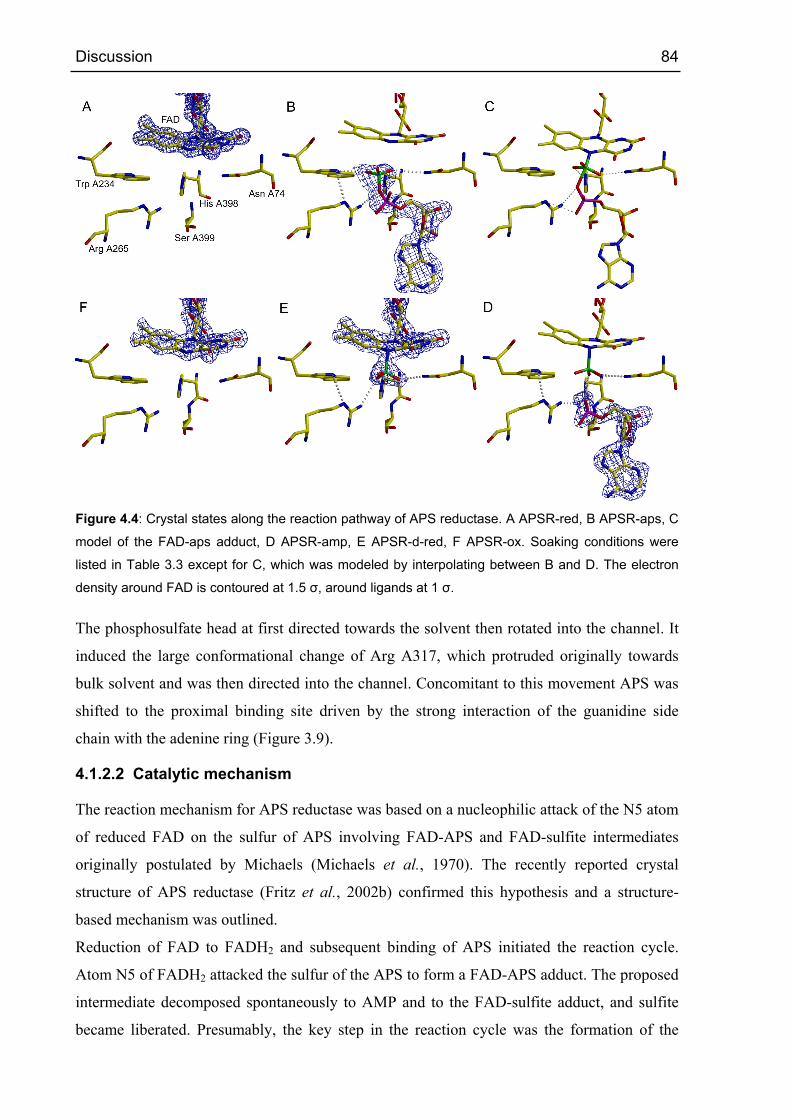
Discussion 84
Figure 4.4: Crystal states along the reaction pathway of APS reductase. A APSR-red, B APSR-aps, C
model of the FAD-aps adduct, D APSR-amp, E APSR-d-red, F APSR-ox. Soaking conditions were
listed in Table 3.3 except for C, which was modeled by interpolating between B and D. The electron
density around FAD is contoured at 1.5 σ, around ligands at 1 σ.
The phosphosulfate head at first directed towards the solvent then rotated into the channel. It
induced the large conformational change of Arg A317, which protruded originally towards
bulk solvent and was then directed into the channel. Concomitant to this movement APS was
shifted to the proximal binding site driven by the strong interaction of the guanidine side
chain with the adenine ring (Figure 3.9).
4.1.2.2 Catalytic mechanism
The reaction mechanism for APS reductase was based on a nucleophilic attack of the N5 atom
of reduced FAD on the sulfur of APS involving FAD-APS and FAD-sulfite intermediates
originally postulated by Michaels (Michaels et al., 1970). The recently reported crystal
structure of APS reductase (Fritz et al., 2002b) confirmed this hypothesis and a structure-
based mechanism was outlined.
Reduction of FAD to FADH2 and subsequent binding of APS initiated the reaction cycle.
Atom N5 of FADH2 attacked the sulfur of the APS to form a FAD-APS adduct. The proposed
intermediate decomposed spontaneously to AMP and to the FAD-sulfite adduct, and sulfite
became liberated. Presumably, the key step in the reaction cycle was the formation of the
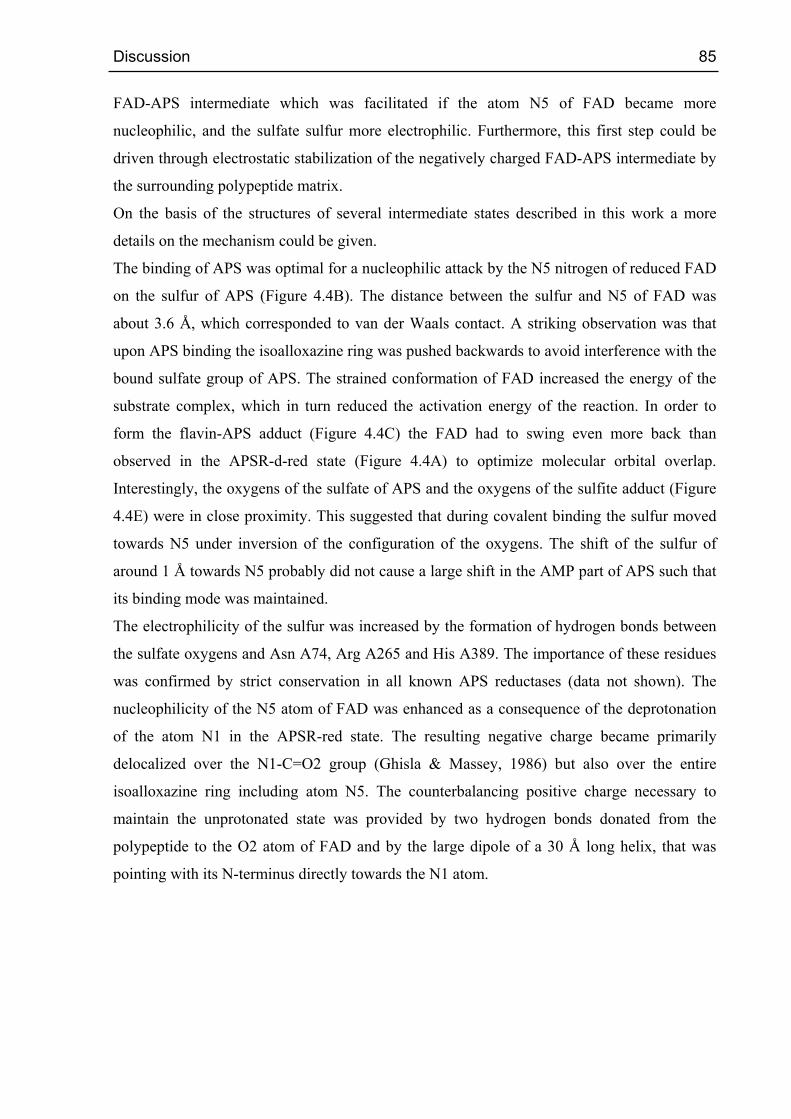
Discussion 85
FAD-APS intermediate which was facilitated if the atom N5 of FAD became more
nucleophilic, and the sulfate sulfur more electrophilic. Furthermore, this first step could be
driven through electrostatic stabilization of the negatively charged FAD-APS intermediate by
the surrounding polypeptide matrix.
On the basis of the structures of several intermediate states described in this work a more
details on the mechanism could be given.
The binding of APS was optimal for a nucleophilic attack by the N5 nitrogen of reduced FAD
on the sulfur of APS (Figure 4.4B). The distance between the sulfur and N5 of FAD was
about 3.6 Å, which corresponded to van der Waals contact. A striking observation was that
upon APS binding the isoalloxazine ring was pushed backwards to avoid interference with the
bound sulfate group of APS. The strained conformation of FAD increased the energy of the
substrate complex, which in turn reduced the activation energy of the reaction. In order to
form the flavin-APS adduct (Figure 4.4C) the FAD had to swing even more back than
observed in the APSR-d-red state (Figure 4.4A) to optimize molecular orbital overlap.
Interestingly, the oxygens of the sulfate of APS and the oxygens of the sulfite adduct (Figure
4.4E) were in close proximity. This suggested that during covalent binding the sulfur moved
towards N5 under inversion of the configuration of the oxygens. The shift of the sulfur of
around 1 Å towards N5 probably did not cause a large shift in the AMP part of APS such that
its binding mode was maintained.
The electrophilicity of the sulfur was increased by the formation of hydrogen bonds between
the sulfate oxygens and Asn A74, Arg A265 and His A389. The importance of these residues
was confirmed by strict conservation in all known APS reductases (data not shown). The
nucleophilicity of the N5 atom of FAD was enhanced as a consequence of the deprotonation
of the atom N1 in the APSR-red state. The resulting negative charge became primarily
delocalized over the N1-C=O2 group (Ghisla & Massey, 1986) but also over the entire
isoalloxazine ring including atom N5. The counterbalancing positive charge necessary to
maintain the unprotonated state was provided by two hydrogen bonds donated from the
polypeptide to the O2 atom of FAD and by the large dipole of a 30 Å long helix, that was
pointing with its N-terminus directly towards the N1 atom.

Discussion 86
N- O
NON
CH3
CH3
N
OH
OH
OH
H
H Asn A 74O
HN
Trp A 234
NH
Arg A 265
NH
NH2
NH2+
His A 399N
NH
N- ON
ON
CH3
CH3
N
OH
OH
OH
HH
Asn A 74OHN
Trp A 234
NH
Arg A 265
NH
NH2
NH2+
Asn A 74OHN
Trp A 234
NH
Arg A 265
NH
NH2
NH2+
Asn A 74O
HN
Trp A 234
NH
Arg A 265
NH
NH2
NH2+
N- ONH
ON
CH3
CH3 N
OH
OH
OH
CH3
SO
OO
Asn A 74O
HN
Trp A 234
NH
Arg A 265
NH
NH2
NH2+
NH2
ON
NH
NH2
N- ONH
ON
CH3
CH3 N
OH
OH
CH3
SOOO
OH
NH2
ON
NH
NH2
O
OH
OHN
N
NH2 N
N
SO
-OO
PO
O
O
O
NH
ON
NH
O
OH
OHN
N
NH2 N
N
N-
O
NH
O
N
CH3
CH3
N
OHOH
OH CH3
S O-
O
PO-
O
O
O
OH
OH2
OH2
OH2 OH2
OH2
OH3+
OH2
OH2
NH2
ON
NH
NH
Ser A 399OHP
O
O O
O-
O
OH
OHN
N
NH2 N
N
OH2 OH3+
OH2
Asn A 74
OHN
Trp A 234
NH
Arg A 265
NH
NH2
NH2+
NH2
ON
NH
NH2
N
CH3
CH3
N
OH
OH
OH
N ON
OH
OH2
H2OOH2
+APS
-AMP
-HSO3-
+2 e-
Glu A 141
O
O
Glu A 141
O
O
Glu A 141
O
O
Glu A 141
O
O
Glu A 141
O
O
Glu A 141
O
O
A B
C
DE
F
Figure 4.5: Structure based reaction mechanism of APS reductase from A. fulgidus. It was based on
the structures of APS reductase in complex with APS, AMP+sulfite and sulfite as well as the structures
of the oxidized and reduced substrate free enzyme.
The formation of the FAD-APS intermediate (Figure 4.4C) was accompanied by the
deprotonation of the N5 hydrogen. The fate of this proton couldn’t be followed directly
because the structures did not provide an unambiguous answer. The nucleophilic attack took
place on the re-side of FAD with the proton located on its si-side. The si-side of FAD was
rather hydrophobic and the only possible acceptor was a water molecule that was too far away
(6.7 Å). Thus, the most likely scenario was a proton transfer from the si-side of FAD to the
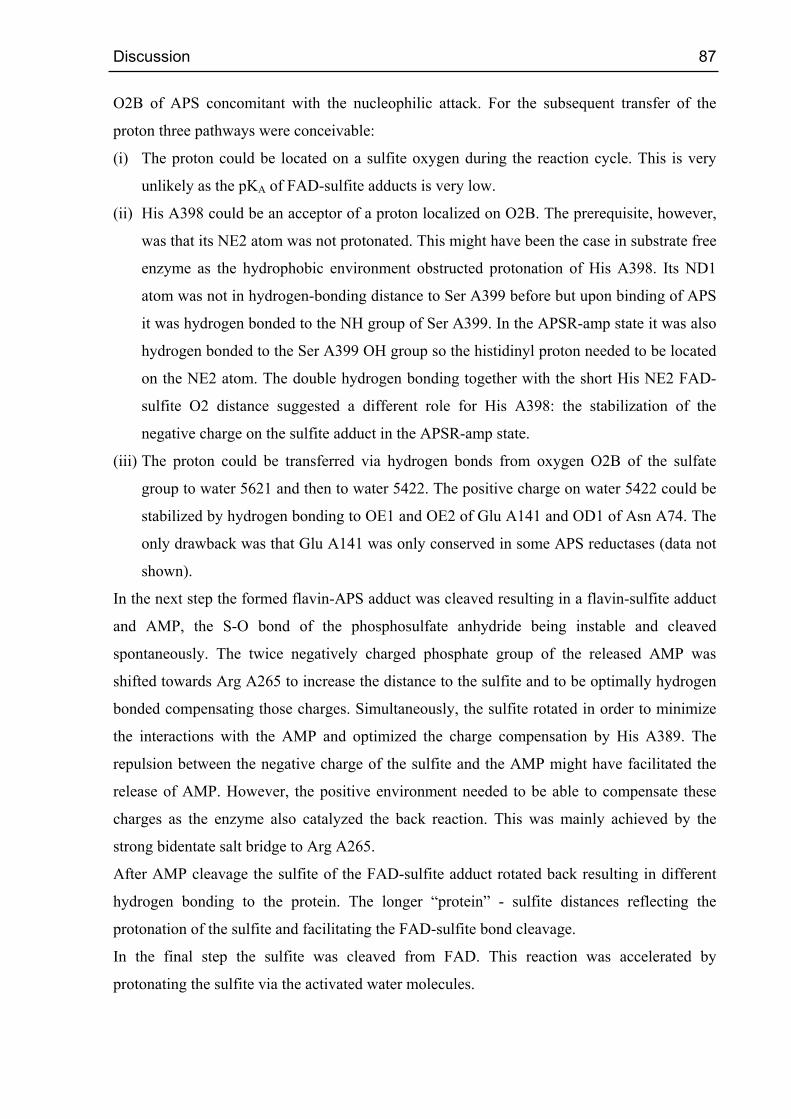
Discussion 87
O2B of APS concomitant with the nucleophilic attack. For the subsequent transfer of the
proton three pathways were conceivable:
(i) The proton could be located on a sulfite oxygen during the reaction cycle. This is very
unlikely as the pKA of FAD-sulfite adducts is very low.
(ii) His A398 could be an acceptor of a proton localized on O2B. The prerequisite, however,
was that its NE2 atom was not protonated. This might have been the case in substrate free
enzyme as the hydrophobic environment obstructed protonation of His A398. Its ND1
atom was not in hydrogen-bonding distance to Ser A399 before but upon binding of APS
it was hydrogen bonded to the NH group of Ser A399. In the APSR-amp state it was also
hydrogen bonded to the Ser A399 OH group so the histidinyl proton needed to be located
on the NE2 atom. The double hydrogen bonding together with the short His NE2 FAD-
sulfite O2 distance suggested a different role for His A398: the stabilization of the
negative charge on the sulfite adduct in the APSR-amp state.
(iii) The proton could be transferred via hydrogen bonds from oxygen O2B of the sulfate
group to water 5621 and then to water 5422. The positive charge on water 5422 could be
stabilized by hydrogen bonding to OE1 and OE2 of Glu A141 and OD1 of Asn A74. The
only drawback was that Glu A141 was only conserved in some APS reductases (data not
shown).
In the next step the formed flavin-APS adduct was cleaved resulting in a flavin-sulfite adduct
and AMP, the S-O bond of the phosphosulfate anhydride being instable and cleaved
spontaneously. The twice negatively charged phosphate group of the released AMP was
shifted towards Arg A265 to increase the distance to the sulfite and to be optimally hydrogen
bonded compensating those charges. Simultaneously, the sulfite rotated in order to minimize
the interactions with the AMP and optimized the charge compensation by His A389. The
repulsion between the negative charge of the sulfite and the AMP might have facilitated the
release of AMP. However, the positive environment needed to be able to compensate these
charges as the enzyme also catalyzed the back reaction. This was mainly achieved by the
strong bidentate salt bridge to Arg A265.
After AMP cleavage the sulfite of the FAD-sulfite adduct rotated back resulting in different
hydrogen bonding to the protein. The longer “protein” - sulfite distances reflecting the
protonation of the sulfite and facilitating the FAD-sulfite bond cleavage.
In the final step the sulfite was cleaved from FAD. This reaction was accelerated by
protonating the sulfite via the activated water molecules.

Discussion 88
With the leaving of the product hydrogen-sulfite the FAD rotated back into the original
position the surrounding residues adjusting to this. The flavin was in the oxidized state and
needed to be reduced for the next reaction cycle.
4.1.2.3 The electron transfer
The reduction of APS required two electrons, which had to be transferred to the buried FAD
over 30 Å via cluster II at the surface of the protein and cluster I (Figure 4.6). Electron
transfer between the unknown physiological electron donor and cluster II required the
docking of the donor to the protein surface adjacent to cluster II.
Figure 4.6: The active site channel of APS reductase. Cut through the molecular surface of APS
reductase in order to show the active site channel (blue) and the position of the cofactors. The active
site channel was lined up by a number of conserved positively charged residues. Almost only the N5
atom of FAD was accessible to the solvent.
Sequence comparisons indicated that the potential interface region that included a flexible
loop between Cys B13 and Arg B18, was conserved in APS reductases of the sulfate-reducing
organisms but not in the enzyme of the sulfur-oxidizing Allochromatium vinosum where the
loop was absent (Figure 3.2). This observation supported the view that different redox
partners interacted with APS reductase dependent on whether APS reduction or oxidation of
sulfite and AMP was catalyzed. The distances between the redox centers in APS reductase
were appropriate for effective electron transfer (Hall et al., 1987). The [4Fe-4S] clusters I and
II had an edge-to-edge distance of 9.7 Å; the distance between the S3 of cluster I and the
methyl group C8M of FAD was 12.4 Å (Figure 4.6). The strictly conserved Trp B48 was
located between the two cofactors in van der Waals contact to both centers (Figure 3.2). The
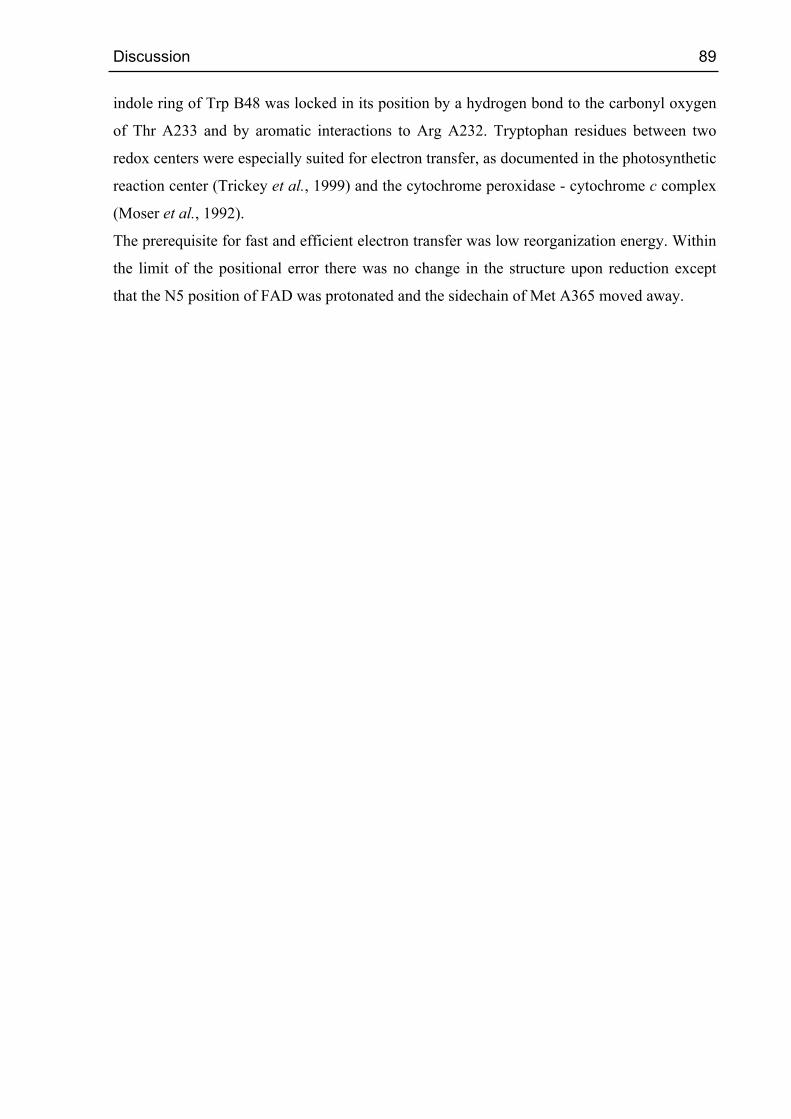
Discussion 89
indole ring of Trp B48 was locked in its position by a hydrogen bond to the carbonyl oxygen
of Thr A233 and by aromatic interactions to Arg A232. Tryptophan residues between two
redox centers were especially suited for electron transfer, as documented in the photosynthetic
reaction center (Trickey et al., 1999) and the cytochrome peroxidase - cytochrome c complex
(Moser et al., 1992).
The prerequisite for fast and efficient electron transfer was low reorganization energy. Within
the limit of the positional error there was no change in the structure upon reduction except
that the N5 position of FAD was protonated and the sidechain of Met A365 moved away.
Discussion 90
4.2 Sulfite reductase from Archaeoglobus fulgidus
4.2.1 Molecular and catalytic properties of sulfite reductase
Sulfite reductase from A. fulgidus was isolated and purified to homogeneity under exclusion
of dioxygen. For the first time an activity was determined for purified enzyme from
thermophile A. fulgidus. The specific activity of 48.2 nmol sulfite min-1 mg-1 was in the same
range as those from sulfate-reducing bacteria (Table 4.1) but was too low compared to the
rates determined in growing cultures of sulfate-reducing bacteria (Badziong & Thauer, 1978;
Cypionka & Pfennig, 1986). It was also lower than the value of 70 nmol sulfite min-1 mg-1
determined for crude extracts of A. fulgidus (Dahl et al., 1993; Dahl & Trüper, 2001).
Reduced methylviologen was used in the sulfite reductase activity assay and the rate was
determined photometrically. However, high initial methylviologen oxidation rates in the crude
extract of A. fulgidus have been reproduced in this study (data not shown). They were not
attributed to sulfite reduction but to non-specific reduction of various proteins present in the
crude extract.
The iron content of dissimilatory sulfite reductase has been a matter of debate. While for most
species 20-24 Fe per α2β2γnδm were reported Wolfe (Wolfe et al., 1994) claimed only 10-11
Fe per α2β2 and speculated that higher values were due to a contamination. This finding was
not confirmed by Marritt & Hagen (1996). For the A. fulgidus enzyme Dahl et al. (1993)
reported 22-24 non-haem iron per α2β2 and proposed six [4Fe-4S] clusters. The value of 12.4
Fe per α2β2 determined by ICP-MS was only consistent with values reported by Wolfe (Wolfe
et al., 1994). The ongoing crystallographic studies will provide further insight into this matter.

Discussion 91
4.2.2 Spectroscopic properties of sulfite reductase
The most interesting spectroscopic property of sulfite reductase was the presence of high-spin
EPR signals. In the oxidized state there were two types of high-spin signals: spin S=5/2 and
S=9/2 (Pierik & Hagen, 1991). The signals with spin S=5/2 were present in assimilatory as
well as dissimilatory sulfite reductases (Jannick & Siegel, 1982; Hall et al., 1979; Wolfe et al.,
1994; Pierik & Hagen, 1991) whereas the S=9/2 signals were only observed in some
dissimilatory sulfite reductases including Desulfovibrio vulgaris and Archaeoglobus fulgidus.
4.2.2.1 High-spin S=5/2 signals
The spin S=5/2 signal has been studied in detail in both assimilatory and dissimilatory sulfite
reductase. It was due to the coupled high-spin siroheme as described in section 4.2.2.3.
In oxidized sulfite reductase from A. fulgidus there was a major component with E/D=0.036.
The E/D of the D. vulgaris enzyme could be estimated to 0.03 based on g-values given by the
authors for the major component. The E/D of as well as the contribution of the minor
components was comparable to the D. vulgaris enzyme (Marritt & Hagen, 1996) but also to
the D. baculatus and D. gigas enzyme (Moura et al., 1988). However, the zero-field splitting
parameter was substantially lower (3.5 ± 1 cm-1 for A. fulgidus vs. 9.1 cm-1 for D. vulgaris).
4.2.2.2 High-spin S=9/2 signals
Oxidized sulfite reductase from A. fulgidus had a single S=9/2 component with E/D=0.153
resulting in two lines at g=17.5 and 9.7. This situation was quite similar in the D. vulgaris
enzyme with two S=9/2 components at g=17, 15, around 9-10 and 8.8 (Marritt & Hagen,
1996). The zero-field splitting parameter D was also determined. The values for A. fulgidus
sulfite reductase determined from depopulation (4.1 ± 0.4 cm-1) and the value necessary for
simulation (2.4 cm-1) were in the same range but indicated that the error of the value from
depopulation experiments was underestimated. However this demonstrated the usefulness of
the simulation of the S=9/2 subspectra if the lines originating from two doublets of the same
component were visible in the spectrum. This was only possible because the used program,
WEPR in this case, correctly calculated the transition probability for the not fully allowed
transitions in the other but the | ± 1/2 > doublets. Pierik & Hagen (Pierik & Hagen, 1991)
reported a value of D= -0.56 cm-1 for the zero-field splitting of D. vulgaris sulfite reductase.
This was interesting because we unambiguously found a positive D value for A. fulgidus
sulfite reductase. Looking at their spectra revealed that with rising temperature the intensity of
the low-field lines decreased for the | ± 1/2 > doublets at g=17 and 15 so the zero-field

Discussion 92
splitting of D. vulgaris sulfite reductase might have also been positive. Further support for
this interpretation were: The g=17 and 15 lines were assigned to the | ± 1/2 > doublet but if
the zero-field splitting was negative this line should not been observable at 4.2K as in a
system with negative zero-field splitting the | ± 1/2 > doublet was highest in energy and
shouldn’t have been populated at 4.2 K. Source Specific activity S=9/2 signals Iron content Reference
D. vulgaris 87 n.d. n.d. Lee et al., 1973
D. gigas 210 n.d. n.d. Lee et al., 1971
D. vulgaris n.d. No n.d. Lui et al., 1994
D. vulgaris 167 No 10-11 Wolfe et al., 1994
D. vulgaris 50-100 Yes 18-26 Pierik & Hagen, 1991
D. vulgaris 67 Yes 19-21 Marritt & Hagen, 1996
D. gigas n.d. Yes* 16-20 Moura et al., 1988
D. baculatus n.d. Yes* 19-23 Moura et al., 1988
D. desulfuricans 42 Yes 21-27 Steuber et al., 1995
A. fulgidus 70** n.d. 22-24 Dahl et al., 1993
A. fulgidus 48 Yes 11-13 this study
Table 4.1: Reported values of specific activity [nmol sulfite min-1 mg-1], presence of S=9/2 signals and
iron content for dissimilatory sulfite reductases. *The authors did not assign the g=9.7 lines in the
spectrum to a S=9/2 species. **value was determined for crude extracts not purified protein.
After describing the spectroscopic parameters of the S=9/2 signals the questions remained
whether they had any biological relevance. If the specific activity correlated with the presence
of S=9/2 signals this would have been a good indication. However, the data basis was rather
small there were only three independent reports where the EPR spectrum as well as the
specific activity was given. Another problem seemed to be the reproducibility; with the same
purification procedure values for specific activity differed by a factor of 2.5. An indication of
the biological relevance of these high-spin signals was the fact that these signals were present
in the enzymes from four different organisms.
One of the major problems for the interpretation of the spectra was the lack of a reliable
quantitation procedure. The problems with quantitation of S=9/2 species were not fully
allowed transitions, lack of model systems, observability of not all g-values and the possible
mixing of the doublets within the spin multiplet for systems with low zero-field splitting and
observation at high magnetic fields. These problems could be overcome by the following
procedure. Simulation of the S=9/2 and S=5/2 species at the given temperature. Determination
of the double integral for both species and extrapolation to 0 K. The ratio of the intensity
Discussion 93
I9/2/I5/2 could then be used with the spin concentration of the S=5/2 signals that were readily
determinable to get a quantitative estimate for the spin concentration of the S=9/2 system.
4.2.2.3 Coupling of redox centers
In assimilatory sulfite reductase Christner et al. showed by Mössbauer spectroscopy that the
siroheme was in the high-spin state and strongly exchange coupled to the [4Fe-4S]2+ cluster.
This species was the origin of the S=5/2 signals in EPR spectroscopy (Christner et al., 1981).
There were exchange and hyperfine interactions between the heme iron and the iron-sulfur
cluster. The iron-sulfur cluster in the +2 oxidation state could be described as an
antiferromagnetically coupled pair of ferromagnetically coupled iron ions (Belinsky, 1995).
These two ferromagnetically coupled pairs were exchange coupled to the heme iron resulting
in non-vanishing hyperfine fields on the iron nuclei of the cluster. This induced
paramagnetism on the individual irons of the diamagnetic cluster (Bominaar, 1995). In other
words the coupling of the heme iron with the iron-sulfur cluster caused mixing of the excited
states of the cluster with its ground state.
The coupling of the siroheme to a [4Fe-4S] cluster in dissimilatory sulfite reductase was
shown by Moura et al. (1988) but later questioned by Pierik & Hagen (1991). Pierik & Hagen
claimed that the spectroscopic data available was not compatible with a coupling of the iron-
sulfur cluster to the siroheme. This point was clarified by the current exchange model of the
siroheme-iron-sulfur active site (Belinsky, 1995).
4.2.2.4 Origin of the S=9/2 signals in sulfite reductase
The S=9/2 signals were present in sulfite reductase but what structure was the origin of these
signals? In principle there were three possibilities: a siroheme coupled to a [4Fe-4S] cluster, a
[4Fe-4S] cluster or a higher nuclear iron sulfur cluster.
The coupling of the siroheme to the iron-sulfur cluster was already observed in sulfite
reductase. To explain the S=9/2 signals coupling of the S=5/2 siroheme to an S=2 cluster was
necessary. This could be achieved by a [4Fe-4S]2+ cluster with an S=2 ground state due to
unusual protein environment. Normally the S=2 state was the second excited state e.g. in
HIPIP from C. vinosum it was 850 cm-1 above the ground state (Lawson Daku et al., 2003). A
magnitude of the coupling constant J ~ 200-300 cm-1 was reasonable for exchange coupling
through a bridge. In a high-spin system (S=9/2, SA=5/2, SB=2) the exchange energy
E(J)=-J[S(S+1)-SA(SA+1)-SB(SB+1)] was easily 2000-3000 cm-1 compared to 1000-1500 cm-1
for the first excited state (S=1; 280 cm-1 above the ground state) and 3000-4500 cm-1 for the
third excited state (S=3; 1700 cm-1 above the ground state). For the ferredoxin type [4Fe-4S]2+
Discussion 94
cluster there were no energy values reported so it might have been speculated that either
coupling of the second or the third excited state resulted in the lowest total energy. However
the coupling was usually antiferromagnetic (Ghosh et al., 2003) except for the double
exchange situation.
This description could also resolve the discrepancies between the measured (metallated)
siroheme content and the spin quantitations of the S=5/2 signal: 0.2 spins S=5/2 signal and 0.6
spins S=9/2 signal (Marritt & Hagen, 1996) resulting from 1 mol [4Fe-4S]-siroheme. The
existence of both species could be explained by the loss of bridging ligand, loss of cluster
iron, change in cluster environment resulting in a ‘normal’ S=0 ground state.
The second possibility was a [4Fe-4S] or another non-classical iron-sulfur cluster with the
unusual S=9/2 ground state in the oxidized form. In a 2Fe ferredoxin from Clostridium
pasteurianum a [2Fe-2S] cluster with S=9/2 ground state was observed that was coordinated
by three cysteines and one serine (Grouse et al., 1995). Thus, in principle it might have also
been possible for a [4Fe-4S]1/3+ cluster to adopt an S=9/2 ground state.
The third possibility was suggested by Pierik & Hagen (Pierik & Hagen, 1991). A cluster with
more than 4 irons were supposed to be the origin of the S=9/2 signals. They proposed a
prismane [6Fe-6S] cluster as observed in the ‘prismane protein’. The crystal structure of
hybrid-cluster protein (formerly named ‘prismane protein’) however showed that it contained
a [4Fe-3S-4O] cluster (Cooper et al., 2000; Macedo et al., 2002). This was compatible with
the preliminary x-ray data of A. fulgidus sulfite reductase but there was no indication for such
a cluster based on sequence data. On the other hand the presence of iron clusters with more
than 4 irons could be excluded by the preliminary x-ray studies on sulfite reductase in
combination with the biochemical data.
It was hard to decide which possibility was most likely, probably not strong ferromagnetic
exchange coupling between a cubane cluster and the siroheme but an unusual iron-sulfur
cluster.
4.2.2.5 Redox states and substrate binding
For assimilatory sulfite reductase the influence of the redox state and ligands on the spectrum
was also studied. Upon one electron reduction the S=5/2 signal disappeared. When the second
electron was added a low or intermediate spin species was found depending on the ligand
field strength of the exogenous ligand of the siroheme (Jannick & Siegel, 1983). The
disappearance of the S=5/2 signal could also be monitored by UV/Vis spectroscopy. A weak
absorption band at 710-720 nm was due to the presence of high spin heme species and
disappeared upon reduction (Stolzenberg et al., 1981).

Discussion 95
In the dissimilatory enzyme this situation was different: upon one-electron reduction the
S=5/2 signal disappeared but then the next electron gave only rise to an S=1/2 species (Wolfe
et al., 1994). Again for the enzyme from the same organism different behaviors were
reported. Pierik & Hagen (1991) also saw the disappearance of the S=9/2 and S=5/2 signals
but couldn’t detect the stochiometric appearance of an S=1/2 species.
For dissimilatory sulfite reductase from Desulfovibrio vulgaris Lui et al. reported no
significant optical changes upon ligand binding to the oxidized siroheme (Lui et al., 1994).
This was different in the A. fulgidus enzyme as shown in Figure 3.13. An explanation might
have been that an electron was transferred from a reduced iron-sulfur cluster to allow
substrate binding.
Upon incubation of sulfite reductase with sulfide the UV/Vis absorption bands at 392nm
(soret-band) and 710 nm decreased. In the EPR spectrum there were almost no high-spin
signals visible. This could be explained by the fact that in E. coli sulfite reductase the heme
was spin S=1/2 with sulfide bound in the oxidized state (Christner et al., 1984).
Interestingly, the EPR spectrum of sulfite reductase as isolated and oxidized sulfite reductase
only differed in the number of components with different rhombicity indicating that sulfite
reductase was isolated in the oxidized state although it was isolated under exclusion of
dioxygen.

Discussion 96
4.2.3 Crystallization and structure determination of sulfite reductase
4.2.3.1 Crystallization
Initial screening using the Hampton Research crystal screen kits yielded immediately in
crystals of sulfite reductase in screen 1 condition 40 (20 % 2-propanol, 0.1 M sodium citrate
pH 5.6, 20 % PEG 4000). High numbers of small needle like crystals were obtained –
unsuitable for x-ray analysis. The conditions were refined by optimizing the pH, ionic
strength, buffer, protein concentration and using additive screens but the best possible yielded
in plate shaped crystals with only 10-50 µm in the one direction and 0.4-0.7 mm in the other
directions. Crystallographic analysis revealed good diffraction in one direction but low to
medium diffraction quality in the other direction.
The crystal shape could be explained later by the crystal contacts in the preliminary solvent
flattened electron density map: while in the xy plane there was continuous electron density
along the z direction layers of electron density were visible.
The diffraction quality of the crystals varied very much and the reproducibility of good
diffracting crystals was not very high.
4.2.3.2 Data collection and reduction
The geometry of the sulfite reductase crystals caused major problems during data collection
and data reduction.
The x-ray diffraction image of a crystal was caused by the repetition of the molecules in the
unit cell of the crystal. Thus, large differences in the dimensions of the crystal resulted in
large differences in the intensity of the spots. In addition, stable crystal contacts were needed
to stabilize a single conformation of the protein in the crystal. For the sulfite reductase crystal
measured at ESRF, ID29 relative scaling factors for the individual frames differed by a factor
of 2.5. This was most probably the reason why it was not possible to process a dataset
measured at ESRF, ID29 with the program suite HKL version 1.97.2 (Otwinowski & Minor,
1996) so XDS (Kabsch, 1993) was used instead. Furthermore, the data processing with XDS
resulted in better data set statistics compared to HKL. This might have been due to the three-
dimensional integration approach of XDS, which was superior in the case of few or no fully
recorded reflections per frame (Kabsch, 1993; Pflugrath, 1999).
Interestingly, for the crystal measured at BW6, DESY the scaling factors were in the usual
range. Whether this phenomenon was due to the crystal or the beamline was not quite clear.
Discussion 97
However, the fact that the native crystal measured at ID29 also had strange scaling factors
indicate that it might have been related to the beamline.
4.2.3.3 Structure determination
For the structure determination of large macromolecular assemblies heavy atom clusters were
usually used. As those clusters were either a priori not in a distinct orientation or the
orientation couldn’t be determined due to the lack of high-resolution data those clusters could
only be described as a single atom with high occupancy and high temperature factor. At low
resolution this might have been a valid approach but even at medium resolution this model
was inadequate as scattering of such a cluster dropped dramatically at resolutions similar to
the diameter of the cluster, and showed a subsidiary maximum at a resolution equal to
approximately half the diameter of the shell (Fu et al., 1999). Thus, for the phase calculations
a structure factor was used that was calculated by averaging over all possible orientations of
the cluster.
It was intended to solve the structure of sulfite reductase by SAD or MAD measurements on
the iron absorption edge because it was known that sulfite reductase contained several iron-
sulfur clusters and heme iron. Even in the best datasets collected the anomalous signal was
only significant to a resolution of 4 Å. Thus, it was not possible to detect the anomalous
scattering of the individual iron atoms. The electron density based on the phasing with iron-
sulfur clusters treated as huge atoms did not allow identifying the positions of the individual
atoms. The use of the spherically averaged structure factor of [4Fe-4S] clusters produced an
electron density good enough to identify the orientation of the clusters. This was then the
basis that enabled the identification of helices and sheets in the electron density.
As indicated by the packing density (Matthews, 1968) there were two αβ-units in the
asymmetric unit of sulfite reductase crystals. The non-crystallographic symmetry operator
was readily determined. However, it was evident already in the first MAD dataset measured
that the density modifications using averaging of the two αβ-units did not improve the
electron density very much. Solvent flipping without averaging was equal if not superior to
solvent flattening with averaging. This might have been due to a higher flexibility of one αβ-
unit as reflected in the refined temperature factors of the irons (Table 3.18). In addition, it was
always a problem that the ‘bones’ model of sulfite reductase was not symmetric, parts of one
αβ-unit were always missing (cf. section 4.2.3.1).
The preparation of the mercury derivative in combination with the measurement of a complete
iron and mercury MAD dataset was one of the biggest steps in structure solution. Although
there were only two mercury ions bound to the protein in the crystal (HgA: occupancy 0.8,

Discussion 98
B=48 Å2; HgB: occupancy 0.9, B=201 Å2, Table 3.18) there was a significant phasing power
contribution from the Hgpeak and Hginflection wavelengths (Table 3.17).
In principle, it should have been possible to solve the crystal structure of dissimilatory sulfite
reductase from A. fulgidus but what was necessary to achieve this? Better crystals would have
been a standard answer. The current crystal form was not great but the crystals had the
potential to enable the determination of the structure. The non-optimal occupancy of the
mercury indicated the necessity to optimize the mercury content of the derivative crystals by a
longer soaking time and maybe also higher Thimerosal concentrations. With a crystal of the
size and diffraction quality comparable to the one used for the sirgg1 dataset it should be
possible to measure a complete highly redundant Fe/Hg MAD dataset at DESY, BW6 that
should enable the structure determination of sulfite reductase.
4.2.3.4 Cofactors of sulfite reductase
Based on the findings of the preliminary crystallographic analysis, the biochemical data (Dahl
et al., 1993) and the sequence data (Klenk et al., 1997), the following model of sulfite
reductase was constructed.
Figure 4.7: Model of sulfite reductase deduced from crystallographic analysis. The α-subunit contains
the siroheme right next to a [4Fe-4S] cluster a second [4Fe-4S] cluster was 15 Å away. The β-subunit
contains another iron-sulfur cluster that was at least 38 Å away from the others. The distance to the
clusters (1B, 2B 3B) of the other αβ-unit (α’,β’) is at least 31 Å.
The siroheme was located in exchange coupling distance from the [4Fe-4S] cluster 1. Another
cluster was located most probably also in the α-subunit within a distance that was compatible
with fast and efficient electron transfer between the centers. The third cluster however was
located at the other side of the αβ-arrangement. The function of this third cluster (3A) being
electron transfer to the active site was almost inconceivable. The shortest distance to the next

Discussion 99
cluster was 31 Å to the equivalent cluster (3B) of the other β-subunit so electron transfer
across αβ-units was not a possibility. On the other hand it was strange that an enzyme that
catalyzes a six-electron reduction contained an iron-sulfur cluster that was not involved in
electron transfer.

Discussion 100

References
101
5 References
Abrahams, J. P. & Leslie, A. G. W. (1996) Methods used in the structure determination of
bovine mitochondrial F1 ATPase, Acta Cryst D52, 30-42
Achenbach-Richter, L., Gupta, R., Stetter, K. O., and Woese C. R. (1987) Were the original
eubacteria thermophiles?, Syst Appl Microbiol 9, 34-39.
Achim C., Golinelli M.-P., Bominaar E. L., Meyer, J., Münck, E. (1996) Mossbauer study of
Cys56Ser mutant 2Fe ferredoxin from Clostridium pasteurianum: evidence for double
exchange in an [2Fe-2S]+ cluster. J Am Chem Soc 118, 8168-8169.
Adams, M. W. W. (1993) Enzymes and proteins from organisms that grow near and obove
100°C, Annual Rev Microbiol 47, 627-658.
Angove, H. C. Yoo, J. S., Burgess, B. K. & Münck, E. (1997) Mössbauer and EPR Evidence
for an All-Ferrous Fe4S4 Cluster with S = 4 in the Fe Protein of Nitrogenase, J Am Chem Soc
119, 8730-8731.
Bamford, V., Dobbin, P. S., Richardson, D. J., and Hemmings, A. M. (1999) Open
conformation of a flavocytochrome c3 fumarate reductase, Nature Struct Biol 6, 1104-1107
Beinert, H., Orme-Johnson, W. H., and Palmer, G. (1978) Special techniques for the
preparation of samples for low-temperature EPR spectroscopy, Methods Enzymol 54, 111-
132.
Belinsky, M. I. (1995) Exchange model of the {[Fe4S4]-Fe} active site of sulfite reductase,
Chem Phys 201, 343-356
Bensadoun, A., & Weinstein, D. (1976) Assay of proteins in the presence of interfering
materials, Anal Biochem 70, 241-50.
Bick, J. A., & Leustek, T. (1998) Plant sulfur metabolism - the reduction of sulfate to sulfite,
Curr Opin Plant Biol 1, 240-244.
References
102
Binda, C., Newton-Vinson, P., Hubálek, F., Edmondson, D. E. and Mattevi, A. (2002)
Structure of human monoamine oxidase B, a drug target for the treatment of neurological
disorders, Nature Struct Biol 1, 22-26
Blundell, T. L. & Johnson, L. N. (1994) Crystallization of proteins, in Protein Crystallography
4. Auflage edit. (Blundell, T. L. & Johnson, L. N., eds.), pp. 59-82. Academic Press Inc., San
Diego.
Brüggemann, H., Falinski, F., and Deppenmeier, U. (2000) Structure of the F420H2:quinone
oxidoreductase of Archaeoglobus fulgidus, Eur J Biochem 267, 5810-5814.
Brünger, A. T. (1992) Free R value: a novel statistical quantity for assessing the accuracy of
crystal structures, Nature 355, 472-475.
Brünger, A. T. (1993) Assessment of phase accuracy by cross validation: the free R value.
Methods und applications, Acta Cryst D 49, 24-36.
Brünger, A. T., Adams, P. D., Clore, G. M., DeLano, W. L., Gros, P., Grosse-Kunstleve, R.
W., Jiang, J. S., Kuszewski, J., Nilges, M., Pannu, N. S., Read, R. J., Rice, L. M., Simonson,
T., Warren, G. L. (1998) Crystallography and NMR system: A new software suite for
macromolecular structure determination, Acta Cryst D 54, 905-921.
Brunold, C., Rennenberg, H., De Kok, L. J., Stulen, I., Davidian, J.-C. (2000) Sulfur Nutrition
and Sulfur Assimilation in Higher Plants: molecular, biochemical and physiological aspects,
Haupt, Berne.
Büchert, T. (2001) Structure and function of adenosine 5'-phosphosulfate reductase, Ph. D.
Thesis, Universität Konstanz, Konstanz.
Burdinski, D., Bill, E., Birkelbach, F., Wieghardt, K. & Chaudhuri, P. (2001) Long-Range
Exchange Interactions and Integer-Spin St = 2 EPR Spectra of a CrIIIZnIICrIII Species with
Multiplet Mixing, Inorg Chem 40, 1160-1166.

References
103
Burgess, B. K., Stiefel, E. I. & Newton, W. E. (1980) Oxidation-reduction properties and
complexation reactions of the iron-molybdenum cofactor of nitrogenase, J Biol Chem 255,
353-356.
Cameron, E. M. (1982) Sulfate and sulfate reduction in the early Precambrian oceans, Nature
296, 145-148.
Carter Jr., C. W. & Carter, C. W. (1979) Protein crystallization using incomplete factorial
experiments, J Biol Chem 254, 12219-12223.
Castro, H. F., Williams, N. H., and Ogram, A. (2000) Phylogeny of sulfate-reducing bacteria,
FEMS Microbiol Ecol 31, 1-9.
Chan, J. M., Christiansen, J., Dean, D. R., Seefeldt, L. C. (1999) Spectroscopic evidence for
changes in the redox state of the nitrogenase P-cluster during turnover, Biochemistry 38,
5779-85.
Chapman, M. S. &Blanc, E. (1997) Potential use of real-space refinement in protein structure
determination, Acta Cryst D 53, 203-206.
Chen, K., Tilley, G. J., Sridhar, V., Prasad, G. S., Stout, C. D., Armstrong, F. A., and Burgess,
B. K. (1999) Alteration of the reduction potential of the [4Fe-4S](2+/+) cluster of Azotobacter
vinelandii ferredoxin I, J Biol Chem 274, 36479-36487
Christner, J. A., Münck, E., Janick, P. A. & Siegel, L. M. (1981) Mössbauer spectroscopic
studies of E. coli sulfite reductase, J Biol Chem 256, 2096-2101
Christner, J. A., Münck, E., Kent, T. A., Janick, P. A., Salerno, J. C., & Siegel, L. M. (1984)
Exchange coupling between siroheme and [4Fe-4S] cluster in E. coli sulfite reductase.
Mössbauer studies and coupling models for a 2-electron reduced enzyme state and complexes
with sulfide, J Am Chem Soc 106, 6786-6794.
Cole, J. A. & Ferguson, S. J. (1988) Forty-Second Symposium of the Society for Gerneral
Microbiology: The Nitrogen and Sulphur Cycles, Cambridge Univ. Press, Cambridge.

References
104
Collaborative Computational Project No. 4. (1994) The CCP4 Suite: Programs for protein
crystallography, Acta Cryst D 50, 760-763.
Cooper, S. J., Garner, C. D., Hagen, W. R., Lindley, P. F. and Bailey, S. (2000) Hybrid-
Cluster Protein (HCP) from Desulfovibrio Vulgaris (Hildenborough) at 1.6 Å Resolution,
Biochemistry 39, 15044-15054.
Cort, J. R., Santhana Mariappan, S. V. Kim, C.-Y., Park, M. S., Peat, T. S., Waldo, G. S.,
Terwilliger, T. C. & Kennedy, M. A. (2001) Solution structure of Pyrobaculum aerophilium
DsrC, an archaeal homologue of the gamma subunit of dissimilatory sulfite reductase, Eur J
Biochem 268, 5842-5850.
Cowtan, K. (1994), Joint CCP4 and ESF-EACBM Newsletter on Protein Crystallography, 31,
p34-38.
Cowtan, K. D. & Main, P. (1996) Phase combination and cross validation in iterated density-
modification calculations, Acta Cryst D 52, 43-48.
Crane, B. R., Siegel, L. M., and Getzoff, E. D. (1995) Sulfite reductase structure at 1.6 Å:
evolution and catalysis for reduction of inorganic anions, Science 270, 59-67.
Crane, B. R., Siegel, L. M., and Getzoff, E. D. (1997a) Structures of the siroheme- and
Fe4S4-containing active center of sulfite reductase in different states of oxidation: heme
activation via reduction-gated exogenous ligand exchange, Biochemistry 36, 12101-12119.
Crane, B. R., Siegel, L. M., and Getzoff, E. D. (1997b) Probing the catalytic mechanism of
sulfite reductase by X-ray crystallography: structures of the Escherichia coli hemoprotein in
complex with substrates, inhibitors, intermediates, and products, Biochemistry 36, 12120-
12137.
Cromer, D. T. & Liberman, D. (1970) Relativistic calculation of anomalous scattering factors
for X-rays, J Chem Phys 53, 1891-1898.
Cypionka, H., and Pfennig, N. (1986) Growth yields of Desulfotomaculatum orientis with
hydrogen in chemostat culture, Arch Microbiol 143, 396-399.

References
105
Dahl, C., and Trüper, H. G., (2001) Sulfite Reductase and APS Reductase from
Archaeoglobus fulgidus, Methods Enzymol 331, 472-441.
Dahl, C., Koch, H.-G., Keuken, O., and Trüper, H. G. (1990) Purification and characterization
of ATP sulfurylase from the exremely thermophilic archaebacterial sulfate-reducer,
Archaeoglobus fulgidus, FEMS Microbiol Lett 67, 27-32.
Dahl, C., Speich, N. and Trüper, H. G., (1994) Enymology and Molecular Biology of Sulfate
reduction in Extremely Thermophilic Archaeon Archaeoglobus fulgidus, Methods Enzymol
243, 331-352.
Dauter, Z., Wilson, K. S., Sieker, L. C., Meyer, J., and Moulis, J.-M. (1997) Atomic
resolution (0.94 A) structure of Clostridium acidurici ferredoxin. Detailed geometry of
[4Fe-4S] clusters in a protein, Biochemistry 36, 16065-16073
Denke, E., Merbitz-Zahradnik, T., Hatzfeld, O. M., Snyder, C. H., Link, T. A., and
Trumpower, B.L. (1998) Alteration of the midpoint potential and catalytic activity of the
rieske iron-sulfur protein by changes of amino acids forming hydrogen bonds to the iron-
sulfur cluster, J Biol Chem 273, 9085-9093
Deppenmeier, U., Blaut, M., and Gottschalk, G. (1991) H2:heterodisulfide oxidoreductase, a
second energy-conserving system in the methanogenic strain Gö 1, Arch Microbiol 155, 272-
277.
Deppenmeier, U., Blaut, M., Mahlmann, A., and Gottschalk, G. (1990) Reduced
F420:heterodisulfide oxidoreductase, a proton-translocating redox system in methanogenic
bacteria, Proc Natl Acad Sci USA 87, 9449-9453.
Deppenmeier, U., Müller, V., and Gottschalk, G. (1996) Pathways of energy conservation in
methanogenic Archaea, Arch Microbiol 165, 149-163.
Deuereux, R., Delaney, M., Widdel, F. & Stahl, H. D. (1989) Natural relationship among
sulfate-reducing eubacteria, J Bacteriol 171, 6689-6695.
Diederichs, K. (2003) personal communication.
References
106
Dixon, D. A., Lindner, D. L., Branchaud, B. & Libscomb, W. N. (1979) Conformations and
electronic structures of oxidized and reduced isoalloxazine, Biochemistry 18, 5770-5775.
Drenth, J. (1994) Principles of Protein X-ray Crystallography, Springer Verlag, Heidelberg.
Einsle, O., Akif Tezcan, E., Andrade, S. L. A., Schmid, B., Yoshida, M., Howard, J. B., Rees,
D. C. (2002) Nitrogenase MoFe-Protein at 1.16 Å Resolution: A Central Ligand in the FeMo-
Cofactor, Science 297, 1696-1700.
Esnouf, R. M. (1997) An extensively modified version of MolScript that includes greatly
enhanced coloring capabilities, J Mol Graph 15, 132-134.
Feng, D. F., and Doolittle, R. F. (1997) Converting amino acid alignment scores into
measures of evolutionary time: a simulation study of various relationships, J Mol Evol 44,
361-370.
Feng, D. F., Cho, G., and Doolittle, R. F. (1997) Determining divergence times with a protein
clock: update and reevaluation, Proc Natl Acad Sci USA 94, 13028-13033.
Fitz, R. M., and Cypionka, H. (1989) A study on electron transport-driven proton
translocation in Desulfovibrio desulfuricans, Arch Microbiol 152, 369-376.
Fitz, R. M., and Cypionka, H. (1991) Generation of a proton gradient in Desulfovibrio
vulgaris, Arch Microbiol 155, 444-448.
Fritz, G. (1999) Structure and function of redox proteins involved in dissimilatory sulfate
reduction: Adenosine 5'-phosphosulfate reductase and multiheme cytochromes, Ph. D. Thesis,
Universität Konstanz, Konstanz.
Fritz, G., Büchert, T., and Kroneck, P. M. H. (1999) in Flavins and Flavoproteins (Ghisla, S.,
Kroneck, P. M. H., Macheroux, P., and Sund, H., eds), pp. 767-774, R. Weber Agency for
Scientific Publications, Berlin
Fritz, G., Büchert, T., and Kroneck, P. M. H. (2002a) The function of the [4Fe-4S] clusters
and FAD in bacterial and archaeal adenylylsulfate reductases. Evidence for flavin-catalyzed
reduction of adenosine 5'-phosphosulfate, J Biol Chem 277, 26066-26073
References
107
Fritz, G., Büchert, T., Huber, H., Stetter, K. O., and Kroneck, P. M. H. (2000) Adenylylsulfate
reductases from archaea and bacteria are 1:1 alphabeta-heterodimeric iron-sulfur
flavoenzymes high similarity of molecular properties emphasizes their central role in sulfur
metabolism, FEBS Lett 473, 63-66
Fritz, G., Roth, A., Schiffer, A., Büchert, T., Bourenkov, K., Bartunik, H. D., Huber, H.,
Stetter, K. O., Kroneck, P. M. H., and Ermler, U. (2002b) Crystal structure of the
adenylylsulfate reductase from the hyperthermophilic Archaeon Archaeoglobus fulgidus at
1.6Ǻ resolution, Proc Natl Acad Sci USA 99, 1836-1841.
Fu, J., Gnatt, A. L., Bushnell, D. A., Jensen, G. J., Thompson, N. E., Burgess, R. R., David,
P. R. and Kornberg, R. D. (1999) Yeast RNA Polymerase II at 5 Å Resolution, Cell 98, 799–
810.
Fujii, T., Hata, Y., Wakaki, T., Tanaka, N., and Oshima, T. (1996) Novel zinc-binding centre
in thermoacidophilic archaeal ferredoxins, Nature Struct Biol 3, 834-837
Ghisla, S. & Massey, V. (1986) New flavins for old: artificial flavins as active site probes of
flavoproteins Biochem J 239, 1–12.
Ghosh, P., Bill, E., Weyhermuller, T., Neese, F., Wieghardt, K. (2003) Noninnocence of the
ligand glyoxal-bis(2-mercaptoanil). The electronic structures of [Fe(gma)]2, [Fe(gma)(py)] x
py, [Fe(gma)(CN)]1-/0, [Fe(gma)I], and [Fe(gma)(PR3)(n)] (n = 1, 2). Experimental and
theoretical evidence for "excited state" coordination, J Am Chem Soc 125, 1293-1308.
Goa, J. (1953) A micro-biuret method for protein determination: determination of total protein
in cerebrospinal fluid, Scand J Clin Lab Invest 5, 219-222.
Green, D. W., Ingram, V. M. & Perutz, M. F. (1954) The structure of hemoglobin. IV. Sign
determination by the isomorphous replacement method, Proc Roy Soc A 225, 287-307.
Grouse, B. R. Meyer, J., Johnson, M. K. (1995) Spectroscopic Evidence for a Reduced Fe2S2
Cluster with a S = 9/2 Ground State in Mutant Forms of Clostridium pasteurianum 2Fe
Ferredoxin, J Am Chem Soc 117, 9612-9613.

References
108
Guex, N. & Peitsch, M. C. (1996) Swiss-PdbViewer: A fast and easy-to-use PDB viewer for
Macintosh and PC, PDB Quart Newslett 77, 7-10.
Hagen, W. R., Wassink, H., Eady, R. R., Smith, B. E. & Haaker, H. (1987) Quantitative EPR
of an S=7/2 system in thione-oxidized MoFe proteins of nitrogenase, Eur J Biochem 169,
457-465.
Hall, L. H., Bowers, M. L., and Durfor, C. N. (1987) Further consideration of flavin
coenzyme biochemistry afforded by geometry-optimized molecular orbitas calculations,
Biochemistry 26, 7401-7409.
Hall, M. H., Prince, R. H. & Cammack, R. (1979) EPR spectroscopy of the iron-sulphur
cluster and sirohaem in the dissimilatory sulphite reductase from Desulfovibrio Gigas,
Biochim Biophys Res Commun 581, 27-33.
Hansen, T. A. (1994) Metabolism of sulfate-reducing prokaryotes, Antonie Van Leeuwenhoek
66, 165-185.
Hendrickson, W. A., Smith, J. L., Phizackerley, R. P. & Merrit, E. A. (1988) Crystallographic
structure analysis of lamprey hemoglobin from anomalous dispersion of synchrotron
radiation, Proteins 4, 77-88.
Hipp, W. M., Pott, A. S., Thum-Schmitz, N., Faath, I., Dahl, C., and Trüper, H. G. (1997)
Towards the phylogeny of APS reductases and sirohaem sulfite reductases in sulfate-reducing
and sulfur-oxidizing prokaryotes, Microbiology 143, 2891-2902.
Hittel, D. S. & Voordouw, G. (2000) Overexpression, purification and immunodetection of
DsrD from Desulfovibrio vugaris (Hildenborough), Antonie Van Leeuwenhoek 77, 13–22.
Hollemann, A. F. & Wiberg, E. (1985) Lehrbuch der anorganischen Chemie, 91.-100. Aufl.,
Walter de Gruyter, Berlin.
Holm, L., and Sander, C. (1993) Protein structure comparison by alignment of distance
matrices, J Mol Biol 233, 123-138
References
109
Holm, L., and Sander, C. (1993) Protein structure comparison by alignment of distance
matrices, J Mol Biol 233, 123-138
Hoppe, W. (1957) Die Faltmolekülmethode: eine neue Methode zur Bestimmung der
Kristallstruktur bei ganz oder teilweise bekannten Molekülstrukturen, Acta Cryst 10, 750-751.
Huber, R. (1965) Die automatisierte Faltmolekülmethode, Acta Cryst 19, 353-356.
Iverson, T. M., Luna-Chavez, C., Cecchini, G., and Rees, D. C. (1999) Structure of the
Escherichia coli fumarate reductase respiratory complex, Science 284, 1961-1966
Jancarik, J. & Kim, S.-H. (1991) Sparse matrix sampling: a screening method for
crystallization of proteins, J Appl Cryst 24, 409-411.
Janick P. & Siegel L. M. (1983) Electron paramagnetic resonance and optical evidence for
interaction between siroheme and Fe4S4 prosthetic groups in complexes of Escherichia coli
sulfite reductase hemoprotein with added ligands, Biochemistry 22, 504-15.
Janick, P. & Siegel, L. M. (1982) Electron Paramagnetic Resonance and optical Spectroscopic
evidence for interaction between siroheme and Fe4S4 prostetic groups in Escherichia coli
sulfite reductase hemoprotein subunit, Biochemistry 21, 3538-3547.
Janick, P., Rueger, D. C., Krueger, R. J., Barber, M. J., Siegel, L. M. (1983) Characterization
of complexes between Escherichia coli sulfite reductase hemoprotein subunit and its
substrates sulfite and nitrite, Biochemistry 22, 396.
Jones, T., Zou, J., Cowan, S., Kjeldgaard, M. (1998) Improved methods for building protein
models in electron-density maps and the location of errors in these models, Acta Cryst A47,
110-119.
Kabsch, W. (1993) Automatic processing of rotation diffraction data from crystals of initially
unknown symmetry and cell constants, J Appl Cryst 26, 795-800.
Karkhoff-Schweizer, R. R., Huber, D. P., and Voordouw, G. (1995) Conservation of the
genes for dissimilatory sulfite reductase from Desulfovibrio vulgaris and Archaeoglobus
fulgidus allows their detection by PCR, Appl Environ Microbiol 61, 290–296.
References
110
Karplus, P. A. and Schulz, G. E. (1987) Refined structure of glutathione reductase at 1.54 Å
resolution, J Mol Biol 195, 701–729.
Kendrew, J. C., Dickerson, R. E., Strandberg, B. E., Hart, R. G., Davies, D. R., Phillips, D. C.
& Shore, V. C. (1960) Structure of myoglobin; a three-dimensional Fourier synthesis at 2 Å
resolution, Nature 185, 422-427.
Klenk, H. P., Clayton, R. A., Tomb, J. F., White, O., Nelson, K. E., Ketchum, K. A., Dodson,
R. J., Gwinn, M., Hickey, E. K., Peterson, J. D., Richardson, D. L., Kerlavage, A. R.,
Graham, D. E., Kyrpides, N. C., Fleischmann, R. D., Quackenbush, J., Lee, N. H., Sutton, G.
G., Gill, S., Kirkness, E. F., Dougherty, B. A., McKenney, K., Adams, M. D., Loftus, B., and
Venter, J. C. (1997) The complete genome sequence of the hyperthermophilic, sulphate-
reducing archaeon Archaeoglobus fulgidus [published erratum appears in Nature 1998 Jul
2;394(6688):101], Nature 390, 364-370.
Kleywegt, G .J. & Jones, T. A. (1994) in From First Map to Final Model (Bailey, S.,
Hubbard, R. and Waller, D. eds) pp. 59-66 SERC Daresbury Laboratory, Warrington.
Kleywegt, G. J. & Jones, T. A. (1999) Software for handling macromolecular envelopes, Acta
Cryst D55, 941-944.
Kleywegt, G. J. (1996) Use of Non-crystallographic Symmetry in Protein Structure
Refinement, Acta Cryst D52, 842-857.
Kraulis, P. (1991) MOLSCRIPT: a program to produce both detailed and schematic plots of
proteins, J Appl Cryst 24, 946-950.
Kroder, M.-J. (1997) Biochemie und Mikrobiologie der Reduktion von Trithionat und
Thiosulfat in dem sulfatreduzierenden Bakterium Desulfovibrio desulfuricans, Ph. D. Thesis,
Universität Konstanz, Konstanz.
La Fortelle, E. & Bricogne, G. (1997) Maximum- Likelihood Heavy- Atom Parameter
Refinement for Multiple Isomorphous Replacement and Multiwavelength Anomalous
Diffraction Methods, Methods Enzymol 276, 472-494.

References
111
Laemmli, U. K. (1970) Cleavage of structural proteins during the assembly of the head of
bacteriophage T4, Nature 227, 680-685.
Lampreia, J., Pereira, A. S., and Moura, J. J. G. (1994) Adenylylsulfate reductase from
sulfate-reducing bacteria, Methods Enzymol 243, 241-260.
Lancaster, C. R. D., Kröger, A., Auer, M., and Michel, H. (1999) Structure of fumarate
reductase from Wolinella succinogenes at 2.2 Å resolution, Nature 402, 377-385.
Lawson Daku, L. M., Pecaut, J., Lenormand-Foucaut, A., Vieux-Melchior, B., Iveson, P. and
Jordanov, J. (2003) Investigation of the Reduced High-Potential Iron-Sulfur Protein from
Chromatium vinosum and Relevant Model Compounds: A Unified Picture of the Electronic
Structure of [Fe4S4]2+ Systems through Magnetic and Optical Studies, Inorg Chem 42, 6824-
6850.
Lee, J.-P. & Peck, H. D. (1971) Purification of the enzyme reducing trithionate from
Desulfovibrio Gigas and its identification as desulfoviridin, Biochem Biophys Res Commun
45, 583-589.
Lee, J.-P., LeGall, J. & Peck, H. D. (1973) Isolation of Assimilatory- and Dissimilatory-Type
Sulfite Reductases from Desulfovibrio vulgaris, J Bacteriol 115, 529-542.
LeGall, J., and Fauque, G. (1988) Dissimilatory reduction of sulfur compounds, in biology of
anaerobic microorganisms. (Zehnder, A. J. B., Ed.), pp. 587-639, John Wiley and Sons, New
York.
Lennon, B. W., Williams, C. H. & Ludwig, M. (1999) Crystal structure of reduced
thioredoxin reductase from Escherichia coli: Structural flexibility in the isoalloxazine ring of
the flavin adenine dinucleotide cofactor, Protein Science 8, 2366-2379.
Leys, D., Tsapin, A. S., Nealson, K. H., Meyer, T. E., Cusanovich, M. A. & Van Beeumen, J.
J. (1999) Structure and mechanism of the flavocytochrome c fumarate reductase of
Shewanella putrefaciens MR-1, Nat Struct Biol 6, 1113-1117.
Li, J., Nelson, M. R., Peng, C. Y., Bashford, D., and Noodleman, L. (1998) Incorporating
Protein Environments in Density Functional Theory: A Self-Consistent Reaction Field
References
112
Calculation of Redox Potentials of [2Fe2S] Clusters in Ferredoxin and Phthalate Dioxygenase
Reductase, J Phys Chem A 102, 6311-6324.
Lui, S. M., Soriano, A. & Cowan, J. A. (1994) Electronic properties of the dissimilatory
sulfite reductase from Desulfovibrio vulgaris (Hildenborough): comparitative studies of
optical spectra and relative reduction potentials for the [Fe4S4]-sirohaem prostetic centers,
Biochem J 304, 441-447.
Macedo, S., Mitchell, E. P., Romao, C. V., Cooper, S. J., Coelho, R., Liu, M. Y., Xavier, A.
V., LeGall, J., Bailey, S. Garner, C. D. Hagen, W. R., Teixeira, M., Carrondo, M. A. and
Lindley, P. (2002) Hybrid cluster proteins (HCPs) from Desulfovibrio desulfuricans ATCC
27774 and Desulfovibrio vulgaris (Hildenborough): X-ray structures at 1.25 Å resolution
using synchrotron radiation, J Biol Inorg Chem 7, 514-525.
Marritt, S. J. & Hagen, W. R. (1996) Dissimilatory sulfite reductase revisited, Eur J Biochem
238, 724-727.
Massa, W. (1994) Kristallstrukturbestimmung, Teubner Studienbücher: Chemie, Stuttgart.
Massey, V., Müller, F., Feldberg, R., Schuman, M., Sullivan, P. A., Howell, L. G., Mayhew,
S. G., Matthews, R. G., and Foust, G. P. (1969) The reactivity of flavoproteins with sulfite.
Possible relevance to the problem of oxygen reactivity, J Biol Chem 244, 3999-4006.
Maté, M. J., Ortiz-Lombardía, M., Boitel, B., Haouz, A., Tello, D., Susin, S. A., Penninger, J.,
Kroemer, G. and Alzari, P. M. (2002) The crystal structure of the mouse apoptosis-inducing
factor AIF, Nature Struct Biol 6, 442-446.
Mattevi, A., Tedeschi, G., Bacchella, L., Coda, A., Negri, A., and Ronchi, S. (1999) Structure
of L-aspartate oxidase: implications for the succinate dehydrogenase/fumarate reductase
oxidoreductase family, Structure 7, 745-756
Matthews, B. W. (1968) Solvent content of protein crystals, J Mol Biol 33, 491-497.
McPherson, A. (1982) Preparation and analysis of protein crystals, Wiley & Sons, New York.
McRee, D. E. (1993) Practical Protein Crystallography, Academic Press Inc., San Diego.
References
113
Merritt, E. A. & Bacon, D. J. (1997) Raster3D: Photorealistic molecular graphics, Meth
Enzymol 277, 505-524.
Michaels, G. B., Davidson, J. T., and Peck, H. D., Jr. (1970) A flavin-sulfite adduct as an
intermediate in the reaction catalyzed by adenylyl sulfate reductase from Desulfovibrio
vulgaris, Biochem Biophys Res Commun 39, 321-328.
Mizuno, N., Voordouw, G., Miki, K., Sarai, A. & Higuchi, Y. (2003) Crystal Structure of
Dissimilatory Sulfite Reductase D (DsrD) Protein—Possible Interaction with B- and Z-DNA
by Its Winged-Helix Motif, Structure 11, 1133–1140.
Moura, I., LeGall, J., Lino, A. R., Peck, H. D., Fauque, G., Xavier, A. V., DerVartanian, D.
V., Moura, J. J. G., & Huynh, B. H. (1988) Characterisation of Two Dissimilatory Sulfite
Reductases from the Sulfate-Reducing Bacteria. Mössbauer and EPR Studies, J Am Chem Soc
110, 1075-1082.
Müller, F., and Massey, V. (1969) Flavin-sulfite complexes and their structures, J Biol Chem
244, 4007-4016.
Murphy, M. J. & Siegel, L. M. (1973) Siroheme and sirohydrochlorin. The basis for a new
type of porphyrin-related prosthetic group common to both assimilatory and dissimilatory
sulfite reductases, J Biol Chem 248, 6911
Neese, F. (1995) The program EPR, Quantum Chemistry Program Exchange. Bulletin 15:5.
Odom, J. M., and Peck, H. D., Jr. (1981) Localization of dehydrogenases, reductases, and
electron transfer components in the sulfate-reducing bacterium Desulfovibrio gigas, J
Bacteriol 147, 161-169.
Ostrowski, J., Barber, M. J., Rueger, D. C., Miller B. E., Siegel, L. M. & Kredich, N. M.
(1989) Characterization of the flavoprotein moieties of NADPH-sulfite reductase from
Salmonella typhimurium and Escherichia coli. Physicochemical and catalytic properties,
amino acid sequence deduced from DNA sequence of cysJ, and comparison with NADPH-
cytochrome P-450 reductase, J Biol Chem 264, 15726-15808.
References
114
Otwinowski, Z. & Minor, W. (1996) Processing of X-ray diffraction data collected in
oscillation mode, Meth Enzymol 276, 307-326.
Peck, H. D., Jr. & Bramlett, R. N. (1982) Flavoproteins in sulfur metabolism, in Flavins and
Flavoproteins (Massey, V. & Williams, C. H., ed.), Elsevier Science Publishers, Amsterdam
Peck, H. D., Jr. (1959) The ATP-dependent reduction of sulfate with hydrogen in extracts of
Desulfovibrio desulfuricans, Proc Natl Acad Sci USA 45, 701-708.
Peck, H. D., Jr., and LeGall, J. (1994) Inorganic Microbial Sulfur Metabolism, Methods
Enzymol 243.
Peinemann, S., Hedderich, R., Blaut, M., Thauer, R. K., and Gottschalk, G. (1990) ATP
Synthesis coupled to electron transfer from H2 to the heterodisulfide of
2-mercaptoethanesulfonate and 7-mercaptoheptanoylthreonine phosphate in vesicle
preparations of the methanogenic bacterium strain Gö 1, FEBS Lett 263, 57-60.
Perutz, M. F., Rossmann, M. G., Cullis, A. F., Muirhead, H., Will, G. & North, A. C. T.
(1960) Structure of haemoglobin; a three-dimensional Fourier synthesis at 5.5 Å resolution,
obtained by X-ray analysis, Nature 185, 416-422.
Pflugrath, J. W. (1999) The finer things in X-ray diffraction data collection, Acta Cryst D 55,
1718-1725.
Philippsen, A. (2002) DINO: Visualizing Structural Biology http://www.dino3d.org
Pierik, A. J., and Hagen, W. R. (1991) S = 9/2 EPR signals are evidence against coupling
between the siroheme and the Fe/S cluster prosthetic groups in Desulfovibrio vulgaris
(Hildenborough) dissimilatory sulfite reductase, Eur J Biochem 195, 505-516.
Postgate, J. R. (1984) The sulphate reducing bacteria, 2nd ed., Cambridge University Press,
Cambridge.
Rabilloud, T. (1990) Mechanism of protein silver staining in polyacrylamide gels: a ten year
synthesis, Electrophoresis 11, 785-794.
References
115
Rawlings, J., Shah, V. K., Chisnell, J. R., Brill, W. J., Zimmermann, R., Münck, E., Orme-
Johnson, W. H. (1978) Novel metal cluster in the iron-molybdenum cofactor of nitrogenase.
Spectroscopic evidence, J Biol Chem 253, 1001-4.
Roberts, D. L., Freeman, F. E., and Kim, J.-J. P. (1996) Three-dimensional structure of human
electron transfer flavoprotein to 2.1-A resolution, Proc Natl Acad Sci USA 93, 14355-14360
Rossmann, M. G. & Blow, D. M. (1962) The detection of subunits within the crystallographic
asymmetric unit, Acta Cryst 15, 24-31.
Roth, A., Fritz, G., Büchert, T., Huber, H., Stetter, K. O., Ermler, U., and Kroneck, P. M. H.
(2000) Crystallization and preliminary X-ray analysis of adenylylsulfate reductase from
Archaeoglobus fulgidus, Acta Cryst D56, 1673-1675.
Schägger, H. & von Jagow, G. (1987) Tricine-sodium dodecyl sulfate-polyacrylamide gel
electrophoresis for the separation of proteins in the range from 1 to 100 kDa, Anal Microbiol
158, 418-421.
Schidlowski, M. (1986) Evolution of the early sulfur cycle, in Geochemistry of the Earth
surface and process of Mineral Formation, pp. 29-49, Granada.
Schidlowski, M., Hayes, J. M., and Kaplan, I. R. (1983) Isotopic inferences of ancient
biochemistries: carbon, sulfur, hydrogen, and nitrogen, in Earth's earliest biosphere, its origin
and evolution. (Schopf, J. W., Ed.), pp. 149-186, Princeton University Press, Princeton, N.J.
Schiffer, A (2000) Structural and functional investigations on the iron-sulfur flavoenzyme
adenosine 5'-phosphosulfate reductase (APSR) from the sulfate-reducing archaeon
Archaeoglobus fulgidus, Diploma Thesis, Universität Konstanz, Konstanz.
Schneider, T. R., Sheldrick, G. M. (2002) Substructure solution with SHELXD, Acta Cryst D
58, 1772-1779.
Schreuder, H. A., Prick, P. A. J., Wierenga, R. K., Vriend, G., Wilson, K. S., Hol, W. G. J.
and Drenth, J. (1989) Crystal structure of the p-hydroxybenzoate hydroxylase-substrate
complex refined at 1.9 Å resolution. Analysis of the enzyme-substrate and enzyme-product
complexes, J Mol Biol 208, 679–696.
References
116
Siegel, L. M. & Davis, P. S. (1974) Reduced nicotinamide adenine dinucleotide phosphate-
sulfite reductase of enterobacteria. IV. The Escherichia coli hemoflavoprotein: subunit
structure and dissociation into hemoprotein and flavoprotein components, J Biol Chem 249,
1587.
Siegel, L. M., Rueger, D. C., Barber, M. J., Krueger, R. J., Orme-Johnson, N. R., Orme-
Johnson, W. H. (1982) Escherichia coli sulfite reductase hemoprotein subunit. Prosthetic
groups, catalytic parameters, and ligand complexes, J Biol Chem 257, 6343
Smith, P. K., Krohn, R. I., Hermanson, G. T., Mallia, A. K., Gartner, F. H., Provenzano, M.
D., Fujimoto, E. K., Goeke, N. M., Olson, B. J., and Klenk, D. C. (1985) Measurement of
protein using bicinchoninic acid [published erratum appears in Anal Biochem 1987 May
15;163(1):279], Anal Biochem 150, 76-85.
Speich, N., Dahl, C., Heisig, P., Klein, A., Lottspeich, F., Stetter, K. O., and Truper, H. G.
(1994) Adenylylsulphate reductase from the sulphate-reducing archaeon Archaeoglobus
fulgidus: cloning and characterization of the genes and comparison of the enzyme with other
iron-sulphur flavoproteins, Microbiology 140, 1273-1284.
Stetter, K. O., Lauerer, G., Thomm, M., and Neuner, A. (1987) Isolation of extremely
thermophilic sulfate reducers: Evidence for a novel branch of archaebacteria, Science 236,
822-824.
Steuber, J., and Kroneck, P. M. H. (1998) Desulfoviridin, the dissimilatory sulfite reductase
from Desulfovibrio desulfuricans (Essex): new structural and functional aspects of the
membranous enzyme, Inorg Chim Acta 275-276, 52-57.
Steuber, J., Arendsen, A. F., Hagen, W. R., and Kroneck, P. M. (1995) Molecular properties
of the dissimilatory sulfite reductase from Desulfovibrio desulfuricans (Essex) and
comparison with the enzyme from Desulfovibrio vulgaris (Hildenborough), Eur J Biochem
233, 873-879.
Sticht, H., and Rösch, P. (1998) The structure of iron-sulfur proteins, Prog Biophys Mol Biol
70, 95-136

References
117
Stolzenberg, A. M., Strauss, S. H. & Holm, R. H. (1981) Iron(II, III)-Chlorin and -
Isobacteriochlorin Complexes. Models of the Heme Prosthetic Groups in Nitrite and Sulfite
Reductases: Means of Formation and Spectroscopic and Redox Properties, J Am Chem Soc
103, 4763-4778.
Suter, M., von Ballmoos, P., Kopriva, S., Op den Camp, R., Schaller, J., Kuhlemeieer, C.,
Schürmann, P., and Brunold, C. (2000) Adenosine 5'-Phosphosulfate Sulfotransferase and
Adenosine 5'-Phosphosulfate Reductase Are Identical Enzymes, J Biol Chem 275, 930-936.
Terwilliger, T. C. (2001) Maximum-likelihood density modification with pattern recognition
of structural motifs, Acta Cryst D57, 1755-1762
Thauer, R. K., Jungermann, K., and Decker, K. (1977) Energy conservation in chemotrophic
anaerobic bacteria, Bacteriol Rev 41, 100-180.
Thompson, J. D., Gibson, T. J., Plewniak, F., Jeanmougin, F. and Higgins, D. G. (1997) The
CLUSTAL X windows interface: flexible strategies for multiple sequence alignment aided by
quality analysis tools, Nucleic Acids Res 24, 4876–4882.
Trüper, H. G., and Fischer, U. (1982) Anaerobic oxidation of sulfur compounds as electron
donors for bacterial photosynthesis, Philos Trans R Soc Lond B Biol Sci 298, 529-542.
Turner, K. L., Doherty, M. K., Heering, H. A., Armstrong, F. A., Reid, G. A. & Chapman, S.
K. (1999) Redox properties of flavocytochrome c3 from Shewanella frigidimarina
NCIMB400, Biochemistry 38, 3302-3309.
Ullrich, T. C., Blaesse, M. & Huber, R. (2001) Crystal structure of ATP sulfurylase from
Saccharomyces cerevisae, a key enzyme in sulfate activation, EMBO J 20, 316-329
Verhagen, M. F., Kooter, I. M., Wolbert, R. B., and Hagen, W. R. (1994) On the iron-sulfur
cluster of adenosine phosphosulfate reductase from Desulfovibrio vulgaris (Hildenborough),
Eur J Biochem 221, 831-837.
Voordouw, G. (1995) The genus Desulfovibrio: The centennial, Appl Environ Microbiol 61,
2813-2819.

References
118
Wächtershäuser, G. (1988) Pyrite formation, the first energy source for life: a hypothesis, Syst
Appl Microbiol 10, 207-210.
Wagner, M., Roger, A. J., Flax, J. L., Brusseau, G. A., and Stahl, D. A. (1998) Phylogeny of
dissimilatory sulfite reductases supports an early origin of sulfate respiration, J Bacteriol 180,
2975-2982.
Waksman, G., Krishna, T. S. R., Willilams, C. H., & Kuriyan, J. (1994) Crystal structure of
Eschericha coli thioredoxin reductase at 2 Å resolution. Implications for a large
conformational change during catalysis, J Mol Biol 236, 800-816.
Watson, J. D. & Crick, F. H. (1953) Molecular structure of nucleic acids. A structure for
deoxyribose nucleic acid, Nature 171, 737-740.
Watt, G. D. & Reddy, K. R. N. (1994) Formation of an all ferrous Fe4S4 cluster in the iron-
protein-component of Azotobacter vinelandii nitrogenase, J Inorg Biochem 53, 281-294
Weber, M., Suter, M., Brunold, C., and Kopriva, S. (2000) Sulfate assimilationin higher
plants. Characterization of a stable intermediate in the adenosine 5'-phosphosulfate reductase
reaction, Eur J Biochem 267, 3647-3653.
Wolfe, B. M., Lui, S. M. & Cowan, J. A. (1994) Desulfoviridin, a multimeric-dissimilatory
sulfite reductase from Desulfovibrio vulgaris (Hildenborough), Eur J Biochem 223, 79-89.
Yoo, S. J., Angove, H. C., Burgess, B. K., Hendrich, M. P. & Münck, E. (1999) Mössbauer
and Integer-Spin EPR Studies and Spin-Coupling Analysis of the [4Fe-4S]0 Cluster of the Fe
Protein from Azotobacter Vinelandii Nitrogenase, J Am Chem Soc 121, 2534-2545.
Zehr, B. D., Savin, T. J., and Hall, R. E. (1989) A one-step, low background coomassie
staining procedure for polyacrylmide gels, Anal Biochem 182, 157-159.
Zhang, J. and Madden, T. L. (1997) PowerBLAST: a new network BLAST application for
interactive or automated sequence analysis and annotation, Genome Res 7, 649–656.
Appendix
119
6 APPENDIX
6.1 Abbreviations
Å Ångstrøm; 1Å = 10-10m
APS adenosine 5’-phosphosulfate
ATCC American Type Culture Collection
BCA bicinchoninic acid
BSA bovine serum albumine
Da Dalton; 1 Da = 1 g·mol-1
DTT 1,4-dithiothreitol
DTE 1,4-dithioerythritol
DSM Deutsche Sammlung für Mikroorganismen
EDTA ethylenediamine tetraacetic acid
EPR electron paramagnetic resonance
FAD flavin adenine dinucleotide
FPLC fast protein liquid chromatography
OD optical density
PEG polyethylene glycol
PAGE polyacrylamide gel electrophoresis
SDS sodium dodecylsulfate
TCA trichloroacetic acid
TRIS trishydroxymethyl aminoethane
UV/Vis ultraviolet/visible
v/v volume per volume
w/v weight per volume
Appendix
120
6.2 Equations used in X-ray crystallography
Rsym=∑hkl∑i |Ii-<I>| / ∑<I>, Ii intensity of the ith measurement per reflection hkl, <I> average
intensity for a reflection.
Phasing power = r.m.s. F(H) / E, F(H) is the heavy atom structure factor amplitudes and E is
the lack of closure error.
Rcullis=∑hkl(|FPH(obs)| - |FPH(calc)|) / ∑hkl(|FPH(obs)| - |FP(obs)|).
Rcryst= ∑hkl(|F(obs)| - |F(calc)|) / ∑hkl|F(obs)|.
Rfree= ∑hkl(|F(obs)| - |F(calc)|) / ∑hkl|F(obs)|, where 5 % of the observed structure factor
amplitudes are not used for refinement.

Appendix
121
6.3 Curriculum vitae
Personal Data:
Name: Alexander Schiffer
Born: 31.07.1974, Esslingen/Neckar, Germany
Education:
1981-1985 Primary School at Esslingen, Germany
1985-1994 Gymnasium at Esslingen, Germany (Abitur; ∅ 1.5)
1994-2000 Student of Chemistry, Universität Konstanz, Germany
11/1999-04/2000 Diploma thesis, Universität Konstanz: “Untersuchungen zur
Struktur und Funktion des Eisen-Schwefel Flavoproteins
Adenosin-5’-phosphosulfat-Reduktase (APSR) aus dem
sulfatreduzierenden Archaeon Archaeoglobus fulgidus”,
supervisor Prof. P.M.H. Kroneck
04/2000 Diploma (∅ 1.8; “gut”)
08/2000-12/2003 Ph. D. thesis, Universität Konstanz: “Structural and functional
investigations on multi site metallo enzymes of the biological
sulfur cycle”, supervisor Prof. P.M.H. Kroneck
09/2001 EU-ESF Advanced Course “Chemistry of Metals in Biological
Systems”, Louvain-la-Neuve, Belgium
06/2002 Bruker CW EPR training course, Rheinstetten

Appendix
122
6.4 Publications
Schiffer, A., Fritz, G., Büchert, T., Kroneck, P. M. H. & Ermler, U. (2002) The iron-sulfur
flavoenzyme adenylylphosphosulfate reductase – a comparison with structurally related flavin
containing enzymes, in Flavins and Flavoproteins 2002 (14th ed.), pp. 69-75, Rudolf Weber
Agency for Scientific Publications, Berlin, Germany.
Fritz, G., Roth, A., Schiffer, A., Büchert, T., Bourenkov, G., Bartunik, H. D., Huber, H.,
Stetter, K. O., Kroneck, P. M. H. & Ermler, U. (2002) Crystal structure of
adenylylphosphosulfate reductase from A. fulgidus at 1.6Å Resolution, Proc Natl Acad Sci
USA, 1836-1841.
Schiffer, A., Kroneck, P. M. H. & Ermler, U. (2003) Structural insights in the reaction
mechanism of adenylylphosphosulfate reductase, Biochemistry (in preparation).
Schiffer, A., Büchert, T., Huber, H., Stetter, K. O., Kroneck, P. M. H. & Ermler, U. (2003)
Isolation, purification and crystallisation of sulfite reductase from A. fulgidus, Acta. Cryst. (in
preparation).
Schiffer, A., Kroneck, P. M. H. & Ermler, U. (2003) Crystal structure of sulfite reductase:
natures machine for the six-electron reduction from sulfite to sulfide, Structure (in
preparation).

Appendix
123
6.5 Conference abstracts
Schiffer, A., Fritz, G., Roth, A., Büchert, T., Huber, H., Stetter, K.O., Kroneck, P.M.H., and
Ermler, U. (2001) Adenylylsulfate reductase: structure based enzymatic mechanism,
Biospektrum Sonderausgabe 2001, 43.
VW Intra- und intermolekularer Elektronen-Transfer, Chemnitz,
Schiffer, A., Fritz, G., Roth, A., Büchert, T., Huber, H., Stetter, K.O., Kroneck, P.M.H., and
Ermler, U. (2002) Adenylylsulfate reductase: structure based enzymatic mechanism,
Biospektrum Sonderausgabe 2002, 39.
Schiffer, A., Fritz, G., Büchert, T., Kroneck, P.M.H. & Ermler, U. (2002), 14th International
Congress on Flavins and Flavoproteins, Cambridge, UK.
Schiffer, A., Fritz, G., Roth, A., Büchert, T., Huber, H., Stetter, K.O., Kroneck, P.M.H., and
Ermler, U. (2003) Biospektrum Sonderausgabe 2003, 39.

Acknowledgments
124
7 Acknowledgements
Für die erfolgreiche Kooperation möchte ich mich bei folgenden Personen bedanken:
PD Dr. Ulrich Ermler vom Max-Planck-Institut für Biophysik in Frankfurt für die
gemeinsame kristallographische Arbeit an APS Reduktase und Sulfit Reduktase
Dr. Harald Huber und Prof. Dr. Karl-Otto Stetter an der Universität Regensburg für die
Bereitstellung der Zellen von Archaeoglobus fulgidus.
Dr. Gleb Bourenkov und Prof. Dr. Hans D. Bartunnik der MPG am DESY in Hamburg
für die Unterstützung bei der Datensammlung an der Beamline BW6
Für das Gelingen dieser Arbeit war sehr wichtig:
die prompte Hilfe von PD Dr. Kai Diederichs bei vielen kristallographischen Problemen;
die Unterstützung von Frank Neese bei Auswertung, Simulation und Verständnis der
EPR spektren.
Die Förderung der vorliegenden Arbeit durch die Deutsche Forschungsgemeinschaft ist
dankend genannt.

Acknowledgments
125
Vieles wäre unmöglich gewesen ohne ...
die Unterstütung in allen Bereichen und wissenschaftliche Betreuung durch Prof. Dr.
Peter Kroneck;
die wissenschafliche Unterstützung und Betreuung und vielfältigen Anregungen von PD
Dr. Ulrich Ermler;
die gemeinsame Arbeit und Hilfe und Freundschaft der ehemaligen:
Thomas Büchert, Günter Fritz, Dietmar Abt, Oliver Einsle und Petra Stach
und aktuellen Arbeitsgruppe Kroneck:
Alma Steinbach, Marc Rudolf, Holger Niessen, Klaus Sulger, Thorsten Ostendorp
und Michael Koch;
die Abteilung molekulare Membranbiologie des Max-Planck-Institutes für Biophysik in
Frankurt, insbesondere:
Annette Roth, Wolfgang Grabarse, Ulrike Demmer, Eberhard Warkentin, Uli Rehse,
Barbara Schiller, Günter Fritzsch und Hartmut Michel;
die vielfältige Hilfe und Unterstützung meiner Eltern ohne die vieles nicht möglich
gewesen wäre;
die Vertiefungskursstudenten Thomas Waßmer, Christoph Stiehler und Silvia Kestler.
Für anregende Diskussion möchte ich mich bei Prof. Dr. Sandro Ghisla bedanken.
Ganz besonders möchte ich Sandra für die liebevolle Unterstüzung danken.