structural analysis of a wind turbine and its drive train … analysis of a wind turbine and its...
TRANSCRIPT
Structural analysis of a wind turbine and its drive trainusing the flexible multibody simulation technique
J. Peeters1, D. Vandepitte2, P. Sas2
1 Hansen Transmissions International,Leonardo da Vincilaan 1, B-2650 Edegem, Belgiume-mail: [email protected]
2 K.U.Leuven, Department of Mechanical Engineering,Celestijnenlaan 300 B, B-3001, Heverlee, Belgium
AbstractThis article demonstrates the application of a generic methodology, based on the flexible multibodysimulation technique, for the dynamic analysis of a wind turbine and its drive train, including a gearbox. Theanalysis of the complete wind turbine is limited up to 10 Hz, whereas the study of the drive train includesfrequencies up to 1500 Hz. Both studies include a normal modes analysis. The analysis of the drive trainincludes additionally a response calculation for an excitation from the meshing gears, a Campbell analysisfor the identification of possible resonance behaviour and a simulation of a transient load case, which occursas a sudden torque variation caused by a disturbance in the electrical grid.
1 Introduction
During the last decades, the interest for using renewable energy sources for electricity generation increased [1].One of its results is a boom in the wind turbine industry since ten years. Figure 1 shows how the global in-stalled wind power capacity reached 59.3 GW at the end of 2005, of which about 20% had been installedin that year. This rapid growth is expected to continue in the coming years and to drive new technologicalimprovements to further increase the capacity and reduce the cost of wind turbines.
In their design calculations, the wind turbine manufacturers use dedicated software codes to simulate theload levels and variations on all components in their machines. Peeters [3] gives an overview of the existingtraditional simulation codes. He concludes that the concept of the structural model of a wind turbine in allthese codes is more or less similar and that the behaviour of the complete drive train (from rotor hub to gener-ator) is typically represented by only one degree of freedom (DOF). This DOF represents the rotation of thegenerator and, consequently, the torsion in the drive train. Peeters describes additionally the consequencesof using this limited structural model for the simulation of drive train loads. The output of the traditionalsimulations lacks insight in the dynamic behaviour of the internal drive train components. De Vries [4] alsoraises the lack of insight in local loads and stresses in a drive train and the insufficient understanding of thedesign loads. He relates furthermore a series of gearbox failures in wind turbines to these consequencesof simulating with a limited structural model. More insight can be gained from a more detailed simulationapproach. Peeters [3] presents a generic methodology for this, which is based on three multibody system(MBS) modelling approaches.
3665

[MW
]
Figure 1: The evolution of the global cumulative installed wind power capacity from 1995 to 2005 [2].
The first approach is limited to the analysis of torsional vibrations only. The second technique offers amore realistic representation of the bearings and the gears in the drive train and its generic implementationcan be used for both helical and spur gears in parallel and planetary gear stages. The third method is theextension to a flexible MBS analysis, which yields information about the elastic deformation of the drivetrain components in addition to their large overall rigid-body motion. The implementation of the differentmodels was done in LMS DADS Revision 9.6 [5] (DADS). This article presents an application of the secondand third technique for the analysis of a drive train in a wind turbine. This example includes:
• a normal modes analysis for the determination of eigenmodes and eigenfrequencies (1) of the windturbine and (2) in the drive train
• a response calculation for an excitation from the meshing gears
• a Campbell analysis for the identification of possible resonance behaviour
• a simulation of a transient load case
2 Drive train layout and model implementation
Figure 2 shows the wind turbine for the present application. It is a generic example of which the results arerepresentative for a modern wind turbine with a gearbox. The drive train has one main bearing integrated inthe gearbox carrying the wind turbine rotor. The generator is a doubly fed induction generator (DFIG) andthe gearbox design is a combination of two planetary stages with one high speed parallel stage. The windturbine rotor is connected to the planet carrier of the first planetary stage. This stage has spur gears and itsring wheel is fixed in the gearbox housing. This housing is assumed to be rigid as well as its connection tothe bed plate. This latter frame supports also the generator and rests on the yaw bearing, which connectsthe complete nacelle with the tower. The second gear stage in the gearbox is a helical planetary stage. Itsplanet carrier is driven by the sun of the first stage and its ring wheel is also fixed in the gearbox housing.The sun of this stage drives the gear of the third stage, which is a parallel stage with helical gears. The
3666 PROCEEDINGS OF ISMA2006

pinion of this stage rotates at the speed of the generator. A brake disk is mounted on this output shaft and aflexible coupling connects it with the input shaft of the generator. Since only the parallel gear stage causesa change in the direction of rotation, the high speed pinion and the generator rotate in the opposite directionof the rotor. The reaction torque of the gearbox on the bed plate is therefore slightly larger than the inputtorque. This torque acts in the same direction as the rotation of the rotor, which is clockwise when lookingat the wind turbine in the direction of the wind. The torque on the generator support acts in the other direction.
rotor hubCCCC
yaw bearing�����
bed plate������
low speed planetary stage�������
high speed planetary stageCCCCCCC
high speed parallel stage
brake disk
DDDDDDDDDD
flexible coupling�
���
generator
����
Figure 2: Simplified representation of the three bladed wind turbine with a zoom on its drive train.
The model of the wind turbine consists of:
1. a model of the gearbox, which is a system of rigid bodies with six DOFs per body: the formulationsfor the gear contacts and the bearings are based on a synthesis of the work of Kahraman [6] and of Linand Parker [7];
2. a brake disk, which is modelled as an additional body clamped on the pinion;
3. a flexible coupling between the high speed shaft of the gearbox and the generator, which is consideredas very flexible in all directions, except for its torsional deformation and, therefore, it is modelled as atorsional spring;
4. a rigid body with only one rotational DOF to represent the generator: the generator is furthermore freeto rotate;
ROTATING MACHINERY:DYNAMICS 3667

5. a model of the rotor and the tower, which differs depending on the frequency range of the analysis (cfr.below).
1. [ 0 - 10 Hz]For the calculation of the wind turbine’s response in a frequency range up to 10 Hz, which is typicallythe limit in the traditional simulations, it is necessary to include a realistic representation of the struc-tural properties of the rotor and the tower. This is done by using a flexible multibody approach forthese bodies. Both the rotor and the tower have six rigid-body DOFs and, furthermore, an extra set ofDOFs to represent the internal deformations of these components. The latter DOFs of the so-calledflexible bodies are derived from an FE model of the rotor and the tower respectively, using the CMStechnique [8, 9]. The set of component modes is composed such that it accurately represents the dy-namic behaviour of the individual components up to 10 Hz. This requires a consideration of four pairsof normal bending modes for each blade and the first ten normal modes of the tower. The remainderof this article describes the results of a normal modes analysis for this model.
2. [ 10 - 1500 Hz]The analysis of the drive train loads in a frequency range up to 1.5 kHz1 requires - in theory - theconsideration of all rotor and tower modes up to approximately 3 kHz. However, since this is an im-practicable task and since both the rotor and the tower have more than ten modes below this frequencyrange, it is assumed that they will act as a large inertia with respect to an excitation at higher frequen-cies. Therefore, instead of adding two flexible bodies for the rotor and the tower, only one rigid bodywith six DOFs is included to represent the large inertia of the rotor. The tower is considered as a rigidground, which supports the gearbox and the generator. This implies no need for an additional body torepresent the tower. The remainder of this article describes three types of analysis for this model: anormal modes analysis, a frequency response analysis and a transient load simulation.
3 Discussion of the analyses
3.1 Low frequency range: [ 0 - 10 Hz]
Table 1 summarises the normal modes calculated for the flexible multibody model of the wind turbine inthe frequency range [ 0 - 10 Hz]. These results correspond to the typical results, which can be calculatedin a traditional wind turbine simulation code. The 8th, 14th and 23rd mode are the respective rotor torsionmodes or drive train modes. These modes have the biggest influence on the torque in the drive train and aredetermined by a combined effect of the following parameters, as demonstrated by Peeters [3]:
1. the (distributed) rotor inertia and flexibility (including the pitch angle and rotor position)
2. the drive train stiffness
3. the generator inertia
4. the coupling between the drive train and the tower top (e.g. the gearbox support and the generatorcharacteristic)
5. the (distributed) tower inertia and flexibility
1This work focusses on a range up to 1.5 kHz, which is considered to be more than sufficient, since 1 kHz is generally themaximum for the gear mesh excitation frequencies.
3668 PROCEEDINGS OF ISMA2006
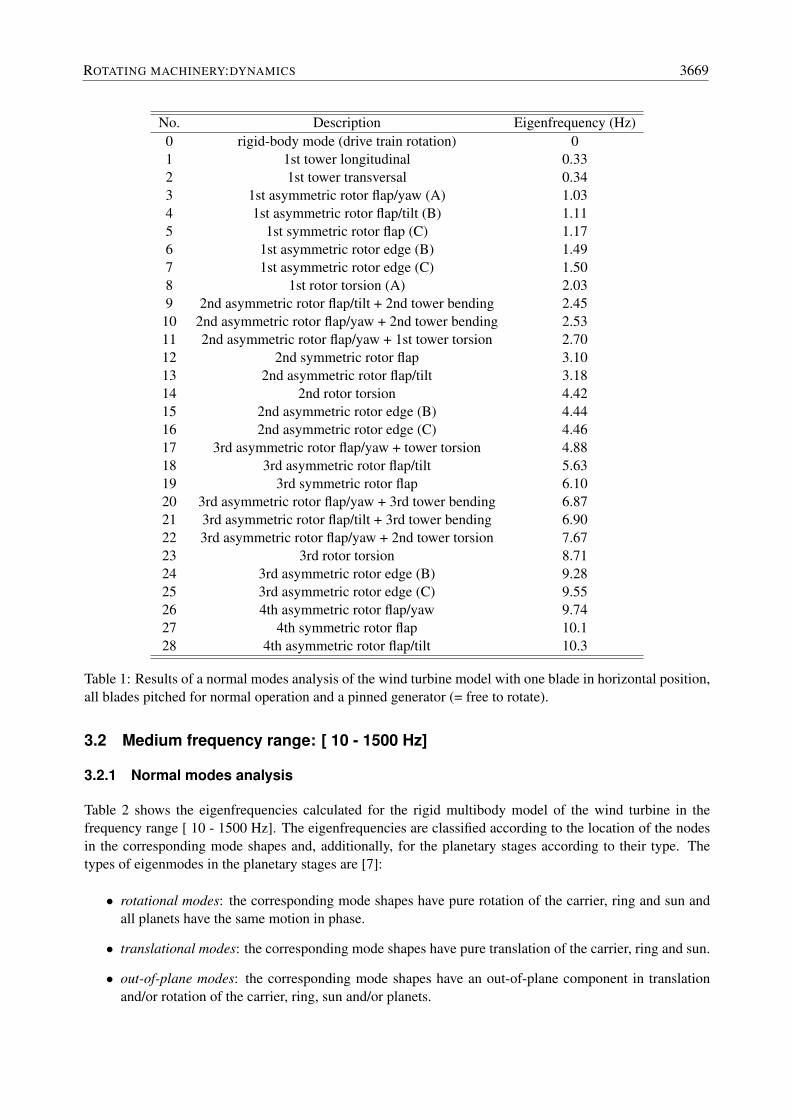
No. Description Eigenfrequency (Hz)0 rigid-body mode (drive train rotation) 01 1st tower longitudinal 0.332 1st tower transversal 0.343 1st asymmetric rotor flap/yaw (A) 1.034 1st asymmetric rotor flap/tilt (B) 1.115 1st symmetric rotor flap (C) 1.176 1st asymmetric rotor edge (B) 1.497 1st asymmetric rotor edge (C) 1.508 1st rotor torsion (A) 2.039 2nd asymmetric rotor flap/tilt + 2nd tower bending 2.4510 2nd asymmetric rotor flap/yaw + 2nd tower bending 2.5311 2nd asymmetric rotor flap/yaw + 1st tower torsion 2.7012 2nd symmetric rotor flap 3.1013 2nd asymmetric rotor flap/tilt 3.1814 2nd rotor torsion 4.4215 2nd asymmetric rotor edge (B) 4.4416 2nd asymmetric rotor edge (C) 4.4617 3rd asymmetric rotor flap/yaw + tower torsion 4.8818 3rd asymmetric rotor flap/tilt 5.6319 3rd symmetric rotor flap 6.1020 3rd asymmetric rotor flap/yaw + 3rd tower bending 6.8721 3rd asymmetric rotor flap/tilt + 3rd tower bending 6.9022 3rd asymmetric rotor flap/yaw + 2nd tower torsion 7.6723 3rd rotor torsion 8.7124 3rd asymmetric rotor edge (B) 9.2825 3rd asymmetric rotor edge (C) 9.5526 4th asymmetric rotor flap/yaw 9.7427 4th symmetric rotor flap 10.128 4th asymmetric rotor flap/tilt 10.3
Table 1: Results of a normal modes analysis of the wind turbine model with one blade in horizontal position,all blades pitched for normal operation and a pinned generator (= free to rotate).
3.2 Medium frequency range: [ 10 - 1500 Hz]
3.2.1 Normal modes analysis
Table 2 shows the eigenfrequencies calculated for the rigid multibody model of the wind turbine in thefrequency range [ 10 - 1500 Hz]. The eigenfrequencies are classified according to the location of the nodesin the corresponding mode shapes and, additionally, for the planetary stages according to their type. Thetypes of eigenmodes in the planetary stages are [7]:
• rotational modes: the corresponding mode shapes have pure rotation of the carrier, ring and sun andall planets have the same motion in phase.
• translational modes: the corresponding mode shapes have pure translation of the carrier, ring and sun.
• out-of-plane modes: the corresponding mode shapes have an out-of-plane component in translationand/or rotation of the carrier, ring, sun and/or planets.
ROTATING MACHINERY:DYNAMICS 3669
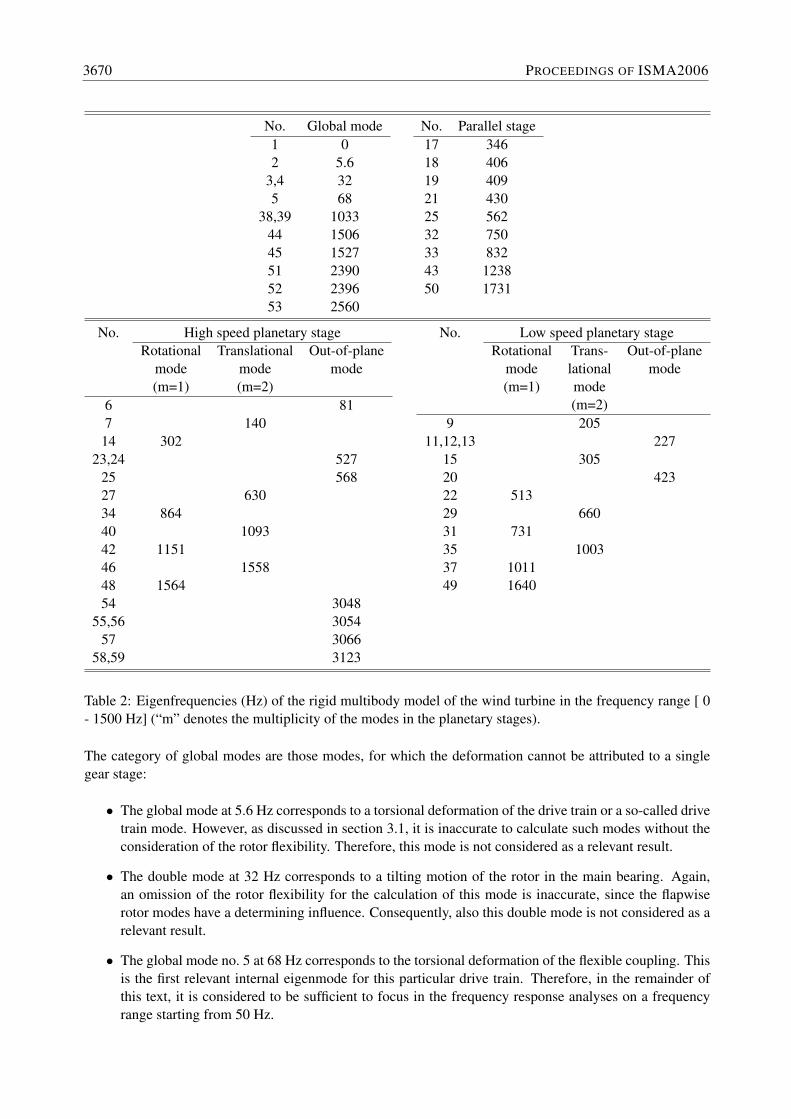
No. Global mode1 02 5.6
3,4 325 68
38,39 103344 150645 152751 239052 239653 2560
No. Parallel stage17 34618 40619 40921 43025 56232 75033 83243 123850 1731
No. High speed planetary stageRotational Translational Out-of-plane
mode mode mode(m=1) (m=2)
6 817 140
14 30223,24 527
25 56827 63034 86440 109342 115146 155848 156454 3048
55,56 305457 3066
58,59 3123
No. Low speed planetary stageRotational Trans- Out-of-plane
mode lational mode(m=1) mode
(m=2)9 205
11,12,13 22715 30520 42322 51329 66031 73135 100337 101149 1640
Table 2: Eigenfrequencies (Hz) of the rigid multibody model of the wind turbine in the frequency range [ 0- 1500 Hz] (“m” denotes the multiplicity of the modes in the planetary stages).
The category of global modes are those modes, for which the deformation cannot be attributed to a singlegear stage:
• The global mode at 5.6 Hz corresponds to a torsional deformation of the drive train or a so-called drivetrain mode. However, as discussed in section 3.1, it is inaccurate to calculate such modes without theconsideration of the rotor flexibility. Therefore, this mode is not considered as a relevant result.
• The double mode at 32 Hz corresponds to a tilting motion of the rotor in the main bearing. Again,an omission of the rotor flexibility for the calculation of this mode is inaccurate, since the flapwiserotor modes have a determining influence. Consequently, also this double mode is not considered as arelevant result.
• The global mode no. 5 at 68 Hz corresponds to the torsional deformation of the flexible coupling. Thisis the first relevant internal eigenmode for this particular drive train. Therefore, in the remainder ofthis text, it is considered to be sufficient to focus in the frequency response analyses on a frequencyrange starting from 50 Hz.
3670 PROCEEDINGS OF ISMA2006

• The out-of-plane modes in the low speed planetary stage (at 227 Hz and 443 Hz) are further notconsidered to be relevant, since they cannot be excited by lack of axial forces on the spur gears in thisstage.
3.2.2 Frequency response analysis
This section describes how the results of the normal modes analysis should be interpreted in order to avoidresonance and, furthermore, it demonstrates how the drive train loads can be simulated for a sinusoidal loadexcitation. Both analyses imply a calculation of the frequency response.
In order to avoid resonance, it is important to know which eigenmodes can considerably influence the loadsin the drive train. This means that in one way or another there should be a coupling between these modesand a source of excitation. One known excitation source is the once-per-tooth pattern in a gear mesh, whichexcites at the so-called gear mesh frequency [10]. The coupling with such an excitation can be estimatedfrom a detailed interpretation of the mode shapes, although, this is not straightforward. An easier methodis to calculate a frequency response function (FRF) between the gear mesh excitation and a specific loadin the drive train and check which eigenmodes lead to amplified load levels. This is demonstrated for thegear mesh excitation in the high speed planetary stage. The excitation is considered here as a variation ofan input torque at the high speed sun. The input torque is a multisine with a minimal frequency of 50 Hz,according to the statement above. The upper frequency limit is 2.0 kHz, which guarantees a proper excitationat all frequencies in the range from 50 to 1.5 kHz. Figure 3 shows the spectrum of the multisine signal. TheDADS solver calculates the output loads for this signal using a time integration procedure. A maximumtime step of 0.0001 second is chosen. The numerical integration is only possible with a certain amount ofdamping in the drive train, which is included by adding a viscous damper element to the DADS model. Thedamping defines the amplitudes of the response, especially at the eigenfrequencies. Since the determinationof the damping values is not within the scope of this analysis, the responses are only considered qualitatively.
Frequency [Hz]
PSD
[dB
/Hz]
Figure 3: Power spectrum of the torque excitation signal used in the FRF calculations.
Figure 4 shows the FRFs calculated for the torque excitation of the sun in the high speed planetary stage.The torque on the high speed pinion and on the two suns are the respective outputs in these calculations.Note that the FRF to the torque at the high speed sun is a direct FRF. The maximum frequency in these plotsis only 1.0 kHz, since no relevant amplified torque levels are identified at higher frequencies. The analysisof these results, leads to the following conclusions:
ROTATING MACHINERY:DYNAMICS 3671

Frequency [Hz]
PSD
[dB
/Hz]
(a) FRF to the torque at the high speed pinion.
Frequency [Hz]
PSD
[dB
/Hz]
(b) FRF to the torque at the high speed sun.
Frequency [Hz]
PSD
[dB
/Hz]
(c) FRF to the torque at the low speed sun.
Figure 4: Response calculation for a gear mesh excitation in the high speed planetary stage, which is appliedas a sinusoidal torque excitation of the high speed sun.
3672 PROCEEDINGS OF ISMA2006

1. For the high speed pinion, mainly the local modes at 430 Hz and at 562 Hz are dominant in the torqueresponse (cfr. figure 4(a)).
2. The direct FRF to the torque on the sun of the high speed planetary stage, indicates that mainly thelocal modes in the parallel stage, at 346 Hz and 430 Hz respectively, can lead to a considerable torqueamplification (cfr. figure 4(b)). This indicates the importance of analysing the drive train as a whole.The analysis of an individual gear stage yields insight in its local modes, but it does not permit todetermine the mutual interaction between dynamic loads in different stages.
3. The torque spectrum at the low speed sun is dominated by one local mode in the parallel stage (346 Hz),one translational mode in the low speed planetary stage (305 Hz) and by six local modes in the range[ 500 - 700 Hz].
4. The global modes at 68 Hz and 140 Hz contribute also to the torque response in the different gearstages, albeit considerably less than the so-called local modes.
The excitation signal used in this analysis has a broadband spectrum in order to get an overall idea aboutwhich eigenmodes can lead to amplified torque levels. However, for a particular speed of the drive train,the gear mesh excitation frequency in the high speed planetary stage is exactly known. This permits todetermine whether it coincides with an important eigenfrequency. Figure 5 demonstrates this procedure. Itis a Campbell diagram, which indicates how the gear mesh frequency varies with the rotational speed of therotor in the wind turbine. In addition to the actual gear mesh frequency, its first and second harmonic are alsoplotted as excitation frequencies. The eigenfrequencies included in this figure are the horizontal lines, whichcorrespond to the dominating peaks from the direct FRF in figure 4(b). These frequencies are considered asthe only important frequencies for this excitation with respect to possible torque amplifications in this gearstage. The intersection of lines indicate possible resonances. For a fixed-speed wind turbine the focus canbe limited to a single speed. However, modern variable-speed wind turbines require the consideration of acertain speed range. For the present example, two cursors indicate such a speed range for the wind turbinerotor from 10 to 20 RPM. In this range, the following intersections are found:
1. the gear mesh frequency intersects the eigenfrequency at 140 Hz;
2. the first harmonic intersects the eigenfrequency at 302 Hz;
3. the second harmonic intersects four eigenfrequencies above 300 Hz.
The results from this analysis are valuable input for assessing whether or not a drive train resonance canoccur as a result of this excitation. The same analysis can be performed for other excitations and with thefocus on other loads. It is obvious that avoiding all intersections between excitations and eigenfrequencies ina quite broad speed range is impossible. However, keeping in mind that the actual gear mesh frequencies areusually more important than their harmonics, the insights from the calculated FRFs yield already valuableinformation for the evaluation of a drive train design in order to avoid severe resonances. To gain more ex-perience in this evaluation and, more generally, to gain further confidence in the present analysis techniquesand their results, it is recommended to perform sufficient experimental validation measurements.
A more detailed numerical investigation of the intersections in the Campbell diagram at a particular fre-quency, requires a prediction of the amplified load levels. This simulation requires an accurate considerationof the drive train damping values and an appropriate description of the excitation signal, which representsthe transmission error in the gear mesh. Since this is not within the scope of the present article, the loadsimulation at resonance is not further elaborated.
ROTATING MACHINERY:DYNAMICS 3673

Rotor speed [RPM]
Eig
enfr
eque
ncie
s[H
z]
Figure 5: Campbell diagram which indicates the position of the gear mesh frequency and its harmonics(inclined lines) of the second gear stage for a varying rotor speed, in comparison to the dominant eigen-frequencies (horizontal lines) from the direct torque response function in figure 4(b). The cursors (verticallines) indicate the speed range during operation.
3.2.3 Simulation of a transient load case
This section demonstrates how the load simulation with a detailed drive train model yields the desired insightin its behaviour and gives much more and more accurate information than obtained with the simulations inthe traditional wind turbine design codes. For the present demonstration, the simulation of a transient loadcase is used. An accurate description of the external forces during a transient load case requires a completemodel of the wind turbine system, including a model for the generator, for the aerodynamics, . . . Since thesemodels are not available, an assumption is made here for the load excitation. This is sufficient for the presentillustration. An integration of the presented drive train model in a traditional wind turbine design code canhelp in further refining the load simulations.
The simulated transient load case includes a sudden torque variation at the generator with a high amplitude.This phenomenon can have various causes, such as disturbances in the electrical grid as described by Soenset al [11] and Seman et al [12, 13]: e.g. frequency disturbances, a voltage dip or swell and a network shortcircuit. In the present example, the torque variation occurs during a start-up of the wind turbine. This meanthat the generator torque would normally be increasing as shown in figure 6(a). Firstly, the simulation is donefor this reference signal, i.e. without the sudden torque peak. The slope of this signal equals 1 kNm/secondand the time series has a length of 1 second. Subsequently, the torque variation is added at t = 0.5 s, whichis visible in figure 6(b). The shape and the duration of the torque variation may largely differ for variousgrid disturbances and is furthermore highly dependent on the type of generator. Here, a damped sinusoidalvariation with a frequency of 20 Hz is considered; it has a duration of two periods (100 ms) and a maximumamplitude of 9.1 kNm. This example is based on the description in [13] of the generator torque variationduring a network short circuit in a DFIG with an over-current protection system.
3674 PROCEEDINGS OF ISMA2006

(a) 1st load case: a normal start-up (reference signal) (b) 2nd load case: a grid disturbance during start-up
Figure 6: Generator torque used in the simulations of two transient load cases.
Figure 7 shows a comparison of the simulations calculated for the two load cases. In this example, the focusis put on:
1. the level of the torque, which acts on the pinion of the high speed stage
2. the rotational acceleration of the pinion in its bearings
3. the axial displacement of the pinion in its bearings
The comparison of the two load cases in figure 7 yields the following conclusions:
• The sudden torque peak in the generator torque, as a result of the grid disturbance, causes a torquepeak at the pinion. The level of this latter peak equals 2.5 kNm, which is about 3.5 times lower thanthe level of the torque peak in the generator. Further experimental validation of the numerical modelsand a proper consideration of the damping in the drive train is required to assess the accuracy of thisabsolute level. This level depends furthermore on the type of coupling used in the drive train, asexplained below.The sudden impact in the drive train excites moreover the 1st drive train mode of the wind turbine. As aresult, various torque reversals occur during this start-up. This may lead to backlashing in the bearings(cfr. below), which should be investigated for the bearing design. Note that a proper simulation of the1st drive train mode requires the consideration of the rotor and the tower flexibility as described insection 3.1.
• The grid disturbance and resulting torque variation cause the pinion to accelerate rapidly in its bearings.The acceleration peak level in this example is about 30 times higher than during the normal start-up. This should also be considered with care in the design of the bearings as well as the negativeacceleration, which follows rapidly after the positive acceleration peak. In the resulting variation ofthe acceleration, the eigenmode at 68 Hz is clearly visible, which corresponds to the deformation ofthe flexible coupling.
• Since the investigated model includes linear bearing models, the axial displacement of the pinionfollows the torque variation. This implies that the displacement peaks when the torque peak occurs.Subsequently, it becomes negative. Under the assumption that the drive train is at no load conditionsfor a displacement value of 0 µm the change in sign for the displacement corresponds to passing theclearance at the pinion. The simulation of this so-called backlashing may be further improved by usinga non-linear bearing model, including clearance.
ROTATING MACHINERY:DYNAMICS 3675

(a) Torque at the pinion of the high speed stage
(b) Rotational acceleration of the pinion (high speed stage) in its bearings
(c) Axial displacement of the pinion (high speed stage) in its bearings (0 µmcorresponds to no load)
Figure 7: Comparison of the results calculated for two transient load cases (dashed: normal start-up; solid:grid disturbance).
3676 PROCEEDINGS OF ISMA2006

The presented analyses are further elaborated by investigating the influence of the stiffness of the flexiblecoupling on the level of the torque and the acceleration at the pinion. This demonstrates how the multibodysimulation approach can be used as an effective tool to assess the influence of design changes. Figure 8 showsthe simulated torque and acceleration signals for the original coupling (A), for a coupling with a stiffnessvalue of 10% (B) and of 1000% (C) of the original. The absolute stiffness values of the three couplings areshown in table 3, including the dimensions of a hypothetical steel shaft which has this stiffness.
Coupling Stiffness Length Diameter[MNm/rad] [m] [mm]
A 1.4 0.5 97B 0.14 1 65C 14 0.3 155
Table 3: Stiffness values for the three flexible couplings used in the transient simulation. The dimensions(length and diameter) of a hypothetical steel shaft with a corresponding stiffness are included.
(a) Torque at the pinion of the high speed stage
(b) Rotational acceleration of the pinion (high speed stage) in its bearings
Figure 8: Comparison of the simulations for three different couplings: solid: original coupling (A); dashed:lower stiffness (B); dotted: higher stiffness (C).
ROTATING MACHINERY:DYNAMICS 3677
A comparison of the simulations for the three couplings yields the following conclusions.
• The level of the torque peak at the pinion decreases when a coupling with a lower stiffness (B) is used.In the present example, the peak is 1.6 times lower than for the original coupling (A). On the otherhand, using a coupling with a higher stiffness (C), yields a higher torque peak. In the present example,the maximum torque level is 5% higher.
• The maximum level of the rotational acceleration of the pinion in its bearings is for both additionalcouplings lower than for the original coupling.
4 Conclusions
This article starts from the statement that the output of the simulations with traditional wind turbine designcodes lacks insight in the dynamic behaviour of the internal drive train components. It demonstrates subse-quently how the multibody simulation technique can be used to gain more insight. The particular exampleconsists of a drive train with a single main bearing integrated in the gearbox and a DFIG. It is a three stagegearbox with one spur planetary gear stage, one helical planetary gear stage and one helical parallel gearstage. The dynamic analysis of this drive train is split up into the frequency ranges [ 0 - 10 Hz] and [ 10 -1500 Hz]. For the study in the former range, a flexible multibody model with an accurate description of therotor, the tower and the complete drive train is analysed. All eigenmodes of this model are described andthose modes which have the biggest influence on the torque - the so-called drive train modes - are indicated.
In the latter frequency range, the focus is limited on the local eigenmodes in the drive train. The analysedmodel includes a rigid body with a large inertia to represent the rotor and no additional body for the tower,since this acts as a rigid supporting structure in this frequency range. The coupling with the generator isincluded as a torsional spring element between the gearbox output shaft and the discrete mass of the gen-erator. This final model of the drive train in the wind turbine has about 70 DOFs and has its first relevanteigenfrequency at 68 Hz. A frequency response analysis in the range [ 50 - 1500 Hz] for a torque excitationat the gear mesh in the high speed planetary gear stage, indicates the importance of the different eigenmodesfor the torque in the drive train during this excitation. Based on the calculated FRFs, a set of eigenmodes,which can lead to amplified torque levels, is identified and, subsequently, compared with possible excitationfrequencies in a Campbell diagram to identify possible drive train resonances. In addition, the frequencyresponse analyses demonstrate how the loads in the drive train can be simulated for a sinusoidal load exci-tation. Finally, the investigation of two transient load cases demonstrates how a disturbance, which causesa torque variation with a high amplitude in the generator torque, yields a torque peak on the pinion of thehigh speed stage, high rotational acceleration levels for the bearings of the pinion and an oscillating axialdisplacement of the pinion in its bearings. A sensitivity analysis indicates how a flexible coupling with alower stiffness value can reduce the amplitude of the torque peak on the pinion.
This article demonstrates the simulation of a transient load case for a particular disturbance in the electricitygrid. Since the accuracy of the predicted load levels in a transient analysis depend highly on the accuracy ofthe load excitation, it is recommended to further investigate the occurrence and the appropriate descriptionof such excitations during realistic load cases. The most efficient solution for this problem seems to be anintegration of the extended drive train model in one of the existing wind turbine design codes, since thesecodes contain usually most of the desired features to describe the applied loads on the wind turbine.
References
[1] W. D’haeseleer. Energie vandaag en morgen : Beschouwingen over energievoorziening en -gebruik.Leuven : Acco, 2005.
3678 PROCEEDINGS OF ISMA2006

[2] GWEC. Global Wind Report. 2006.
[3] J. Peeters. Simulation of dynamica drive train loads in a wind turbine. PhD dissertation, K.U.Leuven,Department of Mechanical Engineering, Division PMA, Leuven (Heverlee), Belgium, 2006. availableonline: http://hdl.handle.net/1979/344.
[4] E. De Vries. Trouble spots: Gearbox failures and design solutions. Renewable Energy World, 9(2):37–47, 2006.
[5] LMS. DADS Revision 9.6 Documentation. LMS International, Belgium, 2000.
[6] A. Kahraman. Effect of axial vibrations on the dynamics of a helical gear pair. Journal of Vibration andAcoustics, 115:33–39, 1993.
[7] J. Lin and R. G. Parker. Analytical Characterization of the Unique Properties of Planetary Gear FreeVibration. Journal of Vibration and Acoustics, 121:316–321, 1999.
[8] R. R. J. Craig. Structural dynamics. John Wiley & Sons, Inc., 1981.
[9] R. R. J. Craig. A review of time-domain and frequency-domain component-mode synthesis methods.International Journal of Analytical and Experimental Modal Analysis, 2(2):59–72, 1987.
[10] J. D. Smith. Gears and their vibration. Marcel Dekker, New York and MacMillan, London, 1983.
[11] J. Soens, J. Driesen, and R. Belmans. Interaction between Electrical Grid Phenomena and the WindTurbine’s Behaviour. Proceedings of The International Conference on Noise and Vibration Engineering(ISMA2004), pp. 3969-3988, Leuven, Belgium, September 20-22, 2004.
[12] S. Seman, J. Niiranen, S. Kanerva, and A. Arkkio. Analysis of a 1.7 MVA Doubly Fed Wind-PowerInduction Generator during Power Systems Disturbances. Proceedings of the Nordic Workshop on Powerand Industrial Electronics (NORPIE/2004), Trondheim, Norway, June 14-16, 2004.
[13] S. Seman, S. Kanerva, J. Niiranen, and A. Arkkio. Transient Analysis of Doubly Fed Power InductionGenerator Using Coupled Field-Circuit Model. Proceedings of the 16th International Conference onElectrical Machines, Krakow, Poland, September 5-8, 2004.
ROTATING MACHINERY:DYNAMICS 3679

3680 PROCEEDINGS OF ISMA2006