strontium isotopes as indicators of aquifer …geofaculty.uwyo.edu/cfrost/pdfs/2008 campbell et al...
TRANSCRIPT

Rocky Mountain Geology, v. 43, no. 2, p. 149–175, 14 figs., 2 tables, November, 2008 149
Strontium isotopes as indicators of aquifer communication in an area of coal bed natural gas production, Powder River Basin, Wyoming and Montana
Catherine E. Campbell1,2, Benjamin N. Pearson1,3, and Carol D. Frost1*
1Department of Geology and Geophysics, The University of Wyoming, Dept. 3006, 1000 East University Avenue, Laramie,
Wyoming 82071, U.S.A.2EnCana Oil and Gas (USA) Inc., 370 17 thStreet, Suite 1700, Denver, Colorado 802023Crimson Exploration, 717 Texas Avenue, Suite 2900, Houston, Texas 77002
*Correspondence should be addressed to: [email protected].
ABSTRACT
Development of the coal-bed natural gas resource of the Powder River Basin of Wyoming and Montana has proceeded rapidly, from fewer than 200 wells in 1995 to more than 22,000 wells in 2007. Continued development of this resource will depend on minimization of water production during gas recovery as well as responsible use of the produced water. Ideally, water should be withdrawn only from isolated coal aquifers to prevent any unnecessary water withdrawal from overlying or underlying aquifers. This study uses the ratio of 87Sr/86Sr of ground water to identify hydraulically isolated coal seams. The ratio of 87Sr/86Sr of ground water represents a time-integrated record of water–rock interaction, such that water from aquifers composed of different rocks may acquire different Sr isotopic ratios.
Sr isotopic data are presented for 145 samples of ground water co-produced with coal-bed natural gas and 14 water samples from wells completed in sandstone aquifers in the Powder River Basin. The coal zone from which each sample was collected was determined by analysis of gamma logs and correlation with the Wyoming State Geological Survey database.
The Sr isotopic ratios and geochemical compositions of ground waters from coal in the Powder River Basin of Wyoming are influenced by a number of factors, including the coal zone from which ground waters are pro-duced, their residence time, the degree to which coal aquifers are confined, and geographic location. The data indicate that the Upper Wyodak coal-zone aquifer in the Gillette and Schoonover areas in the eastern Powder River Basin appears to be a well-confined, combined sand and coal aquifer unit. In contrast, the Wyodak Rider coal zone aquifer may be only partially confined, allowing interactions between sandstone and possibly other coal aquifers. Wells in this area exhibit highly variable Sr isotope ratios and total dissolved solids, and they also are characterized by greater than average water/gas production ratios, consistent with incomplete isolation of the Wyodak Rider coal zone. Faults in the northeastern part of the Powder River Basin may affect aquifer connectiv-ity, either by acting as seals or conduits. Higher gas production correlates with lower Sr isotopic ratios in this part of the basin. Although a correlation between Sr isotopic ratios of produced water with fracture pattern developed during the well enhancement process might be expected, no strong relationship was observed. Evidently there are many factors in addition to fracture pattern that control interactions between aquifers.
KEY WORDS: aquifer communication, coal-bed natural gas, Powder River Basin, produced water, sodium-adsorption ratio, strontium isotopes, water quality.
INTRODUCTION
The Powder R iver Basin of northeastern Wyoming and southeastern Montana is one of the most significant energy-producing regions of the
United States. Powder River Basin coal provides approximately 40 percent of all the coal consumed in the nation annually (473 million short tons in 2006; Bureau of Land Management-Wyoming; Energy Information Administration Coal Report for 2006).

150 Rocky Mountain Geology, v. 43, no. 2, p. 149–175, 14 figs., 2 tables, November, 2008
C. E. CAMPBELL, B. N. PEARSON, AND C. D. FROST
These Tertiary-age, nonmarine subbituminous coals are valued for their low sulfur (~0.5% S) and ash (6–7%) contents (Ellis, 1999; Lyman and Hallberg, 2000). Powder River Basin coals also host an impor-tant natural gas resource. Economically recoverable reserves in the Wyoming parts of the Powder River Basin are estimated at 25.2 trillion cubic feet (Bank and Kuuskraa, 2006), approximately 10–15 percent of the United States’ natural gas reserve. Production of this resource requires drilling a well to the target coal seam, typically less than 2000 feet, under-ream-ing the coal to create a large void, installation of a submersible pump, and removing water from the coal seam to reduce hydrostatic pressure, allowing the methane to desorb and rise up the annular space of the cased well (DeBruin and Lyman, 1999). After an initial period of water production, a typical well pro-duces 60,000 cubic feet (60 Mcf, 1700 cubic meters) of methane per day and 4,500 gallons (17,000 liters) of water per day (based on January, 2007 data from the Wyoming Oil and Gas Conservation Commission,
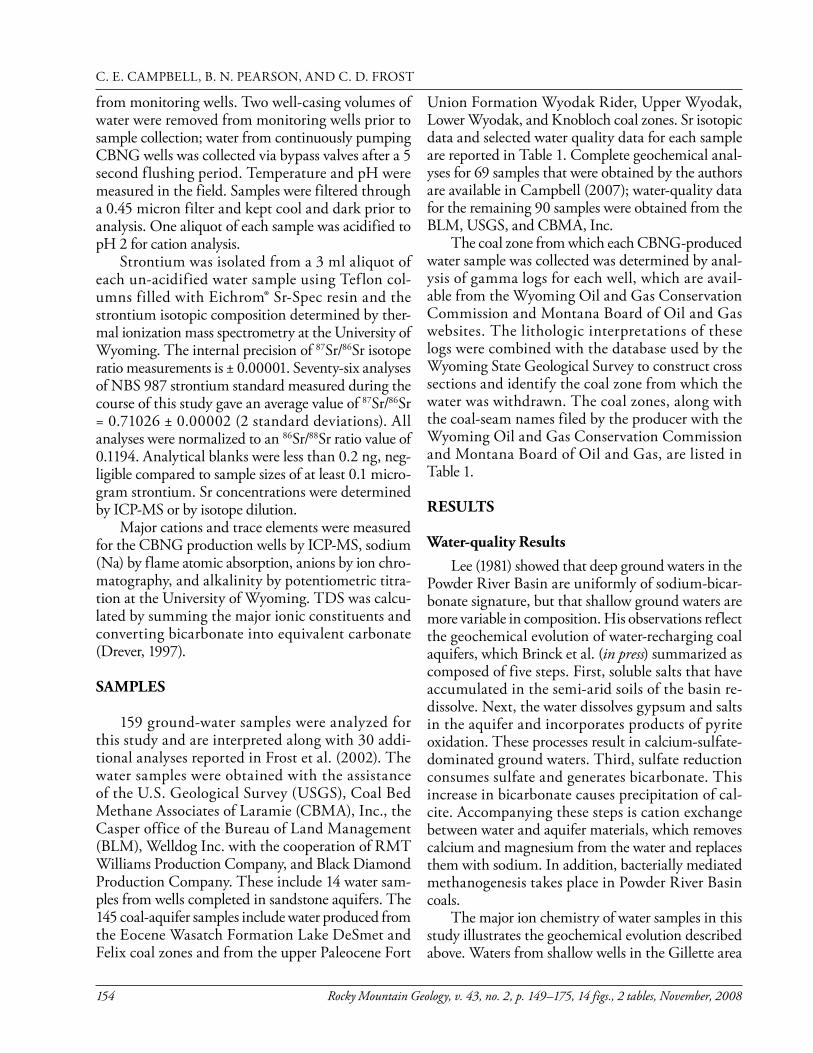
2007). Total production in the Powder River Basin as of January, 2007 is approximately 1,033,000 Mcf (29,250,000 cubic meters) of methane per day and 78.2 million gallons (296 million liters) of water per day (Wyoming Oil and Gas Conservation Commission, 2007). The natural-gas resource developed rapidly. In Wyoming, the number of coal-bed natural gas (CBNG) wells has increased from 152 wells in 1995 to more than 22,000 wells in 2007 (Fig. 1; Surdam et al., 2007; Wyoming State Geological Survey Coal Section, 2007). However, more recently the pace of development has slowed due to concerns about ben-eficial use and proper disposal of co-produced water (Bank and Kuustraa, 2006). Water is a valuable commodity in this semi-arid region, and produc-tion of ground water from coal seams may decrease water availability for agricultural and domestic use in areas adjacent to CBNG activity. In 2003 (and amended in 2006), the State of Montana issued stan-dards for water quality in the Powder, Little Powder, Tongue River, and Rosebud Creek watersheds
Figure 1. Water and gas production in Powder River Basin, 1994–2006. Although the number of producing wells continues to increase, water and gas production has remained fairly constant since 2002. Data from Wyoming Oil and Gas Conservation Commission.

Rocky Mountain Geology, v. 43, no. 2, p. 149–175, 14 figs., 2 tables, November, 2008 151
SR ISOTOPES IN WATER CO-PRODUCED WITH COAL BED NATURAL GAS
(Administrative Rule of Montana 17.30.1670, 2007). Because CBNG co-produced water discharged into surface drainages could impact water quality down-stream in Montana, these concerns have led to a shift in water-disposal methods from untreated surface dis-charge, either into impoundments (ponds) excavated within existing channels or impoundments off exist-ing channels, to treatment prior to surface disposal, dispersal by means of atomization sprayers, or use of produced water for surface and sub-surface irrigation (Wheaton and Donato, 2004). Responsible development of the CBNG resource requires minimization of water production during gas recovery. Ideally, water should be withdrawn only from isolated coal aquifers to prevent wasteful and unnecessary water withdrawal from any overlying or underlying sandstone aquifers. The objective of this study is to identify locations in the Powder River Basin where coal seams are hydraulically isolated from adjacent aquifers and hence water production will be limited to the coal. Communication between coals and adjacent aquifers can be the result of dep-ositional setting or vertical fracturing during well development. This study uses the ratio of 87Sr/86Sr of ground water to evaluate aquifer communica-tion. The ratio of 87Sr/86Sr of ground water represents a time-integrated record of water–rock interaction, such that water from aquifers composed of different rocks may acquire different Sr isotopic ratios. This present work builds upon the preliminary Sr isoto-pic data from CBNG and monitoring wells presented by Frost et al. (2002). That work showed that coal- and sandstone-aquifer systems may have distinct Sr isotopic compositions, and intermediate ratios may indicate incomplete aquifer isolation or improper well completion and therefore wasteful excess water pro-duction. The initial work focused on a limited data set from the eastern area of the Powder River Basin in the vicinity of Gillette and Wright, Wyoming, and it did not differentiate individual coal zones. Hence the goals of this study are to address the following ques-tions:
Do coal-aquifer and sandstone-aquifer waters 1. have distinctive Sr isotopic compositions basin-wide?Can different coal zones be identified by dis-2. tinctive Sr isotopic compositions?What are the geologic or geographic variables 3. that control coal-aquifer isolation?
Do Sr isotopic compositions correlate to frac-4. ture patterns introduced during completion of individual wells?
HYDROGEOLOGIC SETTING
The Powder River Basin is a 60,000 km2 (23,000 mi2) asymmetric structural and sedimentary basin in northeastern Wyoming and southeastern Montana that formed during Late Cretaceous to early Tertiary time as a Laramide foreland basin (Ayers, 1986; Flores and Ethridge, 1985; Hinaman, 2005). The basin’s axis trends north–northwest and is proximal to the western margin (Fig. 2). The basin is bounded to the east by the Black Hills, to the west by the Big Horn Mountains and the Casper Arch, and to the south by the Laramie Mountains and the Hartville Uplift. The northern part of the basin in Montana is bounded by the Miles City Arch and the Cedar Creek Anticline (Montgomery, 1999). Coal seams are found in both the Paleocene Fort Union Formation, which crops out on the basin margins, and the overlying Eocene Wasatch Formation. The uppermost member of the Fort Union Formation, the Tongue River Member, transitions into the Wasatch Formation without obvi-ous lithologic change at the contact (Hinaman, 2005; Glass, 1976). Both formations are composed of sand-stone, siltstone, mudstone, conglomerate, limestone, carbonaceous shale, and coal. In areas where the coal beds split, fluvial channel sandstones or mudstones are the interbedding strata (Flores and Bader, 1999).
Coal correlations across the basin are compli-cated by the merging and splitting of coal seams and by the use of local names in different parts of the basin. In this study we adopt the nomenclature of the Wyoming State Geological Survey (Wyoming State Geological Survey Coal Section, 2007), which divides the late Paleocene and Eocene coals into eight coal zones. From stratigraphically lowest to highest, the six coal zones within the Tongue River Member of the Paleocene Fort Union Formation are the Basal Tongue River, Sawyer, Knobloch, Lower Wyodak, Upper Wyodak, and Wyodak Rider. The Eocene Wasatch Formation includes the Felix and the overly-ing Lake DeSmet coal zones (Fig. 3).
Davis (1976) described four major aquifers in the Powder River Basin: (1) continuous coals with widely variable transmissivity from 100 gal/day/ft to 10,000 gal/day/ft based on fracture concentration and conti-

152 Rocky Mountain Geology, v. 43, no. 2, p. 149–175, 14 figs., 2 tables, November, 2008
C. E. CAMPBELL, B. N. PEARSON, AND C. D. FROST

Rocky Mountain Geology, v. 43, no. 2, p. 149–175, 14 figs., 2 tables, November, 2008 153
SR ISOTOPES IN WATER CO-PRODUCED WITH COAL BED NATURAL GAS
nuity; (2) clastic overburden and underburden adjacent to the coals including paleochannel sands, silt-stone, and shale deposits, all with low permeability and a high degree of isolation from one another; (3) clinker, produced by baking and melting overburden during com-bustion of coal beds, which has porosities up to 35 percent and vari-able transmissivity from 150 gal/day/ft to 3,000,000 gal/day/ft; and (4) alluvial aquifers noted for trans-missivities of 200–500 gal/day/ft. The regional topographic gradient drives the basin-wide flow system from the southwestern side of the basin to the lower northeastern sec-tion of the basin (McPherson and
Chapman, 1996). A potentiometric surface map of the Upper Wyodak coal seam produced by Daddow (1986) suggests that recharge and f low in the coal mimics the recharge patterns inferred from the topographic geometry of the basin. Recharge that occurs near the coal outcrop on the eastern margin is driven by topographic gradient westward toward the basin axis and from the southern margin to the north (Rankl and Lowry, 1985; Daddow, 1986).
Ground-water residence times are poorly known for Powder River Basin aquifers. Pearson (2002) suggested times of 7,000–70,000 years for ground water to f low from the eastern recharge to the central part of the basin based on limited tritium data and Darcy’s
Law calculations. Residence-time ages between the recharge area and the most easterly wells in the Sheridan area (Fig. 2) were esti-mated between 1,200 and 12,000 years based on the proximity of these wells to the recharge and the hydraulic gradient (Pearson, 2002). These estimates are in gen-eral agreement with a maximum mean 14C date of 21,000 years as reported by Frost and Brinck (2005) from an artesian well dis-charging from a sandstone aquifer in the center of the basin immedi-ately west of the Powder River (sec. 19, T. 52 N., R. 77 W.).
METHODS
Water samples were obtained from producing CBNG wells and
Figure 2, facing page. Generalized map of asymmetric Powder River Basin, showing basin axis along its western margin as identified by Wyoming State Geological Survey Coal Section (2007); McLellan et al. (1990) suggested the axis passes through Sheridan area and con-tinues into Montana. Most coal produc-tion is from open-pit mines along east-ern margin of basin in Wyoming. Coal bed methane production started west of these mines in area near Gillette and Wright, Wyoming and has since spread westward and northward. Locations of samples analyzed in this study are shown by symbols that are keyed to coal zone or sandstone aquifer from which water samples were collected. Boxes outline groups of wells discussed in text.
TerretBurly
Broadus
Basal Tongue River
ZedDannarSawyer
Lower MoyerMoyerKnobloch
MonarchCarney
CookGates
Wall BWall CWall
Wall DPawnee
Lower Pawnee
Lower Wyodak
Dietz 1Dietz 2Dietz 3
AndersonLower Anderson
CanyonUpper Wyodak
BakerTaft
Smith
RolandSmithWyodak Rider
Fort Union
Bull CreekFelixFelix
Buffalo CameronMurrayUcross
Lake De SmetWasatch
West CoalCentral CoalCoal ZoneFormation
TerretBurly
Broadus
Basal Tongue River
ZedDannarSawyer
Lower MoyerMoyerKnobloch
MonarchCarney
CookGates
Wall BWall CWall
Wall DPawnee
Lower Pawnee
Lower Wyodak
Dietz 1Dietz 2Dietz 3
AndersonLower Anderson
CanyonUpper Wyodak
BakerTaft
Smith
RolandSmithWyodak Rider
Fort Union(Tongue RiverMember)
Bull CreekFelixFelix
Buffalo CameronMurrayUcross
Lake De SmetWasatch
West CoalCentral CoalCoal ZoneFormation
Figure 3. Coal zones of Powder River Basin. Eocene coal zones of Wasatch Formation include Felix and overly-ing Lake DeSmet. Paleocene coal zones from are, from Fort Union Formation are (stratigraphically lowest to highest) basal Tongue River, Sawyer, Knobloch, Lower Wyodak, Upper Wyodak, and Wyodak Rider. Most coal-bed natural gas is recovered from Lower Wyodak, Upper Wyodak, and Wyodak Rider coal zones. Coal-zone nomenclature is from Wyoming State Geological Survey Coal Section (2007).
154 Rocky Mountain Geology, v. 43, no. 2, p. 149–175, 14 figs., 2 tables, November, 2008
C. E. CAMPBELL, B. N. PEARSON, AND C. D. FROST
from monitoring wells. Two well-casing volumes of water were removed from monitoring wells prior to sample collection; water from continuously pumping CBNG wells was collected via bypass valves after a 5 second flushing period. Temperature and pH were measured in the field. Samples were filtered through a 0.45 micron filter and kept cool and dark prior to analysis. One aliquot of each sample was acidified to pH 2 for cation analysis. Strontium was isolated from a 3 ml aliquot of each un-acidified water sample using Tef lon col-umns filled with Eichrom® Sr-Spec resin and the strontium isotopic composition determined by ther-mal ionization mass spectrometry at the University of Wyoming. The internal precision of 87Sr/86Sr isotope ratio measurements is ± 0.00001. Seventy-six analyses of NBS 987 strontium standard measured during the course of this study gave an average value of 87Sr/86Sr = 0.71026 ± 0.00002 (2 standard deviations). All analyses were normalized to an 86Sr/88Sr ratio value of 0.1194. Analytical blanks were less than 0.2 ng, neg-ligible compared to sample sizes of at least 0.1 micro-gram strontium. Sr concentrations were determined by ICP-MS or by isotope dilution. Major cations and trace elements were measured for the CBNG production wells by ICP-MS, sodium (Na) by flame atomic absorption, anions by ion chro-matography, and alkalinity by potentiometric titra-tion at the University of Wyoming. TDS was calcu-lated by summing the major ionic constituents and converting bicarbonate into equivalent carbonate (Drever, 1997).
SAMPLES
159 ground-water samples were analyzed for this study and are interpreted along with 30 addi-tional analyses reported in Frost et al. (2002). The water samples were obtained with the assistance of the U.S. Geological Survey (USGS), Coal Bed Methane Associates of Laramie (CBMA), Inc., the Casper office of the Bureau of Land Management (BLM), Welldog Inc. with the cooperation of RMT Williams Production Company, and Black Diamond Production Company. These include 14 water sam-ples from wells completed in sandstone aquifers. The 145 coal-aquifer samples include water produced from the Eocene Wasatch Formation Lake DeSmet and Felix coal zones and from the upper Paleocene Fort
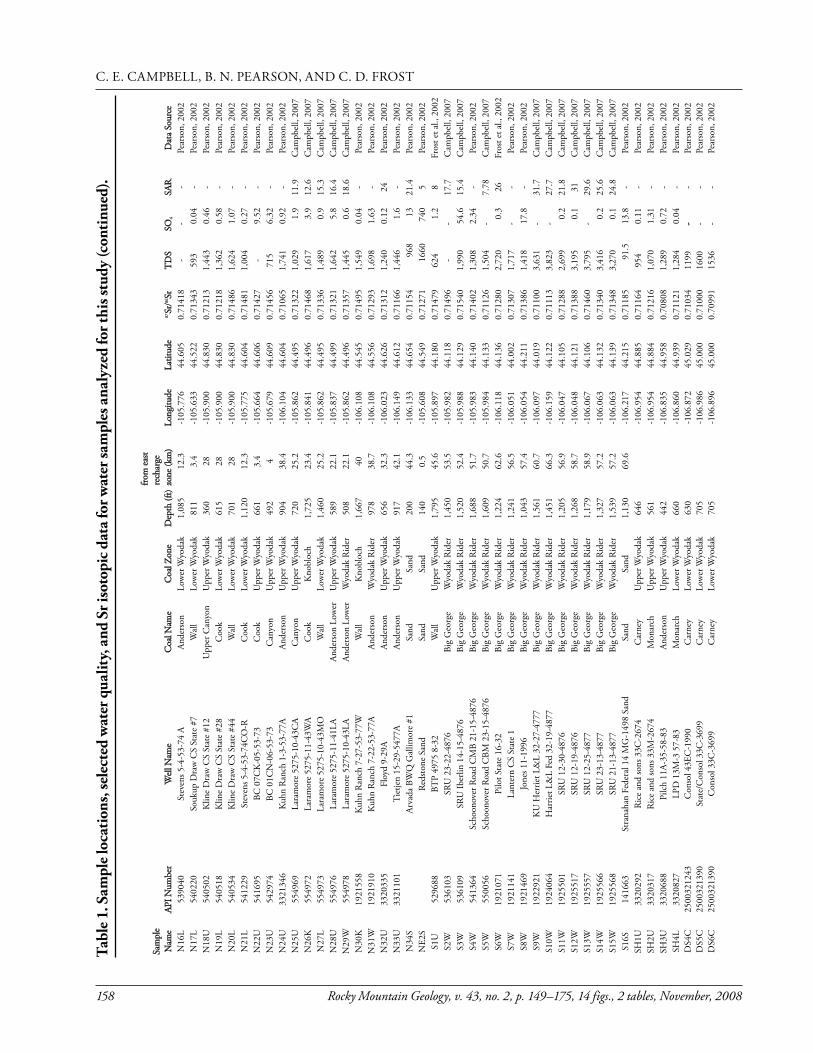
Union Formation Wyodak Rider, Upper Wyodak, Lower Wyodak, and Knobloch coal zones. Sr isotopic data and selected water quality data for each sample are reported in Table 1. Complete geochemical anal-yses for 69 samples that were obtained by the authors are available in Campbell (2007); water-quality data for the remaining 90 samples were obtained from the BLM, USGS, and CBMA, Inc.
The coal zone from which each CBNG-produced water sample was collected was determined by anal-ysis of gamma logs for each well, which are avail-able from the Wyoming Oil and Gas Conservation Commission and Montana Board of Oil and Gas websites. The lithologic interpretations of these logs were combined with the database used by the Wyoming State Geological Survey to construct cross sections and identify the coal zone from which the water was withdrawn. The coal zones, along with the coal-seam names filed by the producer with the Wyoming Oil and Gas Conservation Commission and Montana Board of Oil and Gas, are listed in Table 1.
RESULTS
Water-quality Results
Lee (1981) showed that deep ground waters in the Powder River Basin are uniformly of sodium-bicar-bonate signature, but that shallow ground waters are more variable in composition. His observations reflect the geochemical evolution of water-recharging coal aquifers, which Brinck et al. (in press) summarized as composed of five steps. First, soluble salts that have accumulated in the semi-arid soils of the basin re-dissolve. Next, the water dissolves gypsum and salts in the aquifer and incorporates products of pyrite oxidation. These processes result in calcium-sulfate-dominated ground waters. Third, sulfate reduction consumes sulfate and generates bicarbonate. This increase in bicarbonate causes precipitation of cal-cite. Accompanying these steps is cation exchange between water and aquifer materials, which removes calcium and magnesium from the water and replaces them with sodium. In addition, bacterially mediated methanogenesis takes place in Powder River Basin coals.
The major ion chemistry of water samples in this study illustrates the geochemical evolution described above. Waters from shallow wells in the Gillette area

Rocky Mountain Geology, v. 43, no. 2, p. 149–175, 14 figs., 2 tables, November, 2008 155
SR ISOTOPES IN WATER CO-PRODUCED WITH COAL BED NATURAL GAS
Tabl
e 1.
Sr i
soto
pic
and
sele
cted
wat
er q
ualit
y da
ta fo
r CBN
G c
o-pr
oduc
ed w
ater
sam
ples
, Pow
der R
iver
Bas
in, W
yom
ing.
Sam
ple
Nam
eAP
I Num
ber
Wel
l Nam
eC
oal N
ame
Coa
l Zon
eD
epth
(ft)
Dist
ance
to
E re
char
ge
(km
)Lo
ngitu
deLa
titud
e87Sr
/86Sr
TD
SSO
4SA
RD
ata
Sour
ceB1
LD19
2116
6Te
xaco
13U
31-
32U
cros
sLa
ke D
e Sm
et20
5-1
06.7
8844
.520
0.71
414
--
-Pe
arso
n, 2
002
B2LD
1921
198
Texa
co 4
3HE-
123
Ucr
oss
Lake
De
Smet
223
-106
.784
44.5
060.
7137
61,
586
--
Pear
son,
200
2B3
F19
2126
9LD
EC 2
1BC
1-21
2Bu
ll C
reek
Felix
763
-106
.691
44.4
250.
7123
959
583
.6-
Pear
son,
200
2B4
F19
2127
0LD
EC 2
1BC
2-21
2Fe
lixFe
lix90
5-1
06.6
9144
.425
0.71
149
535
7.46
-Pe
arso
n, 2
002
B5F
1921
436
Cro
ssH
32U
F-17
01U
pper
Fel
ixFe
lix94
5-1
06.6
2744
.305
0.71
193
547
18.1
-Pe
arso
n, 2
002
B6LD
1921
437
Cro
ss H
32U
-170
1U
cros
sLa
ke D
e Sm
et39
7-1
06.6
2644
.305
0.71
256
1,07
18.
2-
Pear
son,
200
2B7
LD19
2150
5Te
xaco
33B
C-1
23Bu
ll C
reek
Lake
De
Smet
695
-106
.787
44.5
050.
7127
51,
138
68-
Pear
son,
200
2BD
1BL
1926
349
Land
rey
22-2
0-52
77C
Coo
kLo
wer
Wyo
dak
1,57
750
.4-1
06.1
5344
.469
0.71
547
1,75
71.
918
.3C
ampb
ell,
2007
BD2B
U19
2635
0La
ndre
y 22
-20-
5277
DAn
ders
onU
pper
Wyo
dak
1,20
250
.4-1
06.1
5344
.469
0.71
404
3,04
62.
335
.4C
ampb
ell,
2007
BD3B
U19
2635
1La
ndre
y 42
-20-
5277
DAn
ders
onU
pper
Wyo
dak
1,07
550
.7-1
06.1
4544
.470
0.71
333
2,34
31.
836
.3C
ampb
ell,
2007
BD4B
L19
2635
7La
ndre
y 31
-20-
5277
CC
ook
Low
er W
yoda
k1,
515
50.7
-106
.148
44.4
730.
7148
32,
714
0.3
37.6
Cam
pbel
l, 20
07BD
5BU
1926
353
Land
rey
31-2
0-52
77D
Ande
rson
Upp
er W
yoda
k1,
200
50.7
-106
.148
44.4
730.
7124
92,
609
0.4
33.1
Cam
pbel
l, 20
07BD
7BL
1926
358
Land
rey
33-2
0-52
77C
Coo
kLo
wer
Wyo
dak
1,45
150
.7-1
06.1
4844
.466
0.71
517
1,84
10.
519
.1C
ampb
ell,
2007
BD8A
U19
2635
2La
ndre
y 33
-20-
5277
DAn
ders
onU
pper
Wyo
dak
1,06
050
.7-1
06.1
4844
.466
0.71
364
2,36
20
52.5
Cam
pbel
l, 20
07BD
9AL
1926
354
Land
rey
42-2
0-52
77B
Wal
lLo
wer
Wyo
dak
1,64
950
.4-1
06.1
4644
.469
0.71
475
1,12
314
.116
Cam
pbel
l, 20
07BD
10BL
1926
359
Land
rey
42-
20-5
277C
Coo
kLo
wer
Wyo
dak
1,44
250
.4-1
06.1
4644
.470
0.71
506
2,54
41.
126
.8C
ampb
ell,
2007
BW1W
1923
370
Moo
re L
and
Fede
ral 4
1-14
-427
7Bi
g G
eorg
eW
yoda
k R
ider
1,23
5-1
06.0
7143
.617
0.71
218
1,19
30
6.01
Cam
pbel
l, 20
07BW
2W19
2339
2M
oore
Lan
d Fe
dera
l 12-
11-4
277
Big
Geo
rge
Wyo
dak
Rid
er1,
330
-106
.086
43.6
280.
7153
61,
351
08.
15C
ampb
ell,
2007
BW3W
1923
393
Moo
re L
and
Fede
ral 2
1-11
-427
7Bi
g G
eorg
eW
yoda
k R
ider
1,46
2-1
06.0
8043
.631
0.71
213
1,34
80
5.71
Cam
pbel
l, 20
07BW
4W19
2339
4M
oore
Lan
d Fe
dera
l 23-
11-4
277
Big
Geo
rge
Wyo
dak
Rid
er1,
332
-106
.081
43.6
240.
7121
11,
662
0.2
7.07
Cam
pbel
l, 20
07BW
5W19
2340
0M
oore
Lan
d Fe
dera
l 43-
11-4
277
Big
Geo
rge
Wyo
dak
Rid
er1,
322
-106
.071
43.6
250.
7122
11,
266
06.
43C
ampb
ell,
2007
BW6W
1924
199
BCU
Dry
For
k 21
-27-
4377
Big
Geo
rge
Wyo
dak
Rid
er1,
583
-106
.103
43.6
760.
7180
62,
010
08.
16C
ampb
ell,
2007
BW7W
1924
888
BCU
Dry
For
k 34
-17-
4377
Big
Geo
rge
Wyo
dak
Rid
er1,
489
-106
.136
43.6
920.
7120
33,
033
0.1
12.1
Cam
pbel
l, 20
07BW
8W19
2489
1BC
U S
tate
41-
16-4
377
Big
Geo
rge
Wyo
dak
Rid
er1,
443
-106
.112
43.7
030.
7131
44,
467
0.1
21.2
Cam
pbel
l, 20
07BW
9W19
2489
7BC
U S
tate
12-
16-4
377
Big
Geo
rge
Wyo
dak
Rid
er1,
604
-106
.125
43.7
000.
7122
21,
844
0.1
9.37
Cam
pbel
l, 20
07BW
10W
1924
914
BCU
Dry
For
k 21
-20-
4377
Big
Geo
rge
Wyo
dak
Rid
er1,
536
-106
.142
43.6
890.
7121
01,
419
0.1
8.69
Cam
pbel
l, 20
07BW
11W
1925
029
BCU
32-
28-4
377
Big
Geo
rge
Wyo
dak
Rid
er1,
607
-106
.117
43.6
710.
7126
01,
144
06.
23C
ampb
ell,
2007
BW12
W19
2503
8BC
U 3
2-15
-427
7Bi
g G
eorg
eW
yoda
k R
ider
1,43
8-1
06.0
9643
.614
0.71
200
1,69
00
9.57
Cam
pbel
l, 20
07BW
13W
1925
050
BCU
34-
33-4
377
Big
Geo
rge
Wyo
dak
Rid
er1,
450
-106
.116
43.6
500.
7130
02,
263
012
.1C
ampb
ell,
2007
BW14
W19
2505
4BC
U 1
4-34
-437
7Bi
g G
eorg
eW
yoda
k R
ider
1,60
4-1
06.1
0843
.650
0.71
259
912
06.
4C
ampb
ell,
2007
BW15
W19
2506
1BC
U 3
4-5-
4277
Big
Geo
rge
Wyo
dak
Rid
er1,
434
-106
.136
43.6
350.
7114
32,
334
010
.4C
ampb
ell,
2007
BW16
W19
2507
3BC
U 3
2-5-
4277
Big
Geo
rge
Wyo
dak
Rid
er1,
485
-106
.136
43.6
430.
7117
53,
170
014
.9C
ampb
ell,
2007
BW17
W19
2508
0BC
U 4
3-5-
4277
Big
Geo
rge
Wyo
dak
Rid
er1,
490
-106
.131
43.6
390.
7121
74,
020
030
.9C
ampb
ell,
2007
BW18
W19
2508
6Bu
llwha
cker
Cre
ek U
N 3
2-3-
4277
Big
Geo
rge
Wyo
dak
Rid
er1,
479
-106
.097
43.6
430.
7128
31,
364
07.
38C
ampb
ell,
2007
BW19
W19
2508
7Bu
llwha
cker
Cre
ek U
N 2
3-3-
4277
Big
Geo
rge
Wyo
dak
Rid
er1,
493
-106
.101
43.6
390.
7123
91,
012
08.
42C
ampb
ell,
2007
BW20
W19
2508
8Bu
llwha
cker
Cre
ek U
N 2
1-3-
4277
Big
Geo
rge
Wyo
dak
Rid
er1,
517
-106
.101
43.6
470.
7143
82,
160
0.1
9.7
Cam
pbel
l, 20
07BW
21W
1925
099
BCU
12-
5-42
77Bi
g G
eorg
eW
yoda
k R
ider
1,48
4-1
06.1
4643
.643
0.71
055
3,16
10
12.6
Cam
pbel
l, 20
07BW
22W
1926
313
BCU
32-
29-4
377
Big
Geo
rge
Wyo
dak
Rid
er1,
553
-106
.136
43.6
710.
7126
611
750
7.21
Cam
pbel
l, 20
07G
1U53
0473
Lynd
e Tru
st 15
-34
Wyo
dak
Upp
er W
yoda
k48
212
.5-1
05.4
8744
.056
0.71
294
382
0.1
6Fr
ost e
t al.,
200
2G
2U53
0802
�ru
sh 5
-44
Wyo
dak
Upp
er W
yoda
k27
55.
8-1
05.4
0543
.987
0.71
287
644
0.1
8Fr
ost e
t al.,
200
2G
3U53
0949
Man
kin
14-2
3W
yoda
kU
pper
Wyo
dak
612
10.3
-105
.477
44.0
480.
7131
953
00
7Pe
arso
n, 2
002
G4U
5309
94Le
o C
G 4
1-30
Wyo
dak
Upp
er W
yoda
k39
96.
7-1
05.4
7744
.048
0.71
315
625
0.1
7Fr
ost e
t al.,
200
2G
5U53
1229
John
Mill
er 5
-32-
15W
yoda
kU
pper
Wyo
dak
270
10.1
-105
.496
44.3
150.
7126
872
00.
088.
4Fr
ost e
t al.,
200
2
Tabl
e 1.
Sr i
soto
pic
and
sele
cted
wat
er q
ualit
y da
ta fo
r CB
NG
co-
prod
uced
wat
er sa
mpl
es, P
owde
r Riv
er B
asin
, Wyo
min
g. (c
onti
nued
on
page
s 156
–159
).

156 Rocky Mountain Geology, v. 43, no. 2, p. 149–175, 14 figs., 2 tables, November, 2008
C. E. CAMPBELL, B. N. PEARSON, AND C. D. FROST
Sam
ple
Nam
eAP
I Num
ber
Wel
l Nam
eC
oal N
ame
Coa
l Zon
eD
epth
(ft)
Dist
ance
fro
m e
ast
rech
arge
zo
ne (k
m)
Long
itude
Latit
ude
87Sr
/86Sr
TD
SSO
4SA
RD
ata
Sour
ceG
6U53
1234
Dur
ham
Ran
ch 3
-31-
20-4
571
Wyo
dak
Upp
er W
yoda
k45
713
.8-1
05.4
1243
.867
0.71
339
660
06.
3Fr
ost e
t al.,
200
2G
7U53
1384
Dur
ham
Ran
ch 5
-33-
3An
ders
onU
pper
Wyo
dak
661
14.6
-105
.493
43.9
030.
7133
357
10.
17
Fros
t et a
l., 2
002
G8U
5314
94D
urha
m R
anch
8-4
2-11
Ande
rson
Upp
er W
yoda
k57
014
-105
.468
43.8
930.
7130
5-
0.01
6.9
Fros
t et a
l., 2
002
G9U
5317
60D
urha
m S
tate
34-
16An
ders
onU
pper
Wyo
dak
715
20.9
-105
.513
43.8
700.
7141
951
00.
037.
3Fr
ost e
t al.,
200
2G
10U
5319
00M
M 2
4-7
Fort
Uni
onU
pper
Wyo
dak
853
16.3
-105
.560
44.0
590.
7138
062
00.
736.
9Pe
arso
n, 2
002
G11
U53
1934
Trip
p 41
-2W
yoda
kU
pper
Wyo
dak
842
20.7
-105
.589
44.1
710.
7135
488
80.
18
Pear
son,
200
2G
12K
5321
05H
aigh
t 22-
25Pa
wne
e/C
ache
Kno
bloc
h1,
411
8.2
-105
.457
44.0
230.
7124
227
00.
0410
.28
Pear
son,
200
2G
13U
5328
60W
. For
k Fl
occh
ini 4
3-12
Wyo
dak
Upp
er W
yoda
k87
916
.3-1
05.4
4543
.801
0.71
396
480
0.75
6.1
Pear
son,
200
2G
14U
5329
10La
nge
14-1
4Fo
rt U
nion
Upp
er W
yoda
k90
120
.5-1
05.6
0544
.132
0.71
379
840
08.
1Pe
arso
n, 2
002
G15
U53
1711
Bog
Stat
e 2-
36W
yoda
kU
pper
Wyo
dak
765
10.9
-105
.450
43.5
690.
7137
039
50.
16
Fros
t et a
l., 2
002
G16
U53
3031
Swan
son
13-1
4-49
-72
Ande
rson
Upp
er W
yoda
k53
110
.9-1
05.4
8744
.220
0.71
244
--
-Pe
arso
n, 2
002
G17
U53
3115
Dur
ham
Ran
ch 1
3-36
Wyo
dak
Upp
er W
yoda
k74
65.
9-1
05.4
6443
.830
0.71
393
390
0.82
6.1
Fros
t et a
l., 2
002
G18
U53
3307
Blue
bird
CS
Stat
e #1
Big
Geo
rge
Upp
er W
yoda
k1,
094
38.1
-105
.822
44.0
980.
7142
090
04.
34-
Pear
son,
200
2G
19U
5339
64La
ney
9-19
-49-
71A
Ande
rson
Upp
er W
yoda
k45
06.
7-1
05.4
3044
.209
0.71
276
620
47.
1Fr
ost e
t al.,
200
2G
20U
5339
75M
oser
14-
35W
yoda
kU
pper
Wyo
dak
1,01
421
.4-1
05.6
0644
.089
0.71
417
660
07.
3Pe
arso
n, 2
002
G21
U53
3977
Mos
er 4
3-27
Wyo
dak
Upp
er W
yoda
k1,
066
24.1
-105
.611
44.1
070.
7135
569
70.
97
Fros
t et a
l., 2
002
G22
U53
4071
Wag
ense
n 11
-32-
4671
Wyo
dak
Upp
er W
yoda
k39
78.
4-1
05.4
2143
.926
0.71
358
509
0.25
-Fr
ost e
t al.,
200
2G
23U
5340
83H
eila
nd 4
2-3-
4773
Wyo
dak
Upp
er W
yoda
k99
222
.5-1
05.6
1244
.081
0.71
386
710
1.9
7Fr
ost e
t al.,
200
2G
24U
5341
18Pe
rsso
n 12
-33
Wyo
dak
Upp
er W
yoda
k1,
315
24.3
-105
.647
44.0
090.
7142
970
00.
897.
8Pe
arso
n, 2
002
G25
U53
4171
Schl
autm
ann
16-1
0-45
-74W
YC
anyo
nU
pper
Wyo
dak
1,43
238
.2-1
05.7
3143
.884
0.71
414
900
129.
3Fr
ost e
t al.,
200
2G
26W
5341
74Sc
hlau
tman
n 9-
10-4
5-74
BGAn
ders
onW
yoda
k R
ider
1,22
538
-105
.731
43.8
870.
7132
097
05.
111
Pear
son,
200
2G
27W
5341
76Sc
hlau
tman
n 15
-10-
45-7
4BG
Ande
rson
Wyo
dak
Rid
er1,
146
39-1
05.7
3643
.884
0.71
367
1120
1.5
12Pe
arso
n, 2
002
G28
W53
4249
Hei
land
24-
27-4
873
Wyo
dak
Wyo
dak
Rid
er77
522
-105
.621
44.1
040.
7133
868
00.
16
Fros
t et a
l., 2
002
G29
U53
4735
Rour
ke 8
-18-
48-7
1AAn
ders
onU
pper
Wyo
dak
490
6.5
-105
.427
44.1
390.
7130
4-
--
Pear
son,
200
2G
30U
5353
59Li
ndse
y 21
-13-
4673
Wyo
dak
Upp
er W
yoda
k1,
044
20.2
-105
.580
43.9
680.
7140
377
70.
03-
Fros
t et a
l., 2
002
G31
U53
5985
Stei
nhoe
fel 5
-7-4
9-71
Ande
rson
Upp
er W
yoda
k32
68.
3-1
05.4
4644
.242
0.71
261
--
-Pe
arso
n, 2
002
G32
U53
6125
Mes
erve
5-3
-49-
72A
Ande
rson
Upp
er W
yoda
k49
812
.7-1
05.5
0744
.256
0.71
287
770
0.07
7.6
Pear
son,
200
2G
33W
5367
91M
cBet
h 41
-7-4
673B
GBi
g G
eorg
eW
yoda
k R
ider
1,00
826
.8-1
05.6
7143
.983
0.71
372
772
0.03
9-
Fros
t et a
l., 2
002
G34
U53
7482
Miln
e 15
-30-
49-7
2AAn
ders
onU
pper
Wyo
dak
911
17.7
-105
.558
44.1
890.
7132
780
00.
068
Pear
son,
200
2G
35U
5388
04Bl
uebi
rd C
S St
ate
#19
Wyo
dak
Upp
er W
yoda
k1,
375
38-1
05.8
2244
.098
0.71
597
897
3.32
-Pe
arso
n, 2
002
G36
U53
9087
�ro
ne 1
4-23
-477
4 W
yoda
kU
pper
Wyo
dak
1,51
429
.1-1
05.7
2744
.030
0.71
473
907
0-
Pear
son,
200
2G
37U
5391
39G
eer 4
3-24
-477
4W
yoda
kU
pper
Wyo
dak
1,36
828
.8-1
05.6
9244
.033
0.71
430
1,19
50.
25-
Cam
pbel
l, 20
07G
38U
5394
35D
urha
m R
anch
23-
26-4
573
Wyo
dak
Upp
er W
yoda
k1,
040
27.6
-105
.601
43.8
440.
7151
081
01.
87.
1Fr
ost e
t al.,
200
2G
39U
5403
99H
ayde
n 23
-11-
4774
Wyo
dak
Upp
er W
yoda
k1,
510
26.5
-105
.722
44.0
640.
7143
51,
578
1.94
8.39
Cam
pbel
l, 20
07G
40U
5404
15G
eer 2
1-15
-477
4W
yoda
kU
pper
Wyo
dak
1,59
028
.2-1
05.7
4144
.056
0.71
509
1,21
40.
078.
58C
ampb
ell,
2007
G41
W54
0416
Gee
r 32-
15-4
774B
GBi
g G
eorg
eW
yoda
k R
ider
1,28
627
.1-1
05.7
3744
.053
0.71
372
-0.
15-
Cam
pbel
l, 20
07G
42U
5404
18H
ayde
n 41
-15-
4774
Wyo
dak
Upp
er W
yoda
k1,
584
27.1
-105
.731
44.0
570.
7146
01,
266
1.65
8.26
Cam
pbel
l, 20
07G
43W
5417
76Pe
rsso
n 43
-12-
4674
BG
Big
Geo
rge
Wyo
dak
Rid
er1,
175
29.3
-105
.692
43.9
750.
7134
31,
349
211
.5C
ampb
ell,
2007
G44
U54
1784
Stat
e 41
-36-
4774
BG
Big
Geo
rge
Upp
er W
yoda
k1,
091
28.1
-105
.693
44.0
120.
7137
61,
109
010
.4C
ampb
ell,
2007
G45
U54
1788
Stat
e 21
-36-
4774
BG
Big
Geo
rge
Upp
er W
yoda
k1,
077
28.1
-105
.702
44.0
120.
7145
21,
343
2.45
9.48
Cam
pbel
l, 20
07G
46U
5417
89St
ate
14-3
6-47
74 B
GBi
g G
eorg
eU
pper
Wyo
dak
1,18
028
.9-1
05.7
0744
.001
0.71
444
1,26
21.
437.
85C
ampb
ell,
2007
G47
W54
1935
Gee
r 34-
1-46
74BG
Big
Geo
rge
Wyo
dak
Rid
er1,
164
30.1
-105
.697
43.9
860.
7135
11,
402
6.91
11C
ampb
ell,
2007
G48
W54
1938
Gee
r 32-
1-46
74BG
Big
Geo
rge
Wyo
dak
Rid
er1,
080
32-1
05.6
9743
.994
0.71
355
1,28
40.
0811
.3C
ampb
ell,
2007
Tabl
e 1.
Sam
ple
loca
tions
, sel
ecte
d w
ater
qua
lity,
and
Sr i
soto
pic
data
for w
ater
sam
ples
ana
lyze
d fo
r thi
s stu
dy (c
onti
nued
).

Rocky Mountain Geology, v. 43, no. 2, p. 149–175, 14 figs., 2 tables, November, 2008 157
SR ISOTOPES IN WATER CO-PRODUCED WITH COAL BED NATURAL GAS
Sam
ple
Nam
eAP
I Num
ber
Wel
l Nam
eC
oal N
ame
Coa
l Zon
eD
epth
(ft)
Dist
ance
fro
m e
ast
rech
arge
zo
ne (k
m)
Long
itude
Latit
ude
87Sr
/86Sr
TD
SSO
4SA
RD
ata
Sour
ceG
49U
5422
26G
eer 2
2-19
-477
3W
yoda
kU
pper
Wyo
dak
1,35
626
.5-1
05.6
8344
.038
0.71
423
883
0.54
8.05
Cam
pbel
l, 20
07G
50W
5439
33Pe
rsso
n 41
-15-
4674
BGBi
g G
eorg
eW
yoda
k R
ider
1,23
034
.4-1
05.7
3243
.967
0.71
357
1,37
81.
1911
.7C
ampb
ell,
2007
G51
W54
3939
Pers
son
21-1
5-46
74BG
Big
Geo
rge
Wyo
dak
Rid
er1,
308
36.6
-105
.742
43.9
670.
7127
81,
407
1.64
12.3
Cam
pbel
l, 20
07G
52W
5439
43M
cbet
h 21
-25-
4674
BGBi
g G
eorg
eW
yoda
k R
ider
1,07
033
.1-1
05.7
0243
.938
0.71
403
1,19
29.
8211
.9C
ampb
ell,
2007
G53
W54
3944
Mcb
eth
34-2
6-46
74BG
Big
Geo
rge
Wyo
dak
Rid
er1,
010
32.4
-105
.717
43.9
270.
7137
21,
201
0.06
11.9
Cam
pbel
l, 20
07G
54U
5439
46M
cbet
h 34
-26-
4674
Wyo
dak
Upp
er W
yoda
k1,
365
32.7
-105
.717
43.9
270.
7146
41,
046
2.88
10.6
Cam
pbel
l, 20
07G
55W
5439
52M
cbet
h 23
-23-
4674
BGBi
g G
eorg
eW
yoda
k R
ider
1,08
535
.6-1
05.7
2143
.945
0.71
358
1,18
62.
3312
Cam
pbel
l, 20
07G
56W
5439
57Ru
by 3
2-14
-467
4BG
Big
Geo
rge
Wyo
dak
Rid
er1,
225
35.7
-105
.717
43.9
640.
7139
21,
361
1.96
11C
ampb
ell,
2007
G57
W54
3959
Mcb
eth3
2-26
-467
4BG
Big
Geo
rge
Wyo
dak
Rid
er1,
080
32.7
-105
.717
43.9
350.
7137
61,
215
0.27
11.7
Cam
pbel
l, 20
07G
58W
5439
81M
cbet
h 14
-13-
4674
BGBi
g G
eorg
eW
yoda
k R
ider
1,12
234
.1-1
05.7
0743
.956
0.71
397
1,33
00.
0710
.4C
ampb
ell,
2007
G59
U54
7297
Flyi
ng T
12-
32-4
672
Can
yon
Upp
er W
yoda
k1,
028
18.9
-105
.545
43.9
210.
7133
299
70.
817.
82C
ampb
ell,
2007
G60
W54
3969
Mcb
eth
34-2
4-46
74BG
Big
Geo
rge
Wyo
dak
Rid
er97
535
.7-1
05.6
9743
.942
0.71
407
1,30
60
10.3
Cam
pbel
l, 20
07G
61U
5321
40Li
ttle
�un
der E
dwar
dds 4
3-12
4372
Wyo
dak
Upp
er W
yoda
k67
514
-105
.445
43.7
140.
7136
639
61.
86
Fros
t et a
l., 2
002
G62
U53
3187
�un
der E
dwar
ds 2
1-7
Wyo
dak
Upp
er W
yoda
k60
612
.3-1
05.4
4643
.722
0.71
333
470
175.
7Pe
arso
n, 2
002
G63
W53
4517
Pine
Tre
e D
raw
CS
Stat
e #1
Big
Geo
rge
Wyo
dak
Rid
er1,
075
27.6
-105
.807
43.5
670.
7137
864
92.
95-
Pear
son,
200
2G
64U
5345
24St
uart
12-
33W
yoda
kU
pper
Wyo
dak
620
9.3
-105
.399
43.7
470.
7136
349
4-
-Fr
ost e
t al.,
200
2G
65W
5354
76M
oore
CS
#60
Big
Geo
rge
Wyo
dak
Rid
er92
532
.8-1
05.6
8843
.735
0.71
387
671
0.05
-Pe
arso
n, 2
002
G66
W54
3698
Gro
ves C
S #2
1Bi
g G
eorg
eW
yoda
k R
ider
980
28.8
-105
.637
43.7
350.
7145
757
10.
29-
Pear
son,
200
2G
67S
Mar
tens
and
Pec
k Se
c. 2
2 C
BM V
S Sa
nd M
onito
ring
Sand
Sand
8010
.6-1
05.4
8744
.123
0.71
263
4290
2410
-Fr
ost e
t al.,
200
2G
68S
Mar
tens
and
Pec
k Se
c. 2
2 C
BM S
and
Mon
itorin
gSa
ndSa
nd40
010
.6-1
05.4
8644
.123
0.71
265
587
99.7
-Fr
ost e
t al.,
200
2G
69S
Mar
tens
and
Pec
k Se
c. 2
2 C
BM S
hallo
w S
and
Mon
itorin
gSa
ndSa
nd18
510
.6-1
05.4
8744
.123
0.71
271
3650
2140
-Fr
ost e
t al.,
200
2G
70S
Barlo
w B
WQ
Gle
nn B
arlo
w #
4 Pe
rmit
166
Sand
Sand
400
42.5
-105
.869
44.1
890.
7121
458
829
6-
Pear
son,
200
2G
75S
Barlo
w B
WQ
Gle
nn B
arlo
w #
2 Pe
rmit
164
Sand
Sand
43-1
05.8
7444
.176
0.71
179
--
Pear
son,
200
2G
71S
�ro
ne 1
1-26
-477
4 M
SSa
ndSa
nd1,
450
29.3
-105
.727
44.0
270.
7138
932
2-
-Pe
arso
n, 2
002
G72
SBR
C F
ED 3
3-31
ASa
ndSa
nd30
010
.6-1
05.4
3043
.657
0.71
304
1580
983
-Pe
arso
n, 2
002
G73
SAl
l Nig
ht C
reek
San
d Ba
rret
t Sta
te 1
3-36
-437
4 M
SSa
ndSa
nd86
025
.9-1
05.7
1443
.660
0.71
228
281
1.1
-Pe
arso
n, 2
002
G74
SC
BM-M
ON
-1W
Sand
Sand
860
29.6
-105
.687
44.2
550.
7125
810
1010
13Fr
ost e
t al.,
200
2G
54C
CBM
-MO
N-2
Wyo
dak-
uppe
rU
pper
Wyo
dak
905
22.8
-105
.621
44.2
600.
7134
910
301
9Fr
ost e
t al.,
200
2N
1U52
9839
Wal
ls Fe
e 74
-7W
yoda
kU
pper
Wyo
dak
480
6.3
-105
.551
44.3
680.
7130
899
00.
817.
7Pe
arso
n, 2
002
N2U
5310
01H
all 3
3-26
33C
anyo
nU
pper
Wyo
dak
299
0-1
05.6
0244
.545
0.71
335
1,04
00.
78
Fros
t et a
l., 2
002
N3L
5328
69So
ukup
Dra
w S
tate
#1
Low
er C
anyo
nLo
wer
Wyo
dak
528
3.4
-105
.633
44.5
220.
7136
689
40.
17-
Pear
son,
200
2N
4L53
4205
Park
s Lon
ghor
n 6-
14-5
5-73
WPa
wne
eLo
wer
Wyo
dak
545
0-1
05.5
9844
.749
0.71
393
800
311
Pear
son,
200
2N
5L53
4424
L-X
Bar
LX
Fee
14-3
5AAn
ders
onU
pper
Wyo
dak
543
21.8
-105
.854
44.7
750.
7131
41,
320
1.2
23Pe
arso
n, 2
002
N6L
5344
25LX
Fee
3-2C
Can
yon
Low
er W
yoda
k80
521
.8-1
05.8
5444
.782
0.71
175
1,60
01.
623
Pear
son,
200
2N
7U53
4475
Wes
t 12-
28C
AC
anyo
nU
pper
Wyo
dak
645
25.8
-105
.901
44.8
000.
7123
81,
550
0.92
22Pe
arso
n, 2
002
N8L
5346
90LX
-Sta
te-1
-36C
Can
yon
Low
er W
yoda
k68
719
.4-1
05.8
2444
.793
0.71
404
1,05
00.
1622
Pear
son,
200
2N
9U53
5333
LX-S
tate
1-3
6ALC
Ande
rson
Upp
er W
yoda
k39
019
.4-1
05.8
2444
.794
0.71
362
1,39
01.
918
Pear
son,
200
2N
10L
5353
52W
est 1
6-13
CO
Coo
kLo
wer
Wyo
dak
1,02
030
.9-1
05.9
4644
.825
0.71
463
2,00
00.
1632
Pear
son,
200
2N
11U
5354
16Fl
oyd
10-2
8-51
-74A
Ande
rson
Upp
er W
yoda
k81
222
.4-1
05.7
6044
.367
0.71
449
540
0.78
13Fr
ost e
t al.,
200
2N
12U
5358
51Fl
oyd
10-3
0-51
-74A
Ande
rson
Upp
er W
yoda
k96
326
.3-1
05.8
0344
.368
0.71
399
1,30
61.
2-
Fros
t et a
l., 2
002
N13
K53
6006
WES
T 6
-28-
56-7
5CO
Wal
l/Paw
nee
Kno
bloc
h1,
150
25.2
-105
.894
44.8
040.
7125
61,
550
0.07
32Pe
arso
n, 2
002
N14
U53
8294
Spot
ted
Hor
se C
S St
ate
#13
Upp
er C
anyo
nU
pper
Wyo
dak
603
25.2
-105
.901
44.7
390.
7133
21,
331
0.83
-Pe
arso
n, 2
002
N15
L53
8300
Spot
ted
Hor
se C
S St
ate
#6W
all
Low
er W
yoda
k77
524
-105
.891
44.7
460.
7141
41,
350
1.22
-Pe
arso
n, 2
002
Tabl
e 1.
Sam
ple
loca
tions
, sel
ecte
d w
ater
qua
lity,
and
Sr i
soto
pic
data
for w
ater
sam
ples
ana
lyze
d fo
r thi
s stu
dy (c
onti
nued
).
158 Rocky Mountain Geology, v. 43, no. 2, p. 149–175, 14 figs., 2 tables, November, 2008
C. E. CAMPBELL, B. N. PEARSON, AND C. D. FROST
Sam
ple
Nam
eAP
I Num
ber
Wel
l Nam
eC
oal N
ame
Coa
l Zon
eD
epth
(ft)
Dist
ance
fro
m e
ast
rech
arge
zo
ne (k
m)
Long
itude
Latit
ude
87Sr
/86Sr
TD
SSO
4SA
RD
ata
Sour
ceN
16L
5390
40St
even
s 5-4
-53-
74 A
Ande
rson
Low
er W
yoda
k1,
085
12.3
-105
.776
44.6
050.
7141
8-
--
Pear
son,
200
2N
17L
5402
20So
ukup
Dra
w C
S St
ate
#7W
all
Low
er W
yoda
k81
13.
4-1
05.6
3344
.522
0.71
343
593
0.04
-Pe
arso
n, 2
002
N18
U54
0502
Klin
e D
raw
CS
Stat
e #1
2U
pper
Can
yon
Upp
er W
yoda
k36
028
-105
.900
44.8
300.
7121
31,
443
0.46
-Pe
arso
n, 2
002
N19
L54
0518
Klin
e D
raw
CS
Stat
e #2
8C
ook
Low
er W
yoda
k61
528
-105
.900
44.8
300.
7121
81,
362
0.58
-Pe
arso
n, 2
002
N20
L54
0534
Klin
e D
raw
CS
Stat
e #4
4W
all
Low
er W
yoda
k70
128
-105
.900
44.8
300.
7148
61,
624
1.07
-Pe
arso
n, 2
002
N21
L54
1229
Stev
ens 5
-4-5
3-74
CO
-RC
ook
Low
er W
yoda
k1,
120
12.3
-105
.775
44.6
040.
7148
11,
004
0.27
-Pe
arso
n, 2
002
N22
U54
1695
BC 0
7CK
-05-
53-7
3C
ook
Upp
er W
yoda
k66
13.
4-1
05.6
6444
.606
0.71
427
-9.
52-
Pear
son,
200
2N
23U
5429
74BC
01C
N-0
6-53
-73
Can
yon
Upp
er W
yoda
k49
24
-105
.679
44.6
090.
7145
671
56.
32-
Pear
son,
200
2N
24U
3321
346
Kuh
n R
anch
1-3
-53-
77A
Ande
rson
Upp
er W
yoda
k90
438
.4-1
06.1
0444
.604
0.71
065
1,74
10.
92-
Pear
son,
200
2N
25U
5549
69La
ram
ore
5275
-10-
43C
AC
anyo
nU
pper
Wyo
dak
720
25.2
-105
.862
44.4
950.
7132
21,
029
1.9
11.9
Cam
pbel
l, 20
07N
26K
5549
72La
ram
ore
5275
-11-
43W
AC
ook
Kno
bloc
h1,
725
23.4
-105
.841
44.4
960.
7146
81,
617
3.9
12.6
Cam
pbel
l, 20
07N
27L
5549
73La
ram
ore
5275
-10-
43M
OW
all
Low
er W
yoda
k1,
460
25.2
-105
.862
44.4
950.
7133
61,
489
0.9
15.3
Cam
pbel
l, 20
07N
28U
5549
76La
ram
ore
5275
-11-
41LA
Ande
rson
Low
erU
pper
Wyo
dak
589
22.1
-105
.837
44.4
990.
7132
11,
642
5.8
16.4
Cam
pbel
l, 20
07N
29W
5549
78La
ram
ore
5275
-10-
43LA
Ande
rson
Low
erW
yoda
k R
ider
508
22.1
-105
.862
44.4
960.
7135
71,
445
0.6
18.6
Cam
pbel
l, 20
07N
30K
1921
558
Kuh
n R
anch
7-2
7-53
-77W
Wal
lK
nobl
och
1,66
740
-106
.108
44.5
450.
7149
51,
549
0.04
-Pe
arso
n, 2
002
N31
W19
2191
0K
uhn
Ran
ch 7
-22-
53-7
7AAn
ders
onW
yoda
k R
ider
978
38.7
-106
.108
44.5
560.
7129
31,
698
1.63
-Pe
arso
n, 2
002
N32
U33
2033
5Fl
oyd
9-29
AAn
ders
onU
pper
Wyo
dak
656
32.3
-106
.023
44.6
260.
7131
21,
240
0.12
24Pe
arso
n, 2
002
N33
U33
2110
1Ti
etje
n 15
-29-
5477
AAn
ders
onU
pper
Wyo
dak
917
42.1
-106
.149
44.6
120.
7116
61,
446
1.6
-Pe
arso
n, 2
002
N34
SAr
vada
BW
Q G
allim
ore
#1Sa
ndSa
nd20
044
.3-1
06.1
3344
.654
0.71
154
968
1321
.4Pe
arso
n, 2
002
NE2
SRe
dsto
ne S
and
Sand
Sand
140
0.5
-105
.608
44.5
490.
7127
116
6074
05
Pear
son,
200
2S1
U52
9688
BTP
4975
8-3
2W
all
Upp
er W
yoda
k1,
795
45.6
-105
.897
44.1
800.
7147
962
41.
28
Fros
t et a
l., 2
002
S2W
5361
03SR
U 2
3-22
-487
6Bi
g G
eorg
eW
yoda
k R
ider
1,45
053
.5-1
05.9
8244
.118
0.71
496
--
17.7
Cam
pbel
l, 20
07S3
W53
6109
SRU
Iber
lin 1
4-15
-487
6Bi
g G
eorg
eW
yoda
k R
ider
1,52
052
.4-1
05.9
8844
.129
0.71
540
1,99
054
.615
.4C
ampb
ell,
2007
S4W
5413
64Sc
hoon
over
Roa
d C
MB
21-1
5-48
76Bi
g G
eorg
eW
yoda
k R
ider
1,68
851
.7-1
05.9
8344
.140
0.71
402
1,30
82.
34-
Pear
son,
200
2S5
W55
0056
Scho
onov
er R
oad
CBM
23-
15-4
876
Big
Geo
rge
Wyo
dak
Rid
er1,
609
50.7
-105
.984
44.1
330.
7112
61,
504
-7.
78C
ampb
ell,
2007
S6W
1921
071
Pilo
t Sta
te 1
6-32
Big
Geo
rge
Wyo
dak
Rid
er1,
224
62.6
-106
.118
44.1
360.
7128
02,
720
0.3
26Fr
ost e
t al.,
200
2S7
W19
2114
1La
nter
n C
S St
ate
1Bi
g G
eorg
eW
yoda
k R
ider
1,24
156
.5-1
06.0
5144
.002
0.71
307
1,71
7-
-Pe
arso
n, 2
002
S8W
1921
469
Jone
s 11-
1996
Big
Geo
rge
Wyo
dak
Rid
er1,
043
57.4
-106
.054
44.2
110.
7138
61,
418
17.8
-Pe
arso
n, 2
002
S9W
1922
921
KU
Her
riet L
&L
32-2
7-47
77Bi
g G
eorg
eW
yoda
k R
ider
1,56
160
.7-1
06.0
9744
.019
0.71
100
3,63
1-
31.7
Cam
pbel
l, 20
07S1
0W19
2406
4H
arrie
t L&
L Fe
d 32
-19-
4877
Big
Geo
rge
Wyo
dak
Rid
er1,
451
66.3
-106
.159
44.1
220.
7111
33,
823
-27
.7C
ampb
ell,
2007
S11W
1925
501
SRU
12-
30-4
876
Big
Geo
rge
Wyo
dak
Rid
er1,
205
56.9
-106
.047
44.1
050.
7128
82,
699
0.2
21.8
Cam
pbel
l, 20
07S1
2W19
2551
7SR
U 1
2-19
-487
6Bi
g G
eorg
eW
yoda
k R
ider
1,26
858
.7-1
06.0
4844
.121
0.71
388
3,19
50.
131
Cam
pbel
l, 20
07S1
3W19
2555
7SR
U 1
2-25
-487
7Bi
g G
eorg
eW
yoda
k R
ider
1,17
958
.9-1
06.0
6744
.106
0.71
460
3,79
5-
29.6
Cam
pbel
l, 20
07S1
4W19
2556
6SR
U 2
3-13
-487
7Bi
g G
eorg
eW
yoda
k R
ider
1,32
757
.2-1
06.0
6344
.132
0.71
340
3,41
60.
225
.6C
ampb
ell,
2007
S15W
1925
568
SRU
21-
13-4
877
Big
Geo
rge
Wyo
dak
Rid
er1,
539
57.2
-106
.063
44.1
390.
7134
83,
270
0.1
24.8
Cam
pbel
l, 20
07S1
6SW
YW-
1416
63St
rana
han
Fede
ral 1
4 M
G-1
498
Sand
Sand
Sand
1,13
069
.6-1
06.2
1744
.215
0.71
185
91.5
13.8
-Pe
arso
n, 2
002
SH1U
3320
292
Ric
e an
d so
ns 3
3C-2
674
Car
ney
Upp
er W
yoda
k64
6-1
06.9
5444
.885
0.71
164
954
0.11
-Pe
arso
n, 2
002
SH2U
3320
317
Ric
e an
d so
ns 3
3M-2
674
Mon
arch
Upp
er W
yoda
k56
1-1
06.9
5444
.884
0.71
216
1,07
01.
31-
Pear
son,
200
2SH
3U33
2068
8Pi
lch
11A-
35-5
8-83
Ande
rson
Upp
er W
yoda
k44
2-1
06.8
3544
.958
0.70
808
1,28
90.
72-
Pear
son,
200
2SH
4L33
2082
7LP
D 1
3M-3
57-
83M
onar
chLo
wer
Wyo
dak
660
-106
.860
44.9
390.
7112
11,
284
0.04
-Pe
arso
n, 2
002
DS4
C25
0032
1243
Con
sol 4
3EC
-199
0C
arne
yLo
wer
Wyo
dak
630
-106
.872
45.0
290.
7103
411
99-
-Pe
arso
n, 2
002
DS5
C25
0032
1390
Stat
e/C
onso
l 33C
-369
9C
arne
yLo
wer
Wyo
dak
705
-106
.986
45.0
000.
7100
016
00-
-Pe
arso
n, 2
002
DS6
C25
0032
1390
Con
sol 3
3C-3
699
Car
ney
Low
er W
yoda
k70
5-1
06.8
9645
.000
0.70
991
1536
--
Pear
son,
200
2
Tabl
e 1.
Sam
ple
loca
tions
, sel
ecte
d w
ater
qua
lity,
and
Sr i
soto
pic
data
for w
ater
sam
ples
ana
lyze
d fo
r thi
s stu
dy (c
onti
nued
).

Rocky Mountain Geology, v. 43, no. 2, p. 149–175, 14 figs., 2 tables, November, 2008 159
SR ISOTOPES IN WATER CO-PRODUCED WITH COAL BED NATURAL GAS
Sam
ple
Nam
eAP
I Num
ber
Wel
l Nam
eC
oal N
ame
Coa
l Zon
eD
epth
(ft)
Dist
ance
fro
m e
ast
rech
arge
zo
ne (k
m)
Long
itude
Latit
ude
87Sr
/86Sr
TD
SSO
4SA
RD
ata
Sour
ceD
S7C
2500
3213
78C
onso
l 31C
-329
0C
arne
yLo
wer
Wyo
dak
650
-106
.854
45.0
000.
7106
013
27-
-Pe
arso
n, 2
002
DS8
C25
0032
1512
Shel
l 44D
-339
9D
ietz
Upp
er W
yoda
k31
8-1
06.9
5144
.997
0.70
937
1337
--
Pear
son,
200
2D
S9C
2500
3214
00C
onso
l 43D
-199
0D
ietz
Upp
er W
yoda
k32
1-1
06.8
7245
.029
0.70
903
1092
0.12
5-
Pear
son,
200
2D
S10C
2500
3213
13St
ate/
Con
sol 3
3D1-
3699
Die
tz 1
Upp
er W
yoda
k24
9-1
06.8
9645
.000
0.70
791
1899
0.23
-Pe
arso
n, 2
002
DS1
1C25
0032
1332
Con
sol 3
1D1-
3290
Die
tz 1
Upp
er W
yoda
k29
7-1
06.8
5445
.009
0.70
850
1067
16.5
-Pe
arso
n, 2
002
DS1
2C25
0032
1299
Con
sol 3
3D2/
3-36
99D
ietz
2/3
Upp
er W
yoda
k37
9-1
06.8
9645
.000
0.70
980
1074
0.15
-Pe
arso
n, 2
002
DS1
4C25
0032
1513
Shel
l 44M
-339
9M
onar
chU
pper
Wyo
dak
421
-106
.951
44.9
970.
7116
81,
717
--
Pear
son,
200
2D
S16C
2500
3213
96C
onso
l 14M
-199
0M
onar
chU
pper
Wyo
dak
354
-106
.885
45.0
270.
7105
193
2-
-Pe
arso
n, 2
002
DS1
7C25
0032
1298
Stat
e/C
onso
l 33M
-369
9M
onar
chU
pper
Wyo
dak
482
-106
.896
45.0
000.
7104
812
50-
-Pe
arso
n, 2
002
DS1
8C25
0032
1325
Con
sol 1
3M-2
599
Mon
arch
Upp
er W
yoda
k41
8-1
06.9
0645
.015
0.71
073
1219
0.03
-Pe
arso
n, 2
002
DS1
9C25
0032
1361
Con
sol 4
2M-3
290
Mon
arch
Upp
er W
yoda
k46
8-1
06.8
5245
.005
0.71
120
1216
0.07
4-
Pear
son,
200
2B8
SJM
Hub
er G
utz #
1Sa
ndSa
nd19
0-1
06.8
4544
.925
0.71
005
703
1427
.18
Pear
son,
200
2D
S2S
JM H
uber
Bea
tty G
ulch
Pas
ture
#1
Sand
Sand
4-1
06.8
9644
.954
0.70
829
1900
2326
.06
Pear
son,
200
2B9
SJM
Hub
er P
ater
son
Wel
l #2
Sand
Sand
40-1
06.8
5244
.894
0.70
960
--
-Pe
arso
n, 2
002
B10S
Dun
ning
#3
JM H
uber
LPD
BW
Q [S
PRIN
G?]
Sand
Sand
300
-106
.902
44.9
480.
7088
4-
--
Pear
son,
200
2B1
1SJM
Hub
er S
and
J Pa
ters
on #
1Sa
ndSa
nd14
0-1
06.8
5144
.928
0.71
044
706
1226
.67
Pear
son,
200
2B1
2SJM
Hub
er L
PD B
WQ
Dun
ning
Hom
e #2
Sand
Sand
-106
.908
44.9
730.
7100
8-
--
Pear
son,
200
2B1
3SJM
Hub
er D
unni
ng B
arn
#1Sa
ndSa
nd40
-106
.906
44.9
730.
7108
0-
--
Pear
son,
200
2
Tabl
e 1.
Sam
ple
loca
tions
, sel
ecte
d w
ater
qua
lity,
and
Sr i
soto
pic
data
for w
ater
sam
ples
ana
lyze
d fo
r thi
s stu
dy (c
onti
nued
).are mainly sulfate and calcium dominated. The same is true in water samples from the Jacobs Ranch Mine east of Wright, Wyoming, completed in both coal and shale or sandstone aquifers (Frost et al., 2001); there is considerable variation. Deeper sandstone wells and coal wells are sodium-bicarbonate type (Fig. 4). Although water from all coal zones is sodium-bicar-bonate type (and thus major ion compositions do not differentiate waters from different coal zones), there are some spatial patterns in water quality.
Total dissolved solids (TDS) are lowest along the eastern margin of the Powder River Basin, typi-cally under 1000 mg/L. They are highest along the Johnson–Campbell county line at approximately 106° W longitude (exceeding 3.000 mg/L in some wells) and intermediate in the area of Sheridan (Fig. 5). Our data are consistent with those of Rice et al. (2000), whose smaller dataset was restricted mainly to water samples from wells in Campbell County near the eastern edge of the Powder River Basin. They described the variation in TDS in the Powder River Basin as increasing from southeast to north-west but did not have access to the more recently completed, deeper wells farther west into the basin that exhibit the highest TDS. Neither did they ana-lyze the relatively dilute produced water from wells in the Sheridan area.
Sodium-adsorption ratio (SAR), defined as:
[ ]
[ ]++
+
+=
22 MgCa
Na
L
mmolSAR
(Essington, 2004) also is highest along 106° W lon-gitude (Fig. 6). Most water samples with SAR greater than 20 are found in this area of the basin. Most of the samples in this study are from wells located in Wyoming on the eastern side of the basin axis, where the CBNG development began. The recharge area for these samples is along the eastern margin of the basin. A major recharge zone for coal aquifers is the clinker outcrops adjacent to the surface coal mines that extend from southeast of Wright to northeast of Gillette. Ground water recharged on the eastern side of the basin is driven westward by the topographic gradient toward the Powder River and the basin’s axis. The distance of the well from the eastern clinker outcrops is a proxy for relative ground-water residence time, such that wells closer to the clinker outcrop yield water with shorter resi-

160 Rocky Mountain Geology, v. 43, no. 2, p. 149–175, 14 figs., 2 tables, November, 2008
C. E. CAMPBELL, B. N. PEARSON, AND C. D. FROST
dence time than wells located farther west. Plotted as a function of dis-tance from recharge, TDS of coal-aquifer waters increases with increas-ing distance into the basin, and values of TDS higher than 2,000 mg/L occur for samples collected more than 45 km from recharge (Fig. 7). Some shallow wells, ranging in depth from 80 to 300 feet (25–92 m), in sandstone aquifers near the recharge area also have high TDS (Fig. 7). Water from these shallow wells is also high in sulfate. High concentrations of sulfur in wells sug-gest that they have not yet under-gone bacterial reduction of sulfate. That process reduces the concentra-tion of sulfate and increases the con-centration of bicarbonate, causing
Ca and Mg to precipitate as carbon-ates and decreasing TDS (Brinck et al., in press). Disregarding these sam-ples and considering only those that have undergone sulfate reduction, residence time appears to be more important than depth of coal seam. There is no strong correlation of TDS with well depth, although all CBNG well waters with high TDS are from wells more than 1,000 ft deep. SAR also increases with increasing distance from recharge zone (Fig. 8), although there is con-siderable variation.
Strontium Isotope Results 87Sr/86Sr ratios for the ground waters in this study vary from less than 0.711 to more than
0.715 (analytical uncertainty is ± 0.00002). The 87Sr/86Sr ratios are lowest in the Sheridan area along the Montana–Wyoming border, and the highest are along 106° W longitude (Fig. 9). Water from sandstone aquifers are generally among the lowest ratios; most are between 0.7083 and 0.7127, a lthough t wo sample s have 87Sr/86Sr ratios > 0.713. In most areas of the Powder River Basin, 87Sr/86Sr ratios for ground water from different coal zones are overlapping (Fig. 10). However, in the Buffalo area, water from the Lake DeSmet coal zone is more radiogenic than water from the Felix coal zone. Also, in the Black Diamond development area of the northeastern part of the basin, water sampled from the Lower Wyodak coal zone is more radiogenic than water from the Upper Wyodak coal zone.
DISCUSSION
Trends in Water Quality and Sr Isotopic Composition in Gillette–Schoonover Area
Because this part of the basin was the first to be developed for the CBNG resource, the preliminary studies by Frost et al. (2001, 2002) were focused on wells located between Gillette and Wright (here referred to as the Gillette area; see area outlined on Fig. 2). Most of these wells were completed in the Upper Wyodak coal zone. Our new analyses include a number of samples further westward into the basin, here referred to as the Schoonover area (Fig. 2). Many of these wells are completed within the Wyodak Rider coal zone, in a thick seam informally called “Big George.” The TDS, SAR, and
KnoblochL. WyodakU. WyodakWy. RiderShallow coalSandstoneClinker
ClCa
Figure 4. Trilinear diagram showing major ion composition of water from coal, clin-ker, and sandstone aquifers in Powder River Basin. Although water samples from shallow clinker, sandstone, and coal aquifers have variable composition, all waters from deeper wells (>40 m or 125 ft) are of sodium-carbonate type. Data from this study and Frost et al. (2001).

Rocky Mountain Geology, v. 43, no. 2, p. 149–175, 14 figs., 2 tables, November, 2008 161
SR ISOTOPES IN WATER CO-PRODUCED WITH COAL BED NATURAL GAS
87Sr/86Sr ratios for waters from these wells are plot-ted in Figures 7, 8, and 11 as functions of distance from the recharge area along the eastern margin of the basin. Water from the Upper Wyodak coal zone is low in SAR (<10) and TDS (<1,000 mg/L), and TDS increases slightly with increasing distance from the recharge zone (Figs. 7 and 8). Water from the Wyodak Rider coal zone extends the trend to higher TDS and SAR, particularly for samples more than 50 km from the recharge zone. The 87Sr/86Sr ratios in waters of the Upper Wyodak coal zone in the Gillette-Schoonover area show an increasing ratio with increasing distance from the recharge zone, as described by Frost et al. (2002; Fig. 11). However, waters from the Wyodak Rider coal zone fall below this trend and extend to
very low ratios. The sandstone-aquifer waters in the Schoonover area are similarly low in 87Sr/86Sr. The trend in results for TDS from CBNG co-produced waters implies an increase in dissolved solids with increased water-residence time. The correlation of 87Sr/86Sr ratios in waters of the Upper Wyodak coal zone with distance into the basin from the recharge zone suggests that the 87Sr/86Sr ratio increases with increased water–rock interaction along the flow path.
Water from shallow-sandstone aquifers in the Gillette and Schoonover areas has relatively unradio-genic 87Sr/86Sr isotopic ratios, irrespective of distance from the recharge area (Frost et al., 2002; Brinck and Frost, 2007). As a result, the distinction between Upper Wyodak coal zone waters and water from shallow-sandstone aquifers becomes pronounced for
Figure 5. Total dissolved solids (TDS) in ground water co-produced with coal-bed natural gas. TDS are lowest in eastern parts of basin, and highest values occur along 106° W longitude. Water-quality data from Table 1.

162 Rocky Mountain Geology, v. 43, no. 2, p. 149–175, 14 figs., 2 tables, November, 2008
C. E. CAMPBELL, B. N. PEARSON, AND C. D. FROST
wells located more than 5 km into the basin. That suggests the Upper Wyodak aquifer system is isolated from other, shallower-sandstone aquifers.
In contrast, one ground-water sample collected from a deep sandstone, G71S (1,450 ft), has a Sr isoto-pic ratio and TDS indistinguishable from a neighbor-ing Upper Wyodak well (1,448 ft deep). Moreover, where Upper Wyodak coals are in direct contact with overlying sandstones as determined from gamma-log analysis (e.g., samples G13U, G14U, and G20U), the water samples do not have the higher TDS and lower 87Sr/86Sr that might be expected if these wells produced ground water from both coal and a chemi-cally and isotopically distinctive sandstone aquifer. These results suggest that the Upper Wyodak aquifer is composite, composed of both coal and sandstone.
The chemical and isotopic characteristics of ground-water samples from the Wyodak Rider coal zone contrast with those from the Upper Wyodak coal zone. A large range in TDS and 87Sr/86Sr ratios is observed in the Wyodak Rider coal zone waters, particularly at 50 to 70 km into the basin from the eastern recharge zone. In some cases this may reflect well completion. Two of the wells, S6W and S7W are perforated to draw water from the coal and overlying sands. Hence elevated TDS and lower 87Sr/86Sr ratios reflect the introduction of water from both aquifers into these wells. For other wells that are open only to coal, the variability may indicate incomplete aquifer isolation and resulting interaction of ground waters between coal and sandstone aquifers. This hypoth-esis is supported by a seismic survey conducted in the
Figure 6. Sodium adsorption ratio (SAR) in ground water co-produced with coal bed natural gas. SAR is low along margins of basin and highest in center at around 106° W longitude. SAR data from Table 1.

Rocky Mountain Geology, v. 43, no. 2, p. 149–175, 14 figs., 2 tables, November, 2008 163
SR ISOTOPES IN WATER CO-PRODUCED WITH COAL BED NATURAL GAS
vicinity of 106° W longitude at Burger Draw by Morozov (2002) that imaged the Big George coal (part of the Wyodak Rider coal zone) and identified complex fault-ing with offsets of approximately 10 meters (30 feet) within the Big George coal and underlying strata. This faulting could cause hydrau-lic connections between coal and other aquifers.
Many Wyodak Rider wells produce higher water-to-gas ratios than average for the Powder River Basin. The average water/gas ratio for 19,158 coalbed natural gas wells that have produced for more than two years is 1.8 bbls/mcf (Surdam et al., 2007), Although 30 per-
cent of the wells studied here that are completed in the Big George seam of the Wyodak Rider coal zone have average or below average water/gas ratios, an equal number have water/gas ratios greater than 20, and 15 percent exceed 100 (Fig. 12; Table 2; Wyoming Oil and Gas Conservation Commission, 2007). By contrast, water/gas ratios for other coal seams include few to no ratios exceeding 20 (Fig. 4; Table 2; Wyoming Oil and Gas Conservation Commission, 2007). The intermediate Sr isotope ratios and elevated TDS compared to other coal aquifer waters, coupled with evidence of faults in the sub-surface, long dewatering periods
and minimal gas production, all suggest that the Wydoak Rider coal zone is not well isolated from adjacent aquifers, particularly in the vicinity of 106° W longitude. We conclude that in the Gillette-Schoonover area, the Upper Wyodak coal zone appears to be isolated, and thus CBNG development likely removes water only from a composite Upper Wyodak aquifer system. On the other hand, the TDS, SAR and Sr isotopic characteristics of some of the waters from Wyodak Rider wells suggest that there may be leakage from adjacent aquifers when these wells are depressur-ized, particularly in the center of the basin.
Possible Influence of Faulting on Sr Isotopic Composition of Ground Water
Northeastern AreaThe Sr isotopic data from the
northeastern part of the Powder River Basin are more scattered than those from the Gillette and Schoonover areas (Fig. 13). Some of the northeast samples plot above the “Gillette trend” as defined by the Upper Wyodak water samples from the Gillette area (Fig. 13); others plot below.
One distinction between the northeastern area and the Gillette–Schoonover areas is the presence of mapped faults in the north-east. These faults could act either as seals or conduits for water and gas f low. The group of samples lying above the Gillette Sr isotopic trend is located in the eastern part of the Northeast area. These sam-ples have comparatively low TDS (<1,000 mg/L). The high 87Sr/86Sr ratios and low TDS suggest that
0
1000
2000
3000
4000
5000
0 10 20 30 40 50 60 70 80
Km from recharge
TDS
Knobloch
Sand
Upper Wyodak
Wyodak Rider
TD
S
Figure 7. Total dissolved solids (TDS) as a function of distance from recharge zone for samples located in Gillette and Schoonover areas. Some ground water from sand-stone aquifers have high TDS. TDS for ground water from coal seams generally increases with increasing distance from recharge; Wyodak Rider ground water sam-ples in the Schoonover area are particularly high. Data from Table 1.

164 Rocky Mountain Geology, v. 43, no. 2, p. 149–175, 14 figs., 2 tables, November, 2008
C. E. CAMPBELL, B. N. PEARSON, AND C. D. FROST
these coals are well isolated from sandstone aquifers and that if faults influence the hydrology of this area, they are acting as seals. It is noteworthy that none of these wells has produced more than 500 MCF gas/month (Wyoming Oi l a nd Ga s C onser va t ion Commission, 2007).
The group of samples lying below the Gillette trend is located northwest of the high 87Sr/86Sr ratio group. These water samples also have higher TDS (1,300–1,800 mg/L). The combination of low 87Sr/86Sr ratios and high TDS sug-gests that in this area the coals are not completely isolated, possi-bly because the faults in this area act as conduits to ground-water flow. Wells in this area are associ-ated with relatively high gas pro-
duction (typically >1.000MCF/month; Wyoming Oil and Gas Conser vat ion Commission, 2007).
Sheridan AreaThe Sheridan sample subset
also illustrates the possible role of faults in increasing recharge rates, decreasing residence time of ground water in coa l and sandstone aquifers, and allowing co-mingling of waters from dif-ferent aquifer types. This area is marked by a number of steeply dipping, east–northeast-trend-ing normal faults (Van Voast et al., 1977; Kanizay, 1978; Love and Christiansen, 1985). Coal-aquifer waters of the Sheridan a rea d i splay lower Sr i soto-
pic ratios than those from the Gillette area (Figs. 9 and 10) and no correlation between isoto-pic ratio and production depth. Like the group of samples from northeastern coal-aquifer water with low 87Sr/86Sr ratios, the TDS of these coal-aquifer waters is elevated (700–1,900 mg/L) relative to the TDS of the Upper Wyodak samples near Gillette. The relatively high TDS of both the northeastern subset and Sheridan area samples suggests that the waters are in the initial phase of ground-water evolu-tion expected for ground waters with short residence times. It is possible that local faults may serve as recharge zones for the coal and sand aquifers. Fault displacements in the Sheridan area of 200–300 ft (Culbertson and Mapel, 1976; Van Voast and Hedges, 1975) could place lithologies with different isoto-pic and geochemical qualities in direct contact, thus providing an intermediate isotope signature between coal and sandstone.
Little to no gas has been pro-duced from any of these wells. The low Sr isotope ratios and lack of gas production suggest: (1) these sam-ples are composed of water from both coal and sandstone aquifers; (2) faults in this region served as conduits for ground-water recharge and flow, complicating the depres-surization process; and/or (3) proximity to recharge area is not favorable for coalbed natural-gas production on the western side of the basin. A combination of these processes appears to limit gas pro-duction and retard development of distinct isotopic and chemical characteristics in produced water between coal and sand aquifers.
0
5
10
15
20
25
30
35
0 10 20 30 40 50 60 70 80
Km from recharge
SAR
Knobloch
Sand
Upper Wyodak
Wyodak Rider
SA
R
Figure 8. Sodium-adsorption ratio (SAR) as a function of distance from recharge area for samples in Gillette and Schoonover areas. As for TDS, SAR values are high-est for water samples from Wyodak Rider coal zone, particularly in Schoonover area. Data from Table 1.

Rocky Mountain Geology, v. 43, no. 2, p. 149–175, 14 figs., 2 tables, November, 2008 165
SR ISOTOPES IN WATER CO-PRODUCED WITH COAL BED NATURAL GAS
Geographic and Temporal Variability Due to Depositional Systems and Sediment Provenance
Although the details are debated, there is gen-eral agreement that the Paleocene and Eocene strata of the Powder River basin were deposited in a f lu-vial/lacustrine environment. Ayers and Kaiser (1984) envisioned a system of deltas supplying Lake Lebo. Each delta had a different source area, and there-fore may have transported clastic material with dif-ferent 87Sr/86Sr ratios. Seeland (1992) suggested a north-flowing fluvial system fed by various uplifts around the basin. Cross bedding in the sandstone aquifers of the Tongue River Member of the Fort Union Formation and of the Wasatch Formation led Flores (1986) to conclude that sediment was variously
sourced from the Big Horn Mountains, Casper Arch, Laramie Mountains, Hartville Uplift, and Black Hills. Some of the variations in 87Sr/86Sr ratio of water produced from coals in different parts of the Powder River Basin may reflect these differences in sediment sources. For example, the samples from the Sheridan area, which have the lowest 87Sr/86Sr ratios, may reflect the dominance of non-radiogenic strontium from Paleozoic and Mesozoic limestone exposed in the northern Big Horn Mountains.
Other variations in 87Sr/86Sr ratio may ref lect temporal changes in depositional systems. For exam-ple, CBNG is being developed in the Buffalo area from the Eocene Lake DeSmet and Felix coals. The Lake DeSmet coals have higher 87Sr/86Sr ratios than
Figure 9. 87Sr/86Sr ratios for water co-produced with coal-bed natural gas. Ratios increase from east to west, with highest ratios occurring for samples from wells located at approximately 106° W longitude. Lowest ratios are from Sheridan area near Wyoming–Montana border. Data from Table 1.

166 Rocky Mountain Geology, v. 43, no. 2, p. 149–175, 14 figs., 2 tables, November, 2008
C. E. CAMPBELL, B. N. PEARSON, AND C. D. FROST
underlying Felix coals, possibly reflecting an increase in the amount of radiogenic (high 87Sr/86Sr ratio) Precambrian detritus being eroded from the Big Horn Mountains as these were uplifted in Eocene time (Whipkey et al., 1991).
Aeolian dust may be an important source of the Sr preserved in coal. A number of studies have determined that the majority of Sr in plant material originates from dry or wet deposition of atmospheric dust (Graustein and Armstrong, 1983; Négrel et al., 1993). The dense, woody vegetation of peat swamps may have trapped airborne dust, and the low-energy environment of the swamps may have allowed dust to settle and be preserved during the coalification process. Some sources of aeolian detritus may be local, but fine atmospheric dust may have been derived from great distances (e.g., Dymond et al., 1974). As for fluvially transported clastic material, the 87Sr/86Sr ratio of aeolian dust deposited in the Powder River Basin may vary spatially and temporally.
Correlation of Sr Isotopic Compositions to Water Enhancement and Resulting Fracture Patterns
The water-enhancement process used to com-plete CBNG wells in the Powder River Basin hydraulically fractures the coal. Water is pumped into the coal seam at a rate of 2,500 gallons per minute for approximately 15 minutes, clean-ing out the coal fines and inducing fractures that may create pathways for gas and water to f low to the wellbore. The orientation of these hydraulic fractures can be determined from the wells’ com-pletion records (Colmenares and Zoback, 2007). Colmenares and Zoback (2007) found that wells with horizontal fractures typically produce less gas than wells with vertical fractures. Some wells with vertical fractures are high water producers (more than 10,000 barrels/month); a large fraction of these produce no gas or have delays in gas produc-tion of about 12 months.
BullwhackerNortheast
Black
Diamond
Gillette
Schoonover
Sheridan
Buffalo
0.720
0.718
0.716
0.714
0.712
0.710
0.708
0.706
Figure 10. 87Sr/86Sr ratios by coal zone and location in Powder River Basin. In most areas of Powder River Basin, 87Sr/86Sr ratios do not distinguish different coal zones. But in Buffalo area, water from Lake DeSmet coal zone is more radiogenic than water from Felix coal zone. In Black Diamond development area of northeastern part of basin, water from Lower Wyodak coal zone is more radiogenic than water from the Upper Wyodak coal zone. Data from Table 1.

Rocky Mountain Geology, v. 43, no. 2, p. 149–175, 14 figs., 2 tables, November, 2008 167
SR ISOTOPES IN WATER CO-PRODUCED WITH COAL BED NATURAL GAS
We have obta ined water samples and Sr isotopic composi-tions for 50 of the wells for which Colmenares and Zoback (2007) identif ied fracture patterns to determine whether fracture pat-tern and/or water and gas pro-duction correlates with 87Sr/86Sr ratio. Of these, 47 are vertically fractured, and 3 are horizontally fractured. The vertically frac-tured wells were subdivided into two groups: those wells that are high water producers (more than 6,000 bbls/month or 1,000 cubic meters/month) and those that are low water producers. Overall, there appears to be little correla-
tion among Sr isotopic composi-tion, fracture pattern, or water/gas ratio. The average 87Sr/86Sr ratio is only slightly lower for water from vertically fractured, low water producers compared to vertically fractured high water producers (Fig. 14). However, in the south-eastern corner of Johnson County, in the small, 10 km by 10 km Bullwhacker area (Fig. 2), where wells have been drilled into the Wyodak Rider coal zone, the dif-ferent fracture patterns are associ-ated with different 87Sr/86Sr ratios. In this area, the vertically frac-tured, high water producing wells have 87Sr/86Sr = 0.71055–0.71271;
vertically fractured, low water pro-ducing wells have higher 87Sr/86Sr = 0.71200–0.71536; and the one horizontally fractured well has the highest 87Sr/86Sr = 0.71806. The lack of a strong correla-tion between 87Sr/86Sr ratio and fracture pattern is not surpris-ing. A correlation would not be expected unless the fractures pro-duce hydraulic connections that allow water to be introduced into the coal seam from another, iso-topically distinct aquifer. If the fractures do not propagate verti-cally into another aquifer because no sand horizons are within the thickness affected by fracturing (typically 30 meters or 100 feet), then no excess water production or perturbation of Sr isotopic ratio is expected. Moreover, even if another aquifer were intersected by the induced fractures, this aquifer must contain water with a differ-ent 87Sr/86Sr ratio in order to affect the Sr isotopic ratio of the CBNG produced water.
CONCLUSIONS
The Sr i sotopic rat ios of ground waters from coal in the Powder River Basin of Wyoming are influenced by a number of fac-tors including the coal zone from which ground waters are with-drawn, ground water residence time in a particular aquifer, the degree to which coal aquifers are confined, and geographic location. These factors and their effects on Sr isotopic ratios are summarized below.
1. The Upper Wyodak coal zone aquifer in the Gillette and Schoonover areas appears to be composed of a combined sand- and coal-aquifer unit. The ground
0.71
0.711
0.712
0.713
0.714
0.715
0.716
0.717
0 20 40 60 80
Km from recharge
87Sr/
86S
Knobloch
Sand
Upper Wyodak
Wyodak Rider
87S
r/8
6S
r
Figure 11. 87Sr/86Sr ratios as a function of distance from recharge area for water sam-ples in Gillette and Schoonover areas. Note the regular increase in Sr-isotope ratio for samples from Upper Wyodak coal zone; this is suggested to reflect water–rock inter-action along flow path in a well-confined aquifer. The Wyodak Rider samples depart from this trend, particularly in the Schoonover area, and may reflect incomplete iso-lation of this coal aquifer from deep sandstone aquifers containing less radiogenic (lower) 87Sr/86Sr ratios. Data from Table 1.

168 Rocky Mountain Geology, v. 43, no. 2, p. 149–175, 14 figs., 2 tables, November, 2008
C. E. CAMPBELL, B. N. PEARSON, AND C. D. FROST
water of the Upper Wyodak coal zone in these areas shows a trend of increasing distance from recharge resulting in more radiogenic ground water due to the continued dissolution of radiogenic Sr-bearing com-ponents of the coal. The TDS value of these wells also increases with increasing distance from recharge due to water–rock interactions along the flow path.
2. The Wyodak Rider coal zone aquifers in the Gillette and Schoonover regions are only partially confined, allowing interactions between sandstone and possibly other coal aquifers with the Wyodak Rider aquifer. This interaction results in a departure from the Upper Wyodak trend with the Wyodak Rider samples showing increased variability with increased distance from the recharge. Wells in the Schoonover area, where the 87Sr/86Sr and TDS vari-ability are more pronounced, also produce, on aver-age, more water than wells from the Gillette Wyodak Rider. Likewise, wells in the Schoonover area may not be completely confined.
3. The 87Sr/86Sr ratios of the coal-aquifer ground water from the Northeast area are more variable than in the Gillette area and may be inf luenced by the presence of faults. Produced water with low 87Sr/86Sr ratios may be influenced by faults apparently acting as conduits for water flow enabling mixing of water from different aquifers. Some samples from the Sheridan area also exhibit low Sr isotopic ratios, and faults in this area also may enhance recharge and flow rates. The low 87Sr/86Sr ratio produced water in the Northeast area is associated with higher gas pro-duction than the high 87Sr/86Sr ratio produced water, suggesting the possibility that the Sr isotopic ratio of water samples from newly drilled wells may help pre-dict the future gas production from the well.
4. Depositional environment may play an impor-tant role in the Sr isotope ratio of ground water throughout the basin. Previous research has identi-fied multiple sources in the surrounding Laramide uplifts for the sediments that compose the Fort Union and Wasatch Formations of the basin. These sources have highly variable ratios of 87Sr/86Sr, which may be imparted to the ground waters from each of these areas. In the western part of the basin, in vicinities of
Big Georgeaverage water/gas
ratio = 67(n = 54, excluding five wellsproducing little to no gas)
Upper Wyodakaverage water/gas ratio = 22(n = 29, excluding one wellproducing no gas)
Andersonaverage water/gas ratio = 14(n = 23)
Canyonaverage water/gas ratio = 3.6(n = 8)
Water/gas ratio (bbls/mcf)0 164 >208 12
2
4
0 164 >208 12
0 164 >208 12
0 164 >208 12
0
6
8
10
12
14
16
2
0
2
0
2
0
4
6
4
Figure 12. Histograms of water/gas production ratios (bbls/mcf ) for wells completed in Big George, Upper Wyodak, Anderson, and Canyon coal seams. A greater proportion of wells completed in Big George coal seam have high water/gas ratios compared to wells in other coal seams. Data from Table 2.

Rocky Mountain Geology, v. 43, no. 2, p. 149–175, 14 figs., 2 tables, November, 2008 169
SR ISOTOPES IN WATER CO-PRODUCED WITH COAL BED NATURAL GAS
Table 2. Water and gas production for wells analyzed in this study.
Sample Name Coal Name Coal Zone
Well Completion
Date1
Water Production
(Bblsmo)1
Gas Production
(Mcf/mo)1
Water/Gas Ratio
(Bbls/mcf )2
Hydraulic Fracture
Pattern3
BD2BU Anderson Upper Wyodak 4/13/06 0 0N24U Anderson Upper Wyodak 10/3/00 31,301 176,287 0.2G34U Anderson Upper Wyodak 11/18/99 109,946 175,972 0.6N32U Anderson Upper Wyodak 8/13/99 159,266 245,232 0.6N5L Anderson Upper Wyodak 5/26/99 80,840 105,990 0.8N9U Anderson Upper Wyodak 6/12/03 271,517 304,034 0.9
SH3U Anderson Upper Wyodak 12/4/99 145,994 112,883 1.3G19U Anderson Upper Wyodak 2/9/99 116,349 78,148 1.5N31W Anderson Wyodak Rider 1/17/01 89,064 46,341 1.9G31U Anderson Upper Wyodak 8/23/99 240,314 108,736 2.2G16U Anderson Upper Wyodak 12/16/98 178,509 73,549 2.4G32U Anderson Upper Wyodak 9/7/99 543,279 156,808 3.5G29U Anderson Upper Wyodak 5/11/99 308,452 67,223 4.6N12U Anderson Upper Wyodak 1/3/00 166,618 21,140 7.9G9U Anderson Upper Wyodak 5/31/98 968,824 121,805 8.0
N11U Anderson Upper Wyodak 8/10/99 594,698 60,797 9.8N33U Anderson Upper Wyodak 8/25/00 122,656 9,321 13.2G7U Anderson Upper Wyodak 12/6/96 1,017,185 69,006 14.7
N29W Anderson Lower Wyodak Rider 5/23/05 59,186 3,479 17.0N16L Anderson Lower Wyodak 3/21/00 11,058 462 23.9G8U Anderson Upper Wyodak 7/18/97 1,774,782 69,434 25.6
G27W Anderson Wyodak Rider 6/1/99 186,907 5,645 33.1N28U Anderson Lower Upper Wyodak 6/3/05 70,009 1,861 37.6G26W Anderson Wyodak Rider 6/28/99 680,020 9,615 70.7
BD3BU Anderson Upper Wyodak 3/30/06 3,789 0BD5BU Anderson Upper Wyodak 3/26/06 4,435 0BD8AU Anderson Upper Wyodak 3/20/06 0 0BW17W Big George Wyodak Rider 2/11/05 25,348 125,838 0.2 V-L
S9W Big George Wyodak Rider 9/26/03 247,186 1,212,450 0.2 V-LS14W Big George Wyodak Rider 6/15/05 47,102 132,770 0.4 V-L
BW16W Big George Wyodak Rider 2/10/05 91,601 231,960 0.4 V-LBW21W Big George Wyodak Rider 2/7/05 67,249 125,554 0.5 V-LBW15W Big George Wyodak Rider 2/14/05 94,605 161,042 0.6 V-LG65W Big George Wyodak Rider 11/30/99 175,859 173,191 1.0G53W Big George Wyodak Rider 8/3/01 179,334 170,797 1.0 V-LG57W Big George Wyodak Rider 7/26/01 198,495 183,931 1.1 V-LG51W Big George Wyodak Rider 7/10/01 205,444 159,121 1.3 V-LG43W Big George Wyodak Rider 3/13/01 113,115 86,406 1.3 V-LG55W Big George Wyodak Rider 4/30/01 198,331 142,405 1.4 V-LG58W Big George Wyodak Rider 5/30/01 124,942 77,122 1.6 V-LS6W Big George Wyodak Rider 3/17/99 78,057 46,399 1.7S5W Big George Wyodak Rider 12/5/03 64,803 37,848 1.7 V-L
G47W Big George Wyodak Rider 2/27/01 33,607 17,993 1.9 H-LBW18W Big George Wyodak Rider 1/24/05 193,959 102,829 1.9 V-HBW12W Big George Wyodak Rider 1/31/05 158,976 66,911 2.4 V-HG56W Big George Wyodak Rider 6/11/01 169,790 71,022 2.4 V-LG48W Big George Wyodak Rider 3/12/01 76,012 30,891 2.5 H-LG52W Big George Wyodak Rider 5/22/01 157,409 56,594 2.8 V-LS15W Big George Wyodak Rider 6/20/05 94,197 31,969 2.9 V-LS13W Big George Wyodak Rider 8/16/05 27,966 8,351 3.3 V-LG50W Big George Wyodak Rider 7/20/01 222,043 66,262 3.4 V-LG60W Big George Wyodak Rider 5/14/01 209,259 52,521 4.0 V-LBW4W Big George Wyodak Rider 1/18/05 226,831 53,860 4.2 V-H
Table 2. Water and gas production for wells analyzed in this study (continued on pages 170–171).

170 Rocky Mountain Geology, v. 43, no. 2, p. 149–175, 14 figs., 2 tables, November, 2008
C. E. CAMPBELL, B. N. PEARSON, AND C. D. FROST
Table 2. Water and gas production for wells analyzed in this study (continued).
Sample Name Coal Name Coal Zone
Well Completion
Date1
Water Production
(Bblsmo)1
Gas Production
(Mcf/mo)1
Water/Gas Ratio
(Bbls/mcf )2
Hydraulic Fracture
Pattern3
G63W Big George Wyodak Rider 8/18/99 704,401 142,119 5.0S11W Big George Wyodak Rider 5/25/05 67,889 8,790 7.7 V-LS3W Big George Wyodak Rider 8/24/00 699,414 72,258 9.7 V-H
G46U Big George Upper Wyodak 4/23/01 43,105 3,683 11.7BW11W Big George Wyodak Rider 7/15/05 249,760 17,769 14.1 V-H
S2W Big George Wyodak Rider 8/21/00 602,820 41,235 14.6 V-HBW5W Big George Wyodak Rider 1/20/05 268,360 18,331 14.6 V-HBW9W Big George Wyodak Rider 3/29/05 276,075 18,366 15.0 V-H
BW19W Big George Wyodak Rider 1/12/05 256,541 16,977 15.1 V-HBW3W Big George Wyodak Rider 1/25/05 260,618 17,217 15.1 V-H
S4W Big George Wyodak Rider 10/4/00 469,688 29,216 16.1BW14W Big George Wyodak Rider 2/24/05 236,336 11,783 20.1 V-H
S10W Big George Wyodak Rider 3/16/05 449,245 20,420 22.0 V-HBW7W Big George Wyodak Rider 4/6/05 163,870 7,265 22.6 V-H
BW22W Big George Wyodak Rider 8/10/05 226,108 7,971 28.4BW10W Big George Wyodak Rider 4/7/05 185,207 5,424 34.1 V-H
S12W Big George Wyodak Rider 7/5/05 25,847 700 36.9 V-LBW20W Big George Wyodak Rider 1/18/05 179,012 3,843 46.6 V-HBW1W Big George Wyodak Rider 1/12/05 310,776 4,208 73.9 V-H
S7W Big George Wyodak Rider 7/5/00 1,774,190 21,393 82.9BW13W Big George Wyodak Rider 2/21/05 197,063 1,178 167.3 V-H
G44U Big George Upper Wyodak 4/16/01 145,396 684 212.6BW6W Big George Wyodak Rider 4/26/05 220,471 633 348.3 H-HG33W Big George Wyodak Rider 11/3/99 223,105 583 382.7BW2W Big George Wyodak Rider 2/7/05 170,360 407 418.6 V-HBW8W Big George Wyodak Rider 4/5/05 189,931 266 714.0 V-HG45U Big George Upper Wyodak 4/9/01 210,740 259 813.7G18U Big George Upper Wyodak 11/2/98 438,107 25 little gasG41W Big George Wyodak Rider 5/4/00 1,083,991 0 no gasG66W Big George Wyodak Rider 3/22/01 59,363 0 no gasS8W Big George Wyodak Rider 6/29/01 182,915 0 no gasB3F Bull Creek Felix 12/3/99 58,471 0 no gas
B7LD Bull Creek Lake De Smit 12/7/00 2,405 15 160.3G59U Canyon Upper Wyodak 5/28/03 72,843 196,464 0.4 V-LN6L Canyon Lower Wyodak 3/29/99 190,086 219,243 0.9N7U Canyon Upper Wyodak 6/21/99 138,656 125,610 1.1
N25U Canyon Upper Wyodak 5/18/05 119,114 69,019 1.7N8L Canyon Lower Wyodak 5/20/03 349,685 129,604 2.7
N23U Canyon Upper Wyodak 1/5/01 79,708 10,733 7.4G25U Canyon Upper Wyodak 5/11/99 141,868 12,562 11.3SH1U Carney Upper Wyodak 3/17/99 410,725 35,670 11.5
BD1AL Cook Lower Wyodak 4/6/06 0 0BD1BL Cook Lower Wyodak 4/7/06 0 0BD4AL Cook Lower Wyodak 3/24/06 2,483 0BD4BL Cook Lower Wyodak 3/25/06 2,483 0BD7AL Cook Lower Wyodak 3/29/06 0 0BD7BL Cook Lower Wyodak 3/30/06 0 0
BD10AL Cook Lower Wyodak 3/22/06 3,262 0BD10BL Cook Lower Wyodak 3/22/06 3,262 0
N10L Cook Lower Wyodak 10/19/99 308,219 296,916 1.0N19L Cook Lower Wyodak 12/19/00 222,890 105,917 2.1N21L Cook Lower Wyodak 9/14/00 503,291 8,253 61.0N22U Cook Upper Wyodak 11/7/00 59,655 211,876 0.3N26K Cook Knobloch 5/23/05 243,665 339 718.8B4F Felix Felix 11/15/99 49,768 0 no gas
G10U Fort Union Upper Wyodak 12/18/97 639,031 277,089 2.3

Rocky Mountain Geology, v. 43, no. 2, p. 149–175, 14 figs., 2 tables, November, 2008 171
SR ISOTOPES IN WATER CO-PRODUCED WITH COAL BED NATURAL GAS
Table 2. Water and gas production for wells analyzed in this study (continued).
Sample Name Coal Name Coal Zone
Well Completion
Date1
Water Production
(Bblsmo)1
Gas Production
(Mcf/mo)1
Water/Gas Ratio
(Bbls/mcf )2
Hydraulic Fracture
Pattern3
G14U Fort Union Upper Wyodak 6/15/98 403,374 445,701 0.9N3L Lower Canyon Lower Wyodak 5/30/98 262,714 38,879 6.8
SH2U Monarch Upper Wyodak 3/23/99 368,481 11,062 33.3SH4L Monarch Lower Wyodak 2/17/00 471,213 330,768 1.4N4L Pawnee Lower Wyodak 2/10/99 104,683 44,537 2.4
G12K Pawnee/Cache Knobloch 8/9/99 225,683 0 no gasB1LD Ucross Lake De Smit 1/17/00 36,862 0 no gasB2LD Ucross Lake De Smit 9/7/99 108,971 129 844.7B6LD Ucross Lake De Smit 3/27/01 287 0 no gasN14U Upper Canyon Upper Wyodak 2/16/00 93,530 300,176 0.3N18U Upper Canyon Upper Wyodak 1/4/01 117,648 170,351 0.7B5F Upper Felix Felix 3/12/01 27,496 0 no gas
BD6AL Wall Lower Wyodak 3/8/06 0 0BD9AL Wall Lower Wyodak 3/9/06 0 0N15L Wall Lower Wyodak 1/13/00 129,731 107,168 1.2N17L Wall Lower Wyodak 8/16/00 1,417,653 11,059 128.2N20L Wall Lower Wyodak 12/19/00 135,922 61,558 2.2N27L Wall Lower Wyodak 5/3/05 197,061 0 no gasN30K Wall Knobloch 7/19/00 355,376 0 no gasS1U Wall Upper Wyodak 9/21/89 322,501 333 968.5
N13K Wall/Pawnee Knobloch 11/4/99 212,441 36,464 5.8G62U Wyodak Upper Wyodak 8/6/98 178,596 534,643 0.3G24U Wyodak Upper Wyodak 6/28/99 133,624 192,863 0.7G4U Wyodak Upper Wyodak 6/14/96 185,393 258,313 0.7G21U Wyodak Upper Wyodak 2/11/99 302,648 420,034 0.7G20U Wyodak Upper Wyodak 2/1/99 316,751 439,084 0.7G28W Wyodak Wyodak Rider 3/4/99 438,787 570,071 0.8G30U Wyodak Upper Wyodak 8/6/99 522,576 505,167 1.0G11U Wyodak Upper Wyodak 1/21/98 289,224 264,160 1.1G54U Wyodak Upper Wyodak 5/10/01 141,861 124,152 1.1 V-LG23U Wyodak Upper Wyodak 1/29/99 424,118 276,469 1.5G2U Wyodak Upper Wyodak 4/11/95 401,219 249,271 1.6G17U Wyodak Upper Wyodak 11/2/98 1,269,443 780,749 1.6G37U Wyodak Upper Wyodak 4/12/00 177,898 100,597 1.8 V-LG6U Wyodak Upper Wyodak 11/23/96 388,341 180,140 2.2G49U Wyodak Upper Wyodak 10/26/00 206,900 95,596 2.2 V-LG3U Wyodak Upper Wyodak 4/5/96 477,164 211,107 2.3G39U Wyodak Upper Wyodak 7/18/00 217,490 68,309 3.2 V-LG1U Wyodak Upper Wyodak 2/10/93 1,273,509 387,359 3.3G22U Wyodak Upper Wyodak 1/27/99 709,555 150,555 4.7G64U Wyodak Upper Wyodak 5/26/99 912,817 191,734 4.8G61U Wyodak Upper Wyodak 5/20/98 742,141 85,480 8.7G5U Wyodak Upper Wyodak 10/15/96 790,452 67,914 11.6G13U Wyodak Upper Wyodak 6/22/98 824,389 45,816 18.0G36U Wyodak Upper Wyodak 4/5/00 399,984 13,602 29.4N1U Wyodak Upper Wyodak 1/30/90 2,512,405 57,071 44.0G15U Wyodak Upper Wyodak 6/10/97 1,379,519 26,330 52.4G38U Wyodak Upper Wyodak 4/7/00 138,415 1,503 92.1G42U Wyodak Upper Wyodak 5/25/00 284,509 879 323.7 V-LG35U Wyodak Upper Wyodak 9/15/00 154,770 6 little gasG40U Wyodak Upper Wyodak 4/27/00 154,251 0 no gas V-L
1Production data from the Wyoming Oil and Gas Conservation Commission (2007). 2Water/gas ratios indicated only for wells more than 2 years old.3Hydraulic fracture pattern as identified by Colmenares and Zoback (2007).

172 Rocky Mountain Geology, v. 43, no. 2, p. 149–175, 14 figs., 2 tables, November, 2008
C. E. CAMPBELL, B. N. PEARSON, AND C. D. FROST
Buffalo and Sheridan, CBNG pro-duced waters tend to have lower 87Sr/86Sr ratios than those in the central and eastern margin of the basin, the Northeast, Schoonover, and Gillette areas. Temporal changes in depositional environ-ment may explain the higher Sr isotopic ratios of water withdrawn from the Lake DeSmet coal zone compared to the underlying Felix coal zone in the vicinity of Buffalo. We also note that the water and gas production from the Eocene coals appears to be significantly lower than that of the Paleocene coals. That conclusion is based on a limited number of samples, how-ever, and additional evaluation is warranted.
5. Evaluating the direction of fractures propagated during the water-enhancement process, coupled with the 87Sr/86Sr of the produced water, may be useful in evaluating wells with minimal gas production and high water pro-duction. Vertically fractured coal seams where sandstone is present within 30 meters (100 feet) above or below the coal are most likely to be in hydraulic communication with sandstone aquifers. However, water from two aquifers must have distinctive Sr isotope ratios in order for the direction of fracture propagation to be correlated with the Sr isotopic ratio of the pro-duced water.
ACKNOWLEDGMENTS
The work presented here is based upon the M.S. thesis research of B. N. Pearson (2002) and C. E. Campbell (2007). The authors thank David Lucke for cartographic assistance and E. B. Meredith, K. J. Reddy and J.
0.71
0.711
0.712
0.713
0.714
0.715
0.716
0.717
0 20 40 60 80
Km from recharge
87Sr/
86S
Knobloch
Lower Wyodak
Sand
Upper Wyodak
Wyodak Rider
Eastern wells,Northeast area
Northwestern wells,Northeast area
"Gillette trend"
87S
r/8
6S
r
Figure 13. 87Sr/86Sr ratios as a function of distance from recharge area for water samples in northeast area. These data form two groups that correspond to distinct geographic areas; one plots above Gillette trend and the other below. The group of samples lying above Gillette Sr-isotopic trend have comparatively low TDS, whereas samples lying below Gillette trend have higher TDS and lower 87Sr/86Sr ratios. Coals yielding latter group of water samples may be affected by faults that act as conduits to ground-water flow. Data from Table 1.
0.1
1
10
100
1000
0.710 0.711 0.712 0.713 0.714 0.715 0.716 0.717 0.718 0.719
87Sr/86S
Water/gas ratio (bbls/mcf)
V-LH-LH-HV-H
Wate
r/g
as
rati
o (
bb
ls/
mcf
)
Figure 14. Water/gas production ratios for wells with known fracture patterns as a function of 87Sr/86Sr ratios. V-H = vertical high-water producing wells; V-L = verti-cally fractured low water-producing wells; H-L = horizontally fractured, low-water producing wells; and H-H = horizontally fractured, high water-producing wells. Data from Tables 1, 2, and Wyoming Oil and Gas Commission (2007).

Rocky Mountain Geology, v. 43, no. 2, p. 149–175, 14 figs., 2 tables, November, 2008 173
SR ISOTOPES IN WATER CO-PRODUCED WITH COAL BED NATURAL GAS
Wheaton for helpful reviews. This study was sup-ported by the Abandoned Coal Mine Land Research Program at the University of Wyoming, administered by the Land Quality Division from funds returned to Wyoming from the Office of Surface Mining of the U.S. Department of the Interior. Additional funds were provided by Department of Energy under Award Number DE-FC26-05NT 15549: Produced water management and beneficial use — task 3. This report was prepared as an account of work spon-sored by an agency of the United States Government. Neither the U.S. Government nor any agency thereof, nor any of their employees, makes any war-ranty, express or implied, or assumes any legal liabil-ity or responsibility for the accuracy, completeness, or usefulness of any information, apparatus, prod-uct, or process disclosed, or represents that its use would not infringe privately owned rights. Reference herein to any specific commercial product, process, or service by trade name, trademark, manufacturer, or otherwise does not necessarily constitute or imply its endorsement, recommendation, or favoring by the U.S. Government or any agency thereof. The views and opinions of authors expressed herein do not nec-essarily state or reflect those of the U.S. Government or any agency thereof.
REFERENCES CITED
A d m i n i s t r a t i v e R u l e o f M o n t a n a 17. 3 0 .167 0 . http://161.7.8.61/17/17-2757.htm (accessed December, 2007).
Ayers, W. B., Jr., 1986, Lacustrine and f luvial deltaic depo-sitional systems, Fort Union Formation (Paleocene), Powder River Basin, Wyoming and Montana: American Association of Petroleum Geologists Bulletin, v. 70, p. 1651–1673.
Ayers, W. B., Jr., and Kaiser, W. R., 1984, Lacustrine–interdeltaic coal in the Fort Union Formation (Paleocene), Powder R iver Basin, Wyoming and Montana, in Rahmani, R. A., and Flores, R. M., eds., Sedimentology of coal and coal bearing sequences: International Association of Sedimentologists, Special Publication 7, p. 61–84.
Bank, G. C. and Kuuskraa, V. A., 2006, The economics of Powder River Basin coalbed methane development, Department of Energy: http://www.fossil.energy.gov/programs/oilgas/publications/coalbed_methane/06_prb_study.pdf (accessed December, 2007).
Bureau of Land Management—Wyoming: http://www.blm.gov/wy/st/en/programs/energy/Coal_Resources/PRB_Coal/production.html (accessed December, 2007).
Brinck, E., and Frost, C. D., 2007, Detecting infiltration and impacts of introduced water using strontium isotopes: Ground Water, v. 45, p. 554–569.
Brinck, E. L., Drever, J. I., and Frost, C. D., in press, The geochemical evolution of water co-produced with coal bed natural gas in the Powder River Basin, Wyoming: Environmental Geosciences.
Campbell, C. E., 2007, Strontium isotopes as tracers of water co-produced with coal bed natural gas in the Powder River Basin, Wyoming [M.S. thesis]: Laramie, University of Wyoming, 124 p.
Colmenares, L. B., and Zoback, M. D., 2007, Hydraulic fracturing and wellbore completion of coalbed methane wells in the Powder River Basin, Wyoming: Implications for water and gas production: American Association of Petroleum Geologists Bulletin, v. 91, p. 51–67.
Culbertson, W. C., and Mapel, W. J., 1976, Coal in the Wasatch Formation, northwest part of the Powder River Basin near Sheridan, Sheridan County, Wyoming, in Geology and Energy Resources of the Powder River, Wyoming Geological Association 28th Annual Field Conference Guidebook, p. 193–201.
Daddow, P. B., 1986, Potentiometric surface map of the Wyodak–Anderson coal bed, Powder River structural basin, Wyoming, 1973–1984: U.S. Geological Survey Water Resources Investigations Report 85-4305, scale 1:250,000, 1 sheet.
Davis, R. W., 1976, Hydrologic factors related to coal devel-opment in the eastern Powder River Basin, in Geology and energy resources of the Powder River: Wyoming Geological Association 28th Annual Field Conference Guidebook, p. 203–207.
DeBruin, R. H., and Lyman, R. M., 1999, Coalbed methane in Wyoming, in Miller, W. R. ed., Coalbed methane and the Tertiary geology of the Powder River Basin Wyoming and Montana: Wyoming Geological Association 50th Annual Field Conference Guidebook, p. 61–72.
Drever, J. I., 1997, The geochemistry of natural waters: Upper Saddle River, NJ, Prentice Hall, 436 p.
Dymond, J., Biscaye, P. E., and Rex, R. W., 1974, Eolian origin of mica in Hawaiian soils: Geological Society of America Bulletin, v. 85, 37–40.
Ellis, M. S., 1999, U.S. Geological Survey 1999 assessment of Wyodak–Anderson coal resources in the Powder River Basin, Wyoming and Montana, in Miller, W. R. ed., Coalbed methane and the Tertiary geology of the Powder River Basin Wyoming and Montana: Wyoming Geological Association 50th Annual Field Conference Guidebook, p. 43–60.
Energy Information Administration Annual Coal Report for 2006: http://www.eia.doe.gov/cneaf/coal/page/acr/acr_sum.html (accessed December, 2007).

174 Rocky Mountain Geology, v. 43, no. 2, p. 149–175, 14 figs., 2 tables, November, 2008
C. E. CAMPBELL, B. N. PEARSON, AND C. D. FROST
Essington, M. E., 2004, Soil and water chemistry: An integra-tive approach: Boca Raton, Florida, CRC Press, 552 p.
Flores, R. M., 1986, Styles of coal deposition in Tertiary alluvial deposits, Powder River Basin, Montana and Wyoming, in Lyons, P. C., and Rice, C. L., eds., Paleoenvironmental and tectonic controls in coal-forming basins of the United States: Geological Society of America Special Paper 210, p. 79–104.
Flores, R. M., and Bader, L. R., 1999, Fort Union coal in the Powder River Basin, Wyoming and Montana: A synthe-sis: U.S. Geological Survey Professional Paper1625-A, Chapter PS, 75 p.
Flores, R. M., and Ethridge, F. G., 1985, Evolution of intermontane f luvial systems of Tertiary Powder River Basin, Montana and Wyoming, in Flores, R. M., and Kaplan, S. S., eds., Cenozoic paleogeography of west-central United States: Rocky Mountain Paleogeography Symposium 3, Denver, Colorado: The Rocky Mountain Section, Society of Economic Paleontologists and Mineralogists, p. 107–126.
Frost, C. D., and Brinck, E., 2005, Strontium isotopic tracing of the effects of coal bed natural gas (CBNG) development on shallow and deep groundwater systems in the Powder River Basin, Wyoming: Wyoming State Geological Survey Report of Investigations 55, p. 93–107.
Frost, C. D., Pearson, B. N., Ogle, K. M., Heffern, E. L., and Lyman, R. M., 2002, Sr isotopic tracing of aquifer interac-tions in an area of coal and methane production, Powder River Basin, Wyoming: Geology, v. 30, p. 923–926.
Frost, C. D., Viergets, J. E., Pearson, B. N., Heffern, E. L., Lyman, R. M., and Ogle, K. M., 2001, Sr isotopic identi-fication of coal and sandstone aquifers and monitoring of aquifer interactions in an area of active coalbed-methane production, Powder River Basin, Wyoming, in Stilwell, D. P., ed., Wyoming gas resources and technology: Wyoming Geological Association 52nd Annual Field Conference Guidebook, p. 107–122.
Glass, G. B., 1976, Update on the Powder River coal basin, in Geology and energy resources of the Powder River: Wyoming Geological Association 28th Annual Field Conference Guidebook, p. 209–220.
Graustein, W. C., and Armstrong, R. L., 1983, The use of strontium-87/strontium-86 ratios to measure atmospheric transport into forested watersheds: Science, v. 219, p. 289–292.
Hinaman, K., 2005, Hydrogeologic framework and estimates of ground-water volumes in Tertiary and Upper Cretaceous hydrogeologic units in the Powder River Basin, Wyoming: U.S. Geological Survey Scientific Investigations Report 2005–5008, 18 p.
Kanizay, S. P., 1978, Preliminary geologic map of the Sheridan area, northwestern Powder River Basin, Wyoming: U.S.
Geological Survey Miscellaneous Field Studies Map MF-1043, scale 1:50,000, 1 sheet.
Lee, R. W., 1981, Geochemistry of water in the Fort Union Formation of the northern Powder River Basin, southeast-ern Montana: U.S. Geological Survey Water-Supply Paper 2076, 17 p.
Love, J. D., and Christiansen, A. C., 1985, Geologic map of Wyoming: U.S. Geological Survey, State Geologic Map, scale 1:500,000, 3 sheets.
Lyman, R. M., and Hallberg, L. L., 2000, Wyoming coal mines and markets: Wyoming State Geological Survey Coal Report CR 00-1, 11 p.
McLellan, M. W., Biewick, L. R. H., Molnia, C. L., and Pierce, F. W., 1990, Cross sections showing the recon-structed stratigraphic framework of Paleocene rocks and coal beds in the northern and central Powder River Basin, Wyoming and Montana: U.S. Geological Survey Map I-1959-A, scale 1:500,000, 2 sheets.
McPherson, B. J. O. L., and Chapman, D. S., 1996, Thermal analysis of the southern Powder River Basin, Wyoming: Geophysical Research Letters, v. 61, p. 1689–1701.
Montgomery, S. L., 1999, Powder River Basin, Wyoming: An expanding coalbed methane (CBM) play: American Association of Petroleum Geologists Bulletin, v. 83, 1207–1222.
Morozov, I., 2002, County line CDP seismic survey, in Institute for Energy Research/Anadarko Coal Bed Methane Project Phase 1 (June 2001–February 2002) Final Report, 11 p.
Négrel, P., Allegre, C. J., Dupre, B., and Lewin, E., 1993, Erosion sources determined by inversion of major and trace element ratios and strontium isotopic ratios in river water: The Congo Basin case: Earth and Planetary Science Letters, v. 120, p. 59–76.
Pearson, B. N., 2002, Sr isotope ratio as a monitor of recharge and aquifer communication, Paleocene Fort Union Formation and Eocene Wasatch Formation, Powder River Basin, Wyoming and Montana [M.S. thesis]: Laramie, University of Wyoming, 151 p.
Rankl, J. G., and Lowry, M. E., 1985, Ground-water-f low systems in the Powder River structural basin, Wyoming and Montana: U.S. Geological Survey Water Resources Investigations Report 85-4229, 39 p.
Rice, C. A., Ellis, M. S., and Bullock, J. H., Jr., 2000, Water co-produced with coalbed methane in the Powder River Basin, Wyoming: Preliminary compositional data: U.S. Geological Survey Open-File Report 00-372, 18 p.
Seeland, D., 1992, Depositional systems of a synorogenic con-tinental deposit: The upper Paleocene and lower Eocene Wasatch Formation of the Powder River Basin, northeast, Wyoming: U.S. Geological Survey Bulletin 1917-H, 20 p.
Surdam, R. C., Jiao, Z., Clarey, K., DeBruin, R. H., Bentley, R., Stafford, J., Deiss, A., Ewald, M., 2007, An evalua-

Rocky Mountain Geology, v. 43, no. 2, p. 149–175, 14 figs., 2 tables, November, 2008 175
SR ISOTOPES IN WATER CO-PRODUCED WITH COAL BED NATURAL GAS
tion of coalbed methane production trends in Wyoming’s Powder River Basin: A tool for resource management: Wyoming State Geological Survey Challenges in Geologic Resource Development No. 3, 42 p.
Van Voast, W. A., and Hedges, R. B., 1975, Hydrogeologic aspects of existing and proposed strip coal mines near Decker, southeastern Montana: Montana Bureau of Mines and Geology Bulletin 97, 31 p.
Van Voast, W. A., Hedges, R. B., and McDermott, J. J., 1977, Hydrogeologic conditions and projections related to mining near Colstrip, southeastern Montana: Montana Bureau of Mines and Geology Bulletin 102, 43 p.
Wheaton, J., and Donato, T., 2004, Coalbed-methane basics: Powder River Basin, Montana: Montana Bureau of Mines and Geology Information Pamphlet 5, 25 p.
Whipkey, C. E., Cavaroc, V. V., and Flores, R. M., 1991, Uplif t of the Bighorn [sic] Mountains, Wyoming and Montana—A sandstone provenance study: U.S. Geological Survey Bulletin 1917-D, 20 p.
Wyoming Oil and Gas Conservation Commission: http://www.wogcc.state.wy.us/ (accessed December, 2007).
Wyoming State Geological Survey Coal Section: http://www.wsgs.uwyo.edu/Coal/CBM_Info.aspx (accessed December, 2007)
Manuscript Submitted February 11, 2008
Revised Manuscript Submitted July 14, 2008
Manuscript Accepted September 6, 2008