“strong, profitable growth seizing the indian dth
TRANSCRIPT

“Strong, profitable growth seizing
the Indian DTH opportunity.”
NASDAQ: VDTH
12 February 2018
Key Operating & Financial Highlights
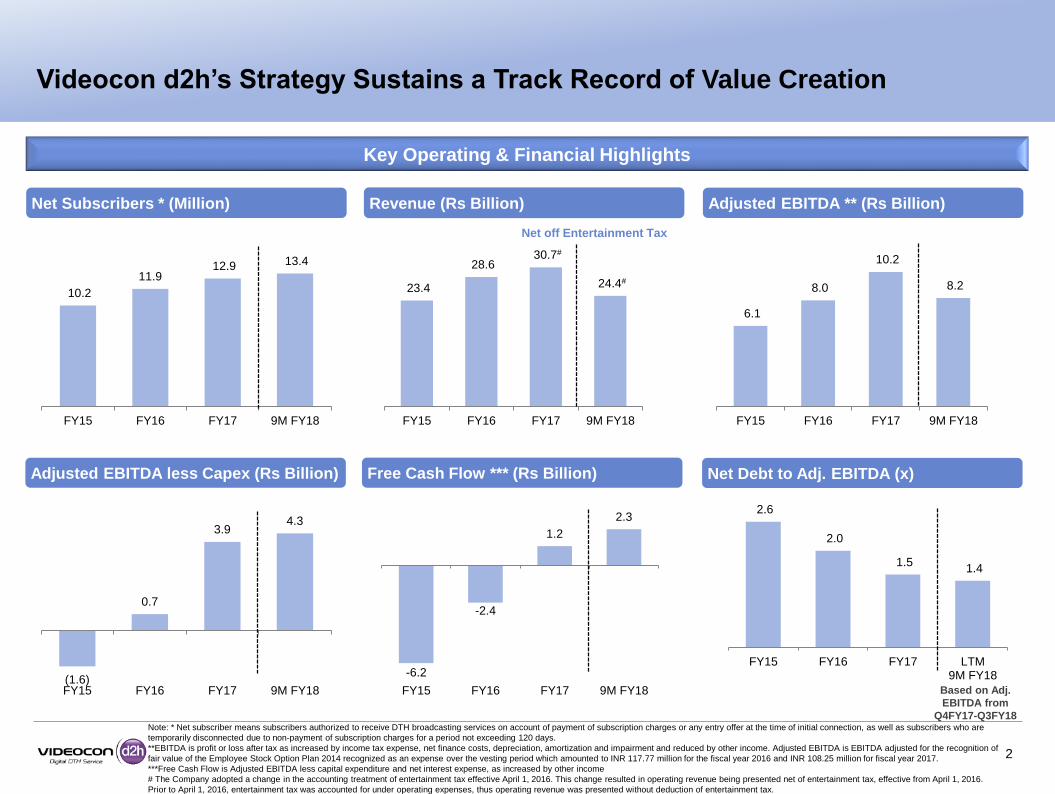
Videocon d2h’s Strategy Sustains a Track Record of Value Creation
2
10.2
11.912.9 13.4
FY15 FY16 FY17 9M FY18
23.4
28.6 30.7#
24.4#
FY15 FY16 FY17 9M FY18
6.1
8.0
10.2
8.2
FY15 FY16 FY17 9M FY18
Net Subscribers * (Million) Revenue (Rs Billion) Adjusted EBITDA ** (Rs Billion)
-6.2
-2.4
1.2
2.3
FY15 FY16 FY17 9M FY18(1.6)
0.7
3.9 4.3
FY15 FY16 FY17 9M FY18
2.6
2.0
1.5 1.4
FY15 FY16 FY17 LTM9M FY18
Adjusted EBITDA less Capex (Rs Billion) Net Debt to Adj. EBITDA (x)Free Cash Flow *** (Rs Billion)
Net off Entertainment Tax
Note: * Net subscriber means subscribers authorized to receive DTH broadcasting services on account of payment of subscription charges or any entry offer at the time of initial connection, as well as subscribers who are
temporarily disconnected due to non-payment of subscription charges for a period not exceeding 120 days.
**EBITDA is profit or loss after tax as increased by income tax expense, net finance costs, depreciation, amortization and impairment and reduced by other income. Adjusted EBITDA is EBITDA adjusted for the recognition of
fair value of the Employee Stock Option Plan 2014 recognized as an expense over the vesting period which amounted to INR 117.77 million for the fiscal year 2016 and INR 108.25 million for fiscal year 2017.
***Free Cash Flow is Adjusted EBITDA less capital expenditure and net interest expense, as increased by other income
# The Company adopted a change in the accounting treatment of entertainment tax effective April 1, 2016. This change resulted in operating revenue being presented net of entertainment tax, effective from April 1, 2016.
Prior to April 1, 2016, entertainment tax was accounted for under operating expenses, thus operating revenue was presented without deduction of entertainment tax.
Based on Adj.
EBITDA from
Q4FY17-Q3FY18

• Build subscriber base through distribution & marketing
• Enhance revenue realization through superior service & differentiated offering
• Strong focus on localization & premiumization
• Lead market in technological innovation
• Enhance operational efficiencies & improve margins
Strategy Drives Sustainable, Strong Growth
3

0.6
0
0.5
9
0.5
8
0.4
7 0.6
3
0.4
5
0.5
6
0.4
3
0.2
3
0.2
5
0.1
4
0.1
3
0.2
1
0.1
6
Q1FY17
Q2FY17
Q3FY17
Q4FY17
Q1FY18
Q2FY18
Q3FY18
Gross additions Net additions
2.6
4
2.6
5
2.2
4
1.6
4
1.7
4
1.6
8
1.0
5
0.5
0
FY15 FY16 FY17 9M FY18
Gross additions Net additions
12
.29
12
.52
12
.77
12
.91
13
.04
13
.25
13
.41
Q1FY17
Q2FY17
Q3FY17
Q4FY17
Q1FY18
Q2FY18
Q3FY18
Net Subscriber Base
10
.18
11
.86
12
.91
13
.41
FY15 FY16 FY17 9M FY18
Net Subscriber Base
Net Subscriber Base (mn)
Net Subscriber Base (mn)
Strong Subscriber Growth
Gross & Net Subscriber Additions (mn)
Gross & Net Subscriber Additions (mn)
4
Source: Company data
Note: Gross subscribers means total registered subscribers.

Backed by founders with 30+ years of experience in Distribution
3 generations old loyalty in market relationship with the founder family
75% of DTH display counters in retail stores have d2h demo
Large shelf space occupied by brands under the parent group
93% penetration (reach) against Industry average of 85%
Market reach of more than 250,000 Retail stores1
6
2
5
Pan-India Distribution Channel Supports Sustainable Growth
5
4
3
Source: Company estimates

Strong Brand Partnerships & Associations
Source: Company data
6

• Building subscriber base through distribution & marketing
• Enhance revenue realization through superior service & differentiated offering
• Strong focus on localization & premiumization
• Lead market in technological innovation
• Enhance operational efficiencies & improve margins
Strategy Drives Sustainable, Strong Growth
7

0.4
9% 0.9
5%
0.8
7%
0.8
7%
1.2
7%
0.6
2%
1.0
0%
Q1FY17
Q2FY17
Q3FY17
Q4FY17
Q1FY18
Q2FY18
Q3FY18
21
1
20
9
20
5
19
6
19
8 21
2
20
8
Q1FY17
Q2FY17
Q3FY17
Q4FY17
Q1FY18
Q2FY18
Q3FY18
0.8
0%
0.7
3%
0.8
0%
0.9
6%
FY15 FY16 FY17 9M FY18
19
6 20
7
20
7
20
6
FY15 FY16 FY17 9M FY18
Monthly Churn (%)
Annual ARPU (Rs)
Rising ARPU and Stable Churn
Monthly Churn (%)
Quarterly ARPU (Rs)
8
Based on Total revenue net off
Entertainment tax & Dealer margin
Source: Company data
Note: Churn has been calculated as the number of subscribers who have not made payment for at least 120 days and is the difference between the number of gross
subscribers and the number of net subscribers.

Strong Focus on Customer Service Lowers Churn
Dealer calls the call centre and gives customer details for
installation or customer complaint
Call centre raises a work
order and passes the
details to the respective
service center
Service centre assigns work order for installation or
customer complaint to an engineer
2,800+ Distributors & Direct DealersMarket reach of over 250,000 Retail stores
Fastest growing DTH company in India with 13.41 million
delighted net subscribers (1)
Nearly 320 direct service centers
97%+ installations within 2-4 hours85%+ repairs within 6-8 hours
Source: Company data
Note: (1) As of December 31, 2017 9

d2h Proprietary Services: Fulfilling the Content Gap
Source: Company data
10

• Building subscriber base through distribution & marketing
• Enhance revenue realization through superior service & differentiated offering
• Strong focus on localization & premiumization
• Lead market in technological innovation
• Enhance operational efficiencies & improve margins
Strategy Drives Sustainable, Strong Growth
11
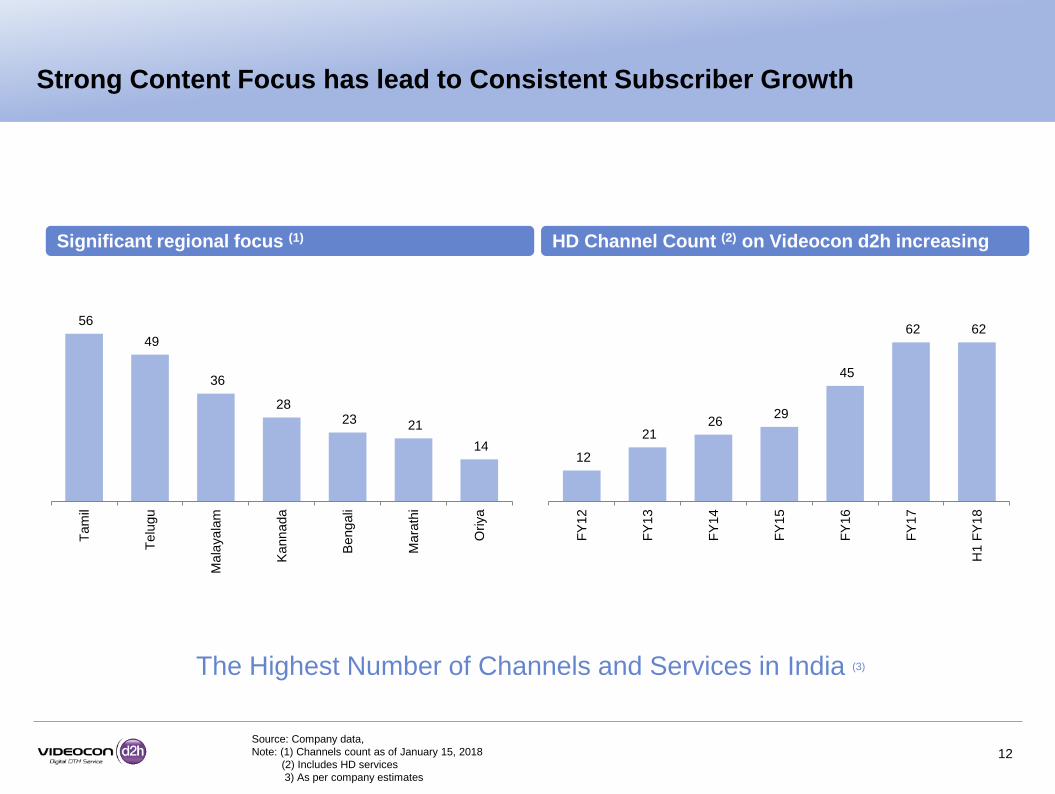
56
49
36
28 23 21
14
Tam
il
Telu
gu
Ma
laya
lam
Kann
ada
Beng
ali
Ma
rath
i
Oriya
Strong Content Focus has lead to Consistent Subscriber Growth
12
Source: Company data,
Note: (1) Channels count as of January 15, 2018
(2) Includes HD services
3) As per company estimates
12
21 26
29
45
62 62
FY
12
FY
13
FY
14
FY
15
FY
16
FY
17
H1
FY
18
HD Channel Count (2) on Videocon d2h increasingSignificant regional focus (1)
The Highest Number of Channels and Services in India (3)

• Building subscriber base through distribution & marketing
• Enhance revenue realization through superior service & differentiated offering
• Strong focus on localization & premiumization
• Lead market in technological innovation
• Enhance operational efficiencies & improve margins
Strategy Drives Sustainable, Strong Growth
13

Constantly Redefining the Viewing Experience: Be Future Ready
14Source: Company data
Latest Technology New Offerings Product Innovation
Technology & Innovations
HEVC
DVB S2
1000 GB HD
DVR
Radio Frequency
RemoteMPEG4
DVB S2Connected Set Top Box
Transforming your TV into a hub of entertainment and knowledge
• MPEG-4 and HEVC technology converts your existing TV into a Smart TV
• Offering a wide range of proprietary services including Smart English, Smart Games, d2h Music, d2h Spice, d2h
Cinema, d2h Cooking, d2h NachLe, d2h Hollywood, d2h Darshan
• India’s First Radio Frequency Remote available to the consumer
• New DVR product can record up to 1,000 GB of content, translating to 1,775 hours of recording
• Connected Set Top Box plugs into any TV enabling apps to stream straight to your TV

• Building subscriber base through distribution & marketing
• Enhance revenue realization through superior service & differentiated offering
• Strong focus on localization & premiumization
• Lead market in technological innovation
• Enhance operational efficiencies & improve margins
Strategy Drives Sustainable, Strong Growth
15

Note: * FY15 Adjusted EBITDA is before accounting for one off securities issue expenses of Rs 105.43 mn and Employee Share based Compensations cost of Rs.
29.74 mn towards provision of ESOP plan of 2014; Q1-Q4 FY16 & Q1-Q4 FY17 Adjusted EBITDA is before accounting for Employee Share based Compensations
cost towards provision of ESOP plan of 2014
1,872 1,869
1,924 1,923
1,865
1,7471,714
Q1 FY17 Q2 FY17 Q3 FY17 Q4 FY17 Q1 FY18 Q2 FY18 Q3 FY18
23
.4 28
.6
30
.7
24
.4
6.1
*
8.0
*
10
.2*
8.2
26.1%28.1%
33.1% 33.6%
-5%
0%
5%
10%
15%
20%
25%
30%
35%
40%
0
5
10
15
20
25
30
35
FY15 FY16 FY17 9M FY18
Revenue EBITDA EBITDA %
209 216207 206
5561
69 69
FY15 FY16 FY17 9M FY18
Total revenue per sub EBITDA per sub
7.6 7.8
7.8
7.5 7.7 8
.3
8.3
2.5
*
2.6
*
2.7
*
2.4
*
2.5 2.8 2.9
33.0% 33.8% 34.4%31.3% 32.2% 33.6% 35.0%
0%
5%
10%
15%
20%
25%
30%
35%
40%
0
9
Q1FY17
Q2FY17
Q3FY17
Q4FY17
Q1FY18
Q2FY18
Q3FY18
Revenue EBITDA EBITDA %
Revenue and EBITDA per avg. net sub (Rs per month)
Annual Revenue & Adjusted EBITDA (Rs billion)
Consistent Profitability Reflects Videocon d2h’s Industry Leadership
Hardware Subsidy per Sub (Rs)
Quarterly Revenue & Adjusted EBITDA (Rs billion)
Source: Company data
Revenue from FY17 is net off
Entertainment Tax
16
Revenue for FY17 is net off
Entertainment Tax

7,501
6,502
7,6497,269
6,249
3,899
FY13 FY14 FY15 FY16 FY17 9M FY18
36.2% 37.8% 39.9% 40.6%
17.2% 16.0% 15.4% 14.8%
21.1% 18.6% 11.9% 11.0%
25.5% 27.6% 32.8% 33.6%
FY15 FY16 FY17 9M FY18
Content costs Fixed costsVariable costs Reported EBITDA margin
38.7% 38.7% 39.6% 42.5% 42.0% 39.7% 40.1%
16.1% 15.0% 13.9%16.6% 14.9% 14.2% 12.4%
12.5% 12.7% 12.4%10.2% 10.9% 12.5% 12.5%
32.7% 33.6% 34.1% 30.7% 32.2% 33.6% 35.0%
Q1FY17
Q2FY17
Q3FY17
Q4FY17
Q1FY18
Q2FY18
Q3FY18
Content costs Fixed costs Variable costs Reported EBITDA margin
(6,728)
(2,580)(1,558)
744
3,932 4,306
FY13 FY14 FY15 FY16 FY17 9M FY18
Capex (Rs mn)
Videocon d2h Finances Managed to Sustain Growth, Minimize Risk
Adjusted EBITDA* less capex (Rs mn)
Source: Company data
Fixed, Variable and Content Cost (% of Revenue) Fixed, Variable and Content Cost (% of Revenue)
Revenue used
for the
calculation is
net off
entertainment
tax starting
FY17
17Note: * Adjusted EBITDA for FY15 is before accounting for one off securities issue expenses and Employee Share based Compensations costs towards provision of
ESOP plan of 2014; Adjusted EBITDA for Q1FY16 to Q4FY17 is before accounting for Employee Share based Compensations costs towards provision of ESOP
plan of 2014.
Adjusted EBITDA* less capex (Rs mn)
Fixed, Variable and Content Cost (% of Revenue)

Videocon d2h Investment Profile Reflects Management’s Value Building
Approach
18
World’s fastest growing pay TV market in
the fastest growing “large economy”
Leading distribution, customer
service and content offering
Seize Upside Potential
Build Downside Protection
Strong balance sheet with low leverage
Strong Board structure SEC compliant financial reporting
Strong revenue and EBITDA growth
driven by operating leverage
Robust free cash flow generation potential
Strong market presence and industry
leading share of subscriber additions

Videocon d2h Extends its Value Creation Track Record
Rs in mn Q1FY17 Q2FY17 Q3FY17 Q4FY17 Q1FY18 Q2FY18 Q3FY18
INCOME
Revenue from operations 7,633 7,762 7,774 7,549 7,726 8,346 8.337
7,633 7,762 7,774 7,549 7,726 8,346 8.337
EXPENSE
Operating expense 3,994 4,052 4,074 4,071 4,142 4,391 4,436
Employee benefits expense 322 315 302 349 277 240 289
Administration and other expenses 178 183 220 235 208 276 189
Selling and distribution expenses 640 607 527 575 614 633 508
Depreciation, amortization and impairment 1,711 1,685 1,697 1,773 1,793 1,816 1,843
Total Expenses 6,845 6,843 6,820 7,003 7,034 7,357 7,266
Profit / (Loss) from operations 787 919 954 546 692 989 1,071
Finance costs/Finance Income (Net) (759) (717) (653) (687) (678) (763) (630)
Other Income 9 9 10 24 3 17 13
Profit/(loss) before tax 38 211 311 (117) 17 243 454
Income tax expense
Current tax - - - - - - -
Deferred tax 11 63 93 (29) 5 75 146
Profit/(Loss) after tax 27 148 218 (87) 12 168 309
Strongest Financial Results to Date
19

Market Cap as on Dec 31, 2017: USD 1,010 million
Free Float: 35.5%
Shares Outstanding: 424,997,937
NASDAQ: VDTH