strong-motion data from the superstition hills earthquakes of 0154 … · geological survey...
TRANSCRIPT

GEOLOGICAL SURVEY OPEN-FILE REPORT 87-672
STRONG-MOTION DATA FROM THE
SUPERSTITION HILLS EARTHQUAKES OF
0154 AND 1315 CGMT), NOVEMBER 24, 1987
By
R. Porcella, E. Etheredge, R. Maley, and J. Switzcr
With contributions from
A. Acosta, R. Forshee, D. Johnson,
J. Nielson, and M. Salsman
DECEMBER 1987
This report is preliminary and has not been reviewed for conformity with U.S. Geological Survey editorial standards

CONTENTS
Page
Introduction
The Imperial Valley strong-motion network Background ------------Historical strong-motion data ---
Data from National Strong-Motion Instrumentation Network Stations --------------------------- 3
Ms=6.2 earthquake -------------------- 3Ms=6.6 earthquake -------------------- 5Special Arrays --------------------- Q
Geotechnical data, Imperial Valley accelerograph stations - - 11
Temporary aftershock sites ------------------13
Acknowledgements -----------------------13
References --------------------------14
ILLUSTRATIONS
Figure 1. USGS accelerograph stations in the Imperial Valleyregion ----------------------- 4
2. Accelerograms from the Ms=6.2 earthquake at:Superstition Mountain Site 8 -______-_ 22Parachute Test Site ---------------22Salton Sea Wildlife Refuge -----------23Calipatria Fire Station -------------23
Imperial Wildlife Liquefaction Array ------ 24Brawley Airport -----------------25Plaster City ------------------25Ocotillo Wells -----------------26
El Centre Array:Station 10 ------------------ 26Station 9 ------------------27Station 8 ------------------27Station 7 --------------- -^- - 28Station 6 ------------------28Station 5 ---------------->-- 29
El Centro Differential Array ----------29El Centro Array Station 4----------~--30Coachella Canal Station 3------------ 30El Centro Array Station 11 -----------31

ILLUSTRATIONS
Page
Figure 2. Meadows Union School --------------31(con't) El Centre Array Station 12 -----------32
Calexico Fire Station --------------32Bonds Corner (SMA) ------------- =-- 33Bonds Corner (RFT) ---------------33Coachella Canal Station 2------------ 34Coachella Canal Station 1 ------------34
3. Accelerograms from the Ms=6.6 earthquake at:Superstition Mountain Site 8 ----------35Parachute Test Site ---------------35Plaster City ------------------36Ocotillo Wells -----------------36Imperial Wildlife Liquefaction Array ------ 37Salton Sea Wildlife Refuge -----------33Brawley Airport -----------------38Calipatria Fire Station -------------39
El Centre Array:Station 13 ------------------ 39Station 10 ------------------ 40Station 11 ------------------ 40Station 9 ------------------41Station 8 ------------------41Station 12 ------------------ 42Station 7 ------------------42Station 6 ------------------43
El Centro Differential Array ----------43El Centro Array Station 5------------ 44El Centro, Meadows Union School ---------44Borrego Springs ----------------- 45El Centro Array:
Station 4 ------------------45Station 3 ------------------45Station 2 ------------------46Station 1 ------------------47
Calexico Fire Station --------------47Coachella Canal Station 3------------ 48Coachella Canal Station 2------------ 48Bonds Corner (SMA) ---------------49Bonds Corner (RFT) ---------------49Rancho De Anza -----------------50Coachella Canal Station 1------------5QTerwilliger Valley, Anza Array ---------51Chihuahua, Anza Array ----------- -^ - - 51Pinyon Flat Obsv., Anza Array ----------52Indio ----------------------52Tule Canyon, Anza Array -----------^---53Cahuilla Valley, Anza Array ----------53

ILLUSTRATIONS
Page
Figure 3. Garner Valley, Anza Array ----------^--54(con't) Thousand Palms -----------------54
North Palm Springs --------------- 55POE (temp.) -----------------1-56KNB (temp.) -------------------55
4. Cross section showing sensor locations at theImperial Wildlife Liquefaction Array --------10
5. Comparison of S-wave interval velocities at El Centre Array Station 9 ------------------12
TABLES
Table 1. Strong-motion data from the Ms=6.2 Superstition Hillsearthquake ---------------------15
2. Strong-motion data from the Ms=6.6 Superstition Hills earthquake --------------------- 13
Iv

INTRODUCTION
On November 24, 1987 at 0132 G.m.t. an ML=4.3 earthquake occurred in
southeastern California near the southern margin of the Salton Sefc. This
event was followed by an ML=4.0 earthquake at 0153 and an Ms=6.2 earthquake at
0154. During the first 18 hours at least 19 earthquakes of magnitude 4.0 or
greater occurred, including an Ms=6.6 earthquake at 1315 (U.S. Geological
Survey, 1987). This largest event was felt as far away as San Diego and Los
Angeles, Calif., Tempe, Ariz., and Las Vegas, Nevada; the earthquake caused at
least 2 deaths and more than $4 million in property damage in the Imperial
Valley of southeastern Calif, and northeastern Baja Calif, (imperial Valley
Press, Nov. 27, 1987). The purpose of this report is to disseminate informa
tion about strong-motion data recorded at USGS stations in the Imperial
Valley, Calif, region during the two earthquakes that occurred on November 24
at 0154 and 1315 G.m.t. (Ms=6.2 and 6.6). Additionally, we include a brief
history of strong-motion recording in this region, and finally, some results
of recent geotechnical investigations at strong-motion stations in the
Imperial Valley, Calif.
THE IMPERIAL VALLEY STRONG-MOTION NETWORK
Background
In July 1932 a U.S. Coast and Geodetic Survey standard accelerograph was
installed in the Southern Sierra Power Co. substation at 302 Commercial Ave.
in El Centre, Calif. (This station is now designated El Centre array station
9). This initial Imperial Valley station was one part of a regional network
designed to gather strong-motion data from active regions in the^western
United States (Matthiesen and Porcella, 1980). On May 18, 1940 an M=7.0
earthquake near El Centre triggered the standard accelerograph as well as

strong-motion instruments located in San Diego, San Bernardino, and Los
Angeles. One recording, the well-known El Centre accelerogram, has been used
worldwide in earthquake engineering studies as representative of ground motion
from a strong local earthquake. On February 9, 1971 a moderate earthquake
near San Fernando, Calif., caused extensive property damage, including failure
of several recently designed structures in the Los Angeles area. One result
of this event was a substantial increase in the 1970's in the rate of instal
lation of strong-motion stations operated by several organizations, including
the U.S. Geological Survey, the Calif. Division of Mines and Geology, the
University of Southern Calif., and the Calif. Institute of Technology. By
October 15, 1979, when an M=6.5 earthquake ruptured the Imperial fault near El
Centre, there were more than 30 USGS strong-motion stations operating in the
Imperial Valley region.
Historical Strong-Motion Data
Approximately 700 strong-motion records have been recovered from USGS
stations in the Imperial Valley since the first accelerograph was installed in
1932. About 250 of these records were recovered prior to the 1979 Imperial
Valley earthquake. This M=6.5 event triggered 43 stations including the 13-
station El Centre Array (see figure 1), a 42-km long array perpendicular to
the Imperial fault, and produced maximum horizontal ground accelerations
greater than 0.5 g_ ait seven stations within 10 km of the Imperial fault rup
ture. The 1979 data set also contains 260 aftershock records from 21 stations
within 30 km of the main shock surface rupture, and now constitutes the most
comprehensive collection of near-source strong ground motion ever~ recorded
(Porcella and others, 1982). On April 26, 1981 the entire El Centre Array was
triggered for the second time; an ML=5.6 earthquake near Westmorland, Calif.

was recorded by 22 USGS strong-motion stations at epicentral distances as
large as 70 km. The maximum recorded ground acceleration was 0.23 g_ at the
Parachute Test Site, epicentral distance 20 km (Maley and Etheredige, 1981).
The two largest shocks (Ms=6.2 and Ms=6.6) of the November 1987 Supersti
tion Hills earthquakes produced at least 65 accelerograms from nearly 40 sta
tions in the greater Imperial Valley region. The accelerogram from Supersti
tion Mtn. contains one of the most significant combinations of high accel
eration/long duration yet recorded at any ground station. Perhaps an equal
number of accelerograms was recorded during the more than 20 ML=4.0 or greater
foreshocks and aftershocks that occurred during the first 72 hours. The
Ms=6.6 shock was the third time the 13-station El Centro Array was triggered
by a single event, and the third time in less than fifty years a magnitude
6.5-7 local earthquake was recorded at the El Centro Commercial Ave. station.
DATA FROM STATIONS IN THE
NATIONAL STRONG-MOTION INSTRUMENTATION NETWORK
At least 33 earthquakes of ML=3.5 or greater were recorded during an
18-hour period on November 24, 1987 (G.m.t.), in the Imperial Valley of south
eastern California (fig. 1), including the Ms=6.2 event at 0154 and Ms=6.6
event at 1315 G.m.t. (see tables 1 and 2, beginning on page 15). This section
contains information about the strong-motion data recorded during these two
earthquakes at National Strong-Motion Instrumentation Network (NSMIN) stations
in the greater Imperial Valley region, including copies of the records from
both events (see figures 2 and 3, beginning on page 22).
Ms=6.2 Earthquake Data '_
Peak horizontal ground accelerations recorded during the Ms=6.2 shock

Cah
uilla
T
arw
llli
ge
r V
alle
y
*!"_
»«_
Chi
huah
ua
V A
Hoa
pita
San
Die
ME
XIC
O
EXPL
ANAT
ION
ACCE
LERO
GRA
PH
Trig
gere
do
Not
trigg
ered
(op
erat
iona
l)
EP
ICE
NTE
R
^M
ag
. 6
.6
: if
M
ag.
6.3
- 3
4»N
-33
«N
117«
W11
6«W
115«
W
Fig
ure
1.
USG
S st
rong
-mot
ion
stat
ions
in t
he r
egio
n of
the
Nov
embe
r 24
, 19
87 S
uper
stit
ion
Hil
ls e
arth
quak
es.
Tri
gger
inf
orm
atio
n re
fers
to
the
1315
G.m
.t. e
vent
.

exceed 0.1 £ at six stations. These stations, and their corresponding epicen-
tral distances and peak motions include Superstition Mountain, 13 km, 0.13 _g_;
Parachute Test Site, 18 km, 0.13^; Salton Sea, 20 km, 0.18 ^Imperial
Wildlife, 24 km, 0.13 £; and Calipatria, 26 km, 0.22 £. Peak motions are
significantly smaller at most stations beyond 26 km (see table 1), and appear
to be low for an event of this magnitude. However, these peak-motion versus
distance data compare favorably with data recorded at similar distances during
the ML=5.6 Westmorland earthquake of April 26, 1981 (Maley and Etheredge,
1981).
Ms=6.6 Earthquake Data
Accelerographs at 39 NSMIN stations were triggered during the Ms=6.6
shock (fig. 1). One station, Holtville, failed completely because of a faulty
accelerograph starter. Maximum horizontal ground accelerations exceed 0.1 £_
at 25 stations within an epicentral distance of 60 km. Peak motion data from
these 25 stations, excluding Calipatria (0.32 £_, 34 km), approach or exceed
0.3 jg_ only at those stations within a relatively narrow band extending
southeast of the epicenter, approximately parallel to the Superstition Hills
fault (see figure 1 and table 2). Stations within an epicentral distance of
60 km outside of this band recorded peak motions in the 0.1 g_ - 0.2 g_ range or
less; and several of these lower peak motions are from sites at distances
closer than the stations to the southeast.
Superstition Mountain station. The Superstition Mountain accelerograph,
the closest NSMIN instrument (7 km), recorded approximately 30 "events" during
an uninterrupted duration of about 7 1/2 minutes after triggering. This
accelerogram contains information that was not recorded at any other station,
including S-P intervals for many of the earliest aftershocks. Superstition

Mountain is a linear granitic block that protrudes approximately 180 in above
the valley floor. The accelerograph is installed at ground level in a garage-
size one-story reinforced concrete building used as a camera site^for U.S.
Navy operations. The record contains peak horizontal accelerations and strong
durations that are among the largest and longest ever recorded in the 55 year
history of the program.
Maximum accelerations exceeded 0.9 g_ and 0.7 g_ in the two horizontal
directions and more than 0.6 g_ in the vertical direction (fig. 3, page 35).
The duration of strong shaking, defined as the number of seconds acceleration
pulses exceed 0.1 _g_, ranged from 15.8 to 16.9 s in the three directions (table
2). This range of strong shaking may be compared with those recorded at
strong-motion stations during other significant earthquakes, for example:
Long Beach March 10, 1933 2.5 - 5.0 s
El Centre May 18, 1940 9.0 - 26.0 s
Taft July 21, 1952 14.0 - 26.0 s
Pacoima Dam February 9, 1971 9.0 - 10.0 s
Bonds Corner October 15, 1979 12.0 - 13.3 s
A comparison of the Superstition Mountain record, which had numerous ac
celeration pulses greater than 0.5 £, with records from the two stations with
substantially longer durations of strong shaking, that is, El Centre (1940)
and Taft (1952), shows the latter contain much lower peak accelerations (in
the range 0.2 _g_- 0.3 _g_). Topographic effects, if any, that could contribute
to such amplification are unknown at this time. Comparisons of the records
from Superstition Mountain and the nearby Parachute Test Site from this event
and those records from the Imperial Valley earthquake of 1979 and the Westmor
land earthquake of April 26, 1981, suggest that amplification may not be sig
nificant. The two later earthquakes produced generally equal or~ greater peak
accelerations and considerably longer durations of strong shaking, generally 3

to 4 times longer at the Parachute Test Site than at the Superstition Mountain
site.
Several aftershock accelerographs were installed after the Ms=6.6 earth
quake, including one at the base of Superstition Mountain to assist in evalua
ting possible topographic amplification. The two records thus far correlated
between the base and top accelerograph stations (approx. 1 km apart) indicate
that for these two events there was no significant amplification at the top of
Superstition Mountain. Peak recorded accelerations and event data are as
follows:
Earthquake Base Station Top Station
November 28, 1987 Horiz. accel. 0.04 g_ 0.08 g_ 0039:10.3 G.m.t. Vert, accel. 0.03 £ 0.06 £ ML=4.2 Horiz. accel. 0.11 %_ 0.07 J, 33.130°N, 115.818°W
December 2, 1987 Horiz. accel. 0.06 g_ 0.08 z. 0403:6.1 G.m.t. Vert, accel. 0.03 £ 0.06^ ML=4.6 Horiz. accel. 0.09 %_ 0.08 g_ 33.157°N, 115.792°W
Parachute Test Site station. The second closest NSMIN accelerograph was
located at ground level in a large, reinforced concrete building approx. 15 m
wide by 40 m long and of widely varying height; it is located at the Parachute
Test Site, approx. 55 m southwest of the November 1987 Superstition Hills
fault surface displacement. The record from this site also shows a relatively
long duration of strong shaking, ranging from 11.3 to 14.5 s (table 2), with
peak accelerations of 0.45 j^ to 0.53 g_ in both horizontal and vertical
directions (fig. 3, page 35). This site's recorded strong ground motion is
nearer to ground rupture than motion recorded at any other site during any
previous California earthquake. The record exhibits long period characteris
tics observed on other records from stations near fault zones, stfch as Cho-
lame-Shandon station 2 during the June 27, 1966 earthquake and El Centre Array

stations 5 and 7 during the October 15, 1979 earthquake. Downhole shear-wave
velocities were measured in 1981 at a 30 m borehole approximately 100 m south-*-
west of the building. The near surface material consists of coarse sand and
fine gravel with a shear-wave velocity measured at 443 m/s betweejj depths of
about 10 and 30 m the highest near-surface S-wave velocity at any of the 22
Imperial Valley sites investigated during the 1981 survey (Porcella, 1984).
Special Arrays
Records were obtained from both the Ms=6.2 and Ms=6.6 earthquakes at co-
located SMA-1 and RFT-250 accelerographs at Bonds Corner, nominally 60 km dis
tant from each event. The RFT-250 instrument was installed in 1982 as part of
an experiment to investigate the cause of high frequency acceleration spikes
observed on the SMA-1 record from this site during the M=6.5 Imperial Valley
earthquake of October 15, 1979. It has been speculated that these spikes may
have been a result of site response, instrumental peculiarity, structural
effects, or some other environmental factor such as an object impacting the
instrument during strong shaking. These two accelerographs have very
different motion sensing pendulums. The SMA-1 pendulum has a gate-type hinge
suspension whereas the RFT-250 pendulum has a unifilar wire suspension. The
latter pendulum system was the standard for the NSMIN for more than 40 years
and its response characteristics were extensively investigated during those
years. The newer gate-type pendulum has been highly successful for nearly 20
years though not as thoroughly studied. By co-locating the two accelerographs
any difference in response would be easily observed. The level- of shaking at
Bonds Corner approached 0.1 j^ and 0.3 g_ for the Ms=6.2 and Ms=6.6 Superstition
Hills earthquakes, respectively, considerably less than the 0.8^ recorded in
1979; and none of the high frequency pulses recorded in 1979 were recorded by

either instrument in 1987. Comparison of the records from the 1987 events
indicates that acceleration traces in common directions are virtual overlays.
A third accelerograph, an RFT-250, also was installed in 19S2 in a small
fiberglass housing, approximately 27 m from the co-located pair, Jto act as a
free field instrument. However, no records were obtained at this site during
the Superstition Hills earthquakes because of an electronic malfunction.
Without the free field record it is impossible to determine if the structure
was related to the high frequency pulses observed in 1979.
A unique record of the Ms=6.6 earthquake was obtained on the Alamo River
flood plain, at the Imperial Wildlife Liquefaction Array 32 km from the
epicenter. This array consists of two triaxial accelerometers, one located at
the surface and the second 6.7 m deep, below a potentially liquefiable zone;
and six pore pressure transducers located within and below the liquefiable
zone (see figure 4). Output from the transducers is transmitted by cable to a
central recorder located at the surface. It was intended that the array data
be used to determine the relations between strong ground motion, pore-water
pressure, and liquefaction (Bennett and others, 1984).
The record, reproduced on page 37, shows acceleration channels 1, 2, and
3 measured at the surface and acceleration channels 4, 5, and 6 measured at a
6.7 m depth. The lower six traces are pore pressure channels, P6 through Pi
as shown in figure 4. Peak surface accelerations were nominally 0.2 g_ with
the exception of a 0.5 s envelope of high frequency vertical motion where
accelerations were larger than 0.4 _g_. Accelerations measured below the
liquefiable zone were somewhat lower, generally in the range 0.10 _g_ to 0.15 j^.
Liquefaction occurred during the earthquake, resulting in numerous sand boils
in the immediate vicinity of the instrumentation array. The pore pressure
data and their relationship to strong shaking and liquefaction are currently

RE
CO
RD
ER
H
OU
SIN
G
ME
TE
RS
nF
PT
H
M1 2 3 4 5 6 7 8 9 10 11
; i
" *
r
13 14
-r-r-r
-5 1
pr
&$
rM
* *
"";
* *.
" «
[ *
, **
.-
." *
. *
."/.
""
SrV
i-§
^
. . *..;'.
": >
:% :
S
ILT
Y
SA
ND
ft *
«
*
". " **
* ** "
.
* ^-
b*^
Z^S
^r'^
ss^^r
S^
SS
" S
ILT
Yf^
- ^S
F*r
» yg
Tt-
Tcs'
CL
AY
,^^
39
?>
4siL
T
^
^ P4
JrC
AS
ED
H
OL
E
7 P
6 »
^m
^v
^»
ft 1 __
_J
VP1
A p J£
^P
2
LIQ
UE
FIA
BLE
LA
YE
R
V P
3
TR
IAX
IAL
AC
CE
LE
RO
ME
TE
R
PIE
ZO
ME
TE
R
. W
AT
ER
T
AB
LE
i -1
f-
»
Fig
ure
4.
Cro
ss s
ecti
on s
how
ing
sens
or l
ocat
ions
at
the
Impe
rial
Wil
dli
fe L
iqu
efac
tion
Arr
ay.

being investigated.
GEOTECHNICAL DATA FROM IMPERIAL VALLEY ACCELEROGRAPR STATIONS£-
Geotechnical investigations in the Los Angeles and San Francisco Bay
regions suggest significant correlations may exist between the shear-wave
velocity and certain physical properties of near-surface materials (Fumal and
others, 1981). The results of these investigations are used to make detailed
comparisons of those geotechnical and seismic characteristics that will allow
quantitative estimates of strong ground motion for a given site, and ultimate
ly development of seismic zonation techniques applicable to other regions.
Site selection criteria for these investigations include distribution of
intensity data and availability of detailed geologic maps and ground motion
data. The Imperial Valley Strong-Motion Network stations thus became prime
candidates for geotechnical investigations after the M=6.5, October 15, 1979
earthquake.
The U.S. Geological Survey began such an investigation in the summer of
1980, including shear-wave velocity surveys at 22 of the 25 stations where
significant ground motions were recorded during the 1979 event (Porcella,
1984). S-wave velocities ranged from 115 m/s in near-surface silty-clay at
Array Station 3 on the east side of the valley to 443 m/s at depths between 10
and 30 m in coarse sand/fine gravel at the Parachute Test site near the west
side of the valley. Although this study measured S-wave velocities for the
first time at many of the 22 sites, there were measurements made by previous
workers at the original Commercial Ave. station and others that were available
for comparison (see figure 5). In general, S-wave velocities were similar at
sites throughout the valley; they averaged about 170 m/s near the surface and
gradually increased to about 340 m/s near a 70 m depth. The Imperial Valley
11

INTERVAL S VELOCITY (M/S)
125 250 375 500
Q. LU Q
60
120
II
L
USGS (Porcella, 1984)
Shannon and Wilson, 1976
Figure 5. Comparison of interval S-wave velocities at the original El Centro Commercial Avenue strong-motion station (from Porcella, 1984).
12

geotechnical study included the following investigations: (1) electronic
cone-penetrometer soundings at nine stations; (2) drilling, sampling, and*-
logging of 22 borings to depths ranging from about 30 to 244 m; (3) downhole
P- and S-wave velocity surveys at 22 stations; (4) high-amplitude.resonant
column tests of undisturbed samples from several stations; and (5) gamma, S-P,
and resistivity logs and caliper and temperature measurements at selected
stations (Porcella, 1984).
TEMPORARY AFTERSHOCK SITES
Temporary strong-motion aftershock stations were established in the epicen-
tral area south of the Salton Sea by USGS personnel from Pasadena and Menlo
Park, Calif. Copies of two accelerograms from Pasadena instruments installed
prior to the Ms=6.6 event have been included at the end of figure 3 on page
56. The aftershock sites, instruments, and recordings are the result of last
minute efforts; related data, therefore, have not been documented and reported
to the same extent as the NSMIN data. Future reports will be issued that
include additional aftershock data from both temporary and NSMIN stations.
ACKNOWLEDGEMENTS
The highly successful operation of the USGS Imperial Valley Strong-Motion
Network, as evidenced by the extensive collection of engineering data recorded
in this region over the past 55 years, is a direct result of the personal
interest and assistance of many local residents in the operation of this
Network. We recognize the cooperation of those individuals associated with
Imperial Valley city and county government agencies, local school and fire
districts, the Imperial Irrigation District, and the U.S. Navy. "Special
appreciation is extended to the many private citizens who have allowed

installation and long-term operation of instrumentation on their property.
REFERENCES I
Bennett, M. J., McLaughlin, P. V., Sarmiento, J., and Youd, T. L^, 1984,
Geotechnical investigation of liquefaction sites, Imperial Valley,
California: U.S. Geol. Survey Open-File Report 84-252, 103 p.
Fumal, T. E., Gibbs, J. F., and Roth, E. F., 1981, In-situ measurements of
Seismic velocity at 19 locations in the Los Angeles, California region:
U.S. Geol. Survey Open-File Report 81-399, 121 p.
Maley, R. P., and Etheredge, E. C., 1981, Strong-motion data from the
Westmorland, California, earthquake of April 26, 1981: U.S. Geol. Survey
Open-File Report 81-1149, 18 p
Matthiesen, R. B., and Porcella, R. L., 1980, Strong-motion data summary,
Imperial Valley earthquake of October 15, 1979 and aftershocks, jin Seismic
Engineering Program Report: U.S. Geol. Survey Circ. 818-C, pp 3-17.
Porcella, R. L., Matthiesen, R. B., and Maley, R. P., 1982, Strong-motion data
recorded in the United States, ir^ The Imperial Valley, California,
earthquake of October 15, 1979: U.S. Geol. Survey Professional Paper 1254,
pp 289-318.
Porcella, R. L., 1984, Geotechnical investigations at strong-motion stations
in the Imperial Valley, California: U.S. Geol. Survey Open-File Report 84-
562, 174 p.
Shannon and Wilson, Inc., and Agbabian Assoc., 1976, Geotechnical and strong-
motion earthquake data from U.S. accelerograph stations: NUREG-0029, 1,
NRC-6, N.T.I.S., Springfield, Virginia 22161.
U.S. Geological Survey, 1987, Preliminary determination of epicenters: No.
47-87, U.S. Govt. Printing Office, Washington, D.C. 20402
14

Table 1.- Strong-motion data from the Me=6.2 Superstition Hills earthquake of November 24, 1987 (0154 G.m.t.)
[Epicentral distance is measured from station to epicenter at lat. 33.07N.* long. 115.79V. Direction of acceleration is for upward trace deflection on the accelerogram.]
STATION IDENTIFICATION
usesNumber
286
5051
5062
5210
5061
5060
5052
5050
412
117
ACCELERATION
Name Coordinates Epicentral Direction Maximum (Location) (degrees N. lat. Distance (degrees} (_g_)
and W. long.) (km)
Superstition Mtn.Site 8(Ground floor)
Parachute Test SiteImler Road(Ground floor)
Salton SeaWildlife Refuge(Ground floor)
Imperial WildlifeLiquefaction Array(Ground level and Downhole)
Note: Ch. 1-3 are mounted
CalipatriaFire Station(Ground floor)
BrawleyAirport Hanger (Ground floor)
Plaster CityStorehouse(Ground floor)
Ocotillo WellsBurro Bend Cafe(Ground floor)
El Centro Array 10Community Hospital(Ground floor)
El Centro Array 9Commercial Ave(Ground floor)
32.955115.823
32.93115.70
33.18115.62
33.10115.53
at surface,
33.13115.52
32.988115.509
32.79115.86
33.14116.13
32.780115.567
32.794115.549
13 135Up045
18 315Up225
20 315Up225
24 Ch. (1) 360Ch. (2) UpCh. (3) 090Ch. (4) 360Ch. (5) UpCh. (6) 090
ch. 4-6 are 6.7 m downhole.
26 315Up225
28 315Up225
32 135Up045
33 315Up225
38 230Up140
38 360Up ;..270
0.13.12.11
.10
.10
.13
.18
.20
.13
.13
.18
.13
.08
.09
.08
.15
.18
.22
.06
.04
.06
.05
.03
.04
.03
.04
.03
.04
.03
.05
.04
.03
.05
Duration (s>0.10 &)
4.81-peak2.6
2-peaks1-peak3.3
2.43.90.8
1.42.70.9 . ._
0.61.60.7
-
- - »
-

Table 1.- Strong-motion data from the Ms=6.2 Superstition Hills earthquake of November 24 3 1987 (0154 G.m.t.) - continued
STATION IDENTIFICATION
usesNumber
958
5028
5158
952
5165
955
5058
464
931
5065
5053
5064
Name (Location)
El Centro Array 8Cruickshank Road(Ground level)
El Centro Array 7Imperial Valley College(Ground floor)
El Centro Array 6Huston Road(Ground level)
El Centro Array 5James Road(Ground level)
El Centro Diff. ArrayDogwood Road(Ground level)
El Centro Array 4Anderson Road(Ground level)
El Centro Array 11McCabe School(Ground floor)
El CentroMeadows Union School(Ground floor)
El Centro Array 12Brockman Road(Ground level)
Coachella CanalStation 3(Ground floor)
CalexicoFire Station(Ground floor)
Coachella CanalStation 2(Ground floor)
Coordinates Degrees N. lat. and W. long.
32.811115.532
32.829115.504
32.839115.487
32.855115.466
32.796115.535
32.864115.432
32.752115.594
32.800115.473
32.718115.637
33.51115.77
32.669115.492
33.56115.95
Epicentral Distance
(km)
38
38
38
39
39
40
40
42
42
49
53
56
ACCELERATION
Direction Maximum (degrees) (_g_)
230Up140 *
230Up140
230Up140
230Up140
360Up270
230Up140
230Up140
230Up140
230Up140
135Up045
315Up225
135 _Up045 .
.06
.04
.04
.05
.03
.03
.05
.02
.05
.11
.02
.08
.07
.03
.07
.03
.02
.02
.05
.03
.04
.05
.02
.05
.05
.01
.04
.04
.04
.03
.04
.03
.05
.03
.02
.02
Duration (s>0.10 _g_)
-
-
1-peak
_
-
-
19

Table 1.- Strong-motion data from the Ms=6.2 Superstition Hills earthquake of November 24 3 198? (0154 G.m.t.) - continued
STATION IDENTIFICATION ACCELERATION
USGS Number
Name (Location)
Coordinates Degrees N. lat. and W. long.
EpicentralDistance
(km)
Direction Maximum Duration (degrees) (g) (s>0.10
5054 Bonds CornerHighway 98 at 115 (Ground floor, SMA)
5054 Bonds CornerHighway 98 at 115 (Ground floor, RFT)
5063 Coachella Canal Station 1 (Ground floor)
32.693115.338
32.693115.338
33.64116.08
59
59
69
230Up140-
230Up140
135Up045
0.09 .02 .06
.09
.02
.06
.08
.05
.08
17

Table 2.- Strong-motion data from the Ms=6.6 Superstition Hills earthquake of November 24, 198? (1315 G.m.t.)
[Epicentral distance is measured from station to epicenter at lat. SS.Olff.j long. 115.86V. Direction of acceleration is for upuard trace deflection on the accelerogram.]
STATION IDENTIFICATION - ACCELERATION
USGS Name Coordinates Epicentral Direction Number (Location) (degrees N. lat. Distance (degrees)
and W. long.) (km)
286
5051
5052
5050
5062
5210
5060
5061
5059
Superstition Mtn.Site 8(Ground floor)
POE, TemporaryAftershock Station(Ground level)
Parachute Test SiteImler Road(Ground floor)
KNB, TemporaryAftershock Station(Ground level)
Plaster CityStorehouse(Ground floor)
Ocotlllo WellsBurro Bend Cafe(Ground floor)
Salton SeaWildlife Refuge(Ground floor)
Imperial WildlifeLiquefaction Array(Ground level and Downhole)
Note: Ch. 1-3 are mounted at
BrawleyAirport Hanger(Ground level)
Call pat rl aFire Station(Ground floor)
El Centre Array 13Strobel Residence(Ground floor)
32.955115.823
33.097115.751
32.93115.70
33.125115.665
32.79115.86
33.14116.13
33.18115.62
33.10115.53
surface,
32.988115.509
33.13115.52
32.709115.683
7 135Up045
14 180Up090
17 315Up225
22 180Up090
24 135Up045
29 315Up225
29 315Up225
32 Ch. (1) 360Ch. (2) UpCh. (3) 090Ch. (4) 360Ch. (5) UpCh. (6) 090
ch. 4-6 are 6.7 m downhole.
33 315Up225
34 315"Up ,225 _
37 230Up140
Maximum <JL>
0.91.65.73
.33
.51
.54
.53
.45
.49
.19
.18
.15
.19
.11
.15
.11
.09
.08
.15
.17
.14
.21
.44
.19
.16
.11
.11
.15
.13
.15
.32
.21
.24
.19
.07
.17
Duration (s>0.10 £)
16.516.915.8
14.817.318.1
11.314.513.7
7.61.58.8
10.41-peak2.5
1-peak
9.212.111.6
13.210.45.91.91-peak1-peak
9.53.62.4
10.710.810.8
0.8 0.7
18

Table 2.- Strong-motion data from the Ms=6.6 Superstition Hills earthquake of November 24, 1987 (1315 G.m.t.) - continued
STATION IDENTIFICATION
USGS Name Number (Location)
412
5058
117
958
931
5028
5165
5158
952
464
955
5220
El Centro Array 10Community Hospital(Ground floor)
El Centro Array 11McCabe School(Ground floor)
El Centro Array 9Commercial Ave.(Ground floor)
El Centro Array 8E. Cruickshank Road(Ground level)
El Centro Array 12Brockman Road(Ground level)
El Centro Array 7Imperial Valley College(Ground floor)
El Centro Diff. ArrayDogwood Road(Ground level)
El Centro Array 6Hus ton Road(Ground level)
El Centro Array 5James Road(Ground level)
El CentroMeadows Union School(Ground floor)
El Centro Array 4Anderson Road(Ground level)
Borrego SpringsScripps Clinic(Ground floor)
Coordinates Degrees N. lat. and W. long.
32.780115.567
32.752115.594
32.794115.549
32.811115.532
32.718115.637
32.829115.504
32.796115.535
32.839115.487
32.855115.466
32.800115.473
32.864115.432
33.210116.330
Epi central Distance
(km)
37
38
38
38
39
39
39
40
41
43
43
44
ACCELERATION
Direction (degree.s)
230Up .140
230Up140
360Up270
230Up140
230Up140
230Up140
360Up270
230Up140
230Up140
230Up140
230Up140
315-Up225r
Maximum (g)
.27
.07
.22
0.32.13.21
.30
.15
.20
.35
.21
.33
.27*
.08*
.19*
.20
.18
.26
.29
.14
.23
.16
.14
.19
.19
.11
.20
.27
.12
.26
.10
.12
.11
.06
.05
.06
Duration (s>0.10 £)
7.6 9.3
15.76.99.4
3.62.62.8
10.14.910.1
2* 2*
3.60.52.9
13.43.4
11.7
2.42.00.7
3.91-peak2.6
8.71-peak9.3
1-peak1-peak0.8
*Instrument malfunction, partial record (approx. 10 seconds)
19

Table 2.- Strong-motion data from the Ms=6.6 Superstition Hills earthquake of November 24, 1987 (1315 G.m.t.) - continued
STATION IDENTIFICATION
USGS Name Number (Location)
5057
5115
5056
5053
5065
505A
505A
506A
5047
5063
50A5
5221
50AA
El Centre Array 3 Pine Union School (Ground floor)
El Centro Array 2 Keystone Road (Ground level)
El Centro Array 1 Borchard Ranches (Ground level)
CalexlcoFire Station (Ground floor)
Coachella CanalStation 3 (Ground floor)
Bonds CornerHighway 98 at 115 (Ground floor, SMA)
Bonds CornerHighway 98 at 115 (Ground floor, RFT)
Coachella CanalStation 2 ' (Ground floor)
Rancho de AnzaAnza-Borrego Park (Ground level)
Coachella CanalStation 1 (Ground floor)
Terwilliger Valley Anza Array (Ground floor)
ChihuahuaAnza Array (Ground floor)
Pinyon Flat Observatory Anza Array (Ground level)
Coordinates Degrees N. lat. and W. long.
32.89A 115.380
32.916 115.366
32.960 115.319
32.669115. A92
33.51115.77
32.693115.338
32.693115.338
33.56115.95
33.35116. AO
33. 6A116.08
33 .A8 116.59
33.38116.68
33.61 116. A6
Epi central Distance
(km)
A7
A7
51
51
56
60
60
62
63
73
86
87
87
ACCELERATION
Direction (degrees)
*-
230 Up . 1AO
230 Up 1AO
230 Up 1AO
315Up 225
135Up OA5
230Up 1AO
230Up 1AO
135Up OA5
135Up OA5
135Up OA5
135Up OA5
360 -Up 270 '
135 Up OA5
Maximum (g)
.11
.08
.11
0.12 .05 .10
.09
.06
.09
.21
.10
.21
.09
.05
.08
.28
.09
.28
.27
.08
.29
.OA
.03
.OA
.06
.03
.06
.08
.05
.09
.02
.01
.02
.02
.01
.03
.01
.01
.01
Duration(S>0.10£)
1.8
1-peak
0.9
1-peak
10.56.0 11.7
9.9
9. A
9.8
9.5
___
"'
20

Table 2.- Strong-motion data from the Ms=6.6 Superstition Hills earthquake of November 24, 198? (1315 G.m.t.) - continued
STATION IDENTIFICATION
USGS Name Number (Location)
5067
5231
5241
5242
5068
5070
IndioSo. Calif. Gas Co.(Ground floor)
Tule CanyonAnza Array(Ground level)
Cahuilla ValleyAnza Array(Ground floor)
Garner ValleyAnza Array(Ground floor)
Thousand PalmsPost Office(Ground floor)
N. Palm SpringsPost Office(Ground floor)
Coordinates Epi central Degrees N. lat. Distance and W. long. (km)
33.747 88116.214
33.47 89116.64
33.512 89116.798
33.615 98116.626
33.82 103116.40
33.924 120116.543
ACCELERATION
Direction Maximum Duration (degrees) (&) (s>0.10 £)
315Up225 -
360Up270
360Up270
360Up270
135Up045
300Up210
.03
.03
.04
.03*
.02*
.02*
.05
.01
.04
.02
.01
.02
.02*
.02*
.03*
.02
.01
.02
*Event/record correlation questionable.
21

SU
PE
RS
TIT
ION
M
TN
, S
ITE
8
13
50
.13
vW
V*f
alW
+4
^^
Up
0.1
2
04
50.
11
2 tim
e m
ark
s/s
ec
PA
RA
CH
UT
E T
ES
T
SIT
E
0154:2
0 G
.m.t.
31
50
.10
Up
' ^fr
t^/v
w^V
WW
1**^^
0.1
0
22
5 Fig
ure
2.
Acc
eler
ogra
ms
from
the
Ms=
6.2
eart
hquak
e.2
tim
e
ma
rks/s
ec

SA
LTO
N S
EA
WIL
DLI
FE
RE
FU
GE
315
| 0154:2
0 G
.m.t.
0.1
8
MN
^vV
jI^^N
V^
0.2
0
,971
3
CA
LIP
AT
RIA
FIR
E S
TA
TIO
N
2 tim
e m
ark
s/s
ec
31
50
.15
««
!)|>
»*v
v*^^
0.1
8
22
5*w
*MrfV
yjflV
\^v*
vv«
WV
^^0
.22
i -t
t"
Fig
ure
2.
Con
tinu
ed.
2 tim
e m
ark
s/s
ec

IMP
ER
IAL
WIL
DL
IFE
LIQ
UE
FA
CT
ION
AR
RA
Y
0154
:21
G.m
.t.
360
(1
to
Su
rfa
ce
0.1
3
Up
(2)
T^M
Wh^^
-v
09
0 (3
) .
. -
...,».,%
>*.«
MW
*^**/**
VflW
yW
^^
36
0 (
4)
Up
(5
)
Su
rfa
ce
Surf
ace
6.7
m
dow
nhole
6.7
m
dow
nhole
0.1
8
0.1
3
0.0
8
0.0
9jrn^
WM
lA^~
n-fr"
^^
nn
.
090(6
)
. v^^^^-
__
__
^
-
(7)
Por
e pr
essu
re s
enso
r
(8)
Por
e pr
essu
re s
enso
r
w
__ (
9)
Por
e pr
essu
re s
enso
r
(10)
Ppr
,e p
ress
ure
sen
sor
(11)
Por
e pr
essu
re s
enso
r
w (12)
Por
e pr
essu
re s
enso
r
6.7
m
do
wn
ho
le
P6
P5 P4
P3
_»..
. -*
-r
i 'I
P2
P1
0.0
8
Fig
ure
2.
Conti
nued
.2
time m
ark
s/s
ec

BR
AW
LE
Y
AIR
PO
RT
-
«
- -
*"
m
mm
M
. .
m .. .«
31
50.0
6
UP
22
5
0.0
6
2 ti
me
ma
rks
/se
c
M <n
PL
AS
TE
R C
ITY
- _
. .
......
- -
-I 0
154:2
2 G
.m.t
.
135_______________
__
__
__
_
^__,
__
__
__
_
__
_
__
__
__
__
__
__
__
__
__
__
Q.Q
5
Up
_____^
._
....._
_
__________________________________________
Q.Q
3
045"
nr
; "7
'.
! ;
T"n
or
Fig
ure
2.
Con
tin
ued
. 2
tim
e m
ark
s/se
c

OC
OT
ILL
O W
EL
LS
01
54
:23
G.m
.t.
31
50
.03
Up
0.0
4
22
50
.03
2 tim
e m
ark
s/s
ec
EL
CE
NT
RO
AR
RA
Y
10
23
00
.04
Up
0.0
3
14
0
,, .,
. r
'0
.05
Fig
ure
2.
Con
tinu
ed.
2 tim
e m
ark
s/s
ec

EL
CE
NT
RO
AR
RA
Y
9
36
0 _
__
__
__
__
__
__
__
_
_
^ . _
__
__
__
__
__
_
__
__
__
__
_______ _
__
__
_______ 0
.04
Up
...._
....
O-0
3
__
0.0
5
2 tim
e m
ark
s/s
ec
N)
N
EL C
EN
TR
O A
RR
AY
8
t 01
54:2
4 ar
at.
23
0
0.0
6
UP
.m
A0
.04
14
0
, ,
. r
't
., r
0.0
4
2 ti
me
mark
s/se
c
Fig
ure
2.
Con
tinu
ed.

230
EL
CE
NT
RO
AR
RA
Y
7
0154:2
4 G
.m.t.
0.0
5
Up
°-
03
140
0.0
3
2 ti
me
mark
s/s
ec
IN) OB
EL
CE
NT
RO
AR
RA
Y 6
I 0154:2
4 G
.m.t.
2
30
°-
05
Up
_
__
__
__
__
__
__
_______________________________________________________0.0
2
140
. _
,^
^
^ _..,.,
^
__
^.
__
. _______
9-9*
^..
. (
- -
r ""
-
- -
..
-_-j-
. _-
__
.1-
-Lnji.n
j-jij-sjv
j n
«L
L_
n-jL
_j njv
^'-
- .-
JX
/ij-rjii-u
_n
ii u
-tn
_
ir i
- __-
_ _
_
-^ _
_
_
._
_
_|
-_-_
_
_T-
.^.r
- _
_
- .-
Fig
ure
2.
Conti
nued
. 2
tim
e m
ark
s/se
c

EL
CE
NT
RO
A
RR
AY
5
0154:2
5 G
.m.t.
23
00.1
1
Up
°'0
2
0.0
8
2 tim
e m
ark
s/s
ec
10
<D
EL
CE
NT
RO
D
IFF
ER
EN
TIA
L A
RR
AY
01
54
:26
G.m
.t.
36
00
.07
,U
p0
.03
27
00
.07
«
....^
i..«.
l»»^^
hA>*
.M)M
vtw\/*
v»^^
.^
.W.»
.I.-*
.^'^
W..^
.W.«~
S.IM.
-M^I
.^.^
.. .
.
».«
...«.
-.
,n «.
. mi**
.. B »
:. .«
.
2 tim
e
ma
rks/s
ec
Fig
ure
2.
Con
tinu
ed.

EL
CE
NT
RO
A
RR
AY
4
I 0
15
4:3
2 G
.m.t.
230
_____
__
__
__
__
__
_
________
__
__
__
_0
.03
Up
__
__
__
__
__
__
__
__
__
__
__
__
__
__
__
__
__
__
__
__
__
__
__
__
__
__
__
__
__
__
__
__
__
__
__
__
__
_0
.02
__
0 ~
~~
~0.02
2 ti
me
mar
ks/s
ecCO o
CO
AC
HE
LL
A
CA
NA
L
ST
AT
ION
3
I 0154:2
5 G
.m.t
.
13J
^_
__
__
__
__
__
__
__
__
__
__
__
__
_..
....
..
__
__
__
__
__
__
__
__
__
__
__
__
__
__
__
__
__
__
__
__
Q.Q
4
uP Z
Z^
-.^
^-.
^-.
,,^
^,.,,
x ...
^
0
-0^
04
5
0.0
3
2 ti
me
mark
s/se
c
Fig
ure
2.
Con
tinue
d.

EL
CE
NT
RO
AR
RA
Y
11
I 0
15
42
4 G
.m.t
.
23
0_
__
__
__
__
__
__
__
__
__
__
__
__
_
_
0.0
5«"" « ^"""^^*
"" "
"
"
"
^ *
^^^^«
*"^«
**
*^"*
«%
fn
^''^^^^^^^^^^^^^*
^^^^^"*
^^^^^^^"%
^^^*
^^«
^1^
^^"
>^»^
<*»^^*^^w
^»w
^*^*«»^*«^^i^
w^^M
^««
Up
_______
_____.A
..._^
_ _.
_ _
.__
_..
_
.._
-__
_
_____
__
__
__
0.0
3
140
0.0
4
2 ti
me
ma
rks
/se
cCO *
ME
AD
OW
S U
NIO
N S
CH
OO
L
I0
15
4:2
4 G
.m.t
.
23
0 ________________________ _
.^_
__
_ °'0
5
Up
~
......_.......
°'0
2
0.0
5
14
0
. _ ..-
Fig
ure
2.
Con
tinu
ed.
2 ti
me
mark
s/se
c

EL
CE
NT
RO
AR
RA
Y
12
I 01
54:2
9 G
.m.t.
2
30
0-0
5
Up
_
__
__
__
__
__
__
__
__
__
__
__
__
__
__
__
__
__
__
__
__
__
__
__
__
__
__
__
__
__
__
__
__
__
_0
.01
14
0
_ ^
.-.. ..-
_
^ -
Ax
/taM
MM
^^h
^^M
M^^B
^^>
K.
2 ti
me
ma
rks
/se
cto
CA
LE
XIC
O F
IRE
ST
AT
ION
> ,
*
, ^*
m
m
» ,
*» m
<
t»
«
*
>m
m
»
, ,,
^ ,<
.«
*m>
*)
31
5
________________________
__
_________________________________0.0
4
Up
0
-03
22
5
^ ^
..^
^
-._-
-
A'0
5~
/ -i
" r
' I
-1 r"
.
2 ti
me
mark
s/se
c
Fig
ure
2.
Con
tinue
d.

BO
ND
S C
OR
NE
R (S
MA
)
01
54
:30
G.m
.t.
230
0.0
9
Up
0.0
2
140
0.0
6
CO co
BO
ND
S C
OR
NE
R (
RF
T)
2 ti
me
mark
s/s
ec
2 ti
me
mark
s/s
ec
k »
k k
k k
k k
» k
k »
» k
> k
k k
k »
k k
k k
k k
k k
» k
k k
k k
k k
k k
t k
k k
k
23
0
Up
0.0
9
0.0
2
140
0154:3
0 G
.m.t.
0.0
6
Fig
ure
2.
Con
tinu
ed.

CO
AC
HE
LL
A
CA
NA
L
ST
AT
ION
2
0154:3
2 G
.m.t.
135
0.0
3
Up
0.0
2
045
0.0
2
2 tim
e m
ark
s/s
ec
CO
CO
AC
HE
LL
A
CA
NA
L
ST
AT
ION
1
135
0.0
8
Up
0
.05
.. *
<*J
* *
^/-s*
,
*
»
-N
^W
«W
*
*-»
**
~
.
oT§
~r~
; ...
......
. .
r~"
- o.o
e.
Fig
ure
2.
Con
tinu
ed.
2 tim
e m
ark
s/s
ec

SU
PE
RS
TIT
ION
M
TN
, S
ITE
8
13
15
:58
G.m
.t.
(appro
x.)
135
2 tim
e m
ark
s/s
ec
CO 01
PA
RA
CH
UT
E T
ES
T S
ITE
1316:0
2 G
.m.t
^v
m
mm
im
«^^^
^^B
| 1
31
6:1
6 G
.m.t.
315
0.5
3J!y
\/lJI/\^
^
\*l\
f^f*
^^
I 'IT
11
2 tim
e m
ark
s/s
ec
Fig
ure
3.
Acc
eler
ogra
ms
fro
m t
he
Ms=
6.6
eart
hquak
e.

135
PL
AS
TE
R
CIT
Y
1316
:02
G.m
.t.
0.1
9^/
WV
^V'^
A>
AA
/^^^
. P
.. ^^*V
**W
*V
***N
W^^^
..»
«. .»
^P
.,^^
to
O)
04
5^A
/V^V
V^/v
vv^V
^
2 tim
e m
arks
/sec
OC
OT
ILL
O
WE
LL
S
I 13
16:0
5 G
.m.t.
315
. 0.1
1
Up
0
.09
225
0.0
8I
r
»
Q n
.. ,
2 ti
me
mar
ks/
sec
Fig
ure
3.
Con
tinue
d.

IMP
ER
IAL
WIL
DLIF
E L
IQU
EF
AC
TIO
N A
RR
AY
1316:0
4 G
.m.t.
360 (1
)S
urf
ace
0.2
1
Cd
"
» "
" '
'«W
^V
V**
^"i^
W*^
^
»
^x
"-*
%/
-^
-*
-M *
090 (3
)
360 (
4)
Up
(5
)
i|l||'i|
Su
rfa
ce
~- ~
~*~
+**
NS
s*#
J*\
/j^
^
6.7
m
do
wn
ho
le
**
**.~
»s^
«^
^
6.7
m
do
wn
ho
le
0.4
4
0.1
9
'%^
~-
0.1
6^
N*A
^V
^
0.1
1--
f*
^
-^
IT
"
090
<6>
6.7
m
do
wn
ho
le0.1
1.^
_
.
P6
(7)
Po
re p
ress
ure
sen
sor
_ _
_.
_ ... .
..
._._
. .
^
(8)
Po
re p
ress
ure
senso
rP
5
(9)P
ore
pre
ssu
re s
en
sor
.(1
0)
Po
re p
ress
ure
senso
r
(11
) P
ore
pre
ssu
re s
enso
r
(12)
Po
re p
ress
ure
se
nso
r
JVJ-
W-'
Fig
ure
3.
Con
tinu
ed.
2 tim
e m
ark
s/s
ec

SA
LT
ON
S
EA
WIL
DLIF
E R
EF
UG
E
t1316:0
3 G
.m.t.
31
5
. A
. 0-1
5
l>lm"
l"''
|N>
^V
MA
^A
vyV
<^^
..^..
i^,
_ r
__
_ .
....
_..
. ._
__-i
i-
illL
iim
l> t
itn
.ii
n..
-...
....
..
. ..... .........
_.
.11.
- . ..i..,i^
. i
..L
I..I
.I
.«_ ..
i ..jliL
l. .
..
. .iliu
i. »
i..
. ....
. U
.I I
i»>*
^uw
vv^>
<»^^
_2
25
_
__
. .
._
_..
.!..
**
*-.
* ...
-- -
^%
v^>
«¥*V
\**V
^/A
A^
^0.1
4
to
OB
2 tim
e m
ark
s/se
c
BR
AW
LE
Y A
IRP
OR
T
wu-u
u
. .
u."
13
16
:05
G
.m.t.
31
5
*^
*K
****^
^
vVW
^irf
W^^
i ,
,..,
,.. d
i.,. .^^
v^v^V
^»*»
V^^^
'
2 ti
me
mar
ks/
sec
Fig
ure
3.
Con
tinu
ed.

CA
LIP
AT
RIA
F
IRE
ST
AT
ION
315
^^^M
^t^\
rJ^
Up
0.2
1
225
--~
*w
YvA
^w
w'/w
yyV
^^ S
y/s/A
vv-%
2 tim
e m
ark
s/s
ec
CO «o
EL
CE
NT
RO
AR
RA
Y
13
1316:0
6 G
.m.t.
230
0.1
9
Up
0.0
7
14
00.1
7^
Fig
ure
3.
Con
tinu
ed.
2 tim
e m
ark
s/s
ec

EL C
EN
TR
O A
RR
AY
10
230
>^\^
v^V
^V
V^^^
°-0
7
2 tim
e m
ark
s/se
c
EL
CE
NT
RO
AR
RA
Y
1 1
I 131
6:06
G.m
.t.
'
'
-
^»**
*vfl(W
A^^
UP
^
140
. r
. ___
. .
. .
..
A .
A
*.
- 0.
21
Fig
ure
3.
Con
tinu
ed.
2 ti
me
"^ar
ks/
sec

EL
CE
NT
RO
A
RR
AY
9
3J*0
-
« -
. 0
.30
/^N
^**/W
**V
W^^
Up
---****^*^^
O.1
5
VA
M^V
"***
**^^
0.2
0
2 tim
e m
ark
s/se
c
EL
CE
NT
RO
AR
RA
Y
8
I 1
31
6:0
6 O
m.t
.
230
^T
^/^
^.fc
I
wt«
~*J\
t+^^
2 ti
me
mar
ks/
sec
Fig
ure
3.
Con
tinu
ed.

EL C
EN
TR
O A
RR
AY
12
2 tim
e m
ark
s/se
c
EL
CE
NT
RO
AR
RA
Y
7
1316
O6
Gm
t.0
.20
230
Up
«tM
»*M
VW
*l^^
0.1
8
14
0vv
v^^v
/vw
v^^w
/^
Fig
ure
3.
Con
tinu
ed.
2 tim
e
mark
s/s
ec
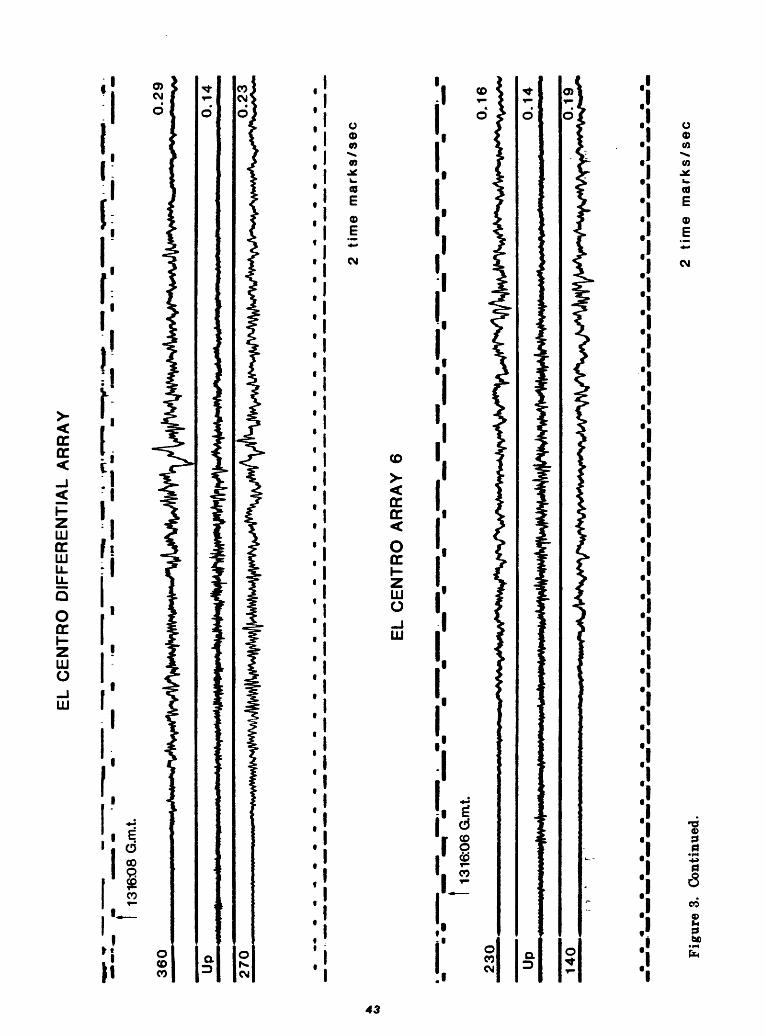
EL
CE
NT
RO
DIF
FE
RE
NT
IAL A
RR
AY
1316
:08
G.m
.t.
'
Up
>^^
^vwv«
^w^^^
^M^^
2 tim
e m
ark
s/s
ec
CO
EL
CE
NT
RO
AR
RA
Y
6
I 13
16:0
6 G
.m.t.
230
°'
16
*sf*
+«*
il*V
+)^
^
Up
,
, 0
.14
«
> .»
.. n
....
....
....
....
....
l«
'^»'
^»%
%lM
^A
J\A
Af^
/^yx
%^^^/^
A^
-,.
« /,
A.
j 2
tim
e m
ark
s/se
c
Fig
ure
3.
Con
tinu
ed.

EL
CE
NT
RO
AR
RA
Y
5
1316
:06
G.m
i.
230
0.1
9*
*v
^V
^U
p0
.11
*fr
*W
S*hV
*d\^
2 tim
e m
ark
s/s
ec
EL
C
EN
TR
O
ME
AD
OW
S
UN
ION
S
CH
OO
L
1316
:06
Gm
t
23
00
.27
Up
140
0.1
2
*\/
v^
Fig
ure
3.
Con
tinu
ed.
2 tim
e m
ark
s/s
ec

EL
CE
NT
RO
AR
RA
Y 4
t131
6:07
G.m
.t.
230
0.1
0i
-
-
-"_
-* "*
1_-"
~"*
.-
_
**-'V
A
/^?^
>^>^
~A
/^A'
\*L
n-'
J>JlJ
'V^"'^*
jA"' "^
Up
0.1
2
14
0
. ^
_
0.1
1'
"
^ ^
**s*+
s+
»+
»+
~*«
***~
~**
fi+
^*J
*^^^
2 ti
me
mar
ks/s
ec
BO
RR
EG
O S
PR
ING
S
I 1
31
6^
9 G
.m.t.
31
5_
__
__
__
__
__
__
__
__
__
__
__
_
__
__
__
°'°
6
Up
___
__
__
__
__
__
_
0.0
5
225
- - ---
«_-»
_____-_
_____._
_______-_
___
- 0.0
6
2 ti
me
m
ark
s/s
ec
F
igu
re 3
. C
ontin
ued.

EL
CE
NT
RO
AR
RA
Y 3
I 13
16:0
7 G
rut.
230
<f^
r^f^
f^^\f
^^^
UD
0.0
8~
T
_1 , -j-_
-jr
_
. -
--i-
-..
.- /
j-
--g^,i
j..
\u/-
-j~
JU'I
Jtr-
';-~
^JW
nij
uX
-j.
~,j
iP_
rV>
nii
jM^p
»\|S
ji>
V*
^r^^
140
_ u
* '
'^s
^*xv
vvA
-*^^
^-*-
-A^v
V^^
^/V
^^
2 ti
me
mark
s/s
ec
4k
0»
EL
CE
NT
RO
A
RR
AY
2
I 13
16:0
7 G
.m.t.
' im
i '*»
*V
VW
*^^A
»AV
V%*
I*<*V
>^V
^^^
UP
___
_
_ ___ _
, °'
05_
14
0
" 7"
0.1
0'»
^V
^^
Fig
ure
s.
Con
tinue
d.
2 tl
me
mark
s/se
c

EL
CE
NT
RO
AR
RA
Y
1
1
31
6:1
4 G
.m.t.
230
°-09
« *-
M * . W
*»
^.~
^»
lM
I*.^**N
frN
^^
I. »" .
'
"i.»
! «
Up
0.0
6
2 tim
e m
ark
s/se
c
CA
LE
XIC
O
FIR
E S
TA
TIO
N
I 1
31
6:0
7 G
.m.t.
0.2
1
VW
*V*W
\*M
^^
UP
0.10
mi
.1.
i^o
^O
^i.
...
...>
^%^»
Mi.
^Vi.<
...^ »
...l»»»*fr
»M
NlW
VM
*N
W^^
V^J
VV
^/'V
VW*^^
2 ti
me
mark
s/se
c
Fig
ure
3.
Con
tinue
d.

CO
AC
HE
LL
A C
AN
AL
ST
AT
ION
3
135
Up
-05
04
50.0
8
13
16
:16
G.m
.t.
1 3
5
CO
AC
HE
LLA
CA
NA
L S
TA
TIO
N 2
2 tim
e
mark
s/s
ec
0.0
3
0.0
4
Fig
ure
3.
Con
tinu
ed.
2 tim
e m
ark
s/s
ec

BO
ND
S C
OR
NE
R (S
MA
)
230
I 13
16:0
9 G
mt
0.2
8
>
"-N
A^X
^/V
V^^
140
*v*v
*v*v
v^^
2 tim
e
ma
rks/s
ec
BO
ND
S
CO
RN
ER
(R
FT
)2
tim
e m
ark
s/s
ec
230
- -
A .
0.2
7*/w
vxv^
j^^/
^^^
Up
0
.08
r*
- »
...-.»
-
»..
-
. «
_
__
140
1316
D9
G.m
.t.
*T
*SW
VW
^^
Fig
ure
3.
Con
tinu
ed.

RA
NC
HO
D
E A
NZ
A
1316:2
0 G
.m.t.
135
0.0
6
Up
045
0.0
3
0.0
6
2 ti
me
ma
rks
/se
c<n o
135
CO
AC
HE
LL
A C
AN
AL
ST
AT
ION
1
0.0
8
Up
0.0
5
045
0.0
9
Fig
ure
3.
Con
tinue
d.
2 ti
me
ma
rks
/se
c

TERWILLIGER VALLEY - ANZA ARRAY
I 1316:2
8 G
.m.t.
13
5
0.0
2
Up
_________________ _
__
__
__
__
__
__
__
_
________________________________0.0
1
04
5
~ 0
.02
2 tim
e
mark
s/s
ec
Ol »
CH
IHU
AH
UA
-
AN
ZA
AR
RA
Y
f1316:2
8 G
.m.t.
36
00
.02
Up
0.0
1
27
0
0.0
3
2 ti
me
mark
s/se
c
Fig
ure
3.
Con
tinu
ed.

PIN
YO
N
FLA
T O
BS
ER
VA
TO
RY
-
AN
ZA
AR
RA
Y
I 1
31
6:2
6 G
mt.
13
50.0
1
Up
_________________________________________________________________________0.0
1
04
5
0.0
1
2 tim
e
mark
s/s
ec
Ol
IND
IO
I 13
16:1
7 G
.m.t.
315
°-03
^__1
__U
IJ_lu
l,,
JJI1
J[UJ
LJtJ
L^ vV
iji_
j_«»_a*»j»
~>
T*»~
Li~
<JX
j^ju
<T
_^-A
j Lju
rxj»
x_iu
rLn ii
ij~-*
__r\
jrt_j
~\j^
-\j\j
~\jt
~*\
j^**
-**-
^jij^
~*~
r*~
*j*^
t~\f\
r^*~
~~
*L**
*\s~
^
__
- -
o.0
3iii
i --
_-.
_._
---_
. __-
_ _-
_-- -
--.-
---_.
_..
_..
-..-
..-.
-,-
.-
/_-
- __-_
__
._-.
-.-_
._ -.
-__
.
,_
,-.'_
,-..---.
.--
^:.
-.-.
,---
.
.---
-.-
_-_
..-
. .. -
_
- -.
'-
- -..,-._
-- -
_
:---
_- ..
"'*
-
225
~~
"
0.0
4
2 ti
me
mark
s/se
c
Fig
ure
3.
Con
tinu
ed.

TU
LE
C
AN
YO
N -
AN
ZA
AR
RA
Y
36
0
Up
27
0
0.0
3
0702
0.0
2
2 tim
e m
ark
s/s
ec
0|
CD
CA
HU
ILLA
V
ALLE
Y -
AN
ZA
AR
RA
Y
1316:3
1
G.m
.t.
36
00.0
5
Up
0.0
1
27
0'
* 0.0
4
Fig
ure
3.
Conti
nued
.2
tim
e m
ark
s/s
ec

GA
RN
ER
V
AL
LE
Y -
AN
ZA
AR
RA
Y
I 1316:2
8 G
.m.t.
36
0
0.0
2
TJfT
__
__
__
__
__
__
__
__
__
__
__
__
__
__
__
__
__
__
__
__
__
__
__
__
__
__
__
__
__
_0
.01
270
0.0
2
2 tim
e m
ark
s/s
ec
Ol
TH
OU
SA
ND
P
AL
MS
0.0
2
Up
0.0
2
04
5 _
__
__
__
.y
.-.r
-1 _
__
__
__
__
__
__
__
__
__
__
__
__
__
__
__
___________________________
, .,
r ,0
-03
2 ti
me
mark
s/se
c
Fig
ure
3.
Con
tinu
ed.

NO
RT
H
PA
LM
S
PR
ING
S
I 1316:2
1
G.m
.t.
30
0_
__
__
__
__
__
__
__
__
__
__
__
__
__
__
__
__
__
__
__
__
__
__
__
__
__
__
__
__
__
__
__
__
__
__
__
__
__
__
_0
.02
U£
__
__
__
__
__
__
__
__
__
__
__
__
__
__
__
__
__
__
__
__
__
__
__
__
__
__
__
__
__
__
__
__
__
__
__
__
__
__
__
0.0
1
21
0
0.0
2
o« o«
Fig
ure
3.
Con
tinu
ed.
2 tim
e m
ark
s/s
ec
I -I
T

PO
E (
TE
MP
OR
AR
Y S
TA
TIO
N)
180
i^jiy^
11 .fi
n 11
. i.
. .
. 0.
51M
4fr
^^I
1
^'
^
1 1__________*i
i _
__
__
1_
__
__
__
_*
__
__
_.M
__
__
__
_
-
2 tim
e m
ark
s/se
c
KN
B (
TE
MP
OR
AR
Y S
TA
TIO
N)
180
0.19
r**
^^^^y^.r
^^^
Up
090
»**'<'-*
'«^*«
*Wv/^
W/^
-^
0.1
8
*~
~V
~-**/H
l^^
2 tim
e m
ark
s/se
c
Fig
ure
3.
Con
tinu
ed.