strong interim result, dividend increased for personal use ... · treasury group limited (asx:trg,...
TRANSCRIPT

Treasury Group Limited
ABN: 39 006 708 792 Level 14, 39 Martin Place, Sydney NSW 2000
Phone +61 2 8243 0400 Facsimile +61 2 8243 0410 www.treasurygroup.com
ASX announcement Tuesday 25 February 2014
Strong Interim Result, Dividend Increased
• NPAT up 12% (on H1 2013) to $6.8 million
• Solid growth in underlying NPAT of $7.2 million, up 30% on H1 2013
• Total FUM at $19.1 billion, up 13% on H1 2012 driven by strong performances from RARE, IML and Celeste
• Dividend up 35% to 23 cents per share
• Portfolio rationalisation – sale of TAAM, merger of Evergreen Capital, closure of Orion Australian equities
• Solid momentum expected to continue into 2H 2014
Treasury Group Limited (ASX:TRG, “Treasury” of “the Company”) is pleased to report the Company’s Half Year results for the six month period ending 31 December 2013. Consolidated profit after tax (NPAT) totalled $6.76 million for the half, representing an increase of 12% on the prior corresponding period (H1 FY2013: $6.0 million). On an underlying basis, the Company’s profits were $7.2 million, representing an increase of 30% on H1 FY2013 ($5.5 million). The key drivers of profit growth were improved market conditions and strong performances from RARE Infrastructure (RARE), Investors Mutual Limited (IML) and Celeste Funds Management (Celeste). Total Funds Under Management (FUM) at 31 December 2013 was $19.1 billion, an increase of $2.2 billion or 13% on H1 FY2013 ($17.0 billion). The aggregated net retail funds inflow from RARE, IML and Celeste for the six-month period ending 31 December 2013 totalled $385 million, compared to $204 million in H1 FY2013. Retail funds inflow from RARE, IML and Celeste are driving net margins higher. Average net margin was 58 bps for H1 FY2014 (excluding Trilogy), compared to average net margin of 54 bps in H1 FY 2013. Following the strong Interim Result, the Board has declared a fully franked interim dividend of $0.23 per share, which represents a 35% increase on the Interim Dividend paid in H1 FY2013 ($0.17 per share). The dividend increase reflects the Board’s confidence in the Company’s financial strength and positive operating outlook. The Record Date for the Interim Dividend is 6 March 2014 and the Payment Date is 27 March 2014.
For
per
sona
l use
onl
y
Page 2 of 2
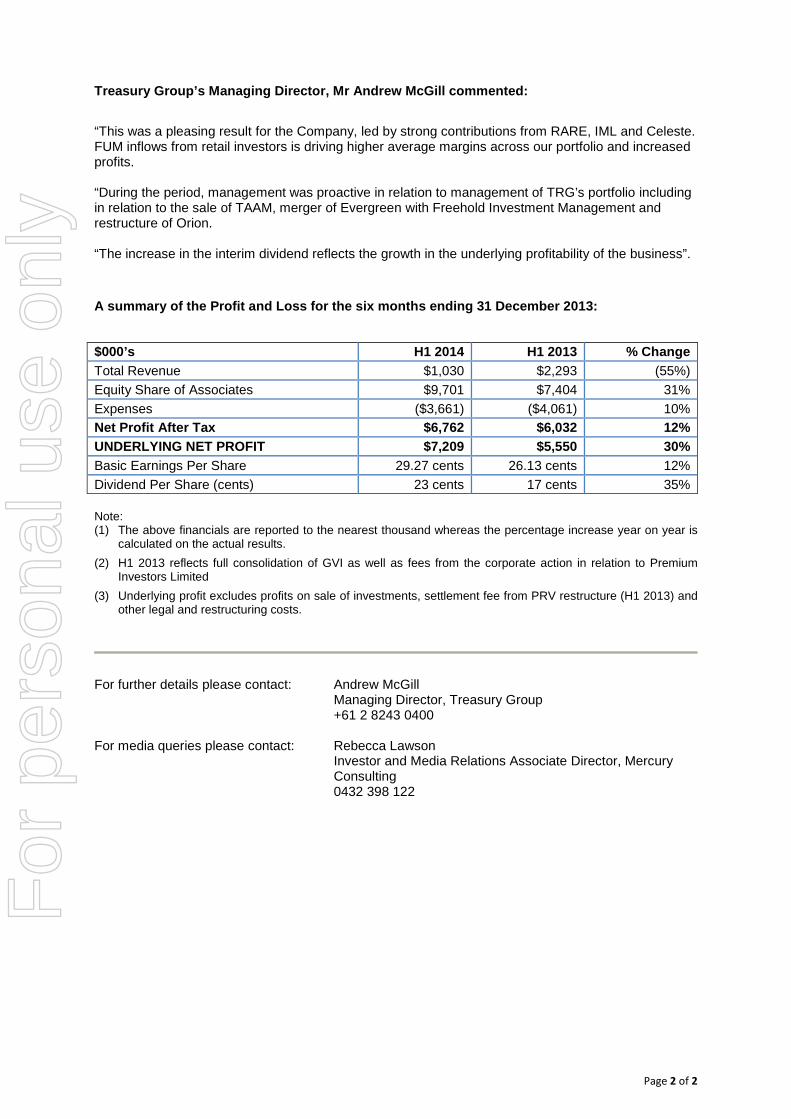
Treasury Group’s Managing Director, Mr Andrew McGill commented:
“This was a pleasing result for the Company, led by strong contributions from RARE, IML and Celeste. FUM inflows from retail investors is driving higher average margins across our portfolio and increased profits. “During the period, management was proactive in relation to management of TRG’s portfolio including in relation to the sale of TAAM, merger of Evergreen with Freehold Investment Management and restructure of Orion. “The increase in the interim dividend reflects the growth in the underlying profitability of the business”.
A summary of the Profit and Loss for the six months ending 31 December 2013:
$000’s H1 2014 H1 2013 % Change Total Revenue $1,030 $2,293 (55%) Equity Share of Associates $9,701 $7,404 31% Expenses ($3,661) ($4,061) 10% Net Profit After Tax $6,762 $6,032 12% UNDERLYING NET PROFIT $7,209 $5,550 30% Basic Earnings Per Share 29.27 cents 26.13 cents 12% Dividend Per Share (cents) 23 cents 17 cents 35% Note: (1) The above financials are reported to the nearest thousand whereas the percentage increase year on year is
calculated on the actual results. (2) H1 2013 reflects full consolidation of GVI as well as fees from the corporate action in relation to Premium
Investors Limited (3) Underlying profit excludes profits on sale of investments, settlement fee from PRV restructure (H1 2013) and
other legal and restructuring costs.
For further details please contact: Andrew McGill
Managing Director, Treasury Group +61 2 8243 0400
For media queries please contact: Rebecca Lawson
Investor and Media Relations Associate Director, Mercury Consulting
0432 398 122
For
per
sona
l use
onl
y

Treasury Group Limited Interim Results presentation 31 December 2013
For
per
sona
l use
onl
y

Agenda
2
1. Financial Highlights – 6 months ending 31 December 2013
2. Funds Under Management
3. Dividend
4. Outlook & Summary
For
per
sona
l use
onl
y

1. Financial Highlights
3
• NPAT up 12.1% (on H1 FY2013) to $6.8 million
• Solid growth in underlying profit – up 29.9% (on H1 FY2013) to $7.2 million
• Total FUM at 31 December 2013 – $19.1 billion, up $2.2 billion (or 12.7%) on H1 FY2013
• Strong performance across boutiques, particularly RARE, IML and Celeste:
› Retail net funds inflow (aggregate) for RARE, IML and Celeste – $385m vs $204m (H1 FY2013)
• Ongoing efficiency and expense management at TRG
• Portfolio rationalisation – sale of TAAM and merger of Evergreen Capital
• Dividend of 23 cents per share, up 35.3% on H1 FY2013 (17 cents per share)
Strong profit growth, driven by RARE, IML and Celeste
For
per
sona
l use
onl
y
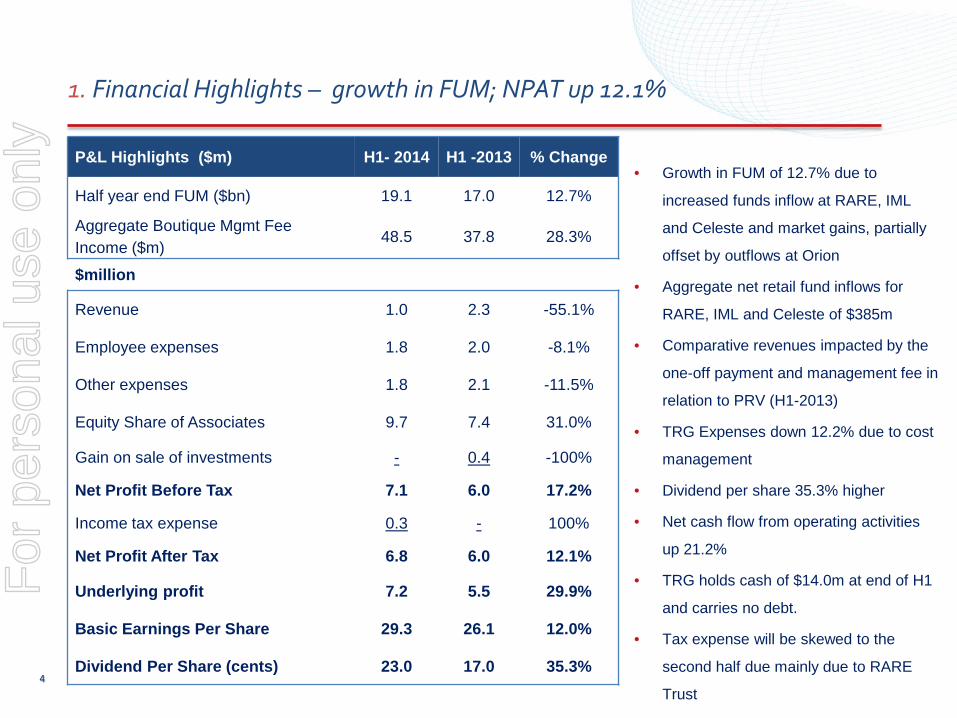
1. Financial Highlights – growth in FUM; NPAT up 12.1%
4
P&L Highlights ($m) H1- 2014 H1 -2013 % Change
Half year end FUM ($bn) 19.1 17.0 12.7%
Aggregate Boutique Mgmt Fee Income ($m) 48.5 37.8 28.3%
$million
Revenue 1.0 2.3 -55.1%
Employee expenses 1.8 2.0 -8.1%
Other expenses 1.8 2.1 -11.5%
Equity Share of Associates 9.7 7.4 31.0%
Gain on sale of investments - 0.4 -100%
Net Profit Before Tax 7.1 6.0 17.2%
Income tax expense 0.3 - 100%
Net Profit After Tax 6.8 6.0 12.1%
Underlying profit 7.2 5.5 29.9%
Basic Earnings Per Share 29.3 26.1 12.0%
Dividend Per Share (cents) 23.0 17.0 35.3%
• Growth in FUM of 12.7% due to
increased funds inflow at RARE, IML
and Celeste and market gains, partially
offset by outflows at Orion
• Aggregate net retail fund inflows for
RARE, IML and Celeste of $385m
• Comparative revenues impacted by the
one-off payment and management fee in
relation to PRV (H1-2013)
• TRG Expenses down 12.2% due to cost
management
• Dividend per share 35.3% higher
• Net cash flow from operating activities
up 21.2%
• TRG holds cash of $14.0m at end of H1
and carries no debt.
• Tax expense will be skewed to the
second half due mainly due to RARE
Trust
For
per
sona
l use
onl
y

1. Financial Results – Underlying NPAT up 29.9%
5
• Residual goodwill in relation to
AR capital written off
• Consulting and legal costs in
relation to the sale of TAAM,
advisory work on projects
Treasury Group P&L ($000) H1- 2014 H1 -2013 % Change
Profit After Tax 6,753.5 6,027.5 12.0%
Net gain on disposal of investments - (396.3)
Settlement fee from PRV restructure - (500.0)
Legal, consulting and restructuring costs
202.6 418.6
Impairment of goodwill 252.7 -
Underlying Profit 7,208.9 5,549.8 29.9%
For
per
sona
l use
onl
y

1. Financial Results – Aggregate Profit & Loss of TRG Boutiques
6
• Average net margin excludes
Trilogy. It is increasing due to
favourable change in mix
(increased retail FUM).
• TRG share of after tax profit
higher due to favourable
change in mix (increase
contribution from IML ,RARE
and Celeste).
• Total cash held across the
boutiques is $36.5 m (excl
TRG)
Aggregate P&L for Boutiques ($m) H1- 2014 H1 - 2013 % change
Half year end FUM ($bn) 19.1 17.0 12.7%
Average Net Margin (%) 58 bpts 54 bpts 7.4%
Base Management Fees 49.4 37.8 30.7%
Other income 2.7 1.4 92.9%
Gross Profit 52.1 39.2 32.9%
Employee expenses 13.1 10.0 31.0%
Other expenses 7.1 6.9 2.9%
NPBT 30.2 22.3 35.4%
Income Tax 6.8 4.2 61.9%
NPAT 23.4 18.1 29.3%
TRG Share of After Tax Profit 9.7 7.4 31.1% For
per
sona
l use
onl
y

2. FUM - diversification across boutiques lowers risks
7
$19.1 billion FUM as at 31 December 2013
IML, 25.1%
Orion, 3.0%
RARE, 41.3%
Celeste, 4.0%
Trilogy, 22.8%
Other TRG Boutiques, 3.8%
For
per
sona
l use
onl
y

2. FUM – Diversification away from Australian equities continues, funds from retail investors is increasing
8
-
2
4
6
8
10
12
14
16
18
20
$bn
FUM by Investor Type
Institutional
Retail
-
2
4
6
8
10
12
14
16
18
20
$bn
FUM by Investor Location
International Source
Domestic Source
Dec-12 Dec-130%
20%
40%
60%
80%
100%
FUM by Product Type
Alternatives
International Equities
Australian Equities
For
per
sona
l use
onl
y

3. FUM
9
• Inflows at RARE, IML
and Trilogy were offset
by outflows at Orion.
Note: Chart shows Net Flow, not change in FUM
-$2,000
-$1,500
-$1,000
-$500
$0
$500
$1,000
$1,500
$m
TRG Half Yearly Net New Funds Flow (Jan 2009 to Dec 2013)
For
per
sona
l use
onl
y

4. FUM - growth at RARE and IML drives average margin higher
10
0
10
20
30
40
50
60
70
80
0
5
10
15
20
25Avg Margin
(bps) FUM $bn
Composition of FUM vs Average Margin
Trilogy
Freehold (Evergreen) & AR Capital
Celeste
TAAM
Aubrey & Global Value Investors
RARE Infrastructure
Orion
Investors Mutual
% incl Trilogy (RHS)
% excl Trilogy (RHS)
For
per
sona
l use
onl
y

5. Dividend – increase reflects growth in underlying profit
11
• Interim dividend for FY2014 up
35.3% (on H1 FY2013) to 23 cents per share
• Balance sheet liquid and ungeared • Payout ratio of 79%
Dividend History
0
5
10
15
20
25
30
35
40
45
2009 2010 2011 2012 2013 2014
cps
Interim Final
For
per
sona
l use
onl
y

6. Summary & Outlook
12
• Solid underlying growth driven by improved market conditions, increased appetite from retail
investors and investment performance from key boutiques
• Strong growth from IML & RARE offset by reduced contribution from Orion
• Shift in FUM towards retail funds boosts overall margin and profits
• Interim dividend up 35.3% from 17 cents per share to 23 cents per share
• Long term fundamentals for funds management remain attractive – Australian industry large and growing
• Significant investment in assessment of new deal opportunities, particularly international
For
per
sona
l use
onl
y

Disclaimer
The information in this presentation is general background information about Treasury Group Limited and is current only at the date of this presentation. In particular, this presentation:
• is not an offer or recommendation to purchase or subscribe for securities in Treasury Group Limited, nor is it an invitation to any person to acquire securities in Treasury Group; • is not personal advice and does not take into account the potential and current individual investment objectives or the
financial situation of investors; and • contains information in summary form and does not purport to be complete.
Certain statements in this presentation may constitute “forward-looking” statements. Forward-looking statements are neither promises nor guarantees and involve known and unknown risks, uncertainties and other factors which may cause actual results to vary materially from any projection, future results or performance expressed or implied by such forward-looking statements.
13
For
per
sona
l use
onl
y