stroke volume optimization: the new hemodynamic · pdf file criticalcarenurse vol 35, ... 2...
TRANSCRIPT
Nurses commonly experience scenarios where hemodynamic monitoring is focused
on hypovolemia (see case study) in clinical practice. In this article, we provide
an overview of the use of stroke volume (the amount of blood ejected from the left
ventricle with each beat) for hemodynamic management of critically ill patients.
We also discuss the limitations of conventional assessment parameters, methods
of measuring stroke volume, hemodynamic variables that influence stroke volume, the stroke volume
optimization (SVO) replacement algorithm, supporting literature, and nursing considerations.
Much of the supporting literature (mostly studies in perioperative patients) on stroke volume as a
primary hemodynamic monitoring parameter focuses on the treatment of hypovolemia, as in the case
Stroke Volume Optimization: The NewHemodynamic AlgorithmALEXANDER JOHNSON, RN, MSN, ACNP-BC, CCNS, CCRN
THOMAS AHRENS, RN, PhD
This article has been designated for CNE credit. A closed-book, multiple-choice examination follows this article,which tests your knowledge of the following objectives:
1. Discuss the use of stroke volume optimization in a hypovolemic patient2. Define corrected flow time, peak velocity, stroke distance, and stroke index3. State various methods used to obtain blood flow measurement
©2015 American Association of Critical-Care Nurses doi: http://dx.doi.org/10.4037/ccn2015427
CNE Continuing Nursing Education
Cover
www.ccnonline.org CriticalCareNurse Vol 35, No. 1, FEBRUARY 2015 11
Critical care practices have evolved to rely more on physical assessments for monitoring cardiac output
and evaluating fluid volume status because these assessments are less invasive and more convenient to
use than is a pulmonary artery catheter. Despite this trend, level of consciousness, central venous pressure,
urine output, heart rate, and blood pressure remain assessments that are slow to be changed, potentially
misleading, and often manifested as late indications of decreased cardiac output. The hemodynamic
optimization strategy called stroke volume optimization might provide a proactive guide for clinicians to
optimize a patient’s status before late indications of a worsening condition occur. The evidence supporting
use of the stroke volume optimization algorithm to treat hypovolemia is increasing. Many of the cardiac
output monitor technologies today measure stroke volume, as well as the parameters that comprise stroke
volume: preload, afterload, and contractility. (Critical Care Nurse. 2015;35[1]:11-28)

study. In the following section, we review the clinical
importance of hypovolemia that may go undetected
(occult hypovolemia) when conventional assessment
techniques are used.
Importance of Occult HypovolemiaTo illustrate the nature of subclinical or occult
hypovolemia and to test the sensitivity of gastrointestinal
tonometry for detecting such hypovolemia, Hamilton-
Davies et al1 conducted a study on 6 healthy volunteers
in the critical care unit at University College of London
Hospitals, London, England. Each of the volunteers had
a mean of 25% (21%-31%) of their overall blood volume
removed during a 1-hour period, and the volunteers’
response was measured. Variables such as heart rate,
blood pressure, serum levels of lactate, and stroke volume
were measured every 30 minutes throughout the study.
After 90 minutes, decreases in gut intramucosal pH were
observed, as well as marked decreases in stroke volume,
by a mean of 16.5 mL (P < .01). Despite this compromised
flow, no clinically significant or consistent postinterven-
tional changes were noted in serum levels of lactate,
arterial blood pressure, heart rate, or arterial blood gases
according to serial measurements obtained throughout
the study period. Retransfusion was started after 90 min-
utes. The results of this study1 may provide insight into
the reliability of routinely used measurements such as
heart rate and systolic blood pressure as volume deple-
tion progressed in these volunteers.
Hypovolemia (defined as inadequate left ventricular
filling volumes)2 affects the cardiovascular system in a
characteristic sequence of events as the hypovolemia
worsens3-6 (Table 1). First, stroke volume decreases
Alexander Johnson is a clinical nurse specialist, Central DuPage Hospital, Cadence Health System–Northwestern Medicine, Winfield, Illinois.
Thomas Ahrens is a research scientist, Barnes-Jewish Hospital, St Louis, Missouri.
Corresponding author: Alexander Johnson, 4007 Schillinger Dr, Naperville, IL 60564 (e-mail: [email protected]).
To purchase electronic or print reprints, contact the American Association of Critical-Care Nurses, 101 Columbia, Aliso Viejo, CA 92656. Phone, (800) 899-1712 or (949) 362-2050 (ext 532); fax, (949) 362-2049; e-mail, [email protected].
Authors
12 CriticalCareNurse Vol 35, No. 1, FEBRUARY 2015 www.ccnonline.org
Acritical care nurse cares for a patient who had
a 3-vessel coronary artery bypass graft approx-
imately 30 minutes earlier. No indications of
bleeding are present, and both cardiac output and urine
output are within the reference limits. However, the
patient’s systolic arterial blood pressure has decreased
to 77 mm Hg 3 times in the past 20 minutes. Because
the decrease seems to respond to fluid administration,
the nurse begins administering a fourth bottle of 5%
albumin via the rapid infuser in accordance with the sur-
geon’s standing orders. Even though the patient’s central
venous pressure has remained at 3-4 mm Hg since the
patient arrived from surgery, the nurse notes that the
stroke volume has remained between 75 and 80 mL
since the second bottle of albumin. On the basis of the
patient’s hemodynamic profile and this recent
sequence of events, the nurse calls the surgeon to inquire
about an order to administer a vasoactive agent. In
this case, decreased stroke volume response to fluid
suggests adequate volume expansion even though low
central venous pressure values suggest hypovolemia.
CASE STUDY
Blood loss, %
Heart rate, beats per minute
Blood pressure, mm Hg
Pulse pressure
Respiratory rate, breaths per minute
Mental status
Class 4
> 40%
> 140
Decreased
Decreased
> 35
Confused, lethargic
Class 3
30%-40%
> 120
Decreased
Decreased
30-40
Anxious, confused
Class 2
15%-30%
> 100
Normal
Decreased
20-30
Mildly anxious
Class 1
< 15%
< 100
Normal
Normal or increased
14-20
Slightly anxious
Table 1 Classes of shock by Advanced Trauma Life Support (ATLS) designationa
a Reprinted from American College of Surgeons,5 with permission.
because of decreased overall circulating volume (class 1).
Next, heart rate increases and vasoconstriction occurs to
maintain blood pressure and cardiac output (the volume
of blood pumped by the heart per minute)7 (class 2). A
surge of endogenous catecholamines helps shunt blood
from the periphery and splanchnic circulation to the brain
and great vessels to preserve vital organs. Once compen-
satory mechanisms are exhausted, cellular respiration
begins to change from aerobic metabolism to anaerobic
metabolism, and tissue oxygenation is threatened. Oxy-
gen extraction rates increase, and mixed venous oxygen
saturation (Sv̄O2) and central venous oxygen saturation
(ScvO2) decrease because of decreased cardiac output,
compromised blood flow, and decreased oxygen deliv-
ery to tissues (class 3).2,7 Finally, urine output, level of
consciousness, and blood pressure decrease (class 4).3-5
Each event may take minutes to hours. Despite this known
sequence, aggressive intervention often is not implemented
until hypotension occurs.8,9 Traditionally, clinicians are
trained to monitor for early indications of decompensa-
tion, and the first hemodynamic monitoring parameter
to decrease in hypovolemia is stroke volume.1-5
Hypovolemia frequently occurs in patients during
surgery and in the critical care unit because of bleeding,
hypoalbuminemia, capillary leak and interstitial edema,
diarrhea, vomiting, and insensible water loss. If the hypo-
volemia is left untreated (or undertreated), circulatory
hypoxia may develop because of the decreased blood flow
and hypoperfusion. Compensatory diversion of blood
flow centrally, away from the peripheral and splanchnic
circulation, often masks hypoperfusion.2
If not recognized and treated promptly, decreased
circulating volume (particularly at the microvascular level)
leads to diminished oxygen delivery, depletion of intra-
cellular energy reserves, acidosis, anaerobic glycolysis,
and lactate accumulation. Hypovolemia can also lead to
ischemic gastrointestinal complications, including nau-
sea, vomiting, and intolerance of oral intake. Therefore,
diligent monitoring, via accurate assessment of cardiac
output and stroke volume, for hypovolemia is important
for monitoring blood flow.
Limitations of Conventional AssessmentsCurrent conventional assessments such as heart rate,
blood pressure, urine output, central venous pressure
(CVP), and level of consciousness often lack precision as
indicators of changes in a patient’s status. Although the
values obtained in these assessments somewhat correlate
with hemodynamic variables, the values are slow to
change and the changes are often late indications of a
patient’s worsening condition.3-5 Several studies10-17 suggest
that using physical assessment to evaluate cardiac output
may yield inaccurate findings. More recent data18-20 sug-
gest that the predictive power of blood lactate levels for
mortality and morbidity are independent of blood pres-
sure and common physiological triage variables (eg,
heart rate, blood pressure, mental status, capillary refill).
Despite these limitations, assessments such as blood
pressure are still considered a standard of care, and cur-
rent practice mandates use of the assessments. However,
blood pressure itself is a composite of so many factors2-5
(Figure 1) that it is of limited value as an early sign of
hemodynamic derangements such as hypovolemia.
Compensatory mechanisms such as vasoconstriction
and tachycardia influence the cardiovascular system to
keep blood pressure normal,2 making the correlation
between blood pressure and blood flow slow to change
as circulating volume decreases.1-5 The terms compensated
shock and cryptic shock are now being used to define
patient scenarios that meet clinical criteria for shock in
www.ccnonline.org CriticalCareNurse Vol 35, No. 1, FEBRUARY 2015 13
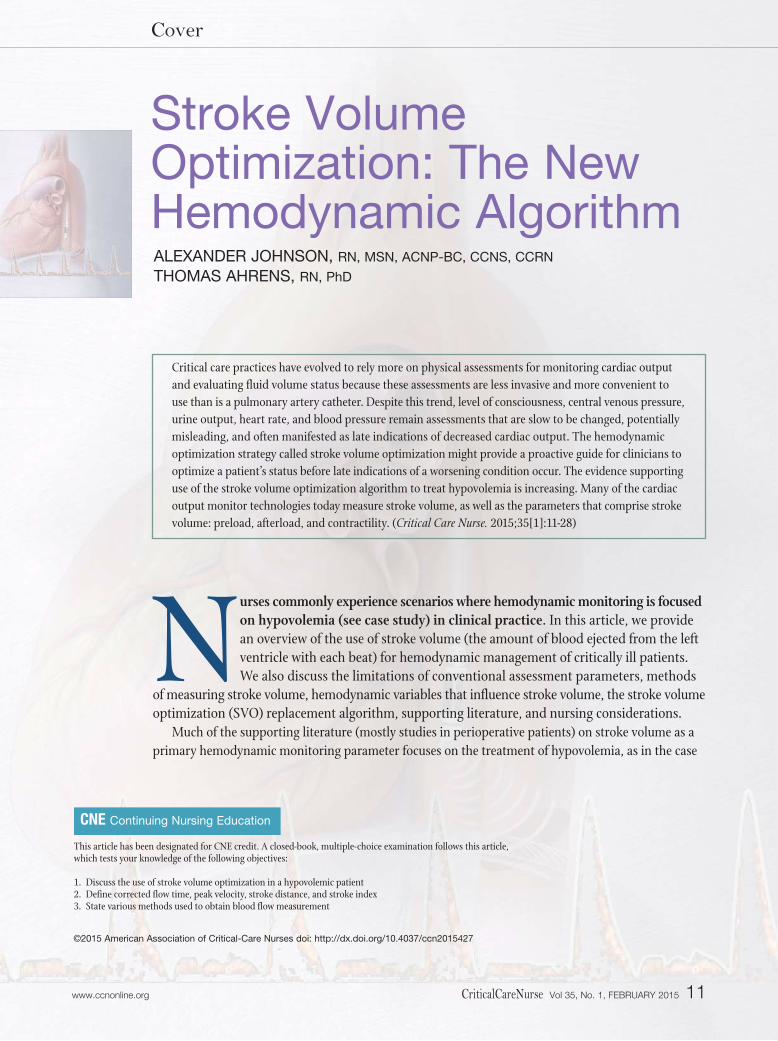
Figure 1 A, Complexity of blood pressure (BP): interrela-tionship of variables comprising BP. BP is the cardiacoutput (CO) multiplied by systemic vascular resistance(SVR). CO is the product of heart rate (HR) and strokevolume (SV). SV is influenced by preload, afterload, contractility, and rhythm. SVR is calculated by dividingthe difference between mean arterial pressure (MAP) and central venous pressure (CVP) by the CO and thenmultiplying by 80. (Derivation of content as described inAlspach.2) B, CO and SVR coexist in a balanced “seesaw”-type relationship. In general, when one decreases, the otherincreases (and vice versa) to maintain normal blood pressure.
BP = CO x SVR
A
B
HR x SV
MAP – CVP x 80
• Preload• Afterload• Contractility• Rhythm
CO
CO SVR

the presence of normal blood pressures.18 Blood pressure
measurements are more useful for conditions that involve
treatment of hypertension rather than treatment of
hypovolemia or shock.21,22 International guidelines such
as the Seventh Report of the Joint National Committee on
Prevention, Detection, Evaluation, and Treatment of High
Blood Pressure22 help guide care providers in the man-
agement of hypertension according to a systematic and
stepwise approach. However, currently no such guidelines
exist for the management of hypotension.
Reconsidering Fluid Replacement End Points
In an article published in 1996, Connors et al23 sug-
gested that use of a pulmonary artery catheter (PAC) was
associated with an increased likelihood of patient death.
Since then, use of PACs has generally decreased. Although
values obtained via a PAC were once considered the gold
standard for bedside hemodynamic monitoring,24,25 the
precision of a PAC for assessing preload status via filling
pressures is limited. As early as 1971, Forrester et al26
pointed out the inaccuracies of CVP monitoring. In a more
recent systematic review of CVP as a predictor of cardiac
output and fluid responsiveness, Marik et al27 concluded
that CVP should
not be used as a
basis for clinical
decisions on fluid
management. In
fact, Marik et al27
noted that the
only published study28 suggesting CVP could be an accurate
indication of preload was done in horses. Even though
guidelines such as those of the Surviving Sepsis Campaign29
recommend using CVP to monitor preload, no study of
CVP or pulmonary artery occlusive pressure (PAOP) has
shown that these pressures consistently correlate with
blood flow or volume status.30 Early and aggressive use
of fluid replacement to preestablished end points such
as ScvO2 is more likely than the measurement of CVP
itself to provide patients benefit.31,32 The limitations of
CVP are further pointed out in the landmark study on
septic shock by Rivers et al33 published in 2001. These
investigators randomized 263 patients with septic shock
to receive either treatment according to a protocol on
fluid replacement known as early goal-directed therapy
or conventional care (control group). The patients treated
according to the protocol had a 17% reduction in mortality,
even though CVP was used as part of the basis for treat-
ment in both the interventional and the control group.33
PAOP is also an inaccurate predictor of fluid respon-
siveness in critically ill patients, further indicating that
blood pressures do not correlate with blood flow param-
eters such as cardiac output and stroke volume.34,35 This
lack of correlation occurs because many factors can
alter the pressure-volume relationship within the heart.
For example, conditions that increase PAOP but not
preload include, but are not limited to, positive-pressure
mechanical ventilation, positive end-expiratory pressure,
and decreased ventricular compliance. Conditions that
alter cardiac compliance include aging, obesity, diabetes,
myocardial ischemia, and sepsis.36 The challenge encoun-
tered with interpreting PAOP is further illustrated in
Figure 2; the 3 hearts in the drawing have different cardio -
myopathies and various left ventricular end-diastolic vol-
umes (LVEDVs), but each heart has the same PAOP. As a
result, the baseline Frank-Starling pressure-volume
curves for the 3 hearts differ vastly (Figure 3). When
LVEDV increases in normal hearts, pressure increases in
a characteristic curvilinear relationship. However, in con-
ditions such as left ventricular hypertrophy, decreased
wall compliance increases intracardiac pressure without
a concomitant increase in volume. Measurements based
on blood flow, such as stroke volume, help clinicians
avoid incorrect assumptions based on pressure-volume
curves.36 Ultimately, blood flow is more reliable and pre-
cise than are blood pressures, and blood flow can decrease
before blood pressures decrease.1,3,5,18
CVP and PAOP were never intended to be used alone;
both are filling pressures meant to guide the optimiza-
tion of stroke volume.27,32 The fundamental reason to
administer a fluid bolus to a patient is to increase stroke
volume.27,35,37 Although stroke volume monitoring is not
considered a standard of care, as is conventional moni-
toring of vital signs, plotting or documenting stroke
volume in response to a fluid challenge may be the clos-
est clinicians can come to using the Frank-Starling curve
in routine bedside practice. Stroke volume is more likely
to indicate hypovolemia before other monitoring param-
eters do because the former is not influenced by most
compensatory mechanisms.1-5 Treatments that include
giving fluids and medications such as drugs that improve
contractility (inotropes) are often administered with the
goal of improving stroke volume. Specifically targeting
14 CriticalCareNurse Vol 35, No. 1, FEBRUARY 2015 www.ccnonline.org
Ultimately, blood flow is more reliableand precise than blood pressures, andblood flow can decrease before bloodpressures decrease.
stroke volume for hemodynamic management is termed
SVO. Indications for use of SVO include age, heart failure,
low urine output, bleeding, monitoring of fluid boluses
and vasoactive infusions, cardiac conditions, and risk for
hypoperfusion or organ dysfunction. Awareness of con-
traindications is just as important: for example, esophageal
Doppler monitoring is contraindicated in patients with
esophageal strictures or varices.
Stroke Volume As the Newest CardiacVital SignAssessing for Adequate Perfusion
Using mean arterial pressure to evaluate a patient for
adequate perfusion to the vital organs is a controversial
but important idea for bedside clinicians to consider.38,39
As oxygen supply decreases or oxygen demand increases,
tissue hypoxia can develop. However, exactly when the
hypoxia occurs in an individual patient is unclear. ScvO2
can be a helpful global indicator; however, monitoring
microcirculatory perfusion at the end-organ level is not
readily available yet.40 When compromised perfusion
progresses to the point of eventual acidosis, organ dam-
age most likely is occurring, even when blood pressures
are normal.1
The complexity of these changes defies overreliance
on parameters such as blood pressure. Ongoing fluid
replacement decisions should be based on stroke volume,
variations in pulse pressure, cardiac output derived by
using a minimally invasive method, and passive leg-raising
maneuvers supported by integrated assessment to more
www.ccnonline.org CriticalCareNurse Vol 35, No. 1, FEBRUARY 2015 15
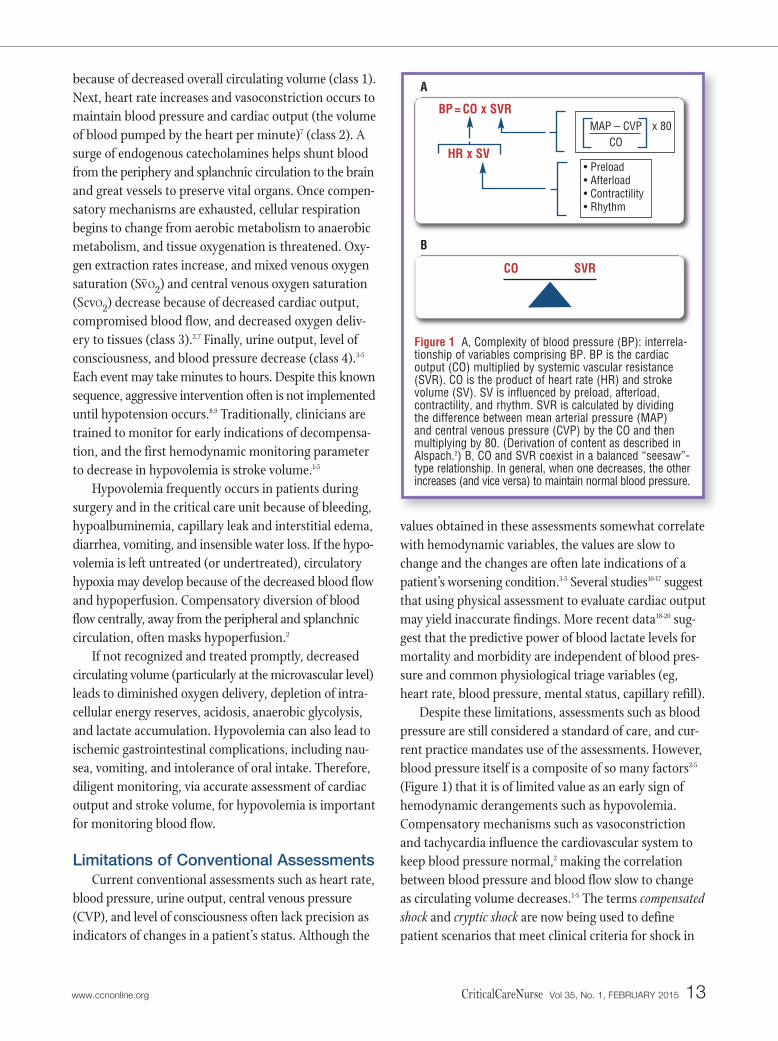
Figure 2 Challenges associated with interpreting pulmonary artery occlusion pressure (PAOP). Left ventricular end-diastolicvolume (LVEDV) can be independent of PAOP. A, PAOP is 22 mm Hg. Normal left ventricle has very high LVEDV. B, PAOP is22 mm Hg. Dilated right ventricle creates increased juxtacardiac pressure; LVEDV is normal. C, PAOP is 22 mm Hg. Left ventric-ular hypertrophy with noncompliant myocardium creates decreased space within the left ventricle; LVEDV is low. Use of PAOPalone to reflect LVEDV may not be accurate.Based on data from Marik et al27 and Turner.36
Illustration courtesy of Lisa Merry, RN, Merry Studio, Bloomington, Illinois.
B CA
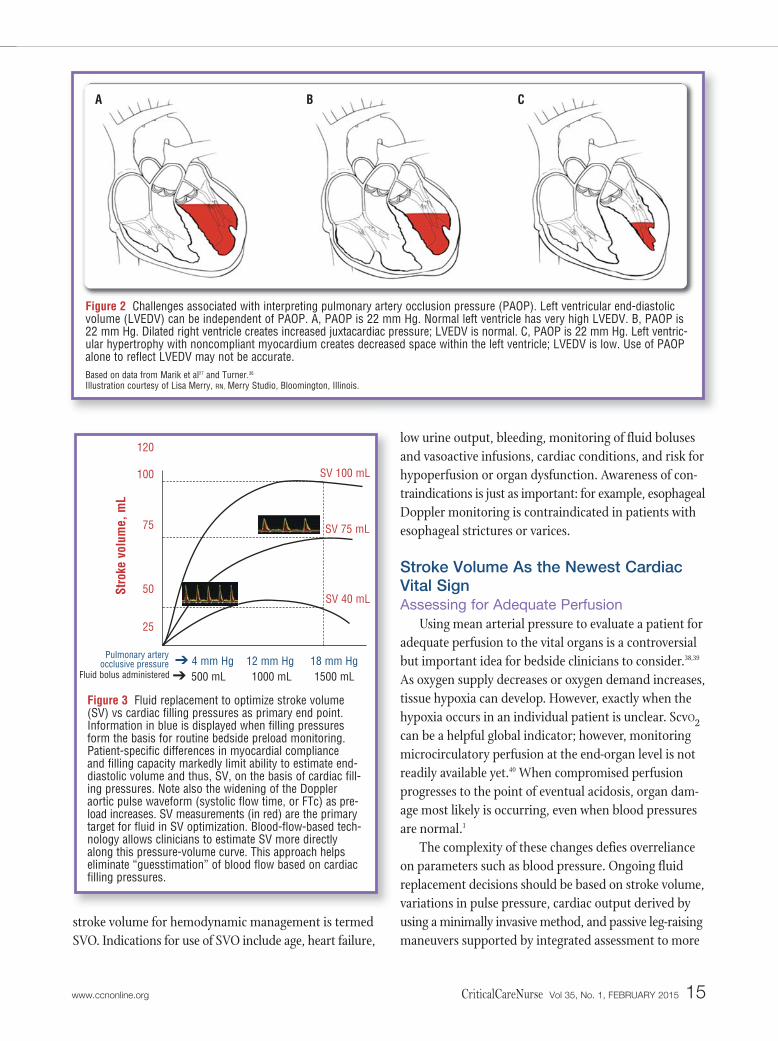
Figure 3 Fluid replacement to optimize stroke volume(SV) vs cardiac filling pressures as primary end point.Information in blue is displayed when filling pressuresform the basis for routine bedside preload monitoring.Patient-specific differences in myocardial compliance and filling capacity markedly limit ability to estimate end-diastolic volume and thus, SV, on the basis of cardiac fill-ing pressures. Note also the widening of the Doppleraortic pulse waveform (systolic flow time, or FTc) as pre-load increases. SV measurements (in red) are the primarytarget for fluid in SV optimization. Blood-flow-based tech-nology allows clinicians to estimate SV more directlyalong this pressure-volume curve. This approach helpseliminate “guesstimation” of blood flow based on cardiacfilling pressures.
Stro
ke v
olum
e, m
L
25
Fluid bolus administered
Pulmonary arteryocclusive pressure
50
SV 100 mL
SV 75 mL
SV 40 mL
500 mL 1000 mL 1500 mL4 mm Hg➔➔
12 mm Hg 18 mm Hg
75
100
120
precisely determine the response to the replacement
efforts.32,35,41,42 Methods of actually measuring blood flow
by more direct methods are becoming increasingly
available. These methods can provide true blood-flow
measurements, such as stroke volume, stroke distance,
variation in stroke volume, and systolic flow time.
Methods of Measuring Stroke VolumeTraditionally, echocardiography has been the most
commonly used method to measure stroke volume at the
bedside. However, this method is expensive and technically
difficult and continuous or serial measurements are often
not practical in critical care. Several new technologies
enable ongoing measurement of stroke volume at the
bedside, including noninvasive Doppler imaging
(USCOM), esophageal Doppler imaging (Deltex Medical;
Figure 4), bioimpedance (SonoSite), endotracheally applied
bioimpedance (ConMed Corporation), bioreactance
(Cheetah Medical), pulse contour methods (Edwards
Lifesciences, LidCo Ltd, Pulsion Medical Systems), an
exhaled carbon dioxide method (Philips, Respironics),
and the PAC. All use various methods to calculate stroke
volume, and the results have various degrees of accuracy.
Some devices measure stroke volume directly (eg,
esophageal Doppler imaging) and may be considered
the preferred method because of the high degree of
accuracy of the results.43 Other technologies simply
divide the cardiac output by the heart rate to obtain
stroke volume (eg, PAC). Table 2 provides a more
detailed comparison.44-59
Clinical application of technology is based on
knowledge and experience in obtaining and applying
the information received. If a care provider targets the
wrong hemodynamic end points or interprets a poor
waveform as an
accurate tracing,
benefits may be
limited. These
concerns were
cited in the tech-
nology assessment report published by the Agency for
Healthcare Research and Quality60 in 2008 as some of the
most likely reasons studies have collectively suggested
no benefit for monitoring with PACs.
Disagreement may exist about which technology is best
for monitoring stroke volume because none of the tech-
nologies is appropriate for all patients in all situations.
Each technology has a unique profile of advantages and
limitations, and a patient’s situation may dictate which
technology is best at a given time. Regardless of the
technology used, the device will provide measurements
of preload, afterload, and contractility for optimizing
stroke volume.
Hemodynamic Variables That InfluenceStroke Volume
Three variables affect stroke volume: preload,
contractility, and afterload.
Measurement of Preload: Corrected Flow TimeCorrected flow time (FTc) is a measure obtained in
esophageal and noninvasive Doppler imaging via ultra-
sound technology. The FTc is an estimate of circulating
blood volume based on the amount of red blood cells
16 CriticalCareNurse Vol 35, No. 1, FEBRUARY 2015 www.ccnonline.org
Each technology has a unique profileof advantages and limitations, and apatient’s situation may dictate whichtechnology is best at a give time.
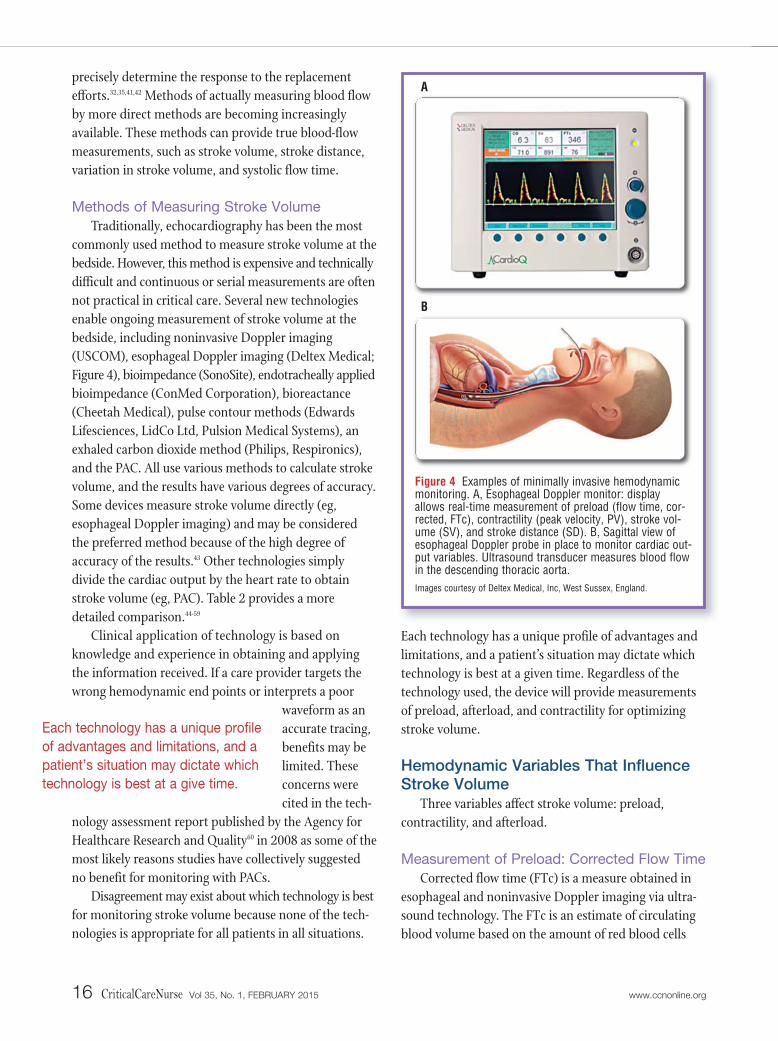
Figure 4 Examples of minimally invasive hemodynamicmonitoring. A, Esophageal Doppler monitor: displayallows real-time measurement of preload (flow time, cor-rected, FTc), contractility (peak velocity, PV), stroke vol-ume (SV), and stroke distance (SD). B, Sagittal view ofesophageal Doppler probe in place to monitor cardiac out-put variables. Ultrasound transducer measures blood flowin the descending thoracic aorta.Images courtesy of Deltex Medical, Inc, West Sussex, England.
A
B
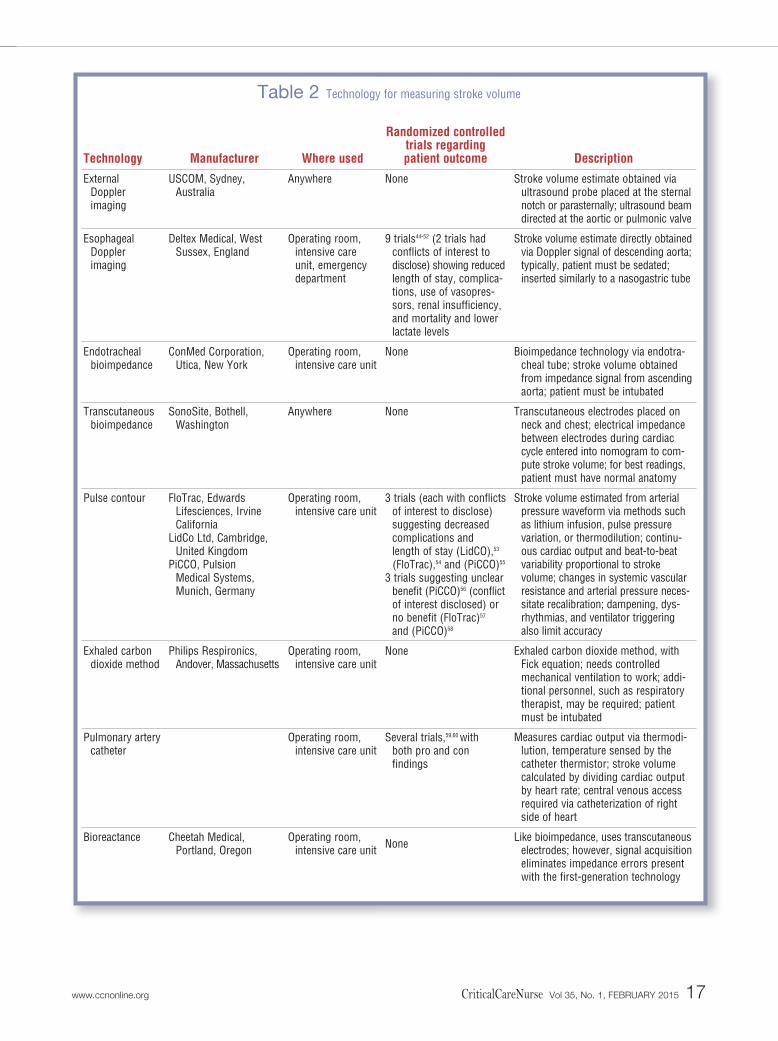
www.ccnonline.org CriticalCareNurse Vol 35, No. 1, FEBRUARY 2015 17
Description
Stroke volume estimate obtained viaultrasound probe placed at the sternalnotch or parasternally; ultrasound beamdirected at the aortic or pulmonic valve
Stroke volume estimate directly obtainedvia Doppler signal of descending aorta;typically, patient must be sedated;inserted similarly to a nasogastric tube
Bioimpedance technology via endotra-cheal tube; stroke volume obtainedfrom impedance signal from ascendingaorta; patient must be intubated
Transcutaneous electrodes placed onneck and chest; electrical impedancebetween electrodes during cardiaccycle entered into nomogram to com-pute stroke volume; for best readings,patient must have normal anatomy
Stroke volume estimated from arterialpressure waveform via methods suchas lithium infusion, pulse pressurevariation, or thermodilution; continu-ous cardiac output and beat-to-beatvariability proportional to stroke volume; changes in systemic vascularresistance and arterial pressure neces-sitate recalibration; dampening, dys-rhythmias, and ventilator triggeringalso limit accuracy
Exhaled carbon dioxide method, withFick equation; needs controlledmechanical ventilation to work; addi-tional personnel, such as respiratorytherapist, may be required; patientmust be intubated
Measures cardiac output via thermodi-lution, temperature sensed by thecatheter thermistor; stroke volumecalculated by dividing cardiac outputby heart rate; central venous accessrequired via catheterization of rightside of heart
Like bioimpedance, uses transcutaneouselectrodes; however, signal acquisitioneliminates impedance errors presentwith the first-generation technology
Randomized controlled trials regarding patient outcome
None
9 trials44-52 (2 trials hadconflicts of interest todisclose) showing reducedlength of stay, complica-tions, use of vasopres-sors, renal insufficiency, and mortality and lowerlactate levels
None
None
3 trials (each with conflictsof interest to disclose)suggesting decreasedcomplications and length of stay (LidCO),53
(FloTrac),54 and (PiCCO)55
3 trials suggesting unclearbenefit (PiCCO)56 (conflictof interest disclosed) orno benefit (FloTrac)57
and (PiCCO)58
None
Several trials,59,60 with both pro and con findings
None
Where used
Anywhere
Operating room,intensive careunit, emergencydepartment
Operating room,intensive care unit
Anywhere
Operating room,intensive care unit
Operating room,intensive care unit
Operating room,intensive care unit
Operating room,intensive care unit
Manufacturer
USCOM, Sydney, Australia
Deltex Medical, WestSussex, England
ConMed Corporation,Utica, New York
SonoSite, Bothell,Washington
FloTrac, Edwards Lifesciences, IrvineCalifornia
LidCo Ltd, Cambridge,United Kingdom
PiCCO, Pulsion Medical Systems,Munich, Germany
Philips Respironics,Andover, Massachusetts
Cheetah Medical, Portland, Oregon
Technology
External Dopplerimaging
Esophageal Doppler imaging
Endotrachealbioimpedance
Transcutaneousbioimpedance
Pulse contour
Exhaled carbondioxide method
Pulmonary arterycatheter
Bioreactance
Table 2 Technology for measuring stroke volume

that cross the ultrasound transducer beam through the
aorta during the systolic phase (Figures 4A and 4B). FTc
corresponds to the width of the pulse waveform base
and can be used to estimate preload. For example, a longer
FTc suggests that the left ventricle is pumping forward
an increased amount of blood (ie, increased preload).
The width of the pulse wave is measured in milliseconds
and represents the amount of time spent in systole com-
pared with total cardiac cycle time, and FTc is also cor-
rected for heart rate.61 The correction is based on a heart
rate of 60/min,
although the
current heart
rate is taken into
account. If a
patient’s heart
rate is 60/min, then each cardiac cycle will last 1 second,
or 1000 ms. Normal FTc is 330 to 360 ms.61,62 In other
words, for a cardiac cycle lasting 1 second, the systolic flow
period should last approximately 330 to 360 ms, provided
that adequate preload exists. An easy way to remember
the reference range is to remember that the heart is in
diastole two-thirds of the time and that normal FTc
multiplied by 3 equals 1 second, or 1000 ms62 (Figure 5).
But normal reference ranges are really just reference points,
not necessarily static physiological targets to be used for
all patients. The most important value of FTc is the degree
to which it changes in response to intravenous adminis-
tration of fluids.62 Increases in FTc in response to volume
challenge help confirm hypovolemia, which is manifested
as a narrow waveform base and a low FTc (Figure 3).
The accuracy of FTc has been questioned.63-65 However,
a complete understanding of the variable is critical before
FTc and be used effectively in clinical practice.66-68 Simply
put, FTc is suggestive of the amount of circulating volume
that passes the tip of the ultrasound probe during systole.36
Therefore, conditions such as bleeding (hypovolemia),
heart failure (low contractility), and high afterload (eg,
vasoconstriction) may contribute to low blood-flow
states and thus low FTc. These influences must be con-
sidered before FTc is accepted as a surrogate for preload
in individual patients. Several investigators66,69-72 have
suggested that FTc is as good as or better than PAOP for
indicating changes in preload. Most important, however,
improvement in stroke volume after fluid administration
is what was intended to form the basis on which preload
18 CriticalCareNurse Vol 35, No. 1, FEBRUARY 2015 www.ccnonline.org
The most important value of correctedflow time is the degree to which itchanges in response to intraveousadministration of fluids.
Figure 5 Waveform components for stroke volume optimization (SVO): aortic pulse waveform from an esophageal Dopplerexamination. Corrected flow time (ie, the time spent in systole) corresponds to the width of the pulse waveform and is an indexof preload. Peak velocity corresponds to the height of the wave and is a measure of contractility. Stroke distance represents thearea under the curve and is used to compute stroke volume.
Peak velocity (cm/s)
Velo
city
, cm
/s
Flow time, ms
Stroke distance (cm)= area under curve
1/3 Systole 2/3 Diastole
1 Cardiac cycle
responsiveness is ultimately determined (in each of the
outcome trials studying SVO).44-52,73,74 In other words,
FTc (as well as CVP and PAOP) is best used as a decision-
making aid for optimizing stroke volume.
Measurement of Contractility: Peak VelocityPeak velocity, a measure of contractility, is indicated
by the amplitude of a Doppler waveform (Figure 5). It
indicates the acceleration of blood flow in the systolic
phase, or the speed at which a pressure wave goes from
baseline to the peak height of contraction. An overall
reference range is 50 to 120 cm/s. Peak velocity can be
age dependent; the expected range for a 20- to 30-year-
old is 90 to 120 cm/s, with gradually decreasing expected
peak velocity as a person ages. Patients more than 65
years old are expected to have a peak velocity greater
than 50 cm/s. Values less than 50 cm/s are suggestive
of poor left ventricular contractility, as in heart failure.
However, peak velocity should be evaluated with respect
to a patient’s baseline values and how those values
respond to treatments. For example, an increase in peak
velocity is expected with administration of an inotrope.
A low stroke volume can occur for 1 of 2 main rea-
sons: hypovolemia or decreased ventricular contractility.
The immediate measured availability of peak velocity
with Doppler techniques provides better information
than do the derived contractility parameters of the PAC
regarding why stroke volume may be low. For example,
if stroke volume is low but peak velocity is normal, the
problem most likely is hypovolemia.21 However, if both
stroke volume and peak velocity are low, the problem
most likely is left ventricular dysfunction.62 A patient’s
response to medications such as preload reducers, after-
load reducers, or inotropes can help differentiate the
cause of the left ventricular dysfunction (eg, fluid over-
load, high afterload, or low contractility, respectively).
Peak velocity may also help detect acute decompen-
sating systolic heart failure earlier than do other tech-
niques for monitoring cardiac output. In critical illness,
poor left ventricular contractility (low ejection fraction)
may initially lead to a compensatory increase in end-
diastolic volume, a change that implies a normal stroke
volume. The ability to monitor peak velocity allows cli-
nicians to recognize this decrease in contractility in real
time and intervene before a decrease in stroke volume
occurs. Further research is needed to better establish
SVO treatment guidelines for patients with heart failure.
Measurement of Afterload: Systemic Vascular Resistance
Systemic vascular resistance (SVR) is the resistance
that must be overcome by the ventricles to develop force
and contract, propelling blood into the arterial circulation.2
Most of the newer hemodynamic monitoring technolo-
gies (eg, esophageal Doppler imaging, bioimpedance,
pulse contour methods) have the capability to calculate
SVR. However, SVR was not a major parameter in the
algorithms used in any of the SVO trials that showed
improved outcomes in surgical patients.44-52,73,74
Evidence of lack of inclusion suggests that SVR is a
more of a secondary monitoring parameter. Elevated SVR
usually occurs in response to systemic hypertension or
as a compensatory mechanism due to decreased cardiac
output, as in shock states (Figures 1A and 1B). Therefore,
nurses must know why the SVR is elevated. If the value is
elevated in response to low cardiac output, once cardiac
output is improved with treatment (eg, fluid, inotropes),
SVR should decrease because of a decreased need for
compensatory vasoconstriction. If SVR is elevated
because of systemic hypertension, treatment may include
administration of an afterload reducer.2
When SVR decreases, the left ventricular ejection of
blood encounters lower resistance. Low afterload states
may be less problematic when blood pressure and car-
diac output are normal (Figure 1A). However, attempts
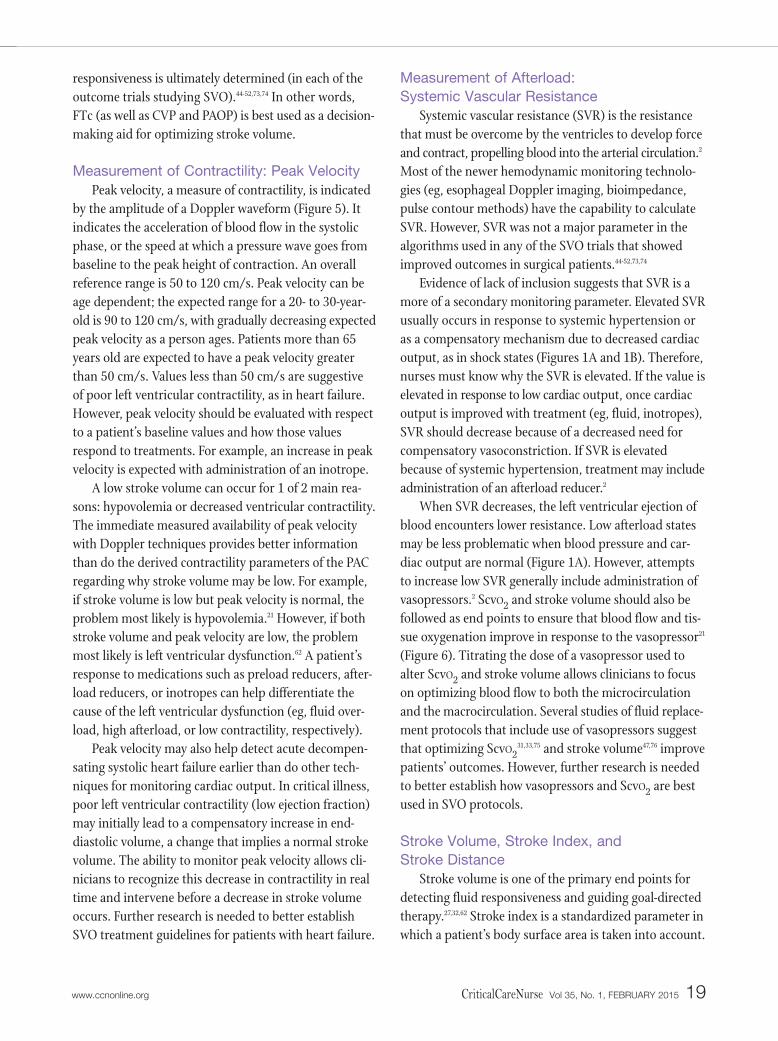
to increase low SVR generally include administration of
vasopressors.2 ScvO2 and stroke volume should also be
followed as end points to ensure that blood flow and tis-
sue oxygenation improve in response to the vasopressor21
(Figure 6). Titrating the dose of a vasopressor used to
alter ScvO2 and stroke volume allows clinicians to focus
on optimizing blood flow to both the microcirculation
and the macrocirculation. Several studies of fluid replace-
ment protocols that include use of vasopressors suggest
that optimizing ScvO231,33,75 and stroke volume47,76 improve
patients’ outcomes. However, further research is needed
to better establish how vasopressors and ScvO2 are best
used in SVO protocols.
Stroke Volume, Stroke Index, and Stroke Distance
Stroke volume is one of the primary end points for
detecting fluid responsiveness and guiding goal-directed
therapy.27,32,62 Stroke index is a standardized parameter in
which a patient’s body surface area is taken into account.
www.ccnonline.org CriticalCareNurse Vol 35, No. 1, FEBRUARY 2015 19
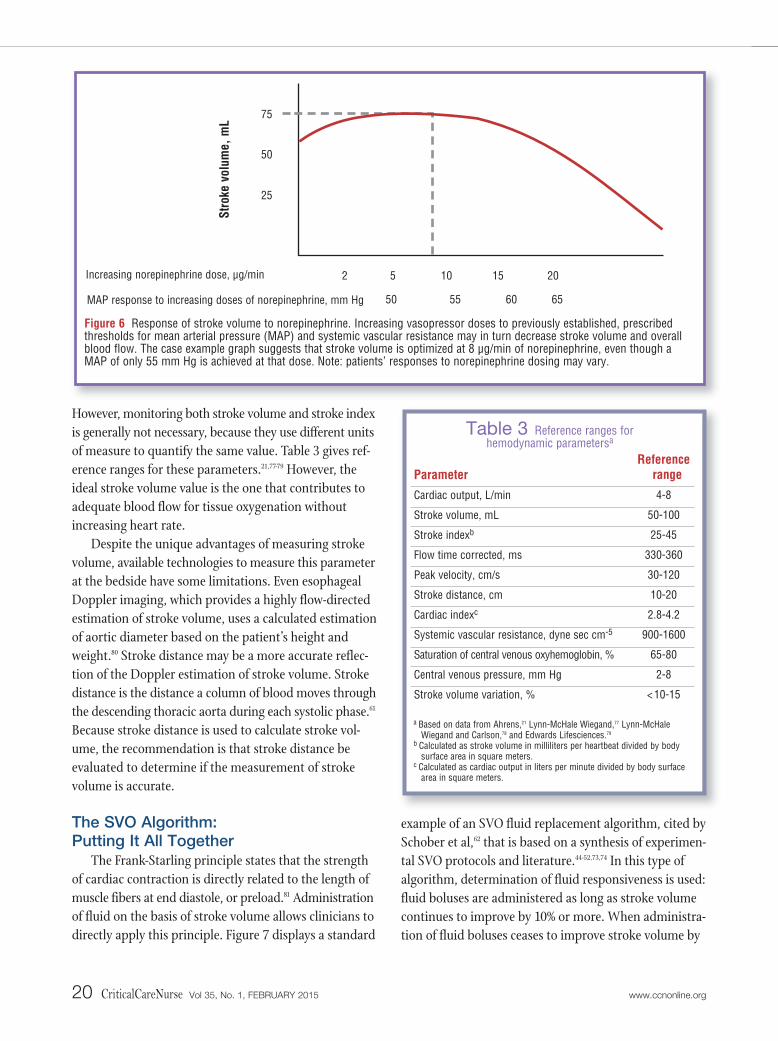
However, monitoring both stroke volume and stroke index
is generally not necessary, because they use different units
of measure to quantify the same value. Table 3 gives ref-
erence ranges for these parameters.21,77-79 However, the
ideal stroke volume value is the one that contributes to
adequate blood flow for tissue oxygenation without
increasing heart rate.
Despite the unique advantages of measuring stroke
volume, available technologies to measure this parameter
at the bedside have some limitations. Even esophageal
Doppler imaging, which provides a highly flow-directed
estimation of stroke volume, uses a calculated estimation
of aortic diameter based on the patient’s height and
weight.80 Stroke distance may be a more accurate reflec-
tion of the Doppler estimation of stroke volume. Stroke
distance is the distance a column of blood moves through
the descending thoracic aorta during each systolic phase.61
Because stroke distance is used to calculate stroke vol-
ume, the recommendation is that stroke distance be
evaluated to determine if the measurement of stroke
volume is accurate.
The SVO Algorithm: Putting It All Together
The Frank-Starling principle states that the strength
of cardiac contraction is directly related to the length of
muscle fibers at end diastole, or preload.81 Administration
of fluid on the basis of stroke volume allows clinicians to
directly apply this principle. Figure 7 displays a standard
example of an SVO fluid replacement algorithm, cited by
Schober et al,62 that is based on a synthesis of experimen-
tal SVO protocols and literature.44-52,73,74 In this type of
algorithm, determination of fluid responsiveness is used:
fluid boluses are administered as long as stroke volume
continues to improve by 10% or more. When administra-
tion of fluid boluses ceases to improve stroke volume by
20 CriticalCareNurse Vol 35, No. 1, FEBRUARY 2015 www.ccnonline.org
Figure 6 Response of stroke volume to norepinephrine. Increasing vasopressor doses to previously established, prescribedthresholds for mean arterial pressure (MAP) and systemic vascular resistance may in turn decrease stroke volume and overallblood flow. The case example graph suggests that stroke volume is optimized at 8 μg/min of norepinephrine, even though aMAP of only 55 mm Hg is achieved at that dose. Note: patients’ responses to norepinephrine dosing may vary.
Stro
ke v
olum
e, m
L
MAP response to increasing doses of norepinephrine, mm Hg
Increasing norepinephrine dose, μg/min 2 5
75
50
25
10 15 20
65605550
Parameter
Cardiac output, L/min
Stroke volume, mL
Stroke indexb
Flow time corrected, ms
Peak velocity, cm/s
Stroke distance, cm
Cardiac indexc
Systemic vascular resistance, dyne sec cm-5
Saturation of central venous oxyhemoglobin, %
Central venous pressure, mm Hg
Stroke volume variation, %
Referencerange
4-8
50-100
25-45
330-360
30-120
10-20
2.8-4.2
900-1600
65-80
2-8
< 10-15
Table 3 Reference ranges for hemodynamic parametersa
a Based on data from Ahrens,21 Lynn-McHale Wiegand,77 Lynn-McHale Wiegand and Carlson,78 and Edwards Lifesciences.79
b Calculated as stroke volume in milliliters per heartbeat divided by bodysurface area in square meters.
c Calculated as cardiac output in liters per minute divided by body surfacearea in square meters.
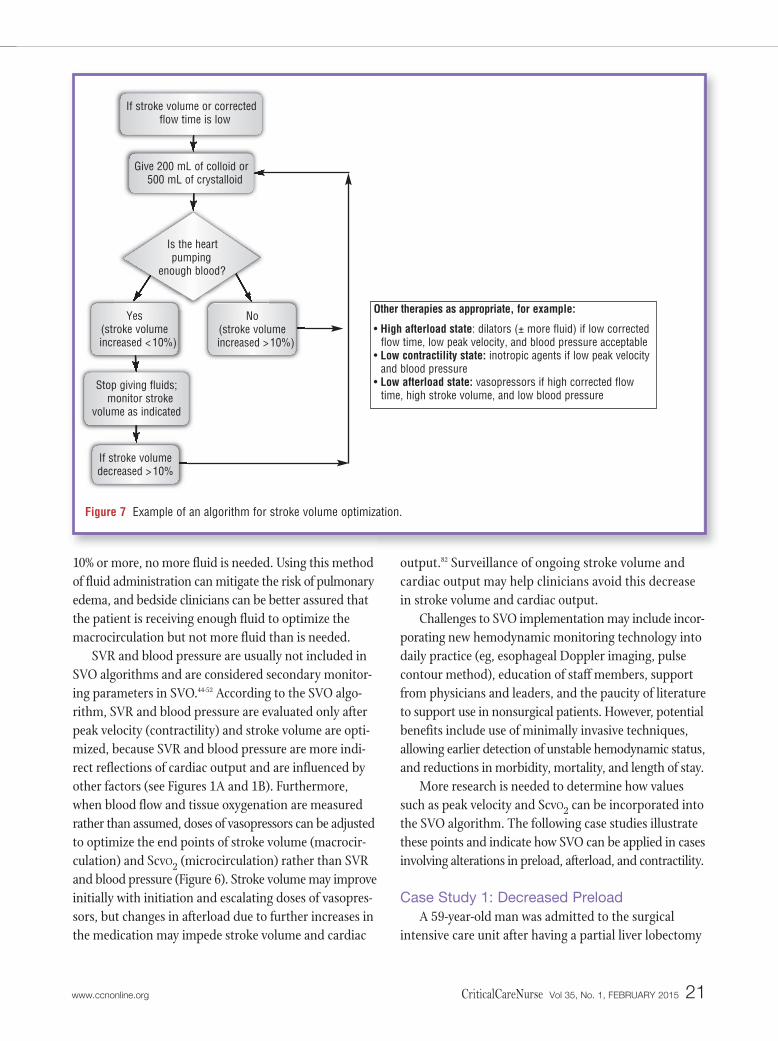
10% or more, no more fluid is needed. Using this method
of fluid administration can mitigate the risk of pulmonary
edema, and bedside clinicians can be better assured that
the patient is receiving enough fluid to optimize the
macrocirculation but not more fluid than is needed.
SVR and blood pressure are usually not included in
SVO algorithms and are considered secondary monitor-
ing parameters in SVO.44-52 According to the SVO algo-
rithm, SVR and blood pressure are evaluated only after
peak velocity (contractility) and stroke volume are opti-
mized, because SVR and blood pressure are more indi-
rect reflections of cardiac output and are influenced by
other factors (see Figures 1A and 1B). Furthermore,
when blood flow and tissue oxygenation are measured
rather than assumed, doses of vasopressors can be adjusted
to optimize the end points of stroke volume (macrocir-
culation) and ScvO2 (microcirculation) rather than SVR
and blood pressure (Figure 6). Stroke volume may improve
initially with initiation and escalating doses of vasopres-
sors, but changes in afterload due to further increases in
the medication may impede stroke volume and cardiac
output.82 Surveillance of ongoing stroke volume and
cardiac output may help clinicians avoid this decrease
in stroke volume and cardiac output.
Challenges to SVO implementation may include incor-
porating new hemodynamic monitoring technology into
daily practice (eg, esophageal Doppler imaging, pulse
contour method), education of staff members, support
from physicians and leaders, and the paucity of literature
to support use in nonsurgical patients. However, potential
benefits include use of minimally invasive techniques,
allowing earlier detection of unstable hemodynamic status,
and reductions in morbidity, mortality, and length of stay.
More research is needed to determine how values
such as peak velocity and ScvO2 can be incorporated into
the SVO algorithm. The following case studies illustrate
these points and indicate how SVO can be applied in cases
involving alterations in preload, afterload, and contractility.
Case Study 1: Decreased PreloadA 59-year-old man was admitted to the surgical
intensive care unit after having a partial liver lobectomy
www.ccnonline.org CriticalCareNurse Vol 35, No. 1, FEBRUARY 2015 21
Figure 7 Example of an algorithm for stroke volume optimization.
Other therapies as appropriate, for example:
• High afterload state: dilators (± more fluid) if low correctedflow time, low peak velocity, and blood pressure acceptable
• Low contractility state: inotropic agents if low peak velocityand blood pressure
• Low afterload state: vasopressors if high corrected flowtime, high stroke volume, and low blood pressure
If stroke volume or correctedflow time is low
Give 200 mL of colloid or500 mL of crystalloid
Stop giving fluids;monitor stroke
volume as indicated
If stroke volume decreased > 10%
Yes (stroke volumeincreased < 10%)
No (stroke volumeincreased > 10%)
Is the heart pumping
enough blood?
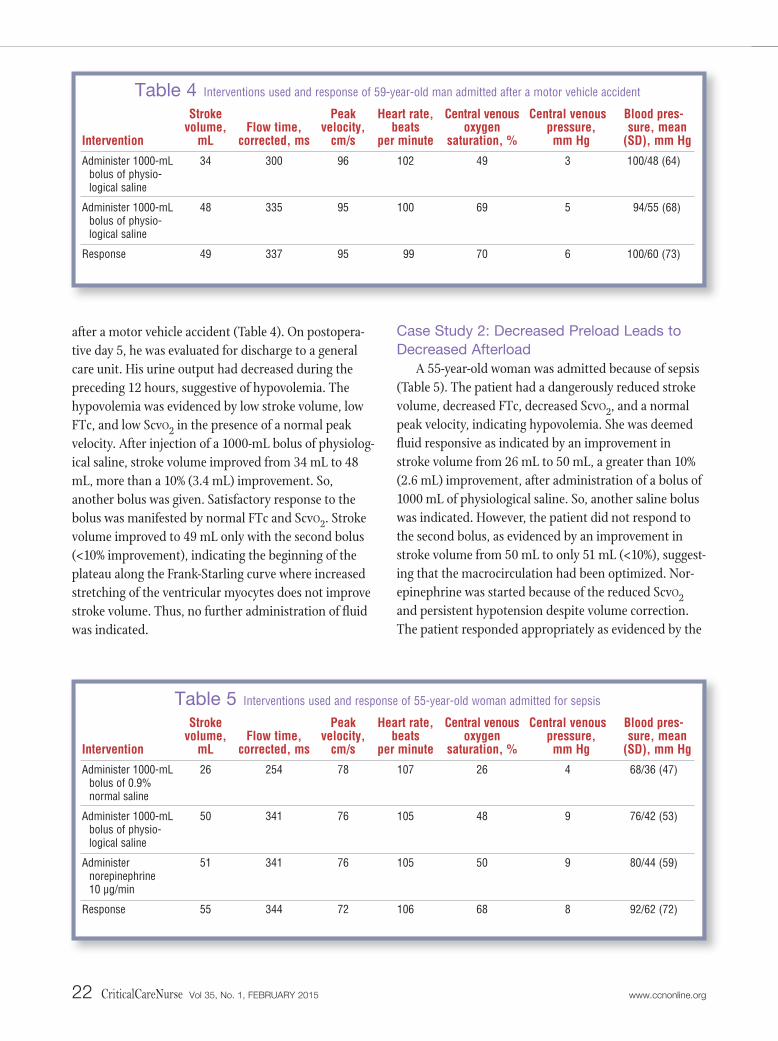
after a motor vehicle accident (Table 4). On postopera-
tive day 5, he was evaluated for discharge to a general
care unit. His urine output had decreased during the
preceding 12 hours, suggestive of hypovolemia. The
hypovolemia was evidenced by low stroke volume, low
FTc, and low ScvO2 in the presence of a normal peak
velocity. After injection of a 1000-mL bolus of physiolog-
ical saline, stroke volume improved from 34 mL to 48
mL, more than a 10% (3.4 mL) improvement. So,
another bolus was given. Satisfactory response to the
bolus was manifested by normal FTc and ScvO2. Stroke
volume improved to 49 mL only with the second bolus
(<10% improvement), indicating the beginning of the
plateau along the Frank-Starling curve where increased
stretching of the ventricular myocytes does not improve
stroke volume. Thus, no further administration of fluid
was indicated.
Case Study 2: Decreased Preload Leads toDecreased Afterload
A 55-year-old woman was admitted because of sepsis
(Table 5). The patient had a dangerously reduced stroke
volume, decreased FTc, decreased ScvO2, and a normal
peak velocity, indicating hypovolemia. She was deemed
fluid responsive as indicated by an improvement in
stroke volume from 26 mL to 50 mL, a greater than 10%
(2.6 mL) improvement, after administration of a bolus of
1000 mL of physiological saline. So, another saline bolus
was indicated. However, the patient did not respond to
the second bolus, as evidenced by an improvement in
stroke volume from 50 mL to only 51 mL (<10%), suggest-
ing that the macrocirculation had been optimized. Nor-
epinephrine was started because of the reduced ScvO2
and persistent hypotension despite volume correction.
The patient responded appropriately as evidenced by the
22 CriticalCareNurse Vol 35, No. 1, FEBRUARY 2015 www.ccnonline.org
Heart rate, beats
per minute
102
100
99
Central venousoxygen
saturation, %
49
69
70
Central venouspressure,mm Hg
3
5
6
Blood pres-sure, mean
(SD), mm Hg
100/48 (64)
94/55 (68)
100/60 (73)
Peak velocity,
cm/s
96
95
95
Flow time, corrected, ms
300
335
337
Stroke volume,
mL
34
48
49
Intervention
Administer 1000-mLbolus of physio-logical saline
Administer 1000-mLbolus of physio-logical saline
Response
Table 4 Interventions used and response of 59-year-old man admitted after a motor vehicle accident
Heart rate, beats
per minute
107
105
105
106
Central venousoxygen
saturation, %
26
48
50
68
Central venouspressure,mm Hg
4
9
9
8
Blood pres-sure, mean
(SD), mm Hg
68/36 (47)
76/42 (53)
80/44 (59)
92/62 (72)
Peak velocity,
cm/s
78
76
76
72
Flow time, corrected, ms
254
341
341
344
Stroke volume,
mL
26
50
51
55
Intervention
Administer 1000-mLbolus of 0.9% normal saline
Administer 1000-mLbolus of physio-logical saline
Administer norepinephrine 10 μg/min
Response
Table 5 Interventions used and response of 55-year-old woman admitted for sepsis

increase in ScvO2 to 68%, suggesting normalization of
the microcirculation.
Literature Supporting Clinical Usefulness of SVO
Before they adopt a new practice, astute clinicians
want to know that the practice is strongly supported in
the literature. Randomized controlled trials are the
highest-level research design, and the number of well-
designed randomized controlled trials is directly correlated
with the level of evidence assigned to a given practice.83-85
The findings of 11 randomized controlled trials,44-52,73,74
including 9 prospective trials,44-52 suggest that SVO results
in improved patient outcomes. Despite a thorough liter-
ature review, we were unable to find a fluid replacement
strategy supported by more research. The results of the
9 prospective trials,44-52 which included a total of about
1000 patients, consistently suggested that compared with
conventional fluid replacement, SVO fluid replacement
protocols contribute to decreases in overall hospital length
of stay (by 2 days or more), complication rates, renal
insufficiency, infection, use of vasopressors, blood lactate
levels, and time-to-tolerance of oral intake. Appropriately
implemented SVO programs that replicate these outcomes
may also be associated with decreased costs.86
Notably, the sample in all 11 trials44-52,73,74 included
perioperative patients. Although 2 of these trials44,47 also
focused on postoperative care in the critical care unit,
more research is needed to indicate the efficacy of SVO
in nonsurgical patients. However, in perioperative
patients, the strength of the supporting evidence in
favor of SVO has been substantiated by large-scale sys-
tematic literature reviews conducted by the Agency for
Healthcare Research and Quality,87 the National Health
Service,86 and third-party payers such as the Centers for
Medicare and Medicaid Services88 and Aetna.89
In 3 of these studies,86-88 the agencies recommended
SVO protocols be used for monitoring cardiac output of
patients receiving mechanical ventilation in the critical
care unit and for surgical patients who require intra -
operative fluid optimization. Esophageal Doppler imag-
ing,88 bioimpedance,90 and PACs91 are all reimbursed by
the Centers for Medicare and Medicaid Services88 on the
basis of systematic literature reviews. However,
esophageal Doppler imaging is the only technology also
supported by the Agency for Healthcare Research and
Quality.87
Similarly, the Cochrane Collaborative59 and the
Agency for Healthcare Research and Quality60 have pub-
lished technology assessments based on meta-analyses
of outcomes related to use of PACs. The analyses indi-
cated that the patients studied showed no evidence of
benefit or harm from PACs. Among the reasons cited
for the perceived lack of benefit was clinician-to-clinician
variability in management of hemodynamic data obtained
via PACs. In addition, the authors59,60 questioned the
accuracy of the interpretation of the hemodynamic
information in the studies analyzed and whether or not
patient management strategies based on hemodynamic
data were appropriate. Furthermore, none of the studies
included use of a specific protocol for PAC use. This lack
of a protocol is a key difference between PAC studies and
SVO studies. Each of the 9 randomized control trials44-52
on SVO
included a
protocol for
use of SVO.
Use of a pro-
tocol is con-
sistent with
other studies of replacement protocols that include
fluid therapy, which can be lifesaving when initiated
early in the course of treatment. Findings from a meta-
analysis of hemodynamic optimization by Poeze et al92
also suggest that replacement strategies such as SVO
improve outcomes, including patient mortality, in
high-risk surgical patients.
Nursing ConsiderationsNursing considerations associated with incorporat-
ing SVO into bedside practice include acquiring and
evaluating hemodynamic data, maintenance of skin
integrity, sedation and analgesia, and nursing research.
Acquisition and Evaluation of Hemodynamic Information
Clinical proficiency with applying or inserting the
hemodynamic monitoring device and adequate signal
acquisition are key.93 Each device has its own unique signal
acquisition technique and competency requirements.
Inappropriate application of the device may produce inac-
curate hemodynamic readings, leading to improper treat-
ment decisions.77,78 Once accurate readings are obtained,
understanding the appropriate application of “normal”
www.ccnonline.org CriticalCareNurse Vol 35, No. 1, FEBRUARY 2015 23
Stroke volume may improve initially with initiation and escalating doses ofvasopressors, but changes in afterloaddue to further pressor dose increases mayimpede stroke volume and cardiac output.

hemodynamic reference ranges to all patients is crucial.
Tracking trends in hemodynamic values over time is
generally more useful than is monitoring and treating
on the basis of single data points, because transient
changes in values may not be clinically importantly.
When readings are considered accurate and hypo -
volemia is identified, rapid infusion of a fluid bolus may
optimize a patient’s response. Fluid infused via a pres-
sure bag often produces a more dramatic increase in
stroke volume than does fluid administered via an intra-
venous infusion pump. A maximum rate of commonly
used intravenous pumps is 999 mL/h. Because hypo -
volemia and hypoperfusion are time-sensitive conditions,
the provider’s judgment and the patient’s condition may
determine that a more rapid infusion rate is needed.
The latest revision of the Surviving Sepsis Campaign
guidelines also suggests an increased emphasis on earlier
and more aggressive fluid replacement. For example, the
2008 guidelines94 recommended a 20 mL/kg crystalloid
fluid challenge in a 6-hour replacement bundle. In the
2012 revised guideline,29 the recommended amount of
fluid was increased (to 30 mL/kg) in a shorter time (3-hour
bundle). Clinicians must strongly consider strategies to
infuse such a volume rapidly enough, in accordance with
institutional policy as appropriate.
Maintenance of Skin IntegrityCare must be taken to avoid skin breakdown under
and around skin electrodes. With bioimpedance and
bioreactance, signals are acquired transcutaneously, and
skin care should be in accordance with the manufacturer’s
recommendations and institutional policy. Mouth ulcer-
ations are also possible with monitoring devices such as
those used for esophageal Doppler imaging93 and endo-
tracheally applied bioimpedance. Diligent oral care should
be performed as
needed while
those devices are
in place. Site care
is also important
when caring for
patients moni-
tored with intravenous pulse contour devices or PACs.
Catheter infections can be minimized by using sterile
conditions during insertion and aseptic technique during
dressing changes.77,78
Sedation and AnalgesiaSedation is sometimes required with techniques such
as the exhaled carbon dioxide method, which requires
controlled mechanical ventilation, and esophageal Doppler
imaging. These techniques may have limited accuracy
when increased respiratory rates or restlessness, respec-
tively, occur. Therefore, sedative agents or analgesics
may be administered as needed.77,78 Although not a major
focus with respect to SVO, pain cannot be overlooked;
it is not only an overall priority but can also influence
hemodynamic readings.
Nurse ResearchThe implications of patient advocacy extend beyond
routine patient care and include nurses’ participation in
designing and implementing future research on the clini-
cal usefulness of SVO in critical care. Critical care nurses
monitor and treat hypovolemia daily and have a unique
opportunity to contribute to the existing scientific body
of knowledge through participation in SVO studies in
medical critical care patients.
SummaryThe growing body of evidence supporting SVO
suggests that implementation of SVO into daily practice
should be considered.61,62,88 A new era is emerging in
which blood-flow monitoring is taking precedence over
the monitoring of blood pressures. Cardiac pressures
help provide estimates of blood volume; however, normal
cardiac pressures can be observed in a patient in shock
and provide little information about blood flow.30,95-97
Interpretation and treatment of blood pressures incor-
porate assumptions, whereas stroke volume may be
considered a more precise measure of fluid responsive-
ness and an earlier warning sign of volume depletion
than are urine output, altered mental status, CVP, heart
rate, and blood pressure.1-5 Earlier signals allow clini-
cians to anticipate rather than react to changes, improv-
ing the likelihood for maintaining a stable metabolic
state at the organ and cellular level. In addition to the
evidence supporting SVO, minimally invasive applica-
tions and improvements in accuracy also add to safety
advantages when inherent limitations of the various
methods are considered.
For years, strategies for use of SVO were not feasible
because no practical measurement method for SVO
24 CriticalCareNurse Vol 35, No. 1, FEBRUARY 2015 www.ccnonline.org
Earlier signals such as stroke volumeallow clinicians to anticipate rather thanreact to changes, improving the likeli-hood of maintaining a stable metabolicstate at the organ and cellular level.

existed for bedside clinicians. Fortunately, technology
has improved the hemodynamic monitoring landscape.
Compared with old devices, newer technology is less inva-
sive, safe, evidence based, flow directed, cost-effective,
easier to use, and accurate. Although further research
on SVO and dynamic indices are needed to establish the
clinical efficacy of SVO in critical care units, the current
body of literature indicates that SVO is associated with
fewer complications and reduced hospital lengths of stay,
particularly in patients receiving mechanical ventilation
and in surgical patients. Until more randomized trials
on the impact of SVO protocols on the outcomes of
critical care patients are published, SVO is supported
by more evidence than is use of filling pressures for fluid
replacement in critical care units.27,32,44-52,73,74,86-88 On the
basis of our review of the current available literature, we
suggest that the SVO algorithm for fluid replacement be
considered in place of use of cardiac filling pressures for
patients in critical care, as appropriate, with attention to
outcomes. In the meantime, more research is needed to
evaluate the impact of SVO on patients other than peri-
operative patients and on nonintubated patients. CCN
AcknowledgmentsThe authors thank Terry Sears and Julie Stielstra for their contributions. Wealso thank the critical care staff, physicians, and leaders at Central DuPageHospital–Northwestern Medicine. Without their help and support, this man-uscript would have been much more difficult to complete.
Financial DisclosuresTom Ahrens has lectured for hemodynamic monitoring companies (includingDeltex Medical Inc) and is a hemodynamic monitoring consultant.
References1. Hamilton-Davies C, Mythen M, Salmon J, Jacobson D, Shukla A, Webb A.
Comparison of commonly used clinical indicators of hypovolaemia withgastrointestinal tonometry. Intensive Care Med. 1997;23(3):276-281.
2. Alspach J, ed. Core Curriculum for Critical Care Nursing. 6th ed. St Louis,MO: Saunders Elsevier; 2006:83, 195, 361, 365, 368.
3. Gutierrez G, Reines HD, Wulf-Gutierrez M. Clinical review: hemorrhagicshock. Crit Care. 2004;8(5):373-381.
4. McLean B, Zimmerman J, Baldisseri M,et al. Fundamental Critical CareSupport. 4th ed. Mount Prospect, IL: Society of Critical Care Medicine;2007:9-6.
5. American College of Surgeons. Advanced Trauma Life Support for Doctors:ATLS. 8th ed. Chicago, IL: American College of Surgeons; 2008.
6. McCance KL, Huether SE, Brashers VL, Rote NS. Pathophysiology: TheBiologic Basis for Disease in Adults and Children. 6th ed. St Louis, MO:Mosby, Elsevier: 2010.
7. Ahrens T, Rutherford K. Essentials of Oxygenation: Implication for ClinicalPractice. Boston, MA: Jones & Bartlett Publishers Inc; 1993:51.
8. Hillman KM, Bristow PJ, Chey T, et al. Antecedents to hospital deaths.Intern Med J. 2001;31(6):343-348.
9. Kause J, Smith G, Prytherch D, et al; Intensive Care Society (UK); Aus-tralian and New Zealand Intensive Care Society Clinical Trials Group.A comparison of antecedents to cardiac arrests, deaths and emergencyintensive care admissions in Australia and New Zealand, and the UnitedKingdom—the ACADEMIA study. Resuscitation. 2004;62(3):275-282.
10. Connors AF Jr, Dawson NV, Shaw PK, Montenegro HD, Nara AR, Martin L. Hemodynamic status in critically ill patients with and withoutacute heart disease. Chest. 1990;98(5):1200-1206.
11. Dawson NV, Connors AF Jr, Speroff T, Kemka A, Shaw P, Arkes HR.Hemodynamic assessment in managing the critically ill: is physicianconfidence warranted? Med Decis Making. 1993;13(3):258-266.
12. Eisenberg PR, Jaffe AS, Schuster DP. Clinical evaluation compared topulmonary artery catheterization in the hemodynamic assessment ofcritically ill patients. Crit Care Med. 1984;12(7):549-553.
13. Hoeft A, Schorn B, Weyland A, et al. Bedside assessment of intravascularvolume status in patients undergoing coronary bypass surgery. Anesthe-siology. 1994;81(1):76-86.
14 Iregui MG, Prentice D, Sherman G, Schallom L, Sona C, Kollef MH.Physicians’ estimates of cardiac index and intravascular volume basedon clinical assessment versus transesophageal Doppler measurementsobtained by critical care nurses. Am J Crit Care. 2003;12(4):336-342.
15. Neath SX, Lazio L, Guss DA. Utility of impedance cardiography toimprove physician estimation of hemodynamic parameters in the emer-gency department. Congest Heart Fail. 2005;11(1):17-20.
16. Staudinger T, Locker GJ, Laczika K, et al. Diagnostic validity of pulmonaryartery catheterization for residents at an intensive care unit. J Trauma.1998;44(5):902-906.
17. Celoria G, Steingrub J, Vickers-Lahti M, et al. Clinical assessment ofhemodynamic values in two surgical intensive care units: effects of ther-apy. Arch Surg. 1990;125(8):1036-1039.
18. Bakker J, Jansen T. Don’t take vitals, take a lactate. Intensive Care Med.2007;33:1863-1865.
19. Howell MD, Donnino M, Clardy P, Talmor D, Shapiro NI. Occult hypop-erfusion and mortality in patients with suspected infection. Intensive CareMed. 2007;33(11):1892-1899.
20. Mikkelsen M, Miltiades A, Gaieski D, et al. Serum lactate is associatedwith mortality in severe sepsis independent of organ failure and shock.Crit Care Med. 2009;37(5):1670-1677.
21. Ahrens T. Hemodynamics in sepsis. AACN Adv Crit Care. 2006;17(4):435-445.
22. Department of Health and Human Services, National Institutes ofHealth, National Heart, Lung, and Blood Institute. The Seventh Report ofthe Joint National Committee on Prevention, Detection, Evaluation, andTreatment of High Blood Pressure. Bethesda MD: National Heart, Lung,and Blood Institute; August 2004. NIH Publication No. 04-5230.
23. Connors A, Speroff T, Dawson N, et al. The effectiveness of right heartcatheterization in the initial care of critically ill patients. SUPPORTInvestigators. JAMA. 1996;276(11):889-897.
24. Smartt S. The pulmonary artery catheter: gold standard or redundantrelic. J Perianesth Nurs. 2005;20(6):373-379.
25. Pugsley J, Lerner A. Cardiac output monitoring: is there a gold standardand how do the newer technologies compare? Semin Cardiothorac VascAnesth. 2010;14(4):274-282.
26. Forrester JS, Diamond G, McHugh TJ, Swan HJ. Filling pressures in theright and left sides of the heart in acute myocardial infarction: a reappraisalof central-venous-pressure monitoring. N Engl J Med. 1971;285(4):190-193.
27. Marik P, Baram M, Vahid B. Does central venous pressure predict fluidresponsiveness? A systematic review of the literature and the tale ofseven mares. Chest. 2008;134(1):172-178.
28. Magdesian KG, Fielding CL, Rhodes DM, Ruby RE. Changes in centralvenous pressure and blood lactate concentration in response to acuteblood loss in horses. J Am Vet Med Assoc. 2006;229(9):1458-1462.
29. Dellinger RP, Levy MM, Rhodes A, et al; Surviving Sepsis CampaignGuidelines Committee including the Pediatric Subgroup. SurvivingSepsis Campaign: International guidelines for management of severesepsis and septic shock: 2012. Crit Care Med. 2013;41(2):580-637.
30. Ahrens T. Stroke volume optimization vs central venous pressure influid management. Crit Care Nurse. 2010;30(2):71-73.
31. Pope JV, Jones AE, Gaieski DF, Arnold RC, Trzeciak S, Shapiro NI; Emer-gency Medicine Shock Research Network (EMShockNet) Investigators.
www.ccnonline.org CriticalCareNurse Vol 35, No. 1, FEBRUARY 2015 25
Now that you’ve read the article, create or contribute to an online discussionabout this topic using eLetters. Just visit www.ccnonline.org and select the articleyou want to comment on. In the full-text or PDF view of the article, click“Responses” in the middle column and then “Submit a response.”
To learn more about stroke volume optimization, read “StrokeVolume Optimization Versus Central Venous Pressure in FluidManagement” by Ahrens in Critical Care Nurse, April 2010;30:71-72. Available at www.ccnonline.org.

Multicenter study of central venous oxygen saturation (ScvO2) as a pre-dictor of mortality in patients with sepsis. Ann Emerg Med. 2010;55(1):40-46.e1.
32. Marik P. Surviving sepsis: going beyond the guidelines. Ann IntensiveCare. 2011;1(17):1-6.
33. Rivers E, Nguyen B, Havstad S, et al; Early Goal-Directed Therapy Col-laborative Group. Early goal-directed therapy in the treatment of severesepsis and septic shock. N Engl J Med. 2001;345(19):1368-1377.
34. Benington S, Ferris P, Nirmalan M. Emerging trends in minimally inva-sive haemodynamic monitoring and optimization of fluid therapy. Eur JAnaesthesiol. 2009;26(11):893-905.
35. Marik P, Monnet X, Teboul JL. Hemodynamic parameters to guide fluidtherapy. Ann Intensive Care. 2011;1(1):1-9.
36. Turner MA. Doppler-based hemodynamic monitoring: a minimallyinvasive alternative. AACN Clin Issues. 2003;14(2):220-231.
37. Michard F, Teboul J. Predicting fluid responsiveness in ICU patients: acritical analysis of the evidence. Chest. 2002;121:2000-2008.
38. Dünser M, Takala J, Brunauer A, Bakker J. Re-thinking resuscitation:leaving blood pressure cosmetics behind and moving forward to permis-sive hypotension and a tissue perfusion-based approach. Crit Care. 2013;17:326. doi:10.1186/cc12727.
39. Marik P, Bellomo R. Re-thinking resuscitation goals: an alternativepoint of view! Crit Care. 2013;17:458. doi:10.1186/cc12775.
40. Knotzer H, Hasibeder W. Microcirculation function monitoring at thebedside—a view from the intensive care. Physiol Meas. 2007;28(9):R65-R86.
41. Marik P, Cavallazzi R, Vasu T, Hirani A. Dynamic changes in arterialwaveform derived variables and fluid responsiveness in mechanicallyventilated patients: a systematic review of the literature. Crit Care Med.2009;37(9):2642-2647.
42. Marik P. Techniques for assessment of intravascular volume in criticallyill patients. Intensive Care Med. 2009;24(5):329-337.
43. Dark P, Singer M. The validity of trans-esophageal Doppler ultrasonog-raphy as a measure of cardiac output in critically ill adults. Intensive CareMed. 2004;30:2060-2066.
44. Chytra I, Pradl R, Bosman R, Pelnar P, Kasal E, Zidkova A. EsophagealDoppler-guided fluid management decreases blood lactate levels inmultiple-trauma patients: a randomized controlled trial. Crit Care.2007;11(1):R24.
45. Conway DH, Mayall R, Abdul-Latif MS, Gilligan S, Tackaberry C. Ran-domized controlled trial investigating the influence of intravenous fluidtitration using esophageal Doppler monitoring during bowel surgery.Anaesthesia. 2002;57(9):845-849.
46. Gan TJ, Soppitt A, Maroof M, et al. Goal-directed intraoperative fluidadministration reduces length of hospital stay after major surgery. Anes-thesiology. 2002;97(4):820-826.
47. McKendry M, McGloin H, Saberi D, Caudwell L, Brady AR, Singer M.Randomised controlled trial assessing the impact of a nurse delivered,flow monitored protocol for optimisation of circulatory status after car-diac surgery. BMJ. 2004;329(7460):258-261.
48. Mythen MG, Webb AR. Perioperative plasma volume expansionreduces the incidence of gut mucosal hypoperfusion during cardiac sur-gery. Arch Surg. 1995;130(4):423-429.
49. Sinclair S, James S, Singer M. Intraoperative intravascular volume opti-misation and length of hospital stay after repair of proximal femoralfracture: randomised controlled trial. BMJ. 1997;315(7113):909-912.
50. Venn R, Steele A, Richardson P, Poloniecki J, Grounds M, Newman P.Randomized controlled trial to investigate influence of the fluid chal-lenge on duration of hospital stay and perioperative morbidity inpatients with hip fractures. Br J Anaesth. 2002;88(1):65-71.
51. Wakeling HG, McFall MR, Jenkins CS, et al. Intraoperative oesophagealDoppler guided fluid management shortens postoperative hospital stayafter major bowel surgery. Br J Anaesth. 2005;95(5):634-642.
52. Noblett S, Snowden C, Shenton B, Horgan A. Randomized clinical trialassessing the effect of Doppler-optimized fluid management on out-come after elective colorectal resection. Br J Surg. 2006;93(9):1069-1076.
53. Pearse R, Dawson D, Fawcett J, Rhodes A, Grounds RM, Bennett ED.Early goal-directed therapy after major surgery reduces complicationsand duration of hospital stay: a randomized, controlled trial[ISRCTN38797445]. Crit Care. 2005;9(6):R687-R693.
54. Mayer J, Boldt J, Mengistu AM, Röhm KD, Suttner S. Goal-directedintraoperative therapy based on autocalibrated arterial pressure wave-form analysis reduces hospital stay in high-risk surgical patients: a ran-domized, controlled trial. Crit Care. 2010;14(1):R18. doi:10.1186/cc8875.
55. Goepfert M, Richter H, Eulenburg C, et al. Individually optimizedhemodynamic therapy reduces complications and length of stay in theintensive care unit: a prospective, randomized controlled trial. Anesthe-siology. 2013;119(4):824-836.
56. Salzwedel C, Puig J, Carstens A, et al. Perioperative goal-directed hemo-dynamic therapy based on radial arterial pulse pressure variation andcontinuous cardiac index trending reduces postoperative complicationsafter major abdominal surgery: a multi-center, prospective, randomizedstudy. Crit Care. 2013;17(5):R191. doi:10.1186/cc12885.
57. Van der Linden PJ, Dierick A, Wilmin S, Bellens B, De Hert SG. A ran-domized controlled trial comparing an intraoperative goal-directedstrategy with routine clinical practice in patients undergoing peripheralarterial surgery. Eur J Anaesthesiol. 2010;27(9):788-793.
58. Szakmany T, Toth I, Kovacs Z, et al. Effects of volumetric vs pressure-guided fluid therapy on postoperative inflammatory response: a prospec-tive, randomized clinical trial. Intensive Care Med. 2005;31(5):656-663.
59. Rajaram SS, Desai NK, Kalra A, et al. Pulmonary artery catheters foradult patients in intensive care. Cochrane Database Syst Rev. 2013;2:CD003408. doi:10.1002/14651858.CD003408.pub3.
60. Balk E, Raman G, Chung M, et al. Evaluation of the Evidence on Benefitsand Harms of Pulmonary Artery Catheter Use in Critical Care Settings.Rockville, MD: Agency for Healthcare Research and Quality; March 28,2008. http://www.cms.gov/determinationprocess/downloads/id55TA.pdf. Accessed October 29, 2014.
61. Roche A, Miller T, Gan T. Goal-directed fluid management with trans-oesophageal Doppler. Best Pract Res Clin Anaesthesiol. 2009;23(3):327-334.
62. Schober P, Loer S, Schwarte L. Perioperative hemodynamic monitoringwith transesophageal Doppler technology. Anesth Analg. 2009;109:340-353.
63. Chew HC, Devanand A, Phua GC, Loo CM. Oesophageal Doppler ultra-sound in the assessment of haemodynamic status of patients admittedto the medical intensive care unit with septic shock. Ann Acad Med Sin-gapore. 2009;38(8):699-703.
64. Bendjelid K. Assessing fluid responsiveness with esophageal Dopplerdynamic indices: concepts and methods [comment]. Intensive Care Med.2006;32(7):1088.
65. Monnet X, Pinsky M, Teboul J. FTc is not an accurate predictor of fluidresponsiveness. Intensive Care Med. 2006;32:1090-1091.
66. Johnson A, Schweitzer D. Putting the wedge under pressure [comment].Ann Acad Med Singapore. 2010;39(10):815.
67. Singer M. The FTc is not an accurate marker of left ventricular preload:reply to the comment by Chemla and Nitenberg. Intensive Care Med.2006;32(9):1456-1457.
68. Singer M. The FTc is not an accurate marker of left ventricular preload.Intensive Care Med. 2006;32(7):1089.
69. Madan AK, UyBarreta VV, Aliabadi-Wahle S, et al. Esophageal Dopplerultrasound monitor versus pulmonary artery catheter in the hemody-namic management of critically ill surgical patients. J Trauma. 1999;46(4):607-611.
70. Seoudi H, Perkal M, Hanrahan A, Angood P. The esophageal Dopplermonitor in mechanically ventilated surgical patients: does it work[abstract]? J Trauma. 1999;47(6):1171.
71. DiCorte CJ, Latham P, Greilich PE, Cooley MV, Grayburn PA, Jessen ME.Esophageal Doppler monitor determinations of cardiac output and pre-load during cardiac operations. Ann Thoracic Surg. 2000;69(6):1782-1786.
72. Kincaid H, Fly M, Chang M. Noninvasive measurements of preloadusing esophageal Doppler are superior to pressure-based estimates incritically injured patients [abstract]. Crit Care Med. 1999;27(1):A111.
73. Mark JB, Steinbrook RA, Gugino LD, et al. Continuous noninvasivemonitoring of cardiac output with esophageal Doppler ultrasound dur-ing cardiac surgery. Anesth Analg. 1986;65(10):1013-1020.
74. Valtier B, Cholley BP, Belot JP, Coussay JE, Mateo J, Payen DM. Nonin-vasive monitoring of cardiac output in critically ill patients using trans-esophageal Doppler. Am J Respir Crit Care Med. 1998;158:77-83.
75. Micek ST, Roubinian N, Heuring T, et al. Before-after study of a stan-dardized hospital order set for the management of septic shock. CritCare Med. 2006;34(11):2707-2713.
76. Saberi D, Caudwell L, McGloin H, Singer M. Proactive circulatory man-agement in the first 4 hours postcardiac surgery: interim analysis of anurse-led, oesophageal Doppler-guided protocol [abstract]. IntensiveCare Med. 2000;26(3 suppl):S220.
77. Lynn-McHale Wiegand D, ed. AACN Procedure Manual for Critical Care.6th ed. St Louis, MO: Elsevier Saunders: 2011.
78. Lynn-McHale Wiegand D, Carlson K, eds. AACN Procedure Manual forCritical Care. 5th ed. St Louis, MO: Elsevier; 2005.
79. Edwards Lifesciences. Advanced hemodynamic monitoring. The FloTracsensor: stroke volume variation. http://www.edwards.com/products/mininvasive/Pages/strokevolumevariationwp.aspx. Accessed October30, 2014.
80. Singer M. Continuous Haemodynamic Monitoring by Oesophageal Doppler[doctoral dissertation]. London, England: University of London; April 1989.
81. Starling EH. The Linacre Lecture on the Law of the Heart. London, England:Longmans, Green & Co; 1918.
26 CriticalCareNurse Vol 35, No. 1, FEBRUARY 2015 www.ccnonline.org

82. Ahrens T, Taylor L. Hemodynamic Waveform Analysis. St Louis, MO: WBSaunders; 1992:432, 444-447.
83. Atkins D, Best D, Briss PA, et al; GRADE Working Group. Grading quality ofevidence and strength of recommendations. BMJ. 2004;328(7454):1490-1498.
84. Guyatt G, Gutterman D, Baumann MH, et al. Grading strength of recom-mendations and quality of evidence in clinical guidelines: report from anAmerican College of Chest Physicians task force. Chest. 2006;129(1):174-181.
85. Schünemann HJ, Jaeschke R, Cook DJ, et al; ATS Documents Developmentand Implementation Committee. An official ATS statement: grading thequality of evidence and strength of recommendations in ATS guidelinesand recommendations. Am J Respir Crit Care Med. 2006;174(5):605-614.
86. Mowatt G, Houston G, Hernández R, et al. Systematic review of the clini-cal effectiveness and cost-effectiveness of oesophageal Doppler monitor-ing in critically ill and high-risk surgical patients. Health Technol Assess.2009;13(7):iii-iv, ix-xii, 1-95. doi:10.3310/hta13070.
87. Agency for Healthcare Research and Quality. Esophageal Doppler ultra-sound-based cardiac output monitoring for real-time therapeutic manage-ment of hospitalized patients: a review. http://www.cms.hhs.gov/determinationprocess/downloads/id45TA.pdf. Published January 16,2007. Accessed October 30, 2014.
88. Centers for Medicare and Medicaid Services. CMS manual system: pub100-03 Medicare national coverage determinations. http://www.cms.hhs.gov/Transmittals/Downloads/R72NCD.pdf. Published August 28,2007. Accessed October 31, 2014.
89. Aetna Health Insurance. Clinical policy bulletin: esophageal Dopplermonitoring. Publication No. 0793. http://www.aetna.com/cpb/medical/data/700_799/0793.html. Accessed October 31, 2014.
90. Centers for Medicare and Medicaid Services. CMS manual system: pub100-03 Medicare national coverage determinations. https://www.cms.gov/transmittals/downloads/R63NCD.pdf. Published December 15, 2006.Accessed October 31, 2014.
91. CMS.gov. Billing and coding guidelines. Cardiac catheterization andcoronary angiography. http://downloads.cms.gov/medicare-coverage-database/lcd_attachments/30719_6/L30719_CV006_CBG_010111.pdf. Accessed November 24, 2014.
92. Poeze M, Greve J, Ramsay G. Meta-analysis of hemodynamic optimization:relationship to methodological quality. Critical Care. 2005;9(6):R771-R779.
93. Prentice D, Sona C. Esophageal Doppler monitoring for hemodynamicassessment. Crit Care Nurs Clin North Am. 2006;18:189-193.
94. Dellinger P, Levy M, Carlet J, et al; International Surviving Sepsis Cam-paign Guidelines Committee; American Association of Critical-CareNurses; American College of Chest Physicians; American College ofEmergency Physicians; Canadian Critical Care Society; European Societyof Clinical Microbiology and Infectious Diseases; European Society ofIntensive Care Medicine; European Respiratory Society; InternationalSepsis Forum; Japanese Association for Acute Medicine; Japanese Soci-ety of Intensive Care Medicine; Society of Critical Care Medicine; Societyof Hospital Medicine; Surgical Infection Society; World Federation ofSocieties of Intensive and Critical Care Medicine. Surviving Sepsis Cam-paign: international guidelines for management of severe sepsis and sep-tic shock: 2008 [published correction appears in Crit Care Med.2008;36(4):1394-1396]. Crit Care Med. 2008;36(1):296-327.
95. Wo CC, Shoemaker WC, Appel PL, Bishop MH, Kram HB, Hardin E.Unreliability of blood pressure and heart rate to evaluate cardiac outputin emergency resuscitation and critical illness. Crit Care Med. 1993;21(2):218-223.
96. Shippy C, Appel P, Shoemaker W. Reliability of clinical monitoring to assessblood volume in critically ill patients. Crit Care Med. 1984;12:107-112.
97. Ferrer R, Artigas A, Suarez D, et al; Edusepsis Study Group. Effectivenessof treatments for severe sepsis: a prospective, multicenter, observationalstudy. Am J Respir Crit Care Med. 2009;180(9):861-866.
www.ccnonline.org CriticalCareNurse Vol 35, No. 1, FEBRUARY 2015 27