stress measurement by x-ray diffractometry
TRANSCRIPT
United States Patent [19] [11] Patent Number: 4,561,062 Mitchell [45] Date of Patent: Dec. 24, 1985
[54] STRESS MEASUREMENT BY X-RAY 737818 12/1977 U.S,S.R. . DIFFRACYOMETRY
[75] Inventor: Crighton M. Mitchell, Kanata, OTHER PUBLICATIONS Canada Jr]. of Metals, “Review of Nondestructive Methods for
[73] Assignee: Her Majesty the Queen in right of Residual Stress Measurement”, Jul. 1981, C. O. Ruud, Canada, as represented by the PP~ 35"39- _ _ Minister of Energy, Mines and Advances in X-Ray Analysis, vol. 20 (1977), “A Dual Resources Canada, Ottawa’ Canada Detector Diffractometer for Measurement of Residual
[2]] App]. No‘: 467,955 Stress”, C. _M. Mitchel, pp. 379-391. [22] Filed, Feb_ 18, 1983 Advances in X-Ray Analysis, vol.’ 22 (1979), “New [51] Int GL4 G01N 15/00; 601M 5/00 Method for Fast?XRPD using a P‘osltlon Sensitive De [52] US. Cl. .................................... .. 364/555; 73/786; ‘69°F ’ H- E- Gobel’ PP’ 255-265
364/508; 378/72 Primary Examiner-Errol A. Krass [58] Field of Search ................ .. 364/508, 555; 378/71, Assistant Examiner~Kevin J. Teska
378/72; 250/307; 73/786, 787 [57] ABSTRACT [56] References Cited
U.S. PATENT DOCUMENTS
2,184,174 12/1939 Bertram .............................. .. 250/65
2,462,374 2/1949 Firth .... .. 250/83.6
2,898,470 8/1959 Khol . . . . . . . . . . .. 250/53
3,023,311 2/1962 Bessen 250/51.5 3,030,507 4/ 1962 Khol .... .. 250/51.5
3,197,638 7/1965 Sinclair 250/83.3 3,402,291 9/1968 Weinman .. 250/51.5 3,411,001 11/1968 Wilchinsky 250/51.5 3,483,377 12/1969 Borkowski 250/83.3 3,614,425 10/1971 Yoshimatsu .. 250/5l.5 3,617,705 11/1971 Takano .... .. 250/51.5
3,634,686 1/1972 Sekita 250/51.5 3,639,758 2/1972 Shimura 250/51.5 3,639,760 2/1972 Mizunuma ......... .. 250/5l.5
3,868,506 2/1975 Ogiso ................. .. 250/278 3,934,138 1/1976 Bens 250/278 4.042.825 8/1977 Ruud ....... .. 250/272
4,076,981 2/ 1978 Sparks et a1. . 250/272 4,095,103 6/1978 Cohen et a1. 250/277 4,125,771 11/1978 Erwin ............. .. 250/277
4,128,762 12/1978 Nagao et al 250/272 4,247,771 1/1981 Frevel ......... .. .. 250/273
4,287,416 9/1981 Kramer et a]. 250/273 4,476,386 10/1984 Reid et a1, .................... .. 250/307 X
FOREIGN PATENT DOCUMENTS
3119287 3/1982 Fed. Rep. of Germany , 2007479 5/1979 United Kingdom . 1585608 3/ 1981 United Kingdom . 441490 9/1972 U.S.S.R. . 624150 2/1977 U.S.S.R. .
DETECTOR ANALYSIS SYSTEM
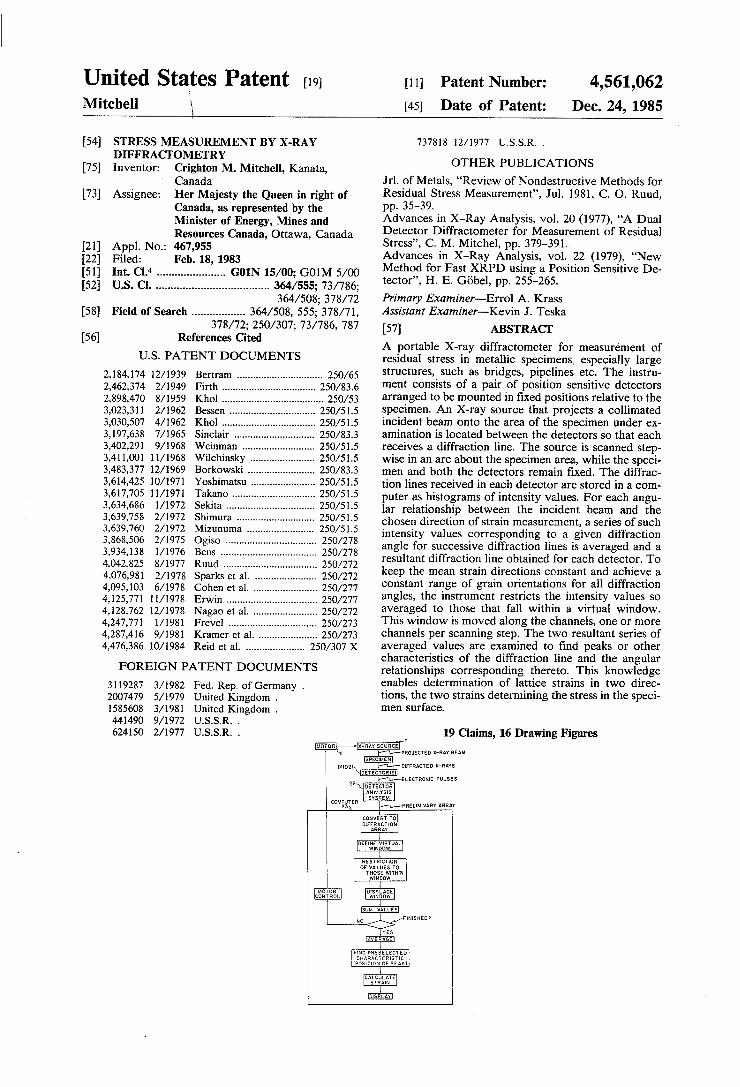
A portable X-ray diffractometer for measurement of residual stress in metallic specimens, especially large structures, such as bridges, pipelines etc. The instru‘ ment consists of a pair of position sensitive detectors arranged to be mounted in ?xed positions relative to the specimen. An X-ray source that projects a collimated incident beam onto the area of the specimen under ex amination is located between the detectors so that each receives a diffraction line. The source is scanned step wise in an are about the specimen area, while the speci men and both the detectors remain ?xed. The diffrac tion lines received in each detector are stored in a com puter as histograms of intensity values. For each angu lar relationship between the incident beam and the chosen direction of strain measurement, a series of such intensity values corresponding to a given diffraction angle for successive diffraction lines is averaged and a resultant diffraction line obtained for each detector. To keep the mean strain directions constant and achieve a constant range of grain orientations for all diffraction angles, the instrument restricts the intensity values so averaged to those that fall within a virtual window. This window is moved along the channels, one or more channels per scanning step. The two resultant series of averaged values are examined to ?nd peaks or other characteristics of the diffraction line and the angular relationships corresponding thereto. This knowledge enables determination of lattice strains in two direc tions, the two strains determining the stress in the speci men surface.
19 Claims, 16 Drawing Figures PROJECTED X-RAY BEAM
DIFFRACTED X_RAYS
ELECTRONIC PULSES
PRELIMINARY AHRAV
RESTRICTlDN OF VALUES TO THOSE WITHIN WINDOW
FIND PRESELECTED CHARACTERISTIC {POSITION OF PEAK)
US. Patent Dec.24, 1985 Sheet10f7 4,561,062
DETECTOR DIE-‘FRACTION PLANE
X-RAY F SOURCE
/FIG.IA PRIOR ART\S\\
SPECI OIFFRACTION ANE NORMAL
DETECTOR
OF S MEASUREMENT
FIG. IB PRIOR ART

US. Patent Dec. 24,1985 Sheet2of7 4,561,062
g .. \
FIG. 2A PRIOR ART COUNTER DIFFRACTOMETER
FIG. 2B PRIOR ART ‘POSITION SENSITIVE DETECTOR DIFFRACTOMETER
US. Patent Dec.24, 1985 Sheet3 0T7 4,561,062
AI“ 4_x._, FIG. 3A PRIOR ART
28m
FIG. 3B PRIOR ART
28ml I 26m' ‘I I I
FIG. 3C PRIOR ART
<-ZB-w
FIG. 3D PRIOR ART

US. Patent Dec.24, 1985 Sheet40f7 4,561,062
SPECIMEN
SSURFACE
REGION OF INTEREST
AFTERwSCAN OF
Tm(28)
US. Patent Dec. 24, 1985 SheetS of? 4,561,062

US. Patent Dec.24, 1985 v Sheet6of7 4,561,062
CHANNEL
US. Patent Dec. 24, 1985 Sheet7 0f7 4,561,062
NF
DIIDZ)
COMPUTER 231
PROJECTED X‘RAY BEAM
DIFFRACTED X-RAYS DETECTORIS)
ELECTRONIC PULSES DETECTOR ANALYSIS SYSTEM
MPRELIMINARY ARRAY
CONVERT TO DIFFRACTION
ARRAY
I DEFINE VIRTUAL
WINDOW
RESTRICTION OF VALUES TO THOSE WITHIN WINDOW
MOTOR CONTROL
I DISPLACE wmoow
FINISHED?
FIND PRESELECTED
(POSITION OF PEAK) HARACTERISTIC
I CALCULATE STRAIN
F IG. 9
4,561,062 1
STRESS MEASUREMENT BY X-RAY DIF F RACTOMETRY
FIELD OF THE INVENTION
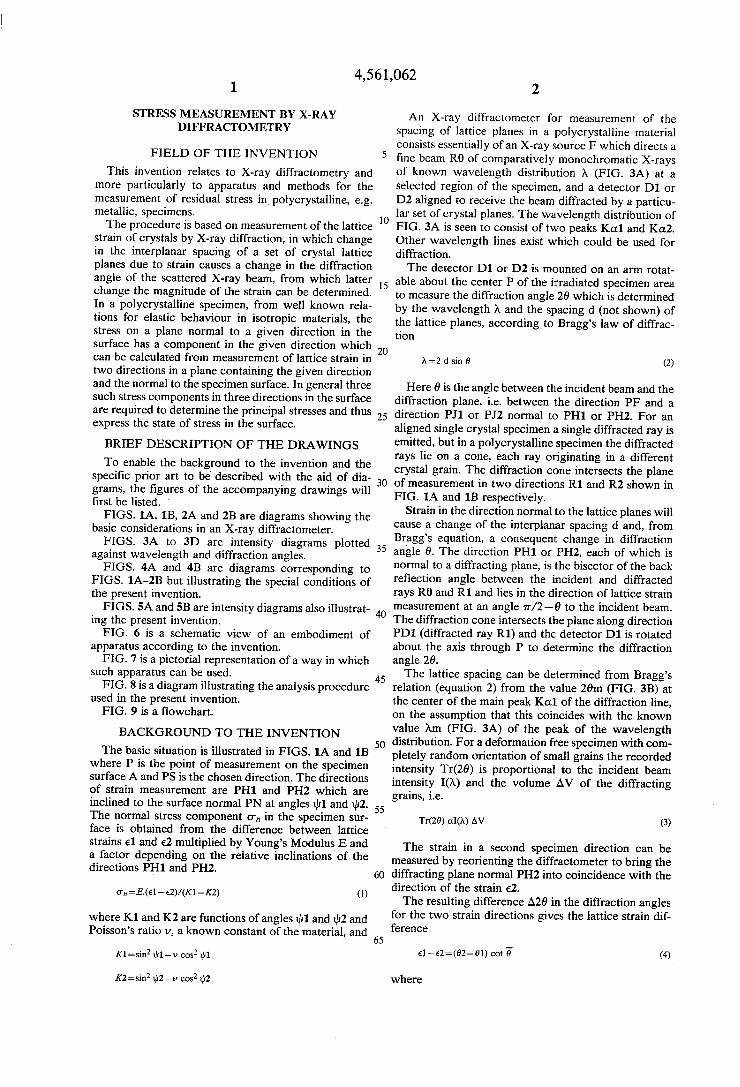
This invention relates to X-ray diffractometry and more particularly to apparatus and methods for the measurement of residual stress in, polycrystalline, e.g. metallic, specimens. The procedure is based on measurement of the lattice
strain of crystals by X-ray diffraction, in which change in the interplanar spacing of a set of crystal lattice planes due to strain causes a change in the diffraction angle of the scattered X-ray beam, from which latter change the magnitude of the strain can be determined. In a polycrystalline specimen, from well known rela tions for elastic behaviour in isotropic materials, the stress on a plane normal to a given direction in the surface has a component in the given direction which can be calculated from measurement of lattice strain in two directions in a plane containing the given direction and the normal to the specimen surface. In general three such stress components in three directions in the surface are required to determine the principal stresses and thus express the state of stress in the surface.
BRIEF DESCRIPTION OF THE DRAWINGS
To enable the background to the invention and the speci?c prior art to be described with the aid of dia grams, the ?gures of the accompanying drawings will ?rst be listed. FIGS. 1A, 1B, 2A and 2B are diagrams showing the
basic considerations in an X-ray diffractometer. FIGS. 3A to 3D are intensity diagrams plotted
against wavelength and diffraction angles. FIGS. 4A and 4B are diagrams corresponding to
FIGS. 1A-2B but illustrating the special conditions of the present invention. FIGS. 5A and 5B are intensity diagrams also illustrat
ing the present invention. FIG. 6 is a schematic view of an embodiment of
apparatus according to the invention. FIG. 7 is a pictorial representation of a way in which
such apparatus can be used. FIG. 8 is a diagram illustrating the analysis procedure
used in the present invention. FIG. 9 is a ?owchart.
BACKGROUND TO THE INVENTION
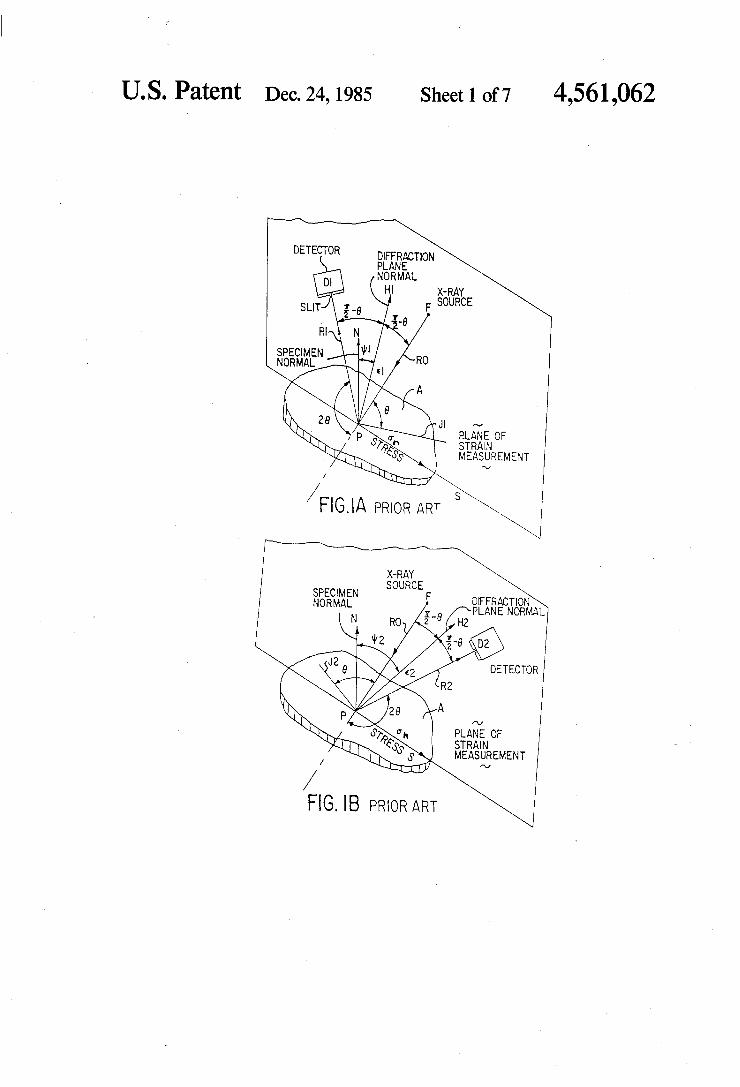
The basic situation is illustrated in FIGS. 1A and 1B where P is the point of measurement on the specimen surface A and PS is the chosen direction. The directions of strain measurement are PHI and PH2 which are inclined to the surface normal PN at angles 1111 and #12. The normal stress component 0-,, in the specimen sur face is obtained from the difference between lattice strains 61 and s2 multiplied by Young’s Modulus E and a factor depending on the relative inclinations of the directions PHl and PH2.
(r,,=E.(el~—e2)/(K1—K2) (1)
where K1 and K2 are functions of angles i111 and i112 and Poisson’s ratio v, a known constant of the material, and
20
25
45
60
65
2
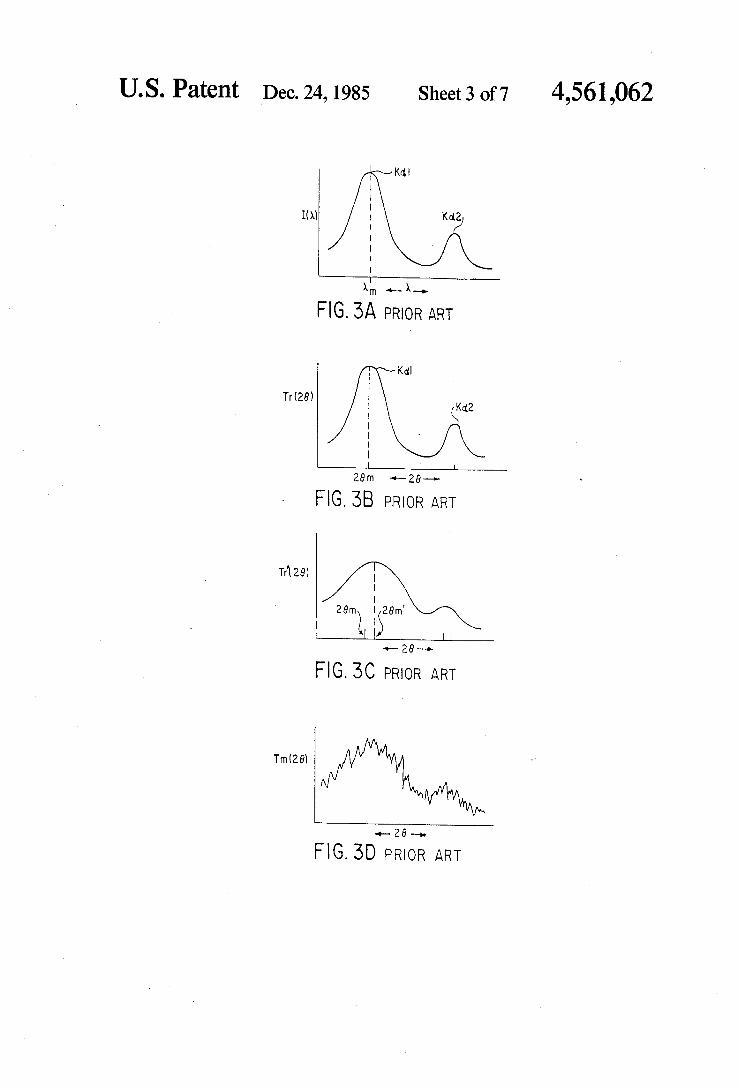
An X-ray diffractometer for measurement of the spacing of lattice planes in a polycrystalline material consists essentially of an X-ray source F which directs a ?ne beam R0 of comparatively monochromatic X-rays of known wavelength distribution A (FIG. 3A) at a selected region of the specimen, and a detector D1 or D2 aligned to receive the beam diffracted by a particu lar set of crystal planes. The wavelength distribution of FIG. 3A is seen to consist of two peaks Kotl and Ka2. Other wavelength lines exist which could be used for diffraction. The detector D1 or D2 is mounted on an arm rotat
able about the center P of the irradiated specimen area to measure the diffraction angle 20 which is determined by the wavelength A and the spacing d (not shown) of the lattice planes, according to Bragg’s law of diffrac tion
}\=2 (1 sin 6 (2)
Here 0 is the angle between the incident beam and the diffraction plane, i.e. between the direction PF and a direction PM or PJ2 normal to P111 or PH2. For an aligned single crystal specimen a single diffracted ray is emitted, but in a polycrystalline specimen the diffracted rays lie on a cone, each ray originating in a different crystal grain. The diffraction cone intersects the plane of measurement in two directions R1 and R2 shown in FIG. 1A and 1B respectively.
Strain in the direction normal to the lattice planes will cause a change of the interplanar spacing d and, from Bragg’s equation, a consequent change in diffraction angle 6. The direction PHI or PH2, each of which is normal to a diffracting plane, is the bisector of the back re?ection angle between the incident and diffracted rays R0 and R1 and lies in the direction of lattice strain measurement at an angle 1r/2—0 to the incident beam. The diffraction cone intersects the plane along direction PD1 (diffracted ray R1) and the: detector D1 is rotated about the axis through P to determine the diffraction angle 20. The lattice spacing can be determined from Bragg’s
relation (equation 2) from the value 20m (FIG. SE) at the center of the main peak Kall of the diffraction line, on the assumption that this coincides with the known value Am (FIG. 3A) of the peak of the wavelength distribution. For a deformation free specimen with com pletely random orientation of small grains the recorded intensity Tr(20) is proportional to the incident beam intensity IO») and the volume AV of the diffracting grains, i.e.
Tr(20) (110.) AV (3)
The strain in a second specimen direction can be measured by reorienting the diffractometer to bring the diffracting plane normal PH2 into coincidence with the direction of the strain 62. The resulting difference A20 in the diffraction angles
for the two strain directions gives the lattice strain dif ference
where

4,561,062
01 + 02 (4) 0: 2
Because this difference in the diffraction angles for the two strain directions is used to determine the stress from equation 1, it is unnecessary to determine 6] and £2 individually, thus avoiding a need for a strain free sam ple of the particular specimen material.
Instead of reorienting the diffractometer or the speci- ' men between strain measurements, an alternative proce dure can be used in which the instrument and specimen remain ?xed for the two strain determinations. Due to the intersection of the diffraction cone with the plane of strain measurement, a second diffracted beam R2 in direction PD2 lies on the opposite side of the incident beam, as shown in FIG. 1B. The diffraction plane nor mal lies along PH2 at an angle A/Z-O to the incident beam R0 and at twice that angle to the direction PHI. If a second detector D2 is suitably located, lattice strain measurements can be made simultaneously in directions PI-Il and PH2. The method in which the diffractometer has to be
reoriented between two separate lattice strain measure ments is known as the double exposure technique (DET) while the simultaneous observation with two detectors is known as the single exposure technique (SET).
In principle a strictly monochromatic X-ray beam and a deformation free specimen under stress would produce a sharp diffraction line having a width of less
; than 1 minute of are, from which the strain could be measured precisely. In practice the characteristic wave length distribution (FIG. 3A) will produce a similar diffracted intensity distribution on a scale of 26 for a deformation free specimen of completely random orien
' tation of small grains, as shown in FIG. 3B. Broadening F~ and distortion of the line can occur from instrumental - factors, principally the source width, and further broad - ening will occur in specimens deformed by cold work ‘or specimens having a grain size below 0.1 micron, both of which effects can produce line widths of several degrees (FIG. 3C). Line broadening will cause a shift in the peak of the diffraction line away from the 20m value corresponding to the wavelength maximum, to the in tensity maximum at 20m’, due to overlapping of the Kal and Ka2 components. This will produce an error in lattice parameter measurement. Where the line pro ?les are the same for both directions in which lattice strain is measured, the angular shift due to broadening will be the same, and, from equation 4, the strain differ ence will be unchanged. Errors due to unequal line distortion can be corrected by pro?le analysis proce dures based on a full diffraction line intensity distribu tion, rather than peak intensity or line center measure ment.
In the counter type of diffractometer the diffraction line intensity is measured by step scanning in increments of 20, by rotating the detector. If the specimen remains ?xed during the scan a progressive change in the dif fraction direction in the specimen will take place. This effect is shown in FIG. 2A. A scan through 1» from 20 to 20’ will change the direction of strain measurement from PHl to PH1’ on the bisector of the new back reflection diffraction angle 7t-20'. The new lattice strain direction PH1’ will have a direction at an angle Ill’ to the specimen normal PN. The change from Ill to til’
15
20
25
45
4 will be equal to the change in the angle A0 of the dif fracting plane to the incident beam direction.
\])'=lll+0J/2 (5A)
where
20': 20 + w (513)
The counter type of diffractometer has now been replaced for many applications by the position sensitive detector diffractometer which employs the recently developed position sensitive X-ray detectors to replace photographic and other methods of detecting X-rays. The nature and performance of position-sensitive
detectors are known, for example, from Borkowski et al. US. Pat. Nos. 3,483,377 of Dec. 9, 1969, Ruud, 4,042,825 issued Aug. 16, 1977 and Sparks et al 4,076,981 issued Feb. 28, 1978. Such detectors collect the full X-ray diffraction line simultaneously and in crease the speed of operation by a factor of at least ?fty times compared with some earlier diffractometers. A situation similar to that described above in the
counter type of diffractometer exists in a diffractometer using a position sensitive detector. A schematic draw ing is shown in FIG. 2B. The position sensitive detector D1 is set with its center at Xo which corresponds to where the aperture in the counter type detector was positioned, with the sensitive area normal to the axis PXo. The output of the detector is fed to a computer where it is separated into a number (say 500) of channels i.e. typically 0.010 per channel. The position X’ of each diffracted X-ray is sensed by the instrument and the number of photons received within each channel of width AX is summed during a ?xed time interval. The X-ray diffraction pattern over the sensitive length of the detector is recorded simultaneously to build a complete diffraction line. The intensity values over the diffraction line are expressed by the computer in the form of a histogram, i.e. a series of numerical values each corre sponding to the number of pulses received by a given channel. In a typical example, a smaller group, (say 250) of these channels, is selected to cover the extent of the diffraction line. The intensity recorded at the position X’ at an angle
a to the reference position X0 is due to diffraction at an angle 20'. The tilt angle ill’ of the new lattice strain direction PHI’ to the normal PN will be displaced by a/2 from the direction PHI, and
In both the counter and position sensitive detector instruments the strain direction PH1’ in the specimen changes with diffraction angle 20'. If the volume AV of the diffracting grains varies irregularly with specimen direction PH1’, the measured intensity Tm(20) (FIG. 3D) will be different from the intensity Tr'(26) (FIG. 3C) for a specimen having a completely random orien tation of small grains, and if w(H) is the ratio of these diffracting volumes
4,561,062 5
The effect of irregular grain distribution on the dif fraction line is shown in FIG. 3D. This effect can be avoided in the counter diffractometer if the specimen direction PHl is held constant by mechanical rotation of the specimen through one half the scan angle to (equation 5A). This is a feature of laboratory stress diffractometers, used with small portable specimens which can be mounted on the instrument.
In the position sensitive detector diffractometer, the continuous change in strain direction, with the resultant changes in grain orientation, also produce variations in the diffraction line intensity distribution, as shown in FIG. 3D.
Variations due to irregular grain distribution occur most frequently in measurement of stress gradients where the beam width is narrow, reducing the number of diffracting grains, and in specimens having a large grain size. An additional factor which can introduce error in
strain measurement is defocusing of the diffraction line due to incident beam divergence, especially when the length of the irradiated area of the specimen in the stress direction is large. Where the diffracting power of the specimen varies over this length, defocusing will pro duce an asymmetric distribution which, because it acts at each point over the diffraction line, will cause a dis placement of the resultant line, and a corresponding error in strain measurement.
Diffractometer misalignment is another factor lead ing to error in stress measurement. The principal align ment error is that due to displacement of the rotation center of the instrument from the point P on the speci men surface. This produces a displacement of the dif fraction line of a similar magnitude. In the single expo sure technique this error is compensated by equal dis placements in 20 of the two diffraction lines. This is not the case in the double exposure method where a residual error occurs, dependent on the tilt values used.
In summary, a well designed stress diffractometer should produce a smooth diffraction line having the intensity distribution of a completely random specimen even in cases where the grain size is large or where a small diffracting volume must be used; focusing of the detectors must be provided; and the alignment error should be controlled. Analysis of the line position should be based on the full intensity distribution of the diffraction line. The scanning diffractometer, using a proportional
counter, or a scintillation counter to measure diffracted intensity at a series of diffraction angles in order to produce a diffraction line intensity distribution, has been the standard laboratory instrument for powder diffraction for many years. The instrument has been adapted for stress measurement by using specimens tilted to vary the lattice strain direction, and which are rotated by the scanning mechanism. Fixed specimens can be examined by the equi-inclination method in which both tube and detector are scanned through equal angles but in opposite senses, to keep the diffrac tion direction constant in the specimen.
Indeed, most of the forms of apparatus developed in the past have been essentially laboratory instruments, that is to say they are not portable and perform best under controlled laboratory conditions. As such, these instruments are unsuitable for work in the ?eld, e.g. for the inspection of large structures, such as bridges, pipe lines etc. To determine stresses in structures in the ?eld, there is a need for a reliable and accurate portable dif
20
25
30
40
45
55
60
65
6 fractometer, and some workers in the art have already begun to develop such devices. Examples of such devel opment will be referred to more fully below.
Portable instruments for ?xed specimens have been designed which do not use equi-inclined geometry, and consequently are subject to irregularity in intensity distribution due to variation in the orientation factor with specimen direction.
Speci?c Prior Art Instruments
Various patents have issued in this ?eld, for example:
Bertram U.S. Pat. No. 2,184,174 December 19, 1939 Firth U.S. Pat. No. 2,462,374 February 22, 1949 Khol U.S. Pat. No. 2,898,470 August 4, 1959 Khol US. Pat. No. 3,030,507 April 17, 1962 Weinman U.S. Pat. No. 3,402,291 September 17, 1968 Sekita US. Pat. No. 3,634,686 January 11, 1972 Shimura U.S. Pat. No. 3,639,758 February 1, 1972 Mizunuma U.S. Pat. No. 3,639,760 February 1, 1972 Ogiso U.S. Pat. No. 3,868,506 February 25, 1975 Bens U.S. Pat. No. 3,934,138 January 20, 1976 Cohen et al U.S. Pat. No. 4,095,103 June 13, 1978 Erwin U.S. Pat. No. 4,125,771 November 14, 1978 Nagao et a1 U.S. Pat. No. 4,128,762 December 5, 1978 Kramer et al U.S. Pat. No. 4,287,416 September 1, 1981
One instrument that provides for constant specimen strain direction during measurement is that of Sekita. The instrument uses a ?xed X-ray tube and a scanning detector driven along a circular are centered on the specimen in order to scan the diffraction line. As shown in Sekita’s FIG. 7 the diffractometer is mounted on an arm connected to an axle, the axis of which passes through the detector rotation axis at the specimen sur face. This enables the whole diffractometer to be ro tated to give a desired direction of lattice strain mea surement in the specimen. Sekita uses a combined scan, in which the detector rotates through an angle a) re1a~ tive to the X~ray source and the arm counter rotates the source and the detector together through —-w/2. This gives equal and opposite relative rotations of source and detector, providing equi-inclination geometry. The two rates of rotations must be coordinated.
In the form shown, the axle extends below the surface plane of the specimen, so that the instrument can only be used with ?xed specimens in limited situations that permit the arm rotation axis to meet the specimen sur face. Of the other prior patents listed above, of particular
interest are the instrument using a proportional counter position sensitive detector disclosed by Cohen et a1., and the two detector instrument shown by Bens. These are portable instruments which have the detector, or detectors, ?xed relative to the X-ray source. The Bens instrument uses two proportional counter
position sensitive detectors mounted integrally with the X-ray source, as shown in his FIG. 3. The assembly is arranged so that the beam from the X-ray source is incident on a specimen at 0, the detectors being aligned with their X-ray sensitive surfaces tangent to the re spective diffracted X-ray beams. The assembly is mounted pivotally about an axis through 0 normal to the diffraction plane so that the: angle 111 between the specimen diffraction direction and the specimen surface normal N can be set to a desired value. The two diffrac tion patterns are recorded simultaneously by the single exposure method.
4,561,062 7
In this instrument the source and the detectors are rigidly assembled together and there is no possibility of rotating the X-ray tube about the axis 0 relative to the detectors. The Cohen et al instrument uses a single proportional
counter position sensitive detector mounted integrally with the X-ray tube, as shown in their FIG. 3. The detector 11 is aligned with the center of its sensitive surface normal to the diffracted X-ray beam. The tube 10 and detector 11 form an assembly that is mounted to move in an are centered on the specimen surface, so that the angle of the measured specimen strain direction to the specimen normal can be changed. Stress is measured by two or more determinations of lattice strain, i.e. using the double exposure method.’ The’ rigid tube and detector mounting precludes rotation of the X-ray tube relative to the detector.
In both these instruments, the observed diffraction lines will be subject to intensity ?uctuations from irreg ularities in the grain orientation factor over the diffrac tion line, as explained above in relation to equation 7. No provision for change of focus with specimen tilt
has been made in the Cohen et al instrument. In the Bens instrument, as shown in FIG. 3, the detector radii are equal to each other while being less than the source radius in order to minimise the defocusing effect. In a specimen of irregular grain orientation, defocusing has been shown to produce a virtual strain displacement,
- which will be present in both these instruments. Herbert E. Gobel in a paper entitled “A new method
for fast XRPD using a position sensitive detector.” published in Advances in X-ray Analysis, Volume 22, pages 255-265, 1979, has proposed an instrument that employs scanning with a position sensitive detector in a standard diffractometer having a rotatable specimen to obtain high speed powder diffraction patterns. The diffraction line at each scan step is collected by mi
- crocomputer. Step scanning with this arrangement ena bles the intensities at each step to be summed according to diffraction angle. Specimen rotation keeps the range of strain directions constant with detector position, and the resultant line has a constant range of grain orienta tions for all diffraction angles, giving a smooth resultant diffraction line with intensity proportional to Tr’(20) in equation 7 above.
SUMMARY OF THE INVENTION
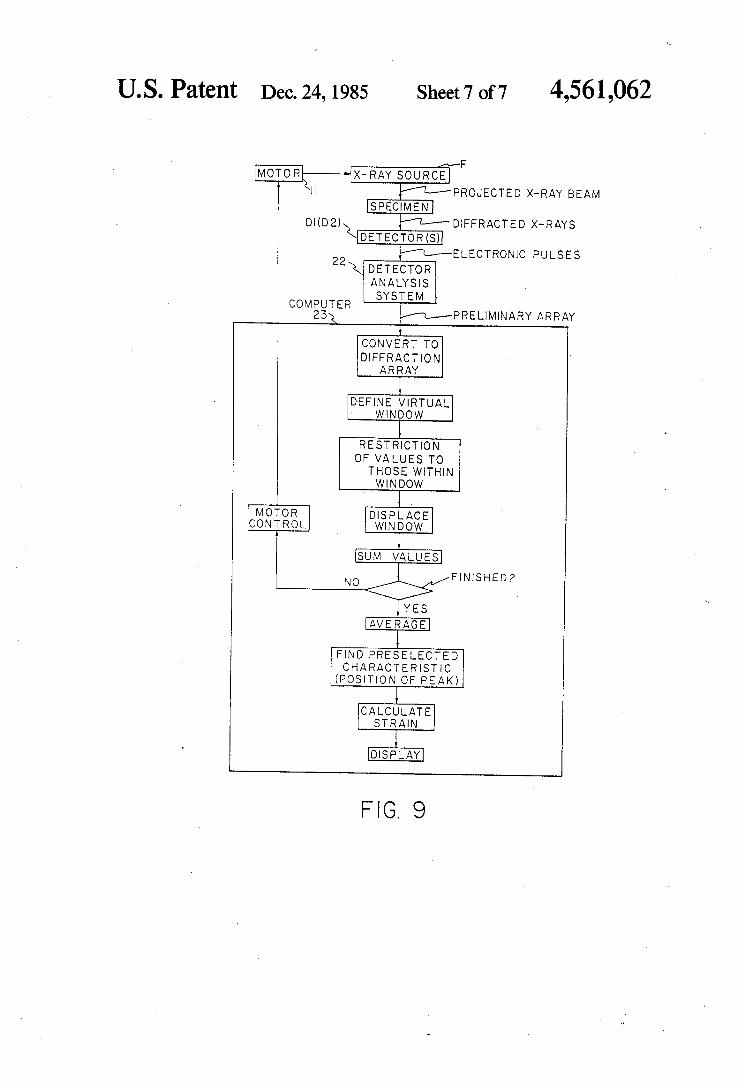
The present invention relates to apparatus and meth ods in which an X-ray beam is projected onto the sur face area of a polycrystalline specimen in which stress is to be measured, and X-rays diffracted by a set of crystal lattice planes in said area are received in a position sensitive detector, or preferably in two such detectors for operation in the single exposure mode. The X-rays received in each detector are ultimately converted into a diffraction array of intensity values as a function of diffraction angle. In the speci?c example given below, this conversion is carried out in two steps. Firstly, in the detector the received X-rays are converted into a pre liminary array of intensity values as a function of chan nel position. This preliminary array is then transformed in the computer into the diffraction array in which the intensity values are stored as a function of diffraction angle. The projected beam is step scanned angularly about the specimen area to generate a sequence of such diffraction arrays. The intensity values of said diffrac tion arrays are then averaged for each of a series of diffraction angles (29). The resulting average values
.. 5.
O
I
20
25
35
40
45
65
8 constitute a histogram from which a computer can cal culate the 20 value of a preselected characteristic in the diffraction line, such as the Kal peak. The two values so obtained (either from separate detectors used simul taneously or from one detector used in the double expo sure technique) can be used to determine a strain differ ence, from which the stress can be calculated. The characterising feature of the present invention
resides in the fact that the intensity values so averaged are restricted to those that measure strain in a selected range of directions about a chosen mean strain direction in the specimen by restricting the intensity values aver aged to those lying within a virtual window in the de tector that is such that the centre of width of the win dow is coincident with the diffracted beam received from lattice planes in the specimen normal to the chosen mean strain direction and the angular width of the win dow is equal to twice the selected range. To achieve this effect the window is displaced relative to the diffraction array for each successive scanning position. The effect is to obtain a resultant diffraction line intensity distribu tion that is substantially equivalent to that of a specimen having a completely random orientation of small grains. An important feature of the invention is that it per
mits operation with a ?xed specimen and hence adap tion as a portable instrument for use in the ?eld with large specimens. It achieves the advantages of an instru ment having equi-inclination geometry without the severe practical complications of the need to scan the source and detector accurately by equal amounts in opposite directions (or to rotate the specimen). This effect is achieved by the window displacement which amounts to a virtual scanning of the detector. The effect of using a ?xed specimen and scanning the
source is illustrated in FIGS. 4A and 4B. The said chosen mean strain direction I-Ir lies at an angle illr to the specimen normal PN. In the measurement of lattice strain in the present method, the selected range of lat tice strains about the mean strain direction is chosen to extend from I-I-l-m to H-m (FIG. 4A) equidistant about the mean strain direction I-Ir at angles +'ym and —'ym. The angle 'ys between Hr and a direction Hs at an angle tbs to the specimen normal PN is
and for Hs within the range of lattice strain directions
lvslé lvml (8B)
The diffraction line values derived in the analytical procedure described below are limited to contributions from this range of directions, known as the “region of interest” and de?ned by the virtual window, the width of this window therefore being 4'ym. At the scan start, referred to as scan 0 and shown in
FIG. 5A, the X-ray beam from source F is diffracted from planes parallel to the plane PBr having normals along Hr at lllr to the specimen normal PN and is re ceived by the detector D at Xo having been diffracted through the angle 200 (FIG. 4B).
Following a scan of the source through an angle to to F’, diffraction by planes parallel to the plane PB having the diffraction normal H at an angle 'y to Hr are re ceived in the detector at X at an angle a to Xo. For the detector position X the diffraction angle 20 is
given by the equation

4,561,062 9
20=200—m+a (9A)
The diffraction direction H at an angle 3/ to Hr gives the equation
20=200—2w+2'y (93)
From these equations the displacement 'y can be ex pressed as
'y=(w+a)/2 (9c)
A scan through an angle —w produces the situation shown in FIG. 5B. The de?ned specimen direction Hr for which 'y=0 will have the detector position Xr at an angle +0) to Xo, where
20r=200+2w (9D)
The region of interest extends in the detector from X—-m to X+m, which correspond to the angles —2'ym and +2'ym.
In step scanning, the scan step Aw can be chosen as a multiple of the angular channel width Ad in order to give 20 displacements of an integral number of chan nels. When the value of 26 is held constant, a scan through each step of Am moves the detector position of 20 from X to X’ through the angle Am. At the same time the centre of the region of interest in the detector moves from Xr to Xr' through an angle —Aw so that the relative motion of a given 20 value across the region of interest is 2A1». For a given 29 value, the intensities are included
when the diffraction direction I-I lies within the region of interest and the average intensity over this region, Ts(20) is calculated. This will be related to the value Tr’(20) for a specimen with completely random orienta tion of small grains, as given in equation 7. For n values that fall within the window the average intensity Ts(20) 1s
Ts(20)= WTI/(20) (10A)
where
1 H m (10B) W = -n- Hlém w(Hs)
and where Hs is the direction of H for the 20 value under consideration. For a sequence of 20 values taken at equal intervals
2A0), the same set of specimen directions will be in volved at each value of 20, and W will be a constant over the diffraction line. When the step Aw is greater than the channel width Act, then 20 values within a single step will be generated by different sets of speci men directions, rotated by increments A'y=Aa/2 and each belongs to a separate 20 sequence having intervals 2Aw. Where Am is small the rotation can be expected to leave the W summation substantially unchanged.
DETAILED DESCRIPTION OF THE PREFERRED EMBODIMENT
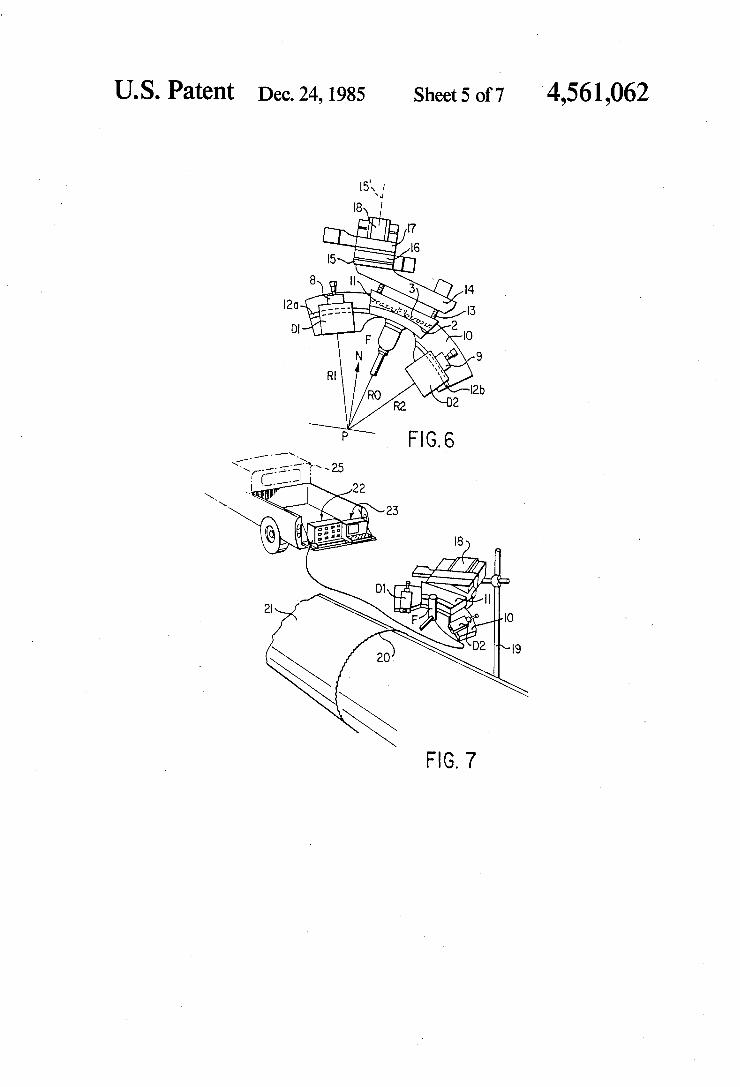
An embodiment of the invention is shown schemati cally in FIG. 6. A miniature X-ray tube F is mounted on a curved slide 2 and is driven in an are about the center P. The tube is driven by a conventional screw and split nut arrangement 3 connected to a Slosyn stepping motor through bevel gears (not shown). The X-ray tube
10
20
25
45
50
65
10 mount and drive assembly 11 is ?xed to a frame 10. Two proportional counter position sensitive detectors D1 and D2 are mounted on micrometer driven slides 8 and 9 at either end of the frame 10 for adjustment along the radial direction. For adjustment in the circumferential direction, the detectors are mounted on arcuate tracks 12a and 12b centered at P, so that the interdetector angle, i.e. between radii R1 and R2, can be set to the required value for the single exposure method, i.e. 211-40m. The assembly 11 carries four screw threaded posts 13
that enter a drive mechanism 14, whereby the instru ment can be translated along the axis PF of the X-ray tube in order to set the rotation axis P on the specimen surface. The mechanism 14 is in turn attached to the rotatable disc 15 of a rotation mount 16 so that the instrument can be rotated about the normal to the speci» men surface to align the plane of the instrument in the direction in which stress is to be measured. The axis 15' of the rotation mount is set coincident with the normal PN to the specimen surface. Two translation drives 17 and 18 carry the rotation mount 16, so that the instru ment can be traversed in X and Y directions parallel to the specimen surface. The drive 18 is attached to a suitable mount, for example a support structure 19 as shown in FIG. 7. This ?gure also shows how the X-ray tube F can be directed at a section of a weld 20 in a pipeline 21. A detector analysis system 22, a computer 23 and a power source (not shown) can conveniently be mounted on a nearby vehicle .25. The computer will preferably include disc storage and a printer for furnish ing a permanent data record of all aspects of the stress measurement. A video terminal is part of the computer for control and output of stress measurements in real time together with graphs of the resultant diffraction lines.
In operation in the single exposure mode the detec tors D1 and D2 are set to measure lattice strain in the specimen in two directions inclined to each other at an angle of 1r-—20m, the ?rst of these directions usually being chosen along the specimen surface normal. Each detector radius Rdl and Rd2 is set to the required focal distance which, for a source radius Rf, is determined from the equation
As above indicated, the scanning takes the form of stepwise rotational movement of the X-ray source F about the irradiated area on the specimen, the size of each such scanning step being Aw=nAa. Since the diffracted beam from an individual grain in the speci men thus advances by 2n channels for each scanning step, each grain passes through a series of scanning steps encompassing the range of 26 values. The averaging procedure is carried out in the com
puter in a manner that is illustrated pictorially in FIG. 8 and as a ?owchart in FIG. 9. This ?gure necessarily shows only some of the detector channels involved (arbitrarily chosen as those designated 91-107). In prac tice, each detector may have about 500 channels. Of these about 250 will cover the entire diffraction line, and the X-ray source F will be arranged to scan about the same number of steps e.g. 250. However, the region of interest shown in FIGS. 5A and 5B, which can con

4,561,062 11
veniently be referred to in the analytical procedure as a virtual window, will be a substantially smaller group, e.g. 100 channels wide. This virtual window is shown in FIG. 8 by the rectangle G, which for convenience of illustration is here shown having a width Wg of only 13 channels. At scan 0 the window begins at channel 94 and ends at channel 106, being centred on channel 100. Within this window G, there are shown some arbitrary individual intensity values recorded for each channel in the detector, which values will have been transferred to the computer memory for each scan position. At each scanning step the window G is moved n channels (as sumed in FIG. 8 to be one channel) in one direction, e. g. to the left when the scan is positive, so that at scan +1 it extends from channel 93 to 105, no longer including channel 106. At a given scan position, each channel corresponds to
5
10
15
12 movement of the intensity value for a given 20 corre sponds to two channels. For each scan the computer examines the intensity
value for each channel in each detector and computes the diffraction angle 20 from equation 9A and the dis placement )’ from equation 9C. From this 7 value the computer determines from
equation 8B whether the intensity value is within the window G. If it is not, the value is disregarded. Those intensity values that are found to lie within the window G are then averaged for each 20 value. The computer will generate such average values
separately for each detector. For each detector these results constitute a resultant
histogram of average intensity values plotted against 20 values from which the computer can calculate the 20 value of the Kal peak or any other preselected charac
a given 20 value, and, with each scan Step, this 29 value, . teristic of this resultant histogram in accordance with moves to an adjacent channel, e.g. to a higher chanyfel number for positive scan steps and to a lower channel number for negative scan steps. This movementis in the opposite direction to that of the window/G. Hence, for each scan step, a given 20 value moves along the win dow G, moving at a relative rate of two channels per step in this example. The intensity values recorded for a given 26 value in successive scan steps are summed only if they fall within the window G. This sum is then di
- vided by the number of values summed to give an aver age intensity value for the given 20 value. To illustrate this point, one set of 20 values Q1 that is
so averaged is shown with each intensity value sur rounded by a double circle. There are 7 such intensity values Q1, and the average so obtained corresponds to position 200. It will be noted that the values Q1’ shown in single circles are not included, since, although they have the same 20 value and thus lie on the diagonal line extending through the values Q1, they are beyond the ends of the window G.
Simultaneously the computer will determine the av erage of the intensity values Q2 (shown in double in
' verted triangles) of which there are also 7 to generate another average value that corresponds to 20o+2Aa.
Similarly the erect triangles Q3 signify another set of seven intensity values for 200-2Aa. The summation for the intermediate values of 20o+Aa and 26o~Aa are not shown but exist and will be similarly averaged. In this case there are only six such intensity values for each 20 value within the window G. The preliminary array referred to above is hence a
sequence of intensity values shown against channel position (channel number) for a given scan position, i.e. a horizontal row in FIG. 8. With each step the window G moves by a ?rst increment (one channel in the exam ple) relative to a reference channel, e. g. the channel 100. The corresponding diffraction array is the same se
quence of intensity values also extending as a horizontal row in FIG. 8, but as a function of diffraction angle. With each scan step, the reference diffraction angle value, e.g. that represented by the values Q1, and lying along a diagonal in FIG. 8 from top left to bottom right, moves relative to the reference channel in the opposite direction from that of the window, so that the window has a displacement relative to the reference diffraction angle value by a second increment which in the example is twice the ?rst increment.
It will be apparent that, measured from the centre Q (shown by squares) of the window G, each successive
20
30
35
45
50
55
60
65
nown analytical procedures. See the paper entitled ‘\Location of Diffractometer Pro?les in X-ray Stress Analysis," D. Kirk et al, published at page 283 of “Ad vances in X-ray Analysis” Vol. 20, Plenum Press, 1977. From these characteristic values (010 and 020), the
strain difference 61 ~62 can be obtained from equation 4 by solving the expression
(12) cl - c2 = (020 - 0lc)cot
Once the value of e1—e2 is known, the value of the surface stress component 0-,, (the desired result) follows from equation 1. The choice of parameters for the scan affects the
accuracy and speed of stress measurement. The width of the region scanned in the position sensi
tive detector, called the scan width Ws, is preferably chosen as the sum of the diffraction line width and the maximum expected strain displacement. The diffraction line width is a function of the wavelength distribution, the instrumental broadening distribution and the lattice deformation distribution. Where these are assumed to be approximately Gaussian, the resultant diffraction line width Wr can be determined from the relation
Wr=(Wa2+ Wi2+ W12)? (13)
where Wa is the width at half maximum intensity of the wave
length distribution, Wi is the width of the instrumental broadening distribu
tion, and Wd is the width of the lattice deformation distribution.
In the case of the Ka doublet, the two component distributions Wal and W012 will be separated by the peak displacement W12 of the components. The total scan width Ws for the doublet is then
Ws= Wr+ Wl2+ Wx (14)
where Wx is the maximum strain displacement. Where the Ka doublet is resolved and only a single
component Kal is used, Ws= Wr+ Wx Where another characteristic is chosen, such as the
line centroid, the scan width Ws must include the full Ka doublet. The window width Wg determines both the degree
of resolution of the lattice strain in the chosen direction
4,561,062 13 14
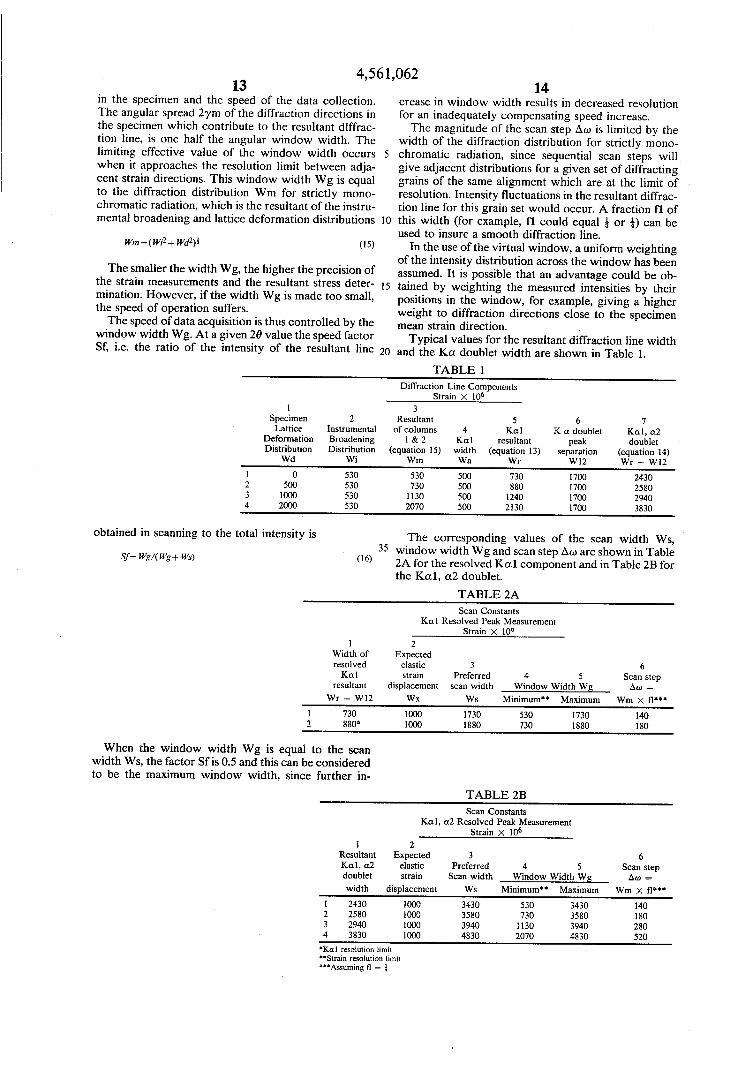
in the specimen and the speed of the data collection. crease in window width results in decreased resolution The angular spread Z'ym of the diffraction directions in for an inadequately compensating speed increase. the specimen which contribute to the resultant dlffrac- The magnitude of the scan step Aw is limited by the tion line, is one half the angular window width. The width of the diffraction distribution for strictly mono limiting effective value of the window width occurs 5 chromatic radiation, since sequential scan steps will when it approaches the resolution limit between adja- give adjacent distributions for a given set of diffracting cent strain directions. This window width Wg is equal grains of the same alignment which are at the limit of to the diffraction distribution Wm for strictly mono- resolution. Intensity fluctuations in the resultant diffrac chromatic radiation, which is the resultant of the instru- tion line for this grain set would occur. A fraction f1 of mental broadening and lattice deformation distributions 0 this width (for example, f1 could equal % or %) can be
used to insure a smooth diffraction line. W"I=( W"2+ Wdzli ('5) In the use of the virtual window, a uniform weighting
of the intensity distribution across the window has been The Smaller the Width Wg, the higher the Precision of assumed. It is possible that an advantage could be ob
the strain measurements and the resultant stress deter- 5 mined by weighting the measured intensities by their mination. However, if the width Wg is made too small, positions in the window, for example, giving a higher the Speed of operahoh ShffefS- _ weight to diffraction directions close to the specimen The speed of data acqu1s1t1on 1s thus controlled by the mean strain direction _
wmflow wldlh'wg All a Elven _29 Value the Speed facior Typical values for the resultant diffraction line width Sf, 1.e. the ratlo of the intensity of the resultant lme 20 and the Ka doublet width are Shown in Table 1_
TABLE 1 Diffraction Line Components
Strain >< 106 l 3
Specimen 2 Resultant 5 6 7 Lattice Instrumental of columns 4 Kal K a doublet Kal, a2
Deformation Broadening l & 2 Kal resultant peak doublet Distribution Distribution (equation 15) width (equation 13) separation (equation 14)
Wd Wi Wm Wa Wr W12 Wr + W12
1 0 530 530 500 730 1700 2430 2 500 530 730 500 880 1700 2580 3 1000 530 1130 500 1240 1700 2940 4 2000 530 2070 500 2130 1700 3830
obtained in Scanning to the total intensity is The corresponding values of the scan width Ws, 35 window width Wg and scan step Aw are shown in Table
Sf: Wg/(Wg+ W3) (16) 2A for the resolved Kotl component and in Table 2B for the Kal, a2 doublet.
TABLE 2A Scan Constants
Kal Resolved Peak Measurement. Strain X 106
l 2 Width of Expected resolved elastic 3 6 Kal strain Preferred 4 5 Scan step
resultant displacement scan width Window Width Wg Aw =
Wr + W12 Wx Ws Minimum“ Maximum Wm >< ?‘"
1 730 1000 1730 530 1730 M0 2 880* 1000 1880 730 1880 180
When the window width Wg is equal to the scan width Ws, the factor Sf is 0.5 and this can be considered to be the maximum window width, since further in
TABLE 2B Scan Constants
Kal, :12 Resolved Peak Measurement Strain X 106
l 2 Resultant Expected 3 6 Kal, a2 elastic Preferred 4 5 Scan step doublet strain Scan width Window Width Wg Am =
width displacement Ws Minimum" Maximum Wm X 0""
l 2430 1000 3430 530 3430 140 2 2580 1000 3580 730 3580 180 3 2940 1000 3940 1130 3940 280 4 3830 1000 4830 2070 4830 520
‘Kal resolution limit "Strain resolution limit "'Assuming fl = i
4,561,062 15
The above values which are in units related to strain can be converted to angles A20 ‘corresponding to the angular width in the detector, or to a number of chan nels Nc (rounded out to an integer), as follows:
A20 = 2etan0 (17A)
Nc=A20XCd (17B)
where e is the strain value in the above tables Cd is a constant representing the number of channels
per degree, and 0 is the diffraction angle for the chosen re?ection. Fora ferritic iron specimen with chromium Ka radia
tion the value of 0 is approximately 78°. Putting this value into equation l7A, for the minimum and maxi mum values of Wg, i.e. e=530><10~6 and 4830>< 1010—6 gives values for A20 of 029° and 260°. In equation 17B, where Cd is assumed to be 100, the corre sponding values for Nc are 29 and 260. An austenitic steel specimen with chromium KB 1,3
radiation has an approximate value for 0=74.2°. The KB line width is 882><lO-6. Putting these values in equation 17A for the minimum and maximum values of the window width Wg, e=530>< 10*6 and 2462>< l0—6 gives values for A20 of 0.22° and 0.997". The corre sponding values of No where Cd is assumed to be 100 in equation 17B are 22 and 100 channels. The reduced width of the maximum window value in this example is due to the smaller width of the chromium KBI,3 dou blet compared with the chromium Ka doublet.
Alternative Procedure
The present arrangement in which the X-ray source is scanned and two detectors are used permits an alter native form of stress measurement in which the angle between the detectors can be increased from the value
.'21r~40m used in the single exposure technique de scribed so far to a larger operating value. For this pur pose the diffraction lines are measured sequentially in the respective detectors. The result is a technique that has the bene?t of the double exposure technique, i.e. an increased angle between the two detector positions, without the disadvantage of the double exposure tech nique, namely the need for the whole instrument to be reoriented between the two strain measurements. This alternative procedure can thus increase the accuracy of stress determination in cases where the back re?ection angle 7r—20m of the chosen reflection is small and the strain directions in the specimen are consequently close together. Increasing the interdetector angle increases the factor Kl-K2 in equation 1 and increases the magni tude of the measured strain difference, giving a lower resultant error in the surface stress component 0-".
Calibration
The detectors can be calibrated with a standard speci men of known lattice spacing, to give the 20 value for each channel by means of the source scan. Such a stan dard specimen should be strain free and can be any material that has a well known lattice spacing and gives a diffraction line in the required region. Generally this material is chosen to be made of the basic element in the stressed specimen under examination, providing it has the same crystal structure as the stressed material. For example, if the stressed specimen is ferritic steel, the standard specimen can be iron. The lattice spacing of
15
25
35
45
50
55
60
65
16 the standard specimen does not have to be the same as that of a strain free sample of the stressed material. The standard specimen gives the diffraction angle
20m for the peak channel, using the known standard lattice spacing d and the wavelength peak value Am in Bragg’s relation, equation 2. This is suf?cient to deter mine the 20 value of one channel. Initially, the detector output has been sorted in channels by the multichannel analyser or computer, the angular displacement be tween detector channels being unknown. The scanning X-ray tube can be used with the standard specimen to determine the mean channel width by scanning the X-ray tube through a known angle and measuring the peak channel of the standard specimen a second time. Knowledge of the value of 20 for the reference channel" '7 V 7 and the mean channel width enables the 20 value of each channel to be determined.
Alternative Construction
In the embodiment of the invention shown in FIG. 6, the source F is scanned relative to the specimen, while the detector or detectors are ?xed relative to the source. While scanning of the source is essential to the inven tion, the ?xing of the detectors is not. There is thus an alternative construction available in which the detec tors are ?xed to the source and the whole assembly is scanned relative to the specimen.
In this case, since the position sensitive detector (or detectors) is an open counter, rotation of each detector will shift the pattern due to the source scan through an angle —m in the detector. The detector equation 9A then becomes
20=20o+a (18A)
The equation 9B for the relation of the specimen diffraction direction to the diffraction angle is un changed. Combining equation 9B and 18A gives
'y=a/2+a> (18B)
The reference diffraction angle 20o remains at Xo for all rotation angles. The position Xr for strain direction Hr in the detector is at an angle -2a> to Xo. The dis placement Xr is therefore twice that for the ?rst exam ple with a ?xed detector, and the effective detector range is one half that for the ?rst example. The detector position X for any given 20 value re
mains ?xed during the scan, while the diffraction direc tion changes. Oscillation of the assembly through a range of a) values will result in an automatic summation of intensities for each 20 value. The resultant diffraction line will have an increased specimen diffracting volume, but the range of specimen directions will be different for each 20 value. Scanning to obtain diffraction by a lim ited range of directions equidistant about Hr can be carried out in a similar analysis to that used for the ?rst example. Looking at this result pictorially in relation to FIG. 8,
the effect will be that the intensity values for a given 20 value will lie along a vertical line, i.e. will remain in the same channel throughout. The window G will move to the left at twice the rate of that in FIG. 8, i.e. two chan nels per scan and the second increment of window movement relative to the reference diffraction angle value will be equal to the ?rst increment of movement relative to the reference channel position.
I claim:

4,561,062 17
1. In a method of obtaining a diffraction line intensity distribution in a surface area of a polycrystalline speci men by X-ray diffraction including
(a) projecting an X-ray beam onto said area, (b) receiving in a position sensitive detector X-rays
diffracted by crystal lattice planes in said area, (c) converting the X-rays received in said detector
into a diffraction array of intensity values as a func tion of diffraction angle,
(d) step scanning the projected beam angularly about said area to generate a sequence of said arrays, said step scanning being such that the angle between said X-ray beam and a normal to said area changes with each step relative to the angle between the centre of width of the detector and said normal, and
(e) averaging the intensity values of said arrays for each of a series of said diffraction angles;
the improvement comprising (f) restricting the intensity values so averaged to
those obtained from a virtual window in the detec tor that is such that the centre of width of the win dow is coincident with the diffracted beam re ceived from a set of said lattice planes normal to a chosen direction, and
(g) displacing said virtual window relative to said diffraction array for each successive scanning posi tion to obtain a resultant diffraction line intensity distribution.
2. The method of claim 1, including determining from said resultant diffraction line intensity distribution de~ rived in step (g) the diffraction angle corresponding to the location of a preselected characteristic of said resul tant diffraction line intensity distribution as a measure of a ?rst strain lying in said chosen direction.
3. The method of claim 2, wherein said conversion step (0) comprises
(h) ?rst converting the X-rays received in the detec tor into a preliminary array of intensity values as a function of channel position in the detector, and
(i) then converting said preliminary array into said diffraction array.
4. The method of claim 3, wherein said window is displaced for each successive scanning position by a ?rst increment relative to a reference channel position and by a second increment relative to a reference dif fraction angle value in the diffraction array.
5. The method of claim 4, including (i) maintaining said detector ?xed relative to the spec
imen, and (k) setting said second increment equal to twice said
?rst increment. 6. The method of claim 4, including (j) maintaining said detector ?xed relative to said
projected X-ray beam, and (k) setting said ?rst and second increments equal to
each other. 7. The method of claim 1 or 2, wherein said projected
beam is scanned through a width at least equal to the sum of the width of the diffraction line intensity distri bution and the width of an expected maximum displace ment of the diffraction line.
8. The method of claim 7, wherein the width of the window lies in a range extending from an upper value approximately equal to the width through which said projected beam is scanned to a lower value approxi mately equal to the combined width of instrumental broadening and lattice deformation distributions.
25
30
35
45
50
55
65
18 9. The method of claim 2, including (h) simultaneously with said receiving step (b), re
ceiving in a second position sensitive detector lo cated on the opposite side of the projected beam from the ?rst detector, X-rays diffracted by a sec ond set of crystal lattice planes in said area normal to a second chosen direction,
(i) converting the X-rays received in said second detector into a second diffraction array of intensity values as a function of diffraction angle, said step scanning of the projected beam generating a sec ond sequence of said second diffraction arrays,
(j) averaging the intensity values of said second dif fraction array for each of a series of said diffraction angles, while restricting the intensity values so averaged to those obtained from a second virtual window in the second detector that is such that the centre of width of the second window is coninci dent with the diffracted beam received from said second set of lattice planes, while displacing said second virtual window relative to said second dif fraction array for each successive scanning position to obtain a second resultant diffraction line inten sity distribution,
(k) determining from said second resultant diffraction line intensity distribution the diffraction angle cor responding to tha location of a preselected charac teristic of said second resultant diffraction line intensity distribution as a measure of a second strain lying in said second chosen direction, and
(l) calculating the normal stress component in the speciment from said ?rst and second strains.
10. The method of claim 2, including (h) subsequent to said receiving step (b), moving said
detector to a second location corresponding to a second chosen direction and receiving in said de tector in the second location, X-rays diffracted by a second set of crystal lattice planes in said area,
(i) converting the X>rays received in said detector in the second location into a second diffraction array of intensity values as a function of diffraction angle,
0) step scanning the projected beam relative to said area to generate a second sequence of said second diffraction arrays,
(k) averaging the intensity values of said second dif fraction array for each of a series of said diffraction angles, while restricting the intensity values so averaged to those obtained from a second virtual window in the detector that is such that the centre of width of the second virtual window is coinci dent with the diffracted beam received from said second set of lattice planes normal to said second chosen direction, while displacing said second vir tual window relative to said second diffraction array for each successive scanning position to ob tain a second resultant diffraction line intensity distribution,
(1) determining from said second resultant diffraction line intensity distribution the diffraction angle cor responding to the location of a preselected charac teristic of said second resultant diffraction line intensity distribution as a measure of a second strain lying in said second chosen direction, and
(m) calculating the normal stress component in the specimen from said ?rst and second strains.
11. The method of claim 2, including (h) locating a second position sensitive detector on
the opposite side of the projected beam from the

4,561,062 19
?rst detector with the angle subtended by the two detectors at the specimen area greater than twice the back re?ection angle de?ned at the specimen area between the projected beam and the beam diffracted to the ?rst detector,
(i) converting the X-rays received in said second detector into a second diffraction array of intensity values as a function of diffraction angle,
(j) subsequent to said step scanning of the projected beam in step ((1), step scanning the projected beam angularly about said area to generate a second sequence of said second diffraction arrays,
(k) averaging the intensity values of said second dif fraction array for each of a series of said diffraction angles, while restricting the intensity values so averaged to those obtained from a second virtual window in the second detector that is such that the centre of width of the second window is coincident with the diffracted beam received from a second set of lattice planes normal to a second chosen direction, while displacing said second virtual win~ dow relative to said second diffraction array for each successive scanning position to obtain a sec ond resultant diffraction line intensity distribution,
(1) determining from said second resultant diffraction line intensity distribution the diffraction angle cor responding to the location of a preselected charac teristic of said second resultant diffraction line intensity distribution as a measure of a second strain lying in said second chosen direction, and
(m) calculating the normal stress component in the speciment from said ?rst and second strains.
12. In X-ray diffractometer apparatus for obtaining a diffraction line intensity distribution in a chosen surface area of a polycrystalline specimen, comprising
(a) an X-ray source for generating an X-ray beam collimated to a small area,
(b) a position sensitive detector, (0) mounting means for the source and the detector,
whereby, upon locating said mounting means in a ?xed position relative to the speciment with said area irradiated by said beam, the detector will re ceiv X-rays diffracted by crystal lattice planes in said area,
(d) processing means connected to the detector for converting the X-rays received in said detector into a diffraction array of intensity values as a func tion of diffraction angle,
(e) said mounting means including means for step scanning the source relative to the speciment to generate in said processing means a sequence of said arrays, said step scanning being such that the angle between said X-ray beam and a normal to said area changes with each step relative to the angle between the center of width of the detector and said normal, and
(f) said processing means averaging the intensity val ues of said sequence of arrays for each of a series of said diffraction angles,
the improvement wherein said processing means in cludes '
(g) means for restricting the intensity values so aver aged to those obtained from a virtual window in the detector that is such that the centre of width of the window is coincident with the diffracted beam received from a set of said lattice planes normal to a chosen direction, and for displacing said virtual window relative to said diffraction array for each
0
5
20
25
30
35
45
50
65
20 successive scanning position to obtain a resultant diffraction line intensity distribution.
13. The apparatus of claim 12, wherein said process ing means includes means for determining from said resultant diffraction line intensity distribution the dif fraction angle corresponding to the location of a prese lected characteristic of said resultant diffraction line intensity distribution as a measure of a ?rst strain lying in said chosen direction.
14. The apparatus of claim 13, wherein said process ing means comprises
(h) means for converting the X-rays received in the detector into a preliminary array of intensity values as a function of channel position in the detector, and
(i) means for converting said preliminary array into said diffraction array.
15. The apparatus of claim 14, wherein said means for displacing said window is such as to displace said win dow for each successive scanning position by a ?rst increment relative to a reference channel position and by a second increment relative to a reference diffraction angle value in the diffraction array.
16. The apparatus of claim 15, wherein (i) said mounting means includes means for securing
said detector in a ?xed position on said mounting means and hence in a ?xed position relative to the specimen, and
(k) said second increment is equal to twice said ?rst increment.
17. The apparatus of claim 15, wherein (i) said mounting means includes means for securing
said detector to said source for step scanning there-_ with, and
(k) said ?rst and second increments are equal to each other.
18. The apparatus of claim 13, including (h) a second position sensitive detector, (i) said mounting means including means for mount
ing said second detector on the opposite side of the projected beam from the ?rst detector to receive X-rays diffracted by a second set of crystal lattice planes in said area normal to a second chosen direc tion,
(i) said processing means including means for con verting the X-rays received in said second detector into a second diffraction array of intensity values as a function of diffraction angle, said means for step scanning the source generating a second sequence of said second diffraction arrays,
(k) said processing means including means for averag ing the intensity values of said second diffraction array for each of a series of said diffraction angles, while restricting the intensity values so averaged to those obtained from a second virtual window in the second detector that is such that the centre of width of the second virtual window is coincident with the diffracted beam received from the second set of lattice planes, and for displacing said second virtual window relative to said second diffraction array for each successive scanning position to ob tain a second resultant diffraction line intensity distribution, and means for determining from said second resultant diffraction line intensity distribu tion the diffraction angle corresponding to the location of a preselected characteristic of said sec ond resultant diffraction line intensity distribution as a measure of a second strain lying in said second

4,561,062 21
chosen direction, and means for calculating the normal stress component in the specimen from said ?rst and second strains.
19. The apparatus of claim 18, wherein said process ing means includes means for calculating the normal
15
20
25
30
35
45
55
60
65
22 stress component in the specimen from two strains mea sured by said diffraction angle determining means with the detector positioned at different locations on said mounting means relative to the source.
* * * * *