stress characteristics for shallow footings in cohesionless slopes
DESCRIPTION
Stress Characteristics for Shallow Footings in Cohesionless SlopesTRANSCRIPT

Stress characteristics for shallow footings in cohesionless slopes
J. GRAHAM Department of Civil Engineering, University of Manitoba, Winnipeg, Man., Catlada R3T 2N2
M. ANDREWS Geotech Associates, 29 Auzonville Road, Turzaputza, Trinidad, West Indies
AND
D. H. SHIELDS Department of Civil Engineering, University of Manitoba, Winnipeg, Man., Canada R3T 2N2
Received May 4 , 1987
Accepted November 2, 1987
Footings placed at shallow depth in bridge approach embankments can be used to reduce the cost and to improve the performance of bridge supports. The embankments frequently terminate in slopes dropping to underpass level, and the footings therefore have lower capacity than that for footings on level ground. The needed design procedures have not been well validated.
The paper describes a new solution using the method of stress characteristics for footing capacity in cohesionless slopes. The soil is assumed to have c = 0, (b = constant, y > 0. Particular attention is paid to modelling the asymmetric nonfailing zone immediately beneath the footing. Solutions for various slope angles and friction angles have been obtained for footings placed at the crest of the slope with D/B = H/B = 0, and for H/B = 0.5, 1.0, and 2.0; D/B = 0.5 and 1.0. The theoretical bearing capacities are compared with experimental values from two series of laboratory tests.
Key words: bearing capacity, footings, failure, bridge abutments, slopes, sand, cohesionless, stress characteristics.
Des semelles mises en place ?i faible profondeur dans les remblais d'approche de ponts peuvent &tre utilisCes pour rCduire lecoQt et amCliorer la performance des appuis de ponts. Les remblais se terminent frkquemment en pente vers le niveau inferieur,et les semelles ont ainsi une capacitC portante inferieure 2 celle dCveloppte sur une surface au niveau. Les procCdures de calcul requises n'ont pas Ctt bien CprouvCes.
Cet article dCcrit une nouvelle solution utilisant la mCthode des caractCristiques de contraintes pour le calcul de la capacitCportante de semelles dans des pentes de sols pulvCrulents. L'on suppose que le sol a c = 0, (b = constante, y > 0. L'on porte une attention particuliCre au modelage de la zone situCe immkdiatement sous la semelle et non assujettie 2 la rupture. Des solutions pour diffkrents angles de pente et de frottement ont CtC obtenues pour des semelles placCes en crEte avec D/B = H/B = 0, et pour H/B = 0,5, 1,O et 2,O; D/B = 0,5 et 1,O. Les capacitCs portantes thCoriques sont comparkes aux valeurs expCrimentales donnCes par deux series d'essais en laboratoire.
Mots clis : capacitC portante, semelles, rupture, culCes de pont, pentes, sable, pulvCrulent, caractCristiques des contraintes. [Traduit par la revue]
Can. Geotech. J . 25, 238-249 (1988)
Introduction
Engineered structures sometimes require shallow footings on sloping ground. These include structures placed on benches cut into the slope, retaining walls, transmission towers, and bridge piers. Highway overpass bridges frequently connect with approach embankments about 10 m high that terminate in a sloping face dropping down to the underpass level. In these cases, supporting the end span of the bridge in the approach fill can produce savings in construction costs and reductions in pavement maintenance costs compared with the use of deep foundations (Shields et al. 1980).
Bauer et al. (1981) noted that the available theoretical solu-tions for bearing capacities in slopes gave widely differing answers and were thought to be unduly conservative. Two of them (Meyerhof 1957; Giroud and Tran 1971) permitted the footing to be placed elsewhere than at the crest of the slope. Both these solutions use limit equilibrium analysis of assumed failure surfaces. However, this method can only accommodate rather unconvincing modelling of the boundary conditions and failure domain properties (Graham 1974). In response to these perceived weaknesses in the analyses, Lebegue (1973),Shields et al. (1977), and Bauer et al. (1981) reported test data
on large-scale model footings. "Remarkable agreement" with the Shields et al. (1977) results has recently been reported by Kimura et al. (1985), who carried out centrifuge tests at 30 g on a model footing 40 mm wide (effective width, 1200 mm).
Graham (1974) showed that an alternative form of analysis using stress characteristics allows more careful modelling of boundary and field conditions for failures in sand. The method has recently been used to model closely spaced interfering footings (Graham et al. 1984) and the effects of footing size on capacity using a critical state strength model (Graham and Hovan 1986). Stress characteristics have been used only rarely in slopes (for example, Sokolovskii 1965; Reddy and Jagan-nath 1985), and in each case, to overcome important computa-tional difficulties, the soil was assumed to retain some cohesion. The method does not seem to have been used previ-ously in cohesionless sand when the footings are placed right at the sand surface, and this forms the objective of the work described here.
The paper describes a new analysis for bearing capacity in cohesionless slopes that takes particular account of the stress conditions immediately beneath the footing. The results are compared with experimental data published previously by Lebegue (1973) and by Shields et al. (1977).
Printed in Canada 1 Imprim6 au Canada
For
pers
onal
use
onl
y.

A ET AL. 239
The method of stress characteristics Details of computational procedures have been given else-
where (Graham 1968) and will only be briefly reviewed here. The solution combines the differential equations for stress transmission in plane strain at a point:
with the Coulomb - Mohr relationship
[2] ax,, = a( l F sin 4 cos 2$); T ~ , = T,, = a sin 4 sin 2$
for the T, a relationships when the soil is failing.' The param-eter a is the mean stress (al + a3)/2, and $ is the inclination of a l with the vertical. The sand is assumed to operate always under drained conditions. All stresses are therefore effective stresses. The common (')-convention for effective stress will be discarded for convenience, even though effective stresses are implied throughout the paper.
Substitution of [2] into [I] leads to hyperbolic differential equations with product terms of a, $ that suggest logarithmic transforms
to separate the variables. This leads to four simultaneous equa-tions, which are solved numerically in related pairs along spe-cific stress characteristic directions for (x,z,o,$) at previously unknown points in the failure domain:
[4] dtldz = b, along the direction dxldz = tan ($ + ,LL) - 92 +@2"
[5] dqldz = a , along the direction@= tan ($ - p)
where a , b = -t sin ($ $ p)/(2a os ($ 7 p) ) . Note that p = (45" - 4/2), so $ $ p are the directions of "slip lines" along which shear failure takes place. The shape and stress dis-tribution of the failure zones are developed as the analysis pro-ceeds. There is no need for the successive searching for most-critical surfaces that is typical of limit equilibrium methods. To provide definite integrals, known boundary con-ditions or previous calculated values of (x,z,a,$) must be available on each of the slip lines. Nonlinearity of the stress functions can be taken into account by iterative procedures for $ (Sokolovskii 1965) and for a (Graham 1968).
The log-transform in [3] leads to difficulties with the numer-ical procedures when there is a zero-surcharge boundary. Graham and Stuart (1971) gave a convenient solution for calculating the N,-coefficient for footings on the surface of cohesionless sand with self-weight (c = 0, 6 = constant > 0, y > 0). It involves (1) starting from a finite surcharge; (2) extending the solution out into the domain; (3) shrinking the calculated field (and hence the surcharge) back towards the origin; and (4) again extending the solution into the domain, under the influence of gravity forces. In this way, the effect of the assumed surcharge is successively reduced until finally the computed stresses in the failure zone are proportional to the distance from the comer of the footing. At this stage the solu-tion is independent of surcharge and the calculated ultimate bearing capacity q, of a footing of width B on the surface of a cohesionless sand can be expressed by
'Notation is given in the List of symbols at the end of the paper.
812 where qu = 2 J o a,dx/B, and the bearing capacity coefficient N,($) depends on the angle of shearing resistance 4 . When the footing is not at the ground surface but at depth D, the bearing capacity can be written:
where Nyq = N,,(+,D/B). In this case the numerical proce-dures are simpler. However, the boundary conditions still need to be carefully considered if good results are to be obtained from the analysis. It is this question of careful attention to the boundary conditions of the solution that marks the particular feature of the present work on bearing capacity in slopes. The symbol N,, will be used throughout the paper for the bearing capacity coefficient. When D/B = 0, N,, = N,.
Asymmetry of the nonfailing "trapped wedge" Andrews (1986) showed that most existing analyses for foot-
ings in slopes assume a nonfailing zone of soil immediately beneath the footing, with the zone being symmetric on either side of the centre line. As is common, the zone will be called an "elastic wedge." In contrast with the symmetry that is seen beneath footings on level ground, photographs from physical models on slopes (Peynircioglu 1948; Mizuno et al. 1960; Giroud and Tran 1971; and Kimura et al. 1985) show that the failure zones are asymmetric (Fig. 1). The downslope zone NPQR in Fig. 1 is larger than the zone LRST rising to the hori-zontal ground surface behind the crest. This means that the elastic wedge LMNR must also be asymmetric. Vesic (1973)
, I and Kimura et al. (1985) show that only a single wedge is formed beneath the footing, not two smaller wedges as in some analyses. The detailed geometry of the wedge is not immedi-ately obvious, and a number of alternatives will be studied in following paragraphs.
Determinate rectilinear failure zones NPQ and LST in Fig. 1 extend below the slope surface and the horizontal ground sur-face respectively. From Mohr circle considerations the inclina-tions of the major principal stress can be obtained as
$ = 0.5{a - a - arc sin (sin alsin 4 ) )
and
along NQ and LS respectively. The values of a along these sur-faces can also be obtained from Mohr circles. These form the starting boundary conditions for detailed stress characteristic calculations in the transition zones NQR and LSR, which end with the stresses along NR and LR respectively. Under the influence of self-weight in the failure zones the "radial" slip lines extending from N and from L are curved, and the "spiral" lines QR and SR are not logarithmic spirals. They have to be determined using numerical forward integration of [4] and [5].
As mentioned earlier, the geometry of the wedge LMNR is indeterminate, and has to be chosen using one of the assump-tions outlined in the following sections. This involves, for example, defining wl, or in Fig. 1 and it can be expected that they will vary with a and with 4 . Once this choice for wl and orhas been made, then XI tan wl = Xr tan o r ; XI + Xr = B; and e = (X, - Xl)/2 (X, + XI). The distribution of vertical stress FGH across the base LMN of the footing is obtained from the vertical stresses calculated along LR and NR. Note that the vertical stress G at M should be the same whether it is calcu-
For
pers
onal
use
onl
y.

240 CAN. GEOTECH. I. VOL. 25, 1988
FIG. 1 . Schematic of failure zones for footing at crest of slope.
FIG. 2. Geometry of the asymmetric nonfailing trapped wedge LNR.
lated as avl by way of TSR coming from beneath the horizontal ground surface TL, or as a,, by way of PQR from the slope surface PN. This will form an important condition for the solu-tions shown later.
Modelling of the wedge LMNR
Graham and Stuart (1971) showed that the capacity of a sur-face footing on horizontal ground depends on the assumptions made for the geometry of the trapped wedge beneath the foot-ing. This is because the stress distribution on the footing base depends strongly on the angle at the pole of the transition zone
at the edge of the footing. In many ways this is the reason for differences between solutions for "smooth" footings using o, = o, = 45" + $12 and "rough" footings using o, = W, = 6.
The following section will examine four possible altema-tives for determining the geometry of the trapped wedge for footings on slopes. In each case the angle wl corresponding to the part of the failure zone extending out to the level ground behind the crest is assumed equal to $ (Graham and Stuart 1971 ; Graham and Hovan 1986). The reasonableness of this assumption will be discussed later.
Model 1 assumes that even though the boundaries SR and
For
pers
onal
use
onl
y.
GRAHAM ET AL.
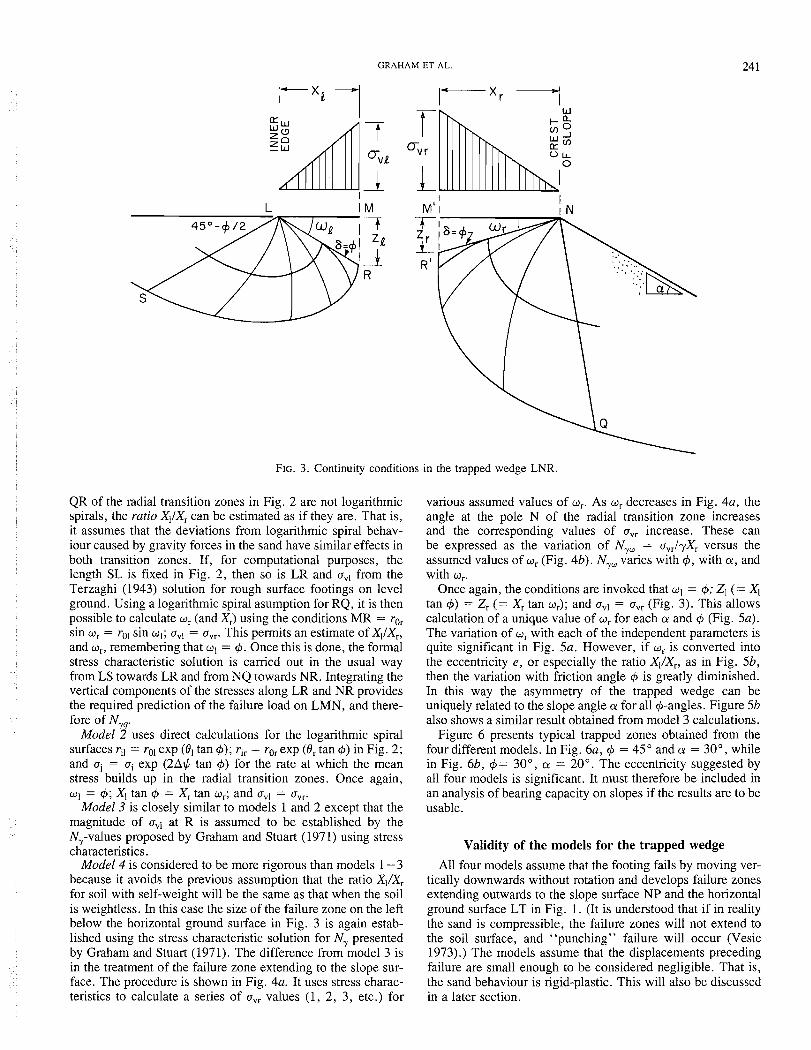
FIG. 3. Continuity conditions in the trapped wedge LNR.
QR of the radial transition zones in Fig. 2 are not logarithmic spirals, the ratio X1/X, can be estimated as if they are. That is, it assumes that the deviations from logarithmic spiral behav-iour caused by gravity forces in the sand have similar effects in both transition zones. If, for computational purposes, the length SL is fixed in Fig. 2, then so is LR and avl from the Terzaghi (1943) solution for rough surface footings on level ground. Using a logarithmic spiral asumption for RQ, it is then possible to calculate or (and X,) using the conditions MR = ro,sin w, = rol sin wl; avl = a,,. This permits an estimate of X,/X,,and w,, remembering that wl = +. Once this is done, the formal stress characteristic solution is carried out in the usual way from LS towards LR and from NQ towards NR. Integrating the vertical components of the stresses along LR and NR provides the required prediction of the failure load on LMN, and there-fore of N,,.
Model 2 uses direct calculations for the logarithmic spiral surfaces ql = rol exp (01 tan 4); rir = ro, exp (8, tan +) in Fig. 2; and aj = 5 exp (2Aq tan +) for the rate at which the mean stress builds up in the radial transition zones. Once again, w1 = 4; XI tan + = X, tan w,; and avl = a,,.
Model 3 is closely similar to models 1 and 2 except that the magnitude of avi at R is assumed to be established by the N,-values proposed by Graham and Stuart (1971) using stress characteristics.
Model 4 is considered to be more rigorous than models 1-3 because it avoids the previous assumption that the ratio Xl/X,for soil with self-weight will be the same as that when the soil is weightless. In this case the size of the failure zone on the left below the horizontal ground surface in Fig. 3 is again estab-lished using the stress characteristic solution for N, presented by Graham and Stuart (1971). The difference from model 3 is in the treatment of the failure zone extending to the slope sur-face. The procedure is shown in Fig. 4a. It uses stress charac-teristics to calculate a series of a,, values (1, 2 , 3 , etc.) for
various assumed values of w,. As w, decreases in Fig. 4a, the angle at the pole N of the radial transition zone increases and the corresponding values of a,, increase. These can be expressed as the variation of N,, = a,,lyX, versus the assumed values of w, (Fig. 4b). N,, varies with +, with a, and with a,.
Once again, the conditions are invoked that wl = +; Zl (= XItan +) = Z, (= X, tan w,); and avl = a,, (Fig. 3). This allows calculation of a unique value of w, for each a and + (Fig. 5a). The variation of w, with each of the independent parameters is quite significant in Fig. 5a. However, if w, is converted into the eccentricity e, or especially the ratio Xl/X,, as in Fig. 5b, then the variation with friction angle + is greatly diminished. In this way the asymmetry of the trapped wedge can be uniquely related to the slope angle a for all +-angles. Figure 5b also shows a similar result obtained from model 3 calculations.
Figure 6 presents typical trapped zones obtained from the four different models. In Fig. 6a, + = 45" and a = 30°, while in Fig. 6b, += 30°, a = 20". The eccentricity suggested by all four models is significant. It must therefore be included in an analysis of bearing capacity on slopes if the results are to be usable.
Validity of the models for the trapped wedge
All four models assume that the footing fails by moving ver-tically downwards without rotation and develops failure zones extending outwards to the slope surface NP and the horizontal ground surface LT in Fig. 1 . (It is understood that if in reality the sand is compressible, the failure zones will not extend to the soil surface, and "punching" failure will occur (Vesic 1973).) The models assume that the displacements preceding failure are small enough to be considered negligible. That is, the sand behaviour is rigid-plastic. This will also be discussed in a later section.
For
pers
onal
use
onl
y.

CAN. GEOTECH. J . VOL. 25, 1988
TABLE 1. Comparison of models 1-4 and photographic evidence for trapped wedge asymmetry
Observed Model 1 Model 2 Model 3 Model 4
A u t h o r * ~ c u o , w , e w , w , e w , o , e w , w , e w , w , e
*(I) Peynircioglu (1948); (2) Giroud and Tran (1971); (3) Kimura et al. (1985). ' ~ n a l ~ s e s were caned out for 10" d a d 45". When a < loo, w, w, and e = 0.0.
3 i.. STRESS : ..
c~,, ..,,, DISTRIBUTIONS
---- . . . . . . . . . .
M N
FIG. 4. Ny,, wr relationships for the model 4 analysis.
Table 1 compares calculated values of the trapped wedge parameters o,, w,, and e with the limited number of values available from published photographic evidence. The evidence is limited, but the trend towards increasing asymmetry of the trapped wedge (denoted by e) with increasing slope angle is clear. This conclusion supports the theoretical findings reported in Table 2. It should be remembered that measured displacement fields do not, in general, correspond well with the shape of calculated stress fields (Serrano 1972). Photo-graphed failure zones appear to be significantly affected by friction between the sand and the glass container, and by dif-ferences between the angle of dilation v and angle of friction
4 . Nevertheless, it can be concluded from Table 1 that o, is much closer to 4 than it is to 45" + 412 (except for Kimura et al.). Hence the choice of ol = 4 for the present work is rea-sonable. Also, o, is less than wl (except, once again for Kimura et al.). Therefore, the photographic evidence supports the models proposed earlier in which the trapped wedges are asymmetric with shapes generally like those shown in Fig. 6.
It will be remembered from the previous section that models 1 - 3 were based on the geometry of the failure zones assuming the sand to be weightless. Model 4 took full account of self-weight in the failure zones and will therefore be considered the preferred model. This choice is made even though the agree-ment between the observed asymmetry in Table 1 and the model 4 values is less good than with some of the other models.
Calculations have been performed using model 4 for 4 = 30, 35, 40, and 45", and for 10" I a! 5 (4 - 5)" in incre-ments of 5". Figure 7a shows values obtained for footings with their front edge right at the crest of the slope (D/B = 0; H/B = 0). As expected, the bearing capacity decreases towards zero as a approaches 4 . Figure 7a also shows values obtained by Graham and Stuart (1971) for level ground with a! = 0. The latter results clearly form a limit for the behaviour when a! > 0 and are compatible with the present calculations.
Figure 7b compares the present results with solutions by pre-vious authors. The values shown in the figure are for 4 = 40".The authors' results lie towards the upper limit of previously published theoretical solutions. It was pointed out earlier that the stimulus for this study of footings in slopes came from an understanding that existing theories were mostly conservative (Bauer et al. 1981). Thus it is in fact helpful that the new analysis presented in Fig. 7a gives values higher than most existing solutions.
Modelling for embedment (D/B > 0) and setback (H/B > 0) While footings at the crest of slopes provide a relatively
amenable problem for analysis, in practice most footings are placed at some depth D into the slope (Fig. 8a) and at some horizontal distance H back from the crest (Fig. 8b). For D/B < 1.0 the embedment can be modelled as a simple normal surcharge along TL, and a surcharge with normal and shear components along NP. Values for shallow embedment are actually generated during the numerical scaling procedures described earlier that lead to the results for zero embedment in Fig. 7a, so they are easily obtained. During this step the asym-metry of the wedge LNR is assumed to have the model 4 values shown in Fig. 5. That is, it is not affected by shallow embedment. Calculated values of N,, for H/B = 0; with D/B = 0.0, 0.5, and 1 .O, are shown in Fig. 9.
For
pers
onal
use
onl
y.

GRAHAM ET AL
I I I I
( a ) + = 4 5 0 a
4 0 ' A - 35' 0 -
-
-
MODEL 4 RESULT
I I I I
SLOPE ANGLE a! (DEG) SLOPE ANGLE a! (DEG)
FIG. 5. Asymmetry of the trapped wedge using model 4, for various +-values: (a) w, versus a; (b) X,/X, versus a.
TABLE 2. Averaged variation of X,/X,and e/B with slope angle cr for various
+-angles (model 4 results)
Slope angle a Eccentricity (deg) X,/Xr e (xB)
The modelling for the horizontal setback distance H requires more careful consideration. Two limiting conditions can be readily identified as shown in Fig. 86. If the footing is at the crest with H = 0, then the geometry of the trapped wedge is given by Fig. 5 and the failure zone emerges from the slope along the length NP. Second, when the footing is placed at L"N" the failure is just contained beneath the level ground surface N"P" and the presence of the slope has no influence on the computed bearing capacity. That is, for H 2 N"P" = Hc the footing behaves like the footings on level ground described by Graham and Stuart (1971). Values of Hc are given in Table 3. The distance N"P" is the distance at which shallow (surface) parallel footings begin to "interfere" and gain additional capacity (Graham et al. 1984). In this case, the wedge L"NUR" is symmetric, with the angles at L" and N" equal to 4.
To the authors' knowledge there is at present no rational way of predicting how the asymmetry of L'N'R' or the position of P' varies with a , +, and H/B. In the present work it has been assumed that as N' moves from N to N" (0 I H I Hc), then (1) P' varies linearly between P and P"; and (2) X,/X, varies linearly between the values for model 4 in Fig. 5b for crest loading and the value 1.0 for the symmetric, level ground case. The resulting positions of P' and R' in Fig. 8b define the extent of the failure zone P'Q'R'. Conditions along N'P' are treated as a triangular surcharge N'NP' having normal and shear com-ponents. Results of these computations are given in Figs. 9 and
TABLE 3. Critical setback distance H, below which failure zones exit from slope face (after Graham et al. 1984)
Angle of shearing resistance + (deg) 30 35 40 45 Critical setback distance Hc/B 1.2 2.0 2.7 3.5
10 for H/B = 0.0, 0.5, 1.0, and 2.0 and D/B = 0.0, 0.5, and 1.0.
As would be expected from the earlier discussion, the value of N,, for a given + reduces with a , increases with D/B, and increases with H/B. Figures 9 and 10 also show the "level ground" ( a = 0) values for N,, given by Graham and Stuart (1971) for D/B = 0.0, 0.5. The trend of the new results is clearly correct. As H/B increases or a decreases the results form the new calculations on slopes converge towards the level ground values in the earlier study.
Comparison with large-scale test results Only a limited number of carefully controlled test experi-
ments of footings on slopes have been reported in the litera-ture. Lebegue (1973) tested a 200 mm wide by 1000 mm long footing. The tests were camed out in a 3000 mm X 3000 mm (in plan) box. The footing was located at the crest of the 3000 mm long slope, hence H/B = 0. Readings were taken from only the centre segment of the three-section footing, to simulate plane strain conditions. He used two different sand densities and three slope angles. After some smoothing of the data to take account of variability in preparing the sand, the experimental results can be presented as shown in Fig. 11. The theoretical results in the figure are for D/B = 0 and H/B = 0, and are identical with those in Fig. 7a. The trend of the theoret-ical results is in broad agreement with the experimental values, but they underestimate the decrease in N,, with increasing a. On detailed examination, the experimental values are higher than analytical values for the same +-value. It should be remembered that the model studies fail the sand under plane strain conditions while the +-values quoted by Lebegue (1973) are from triaxial tests. (The pressure range in the triaxial tests is not reported. Values of 6 can be expected to decrease with increasing pressure.)
For
pers
onal
use
onl
y.

CAN. GEOTECH. J. VOL. 25, 1988
MODEL
I . . . . . . . . . . . ; ' -\ ~ ~ 3 0 0.'.>:::. . .
FIG. 6. Typical predictions for the asymmetry of the trapped wedge from models 1-4: (a) 4 = 45", a = 30"; (b) 4 = 30°, a = 20".
It is widely understood (see, for example, Wroth and Houlsby 1985) that $ in plane strain is larger than that in tri-axial tests (+,,). Quite good agreement is obtained if the exper-imental results in Fig. 11 are compared with the analytical results using $ = $,, x 1.1. Similar suggestions were made by Graham and Stuart (1971) for checking surface footings on level ground with a = 0.
Lebegue also tested some smaller footings with B = 60 mm and length of 200 mm in plane strain. Despite N,, being a dimensionless parameter, it does depend on the size of the footing, decreasing with increasing breadth B for the same density of sand. The shear strength of the sand is only approxi-mated by the common assumption of a straight strength enve-lope, that is, that + is independent of stress level. At failure, larger footings transfer larger stresses to the soil, mobilize lower average $-values in the failure zones, and have smaller N,,-values. This question of "scale effect" in sands has been addressed recently by Graham and Hovan (1986), who incor-porated a critical state strength model into their analysis of sur-face footing capacity. However, in this paper it has been thought preferable to focus attention on a new understanding of the asymmetric wedge LMNR (for example, in Figs. 2, 3, and 6) and to leave for a future occasion the additional uncertain-
ties that would be associated with a more sophisticated soil model in which $ varied with mean pressure levels.
More extensive tests have been reported by Shields et al. (1977, 1980). The tests were performed in a large laboratory sandbox 15 m long, 2 m wide, and 2.2 m high using 500 kN of crushed silica sand. The slope was formed by depositing air-dry sand from a rotating drum spreader. Two sand densities were achieved, 14.85 and 15.75 kN/m3, respectively 70 and 90% density index. Careful attention to the pressure range during testing suggested $,,-values of 37 and 41 " respectively for the two different sand densities.
A 300 mm broad footing stretched across the full 2 m width of the sandbox to create two-dimensional loading. To elimi-nate end effects at the sides of the box, the footing was made in three equal segments that were pressed into the sand at the same rate, with load and displacement readings being taken only from the central segment. Only 2: l slopes (a! = 27")were examined, but the positions of the footings were altered in the range 0 r D/B r 3; 0 r H/B r 5.
Comparison between the theoretical and experimental results is shown in Fig. 12 using the form of presentation originally proposed by Shields et al. (1977). Tests and analyses were per-formed for discrete ranges of D/B and H/B, and then lines of
For
pers
onal
use
onl
y.

GRAHAM ET AL.
SLOPE 6 : l 4 : l 2 : l 1.5: 1 1000 -
I I I I I I - ( a ) -
D/B=O.O - H / B ~ 0 . 0 -
I I I I I I
- ( b ) - - A CHEN AND DAVIDSOld (1973) -
0 MIZUNO E T A L . (1960)
- * MEYERHOF (1957) - GIROUD AND TRAN (1971) BOWLES (1975)
A KOVALEV (1964)- - r HANSEN (1970)
: A L L VALUES %! FOR $=40°, D / B =H/B=O
I I I
1000
400
SLOPE ANGLE Cr. (DEG) SLOPE ANGLE a! (DEG)
SLOPE 6 : 1 4 : l
FIG. 7. Bearing capacity coefficient N,, versus slope angle a: (a) predictions for D/B = H/B = 0 for various +-values; (b) comparison with previously published values, + = 40".
FIG. 8. Schematic of failure zones for embedment and setback: (a) D/B > 0; (b) H/B > 0.
constant Nyq interpolated between the known values. The the values of Hc predicted by Graham and Stuart (1971) with values in the figure are for the front edge of the footing in the experimental findings. The contours of N,, (experimental) the position shown. Once again, the trend of the results is become parallel with the ground surface (signifying Hc has encouraging, with the theoretical results perhaps not taking been reached) at roughly the predicted distances. quite enough account of the influence of the reduction in Table 4 examines whether the experimental and analytical capacity caused by the slope. It is also interesting to compare results should be compared on the basis of +,, or 1.1 X +,,.
For p
erso
nal u
se o
nly.

246 CAN. GEOTECH. J. VOL. 25, 1988
H / B = O . O ----- H / B = 0 . 5 * a = O (GRAHAM AND STUART 1971)
1000 I I I ( b )
10 I I I
0 10 20 30 40 0 10 20 30 40 0 10 20 30 40
a (DEG) a (DEG) a (DEG) FIG. 9. Predicted N,,-values: (a) D/B= 0; (b ) D/B = 0.5; (c) DIB = 1.0. (HIB = 0.0, 0.5.)
H / B = l . O ----- H / B = 2 . 0 * a = O (GRAHAM AND STUART 1971)
1000
FIG. 10. Predicted N,,-values: (a) D/B = 0; (b) D/B = 0.5; (c) D/B = 1.0. (H/B = 1.0, 2.0.)
The theoretical values have been interpolated from the results given earlier in Figs. 9 and 10. In the compact sand the average ratio between theoretical and experimental values for N,, is 1.33 using +,, and 2.82 using 1.1 x +,,. A similar con-clusion can be drawn for the dense sand, where the ratios are 1.04 and 1.88 respectively. In contrast with Lebegue's results discussed previously, the agreement between experimental and theoretical results is much better in this case when +,, is used. Shields et al. (1977) took particular care to relate the +-values to the stress levels in their tests (see also Graham and Stuart 1971).
It should be remembered that neither Lebegue nor Shields et al. considered the increase in embedment 6D that the test footings underwent to reach failure. In the case of the tests of Shields et ul., the footing generally settled 20 or 30 mm, which represents 0.07B-0.10B. It can be argued (Graham and Stuart 197 I), particularly in the case'of surface footings (D = 0), that
the theoretical values of N,, should be increased to account for this added depth of embedment.
Discussion and conclusions Prediction of the bearing capacity of footings requires (1)
identification of an appropriate failure mechanism, particularly as it relates to the indeterminate zone immediately beneath the footing; (2) availability of a suitable analytical model; (3) an appropriate strength model for the soil; and (4) validation of the results by comparison with large-scale laboratory tests, full-scale field tests, or centrifuge tests.
The paper has examined how the modelling of boundary conditions affects the calculation of bearing capacity on slopes. In particular it has identified that the trapped elastic zone is asymmetric to the footing base. A solution has been developed on the assumptions (Fig. 1) that (1) the edge LR of
For
per
sona
l use
onl
y.

GRAHAM ET AL.
TABLE 4. Comparison of experimental and theoretical values of N,,
Values of N,,
Geometry Experimental* TheoreticalT Theorylexperiment
H/B DIB Col. (1) Col. (2) Col. (3) (2) + (1) (3) + (1)
(a) Compact sand 29 64 58 140 84 176 48 100 74 148
100 196
(b) Dense sand 64 140
140 200 176 320 100 200 148 300 196 3 80 148 260 208 350 260 450
* ~ r o m Shields et a[. (1973). ;~uthors, from Andrews (1986). Compact sand: col. (2) I#J = +,, = 37", col. (3) + =
1.14[, = 41"; dense sand: col. (2) 4 = &,, = 41°, col. (3) 4 = 1.1& = 45".
LEBEGUE (1973)
c # I ~ ~ =40° e
SLOPE ANGLE CY (DEG)
FIG. 11. Comparison of predicted values of N,, with experimental values from Lebegue (1973) for B = 200 mm.
the trapped zone slopes at w, = + to the horizontal, as in a normal footing on level ground; (2) the failure zones going out to the level ground and the slope surface (LT and NP respec-tively) start from a common point R; and (3) the vertical stress at M is the same whether it is calculated from LRST or from NRQP, that is, a,, = q,,. It also assumes that the footing moves downwards with "general" shear failure and not
"punching" shear failure in the sand (Vesic 1973). At present there is inadequate experimental evidence to justify these assumptions fully. They do, however, form a rational and coherent framework for allowing the calculations to proceed.
The analysis used the method of stress characteristics for sand with c = 0, + = constant, y > 0. The numerical proce-dures are known to give essentially the same results as the more usual logarithmic spiral methods provided the boundary and domain conditions are specified identically (Graham 1974). However, the method does offer the particular advan-tage in the present work that the boundary conditions can be modelled more convincingly (see also Graham and Stuart 1971) and this has formed the principal thrust of the work pre-sented here using only simple constant-+ strength relationships.
Validation of the theoretical results is incomplete. It has been known for some time that existing theories tend to under-estimate the capacity of footings on slopes. Thus it is encour-aging in Fig. 7b that the present results lie above the majority of previous theoretical solutions. The new analytical results have been compared with the experimental results presented by Lebegue (1973) (Fig. 11) and by Shields et al. (1977) (Fig. 12). It was shown that the trend and magnitude of the theoretical results is largely correct in both cases. In Fig. 11 the results were compared on the basis of + = 1.1 x +,,, an empirical correction that takes some account of the plane strain conditions under which the footings were tested. However, in Fig. 12 and Table 4 the agreement is much better if +,, is used, although it has been noted that no account is taken of how settlements preceding failure affect the capacity of the footings. When experimental or field results are reported in the literature for use in calibrating analytical procedures, it is essential to give the grain size distribution of the sand, its mineralogy, its density at emplacement, the type and stress range of the shear testing, and some estimate of the curvature of the strength envelope.
For
pers
onal
use
onl
y.

CAN. GEOTECH. J. VOL. 25, 1988
( a 1 COMPACT SAND C$ =37O
( b ) DENSE SAND C$ =41°
VALUES OF Nyq : THEORETICAL AUTHORS
EXPERIMENTAL-- - - - SHIELDS E T A L . (19771
I FIG. 12. Comparison of predicted values of N,, with experimental values from Shields et al. (1977) for B = 300 mm.
Further testing is needed, This could be valuably done in a centrifuge, which couples the advantages of convenient model sizes with elevated stress levels that correspond with field- scale applications. This work is currently in progress with the centrifuge at the Laboratoire central des ponts et chaussCes in Nantes, France.
However well tests are performed, they are only usefi~l if the sand behaviour is adequately characterized. Thus, future model test programs also need to pay close attention to the properties of the sand. It is suggested that this needs to take account of the influence of stress level as well as initial density on the shearing resistance. Newer approaches to sand characterization, such as those proposed by Atkinson and Bransby (1978), Bolton (1986), and Been and Jefferies (1985),need to be adopted by geotechnical modellers whether their work is with physical models or with computer models. The additional strength testing program is not large but needs to be carefullv done.
In summary, new theoretical results for footings near the crests of slopes can be compared favourably with two sets of published large-scale model tests. However, the basis for this comparison is inconsistent-in one case $,, can be used while in the other it has to be empirically increased to correspond with plane strain conditions.
tions of Ontario. Ingrid Trestrial and Prabir Mitra provided technical support.
ANDREWS, M. 1986. Computation of bearing capacity coefficients for shallow footings on cohesionless slopes using stress characteristics. M.Sc. thesis, University of Manitoba, Winnipeg, Man.
ATKINSON, J. H., and BRANSBY, P. L. 1978. The mechanics of soils: an introduction to critical state soil mechanics. McGraw Hill (UK) Ltd., Maidenhead, England.
BAUER, G. E., SHIELDS, D. H., SCOTT, J. D., and GRUSPIER, J. E. 1981. Bearing capacity of footings in granular slopes. Proceedings, 10th International Conference on Soil Mechanics and Foundation Engineering, Stockholm, Vol. 2, pp. 33-36.
BEEN, K., and JEFFERIES, M. G. 1985. A state parameter for sands. GCotechnique, 35: 99- 112.
BOLTON, M. D. 1986. The strength and dilatancy of sands. GCotech-nique, 36: 65-78.
BOWLES, J. E. 1975. Spread footings. In Foundation engineering handbook. Edited by H. F. Winterkorn and H.-Y. Fong. Van Nostrand Reinhold, New York, NY.
CHEN, W. F., and DAVIDSON, H. L. 1973. Bearing capacity determi-nation by limit analysis. ASCE Journal of the Soil Mechanics and Foundations Division, 99(SM6): 433-449.
GIROUD, J. P., and TRAN, V.-N. 1971. Force portante d'une fonda-tion sur une pente. Annales de 1'Institut Technique du Bdtiment et des Travaux Publics, Supplement 283 -284.
GRAHAM, J. 1968. Plane plastic failure in cohesionless soils. Acknowledgements GCotechnique, 18: 301 -3 i6.
1974. Plasticity solutions to stability problems in sand. Cana- The work has been supported by research grants and fellow- dian Geotechnical 11: 238-247,
ships from the Natural Sciences and Engineering Research GRAHAM, J. , and HOVAN, J. -M. 1986. Stress characteristics for bear- Council of Canada, the University of Manitoba Transport ing capacity in sand using a critical state model. Canadian Geotech-Institute, and the Ministry of Transportation and Communica- nical Journal, 23: 195 -202.
For
pers
onal
use
onl
y.

ET AL. 249
GRAHAM, J., and STUART, J. G. 1971. Scale and boundary effects in foundation analysis. ASCE Journal of the Soil Mechanics and Foundations Division, 97(SMll): 1533 - 1548.
GRAHAM, J., RAYMOND, G. P., and SUPPIAH, A. 1984. Bearing capacity of three closely-spaced footings on sand. GCotechnique,34: 173- 182.
HANSEN, J. 1970. A revised and extended formula for bearing capac-ity. Danish Geotechnical Institute, Copenhagen, Denmark, Bul-letin 28.
KIMURA, T., KASAKABE, O., and SAITOH, K. 1985. Geotechnical model tests of bearing capacity problems in a centrifuge. GCotech-nique, 35: 33 -45.
KOVALEV, I. V. 1964. De la rksistance ultime des fondations IimitCespar un talus. Traduction du russe, extrait du recueil des travaux de LIIZLT, fascicule 225, "Nekotovye vo prosy tonnele-i-mosto-stroeniy," Leningrad, URSS, 1964. French translation by Labora-toire central des ponts et chaussges, Paris, France, 1973.
LEBEGUE, Y. 1973. Essais de fondations superficielles sur talus. Pro-ceedings, 8th International Conference on Soil Mechanics and Foundation Engineering, Moscow, Vol. 4.3, p. 3 13.
MEYERHOF, G. G. 1957. The ultimate bearing capacity of founda-tions on slopes. Proceedings, 4th Intemational Conference on Soil Mechanics and Foundation Engineering, London, Vol. 1, pp. 384-386.
MIZUNO, T., TOKUMITSU, Y., AND KAWAKAMI, H. 1960. On the bearing capacity of a slope of cohesionless soils. Soils and Founda-tions, 1: 30-37.
PEYNIRCIOGLU, H. 1948. Tests on bearing capacity of shallow foun-dations horizontal top surfaces of sand fills and the behaviour of soils under such foundations. Proceedings, 2nd International Con-ference on Soil Mechanics and Foundation Engineering, Rotter- dam, Vol. 3, pp. 144-205.
REDDY, A. S., and JAGANNATH, S. V. 1985. Bearing capacity of strip footings in depressions. Proceedings, Indian Geotechnical Confer-ence, Roorkee, Vol. 1, pp. 77-82.
SERRANO, A. A. 1972. The method of associated fields of stress and velocity, and its application to earth pressure problems. Proceed-ings, 5th European Conference on Soil Mechanics and Foundations Engineering, Madrid, Vol. 1, p. 77.
SHIELDS, D. H., SCOTT, J. D., BAUER, G. E., DESCHENES, J. H., and BARSVARY, A. K. 1977. Bearing capacity of foundations near slopes. Proceedings, 9th Intemational Conference on Soil Mechanics and Foundations Engineering, Tokyo, Vol. 2, pp. 715-720.
SHIELDS, D. H., DESCHENES, J. H., SCOTT, J. D., and BAUER, G. E. 1980. Advantages of founding bridge abutments on approach fills. Roads and Transport Association of Canada Conference, Sep- tember 1978. Published RTAC Forum 3, No. 1, Spring 1980.
SOKOLOVSKII, V. V. 1965. Statics of granular media. Pergamon Press, New York, NY.
TERZAGHI, K. 1943. Theoretical soil mechanics. Wiley, New York, NY.
VESIC, A. S. 1973. Analysis of ultimate loads of shallow foundations. ASCE Journal of the Soil Mechanics and Foundations Division, 99(SM1): 43 -75.
WROTH, C. P., and HOULSBY, G. T. 1985. Soil mechanics-property characterization and analysis procedures. State of the art report. Proceedings, 1 lth International Conference on Soil Mechanics and Foundation Engineering, San Francisco, CA, Vol. 3, pp. 1-54.
List of symbols
sin ($ + ~ ) l { 2 u tan 4 cos ($ F ~r.)) footing breadth, depth cohesion eccentricity of base of trapped nonfailing zone from footing centre line ( X B ) setback distance from crest, critical setback inside which the slope affects the footing capacity bearing capacity coefficient for D/B = 0, D/B $ 1.0 average footing contact pressure at failure radius, initial radius, pole angle for logarithmic spiral horizontal, vertical coordinates base dimensions on left, right side of trapped zone (Fig. 3) depth of trapped zone coming from left, right side (Fig. 3) slope angle, deg unit weight angle of shearing resistance (friction), dilation normal, shear stress inclination of major principal stress to vertical 45" - 412 (In a)/2 tan 4 + $ base angles at left, right of trapped wedge (Fig. 3)
Subscripts: 1, 3, v major, minor, vertical 1 r i j left, right, initial, general j t h
Effective stresses are implied throughout the paper
For
per
sona
l use
onl
y.