stress, anxiety symptomology, and the need for student
TRANSCRIPT

Louisiana State UniversityLSU Digital Commons
LSU Master's Theses Graduate School
2015
Stress, Anxiety Symptomology, and the Need forStudent Support Services for University Freshmenof First-Generation Status, Low-SES Backgrounds,and those Registered with DisabilitiesKelly Dale AllisonLouisiana State University and Agricultural and Mechanical College, [email protected]
Follow this and additional works at: https://digitalcommons.lsu.edu/gradschool_theses
Part of the Social Work Commons
This Thesis is brought to you for free and open access by the Graduate School at LSU Digital Commons. It has been accepted for inclusion in LSUMaster's Theses by an authorized graduate school editor of LSU Digital Commons. For more information, please contact [email protected].
Recommended CitationAllison, Kelly Dale, "Stress, Anxiety Symptomology, and the Need for Student Support Services for University Freshmen of First-Generation Status, Low-SES Backgrounds, and those Registered with Disabilities" (2015). LSU Master's Theses. 2838.https://digitalcommons.lsu.edu/gradschool_theses/2838
STRESS, ANXIETY SYMPTOMOLOGY, AND THE NEED FOR STUDENT SUPPORT SERVICES FOR UNIVERSITY FRESHMEN OF FIRST-GENERATION STATUS, LOW-SES
BACKGROUNDS, AND THOSE REGISTERED WITH DISABILITIES
A Thesis
Submitted to the Graduate Faculty of the Louisiana State University and
Agricultural and Mechanical College in partial fulfillment of the
requirements for the degree of Master of Social Work
in
The School of Social Work
by Kelly D. Allison
B.S. Xavier University of Louisiana, 2012 May 2015
ii
ACKNOWLEDGEMENTS
I would like to express my sincere appreciation to my committee chair, Dr. Timothy
Page, for his support, guidance, and encouragement throughout the process of completing this
thesis project. Dr. Page was instrumental in all planning, editing, and data analysis of this
project. I would like to thank my committee members, Dr. Juan Barthelemy and Dr. Michelle
Livermore, for their feedback and contributions towards the completion of this project. Also, I
am very grateful to Louisiana State University’s Student Support Services program. LSU’s SSS
students and staff welcomed me as a part of their community for the 2014-2015 Academic Year
and provided me with vital knowledge towards the completion of this project. Finally, I am
grateful to my extremely supportive family and friends for providing me with the encouragement
to push forward in all of my academic endeavors and dreams. Your unceasing support and
confidence in my personal and academic abilities continues to fuel my success.
iii
TABLE OF CONTENTS
ACKNOWLEDGEMENTS ............................................................................................................ ii
ABSTRACT ................................................................................................................................... iv
CHAPTER 1: INTRODUCTION ....................................................................................................1
CHAPTER 2: REVIEW OF THE LITERATURE ........................................................................4
CHAPTER 3: METHODOLOGY .................................................................................................20
CHAPTER 4: RESULTS ...............................................................................................................25
CHAPTER 5: DISCUSSION AND CONCLUSION ....................................................................28
REFERENCES ..............................................................................................................................35
APPENDIX A: RECRUITMENT EMAIL ....................................................................................42
APPENDIX B: THE PERCEIVED STRESS SCALE ..................................................................43
APPENDIX C: THE OVERALL ANXIETY SEVERITY AND IMPAIRMENT SCALE ..........44
APPENDIX D: LSU IRB APPROVAL ........................................................................................46
VITA ..............................................................................................................................................47
iv
ABSTRACT
Three populations of concern for professional social workers in higher educational
settings include first-generation college students (FGCSs), students from low socio-economic
(low-SES) backgrounds, and students with disabilities. As the national demand for degrees in
higher education rises both socially and economically, the push for young adults’ postsecondary
success becomes increasingly crucial. In college and university settings, a significant portion of
students may be classified as FGCSs, low-SES, or may be registered with a disability.
Examining these vulnerable populations within higher education settings, particularly regarding
stress and anxiety symptomology, can help social workers recognize the social, developmental,
and academic inhibitions that mental health factors have on these student populations and help
promote programs within higher education settings that support these students’ social and
academic success. By assessing stress and anxiety levels among FGCSs, students of low-SES,
and students with disabilities, this study will build upon what is already known surrounding
stress and anxiety within young adults, higher education students, and vulnerable student
populations.
Stress and anxiety levels were evaluated within three student populations including:
students of FGCS status, low-SES students, and students with disabilities. Stress was assessed
using the Perceived Stress Scale (Cohen, 1988), and anxiety was assessed using the Overall
Anxiety Severity And Impairment Scale (Norman, Cissell, Means-Christensen, & Stein, 2006).
Results showed that FGCSs, low-SES students, and students with disabilities had stress levels
that are much higher than average and had anxiety levels that are just below the threshold for an
anxiety diagnosis. These results have implications for future research, education policy, and
social work practice.

1
CHAPTER 1: INTRODUCTION
Higher education is pivotal to young adults’ success. For many youth within the general
population, higher education is viewed as both feasible and achievable; it is an academic
endeavor that inevitably follows high school graduation. High school graduates of distinctly
disadvantaged populations, however, have more difficulty achieving academic success and
maintaining enrollment in institutions of higher education. In particular, students of first-
generation college status, students of low socio-economic backgrounds, and students with
disabilities face obstacles while maneuvering through their post-secondary education. The
educational barriers that these students encounter, coupled with the stress and anxiety that they
often experience relating to their home environments and fear of failure, put many of them at risk
for unsuccessful degree completion at college and universities.
College students of first-generation status represent half of the U.S. postsecondary
student population (American Council on Education, 2002), yet campus resources are often not
available to accommodate the needs of this prevalent student population. Due to their parents’
lack of experience and limited knowledge regarding matriculation through college and university
settings, first-generation college students are at a particular social disadvantage in the
postsecondary realm. They also tend to be significantly less prepared for the financial and
academic adjustments that come with college and university life (Hertel, 2002). The everyday
experiences of academic pressure coupled with a lack of social capital among first-generation
students are often significant obstacles to their academic success of these students (Phinney and
Haas, 2003).
Individuals of low socio-economic status represent a significant portion of college and
university students. More than half of recent high school graduates from low-income families

2
enroll in a postsecondary institution (National Center for Education Statistics, 2012). Similar to
the academic and social disadvantages of first-generation college students, those from low-
income families, neighborhoods, and communities encounter distinct obstacles to social
integration and academic success in college and university life. In addition to the developmental
difficulties of adjusting to college and university life, students of low socio-economic status also
encounter personal difficulties and family responsibilities that create additional stressors. An
absence of support and social resources has been shown to promote stress and anxiety in students
of low socio-economic status (Hammen, Kim, Eberhart, & Brennan, 2009). Poor coping styles
displayed by some students in response to stress-inducing situations can exacerbate the stress and
anxiety experienced by low-income students (Palomar-Lever & Victorio-Estrada, 2012).
Students with disabilities share a unique set of challenges in the college and university
setting. This population represents 11% of students enrolled in postsecondary institutions
(NCES, 2013) and report higher levels of anxiety than their counterparts with no disabilities
(Verhoof, Maurice-Stam, Heymans, & Grootenhuis, 2013). The stress reported by these students
can lead to symptoms of anxiety, which can impair academic achievement (Gregg, Hoy, King,
Moreland, & Jagota, 1992). Weinstein and Palmer (1990) found that when students with
disabilities are under pressure to perform academically, they are likely to perform below the
level of their full potential.
Through federal funding, Student Support Services programs on college and university
campuses across the U.S. have provided academic and social support to students of first-
generation college status, students of low socio-economic backgrounds, and students with
disabilities. Using counseling, academic advising, tutoring, and skills-building courses (U.S.
Department of Education, 2014), Student Support Services provides opportunities for academic
3
enhancement and social engagement to these disadvantaged populations (Kuh, 2008).
Participation in Student Support Services programs increase students’ retention and degree
completion through academic and psychological support (U.S. Department of Education, 2010).
The relationships formed and guidance provided to students through Student Support Services
staff is a major contributor to the success of the students (Walsh & Kankakee Community
College, 2000).
The adjustment to college and university life can be overwhelming to any freshman
student. Moving away from one’s hometown, maneuvering large campuses, encountering
thousands of students, enrolling in auditorium-sized classes, and adjusting to what are often
impersonal relationships with faculty and staff can make the transition into postsecondary
education difficult for any first-year student. Given these complexities along with the unique
stressors and anxiety-promoting aspects of being a first-generation college student, a low-income
college student, or a student with a disability, success in higher education is even more difficult
to achieve. The lack of social and academic support, and also the loss of a sense of community
in large college and university settings can lead these freshmen to become stressed and anxious,
resulting in poor performance during their academic undertakings. To better serve this
population and, hopefully, improve their chances for academic success, more study of the extent
of these difficulties is needed. The current study, therefore, poses the question: To what extent
does the Lousiana State University Student Support Services freshman population experience
high levels of stress and anxiety? Finding an answer to this question could point the way to
improved services to support the academic success of these vulnerable students.
4
CHAPTER 2: REVIEW OF THE LITERATURE
Students in Higher Education
Currently in the United States, there are over 7000 degree-granting postsecondary
institutions (NCES, 2013). In the fall of 2012, there were 17.7 million undergraduate students of
full-time and part-time status enrolled in post-secondary institutions across the nation (NCES,
2014). Students that attend and successfully complete college report higher rates of
employment, higher lifetime earnings, more engagement in civic activities, higher rates of
healthy lifestyle choices, an increased likelihood of moving up the socioeconomic ladder, and an
increased likelihood of educational involvement in their children’s academic career (College
Board, 2010). It has also been found that compared to their less educated counterparts, college-
educated mothers spend more time with their children and devote a significant portion of this
time to the developmental needs of their children (College Board, 2010).
First-generation College Students. According to College Board (2013), a first-
generation college student (FGCS) is the first person in his or her immediate family to attend
college, and the highest degree earned by either parent is a high school diploma, high school
diploma equivalent, or less than the high school level. Between the years of 1992 and 2000, 22%
of college freshmen were FGCSs (NCES, 2005). More recently, approximately 50% of all
postsecondary students and about 34% of all students enrolled in 4-year postsecondary
institutions are of FGCS status (American Council on Education, 2002). These students are
disproportionately overrepresented among historically disadvantaged groups, including students
of color and students from low-income backgrounds (The Pell Institute for Study of Opportunity
in Higher Education, 2007). According to the National Center for Education Statistics (2001),
only 54% of students whose parents’ highest educational attainment was high school enrolled in

5
college immediately after completing high school, and a mere 36% of students whose parents’
highest educational attainment was less than a high school enrolled in college immediately after
completing high school. This is significantly lower than the 82% of non-FGCSs that enrolled in
college immediately after completing high school (NCES, 2001). FGCSs are more likely to
attend less selective colleges and also colleges in closer proximity to home (The Pell Institute for
Study of Opportunity in Higher Education, 2007). FGCSs tend to work more while in college
and also live off-campus, compared to their non-FGCS counterparts; this has been shown to
negatively affect both academic and social aspects of students’ college tenure (Higher Education
Research Institute, 2007). Lastly, FGCSs are less likely to incorporate academic areas such as
mathematics, science, and computer science, and are more likely to focus on vocational and
technical fields (NCES, 2005).
College Students of Low Socio-Economic Status. According to The Pell Institute for
Study of Opportunity in Higher Education (2007), a student of low socio-economic status (low-
SES) is one that has a household annual income of $25,000 or less. In 2012, 50.9% of recent
low-income high school completers were enrolled in a two or four year college (National Center
for Education Statistics, 2012). In 2010, the NCES reported that only 58.4% of high school
graduates from low-income families enrolled in a two or four-year college immediately after
high school, while 63.3% of students from middle-income families enrolled, and 78.2% of
students from high-income families enrolled. Compared to only 16% of students with household
annual incomes over $100,000, 44% of low-SES college students enroll in a 2-year college, as
opposed to a 4-year institution (National Center for Education Statistics, 2008). Thus, students
of a low-SES background are less likely to enroll in a postsecondary institution, and when they
do, it is more likely that this will be a two-year institution as opposed to a four-year institution
6
that their economically advantaged peers are likely to attend (National Center for Education
Statistics, 2008).
The National Center for Education Statistics (2004) found that 63% of the lowest
academically ranked college students took at least one remedial course during their
postsecondary studies; it was also found that students offered remediation through courses are
less likely to earn a degree or certificate. Adelman (1999) found that academic rigor of course
work during students’ elementary and high school education is one of the best predictors of
college success. However, low-SES students are less likely to have attended high schools that
offer rigorous, college-preparatory curricula. Eighty-three percent of students in the highest SES
quintile attended a high school that offered a trigonometry course, while only 64% of students in
the lowest SES quintile were offered a trigonometry course, and 72% of students in the highest
SES quintile attended a high school that offered a calculus course, while only 44% of students in
the lowest SES quintile were offered a calculus course (Adleman, 2006).
One way for high schools to encourage college-preparatory curricula is participation in
Advanced Placement programs, which consist of over 30 courses and qualifying exams taught
within high schools and designed to offer college-level credit to those who successfully complete
them (The College Board, 2009). Students who participate in Advanced Placement courses have
been shown to have a higher likelihood of obtaining a postsecondary degree (Bleske-Rechek,
Lubinski, & Benbow, 2004). Educational Testing Service (2008) found, however, that low-SES
students are much less likely to participate in an Advanced Placement program.
College Students with Disabilities. According to the National Center for Education
Statistics (2013), college students with disabilities (CSD) are those who report a “specific
learning disability, visual handicap, hard of hearing, deafness, speech disability, orthopedic
7
handicap, or health impairment”. The enrollment of students with disabilities in postsecondary
institutions is increasing (Institute of Education Sciences, 2010). Four out of five high school
students with disabilities identify postsecondary education as a goal (National Longitudinal
Transition Study 2, 2004). During the 2007-2008 academic year, 11% of students who enrolled
in postsecondary institutions reported having a disability (NCES, 2013). Even with this
increasing number and an increase of high school students with disabilities taking rigorous
college-preparatory courses (National Longitudinal Transition Study 2, 2004), students with
disabilities encounter various challenges in the transition from high school to college. Institute of
Education Sciences (2011), found that students with disabilities were more likely to be enrolled
in 2-year colleges or community colleges than 4-year colleges or universities. While 37% of
young adults in the general population have been enrolled in a 4-year postsecondary institution,
only 15% of young adults with disabilities have been enrolled (Institute of Education Sciences,
2011).
Developing at the same rate as individuals in the general population can be challenging
for young adults with disabilities (Stam, Hartman, Deurloo, Groothoff, & Grootenhuis, 2006).
This population of young adults is at risk for poor educational, vocational, and social outcomes
in later years (Maslow, Haydon, McRee, Ford, & Halpern, 2011). Young adults with chronic
disabilities face particular difficulties in finding and maintaining employment (Schur, 2002),
leading to not only occupational disadvantages, but financial and social disadvantages as well
(Winn & Hay, 2009).
The prevalence and identified educational challenges of FGCSs, low-SES students, and
students with disabilities calls for particular attention to their academic, social, and psychological
well-being. A significant number of individuals in the young adult population suffer from
8
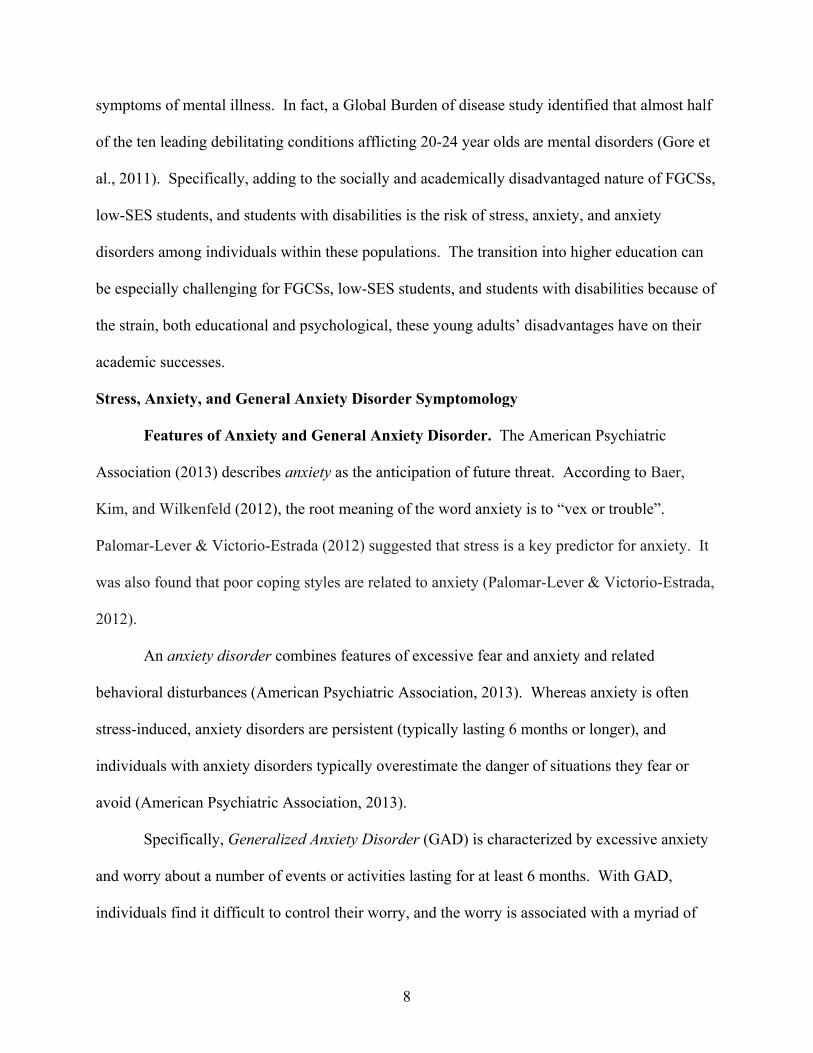
symptoms of mental illness. In fact, a Global Burden of disease study identified that almost half
of the ten leading debilitating conditions afflicting 20-24 year olds are mental disorders (Gore et
al., 2011). Specifically, adding to the socially and academically disadvantaged nature of FGCSs,
low-SES students, and students with disabilities is the risk of stress, anxiety, and anxiety
disorders among individuals within these populations. The transition into higher education can
be especially challenging for FGCSs, low-SES students, and students with disabilities because of
the strain, both educational and psychological, these young adults’ disadvantages have on their
academic successes.
Stress, Anxiety, and General Anxiety Disorder Symptomology
Features of Anxiety and General Anxiety Disorder. The American Psychiatric
Association (2013) describes anxiety as the anticipation of future threat. According to Baer,
Kim, and Wilkenfeld (2012), the root meaning of the word anxiety is to “vex or trouble”.
Palomar-Lever & Victorio-Estrada (2012) suggested that stress is a key predictor for anxiety. It
was also found that poor coping styles are related to anxiety (Palomar-Lever & Victorio-Estrada,
2012).
An anxiety disorder combines features of excessive fear and anxiety and related
behavioral disturbances (American Psychiatric Association, 2013). Whereas anxiety is often
stress-induced, anxiety disorders are persistent (typically lasting 6 months or longer), and
individuals with anxiety disorders typically overestimate the danger of situations they fear or
avoid (American Psychiatric Association, 2013).
Specifically, Generalized Anxiety Disorder (GAD) is characterized by excessive anxiety
and worry about a number of events or activities lasting for at least 6 months. With GAD,
individuals find it difficult to control their worry, and the worry is associated with a myriad of
9
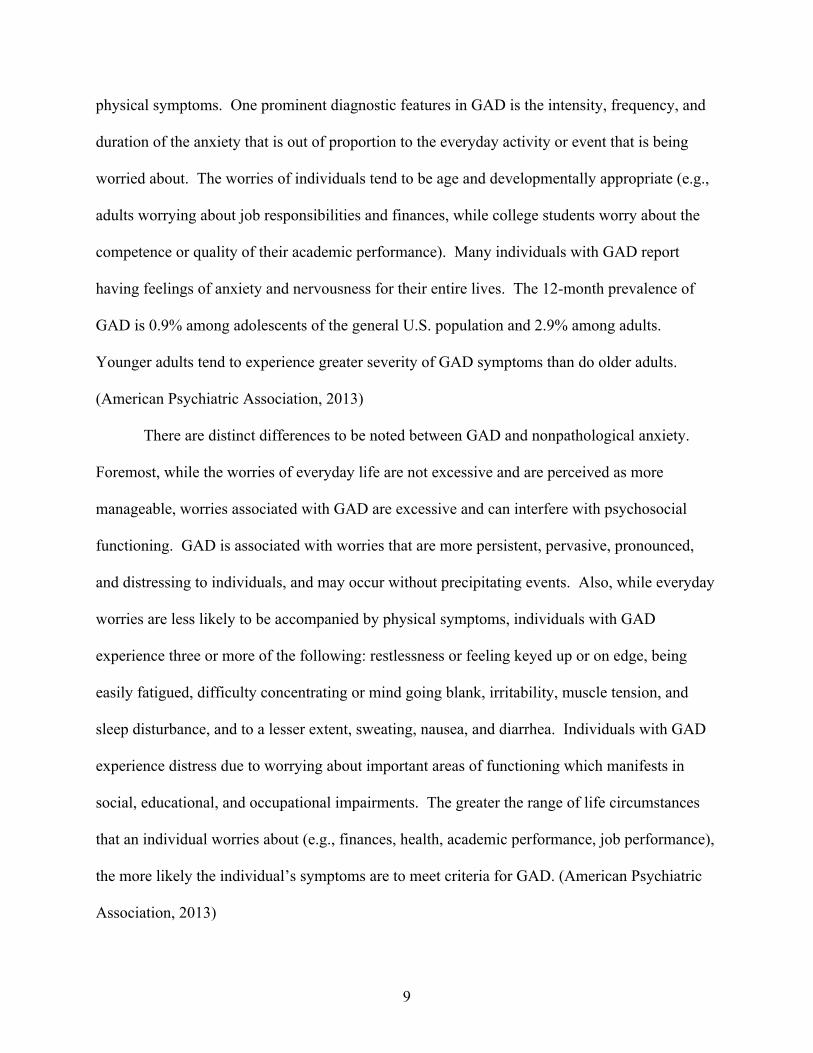
physical symptoms. One prominent diagnostic features in GAD is the intensity, frequency, and
duration of the anxiety that is out of proportion to the everyday activity or event that is being
worried about. The worries of individuals tend to be age and developmentally appropriate (e.g.,
adults worrying about job responsibilities and finances, while college students worry about the
competence or quality of their academic performance). Many individuals with GAD report
having feelings of anxiety and nervousness for their entire lives. The 12-month prevalence of
GAD is 0.9% among adolescents of the general U.S. population and 2.9% among adults.
Younger adults tend to experience greater severity of GAD symptoms than do older adults.
(American Psychiatric Association, 2013)
There are distinct differences to be noted between GAD and nonpathological anxiety.
Foremost, while the worries of everyday life are not excessive and are perceived as more
manageable, worries associated with GAD are excessive and can interfere with psychosocial
functioning. GAD is associated with worries that are more persistent, pervasive, pronounced,
and distressing to individuals, and may occur without precipitating events. Also, while everyday
worries are less likely to be accompanied by physical symptoms, individuals with GAD
experience three or more of the following: restlessness or feeling keyed up or on edge, being
easily fatigued, difficulty concentrating or mind going blank, irritability, muscle tension, and
sleep disturbance, and to a lesser extent, sweating, nausea, and diarrhea. Individuals with GAD
experience distress due to worrying about important areas of functioning which manifests in
social, educational, and occupational impairments. The greater the range of life circumstances
that an individual worries about (e.g., finances, health, academic performance, job performance),
the more likely the individual’s symptoms are to meet criteria for GAD. (American Psychiatric
Association, 2013)
10
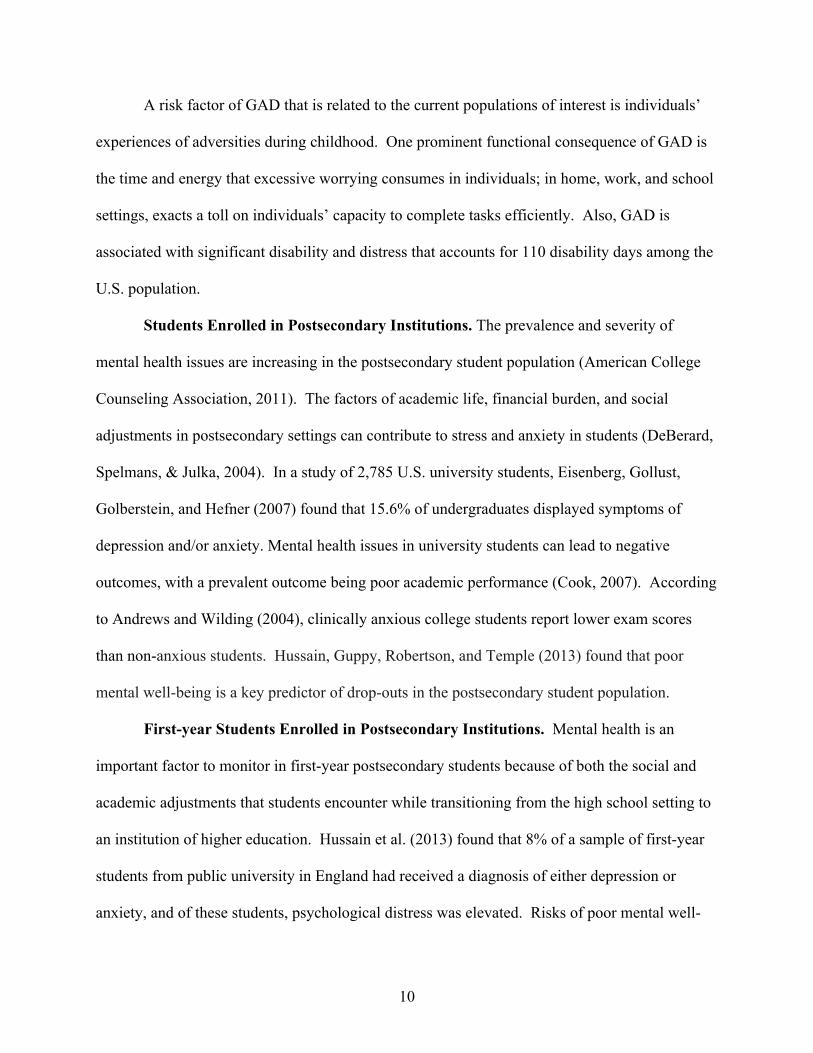
A risk factor of GAD that is related to the current populations of interest is individuals’
experiences of adversities during childhood. One prominent functional consequence of GAD is
the time and energy that excessive worrying consumes in individuals; in home, work, and school
settings, exacts a toll on individuals’ capacity to complete tasks efficiently. Also, GAD is
associated with significant disability and distress that accounts for 110 disability days among the
U.S. population.
Students Enrolled in Postsecondary Institutions. The prevalence and severity of
mental health issues are increasing in the postsecondary student population (American College
Counseling Association, 2011). The factors of academic life, financial burden, and social
adjustments in postsecondary settings can contribute to stress and anxiety in students (DeBerard,
Spelmans, & Julka, 2004). In a study of 2,785 U.S. university students, Eisenberg, Gollust,
Golberstein, and Hefner (2007) found that 15.6% of undergraduates displayed symptoms of
depression and/or anxiety. Mental health issues in university students can lead to negative
outcomes, with a prevalent outcome being poor academic performance (Cook, 2007). According
to Andrews and Wilding (2004), clinically anxious college students report lower exam scores
than non-anxious students. Hussain, Guppy, Robertson, and Temple (2013) found that poor
mental well-being is a key predictor of drop-outs in the postsecondary student population.
First-year Students Enrolled in Postsecondary Institutions. Mental health is an
important factor to monitor in first-year postsecondary students because of both the social and
academic adjustments that students encounter while transitioning from the high school setting to
an institution of higher education. Hussain et al. (2013) found that 8% of a sample of first-year
students from public university in England had received a diagnosis of either depression or
anxiety, and of these students, psychological distress was elevated. Risks of poor mental well-

11
being, such as depression and anxiety, include poor physical health, maladaptive and/or a lack of
social interactions, and negative outcomes in postsecondary education, including student drop-
out (Cook, 2007; Patel, Flisher, Hetrick, & McGorry, 2007).
In a study of 226 first-year undergraduate students, Pancer, Hunsberger, Pratt, and Alisat
(2000) found that college freshmen’s initial adjustment during the first 6 months at their
university was significantly related to their levels of stress immediately prior to beginning their
undergraduate studies. Consequently, it was shown that college freshmen who experienced high
levels of stress prior to beginning college showed poor levels of adjustment to university life
(Pancer, Hunsberger, Pratt, &Alisat, 2000). Sasaki and Yamasaki (2007) stated that better
adaptation to university life among students can be promoted by positive coping that focuses on
problem-solving.
Stress and Coping: First-generation College Students
FGCSs tend to experience greater stress than their non-FGCS counterparts (Phinney &
Haas, 2003). These students tend to come from low-income households and therefore have
greater financial need (Terenzini, Springer, Yaeger, Pascarella, & Nora, 1996); most have part-
time or full-time jobs while also being enrolled as full-time students (Phinney & Haas, 2003).
Many FGCSs from immigrant families, especially those living at home, experience the strain of
commitments to cultural and household obligations, such as childcare and housework, while also
balancing academics (American Association of University Women Educational Foundation,
2001).
FGCSs tend to be less prepared for postsecondary studies than their non-FGCS peers
both socially and academically, and therefore tend to be overwhelmed with aspects of the college
setting (Hertel, 2002). FGCSs also may perceive that they are less supported on campus than
12
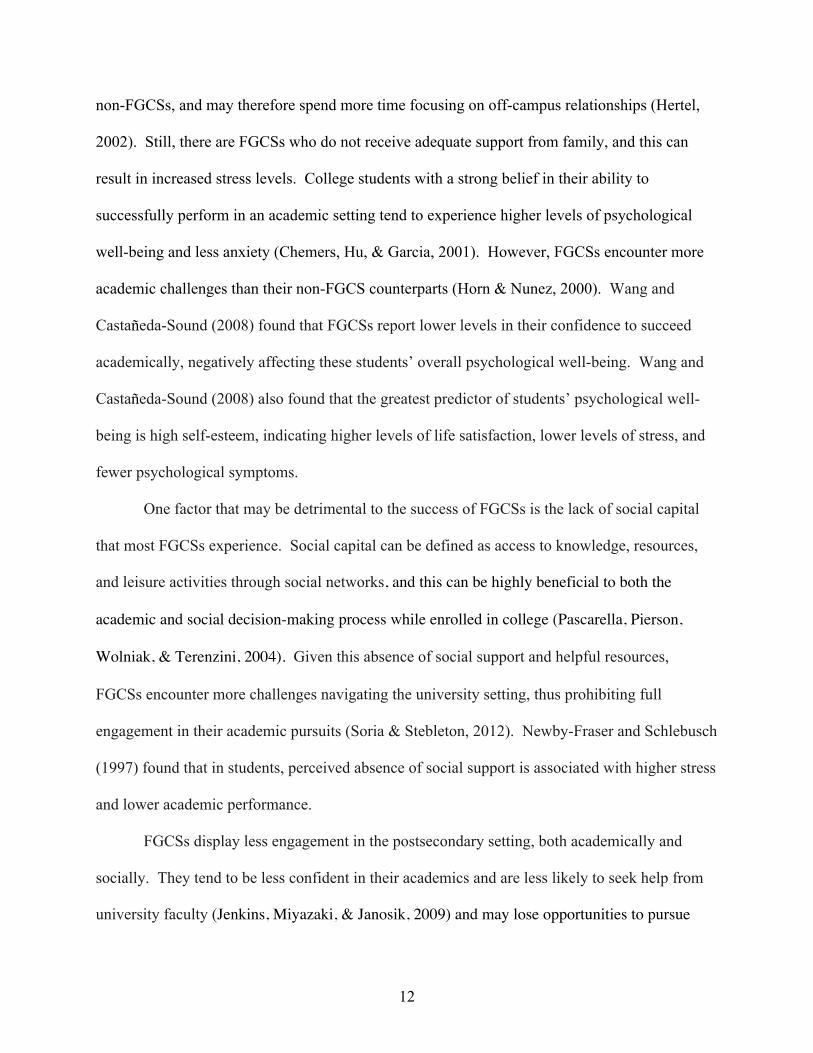
non-FGCSs, and may therefore spend more time focusing on off-campus relationships (Hertel,
2002). Still, there are FGCSs who do not receive adequate support from family, and this can
result in increased stress levels. College students with a strong belief in their ability to
successfully perform in an academic setting tend to experience higher levels of psychological
well-being and less anxiety (Chemers, Hu, & Garcia, 2001). However, FGCSs encounter more
academic challenges than their non-FGCS counterparts (Horn & Nunez, 2000). Wang and
Castañeda-Sound (2008) found that FGCSs report lower levels in their confidence to succeed
academically, negatively affecting these students’ overall psychological well-being. Wang and
Castañeda-Sound (2008) also found that the greatest predictor of students’ psychological well-
being is high self-esteem, indicating higher levels of life satisfaction, lower levels of stress, and
fewer psychological symptoms.
One factor that may be detrimental to the success of FGCSs is the lack of social capital
that most FGCSs experience. Social capital can be defined as access to knowledge, resources,
and leisure activities through social networks, and this can be highly beneficial to both the
academic and social decision-making process while enrolled in college (Pascarella, Pierson,
Wolniak, & Terenzini, 2004). Given this absence of social support and helpful resources,
FGCSs encounter more challenges navigating the university setting, thus prohibiting full
engagement in their academic pursuits (Soria & Stebleton, 2012). Newby-Fraser and Schlebusch
(1997) found that in students, perceived absence of social support is associated with higher stress
and lower academic performance.
FGCSs display less engagement in the postsecondary setting, both academically and
socially. They tend to be less confident in their academics and are less likely to seek help from
university faculty (Jenkins, Miyazaki, & Janosik, 2009) and may lose opportunities to pursue
13
mentoring relationships with older students and faculty within their institutions. FGCSs also
report more confusion regarding faculty’s expectations for assignments (Collier & Morgan,
2008). The lack of engagement results in the isolation and disconnection of FGCSs from their
institutions, particularly those enrolled in large research universities (Kim, 2009). A study by
Soria and Stebleton (2012) found that retention rates are lower in FGCSs as compared to non-
FGCSs. Soria and Stebleton (2012) also found that even when controlling for demographic,
academic, and social factors, FGCSs reported significantly lower academic engagement,
concluding that FGCS status lowers students’ social capital, thus decreasing these students’
academic engagement.
First-year Students Enrolled in Postsecondary Institutions. The stress experienced
and the relatively low availability of social capital while adjusting to postsecondary academic
life is particularly damaging in FGCSs; first year students’ initial experiences at an institution
ultimately influence their ability to be successful (Soria & Stebleton, 2012). Phinney and Haas
(2003) found that first-year FGCSs identified time conflicts, academic pressure, and family
difficulties as major stressors; it was found that seeking support is the most successful coping
strategy for first-year FGCSs. Accordingly, a lack of social support during FGCS first year of
college was associated with less successful coping (Phinney & Haas, 2003). Chemers et al.
(2001) stated that social support is related to academic success, specifically in the area of
adjustment.
Stress and Anxiety in Low Socio-Economic Status
Young Adults (General U.S. Population). Consistently positive relationships have
been established between low-SES status and psychiatric disorders (Hudson, 2005). Individuals
in lower social classes are exposed to more stressful experiences than those who are in a higher
14
social class (Wolff, Santiago, & Wadsworth, 2009). Stress is more psychologically damaging to
individuals within lower social classes because this population has limited access to social
relationships and other resources that could be helpful in stress-inducing situations (Wolff et al.,
2009). Kinnier, Hofsess, Pongratz, and Lambert (2009) found that perceiving oneself’s situation
as hopeless is prevalent in individuals with anxiety disorders. Chronic exposure to stress
promotes the development of anxiety symptoms (Hammen, Kim, Eberhart, & Brennan, 2009),
and poor youth and adults experience chronically stressful living conditions (Wolff, Santiago, &
Wadsworth, 2009). Palomar-Lever & Victorio-Estrada (2012) suggested that stress is a key
predictor for anxiety. Specifically, it was found that poor coping styles exhibited by individuals
in stress-inducing situations are related to anxiety (Palomar-Lever & Victorio-Estrada, 2012).
Termed poverty-related stress, multiple stressors in the lives of low-SES individuals can have
significant effects on psychological functioning (Wadsworth et al., 2008).
Chronic poverty-related stress can lead to the development of anxiety disorders (Weems,
Zakem, Costa, Cannon, & Watts, 2005). Poverty-related stress can be detrimental to the mental
health of all individuals, but younger adults tend to be more affected by this stress more than
older individuals, and this may be due to the lack of power, such as his or her family’s financial
state, that young adults are not in a position to control or change (Wolff et al., 2009). In a study
examining children and parents from low-SES families, it was found that experiencing high
levels of poverty-related stress may lead to damaging psychopathology, particularly anxiety-
related disorders (Wolff et al., 2009). Najman (2010) found that cumulative poverty across the
lifespan through adolescence has a consistent impact on young adult anxiety. It has been argued
that the linkage between low-SES living conditions and anxiety lies in individuals’ continuous
exposure to their perpetual lack of resources (Davidson et al., 2001). Younger people exposed to
15
poverty-related stress are also at greater risk because of their relative developmental
vulnerability.
Historically, women have held the primary responsibility for household duties such as
childcare, elder care, cooking, and chores; with women now being as equally involved as men in
academia and the workforce, women are struggling to find the balance between household
responsibilities and their education and/or careers (Bird, 1999). Women’s high levels of this
described responsibility for domestic work, combined with a low socioeconomic position, have
resulted in high risks of psychological distress in adult women of low-SES status (Matthews &
Powers, 2005).
One of the most commonly diagnosed psychological disorders in the socially
disadvantaged is GAD (Kessler & Wittchen, 2002). Moffitt et al. (2007) found that low-SES
living conditions during childhood are associated with the future onset of GAD. However, the
social factors involved in the etiology of GAD often go unnoticed and remain unrecognized
(Baer, Kim, & Wilkenfeld, 2012). In a study examining poor families, Baer et al. (2012) found
that poverty is positively associated with GAD, supporting the premise that the contextual factors
of stress and anxiety should be considered when studying the causes of psychologically
debilitating conditions. From this, Baer et al. (2012) suggest that the origin of anxiety in the
poor is not psychiatric but environmental.
Anxiety Symptomology in Individuals with Disabilities
Students Enrolled in Postsecondary Institutions. Understanding the impact of learning
disabilities in the postsecondary arena is essential to providing more efficient academic and
vocational support to students. Verhoof, Maurice-Stam, Heymans, and Grootenhuis (2013) found
that young adults with disabilities generally report higher levels of anxiety than those from the
16
general population. Gregg, Hoy, King, Moreland, and Jagota (1992) found that university
students with disabilities reported significant stress levels, both short-term and long term, which
can lead to anxiety disorders. Also, it was found that behaviors identified with general anxiety
are found in the personality traits of students with learning disabilities (Gregg et al., 1992).
Lastly, Gregg et al. (1992) suggested that the social isolation students experience while in the
university setting may result in generalized anxiety in subsequent years.
Students with learning disabilities represent the largest group of students with disabilities
in postsecondary institutions, and the number of students entering postsecondary institutions with
learning disabilities is steadily increasing (Trainin & Swanson, 2005). It has been found that
higher education improves employment opportunities for individuals with disabilities (Ontario
Coalition for Inclusive Education, 2002), yet students with learning disabilities are particularly
disadvantaged in the university setting (Reed, Lewis, & Lund-Lucas 2006). Manglitz, Hoy,
Gregg, King, and Moreland (1995) found that college students with learning disabilities are
highly affected by their anxiety symptomology in academic settings. It has been suggested that
when college students are anxious about performing academically, they may lack the ability to
effectively demonstrate their actual level of knowledge and skills (Weinstein & Palmer, 1990).
Specifically, Connelly, Hasher, and Zacks (1991), found that anxiety related to academic
performance may result in the reduction of memory capacity. Even after accommodations in the
academic setting were made, Fuller, Healey, Bradley, and Hall (2004) found that students with
learning disabilities still had academic disadvantages. For reasons such as these, it is imperative
that colleges and universities support students with learning disabilities not only academically,
but also psychosocially.

17
Student Support Services in Higher Education
The role of environmental social conditions in the manifestation of psychological distress
is often disregarded and underestimated (Baer et al., 2012). Anxiety is matter of concern in
social work because it brings significant distress to those affected by it (Baer et al., 2012),
specifically for individuals with disadvantaged life conditions, and in this case, the populations
of study (FGCS, low-SES, and individuals with disabilities). According to Kuh (2008),
university initiatives designed specifically for disadvantaged student populations promote
academic enhancement and social engagement, therefore supporting student retention. For
example, a study by Pancer, Pratt, Hunsberger, and Alisat (2004) found that university freshmen
who took part in a university preparation course reported higher levels of university adjustment
and had lower drop-out rates.
Through Student Support Services (SSS) programs, the U.S. federal government awards
funding to institutions of higher education to assist students with academic, social, and financial
disadvantages. SSS is one of eight federally funded grant programs that are administered as part
of the Federal TRIO Programs (TRIO) within the U.S. Department of Education SSS provides
opportunities for academic development to students of low-income status, those who are of
FGCS status, and students with registered disabilities. SSS also provides aid to students
receiving Federal Pell Grants. Support is provided by assisting students with fulfilling basic
college requirements and motivating students toward the successful completion of postsecondary
education. Specifically, SSS programs offer academic tutoring (instruction in reading, writing,
study skills, mathematics, science, and other subjects), advising in postsecondary course
selection, assistance regarding financial aid programs, aid with locating public and private
scholarships, and assistance in completing financial aid applications. Beyond assistance with

18
factors of students’ current academic setting, SSS programs provide education regarding
financial and economic literacy and guidance with the graduate and professional school
application process. Also, SSS provides students with opportunities for individualized
counseling sessions with SSS counselors regarding personal problems as well as academic and
career counseling. Last, SSS provides students with access to cultural events, academic
programs, and mentoring programs not available to the general student population, as well as
housing support during to students with no home to go to during breaks in the academic year.
The goal of SSS programs is to increase college retention and ultimately, graduation rates of its
participants. (U.S. Department of Education, 2014)
Several empirical studies have supported the success of SSS programs throughout the
U.S. When evaluating SSS programs across the nation, the U.S. Department of Education
(2010) found that participation in SSS counseling and programming during students’ freshman
year was associated with increases in student retention and degree completion. Also,
supplemental services to students (e.g. educational and cultural seminars) were also positively
associated with students’ retention and degree completion (U.S. Department of Education, 2010).
U.S. Department of Education (1997) found that best practices for SSS programs includes
programming and activities specifically geared toward students’ freshman year experience,
academic support for common freshman courses, extensive student contacts with SSS
counselors, participant recruitment and incentives, and a genuine and dedicated nature of SSS
staff. The evaluation of an SSS program at a community college showed that the most effective
practices of SSS include helping students gain career clarity, providing intensive academic
planning and monitoring, offering learning enhancements, recognizing student achievements,
and identifying resources that contribute to students’ success (Walsh & Kankakee Community
19
College, 2000). The academic, social, and psychosocial support provided to students of FGCS
status, low-SES backgrounds, and those with registered disabilities in SSS programs nation-wide
is essential to the overall academic and vocational success of these disadvantaged student
populations.

20
CHAPTER 3: METHODOLOGY
The current cross-sectional descriptive study examined stress and anxiety symptomology
in Louisiana State University’s (LSU) SSS freshman population. The participants in the study
were operationalized as university-recognized students of FGCS status, students with low-SES
status, and students with registered disabilities. The dependent variables (symptoms of stress
and anxiety) were operationalized by The Perceived Stress Scale and the Overall Anxiety
Severity And Impairment Scale. The study was approved by the LSU Institutional Review
Board.
The study was guided by the following research questions:
1. What is the level of stress reported by SSS-enrolled freshman students as indicated by scores
on the Perceived Stress Scale?
2. What is the level of anxiety reported by SSS-enrolled freshman students as indicated by scores
on the Overall Anxiety Severity and Impairment Scale?
3. To what extent do stress and anxiety scores vary by demographic variables (race, gender,
number of SSS classifications, low-income v. non-low-income, weekly work hours, and current
major)?
It is hypothesized that the more of SSS classifications an SSS-enrolled freshman student
qualifies for, the higher the stress and anxiety symptoms that students will report on the
Perceived Stress Scale and the Overall Anxiety and Impairment Scale. It is also hypothesized
that female SSS-enrolled freshmen students will report higher levels of stress and anxiety on the
Perceived Stress Scale and the Overall Anxiety and Impairment Scale than male SSS-enrolled
freshmen students.
21
Procedures
Participants were recruited through e-mails and text alerts. These messages included
information regarding eligibility requirements and the dates, times, and locations that the
measurements would be accessible to the students. Also, the messages included information
describing two participants’ chances for being randomly selected to receive on of two $20 VISA
gift card, as an incentive for students to participate in the study. The anonymous survey was
available to students via an e-mailed Survey Monkey link and was accessible for students to
complete online at their leisure for two consecutive weeks.
Sample
The procedures resulted in 55 students completing the online survey. This sample was
drawn from 96 first-year students enrolled in LSU’s SSS program. These students were of
FGCS status, low-SES status, are registered with disability, or have with two or more of these
classifications. Thus, this study’s sample included 59.29% of freshmen students utilizing SSS
for the 2014-2015 academic year. The researcher’s relationship with the participants was that of
a Master’s level social work intern assigned by the LSU School of Social Work. The researcher
served as a counselor to LSU’s SSS student population and holds the role of academic advisor,
individual appointment counselor, college success educator, and study skills course instructor.
The researcher began her placement as an intern in LSU’s SSS program at the beginning of the
2014-2015 academic year. In her capacity as SSS counselor, advisor, and instructor, she also
had personal acquaintances with all 96 freshmen students enrolled in SSS, and communicates
with them via email and office visits on a regular basis.
Sample Demographics. Four-fifths (80%) of participants were female (n=44), and one-
fifth (20%) of participants were male (n=11). Over two-fifths (43.63%) of participants identified

22
as White, followed by Black or African-American (32.72%), from multiple races (10.90%),
Asian (9.09%), and American Indian or Alaskan Native (3.63%). The mean age of participants
was 18.49, as nearly one-half of participants (50.90%) were 18 years old, and the other one-half
of participants (49.09%) were 19 years old. Of the three SSS classifications (FGCSs, low-SES
students, and students registered with disabilities), 80% reported FGCS status, 69.09% reported
low-SES, and 3.63% reported being registered with a disability. Almost half (47.27%) of
participants reported possessing only one SSS classification, while 50.90% reported possessing
two SSS classifications, and only one person reported possessing three SSS classifications.
Participants’ majors were grouped according to discipline; reported majors were as follows:
(Chemistry, Astronomy, Pre-Veterinary, Renewable Natural Resources, & Animal Science:
21.81%; Psychology, Anthropology, History, Child & Family Studies, Education, & Human
Resources: 16.36%; Pre-Nursing, Pre-Dental Hygiene, & Nutrition and Dietetics: 12.72%;
Engineering, Computer Science, & Construction Management: 12.72%; Business, Accounting,
Marketing, & Finance: 10.90%; Mass Communications & Graphic Design: 10.90%;
Kinesiology: 10.90%; Undecided: 3.63%). Lastly, 32.72% of participants reported that they do
not have either an on-campus or off-campus job, while 23.63% reported working 10 hours per
week or less, 38.18% reported working 11-20 hours per week, 3.63% reported working 21-30
hours per week, and one person reported working 31-40 hours per week.
Instruments
Perceived Stress Scale. The Perceived Stress Scale (PSS) was used to measure levels of
stress among participants. The PSS is a psychometrically sound global measure of perceived
stress, designed by Cohen (1988). It includes 10 Likert-type scale items (0=Never, 1=Almost
Never, 2=Sometimes, 3=Fairly Often, 4=Very Often) that assess the degree to which individuals
23
appraise their situations as stressful (i.e., unpredictable, uncontrollable, and overloaded in
nature). This instrument was designed for use in community samples; therefore, the items are
simple and easy to comprehend. The PSS assesses feelings and thoughts experienced during the
past month (Cohen, 1988). Total scores will range from 0-40, and higher scores indicate
increased stress. The normed score for individuals ages 18-29 is 14.2. Generally, scores 16-20
indicate stress that is moderately higher than average, and scores of 21-40 indicate stress that is
much higher than average (Cohen, Kamarck, & Mermelstein, 1983). For the PSS, Andreou et al.
(2011) found a satisfactory Cronbach’s alpha of 0.82.
Overall Anxiety Severity And Impairment Scale. The Overall Anxiety Severity And
Impairment Scale (OASIS) was used to measure levels of anxiety among participants. The
OASIS was designed by Norman and colleagues (2006). It is a brief, five-item continuous
measure used to assess anxiety disorders as well as the threshold of anxiety symptoms.
Specifically, the OASIS measures anxiety severity and related impairment. Respondents are
asked to answer items based on their experiences in the past week. Responses are measured
using a 5-point Likert scale (0=No anxiety in the past week; 1=Infrequent anxiety. Felt anxious a
few times; 2=Occasional anxiety. Felt anxious as much of the time as not. It was hard to relax;
3=Frequent anxiety. Felt anxious most of the time. It was very difficult to relax; 4=Constant
anxiety. Felt anxious all of the time and never really relaxed.) OASIS scores can range from 0-
20, and higher scores indicate greater anxiety-related severity and impairment. The first
population to be assessed by the OASIS was a group of U.S. undergraduate students, for which
the Cronbach’s alpha was 0.80. (Norman, Cissell, Means-Christensen, & Stein, 2006). A study
by Campbell-Sills et al. (2009) examined 1,036 patients with clinical anxiety and found that a
cut-score of 8 correctly identified the anxiety disorder status of 87% of the sample.

24
Data Analysis
Univariate analyses were performed to determine the mean scores on the PSS and the
OASIS. Participants’ mean scores from both instruments were compared to that of the normed
and cut-off scores for problematic stress and anxiety as reported for the respective instruments.
Bi-variate analyses were also performed to examine differences in stress and anxiety scores
among SSS classifications and demographic characteristics. To examine stress and anxiety
within the sample’s races, genders, number of SSS classifications, and low-income v. non-low-
income status, t-tests were used. A Pearson correlation was used to examine stress and anxiety
among participants’ weekly work hours, and an ANOVA was used to examine stress and anxiety
among participants’ majors.

25
CHAPTER 4: RESULTS
This study examined stress and anxiety levels among university freshmen of first
generation college student status, low-income status, and students registered with disabilities.
Descriptive statistics were used to examine the study’s research questions.
Question 1: What is the level of stress reported by SSS-enrolled freshman students as indicated
by scores on the Perceived Stress Scale?
The properties of the PSS were examined with respect to internal reliability and
normality of the distribution. The alpha coefficient obtained for the scale was .80. The PSS was
found to be normally distributed. To answer question 1, the mean and standard deviation of the
PSS was calculated. The PSS mean for the sample is 20 (sd, 6.09).
Question 2: What is the level of anxiety reported by SSS-enrolled freshman students as indicated
by scores on the Overall Anxiety Severity and Impairment Scale?
The properties of the OASIS were examined with respect to internal reliability and
normality of the distribution. The obtained alpha coefficient was .83. The OASIS was found to
be normally distributed. To answer question 2, the mean and standard deviation of the PSS was
calculated. The OASIS mean for the sample is 6.61 (sd, 3.90).
Question 3: To what extent do stress and anxiety scores vary by demographic variables (race,
gender, number of SSS classifications, low-income v. non-low-income, weekly work hours, and
current major)?
The demographic variables were analyzed in relation to both PSS and OASIS scores (see
Tables 1 and 2).

26
Table 1. Associations of Demographic Variables and PSS (T-Tests) Demographic variable
Mean Score Mean Score
Gender Male (14.36) Female (21.41) *** Race African-American (19.83) White (19.75) Income Low income (19.26) Non-low-income (21.81) Age 18 (20.79) 19 (19.19) Number SSS classifications
One (20.00) Two (20.00)
*** p<.001 Table 2. Associations of Demographic Variables and OASIS (T-Tests) Demographic variable
Mean Score Mean Score
Gender Male (3.64) Female (7.35)*** Race African-American (7.00) White (7.17) Income Low income (6.50) Non-low-income (6.81) Age 18 (6.74) 19 (6.44) Number SSS classifications
One (6.35) Two (6.93)
***p<.01
Race. The analysis of differences with respect to race was conducted by comparing
Black/African American participants and White participants only. In the comparison of
Black/African American and White participants (n=42) no significant differences were found
between the two groups for either the stress or anxiety scale.
Gender. The analysis of differences with respect to gender was conducted by comparing
male and female participants. Women of the sample had significantly higher PSS scores than
men (x̅ =7.35 v. 3.64; t=2.99, p<.01). Women reported a mean PSS score of 21.41, and men
reported a mean PSS score of 14.36. Women also had significantly higher OASIS scores than
men (x̅=21.41 v. 14.36; t=3.84, p<.01). Women reported a mean OASIS score of 7.35, and men
reported a mean OASIS score of 3.64.
27
Number of SSS classifications. The analysis of differences with respect to students’
number of SSS classifications was conducted by comparing students who qualify for only one
SSS classification to students with any two SSS classifications. There was no significant
difference in levels of anxiety or stress in students’ numbers of SSS classifications. An analysis
that compared the three SSS classifications to one another could not be conducted because a
significant number of students shared multiple SSS classifications that overlapped.
Low-income v. non-low-income. The analysis of differences with respect to income
level was conducted by comparing students that reported being from low-income households to
students that did not report being from low-income households. No significant differences
between the two groups were found on either the PSS or the OASIS.
Work hours. A Pearson correlation found that there was no significant difference
between participants who reported working an on and/or off-campus job and participants who
did not report working an on and/or off-campus job p<.1.
Major. Participants’ majors were grouped into the following areas of similar disciplines:
(Pre-Nursing/Pre-Dental Hygiene/Nutrition and Dietetics), (Engineering/Computer
Science/Construction Management), (Business/Accounting/Marketing/Finance),
(Psychology/Anthropology/History/Child & Family Studies/Education/Human Resources),
(Mass Communications/Graphic Design), (Chemistry/Astronomy/Pre-vet/Renewable Natural
Resources/Animal Science), (Kinesiology), and (Undecided); no significant differences between
students’ current majors were found.
28
CHAPTER 5: DISCUSSION AND CONCLUSION
This descriptive study sought to explore stress and anxiety symptomology among
historically disadvantaged populations within the university setting. It is well documented that
students face significant levels of stress and anxiety during their first year in higher education
settings (Hussain et al., 2013). It has also been established that young adults of low-SES and
those with disabilities face disproportionately higher amounts of stress and anxiety than young
adults in the general population (Moffitt et al., 2007; Verhoof, Maurice-Stam, Heymans, &
Grootenhuis, 2013). There is a gap in the literature, however, when examining the extent to
which stress and anxiety are prevalent in these populations among first-year students in the
higher education setting.
University freshmen that experience high levels of stress prior to beginning their higher
education studies exhibit poor levels of adjustment to university life (Pancer, Hunsberger, Pratt,
&Alisat, 2000). FGCSs tend to come from low-income households and also have more non-
academic responsibilities (Terenzini, Springer, Yaeger, Pascarella, & Nora, 1996), such as jobs
and family obligations (Phinney & Haas, 2003). Low-SES students experience highly stressful
living conditions (Wolff, Santiago, & Wadsworth, 2009); these individuals’ tendency to cope
poorly with stress can lead to severe anxiety (Palomar-Lever & Victorio-Estrada, 2012). Lastly,
college students with disabilities report significant amounts of both long-term and short-term
stress (Gregg, Hoy, King, Moreland, & Jagota, 1992). Given the inhibition that stress and
anxiety can have on individuals’ social, vocational, academic, and mental abilities, university
students of FGCS status, low-SES status, and those with disabilities have a much greater risk of
failure in higher education settings. For this reason, it is essential that colleges and universities
offer academic advising, college success training, and support services to students within these
29
disadvantaged populations. Particularly, given the findings from the current study, colleges and
universities should directly address the stress and anxiety experienced by these students.
Although researchers have examined risks to mental health within these populations (American
College Counseling Association, 2011), the present study specifically examined the presence of
stress and anxiety in first-year students of FGCS status, low-SES, and students with disabilities
within a large, state university setting.
Stress Level
Given that the PSS mean score of 20 found for this sample is just one point below the
cut-point for scores considered to be of clinical concern, it can be concluded that participants, on
average, experience high stress. This finding is clinically relevant because an overwhelming
majority of participants reported high stress, and as found by Hammen, Kim, Eberhart, and
Brennan (2009), chronic exposure to stress can lead to the development of physical and
emotional problems, including anxiety disorders.
Anxiety Level
Given that an OASIS global score of 8 or above is used to determine an anxiety
diagnosis, and the current sample reported a mean score of 6.61, it can be concluded that
participants, on average, experience anxiety symptoms. Of particular concern, 47.27% of the
sample reported anxiety scores at or above the cut-score for an anxiety disorder diagnosis. As
found by the American Psychiatric Association (2013), anxiety disorders can, minimally,
negatively impact academic performance; anxiety also causes severe physical and emotional
disturbances that may hinder individuals’ ability to function at general developmental levels.

30
Stress and Anxiety in Demographic Variables
Gender was the only demographic variable significantly associated with variation in
stress and anxiety scores. As hypothesized, female participants reported significantly higher
levels of both stress and anxiety symptoms than male participants. This finding is significant
because it has been widely established that the children of low-income households carry much of
the financial and caregiving burdens of their families, even from young ages (American
Association of University Women Educational Foundation, 2001). Particularly, female
household members of low-SES backgrounds bear the burden of significantly more household
duties than males (Matthews & Powers, 2005). This could be an indication that the women in
the sample experience these home-life burdens in addition to the stress and anxiety induced by
their university life adjustments, resulting in significantly higher stress and anxiety than the male
participants. This finding is consistent with a broad literature that has shown gender effects for
psychological distress in diverse samples over time (Harryson, Novo, & Hammarström;
Harryson, Strandh, & Hammarström, 2012).
Limitations of the Current Study
The current study is an initial investigation to identify factors contributing to the stress
and anxiety of first-year FCGSs, low-SES students, and students with disabilities in LSU’s SSS
program. Further research can expand upon these findings by addressing the limitations of this
study. More specifically, this study relies on a convenience sample within one state university of
the U.S., making it susceptible to bias. The current study did not use a random sample;
therefore, the findings cannot be generalized to other populations, but only similar students at
similar universities. Also, as a descriptive study, it has limited the researcher’s ability to draw
conclusions about the sample over students’ matriculation through their undergraduate studies.
31
It is also important to note that it is possible that the participants’ rapport with the researcher
(participants’ counselor intern) could affect the quality of data. Lastly, the relatively small
sample size and low response rate warrants even further caution when drawing conclusions about
this population of students.
The measures for the stress and anxiety symptoms in the sample also pose limitations for
the results of the study. The PSS consists of 10 items that measured stress symptomology, and
the OASIS consists of 5 items that measure anxiety symptomology. While these measures are
reliable, more in-depth measures could allow for the identification of more specific types of
stress and anxiety and also more precise severities of stress and anxiety.
Implications for Future Research
The present study examines two widely researched aspects of mental health (stress and
anxiety) within three widely researched populations (FGCSs, low-SES students, and students
with disabilities). It has looked at the presence of reported stress and anxiety within several
demographic factors of these disadvantaged student populations at only LSU, which is a large
state university. Thus, further research that examines stress and anxiety among these student
populations within a variety of higher education institutions, including private colleges and
universities, and both 2-year and 4-year institutions, should be examined. Also, further research
can examine the use of mental health resources within these student populations; plausibly,
students that utilize mental health services would report less significant levels of stress and
anxiety. Lastly, given the current finding that female participants reported significantly higher
stress and anxiety than male participants, further research should examine differences between
the stressors of male and female students from these disadvantaged student populations. It
would beneficial for future studies to examine the nature of stressors in female students; this
32
could lead to implications for addressing female students’ stress in the form of practice and also
access to helpful resources.
Implications for Policy
In addition to this study prompting further research, there are implications that can be
made for policy. Programs that provide education, social services, and mental health services to
disadvantaged student populations are often funded through external entities. SSS, a Federal
TRIO program, is federally funded grant program designed to provide both academic and social
support to university FGCSs, low-SES students, and students with disabilities (U.S. Department
of Education, 2014). Currently in the U.S., there are over 7,000 post-secondary institutions
(National Center for Education Statistics, 2013), yet the U.S. federal government has funded SSS
programs at only 1,027 institutions this academic year (U.S. Department of Education, 2014). In
2012, there were 17.7 million students enrolled in U.S. institutions of higher education (National
Center for Education Statistics, 2014), yet the U.S. federal government has allocated grant
money ($288,631,903) to serve only 202,492 students of FGCS status, low-SES status, and those
with disabilities (U.S. Department of Education, 2014). SSS programs across the U.S. serve
approximately 1.19% of the higher education student population, yet 50% of all post-secondary
students are of FGCS status, 50.9% of all post-secondary students are of low-SES, and 11% of
all post-secondary students have disabilities (American Council on Education, 2002; National
Center for Education Statistics, 2012; U.S. Department of Education, National Center for
Education Statistics, 2013). This extreme deficit in SSS program funding necessitates the U.S.
Department of Education to closely evaluate the positive social, behavioral, and academic effects
that SSS programs provide to students from these disadvantaged populations; it is consequently
33
warranted for the U.S. Department of Education to allocate significantly more funding programs
which support students from these disadvantaged populations.
Implications for Practice
While policy influences the widespread outcomes of groups, institutions, and systems,
mental health and social service professionals provide direct practice to FGCSs, low-SES
students, and students with disabilities within higher education settings. The clinically relevant
levels of stress and anxiety reported by the current sample warrants that a large emphasis be
placed on the mental health needs of university students of disadvantaged populations. It has
been established that academic support is a key component of students’ success in higher
education, but as found by this study, it is equally as vital address stress, anxiety, and other
mental health issues within these vulnerable populations. This practice can be implemented
through regular evaluations and assessments of SSS students’ mental health, mental health
counseling, educational interventions regarding mental health, stress regulation, self-care, and
organized support groups. Last, given that there is a consistent influx of female students within
higher education (NCES, 2013), combined with the significant stress and anxiety levels reported
in female participants of the current study, it may be beneficial to implement mental health
services such as counseling, group therapy, and support groups for female students of these
disadvantaged university populations.
Conclusion
Gaining knowledge regarding the mental health of disadvantaged student populations is
extremely useful in gauging and addressing students’ needs. Specifically, examining university
students’ stress and anxiety levels can aid us in identifying to what degree stress and anxiety
hinder academic performance and success. It is well known that stress and anxiety are key
34
predictors of poor academic performance and ultimately, college dropouts (Hussain, Guppy,
Robertson, & Temple, 2013). It has also been established that the successful completion of a
higher education degree increase chances of gaining stable employment and contributing back to
society, both socially and economically (College Board, 2010). Since stress and anxiety are
prevalent in such large disadvantaged post-secondary student populations, it is critical to
acknowledge these threats to academic success. It is just as critical to implement programs,
policies, and best practices to meet the mental health needs of these student populations,
consequently promoting higher education retention, academic success, attainment of bachelors
degrees, and widespread employment. It is vital, therefore, that programs such as SSS be funded
at both state and federal levels and be provided to students in higher education that qualify as
members of these disadvantaged, at-risk populations. The intimate academic and personal
counseling provided through SSS is a significant aid in students’ matriculation through the
overwhelming academic and social aspects of large college and university settings.

35
REFERENCES
American Association of University Women Educational Foundation. (2001). Si, se puede! Yes, we can: Latinas in school. Retrieved from http://history.aauw.org/files/2013/01/SiSePuede.pdf.
American College Counseling Association. (2011). National Survey of Counseling Center
Directors, 2011. Retrieved from http://collegecounseling.org/wp-content/uploads/2011-NSCCD.pdf.
American Council on Education, Center for Policy Analysis. (2002). Access & persistence:
Findings from 10 years of longitudinal research on students. Retrieved from http://inpathways.net/access.pdf.
American Psychiatric Association: Diagnostic and Statistical Manual of Mental Disorders, Fifth
Edition. Arlington, VA, American Psychiatric Association, 2013. Andreou, E., Alexopoulos, E. C., Lionis, C., Varvogli, L., Gnardellis, C., Chrousos, G. P., &
Darviri, C. (2011). Perceived Stress Scale: Reliability and validity study in Greece. International Journal of Environmental Research and Public Health, 8(8), 3287–3298.
Andrews, B. & Wilding, J.M. (2004). The relation of depression and anxiety to life-stress and
achievement in students. British Journal of Psychology, 95(4), 509–521. Anxiety and Depression Association of America. (2015). Living and thriving: Women: Facts.
Retrieved from http://www.adaa.org/living-with-anxiety/women/facts. Baer, J., Kim, M., & Wilkenfeld, B. (2012). Is it Generalized Anxiety Disorder or poverty? An
examination of poor mothers and their children. Child & Adolescent Social Work Journal, 29(4), 345–355.
Bird, C. E. (1999). Gender, household labor, and psychological distress: The impact of the
amount and division of housework. Journal of Health Social Behavior 40, 32–45. Bleske-Rechek, A., Lubinski, D., & Benbow, C. P. (2004). Meeting the educational needs of
special populations: Advanced Placement’s role in developing exceptional human capital. Psychological Science, 15(4), 217–224.
Campbell-Sills, L., Norman, S. B., Craske, M. G., Sullivan, G., Lang, A. J., Chavira, D. A.,
Bystritsky, A., Sherbourne, C., Roy-Byrne, & Stein, M. B. (2009). Validation of a brief measure of anxiety-related severity and impairment: The Overall Anxiety Severity and Impairment Scale (OASIS). Journal of Affective Disorders, 112(1-3), 92–101.
Chemers, M. M., Hu, L., & Garcia, B. F. (2001). Academic self-efficacy and first-year college
student performance and adjustment. Journal of Educational Psychology, 93(1), 55–64.

36
Cohen, S. (1988). Perceived stress in a probability sample of the United States. In S. Spacapan, S. Oskamp (Eds.), The social psychology of health (pp. 31-67). Thousand Oaks, CA, US: Sage Publications, Inc.
Cohen, S., Kamarck, T., Mermelstein, R. (1983). A global measure of perceived stress. Journal
of Health and Social Behavior, 24, 385–396. College Board. (2010). Education pays 2010: The benefits of higher education for individuals
and society. Retrieved from http://trends.collegeboard.org/sites/default/files/education-pays-2013-full-report.pdf.
College Board. (2013). First generation students: College aspirations, preparedness and
challenges. Retrieved from https://research.collegeboard.org/sites/default/files/publications/2013/8/presentation-apac-2013-first-generation-college-aspirations-preparedness-challenges.pdf.
Collier, P. J., & Morgan, D. L. (2008). ‘‘Is that paper really due today?’’: Differences in first-
generation and traditional college students’ understandings of faculty expectations. Higher Education, 55(4), 425–46.
Connelly, S. L., Hasher, L., & Zacks, R. T. (1991). Age and reading: The impact of distraction.
Psychology and Aging, 6, 533–541. Cook, L. J. (2007). Striving to help college students with mental health issues. Journal of
Psychosocial Nursing Mental Health Services, 45(4), 40–44. Davidson, S., Judd, F., Jolley, D., Hocking, B., Thompson, S., Hyland, B. (2001). Cardiovascular
risk factors for people with mental illness. Australian and New Zealand Journal of Psychiatry. 35(2), 196–202.
DeBerard, M., Spelmans, G., Julka, D. (2004). Predictors of academic achievement and retention
among college freshman. College Student Journal, 38(1), 355–371. Educational Testing Service. (2008). Access to success: Patterns of Advanced Placement
participation in U.S. high schools. Retrieved from www.ets.org/Media/Research/pdf/PIC-ACCESS.pdf.
Eisenberg, D., Gollust, S., Golberstein, E., Hefner, J. (2007). Prevalence and correlates of
depression, anxiety, and suicidality among university students. American Journal of Orthopsychiatry, 77(4), 534–542.
Fuller, M., Healey, M., Bradley, A., & Hall, T. (2004). Barriers to learning: A systematic study
of the experience of disabled students at one university. Studies in Higher Education 29, 303–18.

37
Gore, F. M., Bloem, P. J., Patton, G. C., Ferguson, J., Joseph, V., Coffey, C., Sawyer, S. M., & Mathers, C. D. (2011). Global burden of disease in young people aged 10–24 years: A systematic analysis. Lancet, 377(9783), 2093–2102.
Gregg, N., Hoy, C., King, M., Moreland, C., & Jagota, M. (1992). The MMPI-2 profile of adults
with learning disabilities in university and rehabilitation settings. Journal Of Learning Disabilities, 25(6), 386–395.
Hammen, C., Kim, E. Y., Eberhart, N. K. & Brennan, P. A. (2009). Chronic and acute stress and
the prediction of major depression in women. Depression and Anxiety, 26, 718–723. Harryson, L., Novo, M., & Hammarström, A. (2012). Is gender inequality in the domestic
sphere associated with psychological distress among women and men? Results from the Northern Swedish Cohort. Journal of Epidemiology and Community Health 66: 271–276.
Harryson, L., Strandh, M., & Hammarström, A. (2012). Domestic Work and Psychological
Distress-What Is the Importance of Relative Socioeconomic Position and Gender Inequality in the Couple Relationship?. Plos ONE, 7(6), 1–7.
Hertel, J. B. (2002). College student generational status: Similarities, differences, and factors in
college adjustment. The Psychological Record, 52(1), 3–18. Higher Education Research Institute, University of California, Los Angeles (2007). First in my
family: A profile of first-generation college students at four-year institutions since 1971. Retrieved from http://www.heri.ucla.edu/PDFs/pubs/TFS/Special/Monographs/FirstInMyFamily.pdf.
Horn, L., & Nunez, A. (2000). Mapping the road to college: First generation students' math track
planning strategies and context of support. Education Statistics Quarterly, 2, 81–86. Hudson, C. G. (2005). Socioeconomic status and mental illness: Tests of the social causation and
selection hypothesis. American Journal of Orthopsychiatry, 75(1), 3–18. Hussain, R., Guppy, M., Robertson, S., & Temple, E. (2013). Physical and mental health
perspectives of first year undergraduate rural university students. BMC Public Health, 13(1), 1–11.
Institute of Education Sciences, National Center for Special Education Research. (2010).
Comparisons across time of the outcomes of youth with disabilities up to 4 years after high school. Retrieved from http://ies.ed.gov/ncser/pubs/20103008/.
Institute of Education Sciences, National Center for Special Education Research. (2011). The
Post- High School Outcomes of Young Adults With Disabilities up to 6 Years After High School. Retrieved from http://ies.ed.gov/ncser/pubs/20113004/pdf/20113004.pdf.
38
Jenkins, A. L., Miyazaki, Y., & Janosik, S. M. (2009). Predictors that distinguish first- generation college students from non-first generation college students. Journal of Multicultural, Gender, and Minority Studies 3(1), 1–9.
Kessler, R. C., & Wittchen, H. U. (2002). Patterns and correlates of generalized anxiety disorder
in community samples. Journal of Clinical Psychiatry, 63(8), 4–10. Kim, E. (2009). Navigating college life: The role of student networks in first year adaptation
college adaptation experience of minority immigrant students. Journal of the First Year Experience and Students in Transition, 21(2), 9–34.
Kinnier, R. T., Hofsess, C., Pongratz, R. & Lambert, C. (2009). Attributions and affirmations for
overcoming anxiety and depression. Psychology and Psychotherapy: Theory, Research and Practice, 82(2), 153–169.
Kuh, G. D. (2008). High-impact educational practices: What they are, who has access to them,
and why they matter. Washington, DC: Association of American Colleges and Universities.
Manglitz, E., Hoy, C., Gregg, N., King, M., & Moreland, C. (1995). The relationship of
depression and anxiety to ability and achievement in adults with learning disabilities at a university and rehabilitation setting. Assessment in Rehabilitation and Exceptionality, 2, 163–178.
Maslow, G. R., Haydon, A., McRee, A. L., Ford, C. A., & Halpern, C. T. (2011). Growing up
with a chronic illness: Social success, educational/vocational distress. Journal of Adolescent Health, 49, 206–212.
Matthews, S. & Power, C. (2002). Socio-economic gradients in psychological distress: a focus
on women, social roles and work-home characteristics. Social Science and Medicine, 54, 799–810.
Moffitt, T. E., Avshalom, C., Harrington, H., Milne, B. J., Melchior, M., Goldberg, D., &
Poulton, R. (2007). Generalized anxiety disorder and depression: Childhood risk factors in a birth cohort followed to age 32. Psychological Medicine, 37(3), 441–452.
Najman, J. M., Mohammad R., F., Hayatbakhsh, Clavarino, A., Bor, W., O'Callaghan, M. J., &
Williams, G. M. (2010). Family poverty over the early life course and recurrent adolescent and young adult anxiety and depression: A longitudinal study. American Journal Of Public Health, 100(9), 1719–1723.
National Center for Education Statistics. (2004). The Condition of Education 2004. Retrieved
from http://nces.ed.gov/pubs2004/2004077.pdf. National Center for Education Statistics. (2005). The condition of education 2005. Retrieved
from http://nces.ed.gov/pubs2005/2005094.pdf.
39
National Center for Education Statistics. (2008). Community colleges: Special supplement to the condition of education. Retrieved from http://nces.ed.gov/pubs2008/2008033.pdf.
National Center for Education Statistics. (2010). The condition of education 2010. Retrieved
from http://nces.ed.gov/pubs2010/2010028.pdf. National Center for Education Statistics. (2012). Digest of Educational Statistics. Retrieved from
http://nces.ed.gov/pubsearch/pubsinfo.asp?pubid=2014015. National Center for Education Statistics. (2013). Digest of Education Statistics, 2012. Retrieved
from http://nces.ed.gov/programs/digest/d12/tables/dt12_269.asp. National Center for Education Statistics. (2013). Digest of Education Statistics, 2012. Retrieved
from http://nces.ed.gov/pubs2014/2014015.pdf. National Center for Education Statistics. (2014). The condition of education. Retrieved from
http://nces.ed.gov/programs/coe/indicator_cha.asp. National Longitudinal Transition Study 2. (2004). Transition planning for students with
disabilities: A Special Topic Report of Findings from the National Longitudinal Transition Study-2 (NLTS2). Retrieved from http://www.nlts2.org/reports/2004_11/nlts2_report_2004_11_execsum.pdf.
Newby-Fraser, E., & Schlebusch, L. (1997). Social support, self-efficacy and assertiveness as
mediators of student stress. Psychology: A Journal of Human Behavior, 34, 61–69. Norman, S. B., Cissell, S. H., Means-Christensen, A. J., & Stein, M. B. (2006). Development and
validation of an Overall Anxiety Severity And Impairment Scale (OASIS). Depression & Anxiety (1091-4269), 23(4), 245–249.
Ontario Coalition for Inclusive Education. (2002). Education and disability: Human rights issues
in Ontario’s education system. Retrieved from http://www.inclusive-education.ca/resources/documents/OHRC_Presentation.pdf.
Palomar-Lever, J., & Victorio-Estrada, A. (2012). Factors that influence emotional disturbance
in adults living in extreme poverty. Scandinavian Journal Of Psychology, 53(2), 158-164. Pancer, S., Hunsberger, B., Pratt, M. W., & Alisat, S. (2000). Cognitive complexity of
expectations and adjustment to university in the first year. Journal of Adolescent Research, 15(1), 38.
Pancer, S. M., Pratt, M., Hunsberger, B., & Alisat, S. (2004). Bridging troubled waters: Helping
students make the transition from high school to university. Guidance and Counseling 19(4), 184–90.

40
Pascarella, E. T., Pierson, C. T., Wolniak, G. C., & Terenzini, P. T. (2004). First-generation college students. Journal of Higher Education, 75, 249–84.
Patel, V., Flisher, A. J., Hetrick, S., & McGorry, P. (2007). Mental health of young people: A
global public-health challenge. Lancet, 369(9569), 1302–1313. Phinney, J. S. & Haas, K. (2003). The process of coping among ethnic minority first-generation
college freshmen: A narrative approach. Journal of Social Psychology, 143(6), 707–726. Reed, M. J., Lewis, T., & Lund-Lucas, E. (2006). Student alumni and parent perspectives on
access to post-secondary education and services for students with learning disabilities: Experiences at two Ontario Universities. Higher Education Perspectives 2(3), 50–65.
Sasaki, M., & Yamasaki, K. (2007). Stress coping and the adjustment process among university
freshmen. Counselling Psychology Quarterly, 20(1), 51–67. Schur, L. (2002). The difference a job makes: the effects of employment among people with
disabilities. Journal of Economic Issues, 36, 339–347. Soria, K. M., & Stebleton, M. J. (2012). First-generation students' academic engagement and
retention. Teaching In Higher Education, 17(6), 673–685. Stam, H., Hartman, E. E., Deurloo, J. A., Groothoff, J., & Grootenhuis, M. A. (2006). Young
adult patients with a history of pediatric disease: Impact on course of life and transition into adulthood. Journal of Adolescent Health, 39(1), 4–13.
Terenzini, P. T., Springer, L., Yaeger, P. M., Pascarella, E. T., & Nora, A. (1996). First-
generation college students: Characteristics, experiences, and cognitive development. Research in Higher Education, 37(1), 1-22.
The College Board. (2009). The relationship between AP® Exam performance and college
outcomes. Retrieved from https://research.collegeboard.org/sites/default/files/publications/2012/7/researchreport-2009-4-relationship-between-ap-exam-performance-college-outcomes.pdf.
The Pell Institute for Study of Opportunity in Higher Education. (2007). Moving beyond access:
College success for low-income, first- generation students. Retrieved from http://files.eric.ed.gov/fulltext/ED504448.pdf.
Trainin, G., & Swanson, H. L. (2005). Cognition, metacognition, and achievement of college
students with learning disabilities. Learning Disability Quarterly, 28, 261–272. U.S. Department of Education. (1997). "Best Practices" in Student Support Services: A study of
five exemplary sites. Retrieved from http://knowledgecenter.completionbydesign.org/sites/default/files/50%20Muraskin%20Best%20Practices%201997.pdf.
41
U.S. Department of Education. (1999). Answers in the tool box: Academic intensity, attendance patterns, and bachelor’s degree attainment. Retrieved from https://www2.ed.gov/pubs/Toolbox/toolbox.html.
U.S. Department of Education. (2006). The toolbox revisited: paths to degree completion from
high school through college. Retrieved from https://www2.ed.gov/rschstat/research/pubs/toolboxrevisit/toolbox.pdf.
U.S. Department of Education. (2010). National evaluation of student support services:
Examination of student outcomes after six years, final report. Retrieved from https://www2.ed.gov/rschstat/eval/highered/student-support/final-report.pdf.
U.S. Department of Education (2014). Student Support Services Program. Retrieved from
http://www2.ed.gov/programs/triostudsupp/index.html. Verhoof, E., Maurice-Stam, H., Heymans, H., & Grootenhuis, M. (2013). Health-related quality
of life, anxiety and depression in young adults with disability benefits due to childhood-onset somatic conditions. Child & Adolescent Psychiatry & Mental Health, 7(1), 1–9.
Wadsworth, M.E., Raviv, T., Reinhard, C., Wolff, B., Santiago, C.D., & Schachter, L. (2008).
Indirect effects model of the association between poverty and child functioning: The role of children’s poverty-related stress. Journal of Loss and Trauma, 13(2/3), 156-185.
Walsh, J., & Kankakee Community College, IL. (2000). Unique and Effective Practices for
TRIO Student Support Services Programs. Wang, C. C., & Castañeda-Sound, C. (2008). The role of generational status, self-esteem,
academic self-efficacy, and perceived social support in college students' psychological well-being. Journal of College Counseling, 11(2), 101–118.
Weems, C. F., Zakem, A. H., Costa, N. M., Cannon, M. F., & Watts, S. E. (2005). Physiological
response and childhood anxiety: Association with symptoms of anxiety disorders and cognitive bias. Journal of Clinical Child and Adolescent Psychology, 34(4), 712–723.
Weinstein, C. E., & Palmer, D. R. (1990). LASSI-HS user’s manual. Clear- water, FL: H & H
Publishing Company. Winn, S. & Hay, I. (2009). Transition from school for youths with a disability: Issues and
challenges. Disability & Society, 24(1), 103–115. Wolff, B. C., Santiago, C., & Wadsworth, M. E. (2009). Poverty and involuntary engagement
stress responses: examining the link to anxiety and aggression within low-income families. Anxiety, Stress & Coping, 22(3), 309–325.
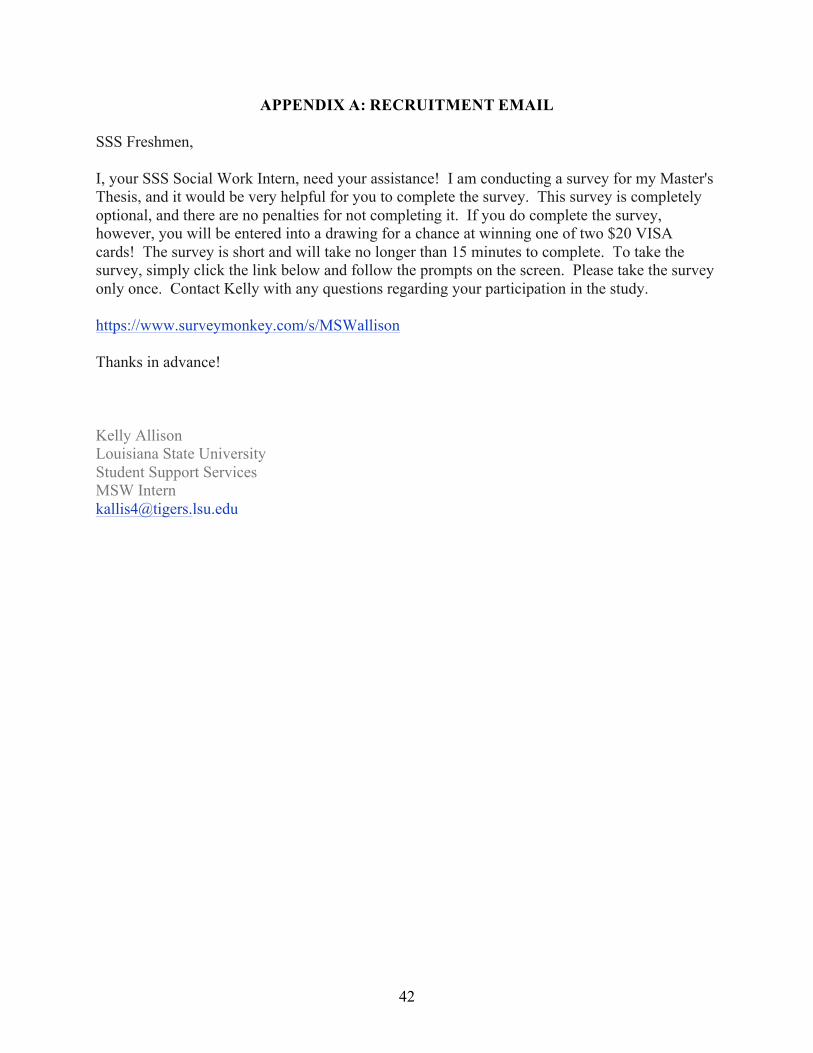
42
APPENDIX A: RECRUITMENT EMAIL
SSS Freshmen, I, your SSS Social Work Intern, need your assistance! I am conducting a survey for my Master's Thesis, and it would be very helpful for you to complete the survey. This survey is completely optional, and there are no penalties for not completing it. If you do complete the survey, however, you will be entered into a drawing for a chance at winning one of two $20 VISA cards! The survey is short and will take no longer than 15 minutes to complete. To take the survey, simply click the link below and follow the prompts on the screen. Please take the survey only once. Contact Kelly with any questions regarding your participation in the study. https://www.surveymonkey.com/s/MSWallison Thanks in advance! Kelly Allison Louisiana State University Student Support Services MSW Intern [email protected]
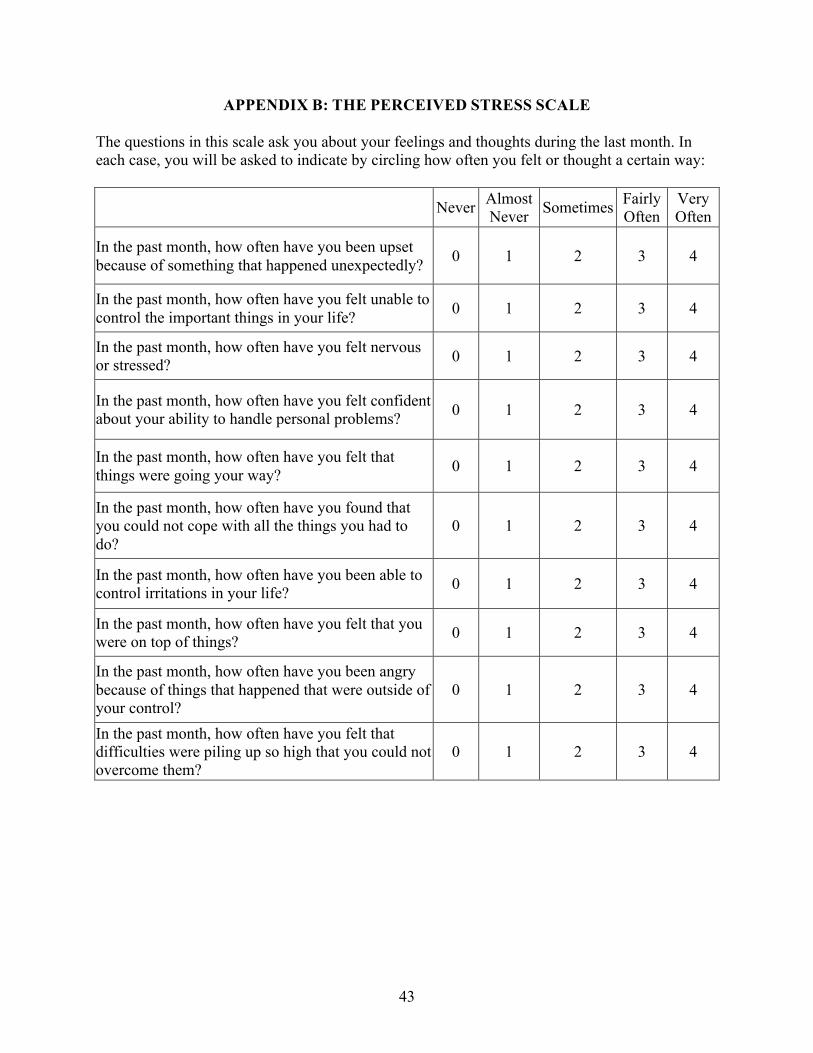
43
APPENDIX B: THE PERCEIVED STRESS SCALE
The questions in this scale ask you about your feelings and thoughts during the last month. In each case, you will be asked to indicate by circling how often you felt or thought a certain way:
Never Almost Never Sometimes Fairly
Often Very Often
In the past month, how often have you been upset because of something that happened unexpectedly? 0 1 2 3 4
In the past month, how often have you felt unable to control the important things in your life? 0 1 2 3 4
In the past month, how often have you felt nervous or stressed? 0 1 2 3 4
In the past month, how often have you felt confident about your ability to handle personal problems? 0 1 2 3 4
In the past month, how often have you felt that things were going your way? 0 1 2 3 4
In the past month, how often have you found that you could not cope with all the things you had to do?
0 1 2 3 4
In the past month, how often have you been able to control irritations in your life? 0 1 2 3 4
In the past month, how often have you felt that you were on top of things? 0 1 2 3 4
In the past month, how often have you been angry because of things that happened that were outside of your control?
0 1 2 3 4
In the past month, how often have you felt that difficulties were piling up so high that you could not overcome them?
0 1 2 3 4
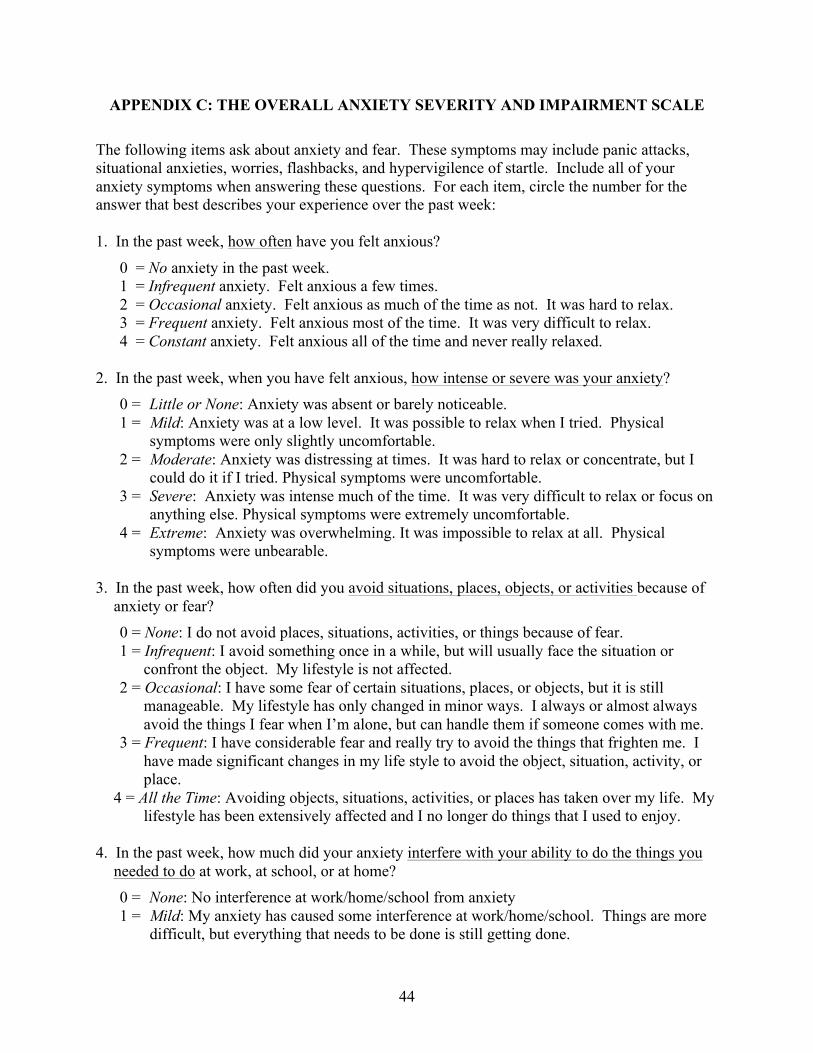
44
APPENDIX C: THE OVERALL ANXIETY SEVERITY AND IMPAIRMENT SCALE
The following items ask about anxiety and fear. These symptoms may include panic attacks, situational anxieties, worries, flashbacks, and hypervigilence of startle. Include all of your anxiety symptoms when answering these questions. For each item, circle the number for the answer that best describes your experience over the past week: 1. In the past week, how often have you felt anxious?
0 = No anxiety in the past week. 1 = Infrequent anxiety. Felt anxious a few times. 2 = Occasional anxiety. Felt anxious as much of the time as not. It was hard to relax. 3 = Frequent anxiety. Felt anxious most of the time. It was very difficult to relax. 4 = Constant anxiety. Felt anxious all of the time and never really relaxed.
2. In the past week, when you have felt anxious, how intense or severe was your anxiety?
0 = Little or None: Anxiety was absent or barely noticeable. 1 = Mild: Anxiety was at a low level. It was possible to relax when I tried. Physical
symptoms were only slightly uncomfortable. 2 = Moderate: Anxiety was distressing at times. It was hard to relax or concentrate, but I
could do it if I tried. Physical symptoms were uncomfortable. 3 = Severe: Anxiety was intense much of the time. It was very difficult to relax or focus on
anything else. Physical symptoms were extremely uncomfortable. 4 = Extreme: Anxiety was overwhelming. It was impossible to relax at all. Physical
symptoms were unbearable. 3. In the past week, how often did you avoid situations, places, objects, or activities because of
anxiety or fear? 0 = None: I do not avoid places, situations, activities, or things because of fear. 1 = Infrequent: I avoid something once in a while, but will usually face the situation or
confront the object. My lifestyle is not affected. 2 = Occasional: I have some fear of certain situations, places, or objects, but it is still
manageable. My lifestyle has only changed in minor ways. I always or almost always avoid the things I fear when I’m alone, but can handle them if someone comes with me.
3 = Frequent: I have considerable fear and really try to avoid the things that frighten me. I have made significant changes in my life style to avoid the object, situation, activity, or place.
4 = All the Time: Avoiding objects, situations, activities, or places has taken over my life. My lifestyle has been extensively affected and I no longer do things that I used to enjoy.
4. In the past week, how much did your anxiety interfere with your ability to do the things you
needed to do at work, at school, or at home? 0 = None: No interference at work/home/school from anxiety 1 = Mild: My anxiety has caused some interference at work/home/school. Things are more
difficult, but everything that needs to be done is still getting done.
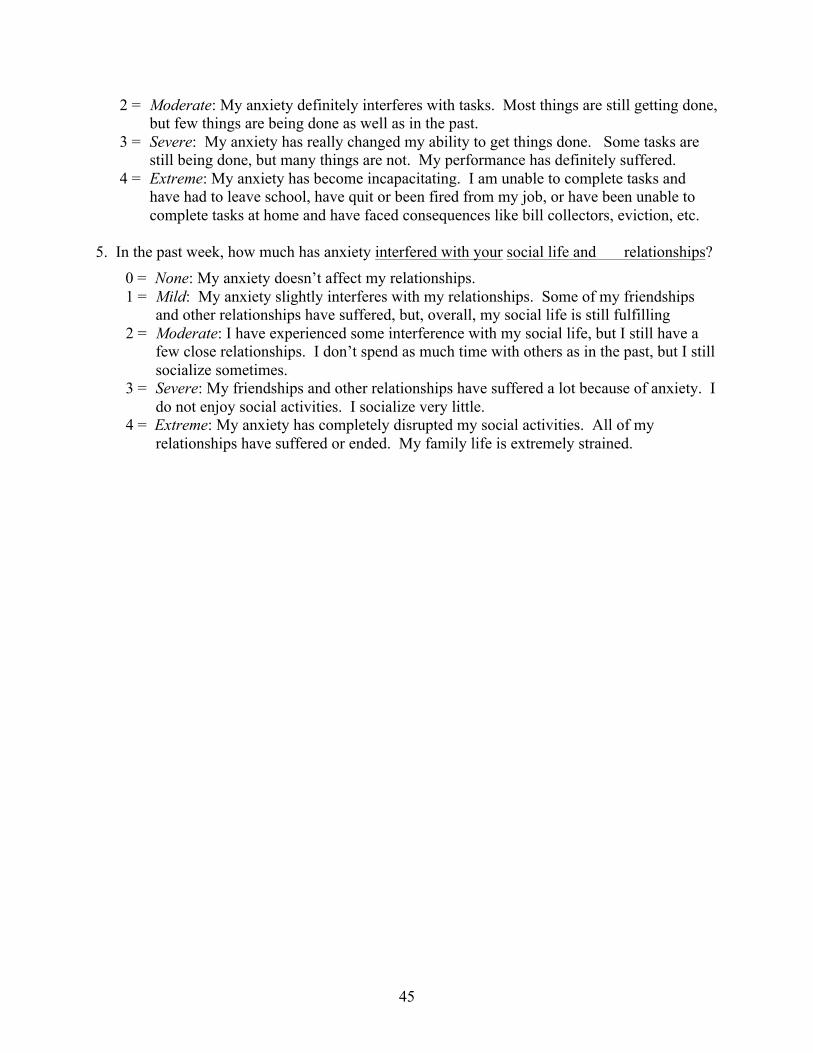
45
2 = Moderate: My anxiety definitely interferes with tasks. Most things are still getting done, but few things are being done as well as in the past.
3 = Severe: My anxiety has really changed my ability to get things done. Some tasks are still being done, but many things are not. My performance has definitely suffered.
4 = Extreme: My anxiety has become incapacitating. I am unable to complete tasks and have had to leave school, have quit or been fired from my job, or have been unable to complete tasks at home and have faced consequences like bill collectors, eviction, etc.
5. In the past week, how much has anxiety interfered with your social life and relationships?
0 = None: My anxiety doesn’t affect my relationships. 1 = Mild: My anxiety slightly interferes with my relationships. Some of my friendships
and other relationships have suffered, but, overall, my social life is still fulfilling 2 = Moderate: I have experienced some interference with my social life, but I still have a
few close relationships. I don’t spend as much time with others as in the past, but I still socialize sometimes.
3 = Severe: My friendships and other relationships have suffered a lot because of anxiety. I do not enjoy social activities. I socialize very little.
4 = Extreme: My anxiety has completely disrupted my social activities. All of my relationships have suffered or ended. My family life is extremely strained.

46
APPENDIX D: LSU IRB APPROVAL
47
VITA
Kelly Allison received her Bachelor of Science in Psychology from Xavier University of
Louisiana and is currently a candidate for her Master of Social Work (MSW) degree from
Louisiana State University. While pursuing her MSW for the past two years, Kelly interned at
Discovery Family Resource Project, a child safety and well-being facility in the Department of
Health and Human Sciences at Southeastern Louisiana University, and Louisiana State
University’s Student Support Services, a federal TRIO program. These internships have
provided her with skills in the areas of educational interventions and goal-planning for adults that
required parenting education and also university students facing personal, social, developmental,
and economic disadvantages. Upon completion of her MSW, Kelly plans to pursue a career
Human Resources, particularly in the area of diversity and inclusion. She hopes to combine her
knowledge and skills surrounding individuals and groups to promote diversity and favorable
work climates in corporate settings.