strengthening techniques in reinforced concrete hollow core 4/issue 8/ijeit1412201502_26.pdf ·...
TRANSCRIPT

ISSN: 2277-3754
ISO 9001:2008 Certified International Journal of Engineering and Innovative Technology (IJEIT)
Volume 4, Issue 8, February 2015
159
Strengthening Techniques in Reinforced Concrete
Hollow Core Amr A. Gamal
Associate Professor, Department of Civil Engineering, Shoubra Faculty of Engineering, BENHA University,
Cairo, Egypt Abstract-Continuous rise in the prices of steel reinforcement
and cement leads, to the search for ways to reduce the weight
of the concrete. This reflects on the total cost of the
construction project. This also has a significant effect on
environmental problems caused by use of huge amounts of
cement and steel. In this study we focused on several
strengthening techniques for hollow core using polypropylene
pipe, polypropylene pipe in addition to silica fume added to the
concrete matrix, polypropylene pipe coated with a layer of
epoxy resin, polypropylene pipe with both silica fume and
epoxy resin and steel pipes in addition to silica fume and
epoxy resin .The of steel reinforcement using Ø6mm, Ø8mm
andØ10mm to further enhance the concrete matrix was also
considered in this study. Investigation of the physical and
mechanical properties of standard concrete cubes and beams
was considered in this study. In addition to that scanning
electron microscope investigation and Energy Dispersive X-
ray Analyses were also considered.
Index terms- Hollow core strengthening, polypropylene in
concrete, steel pipes in concrete, Silica fume in concrete.
I. INTRODUCTION
Several researches studies focused on reducing the
bulk density of concrete, by making a hollow core in
concrete columns wrapped with using fiber (FRP)
reinforcement. [1], [2], [3]. Other research studies
focused on the effect of hollow core on the behavior of
reinforced concrete slabs. [4]- [7]. More work was
performed on the performance of hollow in pre-stressed
concrete sections. [8], [9], [10].Others focused on design
parameters in hollow core [11], [12], [13]. Their main
aim was to produce a light weight concrete section, and to
reduce steel reinforcement as well as the cement and
aggregate quantities in the concrete slabs and beams.
The aim of this study was to reduce the bulk weight of
concrete and enhance the performance of hollow core
slabs, through internal strengthening of (3 inch) hollow
core in concrete cubes and beams. To achieve this goal,
variable strengthening techniques using 3 inch
polypropylene pipes, poly propylene pipes with epoxy
resin as well as steel hollow core were considered in this
study. The effect of silica fumes in hollow core concrete
cubes and beams was also considered in this study.
Variable steel reinforcement diameters were considered
in this study. The test program also included, studying the
effect of variable diameters of the steel reinforcement of
(6 mm, 8 mm, and 10 mm) in hollow core concrete cubes
and beams. Scanning Electron microscope (SEM) and
Energy Dispersive X-ray Analyses (EDX) were also
conducted in this study at the inter-phase between the
hollow core membrane and the concrete matrix with and
without epoxy.
II. TESTING PROGRAM
The experimental program focused on the effect of
variable strengthening techniques of hollow core in
concrete cubes and beams using (3 inch polypropylene
and 3 inch steel pipe). The effect of using variable
diameters of the steel reinforcement, (6 mm, 8 mm, and
10 mm) in concrete hollow core cubes and beams was
also considered. The effect of silica fumes, in hollow core
concrete cubes and beams on the absorption capacity and
relative density were performed according to ASTM
standards [14], [15]. And mechanical properties of
concrete, was also investigated. To achieve this goal,
Small scale standard concrete cubes (15 x 15 x 15) cm
and standard concrete beams (10 x 10 x 50) cm were used
in this testing program. Table (1) shows concrete mix
proportions used in the testing program.
The testing program was classified into four main
groups. See Chart (1). The first group was composed of
solid concrete cubes and beams without reinforcement G
(1-1). G (1-2) was composed of hollow core concrete
cubes and beams using polypropylene pipe (3 inch)
diameter, G (1-3) contains polypropylene pipes with
silica fume, meanwhile G (1-4) contains polypropylene
pipes with epoxy. Subgroup G (1-5) contains
polypropylene pipes with epoxy and silica fume, and G
(1-6) contains silica fume, epoxy and a steel pipe (3inch)
diameter. See Fig (1).
The second group G (2) with steel reinforcement 6mm
was further classified into five subgroups. See Fig (2). G
(2-1) using polypropylene pipe (3 inch) diameter. See Fig
(3, 4). G(2-2) polypropylene pipe and silica fume, G(2-3)
polypropylene pipe with epoxy, G(2-4) polypropylene
pipe with epoxy and silica fume, G(2-5) polypropylene
pipe with epoxy and silica and a steel pipe (3inch)
diameter. See Fig (5). Concrete specimens in group three
G(3) using 8mm reinforcement steel was further
classified into G(3-1) using polypropylene pipe (3 inch)
diameter, G(3-2) polypropylene pipe and silica fume,
G(3-3) polypropylene pipe with epoxy, G(3-4)
polypropylene pipe with epoxy and silica fume, G(3-5)
polypropylene pipes with epoxy, silica fume and a steel
pipe (3inch) diameter . All specimens were subjected to

ISSN: 2277-3754
ISO 9001:2008 Certified International Journal of Engineering and Innovative Technology (IJEIT)
Volume 4, Issue 8, February 2015
160
the same curing and storage conditions See Figs. (6,
7).Finally standard concrete cubes and beams used in
group four G (4) with 10 mm steel reinforcement. See Fig
(8), were further classified into G (4-1) using
polypropylene pipe (3 inch) diameter, G (4-2)
polypropylene pipe with silica fume, G (4-3)
polypropylene pipe with epoxy, G (4-4) polypropylene
pipe with epoxy and silica fume, G (4-5) polypropylene
pipe with epoxy and silica fume and a steel pipe (3inch)
diameter. All results were compared to reference
specimens G1-1 and G1-2. See Chart (1). As shown in
Figs (9, 10), Concrete beams exhibited flexural modes of
failure, during the testing program. Introduction of
Reinforcement steel resulted in a shift in the mode of
failure to a shear mode. See Figs (11).
Table (1) The Main Quantities Mix Designs For 1m3
Fig (1) Schematic diagram showing showing detailed hollow core section
Fig (2) Reinforcement steel before placing Fig (3) Reinforcement steel and Polypropylene pipe
Mix Quantity(kg/m3)
Water 220
Cement 400
Sand 800
Gravel 1600
15
c
m
Poly. Hollow Core Cube
2.5 7.62cm 1.19 1.19cm
a=15 cm
bw
Epoxy
Hollow Core Cube
Polypropylene
tube

ISSN: 2277-3754
ISO 9001:2008 Certified International Journal of Engineering and Innovative Technology (IJEIT)
Volume 4, Issue 8, February 2015
161
Chart (1) Flow chart for Testing Program
W/C=0.55
Cement Content=400kg/m3
Hollow Core
Without
Reinforced
Steel (G1)
With
Reinforced
Steel
Poly. (G1-2)
Poly. +Silica
Fume 10 %
(G1-3)
Poly. +Silica
Fume
10%+Epoxy
(G1-5)
Ø6 (G2)
4bars
Ø8 (G3)
4bars Ø10 (G4)
4bars
Poly. (G2-1)
Poly. +silica
fume 10%
(G2-2)
Poly. +Silica
Fume 10%
+Epoxy
(G2-4)
Poly. +Epoxy
(G1-4)
Poly. +Epoxy
(G2-3)
Steel pipe
+Silica
Fume
10%+Epoxy
(G2-5)
Poly. (G3-1) Poly. (G4-1)
Poly. +silica
fume 10%
(G3-2)
Poly. +silica
fume 10%
(G4-2)
Poly. +Epoxy
(G3-3)
Poly. +Epoxy
(G4-3)
Poly. +Silica
Fume 10%+
Epoxy
(G3-4)
Poly. +Silica
Fume 10%+
Epoxy
(G4-4)
Steel pipe
+Silica
Fume 10%
+Epoxy
(G3-5)
Steel pipe
+Silica
Fume 10%
+Epoxy
(G4-5)
Solid G (1-1)
Steel pipe
+Silica
Fume
10%+Epoxy
(G1-6)

ISSN: 2277-3754
ISO 9001:2008 Certified International Journal of Engineering and Innovative Technology (IJEIT)
Volume 4, Issue 8, February 2015
162
Fig (4) Concrete Cube during and after Casting Fig (5) Steel pipe in concrete Cube before Casting.
Fig (6) Concrete cubes during Curing. Fig (7) Polypropylene and Steel Hollow Core after curing
Fig (8) Reinforcement steel and Polypropylene Pipe in Beam before casting

ISSN: 2277-3754
ISO 9001:2008 Certified International Journal of Engineering and Innovative Technology (IJEIT)
Volume 4, Issue 8, February 2015
163
Fig (9) Flexural failure in Hollow core beam without Reinforcement steel.
Fig (10) Flexural Failure in Reference Beam.
Fig (11) Shear Failure in Polypropylene Hollow Core Beam with Reinforcement steel and Stirrups.
III. RESULTS AND DISCUSSION
A. Bulk Density & Moisture Content
The General trend in concrete cubes in Group 1
(without reinforcement steel) indicates that, the Bulk
Density was 2199.4 Kg/m3 for G (1-1) (Reference
concrete cube).In Group (1-2) (concrete cube with
Polypropylene pipe) the bulk Density showed a decrease
by 19.3% with respect to the reference specimen. This
was attributed to the existence of a Polypropylene Hollow
Core creating a void in the concrete and resulting in
reduction in the Bulk Density corresponding to the
occupied volume of the hollow core.
For Group (1-3) (concrete cube with Polypropylene
Pipe + Silica Fume) a decrease was encountered with
respect to the Reference specimen in Group (1-1) by
18.5% due to the existence of Polypropylene pipe. On the
other hand an increase in the Bulk Density by 1.0%
compared to Group (1-2) was registered. This was due to
the addition of Silica Fume to the concrete mix. For
Group (1-4) (concrete cube with Polypropylene Pipe
+Epoxy) specimen, the Bulk Density was 1834.1 Kg/m3
lower than Group (1-1) by 16.6 %.See Fig. (12).

ISSN: 2277-3754
ISO 9001:2008 Certified International Journal of Engineering and Innovative Technology (IJEIT)
Volume 4, Issue 8, February 2015
164
For Group (1-5) (concrete cube with Polypropylene
Pipe + Silica Fume + Epoxy), the Bulk Density in this
subgroup showed highest value among all groups with
polypropylene hollow core. Yet it showed a decrease in
Bulk Density by 16.2% compared to the Reference
concrete specimen G (1-1).
For Group (1-6) (concrete cubes with Steel Hollow
Core), the Bulk Density showed highest bulk density
values among all group with Hollow Core. This was
attributed to the existence of a steel hollow core pipe
which attributed effectively in increasing the Bulk
Density in this Group. But it was still less than that of the
Reference solid concrete cube by 2.5%.
The same trend mentioned above in Group (1) was also
noted in group (2) ,Concrete cubes with reinforced steel
Ø 6mm, ranged between -13.64% and up to +2.1% . For
group (3) reinforced steel with Ø 8mm, the bulk density
results ranged between -12.7% and up to +5.44%. finally
for group (4) concrete cubes with steel reinforcement Ø
10 mm ranged between -18.4% and up to +6.65%. See
Table (2).
In all groups the existence of a steel pipe registered
highest bulk density value among all hollow core
subgroups ranging between -2.54% and +6.65%. It should
be noted that as the diameter of steel reinforcement
increased from 6mm to 10 mm, the bulk density showed a
continuous increase, this was attributed to the
replacement of the concrete matrix with steel
reinforcement.
The moisture content ranged between 2.2 % and 5.5%.
See Table (2). It was also noted that the existence of silica
fume did not show lowest values of moisture content,
which was attributed to the fine particle size of the silica
fume of the silica fume and its high surface area, which to
some extent reduced workability. Concrete cubes with
epoxy resin in all groups showed an absorption capacity
ranging between 2.2% and 3.9%. It should also be noted
that the epoxy resin emits heat after placing which leads
to evaporation of the water from the concrete cube.
0
500
1000
1500
2000
2500
No Reinf 6 mm 8 mm 10 mm
Bu
lk d
en
sity
Kg
/cm
2
Reinforcement Steel
Refrence
Poly holow core
Poly holow core with Silica
fume
Poly hollow core with epoxy
Poly hollow core with Silica
and epoxy
Poly hollow core with SF
epoxy & steel
Fig (12) Bulk density results for all hollow core concrete cubes
Table (2) Bulk density and Moisture content results for hollow core concrete cubes
Group
Type
Description Bulk Density
Kg/m3
Absorption
Capacity %
% of Weight
Reduction
Rebound
Number
G1-1 Reference 2199.4 3.3
0% 20.5
G1-2 Poly 1774.8 5.2
-19.3% 20.5
G1-3 Poly & Silica 1792.6 4.8
-18.5% 19.5
G1-4 Poly & Epoxy 1834.1 3.6
-16.6% 24.9
G1-5 Poly, Epoxy & Silica 1840.9 3.3
-16.2% 20.2
G1-6 Poly, Epoxy ,Silica &
Steel Hollow Core
2145.2 3.9 -2.5% 21.2

ISSN: 2277-3754
ISO 9001:2008 Certified International Journal of Engineering and Innovative Technology (IJEIT)
Volume 4, Issue 8, February 2015
165
6 mm Reinforcement
G2-1 Poly
1899.3 5.1
-13.64% 18.5
G2-2 Poly & Silica
1880 3.7
-14.5% 19.7
G2-3 Poly & Epoxy
1914.1 3.7
-12.97% 24.7
G2-4 Poly, Epoxy & Silica
1928.9 2.6
-12.29% 19.7
G2-5 Poly, Epoxy ,Silica &
Steel Hollow Core 2245.9 2.6
+2.1% 23.9
8 mm Reinforcement
G3-1 Poly
1920 4.8
-12.7% 19.1
G3-2 Poly & Silica
1951.7 4.1
-11.26% 20.57
G3-3 Poly & Epoxy
1970.4 3.6
-10.41% 24.4
G3-4 Poly, Epoxy & Silica
2023.7 2.5
-7.98% 20.8
G3-5 Poly, Epoxy ,Silica &
Steel Hollow Core 2319.1 2.3
+5.44% 24.14
10 mm Reinforce
G4-1 Poly
1794.7 5.5
-18.4% 19.3
G4-2 Poly & Silica
2002.1 3.4
-8.97% 20.2
G4-3 Poly & Epoxy
2027.6 3.8
-7.84% 23.9
G4-4 Poly, Epoxy & Silica
1993.2 3.3
-9.3% 20.2
G4-5 Poly, Epoxy ,Silica &
Steel Hollow Core 2345.8 2.2
+6.65% 23.35
B. Schmidt Hammer Test
Schmidt hammer was performed on all concrete hollow
core subgroups under same conditions. The rebound
number was measured at room temperature and in a
horizontal position.
The general trend among concrete specimens of Group
(1) hollow core without steel reinforcement indicates that
the existence of epoxy resin with the polypropylene
hollow core G (1-4) had a direct effect on increasing the
rebound number. See Fig (13). The addition of silica
fume to the epoxy resin showed further increases in the
rebound number in subgroup G (1-5). Furthermore
placing a steel pipe instead of the epoxy resin resulted in
increasing the rebound number to higher values. The
weakest performance for rebound number was registered
in subgroup G (1-2) concrete hollow core with
polypropylene tube only. The same trend was observed in
groups (2), (3) and group (4). It was evident that the
existence of epoxy resin close to the concrete surface
with its high bearing capacity 1000Kg/cm2 had a direct
effect on increasing the rebound number. It was also
noted that as the diameter of the steel reinforcement
increased from Ø 6mm in group (2) to Ø 10 mm in group
(4), there was a continuous increase in the rebound
number results. This was attributed to the high stiffness of
the steel reinforcement in the concrete cubes. The highest
rebound number values registered within each subgroup
was that of the hollow core concrete cubes with a steel
pipe which indicates the effectiveness of the steel pipe in
strengthening the hollow core. See Table (2). These
results were compatible with the compressive and
flexural strength results. It should also be noted that the
rebound number results were not very sensitive in
differentiating the relative performance within each
subgroup as incase of compressive and flexural strength
results.

ISSN: 2277-3754
ISO 9001:2008 Certified International Journal of Engineering and Innovative Technology (IJEIT)
Volume 4, Issue 8, February 2015
166
0
5
10
15
20
25
30
No Reinf 6 mm 8 mm 10 mm
Reb
ou
nd
Nu
mb
er
Group Type
Refrence
Poly holow core
Poly holow core with Silica fume
Poly hollow core with epoxy
Poly hollow core with Silica and
epoxy
Poly hollow core with SF and
epoxy & steel
Fig (13) Rebound No. For Various groups versus group type
C. Compressive Strength Test
The general trend among concrete cubes without any
reinforcement indicates that the highest compressive
strength encountered was that of Group (1-1) (Reference
Solid concrete cube without hollow core). This was
attributed to the fact that the area subjected to the applied
load was all solid. For the above mentioned cause Group
G1-2 was considered as a reference for all hollow core
concrete specimens subject to axial compression, since
the net area subjected to the applied load will more or less
be the same during investigation of the effect of other
strengthening techniques. Group (1-2) showed the lowest
compressive strength among all groups due to the
existence of a 75 mm in diameter hollow core
strengthened by a polypropylene tube. See Table (3).
Group (1-3) (concrete cubes with polypropylene Pipe +
Silica Fume) showed an increase in the compressive
strength by 199.7%, with respect to Group (1-2) which
indicates the effectiveness of the silica fume in enhancing
the performance of concrete cubes. See Fig (14).
For Group (1-4) (concrete cubes with polypropylene
Pipe + Epoxy resin) showed an increase in compressive
strength by 212.4%, with respect to Group (1-2) which
indicates the effectiveness of the epoxy resin in
enhancing the performance of concrete cubes. Group (1-
5) (concrete cubes with polypropylene Pipe + Silica Fume
+ Epoxy resin) showed an increase in compressive
strength by 215.4% , with respect to Group (1-2 ) which
was due to the combined effect of the silica fume and
epoxy resin in enhancing the performance of concrete.
Finally Group (1-6) (concrete cubes with steel hollow
core) showed the highest compressive strength among all
G1 hollow core subgroups by 270.7 % compared to G (1-
2). This was attributed to the effect of the steel tube
imbedded in the concrete instead the polypropylene
hollow core. See Fig. (14).
The same trend observed in Group one was confirmed
by the results of groups 2, 3 and 4, but with higher
compressive strength levels as the reinforcement steel
increased from Ø 6mm to Ø8 mm and up to Ø10. It was
also observed in groups 2,3 and 4 that, the weakest
performance was that of the polypropylene hollow core
concrete cubes with a gradual rise in the compressive
strength results due to introduction of silica fume and
epoxy resin. The best performance of hollow core
concrete cubes was that of subgroups with steel pipe
which ranged between 347.5% for G2-5 with Ø6 mm
reinforcement steel and up to 415.22% for G3-5 with
Ø8mm and reaching a maximum of 569.35% for G 4-5
with Ø10mm steel reinforcement.

ISSN: 2277-3754
ISO 9001:2008 Certified International Journal of Engineering and Innovative Technology (IJEIT)
Volume 4, Issue 8, February 2015
167
0
5
10
15
20
25
30
35
40
No Reinf 6 mm 8 mm 10 mm
Co
mp
ress
ive S
tren
gth
N/m
m2
Group Type
Compressive strength Refrence
Poly holow core
Poly holow core with Silica
fume
Poly hollow core with epoxy
Poly hollow core with Silica and
epoxy
Poly hollow core with SF and
epoxy & steel
Fig (14) Compressive Strength for Various groups Versus Group Type
Table (3) Compressive and Flexural Strength results for hollow core concrete cubes and beams
Group
Type
Description Compressive
Strength after
28 Days
N/mm2
%
Compression
Strength with
poly cube as a
reference
Compressive
strength on net
area N/mm2
Ultimate
Flexural failure
load
kN
% of
increase in
strength
G1-1 Reference 27.528 424.6% 27.528 38.533 0
G1-2 Poly 6.4832 0% 12.156 79.511 206.34%
G1-3 Poly & Silica 12.9464 199.7% 24.275 84.622 219.6%
G1-4 Poly & Epoxy 13.7744 212.46% 25.827 85.111 220.8%
G1-5 Poly, Epoxy & Silica 13.9648 215.4% 26.184 86.756 225.14%
G1-6 Poly, Epoxy ,Silica &
Steel H Core
17.552 270.7% 32.91 284.444 738.18%
G2-1 Poly 9.5936 147.97% 17.988 106.044 275.2%
G2-2 Poly & Silica 14.1088 217.6% 26.454 143.778 373.12%
G2-3 Poly & Epoxy 15.8464 244.4% 29.712 159.289 413.38%
G2-4 Poly, Epoxy & Silica 18.56 286.2% 34.8 175.556 455.59%
G2-5 Poly, Epoxy ,Silica &
Steel H Core
22.528 347.5% 42.24 311.911 809.46%
G3-1 Poly 9.2832 143.2% 17.406 130.133 337.77%
G3-2 Poly & Silica 14.423 222.5% 27.043 131.511 341.29%
G3-3 Poly & Epoxy 15.7024 242.2% 29.442 166.311 431.6%
G3-4 Poly, Epoxy & Silica 21.168 326.5% 39.69 170.533 442.56%
G3-5 Poly, Epoxy ,Silica &
Steel H Core
26.92 415.22% 50.475 398.756 1034.84%
G4-1 Poly 10.432 160.8% 19.56 139.022 360.7%
G4-2 Poly & Silica 15.1296 233.4% 28.368 139.333 361.59%

ISSN: 2277-3754
ISO 9001:2008 Certified International Journal of Engineering and Innovative Technology (IJEIT)
Volume 4, Issue 8, February 2015
168
G4-3 Poly & Epoxy 15.8128 243.9% 29.649 173.911 451.33%
G4-4 Poly,Epoxy & Silica 16.504 254.6% 30.945 188.711 489.73%
G4-5 Poly,Epoxy ,Silica &
Steel H Core
36.912 569.35% 69.21 455.556 1182.2%
D. Flexural Strength Test
0
50
100
150
200
250
300
350
400
450
500
No Reinf 6 mm 8 mm 10 mm
Ult
ima
te F
lex
ural F
ail
ure L
oad
(k
N)
Group Type
Refrence
Poly holow core
Poly holow core with Silica fume
Poly hollow core with epoxy
Poly hollow core with Silica and epoxy
Poly hollow core with SF and epoxy & steel
Fig (15) Ultimate flexural Failure Load For Various groups
There are two trends observed in this test. The first
trend was a local trend within each group showing that as
the strengthening techniques develops from hollow core
with polypropylene to hollow core with silica fume and
epoxy resin and steel pipe the flexural strength increases.
The second trend was a general trend indicating that as
the steel reinforcement increases from Ø 6mm to Ø
10mm, the ultimate flexural failure load showed a
continuous increase. See Fig (15). Regarding the mode
of failure, it was noted that, use of polypropylene hollow
core showed flexural modes of failure. See Fig (9, 10).
Meanwhile introduction of epoxy resin and silica fume
started to change the mode of failure in combined shear
and flexural modes of failure. Introduction of steel
reinforcement shifted the mode of failure into a shear
mode .See Fig (11).
The general trend in group (1) indicates that the lowest
flexural performance encountered among all groups was
that of group (1-1). Introduction of a polypropylene
Hollow Core in group (1-2) resulted in an increase in the
Ultimate Failure Load by 206.34% with respect to Group
(1-1) (Reference solid concrete beam) in spite of the
existence of a void in the G (1-2). Furthermore
introduction of silica fume for Group (1-3) in addition to
polypropylene pipe resulted in more increase in the
Ultimate Failure Load by 219.6% with respect to
reference specimen G (1-1).
Further enhancement of Group (1-4) by adding Epoxy
risen to the polypropylene pipe, resulted in an increase in
the Ultimate Failure Load by 220.8% with respect to the
Reference specimen Group (1-1).For Group (1-5) by
adding Epoxy resin around the polypropylene pipe in
addition to Silica Fume, resulted in an increase in the
Ultimate Failure Load by 225.14% with respect to the
Reference specimen Group (1-1). Finally For Group (1-6)
strengthening of the hollow core using polypropylene
pipe +Epoxy + Silica Fume and Steel Hollow core
resulted in an increase in the Ultimate Failure Load By
738.18% with respect to the reference specimen Group
(1-1). Meanwhile comparison of the performance of G(1-
6) using a steel hollow core with respect G(1-5) using
polypropylene hollow core shows an increase in the
ultimate failure load by 327.86%. In favor of G (1-6), this
shows the effectiveness of replacement of the
polypropylene pipe with a steel pipe. See Table (3).
The same trend observed in Group one was observed in
Group 2 using Ø 6mm as well as Group 3 Ø 8mm and
Group 4 using Ø 10mm. Although the levels of the
ultimate failure load were higher than those encountered
in group 1 and continued to show a continuous increase
as diameter of the steel reinforcement increased from Ø
6mm to Ø 10mm. For group 2 the ultimate failure load
ranged from 275.2% for G2-1 and up to 809.46% for G2-
5 with respect to G1-1. Meanwhile for Group 3, the
ultimate failure load ranged from 337.7% for G3-1 and up
to 1034.8% for G3-5. The best performance of hollow
ISSN: 2277-3754
ISO 9001:2008 Certified International Journal of Engineering and Innovative Technology (IJEIT)
Volume 4, Issue 8, February 2015
169
core concrete beams was that of concrete beams in group
4. For Group 4, the ultimate failure load ranged from
360.78% for G4-1 and up to 1182% for G4-5. See Fig
(15).
E. Scanning Electron Microscopy (SEM) and EDX
Analysis
Scanning electron microscope (SEM) model QUANTA
FEG 250 (Field Emission Gun) attached with EDX Unit
(Energy Dispersive X-ray Analyses), with accelerating
voltage30 K.V. magnification14x up to 1000000,
resolution for Gun.1n. The investigation was carried out
at the Egyptian Mineral Resources Authority Central
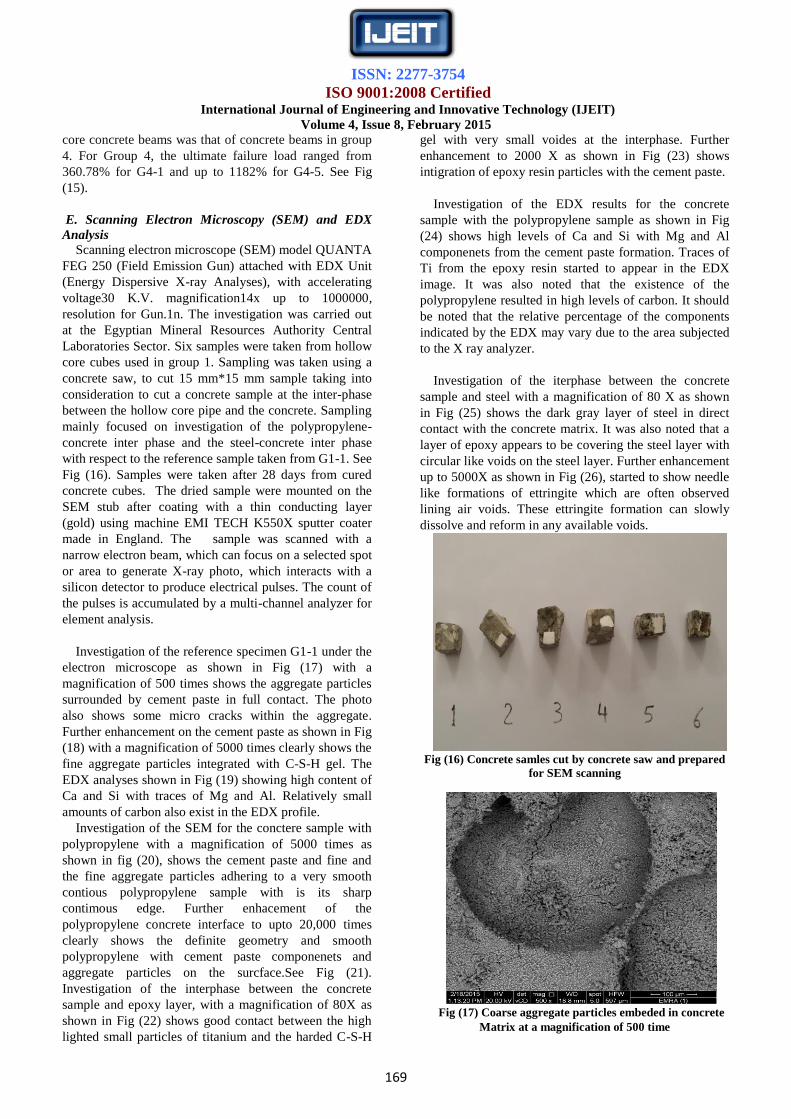
Laboratories Sector. Six samples were taken from hollow
core cubes used in group 1. Sampling was taken using a
concrete saw, to cut 15 mm*15 mm sample taking into
consideration to cut a concrete sample at the inter-phase
between the hollow core pipe and the concrete. Sampling
mainly focused on investigation of the polypropylene-
concrete inter phase and the steel-concrete inter phase
with respect to the reference sample taken from G1-1. See
Fig (16). Samples were taken after 28 days from cured
concrete cubes. The dried sample were mounted on the
SEM stub after coating with a thin conducting layer
(gold) using machine EMI TECH K550X sputter coater
made in England. The sample was scanned with a
narrow electron beam, which can focus on a selected spot
or area to generate X-ray photo, which interacts with a
silicon detector to produce electrical pulses. The count of
the pulses is accumulated by a multi-channel analyzer for
element analysis.
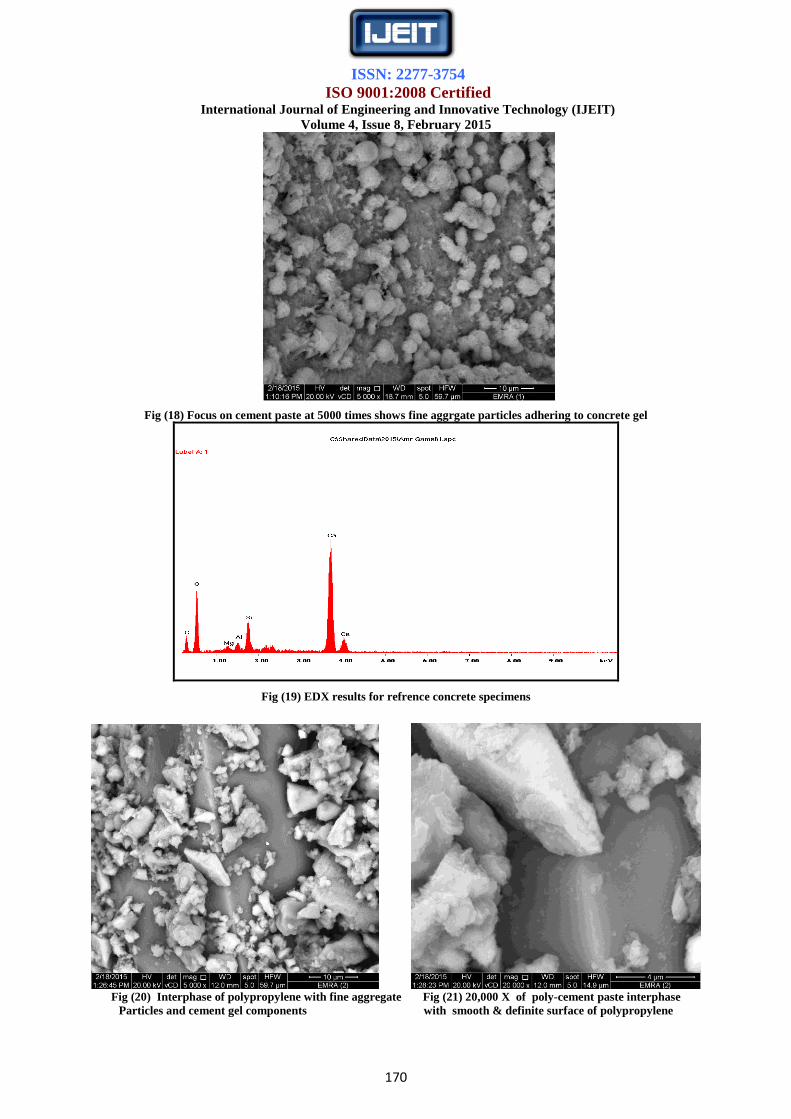
Investigation of the reference specimen G1-1 under the
electron microscope as shown in Fig (17) with a
magnification of 500 times shows the aggregate particles
surrounded by cement paste in full contact. The photo
also shows some micro cracks within the aggregate.
Further enhancement on the cement paste as shown in Fig
(18) with a magnification of 5000 times clearly shows the
fine aggregate particles integrated with C-S-H gel. The
EDX analyses shown in Fig (19) showing high content of
Ca and Si with traces of Mg and Al. Relatively small
amounts of carbon also exist in the EDX profile.
Investigation of the SEM for the conctere sample with
polypropylene with a magnification of 5000 times as
shown in fig (20), shows the cement paste and fine and
the fine aggregate particles adhering to a very smooth
contious polypropylene sample with is its sharp
contimous edge. Further enhacement of the
polypropylene concrete interface to upto 20,000 times
clearly shows the definite geometry and smooth
polypropylene with cement paste componenets and
aggregate particles on the surcface.See Fig (21).
Investigation of the interphase between the concrete
sample and epoxy layer, with a magnification of 80X as
shown in Fig (22) shows good contact between the high
lighted small particles of titanium and the harded C-S-H
gel with very small voides at the interphase. Further
enhancement to 2000 X as shown in Fig (23) shows
intigration of epoxy resin particles with the cement paste.
Investigation of the EDX results for the concrete
sample with the polypropylene sample as shown in Fig
(24) shows high levels of Ca and Si with Mg and Al
componenets from the cement paste formation. Traces of
Ti from the epoxy resin started to appear in the EDX
image. It was also noted that the existence of the
polypropylene resulted in high levels of carbon. It should
be noted that the relative percentage of the components
indicated by the EDX may vary due to the area subjected
to the X ray analyzer.
Investigation of the iterphase between the concrete
sample and steel with a magnification of 80 X as shown
in Fig (25) shows the dark gray layer of steel in direct
contact with the concrete matrix. It was also noted that a
layer of epoxy appears to be covering the steel layer with
circular like voids on the steel layer. Further enhancement
up to 5000X as shown in Fig (26), started to show needle
like formations of ettringite which are often observed
lining air voids. These ettringite formation can slowly
dissolve and reform in any available voids.
Fig (16) Concrete samles cut by concrete saw and prepared
for SEM scanning
Fig (17) Coarse aggregate particles embeded in concrete
Matrix at a magnification of 500 time
ISSN: 2277-3754
ISO 9001:2008 Certified International Journal of Engineering and Innovative Technology (IJEIT)
Volume 4, Issue 8, February 2015
170
Fig (18) Focus on cement paste at 5000 times shows fine aggrgate particles adhering to concrete gel
Fig (19) EDX results for refrence concrete specimens
Fig (20) Interphase of polypropylene with fine aggregate Fig (21) 20,000 X of poly-cement paste interphase
Particles and cement gel components with smooth & definite surface of polypropylene

ISSN: 2277-3754
ISO 9001:2008 Certified International Journal of Engineering and Innovative Technology (IJEIT)
Volume 4, Issue 8, February 2015
171
Fig (22) 80 X magnification showing epoxy layer binding Fig ( 23) Magnification of binding material at 2000 X
Cement paste with Ti particles high lighted showing highlighted Ti particles in epoxy
Fig (24) EDX results for concrete sample with polypropylene sample attached
Fig (25) Magnification 80X shows inter phase between Fig (26) magnification upto 5000 X clearly shows needle
Steel sample and cement paste like itringite components adhering to the steel surface

ISSN: 2277-3754
ISO 9001:2008 Certified International Journal of Engineering and Innovative Technology (IJEIT)
Volume 4, Issue 8, February 2015
172
Investigation of the EDX profile as shown in Fig (27)
started to show levels Fe due to the existence of a steel
interphase and in addition to the appearance of traces of
Ti from the epoxy resin, which also appeared previously
when the same epoxy was used with the polypropylene
sample. Traces of Mg, K, Al Zn in addition to the high
levels of Ca, C and Si appeared in the EDX profile.
Fig (27) EDX results for concrete-Steel interphase showing levels of Fe with concrete and ittringite components
IV. CONCLUSION
In this section we will conclude the main points
encountered from the above mentioned study, regarding
the effect of the variable Hollow core strengthening
techniques compared to the Reference Concrete
Specimen without Hollow Core.
1-Use of polypropylene hollow core showed flexural
modes of failure, meanwhile introduction of epoxy resin
and silica fume started to change the mode of failure in
combined shear and flexural modes of failure.
Introduction of steel reinforcement shifted the mode of
failure into a shear mode.
2- For concrete specimens with Polypropylene Hollow
Core, it was noted that existence of Hollow Core reduced
the Bulk Density by up to 19.3 % with respect to the
Reference Specimen.
3- Addition of Silica Fume and Epoxy improved the
Compressive Strength by up to 215.4% with respect to
Polypropylene hollow core cubes.
4- Introduction of steel pipes improved the
compressive strength by 270.7 % compared to
Polypropylene Hollow core cubes.
5- Addition of steel reinforcement showed a
continuous increase in the compressive strength up to
569.35% compared to polypropylene hollow core cubes
using Ø 10mm steel reinforcement.
6- Addition of Silica Fume and Epoxy improved the
Flexural strength by 225.14% compared to Reference
Beams. Meanwhile introduction of steel pipes improved
the flexural ultimate failure load by 738.18%.
7- Addition of Steel pipes and steel reinforcement,
showed an increase in the ultimate failure load 1182.2%,
when using 10 mm Reinforcement Steel compared to
reference concrete beams.
8- SEM was successful in clearly differentiating
between polypropylene components, ettringite
components and steel components attached to the concrete
matrix.
V. RECOMMENDATIONS
1- Reduction of the water /cement ratio to 0.3 with the
addition of super plasticizer will enhance bonding between
polypropylene and steel pipes with the concrete matrix.
2- Increasing the thickness of the polypropylene and
steel pipes will also play and effective role on the
performance of hollow core concrete matrix.
3- One third scale and full scale testing of concrete
beams and slabs will provide better understanding of the
strengthening techniques.
REFERENCES
[1] M.N.S. Hadi, T.D. Le "Behavior of hollow
core square reinforced concrete columns wrapped
with CFRP with different fiber orientations"
Construction and Building Materials, Volume
50, 15, Pages 62-73 January 2014.
[2] Thong M. Pham, Le V. Doan, Muhammad N.S.
Hadi" Strengthening square reinforced concrete
columns by circularization and FRP confinement"
Construction and Building Materials, Volume
49, , Pages 490-499, December 2013.

ISSN: 2277-3754
ISO 9001:2008 Certified International Journal of Engineering and Innovative Technology (IJEIT)
Volume 4, Issue 8, February 2015
173
[3] S.P. Tastani, I. Balafas, A. Dervisis, S.J.
Pantazopoulou "Effect of core compaction on
deformation capacity of FRP-jacketed
concrete columns". Construction and Building
Materials, Volume47, October, Pages 1078-1092,
2013.
[4] Fenwick, R., Deem, B., & Bull, D. "Failure modes
for hollow core flooring units."Journal of the
structural Engineering Society Inc.17 (1), 52-70,
2004.
[5] Hawkins and Ghosh, “Shear Strength of Hollow
Core Slabs”, PCI Journal, pp. 110-114, 2006.
[6] Swad, Alex and Jacques, Francis J., “Behavior of
Hollow Core Slabs Subject to Edge Loads”, PCI
JOURNAL, V. 37, No.2, March-April, pp 72-83,
1992.
[7] Stanton, John F., “Response of Hollow Core Slab
Floors to Concentrated Loads”, PCI JOURNAL, V.
37, No. 4, July-Au- gust, pp 98-113, 1992.
[8] F. Elgabbas, A.A. El-Ghandour, A.A. Abdelrahman,
A.S. El-Dieb. "Different CFRP strengthening
techniques for prestressed hollow core slabs:
Experimental study and analytical investigation"
.Composite Structures, Volume 92, Issue 2, Pages
401-411 January 2010.
[9] VAN ACKER A., "Shear resistance of pre-
stressed hollow core floors exposed to fire",
Structural Concrete, Vol. 4, No. 2, pp. 65-74, 2003.
[10] Pajari, M., “Resistance of Pre-stressed Hollow Core
Slabs Against Web Shear Failure,” Research Notes
1292, VTT Building and Transport, Kemistintie,
Finland, 69 pp., 2005.
[11] A.A. El-Ghandour "Experimental and analytical
investigation of CFRP flexural and shear
strengthening efficiencies of RC beams"
Construction and Building Materials, Volume 25,
Issue 3, Pages 1419-1429 March 2011.
[12] Alnuaimi AS, Bhatt P, "direct design of hollow
reinforced concrete beams, part I: design procedure".
Structural concrete J 5(4). 159-146. 2004.
[13] Alnuaimi AS, Bhatt P (2004) direct design of hollow
reinforced concrete beams, part II:
experimental investigation. Structural Concrete J
5(4):147–160, 2004.
[14] ASTM Standard C127, (2007), Standard Test
Method for Density, Relative Density (Specific
Gravity), and Absorption of Coarse Aggregate,
ASTM International, West Conshohocken,
Pennsylvania, DOI: 10.1520/C0127-07, 2007.
[15] ASTM Standard C128, (2007), Standard Test
Method for Density, Relative Density (Specific
Gravity), and Absorption of Fine Aggregate, ASTM
International, West Conshohocken, Pennsylvania,
DOI: 10.1520/C0128-07a, 2007.