strengthening health indicators - harvard university · strengthening health systems: the role of...
TRANSCRIPT


Strengthening Health Systems: the Role of Maternal Health Indicators
Woodrow Wilson International CenterGlobal Health Initiative
8 March 2010
Helen de Pinho MBBCh, MBA, FCCHWith acknowledgements to
Patsy Bailey, Samantha Lobis, Lynn Freedman
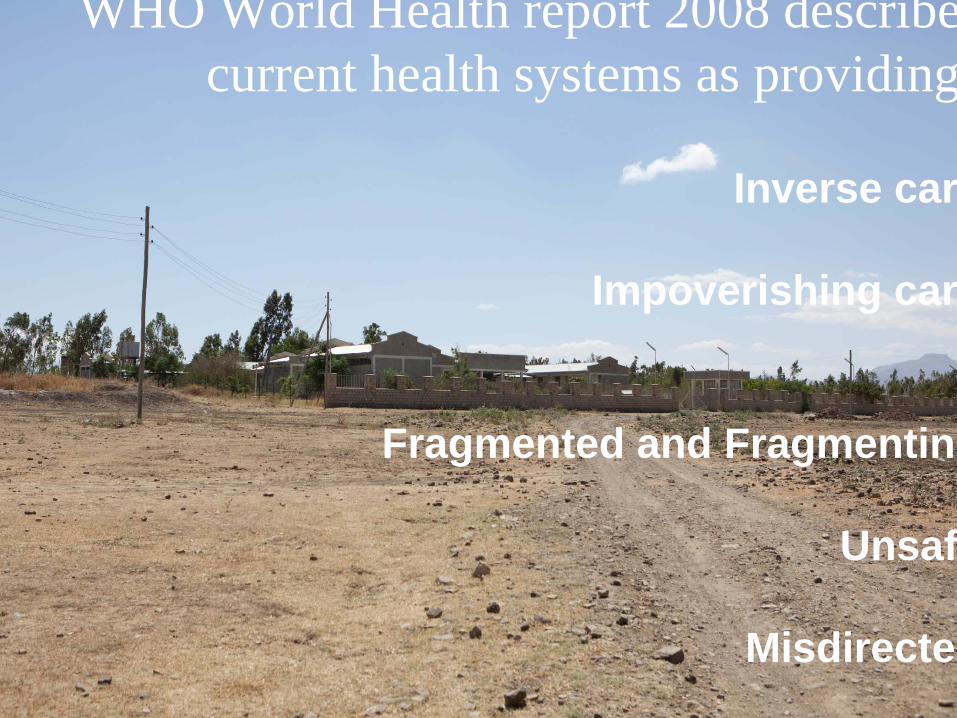
WHO World Health report 2008 describecurrent health systems as providing
Inverse car
Impoverishing car
Fragmented and Fragmenting
Unsaf
Misdirected

Health services
Workforce
Information for decision making
Essential drug supply and logistics
Financing and resource allocation
Leadership and governance
WHO Framework
for Strengthening
Health Systems
Source: WHO. (2000).

What we already know:
• Approximately 15% of pregnant women develop complications
• Most maternal deaths are caused by direct obstetric complications that can be treated
• Many direct obstetric complications cannot be predicted or prevented

We know when maternal deaths occur
Complication Hours DaysHemorrhage
Postpartum 2Antepartum 12
Ruptured uterus 1
Eclampsia 2Obstructed labor 3
Infection 6
Time Between the Beginning of a Complication and Death

We know when neonates die
75% occur in thefirst week (3 million)
Source: Lawn JE et al. (2005).
Asphyxia
Preterm/Low Birth Weight

We recognize the Maternal and Newborn Care Continuum
Facility
Community
Focused antenatal care
Emergency Obstetric
Care
Postpartum/post natal care for Mother and Baby, and IMNCI
Skilled attendance at birth
Family planning
Health education during pregnancy
birth planning
Skilled attendanceat birth
Pre-pregnancy Pregnancy Delivery Postpartum, post natal
Postpartum/Post natal care for mother and baby,Identifying/referring newborn illness
Family planning
PMTCT

Consensus for Maternal, Newborn and Child Health - requires
• Political leadership and community engagement and mobilization
• Effective health systems that deliver a package of high quality interventions
• Removing barriers to access, with services for services women and children being free at the point of use
• Skilled and motivated health workers
• Accountability at all levels Endorsed by G8, 2009

Consensus for Maternal, Newborn and Child Health will:
• Save lives of 1 million women from pregnancy and childbirth complications
• Save Lives of 4.5million newborns• Prevent 1.5million stillbirths• Significant decrease in total number of
unwanted pregnancies an half of the unsafe abortions
• Significant decrease in current unmet need for FP services
Endorsed by G8, 2009

Can the EmOC Indicators assess health systems strengthening?
AvailabilityAre there enough facilities providing EmOC? Are they well distributed?
UtilizationAre enough women using these facilities? Are women with obstetric complications using these facilities? Are sufficient critical services being provided?
Quality of CareIs the quality of the services adequate?
What services needed in addition to EmOC?

How and when are the EmOC indicators measured?
• Nationally, integrated into HMIS
• Project monitoring
• Needs assessments for EmONC – facility-based surveys of hospitals and health centers

Availability

EmOC Indicators
Availability: Are there enough facilities providing EmOC?
Indicator (1) Minimum acceptable level
Number of EmOC For every 500,000 populationfacilities: — Basic — 5 EmOC facilities where at
least 1 is Comprehensive — Comprehensive

EmOC Signal functions
1. Parenteral antibiotics
2. Uterotonic drugs
3. Parenteral anticonvulsants
4. Manual removal of placenta
5. Removal of retained products
6. Assisted vaginal delivery
7. Neonatal resuscitation
8. Cesarean delivery
9. Blood transfusion
Basic
Em
OC
Com
prehensive Em
OC

Santos et al. Improving emergency obstetric care in Mozambique: The story of Sofala. IJGO, 2006: 190-201.
Sofala, Mozambique Amount of EmOC

EmOC Indicators
Availability: Are facilities well distributed?
Indicator (2) Minimum acceptable level
Geographic distribution Minimum level is met in sub-national areas

Paxton et al The United Nations Process Indicators for emergency obstetric care: Reflections based on a decade of experience 2006 I
Bhutan: Functioning EmOC Facilities March 2000

Bhutan: Functioning EmOC Facilities September 2002

Fulfillment of Recommended Minimum Number of EmOC Facilities, Angola 2007
125%
72%
52% 52% 51%50% 46%42% 39% 38%
25% 21% 19%19% 17%17% 15%8%
0%0%
20%
40%
60%
80%
100%
120%
140%
ZaireLu
nda SHuil
aKua
nza N
Cunene
Lund
a NNam
ibeBen
goMox
icoKua
nza S
Nation
alBen
guela
Cabind
aMala
ngeUíge Bié
Huambo
Luan
daKua
ndo K
MoH – Angola Needs Assessment report

Utilization
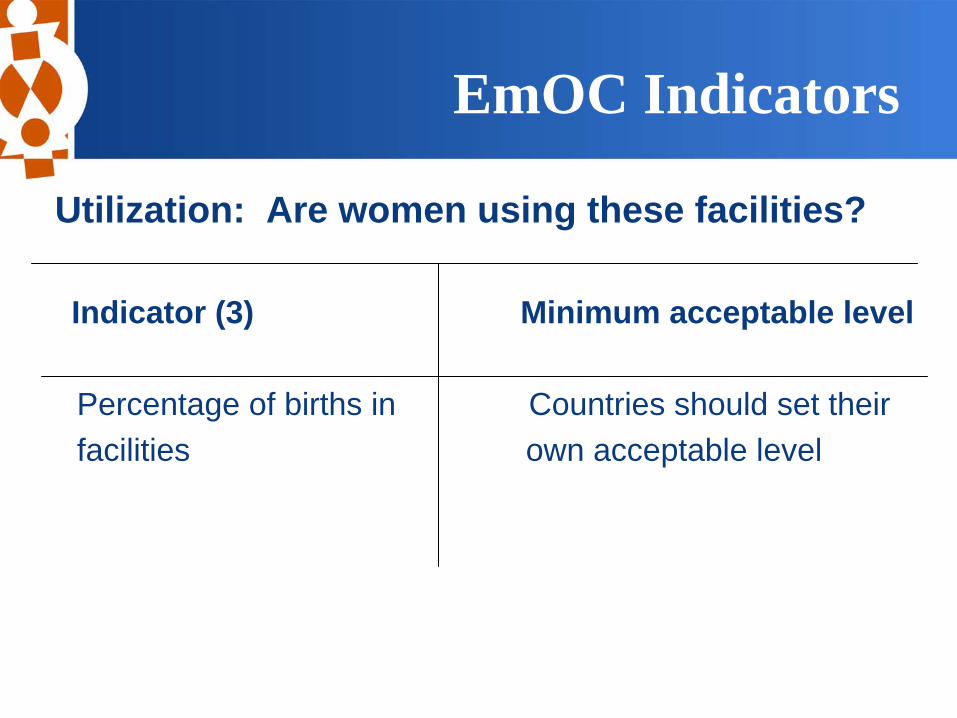
EmOC Indicators
Utilization: Are women using these facilities?
Indicator (3) Minimum acceptable level
Percentage of births in Countries should set theirfacilities own acceptable level
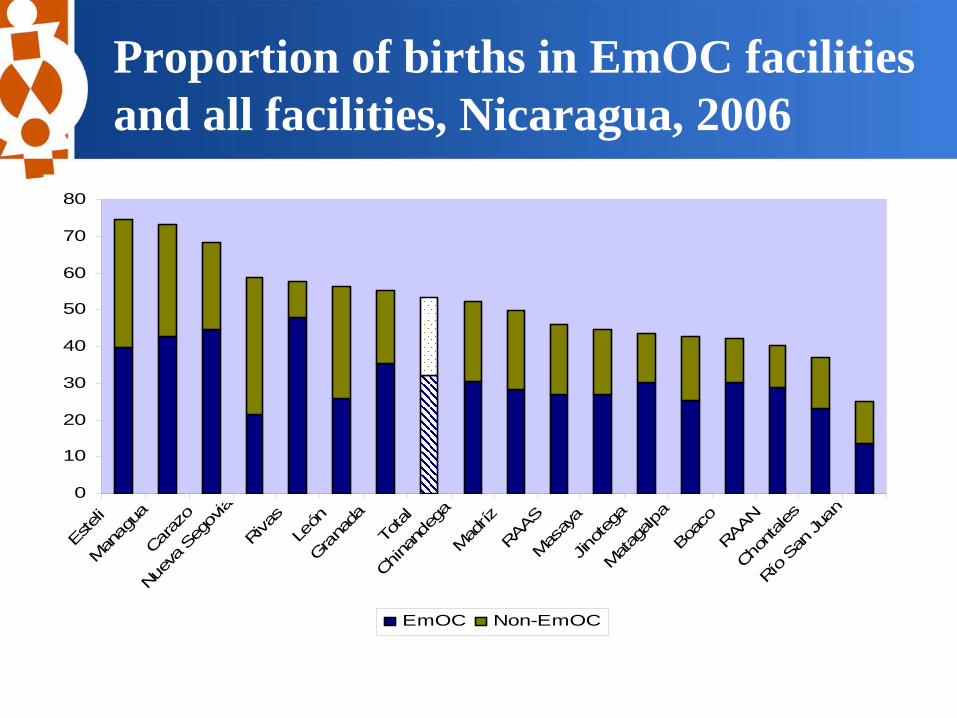
Proportion of births in EmOC facilities and all facilities, Nicaragua, 2006
0
10
20
30
40
50
60
70
80
Este
liM
anag
uaCa
razo
Nuev
a Se
govia
Riva
sLe
ónGra
nada
Tota
l
China
ndeg
aM
adríz
RAAS
Mas
aya
Jinot
ega
Mat
agalp
aBo
aco
RAAN
Chon
tales
Río
San
Juan
EmOC Non-EmOC

EmOC Indicators
Utilization: Are women with obstetric complications using these facilities?
Indicator (4) Minimum acceptable level
Met need for EmOC% of women with At least 100% of womencomplications treated with obstetric complicationsin facilities treated in facilities(15% of all births expected
to have complications)

Experience from the field: Sofala, Mozambique
0%
5%
10%
15%
20%
25%
30%
35%
2000 2002 2003 2004 2005
Met need for EmOC
Met need for EmOC
Santos et al. Improving emergency obstetric care in Mozambique: The story of Sofala. IJGO, 2006: 190-201.

Met Need for EmOC in EmOC facilities and all facilities Angola
0%
10%
20%
30%
40%
50%
60%
EmOC Non-EmOCMoH – Angola Needs Assessment report
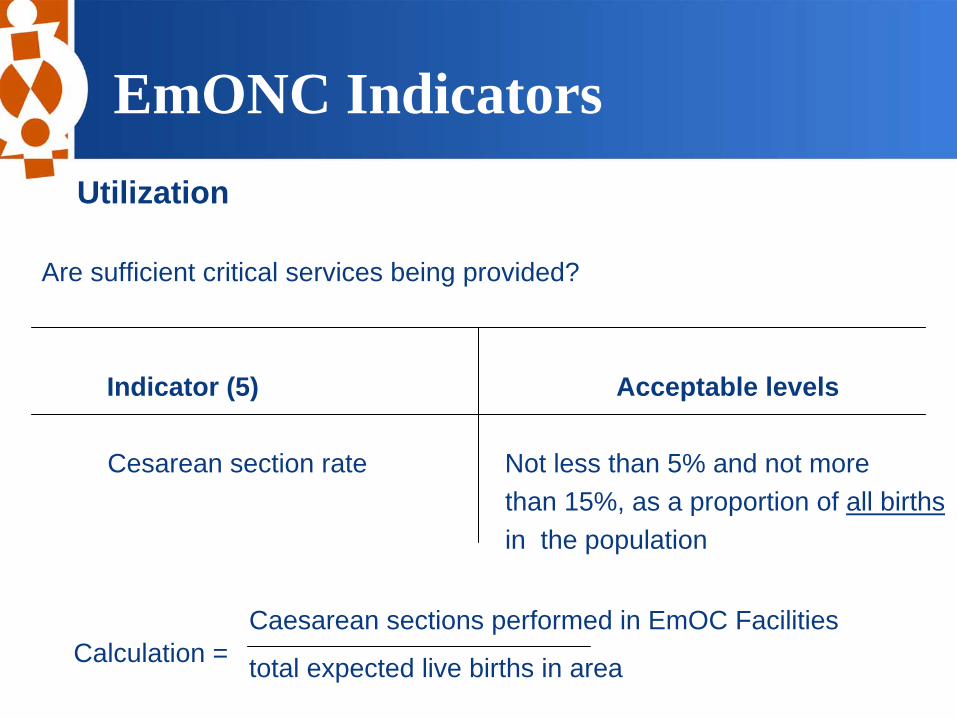
EmONC IndicatorsUtilization
Are sufficient critical services being provided?
Indicator (5) Acceptable levels
Cesarean section rate Not less than 5% and not more than 15%, as a proportion of all birthsin the population
Calculation =Caesarean sections performed in EmOC Facilities
total expected live births in area

Population-based C/S rate by region
EmONC Baseline Assessment, MOH, 2009
9.9%7.1%
2.6%0.6% 0.7% 0.7% 0.7% 0.4% 0.4% 0.2% 0.1% 0.0%
0.0%
5.0%
10.0%
15.0%
20.0%
Harari
Addis A
baba
Dire Daw
aNation
alTigr
ayGam
bela
Benish
angul-
Gumuz
SNNPOromiyaAmha
raSom
ali Affar
Quality of Care

EmOC Indicators
Quality of care: Is the quality of the services adequate?
Indicator (6) Acceptable level
Direct obstetric case fatality Less than 1%rate (DOCFR)

Direct Obstetric Case Fatality Rates
2.0%
3.0%
3.5%
0.9%
1.9%1.7%
0.0%
0.5%
1.0%
1.5%
2.0%
2.5%
3.0%
3.5%
4.0%
Gisarme, Rwanda Muanza, Tanzania Sofala, Mozambique
Baseline Follow up

EmOC IndicatorsQuality of care: Is the quality of the services adequate?
Indicator (7) Acceptable level
Intrapartum and very early To be determinedneonatal death rate

Intrapartum & very early neonatal death rate
CountryIntrapartum +
very early neonatal deaths
Women who delivered
Intrapartum & very early
neonatal death rate
Cusco, Peru 2004
164 19,191 0.85%
S E Asian country 2008*
625 83,708 0.75%
*283 intrapartum stillbirths excluded due to unspecified BWT

EmOC Indicators
What services are needed in addition to EmOC?
Indicator (8) Acceptable level
Proportion of maternal deaths No set acceptable leveldue to indirect causes

Proportion of maternal deaths due to direct and indirect causes, Angola 2007
Source: MOH, UNICEF, UNFPA, WHO. (2007). Preliminary Results.
Causes of maternal deaths
Direct obstetric causes of maternal deaths
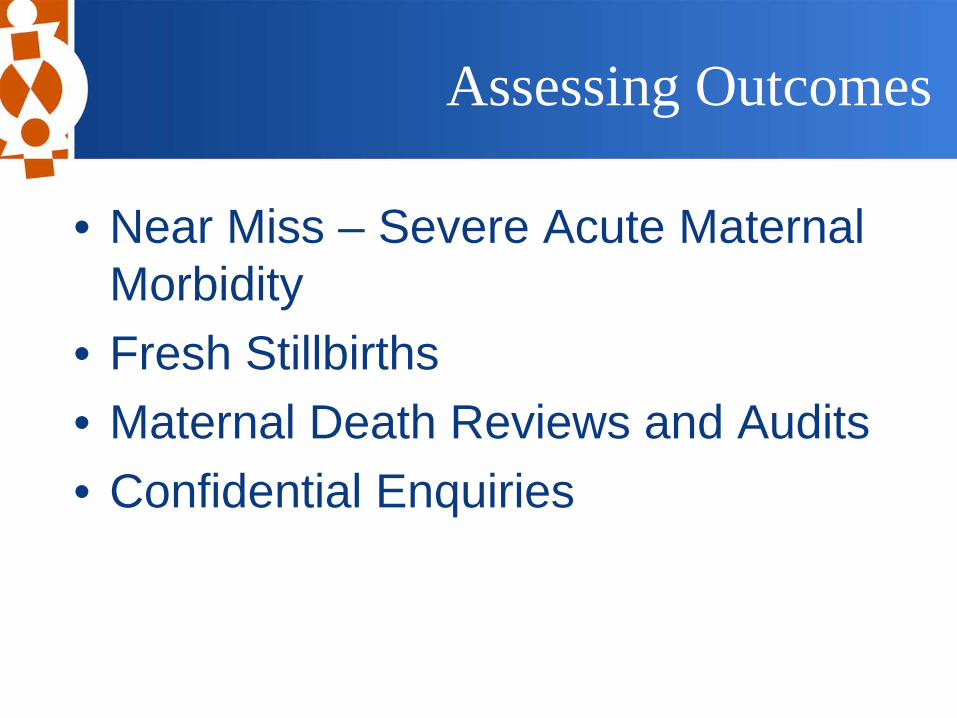
Assessing Outcomes
• Near Miss – Severe Acute Maternal Morbidity
• Fresh Stillbirths• Maternal Death Reviews and Audits• Confidential Enquiries

•Policy•Human Resource Policies •Clinical Management & Training Policies
•Programming•National strategy and planning•Improving the availability, accessibility, utilization and quality of EmONC
•Monitoring & evaluation•EmOC Indicators integrated into HMIS in > 7 countries• Several countries have done more than 1 needs assessment• Results useful for monitoring MDG 5
How have the indicator data been used?
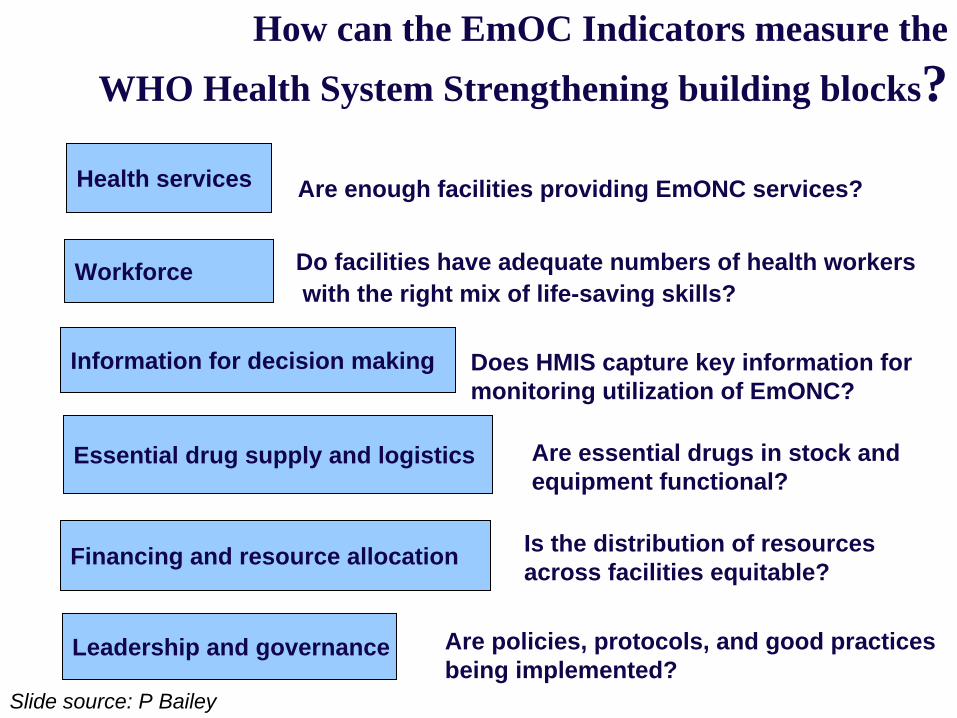
Health services
Workforce
Information for decision making
Essential drug supply and logistics
Financing and resource allocation
Leadership and governance
Are enough facilities providing EmONC services?
Do facilities have adequate numbers of health workerswith the right mix of life-saving skills?
Does HMIS capture key information for monitoring utilization of EmONC?
Are essential drugs in stock andequipment functional?
Is the distribution of resources across facilities equitable?
Are policies, protocols, and good practicesbeing implemented?
How can the EmOC Indicators measure the WHO Health System Strengthening building blocks?
Slide source: P Bailey