strengthen the core
TRANSCRIPT
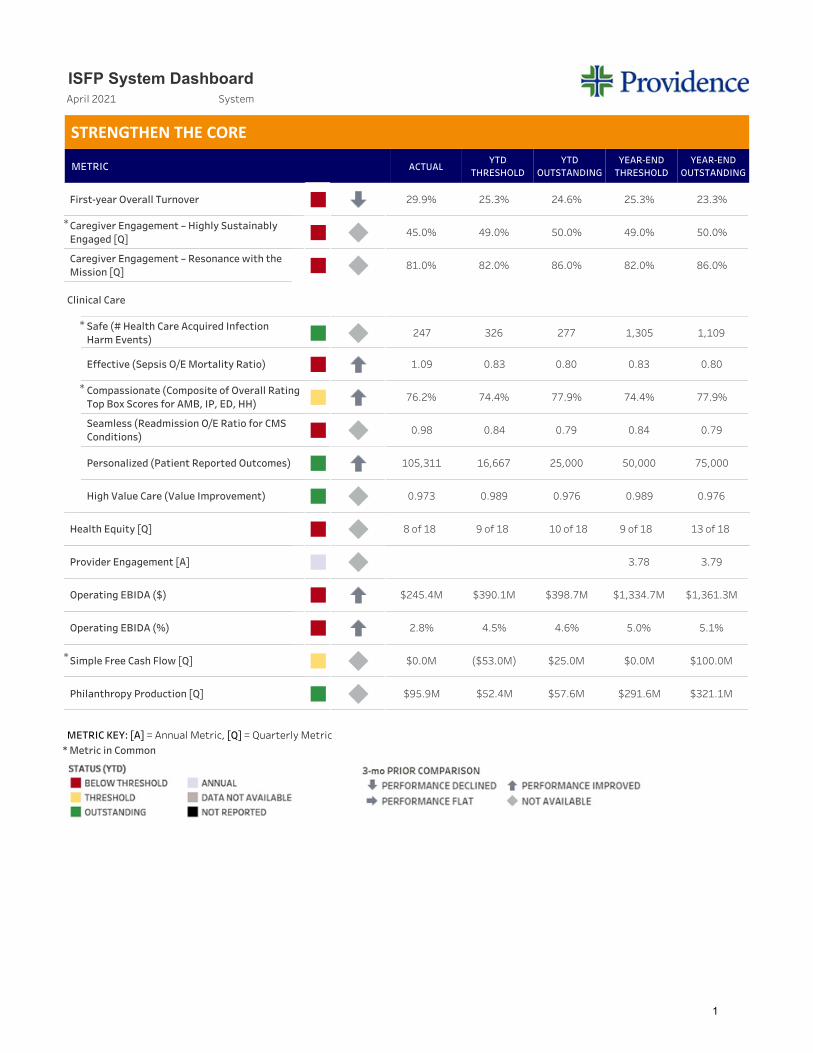
Simple Free Cash Flow [Q]
First-year Overall Turnover
$1,361.3M$1,334.7M$398.7M$390.1M$245.4M
SystemApril 2021
23.3%25.3%24.6%25.3%29.9%
METRIC ACTUALYTD
THRESHOLDYTD
OUTSTANDINGYEAR-ENDTHRESHOLD
YEAR-ENDOUTSTANDING
STRENGTHEN THE CORE
ISFP System Dashboard
Caregiver Engagement – Highly SustainablyEngaged [Q]
50.0%49.0%50.0%49.0%45.0%
Caregiver Engagement – Resonance with theMission [Q]
86.0%82.0%86.0%82.0%81.0%
Safe (# Health Care Acquired InfectionHarm Events)
Effective (Sepsis O/E Mortality Ratio)
Compassionate (Composite of Overall RatingTop Box Scores for AMB, IP, ED, HH)
Seamless (Readmission O/E Ratio for CMSConditions)
Personalized (Patient Reported Outcomes)
High Value Care (Value Improvement)
Provider Engagement [A]
Operating EBIDA (%)
Philanthropy Production [Q]
1,1091,305277326247
0.800.830.800.831.09
77.9%74.4%77.9%74.4%76.2%
0.790.840.790.840.98
75,00050,00025,00016,667105,311
0.9760.9890.9760.9890.973
3.793.78
5.1%5.0%4.6%4.5%2.8%
$321.1M$291.6M$57.6M$52.4M$95.9M
Operating EBIDA ($)
Clinical Care
METRIC KEY: [A] = Annual Metric, [Q] = Quarterly Metric
*
*
*
*
* Metric in Common
Health Equity [Q] 8 of 18 9 of 18 10 of 18 9 of 18 13 of 18
$100.0M$0.0M$25.0M($53.0M)$0.0M
1
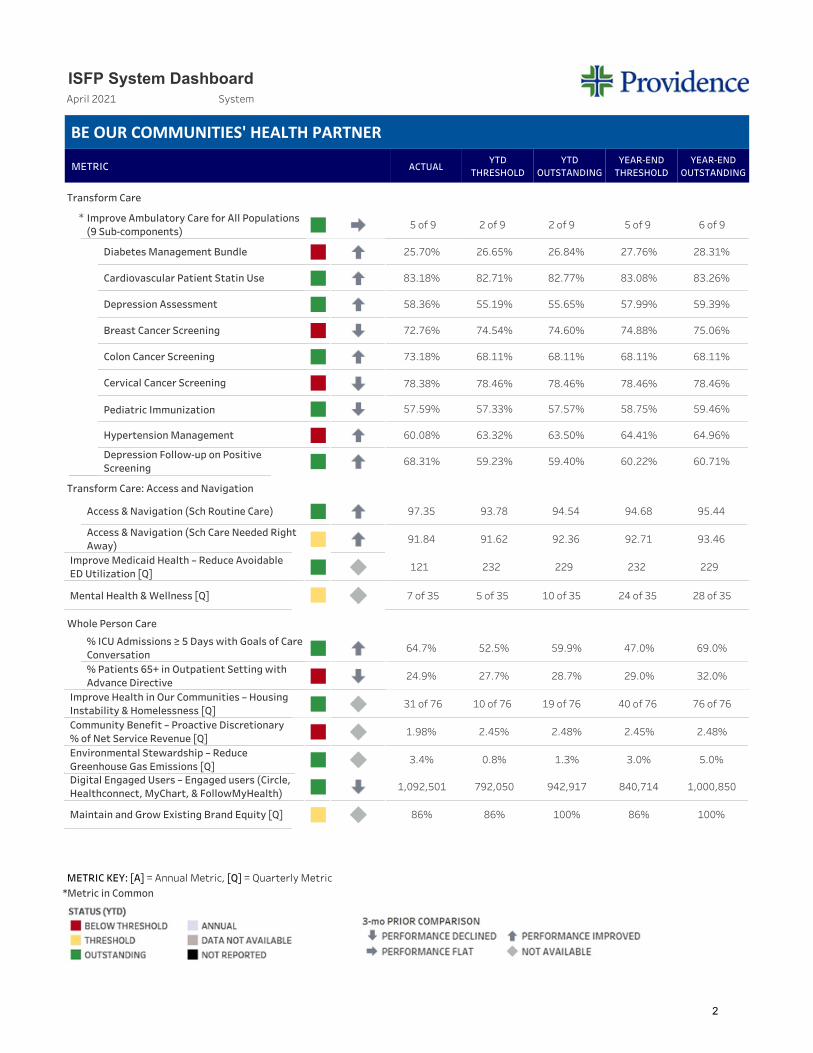
Improve Ambulatory Care for All Populations(9 Sub-components)
% ICU Admissions ≥ 5 Days with Goals of CareConversation
Access & Navigation (Sch Care Needed RightAway)
31 of 76 10 of 76 19 of 76 40 of 76 76 of 76
93.4692.7192.3691.6291.84
SystemApril 2021
METRIC ACTUALYTD
THRESHOLDYTD
OUTSTANDINGYEAR-ENDTHRESHOLD
YEAR-ENDOUTSTANDING
BE OUR COMMUNITIES' HEALTH PARTNER
ISFP System Dashboard
Diabetes Management Bundle
Cardiovascular Patient Statin Use
Depression Assessment
Breast Cancer Screening
Colon Cancer Screening
Cervical Cancer Screening
Pediatric Immunization
% Patients 65+ in Outpatient Setting withAdvance Directive
Digital Engaged Users – Engaged users (Circle,Healthconnect, MyChart, & FollowMyHealth)
28.31%27.76%26.84%26.65%25.70%
83.26%83.08%82.77%82.71%83.18%
59.39%57.99%55.65%55.19%58.36%
75.06%74.88%74.60%74.54%72.76%
68.11%68.11%68.11%68.11%73.18%
78.46%78.46%78.46%78.46%78.38%
59.46%58.75%57.57%57.33%57.59%
229232229232121
69.0%47.0%59.9%52.5%64.7%
32.0%29.0%28.7%27.7%24.9%
1,000,850840,714942,917792,0501,092,501
Improve Medicaid Health – Reduce AvoidableED Utilization [Q]
Community Benefit – Proactive Discretionary% of Net Service Revenue [Q]
Improve Health in Our Communities – HousingInstability & Homelessness [Q]
2.48%2.45%2.48%2.45%1.98%
METRIC KEY: [A] = Annual Metric, [Q] = Quarterly Metric
Maintain and Grow Existing Brand Equity [Q] 100%86%100%86%86%
*
*Metric in Common
Hypertension Management 64.96%64.41%63.50%63.32%60.08%
Access & Navigation (Sch Routine Care) 95.4494.6894.5493.7897.35
5 of 9 2 of 9 2 of 9 5 of 9 6 of 9
Depression Follow-up on PositiveScreening
60.71%60.22%59.40%59.23%68.31%
Transform Care: Access and Navigation
Mental Health & Wellness [Q] 7 of 35 5 of 35 10 of 35 24 of 35 28 of 35
Whole Person Care
Transform Care
Environmental Stewardship – ReduceGreenhouse Gas Emissions [Q]
5.0%3.0%1.3%0.8%3.4%
2
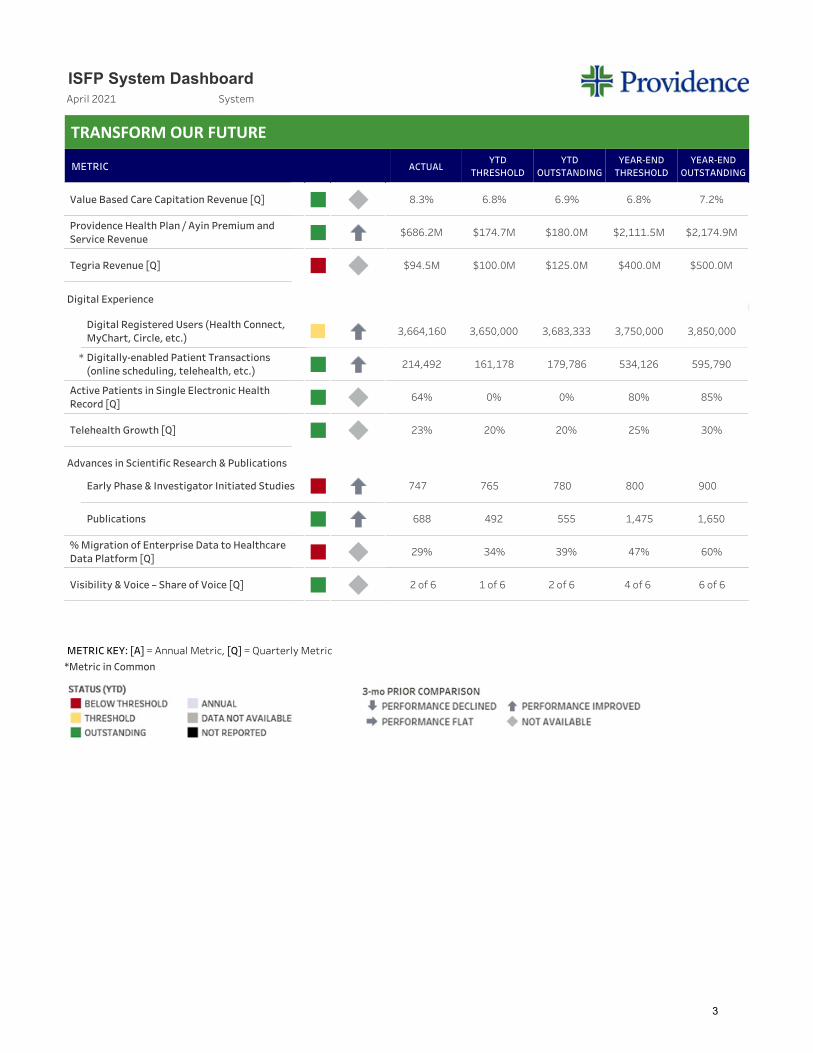
Early Phase & Investigator Initiated Studies
SystemApril 2021
METRIC ACTUALYTD
THRESHOLDYTD
OUTSTANDINGYEAR-ENDTHRESHOLD
YEAR-ENDOUTSTANDING
TRANSFORM OUR FUTURE
ISFP System Dashboard
Digital Experience
Digitally-enabled Patient Transactions(online scheduling, telehealth, etc.)
Digital Registered Users (Health Connect,MyChart, Circle, etc.)
Publications
595,790534,126179,786161,178214,492
3,850,0003,750,0003,683,3333,650,0003,664,160
900800780765747
1,6501,475555492688
METRIC KEY: [A] = Annual Metric, [Q] = Quarterly Metric
*
*Metric in Common
Value Based Care Capitation Revenue [Q] 7.2%6.8%6.9%6.8%8.3%
Providence Health Plan / Ayin Premium andService Revenue
$2,174.9M$2,111.5M$180.0M$174.7M$686.2M
Tegria Revenue [Q] $500.0M$400.0M$125.0M$100.0M$94.5M
Active Patients in Single Electronic HealthRecord [Q]
85%80%0%0%64%
Telehealth Growth [Q] 30%25%20%20%23%
Advances in Scientific Research & Publications
% Migration of Enterprise Data to HealthcareData Platform [Q]
60%47%39%34%29%
Visibility & Voice – Share of Voice [Q] 2 of 6 1 of 6 2 of 6 4 of 6 6 of 6
3