strength of california’s economy - state … · strength of california’s economy boosts demand...
TRANSCRIPT

STRENGTH OF CALIFORNIA’S ECONOMY BOOSTS DEMAND FOR TAX-EXEMPT BONDS
STATE OF CALIFORNIA | DEBT AFFORDABILITY REPORT | OCTOBER 2017 JOHN CHIANG | CALIFORNIA STATE TREASURER

October 1, 2017
Fellow Californians:
We have been busy at the California State Treasurer’s Office since we issued our last Debt Affordability Report a year ago. We sold just over $9 billion in general obligation bonds in six offerings in the fiscal year that ended June 30.
We sponsored successful legislation to inform taxpayers about the full borrowing cost of local government bond issues.
And, we are driving ahead to create a dynamic, practical and profitable market for “green bonds” to pay for bil-lions of dollars of climate-friendly infrastructure.
These efforts are part of my continuing drive to modernize the State Treasurer’s Office to lower costs and maxi-mize efficiency. We want to make the most of every dollar we borrow for essential public works.
Here is a rundown on what my staff and I have been doing:
BOND SALES: During the fiscal year ending June 30, 2017, we sold $9.05 billion in general obligation bonds. Proceeds from about $2.73 billion worth will be spent on transportation, clean water, clean air, parks, housing, educational facilities, stem cell research, children’s hospitals, and other infrastructure.
The balance of about $6.32 billion was used to refinance existing debt. As a result, California taxpayers will get gross savings of approximately $1.49 billion over the remaining lives of the bonds.
This is a great deal for our state. Every dollar we save in interest charges is available for education, health services, environmental protection and other programs that Californians value.
These significant savings are a benefit to the state’s bottom line. Since I became Treasurer in January 2015, ap-proximately $6 billion in debt service gross savings has been achieved, over the lives of bonds. The borrowing included general obligation sales and issuances from the Department of Water Resources, the University of Cali-fornia and other major state agencies.
The market reception for our bond sales remains positive, thanks to our stable, strong and growing economy, our responsible, on-time budgeting and a commitment by lawmakers and the governor to build a resilient financial framework to prepare for an eventual recession.
We enjoy high-grade ratings: Aa3 from Moody’s, AA- from Fitch and AA- from S&P. In August, Moody’s cited California for having a “large, diverse economy and high wealth…healthy liquidity…and on-time budgets.”
Those high-ratings give us in the Golden State the confidence to explore and tap into the potential of green bonds for financing the fight to counter global warming. A big part of that exploration will occur early next year when I convene a high-level green bonds seminar at the Milken Institute in Santa Monica.
John ChiangTreasurer
sTaTe of California

JOHN CHIANG California State Treasurer
The green bond market has grown rapidly in Europe and Asia. But it lags in the United States, the world’s second-largest emitter of greenhouse gases. Issuances are sporadic, especially in the corporate sector. And there is less pressure on issuers here than on their European and Asian counterparts to go green.
TRANSPARENCY: In the just-completed session, lawmakers supported a bill we sponsored. Senate Bill 450 by Sen. Robert Hertzberg mandates that local governments obtain a “truth in borrowing” statement from their under-writer, financial intermediary or private lender before taking on long-term debt obligations.
The process is similar to what takes place with home mortgage loans as required by federal law. Such statements would include the true interest cost, finance charge, total amount financed and a good-faith estimate of the total cost of the bond. Having all this information on hand ahead of closing on bond sales helps local officials make better financial decisions.
Also, on the transparency front, we have been making progress over the last year implementing a program that requires Wall Street firms, such as underwriters, lawyers and municipal advisors, to certify that they have policies that ensure their firms will not engage in municipal finance business with issuers to which the firms have made bond campaign contributions.
Those who fail to do so will be removed from my official list of acceptable vendors and barred from being ap-pointed to work on state bond issues. The initiative is supported by the California Association of County Trea-surers and Tax Collectors.
Backers also included California Forward and Common Cause, two nonpartisan groups that work for govern-ment efficiency and ethics.
Local treasurers throughout the state and I are united in refusing to do business with any firm that promotes these quid-pro-quo schemes that do nothing but inflate taxpayer bills and reduce resources for students.
At the same time, we are making progress on an effort to better train local government officials about the intricacies of bond financing. An agency I chair, the California Debt & Investment Advisory Commission, is developing a series of educational videos to give elected officials the knowledge they need to make prudent borrowing decisions.
These reasonable accountability reforms, combined with a strong and growing economy, have helped make the Golden State’s municipal bond market healthy and attractive to investors across the country. They recog-nize that we prudently and professionally manage our debt so that needed public works gets built while our taxpayers save money.

CONTENTS
PREFACE
STRENGTH OF CALIFORNIA’S ECONOMY BOOSTS DEMAND FOR TAX-EXEMPT BONDS
SECTION 1: MARKET FOR STATE BONDS
SECTION 2: SNAPSHOT OF THE STATE’S DEBT
SECTION 3: MEASURING DEBT BURDEN
SECTION 4: ANALYSIS OF THE STATE’S CREDIT RATINGS
APPENDIX A: THE STATE’S DEBT
APPENDIX B: THE STATE’S DEBT SERVICE
i
1
3
9
11
13
15
21


STATE TREASURER’S OFFICE i
PREFACE
Government Code section 12330 requires the State Treasur-er to submit an annual Debt Affordability Report (DAR) to the governor and Legislature. The report must provide the following information:
• A listing of authorized but unissued debt the Treasurer intends to sell during the current year (2017-18) and the following year (2018-19), and the projected increase in debt service as a result of those sales.
• A description of the market for state bonds.
• An analysis of state bonds’ credit ratings.
• A listing of outstanding debt supported by the General Fund and a schedule of debt service requirements for the debt.
• A listing of authorized but unissued bonds that would be supported by the General Fund.
• Identification of pertinent debt ratios, such as debt service to General Fund revenues, debt to personal in-come, debt to estimated full value of property and debt per capita.
• A comparison of the pertinent debt ratios for the state with those of the 10 most populous states.
• The percentage of the state’s outstanding general ob-ligation (GO) bonds comprised of fixed rate bonds, variable rate bonds, bonds that have an effective fixed interest rate through a hedging contract and bonds that have an effective variable interest rate through a hedging contract.
• A description of any hedging contract, the outstanding face value, the effective date, the expiration date, the name and ratings of the counterparty, the rate or float-ing index paid by the counterparty, and an assessment of how the contract met its objectives.
NOTES ON TERMINOLOGY
• This report frequently uses the words “bonds” and “debt” interchangeably, even when the underlying obligation be-hind the bonds does not constitute debt subject to limi-tation under California’s constitution. This conforms to the municipal market convention that applies the terms “debt” and “debt service” to a wide variety of instruments, regardless of their precise legal status.
• The report references fiscal years without using the term “fiscal year” or “fiscal.” For example, 2017-18 means the 2017-18 fiscal year ending June 30, 2018.

STATE TREASURER’S OFFICE 1
This year’s Debt Affordability Report reflects some eventful changes for governmental debt issuers, both in California and across the nation. It also reflects continued improve-ments in the state’s credit profile, strong access to the capital markets and the state’s ongoing investment in meeting critical in-frastructure needs.
In fiscal 2017, the Federal Reserve Board continued to slowly in-crease interest rates to tight-en monetary policy.
The strength of the national econ-omy would suggest that higher inter-est rates can be tolerated without un-due adverse effects on capital formation by states and local governments. However state and local governments tend to borrow for longer terms—usually to match the eco-nomic lives of the assets being financed—the ef-fect of rising interest rates can be significant.
While slowly rising yields will have an effect on Cali-fornia over the long-term, for now, it is worthwhile to note that the state still has the ability to borrow long-term mon-ey at rates under 3.5 percent and to refinance a great deal of its outstanding debt to attain savings in interest costs.
At the end of June 2017, calendar year-to-date issuance in the United States municipal market totaled $195 billion, gener-ally in line with the ten-year average of $196 billion; and, in-
vestor demand remains strong. According to the Investment Company Institute, early 2017 flows into the mutual fund sector were positive, with $16 billion of net inflows through the end of June. The mutual fund sector accounts for a con-siderable portion of the investment in new issues of govern-mental debt and California is no exception to that.
In addition to the prospect for higher interest rates, ad-verse credit events were also shaping the markets for gov-ernmental issuers. There have been downgrades of credit ratings of several states – Connecticut and Illinois, in par-ticular – generally as a result of budgetary gaps and or
declining reserves.
In addition, in May 2017, the Fiscal Oversight Board of Puerto Rico filed for bankruptcy protection
that affected $74 billion in the island’s bonded debt. This was followed in early July by a
default by the Puerto Rico Electric Power Authority on $9 billion
worth of debt, which pro-voked the Authority to
also file for bankrupt-cy in early July. Even though the financial strife in Puerto Rico was widely anticipat-ed, the effect of the bankruptcy filing is still be-
ing assessed.
These types of events can make the municipal market more difficult for issuers and can lead to market price volatility and higher taxpayers’ cost of financing infrastructure.
STRENGTH OF CALIFORNIA’S ECONOMY BOOSTS DEMAND FOR TAX-EXEMPT BONDS
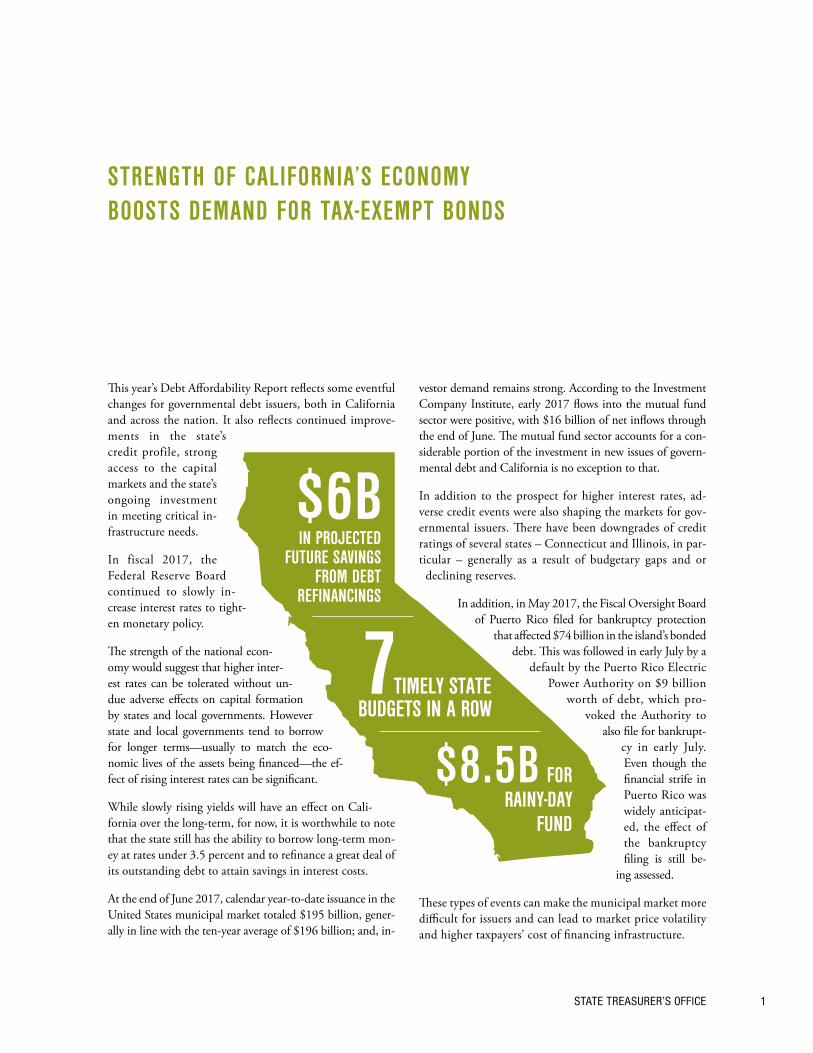
7TIMELY STATE BUDGETS IN A ROW
$6BIN PROJECTED
FUTURE SAVINGS FROM DEBT
REFINANCINGS
$8.5B FORRAINY-DAY
FUND
2017 DEBT AFFORDABILITY REPORT2
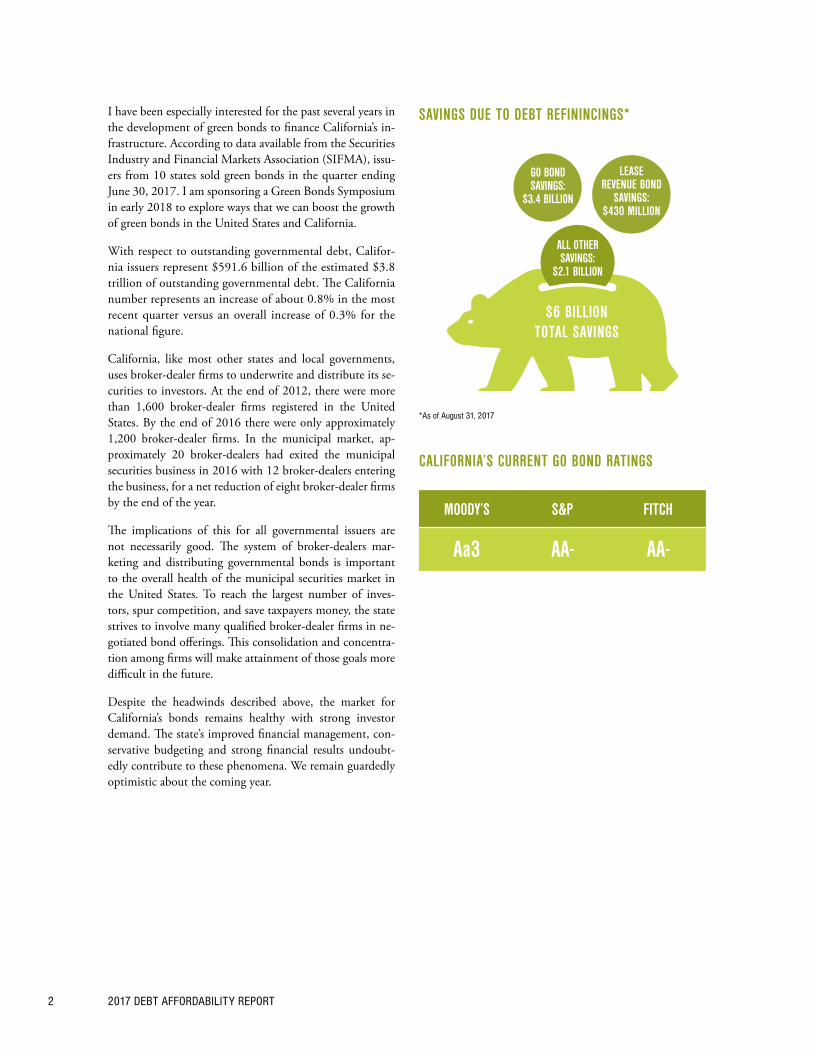
ALL OTHER SAVINGS:
$2.1 BILLION
GO BOND SAVINGS:
$3.4 BILLION
LEASE REVENUE BOND
SAVINGS: $430 MILLION
SAVINGS DUE TO DEBT REFININCINGS*
MOODY’S S&P FITCH
Aa3 AA- AA-
$6 BILLION TOTAL SAVINGS
*As of August 31, 2017
CALIFORNIA’S CURRENT GO BOND RATINGS
I have been especially interested for the past several years in the development of green bonds to finance California’s in-frastructure. According to data available from the Securities Industry and Financial Markets Association (SIFMA), issu-ers from 10 states sold green bonds in the quarter ending June 30, 2017. I am sponsoring a Green Bonds Symposium in early 2018 to explore ways that we can boost the growth of green bonds in the United States and California.
With respect to outstanding governmental debt, Califor-nia issuers represent $591.6 billion of the estimated $3.8 trillion of outstanding governmental debt. The California number represents an increase of about 0.8% in the most recent quarter versus an overall increase of 0.3% for the national figure.
California, like most other states and local governments, uses broker-dealer firms to underwrite and distribute its se-curities to investors. At the end of 2012, there were more than 1,600 broker-dealer firms registered in the United States. By the end of 2016 there were only approximately 1,200 broker-dealer firms. In the municipal market, ap-proximately 20 broker-dealers had exited the municipal securities business in 2016 with 12 broker-dealers entering the business, for a net reduction of eight broker-dealer firms by the end of the year.
The implications of this for all governmental issuers are not necessarily good. The system of broker-dealers mar-keting and distributing governmental bonds is important to the overall health of the municipal securities market in the United States. To reach the largest number of inves-tors, spur competition, and save taxpayers money, the state strives to involve many qualified broker-dealer firms in ne-gotiated bond offerings. This consolidation and concentra-tion among firms will make attainment of those goals more difficult in the future.
Despite the headwinds described above, the market for California’s bonds remains healthy with strong investor demand. The state’s improved financial management, con-servative budgeting and strong financial results undoubt-edly contribute to these phenomena. We remain guardedly optimistic about the coming year.
STATE TREASURER’S OFFICE 3
The state continues to be one of the largest issuers in the $3.8 trillion U.S. municipal bond market. Over the last five fiscal years, the state has issued an average of $7.3 billion of General Obligation (GO) bonds annually. In 2016-17, the state issued $9.1 billion of GO bonds. Of that total, $6.4 billion refunded already outstanding GO bonds to produce debt service savings.
The market and price for the state’s bonds are affected by factors specific to the state, as well as overall conditions in the capital markets. These factors include the economy, general market interest rates, national and state personal income tax rates, the supply of and demand for munici-pal bonds, investor perception of the state’s credit and the performance of alternative investments, such as stocks or other debt capital. Since the last Debt Affordability Re-port was published in October 2016, municipal bond in-terest rates initially spiked following the presidential elec-tion in November 2016 and subsequently declined. With the strength of the state’s credit profile, interest rates on the state’s bonds relative to those of other municipal issu-ers continued to tighten in the beginning of 2016-17 and widened modestly as rates rose. It is typical when rates rise, for credit spreads to widen. The state’s standing in the capital markets continues to be markedly stronger than it was several years ago.
STATE-SPECIFIC FACTORS
The state’s credit profile has improved significantly since 2012-13. Several factors have contributed to this ongoing positive trend that reflect both state actions and the state’s improving economy.
• Beginning in 2012, the state enacted significant struc-tural fiscal reforms including:
• Voters approved an initiative which reinstated the ma-jority vote for annual legislative approval of the state budget and the Legislature eliminated redevelopment agencies, which ended the involuntary redirection of tax revenues from schools and local governments and reduced the burden on the state’s General Fund to backfill the schools’ loss of money;
• In November 2014, voters approved Proposition 2, a constitutional amendment that strengthens the state’s Budget Stabilization Account (BSA), also called the Rainy-Day Fund, requires repayment of debt/un-funded liabilities and reduces the General Fund’s reli-ance on capital gains revenues; and
• Together, these and other statutory changes have re-sulted in significant positive institutionalized chang-es to the state’s financial management.
• Since 2012, the state’s economy has improved signifi-cantly with the unemployment rate declining from 10.4 percent to 5.4 percent in 2016, employment increasing from 16.6 million to 18.1 million and the state’s per-sonal income rising by more than 18 percent.
• The 2017-18 state budget is the seventh consecutive budget adopted on-time, before the June 30 constitu-tional deadline.
• In November 2016, voters approved Proposition 55, which extended the personal income tax increase until 2030 that was initially set to expire on December 31, 2018.
MARKET FOR STATE BONDSSECTION 1
2017 DEBT AFFORDABILITY REPORT4
• The governor and Legislature have taken steps to sub-stantially pay down the state’s past budgetary borrow-ings. The 2017 state budget projects that an additional $1.8 billion of Proposition 2 eligible debts and liabilities will be paid down this fiscal year and the Department of Finance (DOF) projects that almost all of the remaining Proposition 2 budgetary obligations will be repaid by the end of 2020-21.
• The state has continued to build up its reserves, provid-ing protection for future economic slowdowns. At the end of 2016-17, the state had $6.7 billion in the BSA and $0.6 million in the Special Fund for Economic Un-certainties (SFEU) for total reserves of over $7.3 billion.
• The state’s 2017-18 budget projects continued im-provement in the state’s fiscal condition, with struc-turally balanced budgets through 2019-20, and a projected $1.8 billion transfer to the state’s Rainy-Day Fund in 2017-18. This transfer would bring the BSA to $8.5 billion and total reserves to $9.9 billion by June 30, 2018.
• Prior to 2015-16 the state had issued Revenue Anticipa-tion Notes (RANs) in all but one fiscal year since the mid-1980s. As a result of the state’s improved cash posi-tion, no RANs have been issued in the last two fiscal years and are not expected to be issued in 2017-18.
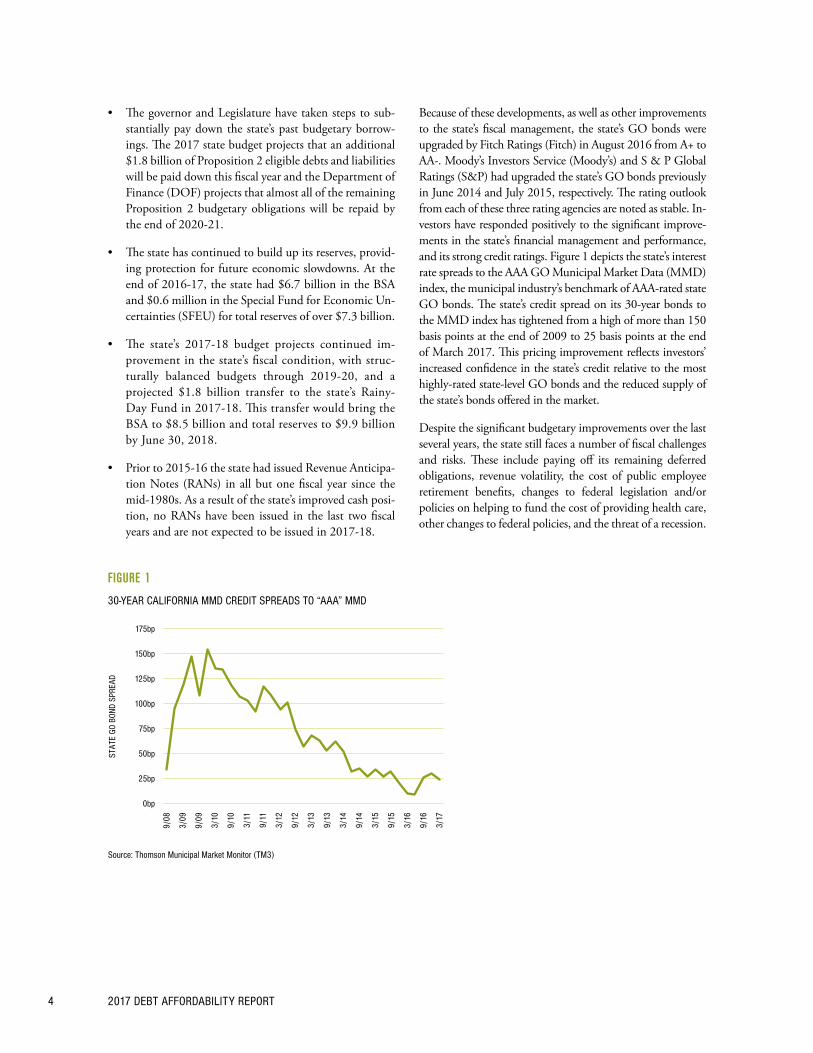
Because of these developments, as well as other improvements to the state’s fiscal management, the state’s GO bonds were upgraded by Fitch Ratings (Fitch) in August 2016 from A+ to AA-. Moody’s Investors Service (Moody’s) and S & P Global Ratings (S&P) had upgraded the state’s GO bonds previously in June 2014 and July 2015, respectively. The rating outlook from each of these three rating agencies are noted as stable. In-vestors have responded positively to the significant improve-ments in the state’s financial management and performance, and its strong credit ratings. Figure 1 depicts the state’s interest rate spreads to the AAA GO Municipal Market Data (MMD) index, the municipal industry’s benchmark of AAA-rated state GO bonds. The state’s credit spread on its 30-year bonds to the MMD index has tightened from a high of more than 150 basis points at the end of 2009 to 25 basis points at the end of March 2017. This pricing improvement reflects investors’ increased confidence in the state’s credit relative to the most highly-rated state-level GO bonds and the reduced supply of the state’s bonds offered in the market.
Despite the significant budgetary improvements over the last several years, the state still faces a number of fiscal challenges and risks. These include paying off its remaining deferred obligations, revenue volatility, the cost of public employee retirement benefits, changes to federal legislation and/or policies on helping to fund the cost of providing health care, other changes to federal policies, and the threat of a recession.
FIGURE 1
30-YEAR CALIFORNIA MMD CREDIT SPREADS TO “AAA” MMD
0bp
25bp
50bp
75bp
100bp
125bp
175bp
150bp
9/08
3/09
9/09
3/10
9/10
3/11
9/11
3/12
9/12
3/16
3/15
9/15
3/17
9/16
9/14
3/14
9/13
3/13
Source: Thomson Municipal Market Monitor (TM3)
STAT
E GO
BON
D SP
READ

STATE TREASURER’S OFFICE 5
FIGURE 2
TRENDS OF TAX-EXEMPT INTEREST RATES
1.00%
1.50%
2.00%
2.50%
3.00%
3.50%
4.00%
7/16
8/16
9/16
10/1
6
11/1
6
12/1
6
1/17
2/17
3/17
4/17
5/17
6/17
7/17
Source: Thomson Municipal Market Monitor (TM3)
AAA-
GO Y
IELD
S
30-Year AAA GO MMD Benchmark
10-Year AAA GO MMD Benchmark
OVERALL MARKET CONDITIONS
The discussion below reviews factors in the larger municipal and taxable bond markets that also have significantly af-fected the market for the state’s bonds.
INTEREST RATES
LONG-TERM INTEREST RATES. In early July 2016, long-term municipal interest rates reached an all-time low since the inception of the MMD index in 1985. Thereaf-ter, long-term rates generally increased through Decem-ber 2016. The increase began due to multiple factors, including the growing realization that the process by Britain to exit the European Union (Brexit) would be slow, the gradual tightening of monetary policy by the Federal Reserve Bank, and an increased supply of munic-ipal bonds following a slow start for calendar 2016. But, by far, the strongest driver of the increase in long-term municipal interest rates was the result of the U.S. presi-dential election, which caught many market participants by surprise. The prospects of significant policy changes under the new federal administration in the areas of tax reform, infrastructure spending and regulatory reform all prompted a dramatic sell-off in the municipal bond market. In all, from early July 2016 to early December 2016, the 10 and 30 year tax-exempt MMD index in-
creased by 129 and 142 basis points, respectively. Since then, the municipal market has recovered some of those losses, due in part to the lack of legislative action by the federal government. Interest rates have declined with the 10-year and 30-year MMD falling by 59 and 56 basis points respectively, from their highs in early December 2016 to the end of June 2017. Since then, municipal interest rates have remained steady through late August.
SHORT-TERM INTEREST RATES. While long-term tax-exempt interest rates have been volatile from July 2016 through June 2017, short-term tax-exempt interest rates have steadily increased. The increases are attributable pri-marily to Federal Reserve rate hikes and the full imple-mentation of reforms in October 2016 to tax-exempt money market funds, which represent the largest segment of investors of short-term tax-exempt obligations. The re-forms required most money market funds including tax-exempt money market funds (i) to be valued at a fluctuat-ing net asset value (NAV) rather than par, (ii) to impose withdrawal limitations and charges on investors to pre-vent large withdrawals during difficult market conditions, and (iii) to reduce the weighted average maturity of their holdings. In response to these changes, tax-exempt money market funds shortened the duration of their holdings or in some cases, closed, decreasing the demand for short-term tax-exempt obligations.
2017 DEBT AFFORDABILITY REPORT6
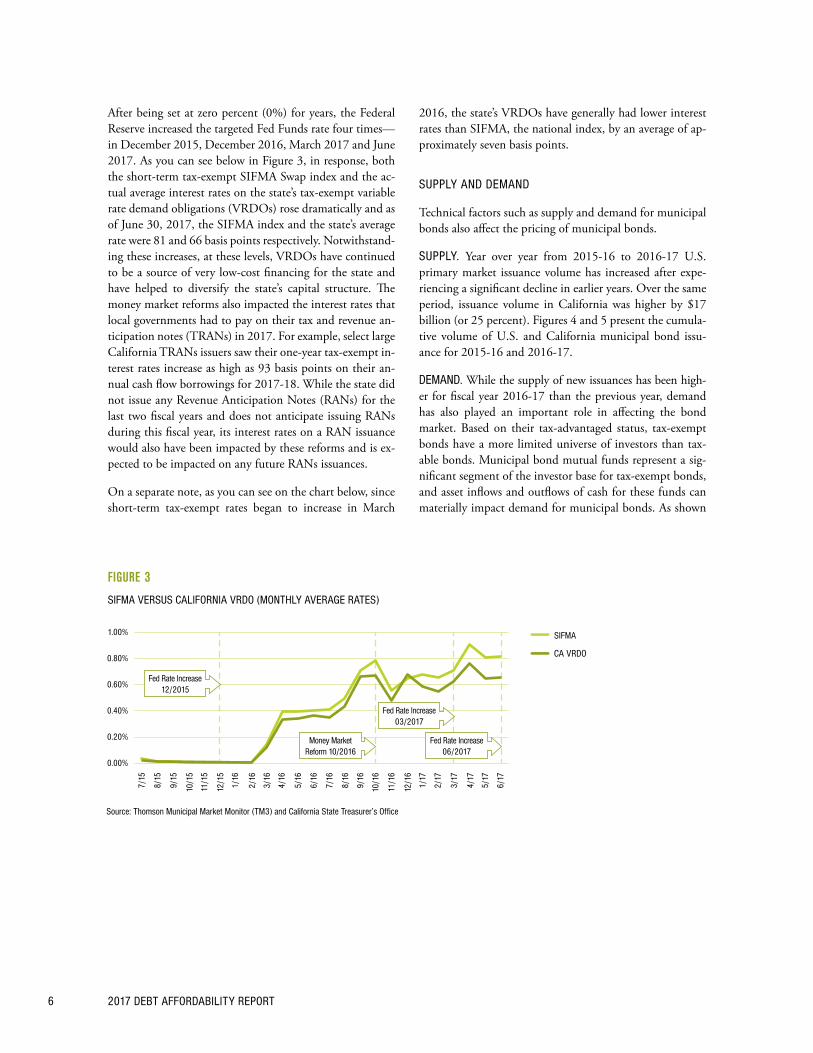
2016, the state’s VRDOs have generally had lower interest rates than SIFMA, the national index, by an average of ap-proximately seven basis points.
SUPPLY AND DEMAND
Technical factors such as supply and demand for municipal bonds also affect the pricing of municipal bonds.
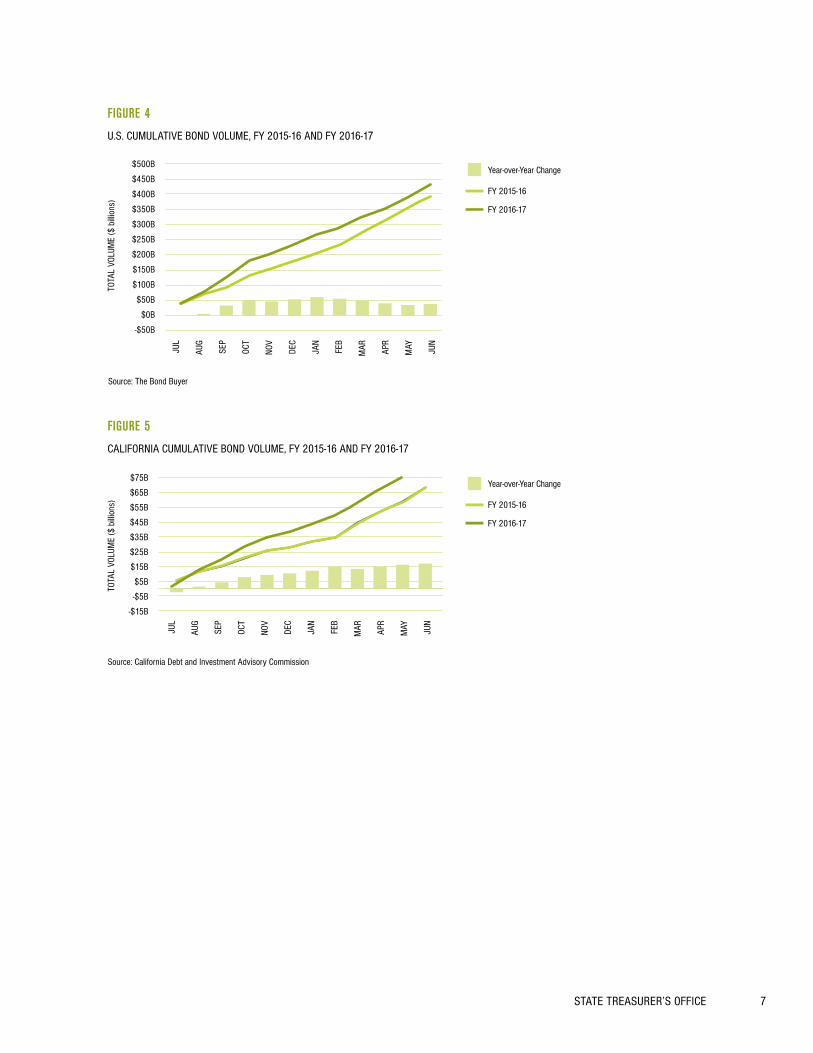
SUPPLY. Year over year from 2015-16 to 2016-17 U.S. primary market issuance volume has increased after expe-riencing a significant decline in earlier years. Over the same period, issuance volume in California was higher by $17 billion (or 25 percent). Figures 4 and 5 present the cumula-tive volume of U.S. and California municipal bond issu-ance for 2015-16 and 2016-17.
DEMAND. While the supply of new issuances has been high-er for fiscal year 2016-17 than the previous year, demand has also played an important role in affecting the bond market. Based on their tax-advantaged status, tax-exempt bonds have a more limited universe of investors than tax-able bonds. Municipal bond mutual funds represent a sig-nificant segment of the investor base for tax-exempt bonds, and asset inflows and outflows of cash for these funds can materially impact demand for municipal bonds. As shown
After being set at zero percent (0%) for years, the Federal Reserve increased the targeted Fed Funds rate four times—in December 2015, December 2016, March 2017 and June 2017. As you can see below in Figure 3, in response, both the short-term tax-exempt SIFMA Swap index and the ac-tual average interest rates on the state’s tax-exempt variable rate demand obligations (VRDOs) rose dramatically and as of June 30, 2017, the SIFMA index and the state’s average rate were 81 and 66 basis points respectively. Notwithstand-ing these increases, at these levels, VRDOs have continued to be a source of very low-cost financing for the state and have helped to diversify the state’s capital structure. The money market reforms also impacted the interest rates that local governments had to pay on their tax and revenue an-ticipation notes (TRANs) in 2017. For example, select large California TRANs issuers saw their one-year tax-exempt in-terest rates increase as high as 93 basis points on their an-nual cash flow borrowings for 2017-18. While the state did not issue any Revenue Anticipation Notes (RANs) for the last two fiscal years and does not anticipate issuing RANs during this fiscal year, its interest rates on a RAN issuance would also have been impacted by these reforms and is ex-pected to be impacted on any future RANs issuances.
On a separate note, as you can see on the chart below, since short-term tax-exempt rates began to increase in March
FIGURE 3
SIFMA VERSUS CALIFORNIA VRDO (MONTHLY AVERAGE RATES)
0.00%
0.20%
0.40%
0.60%
0.80%
1.00%
7/15
8/15
9/15
11/1
5
10/1
5
12/1
5
1/16
2/16
3/16
4/16
5/16
6/16
7/16
8/16
9/16
10/1
6
11/1
6
12/1
6
1/17
2/17
3/17
4/17
5/17
6/17
Source: Thomson Municipal Market Monitor (TM3) and California State Treasurer’s Office
SIFMA
CA VRDO
Fed Rate Increase12/2015
Money MarketReform 10/2016
Fed Rate Increase06/2017
Fed Rate Increase03/2017
STATE TREASURER’S OFFICE 7
FIGURE 5
CALIFORNIA CUMULATIVE BOND VOLUME, FY 2015-16 AND FY 2016-17
FIGURE 4
U.S. CUMULATIVE BOND VOLUME, FY 2015-16 AND FY 2016-17
Year-over-Year Change
FY 2015-16
FY 2016-17
TOTA
L VO
LUM
E ($
billi
ons)
JAN
FEB
MAR AP
R
MAY JUN
-$50B
$0B
$100B
$200B
$50B
$150B
$300B
$500B
$450B
$400B
$250B
$350B
JUL
AUG
SEP
OCT
NOV
DEC
Source: The Bond Buyer
JUL
AUG
SEP
OCT
NOV
DEC
Year-over-Year Change
FY 2015-16
FY 2016-17
-$15B
-$5B
$5B
$15B
$25B
$45B
$75B
$65B
$35B
$55B
JAN
FEB
MAR AP
R
MAY JUN
TOTA
L VO
LUM
E ($
billi
ons)
Source: California Debt and Investment Advisory Commission
2017 DEBT AFFORDABILITY REPORT8
1.5%
2.0%
2.5%
3.0%
3.5%
4.0%
7/16
8/16
9/16
10/1
6
11/1
6
12/1
6
1/17
5/17
7/17
3/17
2/17
6/17
4/17
STAT
E GO
BON
D YI
ELD
CA MMD Benchmark
AAA MMD Benchmark
Source: Thomson Municipal Market Monitor (TM3)
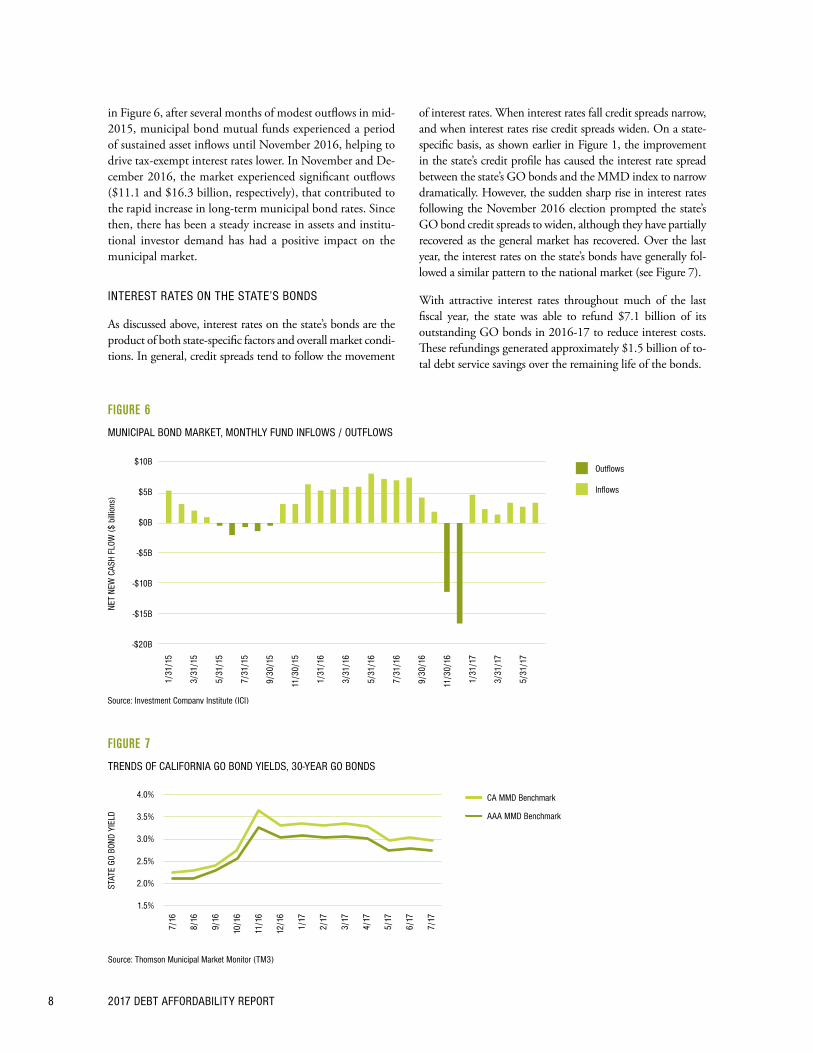
in Figure 6, after several months of modest outflows in mid-2015, municipal bond mutual funds experienced a period of sustained asset inflows until November 2016, helping to drive tax-exempt interest rates lower. In November and De-cember 2016, the market experienced significant outflows ($11.1 and $16.3 billion, respectively), that contributed to the rapid increase in long-term municipal bond rates. Since then, there has been a steady increase in assets and institu-tional investor demand has had a positive impact on the municipal market.
INTEREST RATES ON THE STATE’S BONDS
As discussed above, interest rates on the state’s bonds are the product of both state-specific factors and overall market condi-tions. In general, credit spreads tend to follow the movement
of interest rates. When interest rates fall credit spreads narrow, and when interest rates rise credit spreads widen. On a state-specific basis, as shown earlier in Figure 1, the improvement in the state’s credit profile has caused the interest rate spread between the state’s GO bonds and the MMD index to narrow dramatically. However, the sudden sharp rise in interest rates following the November 2016 election prompted the state’s GO bond credit spreads to widen, although they have partially recovered as the general market has recovered. Over the last year, the interest rates on the state’s bonds have generally fol-lowed a similar pattern to the national market (see Figure 7).
With attractive interest rates throughout much of the last fiscal year, the state was able to refund $7.1 billion of its outstanding GO bonds in 2016-17 to reduce interest costs. These refundings generated approximately $1.5 billion of to-tal debt service savings over the remaining life of the bonds.
FIGURE 6
MUNICIPAL BOND MARKET, MONTHLY FUND INFLOWS / OUTFLOWS
Inflows
-$20B
-$15B
-$10B
-$5B
$0B
$5B
$10B
NET
NEW
CAS
H FL
OW ($
billi
ons)
Source: Investment Company Institute (ICI)
Outflows
5/31
/17
11/3
0/15
9/30
/15
7/31
/15
5/31
/15
3/31
/15
1/31
/15
1/31
/16
3/31
/16
5/31
/16
7/31
/16
9/30
/16
11/3
0/16
1/31
/17
3/31
/17
FIGURE 7
TRENDS OF CALIFORNIA GO BOND YIELDS, 30-YEAR GO BONDS

STATE TREASURER’S OFFICE 9
OVERVIEW
Figure 8 summarizes the state’s long-term debt as of June 30, 2017. This summary of state debt includes General Fund-supported GO bonds approved by voters and lease revenue bonds (LRBs) authorized by the Legislature, as well as self-liquidating GO bonds. Self-liquidating GO bonds are secured primarily by specific revenues, and the General
Fund is not expected to pay debt service. However, the General Fund is obligated to pay debt service should the revenues to support repayment not be sufficient. The figures include bonds the state has sold (outstanding) and bonds authorized but not yet sold. A detailed list of the state’s out-standing bonds, and their debt service requirements, can be found in Appendices A and B.
SNAPSHOT OF THE STATE’S DEBTSECTION 2
FIGURE 8
SUMMARY OF THE STATE’S DEBT (a) AS OF JUNE 30, 2017 (dollars in billions)
OUTSTANDINGAUTHORIZED
BUT UNISSUED TOTAL
GENERAL FUND-SUPPORTED ISSUES
General Obligation Bonds $73.84 $33.75 $107.59
Lease Revenue Bonds (b) 9.40 4.86 14.26
TOTAL GENERAL FUND SUPPORTED ISSUES $83.24 $38.61 $121.85
SELF-LIQUIDATING GENERAL OBLIGATION BONDS
Veterans General Obligation Bonds $0.61 $0.20 $0.81
California Water Resources Development General Obligation Bonds 0.09 0.17 0.26
TOTAL SELF-LIQUIDATING GENERAL OBLIGATION BONDS $0.70 $0.37 $1.07
TOTAL $83.94 $38.98 $122.92
(a) Debt obligations not included in Figure 8: Any short-term obligations such as commercial paper or revenue anticipation notes; revenue bonds issued by state agencies which are repaid from specific revenues outside the General Fund; and “conduit” bonds, such as those issued by state financing authorities on behalf of other governmental or private entities whose obligations secure the bonds.
(a) SB 1407 (2008) authorized an additional amount for construction of certain court projects. The authorized but unissued figure excludes the amount for those projects that has not been appropriated by the Legislature.
2017 DEBT AFFORDABILITY REPORT10
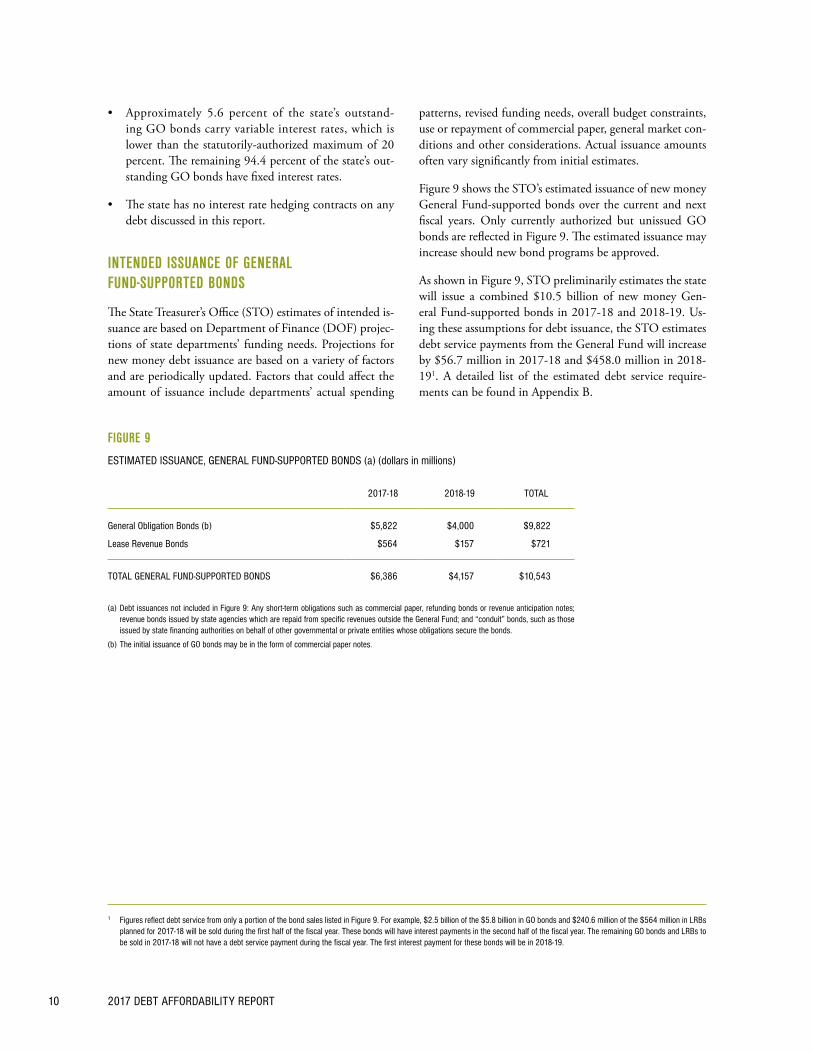
patterns, revised funding needs, overall budget constraints, use or repayment of commercial paper, general market con-ditions and other considerations. Actual issuance amounts often vary significantly from initial estimates.
Figure 9 shows the STO’s estimated issuance of new money General Fund-supported bonds over the current and next fiscal years. Only currently authorized but unissued GO bonds are reflected in Figure 9. The estimated issuance may increase should new bond programs be approved.
As shown in Figure 9, STO preliminarily estimates the state will issue a combined $10.5 billion of new money Gen-eral Fund-supported bonds in 2017-18 and 2018-19. Us-ing these assumptions for debt issuance, the STO estimates debt service payments from the General Fund will increase by $56.7 million in 2017-18 and $458.0 million in 2018-191. A detailed list of the estimated debt service require-ments can be found in Appendix B.
1 Figures reflect debt service from only a portion of the bond sales listed in Figure 9. For example, $2.5 billion of the $5.8 billion in GO bonds and $240.6 million of the $564 million in LRBs planned for 2017-18 will be sold during the first half of the fiscal year. These bonds will have interest payments in the second half of the fiscal year. The remaining GO bonds and LRBs to be sold in 2017-18 will not have a debt service payment during the fiscal year. The first interest payment for these bonds will be in 2018-19.
• Approximately 5.6 percent of the state’s outstand-ing GO bonds carry variable interest rates, which is lower than the statutorily-authorized maximum of 20 percent. The remaining 94.4 percent of the state’s out-standing GO bonds have fixed interest rates.
• The state has no interest rate hedging contracts on any debt discussed in this report.
INTENDED ISSUANCE OF GENERAL FUND-SUPPORTED BONDS
The State Treasurer’s Office (STO) estimates of intended is-suance are based on Department of Finance (DOF) projec-tions of state departments’ funding needs. Projections for new money debt issuance are based on a variety of factors and are periodically updated. Factors that could affect the amount of issuance include departments’ actual spending
FIGURE 9
ESTIMATED ISSUANCE, GENERAL FUND-SUPPORTED BONDS (a) (dollars in millions)
2017-18 2018-19 TOTAL
General Obligation Bonds (b) $5,822 $4,000 $9,822
Lease Revenue Bonds $564 $157 $721
TOTAL GENERAL FUND-SUPPORTED BONDS $6,386 $4,157 $10,543
(a) Debt issuances not included in Figure 9: Any short-term obligations such as commercial paper, refunding bonds or revenue anticipation notes; revenue bonds issued by state agencies which are repaid from specific revenues outside the General Fund; and “conduit” bonds, such as those issued by state financing authorities on behalf of other governmental or private entities whose obligations secure the bonds.
(b) The initial issuance of GO bonds may be in the form of commercial paper notes.

11
DEBT AS PERCENTAGE OF PERSONAL INCOME
Comparing a state’s level of debt to the total personal in-come of its residents is a way to measure a state’s ability to generate revenues and repay its obligations. In its 2017 State Debt Medians report, Moody’s lists the state’s ratio of net tax-supported debt to personal income at 4.2 percent.5
DEBT PER CAPITA
Debt per capita measures residents’ average share of a state’s total outstanding debt. It does not account for the employ-ment status, income or other financial resources of residents. As a result, debt per capita does not reflect a state’s ability to repay its obligations as well as other ratios, such as debt service as a percentage of General Fund revenues or debt as a percentage of personal income. In its 2017 State Debt Medi-ans report, Moody’s lists the state’s debt per capita at $2,217.5
DEBT AS PERCENTAGE OF STATE GDP
Debt as a percentage of GDP generally is used to measure the financial leverage provided by an issuer’s economy. Specifically, this debt ratio compares what an issuer owes versus what it produces. California has the world’s sixth largest economy6 and one of its most diverse. In its 2017 State Debt Medians report, Moody’s lists the state’s debt as a percentage of GDP at 3.51 percent.5
2 Does not reflect offsets due to subsidy payments from the federal government for Build America Bonds (BABs) or transfers from special funds. When debt service is adjusted to account for approximately $1.6 billion of estimated offsets, the 2016-17 debt service decreases to $6.2 billion, and the ratio of debt service to General Fund revenues drops to 5.25 percent.
3 Excludes special fund bonds, for which debt service each year is paid from dedicated funds.4 Does not reflect offsets due to subsidy payments from the federal government for BABs or transfers from special funds. When debt service is adjusted to account for approximately $1.9
billion of estimated offsets, the 2017-18 debt service decreases to $6.2 billion and the ratio of debt service to General Fund revenues drops to 4.90 percent.5 Moody’s calculation of net tax-supported debt includes GO bonds (non self-liquidating), LRBs, Enterprise Revenue Bonds, GO commercial paper notes, federal Highway Grant Anticipation
Bonds, tobacco securitization bonds with a General Fund backstop, various regional center bonds, and State Building Lease Purchase bonds.6 California GDP as reported by the U.S. Bureau of Economic Analysis for 2016. Sovereign country ranking and GDP for 2016 as reported by the International Money Fund.
MEASURING DEBT BURDENSECTION 3
DEBT RATIOS
Measuring California’s debt level with various ratios – while not particularly helpful in assessing debt affordability – does provide a way to compare the state’s burden to that of other borrowers. The three most commonly-used ratios are: debt service as a percentage of General Fund revenues; debt as a percentage of personal income; and debt per capita. A fourth ratio – debt as a percentage of state gross domestic product (GDP) – also can be a useful comparison tool.
DEBT SERVICE AS PERCENTAGE OF GENERAL FUND REVENUES
Because debt service is considered a fixed part of a bud-get, credit analysts compare General Fund-supported debt service to General Fund revenues to measure a state’s fis-cal flexibility. California’s ratio of General Fund-supported debt service to General Fund revenues was 6.57 percent2 in 2016-17. That figure is based on $7.8 billion3 of GO and LRB debt service payments versus $118.5 billion of Gen-eral Fund revenues (less transfer to the Budget Stabilization Account/Rainy-Day Fund). The STO estimates this ratio will be 6.40 percent4 in 2017-18. That estimate is based on an expected $8.1 billion of debt service payments versus $125.9 billion of General Fund revenues (less transfer to the Budget Stabilization Account/Rainy-Day Fund).

2017 DEBT AFFORDABILITY REPORT12
DEBT RATIOS OF THE 10 MOST POPULOUS STATES
In its State Debt Medians report, Moody’s calculates for each state the ratios of debt to personal income, debt per capita and debt as a percentage of GDP and provides the median ratios across all states. It’s useful to compare Cali-fornia’s debt levels with those of its “peer group” of the 10 most populous states. As shown in the tables, the median debt to personal income (Figure 10), debt per capita (Figure 11) and debt as a percentage of GDP (Figure 12) of these 10 states are, on average, in line with Moody’s median for all states combined. California’s ratios, however, rank well above the medians for the 10 most populous states.
FIGURE 12
DEBT AS A PERCENTAGE OF STATE GDP OF 10 MOST POPULOUS STATES
STATEMOODY’S/S&P/
FITCH (a)DEBT AS % OF
STATE GDP (b)(c)
Texas Aaa/AAA/AAA 0.66%
North Carolina Aaa/AAA/AAA 1.35%
Michigan Aa1/AA-/AA 1.46%
Georgia Aaa/AAA/AAA 2.05%
Ohio Aa1/AA+/AA+ 2.07%
Florida Aa1/AAA/AAA 2.23%
Pennsylvania Aa3/AA-/AA- 2.41%
California Aa3/AA-/AA- 3.51%
Illinois Baa3/BBB-/BBB 4.14%
New York Aa1/AA+/AA+ 4.23%
MOODY’S MEDIAN ALL STATES 2.23%
MEDIAN FOR THE 10 MOST POPULOUS STATES 2.15%
(a) Moody’s, S&P and Fitch ratings as of August 2017.
(b) Figures as reported by Moody’s in its 2017 State Debt Medians report released May 2017. As of end of calendar year 2016.
(c) State GDP numbers have a one-year lag.
FIGURE 10
DEBT TO PERSONAL INCOME OF 10 MOST POPULOUS STATES
STATEMOODY’S/S&P/
FITCH (a)DEBT TO PERSONAL
INCOME (b)
Texas Aaa/AAA/AAA 0.80%
North Carolina Aaa/AAA/AAA 1.60%
Michigan Aa1/AA-/AA 1.60%
Florida Aa1/AAA/AAA 2.20%
Ohio Aa1/AA+/AA+ 2.50%
Georgia Aaa/AAA/AAA 2.50%
Pennsylvania Aa3/AA-/AA- 2.70%
California Aa3/AA-/AA- 4.20%
Illinois Baa3/BBB-/BBB 5.10%
New York Aa1/AA+/AA+ 5.30%
MOODY’S MEDIAN ALL STATES 2.50%
MEDIAN FOR THE 10 MOST POPULOUS STATES 2.50%
(a) Moody’s, S&P and Fitch ratings as of August 2017.
(b) Figures as reported by Moody’s in its 2017 State Debt Medians report released May 2017. As of end of calendar year 2016.
FIGURE 11
DEBT PER CAPITA OF 10 MOST POPULOUS STATES
STATEMOODY’S/S&P/
FITCH (a)DEBT PER CAPITA (b)
Texas Aaa/AAA/AAA $383
North Carolina Aaa/AAA/AAA $659
Michigan Aa1/AA-/AA $689
Florida Aa1/AAA/AAA $961
Georgia Aaa/AAA/AAA $992
Ohio Aa1/AA+/AA+ $1,087
Pennsylvania Aa3/AA-/AA- $1,337
California Aa3/AA-/AA- $2,217
Illinois Baa3/BBB-/BBB $2,511
New York Aa1/AA+/AA+ $3,070
MOODY’S MEDIAN ALL STATES $1,006
MEDIAN FOR THE 10 MOST POPULOUS STATES $1,040
(a) Moody’s, S&P and Fitch ratings as of August 2017.
(b) Figures as reported by Moody’s in its 2017 State Debt Medians report released May 2017. As of end of calendar year 2016.

STATE TREASURER’S OFFICE 13
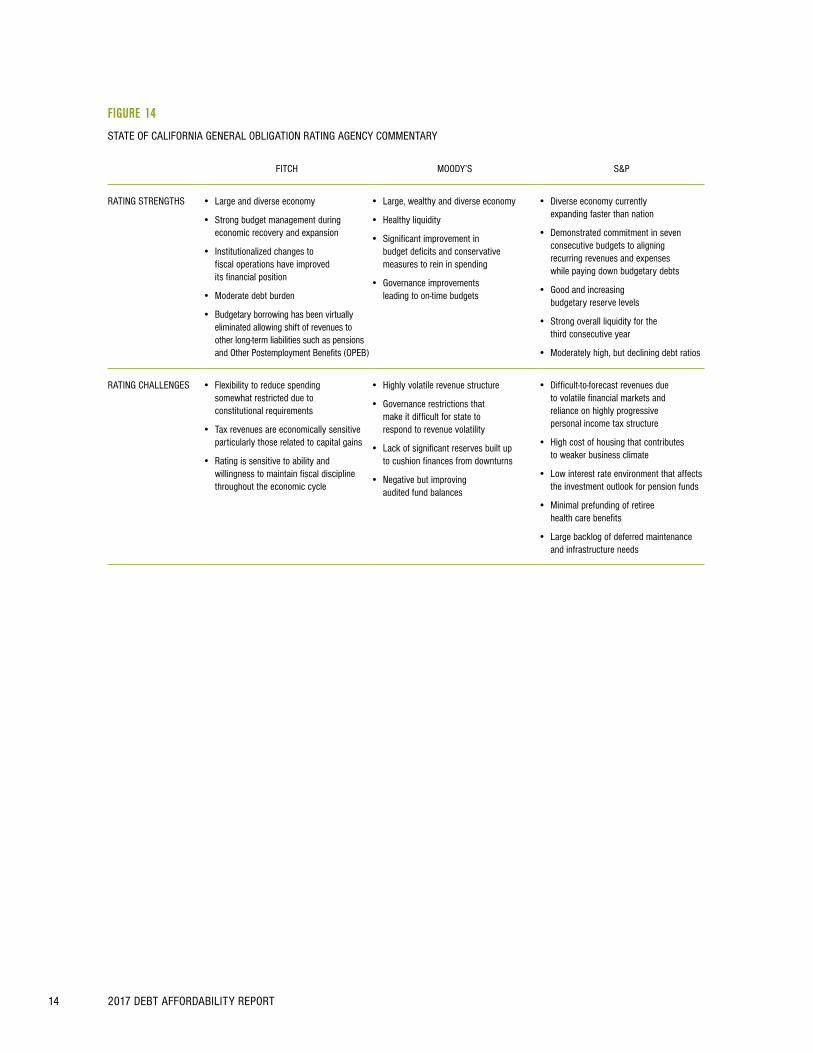
The State’s current GO bond ratings are “AA-” from Fitch, “Aa3” from Moody’s and “AA-” from S&P. A summary of rating agencies’ actions on the State’s GO bonds since the last DAR is presented in Figure 13.
Since the last DAR, a year ago, Fitch, Moody’s and S&P have maintained their “AA-”, “Aa3” and “AA-” ratings respectively. A summary of the rating agencies’ opinion of the state’s credit strengths and challenges is presented in Figure 14.
ANALYSIS OF THE STATE’S CREDIT RATINGSSECTION 4
FIGURE 13
LATEST RATING ACTIONS
RATING AGENCY
ACTION DATE
Fitch Affirmed “AA-” GO rating August 2017
Moody’s Affirmed “Aa3” GO rating August 2017
S&P Affirmed “AA-” GO rating August 2017
2017 DEBT AFFORDABILITY REPORT14
FIGURE 14
STATE OF CALIFORNIA GENERAL OBLIGATION RATING AGENCY COMMENTARY
FITCH MOODY’S S&P
RATING STRENGTHS • Large and diverse economy
• Strong budget management during economic recovery and expansion
• Institutionalized changes to fiscal operations have improved its financial position
• Moderate debt burden
• Budgetary borrowing has been virtually eliminated allowing shift of revenues to other long-term liabilities such as pensions and Other Postemployment Benefits (OPEB)
• Large, wealthy and diverse economy
• Healthy liquidity
• Significant improvement in budget deficits and conservative measures to rein in spending
• Governance improvements leading to on-time budgets
• Diverse economy currently expanding faster than nation
• Demonstrated commitment in seven consecutive budgets to aligning recurring revenues and expenses while paying down budgetary debts
• Good and increasing budgetary reserve levels
• Strong overall liquidity for the third consecutive year
• Moderately high, but declining debt ratios
RATING CHALLENGES • Flexibility to reduce spending somewhat restricted due to constitutional requirements
• Tax revenues are economically sensitive particularly those related to capital gains
• Rating is sensitive to ability and willingness to maintain fiscal discipline throughout the economic cycle
• Highly volatile revenue structure
• Governance restrictions that make it difficult for state to respond to revenue volatility
• Lack of significant reserves built up to cushion finances from downturns
• Negative but improving audited fund balances
• Difficult-to-forecast revenues due to volatile financial markets and reliance on highly progressive personal income tax structure
• High cost of housing that contributes to weaker business climate
• Low interest rate environment that affects the investment outlook for pension funds
• Minimal prefunding of retiree health care benefits
• Large backlog of deferred maintenance and infrastructure needs
STATE TREASURER’S OFFICE 15
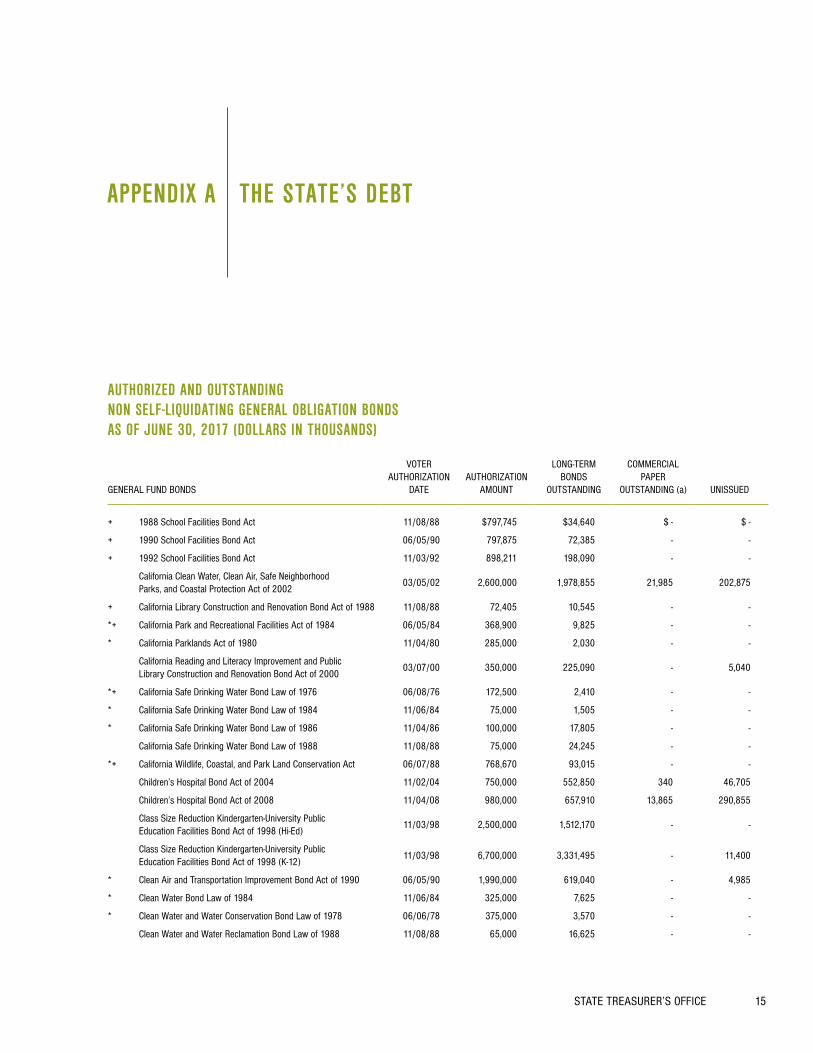
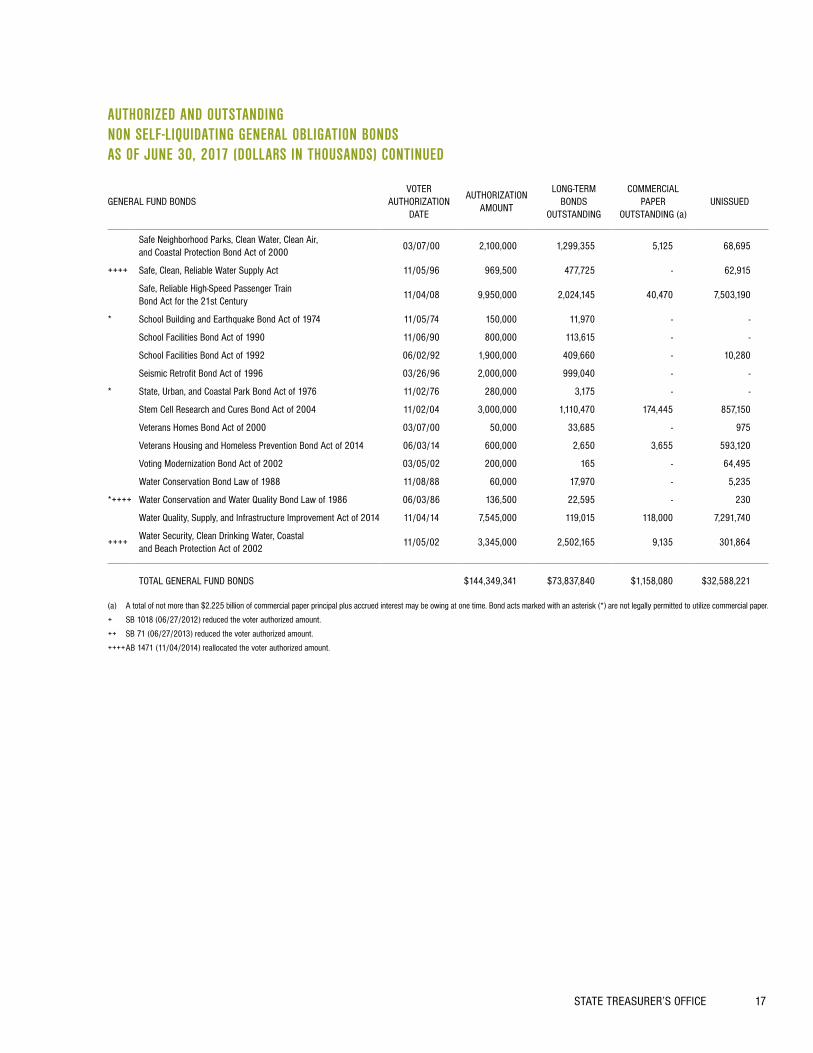
AUTHORIZED AND OUTSTANDING NON SELF-LIQUIDATING GENERAL OBLIGATION BONDS AS OF JUNE 30, 2017 (DOLLARS IN THOUSANDS)
GENERAL FUND BONDS
VOTERAUTHORIZATION
DATEAUTHORIZATION
AMOUNT
LONG-TERM BONDS
OUTSTANDING
COMMERCIAL PAPER
OUTSTANDING (a) UNISSUED
+ 1988 School Facilities Bond Act 11/08/88 $797,745 $34,640 $ - $ -
+ 1990 School Facilities Bond Act 06/05/90 797,875 72,385 - -
+ 1992 School Facilities Bond Act 11/03/92 898,211 198,090 - -
California Clean Water, Clean Air, Safe Neighborhood Parks, and Coastal Protection Act of 2002
03/05/02 2,600,000 1,978,855 21,985 202,875
+ California Library Construction and Renovation Bond Act of 1988 11/08/88 72,405 10,545 - -
*+ California Park and Recreational Facilities Act of 1984 06/05/84 368,900 9,825 - -
* California Parklands Act of 1980 11/04/80 285,000 2,030 - -
California Reading and Literacy Improvement and Public Library Construction and Renovation Bond Act of 2000
03/07/00 350,000 225,090 - 5,040
*+ California Safe Drinking Water Bond Law of 1976 06/08/76 172,500 2,410 - -
* California Safe Drinking Water Bond Law of 1984 11/06/84 75,000 1,505 - -
* California Safe Drinking Water Bond Law of 1986 11/04/86 100,000 17,805 - -
California Safe Drinking Water Bond Law of 1988 11/08/88 75,000 24,245 - -
*+ California Wildlife, Coastal, and Park Land Conservation Act 06/07/88 768,670 93,015 - -
Children’s Hospital Bond Act of 2004 11/02/04 750,000 552,850 340 46,705
Children’s Hospital Bond Act of 2008 11/04/08 980,000 657,910 13,865 290,855
Class Size Reduction Kindergarten-University Public Education Facilities Bond Act of 1998 (Hi-Ed)
11/03/98 2,500,000 1,512,170 - -
Class Size Reduction Kindergarten-University Public Education Facilities Bond Act of 1998 (K-12)
11/03/98 6,700,000 3,331,495 - 11,400
* Clean Air and Transportation Improvement Bond Act of 1990 06/05/90 1,990,000 619,040 - 4,985
* Clean Water Bond Law of 1984 11/06/84 325,000 7,625 - -
* Clean Water and Water Conservation Bond Law of 1978 06/06/78 375,000 3,570 - -
Clean Water and Water Reclamation Bond Law of 1988 11/08/88 65,000 16,625 - -
THE STATE’S DEBTAPPENDIX A
2017 DEBT AFFORDABILITY REPORT16
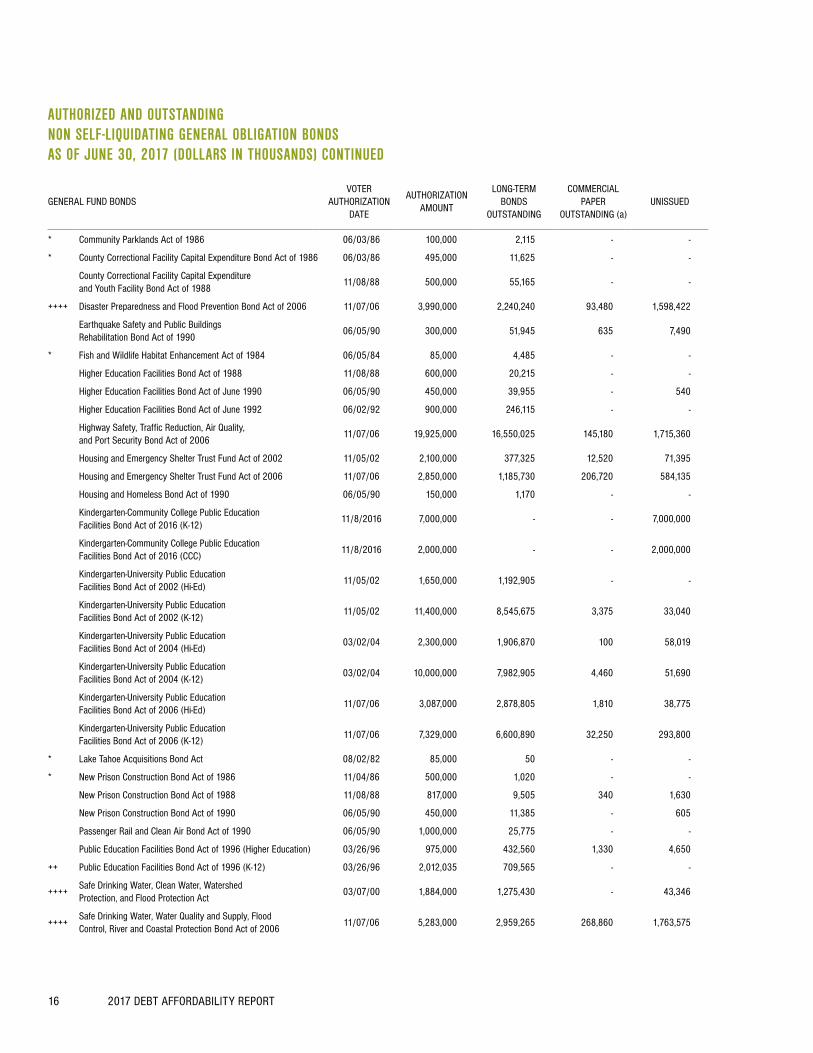
AUTHORIZED AND OUTSTANDING NON SELF-LIQUIDATING GENERAL OBLIGATION BONDS AS OF JUNE 30, 2017 (DOLLARS IN THOUSANDS) CONTINUED
GENERAL FUND BONDSVOTER
AUTHORIZATIONDATE
AUTHORIZATIONAMOUNT
LONG-TERM BONDS
OUTSTANDING
COMMERCIAL PAPER
OUTSTANDING (a) UNISSUED
* Community Parklands Act of 1986 06/03/86 100,000 2,115 - -
* County Correctional Facility Capital Expenditure Bond Act of 1986 06/03/86 495,000 11,625 - -
County Correctional Facility Capital Expenditure and Youth Facility Bond Act of 1988
11/08/88 500,000 55,165 - -
++++ Disaster Preparedness and Flood Prevention Bond Act of 2006 11/07/06 3,990,000 2,240,240 93,480 1,598,422
Earthquake Safety and Public Buildings Rehabilitation Bond Act of 1990
06/05/90 300,000 51,945 635 7,490
* Fish and Wildlife Habitat Enhancement Act of 1984 06/05/84 85,000 4,485 - -
Higher Education Facilities Bond Act of 1988 11/08/88 600,000 20,215 - -
Higher Education Facilities Bond Act of June 1990 06/05/90 450,000 39,955 - 540
Higher Education Facilities Bond Act of June 1992 06/02/92 900,000 246,115 - -
Highway Safety, Traffic Reduction, Air Quality, and Port Security Bond Act of 2006
11/07/06 19,925,000 16,550,025 145,180 1,715,360
Housing and Emergency Shelter Trust Fund Act of 2002 11/05/02 2,100,000 377,325 12,520 71,395
Housing and Emergency Shelter Trust Fund Act of 2006 11/07/06 2,850,000 1,185,730 206,720 584,135
Housing and Homeless Bond Act of 1990 06/05/90 150,000 1,170 - -
Kindergarten-Community College Public Education Facilities Bond Act of 2016 (K-12)
11/8/2016 7,000,000 - - 7,000,000
Kindergarten-Community College Public Education Facilities Bond Act of 2016 (CCC)
11/8/2016 2,000,000 - - 2,000,000
Kindergarten-University Public Education Facilities Bond Act of 2002 (Hi-Ed)
11/05/02 1,650,000 1,192,905 - -
Kindergarten-University Public Education Facilities Bond Act of 2002 (K-12)
11/05/02 11,400,000 8,545,675 3,375 33,040
Kindergarten-University Public Education Facilities Bond Act of 2004 (Hi-Ed)
03/02/04 2,300,000 1,906,870 100 58,019
Kindergarten-University Public Education Facilities Bond Act of 2004 (K-12)
03/02/04 10,000,000 7,982,905 4,460 51,690
Kindergarten-University Public Education Facilities Bond Act of 2006 (Hi-Ed)
11/07/06 3,087,000 2,878,805 1,810 38,775
Kindergarten-University Public Education Facilities Bond Act of 2006 (K-12)
11/07/06 7,329,000 6,600,890 32,250 293,800
* Lake Tahoe Acquisitions Bond Act 08/02/82 85,000 50 - -
* New Prison Construction Bond Act of 1986 11/04/86 500,000 1,020 - -
New Prison Construction Bond Act of 1988 11/08/88 817,000 9,505 340 1,630
New Prison Construction Bond Act of 1990 06/05/90 450,000 11,385 - 605
Passenger Rail and Clean Air Bond Act of 1990 06/05/90 1,000,000 25,775 - -
Public Education Facilities Bond Act of 1996 (Higher Education) 03/26/96 975,000 432,560 1,330 4,650
++ Public Education Facilities Bond Act of 1996 (K-12) 03/26/96 2,012,035 709,565 - -
++++Safe Drinking Water, Clean Water, Watershed Protection, and Flood Protection Act
03/07/00 1,884,000 1,275,430 - 43,346
++++Safe Drinking Water, Water Quality and Supply, Flood Control, River and Coastal Protection Bond Act of 2006
11/07/06 5,283,000 2,959,265 268,860 1,763,575
STATE TREASURER’S OFFICE 17
AUTHORIZED AND OUTSTANDING NON SELF-LIQUIDATING GENERAL OBLIGATION BONDS AS OF JUNE 30, 2017 (DOLLARS IN THOUSANDS) CONTINUED
GENERAL FUND BONDSVOTER
AUTHORIZATIONDATE
AUTHORIZATIONAMOUNT
LONG-TERM BONDS
OUTSTANDING
COMMERCIAL PAPER
OUTSTANDING (a) UNISSUED
Safe Neighborhood Parks, Clean Water, Clean Air, and Coastal Protection Bond Act of 2000
03/07/00 2,100,000 1,299,355 5,125 68,695
++++ Safe, Clean, Reliable Water Supply Act 11/05/96 969,500 477,725 - 62,915
Safe, Reliable High-Speed Passenger Train Bond Act for the 21st Century
11/04/08 9,950,000 2,024,145 40,470 7,503,190
* School Building and Earthquake Bond Act of 1974 11/05/74 150,000 11,970 - -
School Facilities Bond Act of 1990 11/06/90 800,000 113,615 - -
School Facilities Bond Act of 1992 06/02/92 1,900,000 409,660 - 10,280
Seismic Retrofit Bond Act of 1996 03/26/96 2,000,000 999,040 - -
* State, Urban, and Coastal Park Bond Act of 1976 11/02/76 280,000 3,175 - -
Stem Cell Research and Cures Bond Act of 2004 11/02/04 3,000,000 1,110,470 174,445 857,150
Veterans Homes Bond Act of 2000 03/07/00 50,000 33,685 - 975
Veterans Housing and Homeless Prevention Bond Act of 2014 06/03/14 600,000 2,650 3,655 593,120
Voting Modernization Bond Act of 2002 03/05/02 200,000 165 - 64,495
Water Conservation Bond Law of 1988 11/08/88 60,000 17,970 - 5,235
*++++ Water Conservation and Water Quality Bond Law of 1986 06/03/86 136,500 22,595 - 230
Water Quality, Supply, and Infrastructure Improvement Act of 2014 11/04/14 7,545,000 119,015 118,000 7,291,740
++++Water Security, Clean Drinking Water, Coastal and Beach Protection Act of 2002
11/05/02 3,345,000 2,502,165 9,135 301,864
TOTAL GENERAL FUND BONDS $144,349,341 $73,837,840 $1,158,080 $32,588,221
(a) A total of not more than $2.225 billion of commercial paper principal plus accrued interest may be owing at one time. Bond acts marked with an asterisk (*) are not legally permitted to utilize commercial paper.
+ SB 1018 (06/27/2012) reduced the voter authorized amount.
++ SB 71 (06/27/2013) reduced the voter authorized amount.
++++ AB 1471 (11/04/2014) reallocated the voter authorized amount.
2017 DEBT AFFORDABILITY REPORT18
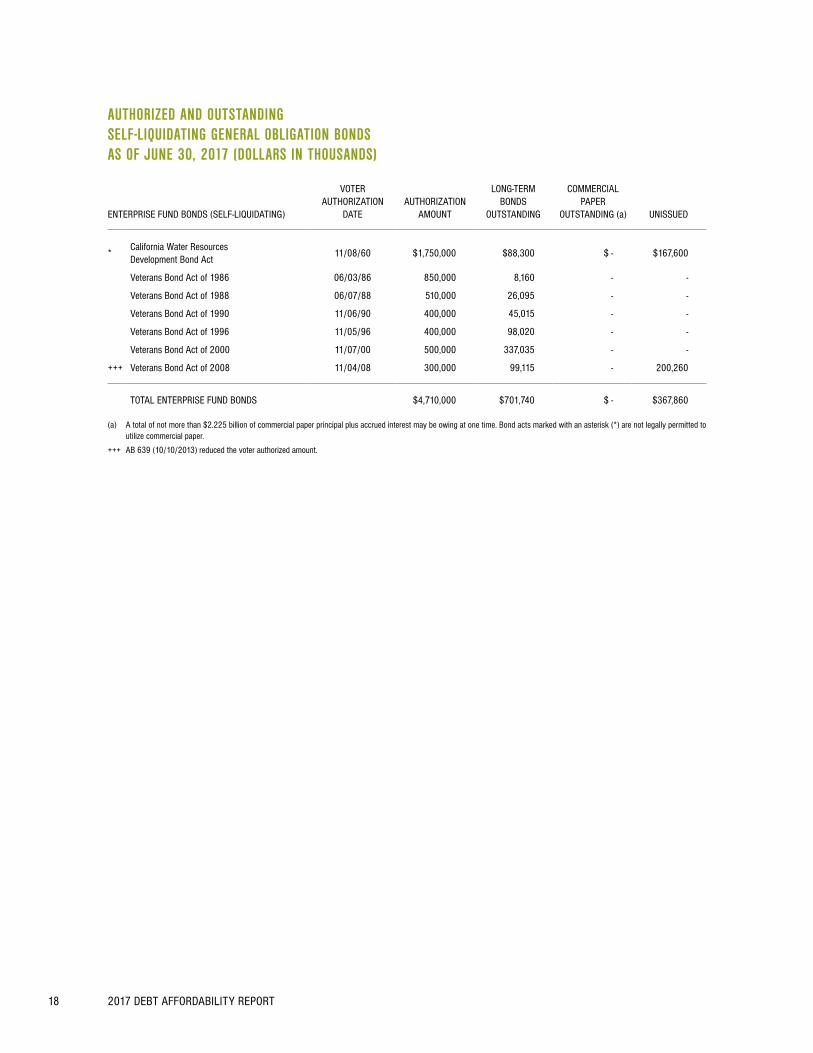
AUTHORIZED AND OUTSTANDING SELF-LIQUIDATING GENERAL OBLIGATION BONDS AS OF JUNE 30, 2017 (DOLLARS IN THOUSANDS)
ENTERPRISE FUND BONDS (SELF-LIQUIDATING)
VOTER AUTHORIZATION
DATEAUTHORIZATION
AMOUNT
LONG-TERM BONDS
OUTSTANDING
COMMERCIAL PAPER
OUTSTANDING (a) UNISSUED
*California Water Resources Development Bond Act
11/08/60 $1,750,000 $88,300 $ - $167,600
Veterans Bond Act of 1986 06/03/86 850,000 8,160 - -
Veterans Bond Act of 1988 06/07/88 510,000 26,095 - -
Veterans Bond Act of 1990 11/06/90 400,000 45,015 - -
Veterans Bond Act of 1996 11/05/96 400,000 98,020 - -
Veterans Bond Act of 2000 11/07/00 500,000 337,035 - -
+++ Veterans Bond Act of 2008 11/04/08 300,000 99,115 - 200,260
TOTAL ENTERPRISE FUND BONDS $4,710,000 $701,740 $ - $367,860
(a) A total of not more than $2.225 billion of commercial paper principal plus accrued interest may be owing at one time. Bond acts marked with an asterisk (*) are not legally permitted to utilize commercial paper.
+++ AB 639 (10/10/2013) reduced the voter authorized amount.

STATE TREASURER’S OFFICE 19
AUTHORIZED AND OUTSTANDING LEASE REVENUE BONDS AS OF JUNE 30, 2017 (DOLLARS IN THOUSANDS)
GENERAL FUND-SUPPORTED ISSUES OUTSTANDING AUTHORIZED
BUT UNISSUED
STATE PUBLIC WORKS BOARD
California Community Colleges $182,140 $ -
California Department of Corrections and Rehabilitation 4,128,655 2,595,585
Trustees of the California State University 180,865 49,909
Various State Facilities (a) 4,675,830 2,217,187
TOTAL STATE PUBLIC WORKS BOARD ISSUES $9,167,490 $4,862,681
TOTAL OTHER STATE FACILITIES LEASE-REVENUE ISSUES (b) $232,585 $ -
TOTAL GENERAL FUND-SUPPORTED ISSUES $9,400,075 $4,862,681
(a) Includes projects that are supported by multiple funding sources in addition to the General Fund.
(b) Includes $62,435,000 Sacramento City Financing Authority Lease-Revenue Refunding Bonds State of California - Cal/EPA Building, 2013 Series A, which are supported by lease rentals from the California Environmental Protection Agency; these rental payments are subject to annual appropriation by the State Legislature.


STATE TREASURER’S OFFICE 21
THE STATE’S DEBT SERVICEAPPENDIX B
2017 DEBT AFFORDABILITY REPORT22
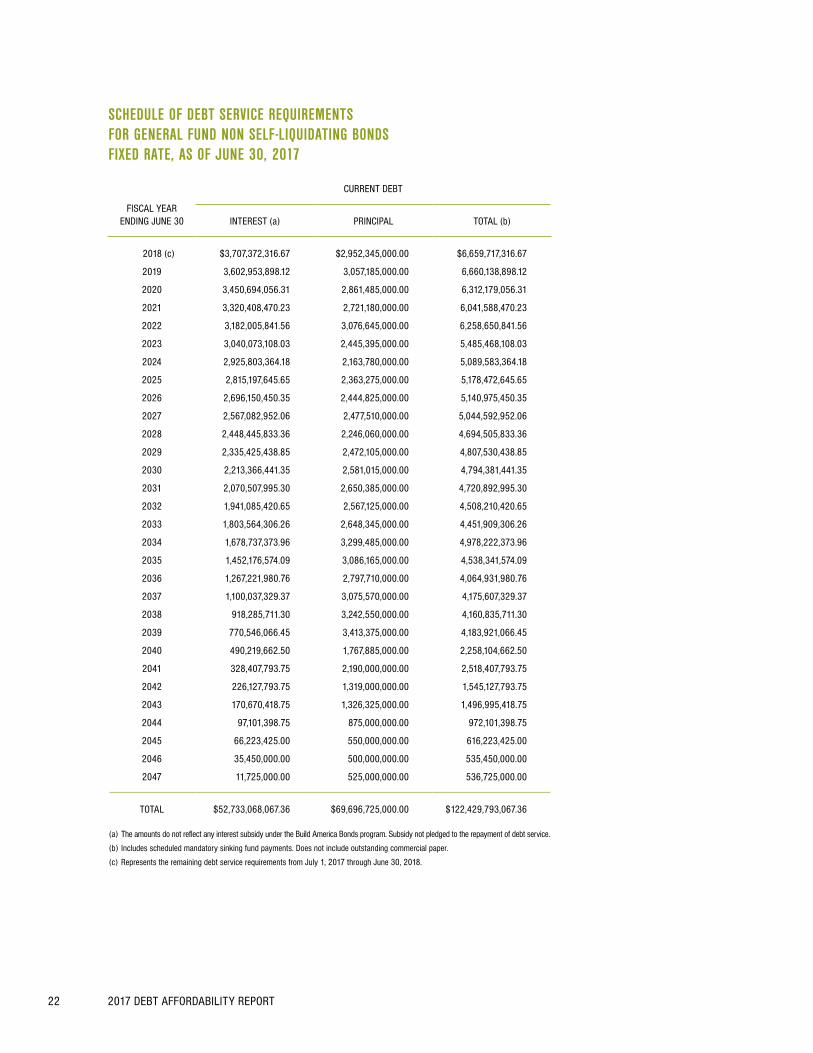
SCHEDULE OF DEBT SERVICE REQUIREMENTS FOR GENERAL FUND NON SELF-LIQUIDATING BONDS FIXED RATE, AS OF JUNE 30, 2017
FISCAL YEARENDING JUNE 30
CURRENT DEBT
INTEREST (a) PRINCIPAL TOTAL (b)
2018 (c) $3,707,372,316.67 $2,952,345,000.00 $6,659,717,316.67
2019 3,602,953,898.12 3,057,185,000.00 6,660,138,898.12
2020 3,450,694,056.31 2,861,485,000.00 6,312,179,056.31
2021 3,320,408,470.23 2,721,180,000.00 6,041,588,470.23
2022 3,182,005,841.56 3,076,645,000.00 6,258,650,841.56
2023 3,040,073,108.03 2,445,395,000.00 5,485,468,108.03
2024 2,925,803,364.18 2,163,780,000.00 5,089,583,364.18
2025 2,815,197,645.65 2,363,275,000.00 5,178,472,645.65
2026 2,696,150,450.35 2,444,825,000.00 5,140,975,450.35
2027 2,567,082,952.06 2,477,510,000.00 5,044,592,952.06
2028 2,448,445,833.36 2,246,060,000.00 4,694,505,833.36
2029 2,335,425,438.85 2,472,105,000.00 4,807,530,438.85
2030 2,213,366,441.35 2,581,015,000.00 4,794,381,441.35
2031 2,070,507,995.30 2,650,385,000.00 4,720,892,995.30
2032 1,941,085,420.65 2,567,125,000.00 4,508,210,420.65
2033 1,803,564,306.26 2,648,345,000.00 4,451,909,306.26
2034 1,678,737,373.96 3,299,485,000.00 4,978,222,373.96
2035 1,452,176,574.09 3,086,165,000.00 4,538,341,574.09
2036 1,267,221,980.76 2,797,710,000.00 4,064,931,980.76
2037 1,100,037,329.37 3,075,570,000.00 4,175,607,329.37
2038 918,285,711.30 3,242,550,000.00 4,160,835,711.30
2039 770,546,066.45 3,413,375,000.00 4,183,921,066.45
2040 490,219,662.50 1,767,885,000.00 2,258,104,662.50
2041 328,407,793.75 2,190,000,000.00 2,518,407,793.75
2042 226,127,793.75 1,319,000,000.00 1,545,127,793.75
2043 170,670,418.75 1,326,325,000.00 1,496,995,418.75
2044 97,101,398.75 875,000,000.00 972,101,398.75
2045 66,223,425.00 550,000,000.00 616,223,425.00
2046 35,450,000.00 500,000,000.00 535,450,000.00
2047 11,725,000.00 525,000,000.00 536,725,000.00
TOTAL $52,733,068,067.36 $69,696,725,000.00 $122,429,793,067.36
(a) The amounts do not reflect any interest subsidy under the Build America Bonds program. Subsidy not pledged to the repayment of debt service.
(b) Includes scheduled mandatory sinking fund payments. Does not include outstanding commercial paper.
(c) Represents the remaining debt service requirements from July 1, 2017 through June 30, 2018.

STATE TREASURER’S OFFICE 23
SCHEDULE OF DEBT SERVICE REQUIREMENTS FOR GENERAL FUND NON SELF-LIQUIDATING BONDS VARIABLE RATE, AS OF JUNE 30, 2017
FISCAL YEARENDING JUNE 30
CURRENT DEBT
INTEREST (a) PRINCIPAL TOTAL (b)
2018 (c) $62,643,299.11 $243,305,000.00 $305,948,299.11
2019 60,983,045.96 113,420,000.00 174,403,045.96
2020 59,627,644.57 105,500,000.00 165,127,644.57
2021 58,606,360.27 154,400,000.00 213,006,360.27
2022 57,027,196.93 39,200,000.00 96,227,196.93
2023 56,726,728.00 121,100,000.00 177,826,728.00
2024 55,064,046.75 233,600,000.00 288,664,046.75
2025 52,286,964.79 176,400,000.00 228,686,964.79
2026 50,131,478.55 263,300,000.00 313,431,478.55
2027 46,452,031.04 274,600,000.00 321,052,031.04
2028 36,760,683.17 559,000,000.00 595,760,683.17
2029 26,396,912.54 467,700,000.00 494,096,912.54
2030 20,080,818.58 364,390,000.00 384,470,818.58
2031 14,585,301.56 323,600,000.00 338,185,301.56
2032 8,876,200.30 425,600,000.00 434,476,200.30
2033 2,835,953.05 271,400,000.00 274,235,953.05
2034 59,216.95 1,600,000.00 1,659,216.95
2035 48,593.00 - 48,593.00
2036 48,708.56 - 48,708.56
2037 48,477.44 - 48,477.44
2038 48,593.00 - 48,593.00
2039 48,593.00 - 48,593.00
2040 47,936.09 1,000,000.00 1,047,936.09
2041 40,404.36 - 40,404.36
2042 40,282.58 - 40,282.58
2043 40,282.58 - 40,282.58
2044 40,362.48 - 40,362.48
2045 40,303.52 - 40,303.52
2046 40,333.00 - 40,333.00
2047 37,257.43 2,000,000.00 2,037,257.43
TOTAL $669,714,009.16 $4,141,115,000.00 $4,810,829,009.16
(a) The estimate of future interest payments is based on rates in effect as of June 30, 2017. The interest rates for the daily, weekly and monthly rate bonds range from 0.56 - 2.06%. The Highway Safety, Traffic Reduction, Air Quality, and Port Security Bond Act of 2006, Series 2013B & 2016A currently bear interest at a fixed rate of 4.00%, and Series 2014A bears interest at a fixed rate of 3.00% (the “Prop 1B Put Bonds”); the Safe, Reliable High-Speed Passenger Train Bond Act for the 21st Century, Series 2017B (the “Prop 1A Put Bonds”) currently bears interest at a fixed rate of 2.193%; until each series respective reset dates, both the Prop 1B Put Bonds and the Prop 1A Put Bonds, and are assumed to bear the respective rates for each such series from reset until maturity.
(b) Includes scheduled mandatory sinking fund payments. Does not include outstanding commercial paper.
(c) Represents the remaining estimated debt service requirements from July 1, 2017 through June 30, 2018.
2017 DEBT AFFORDABILITY REPORT24
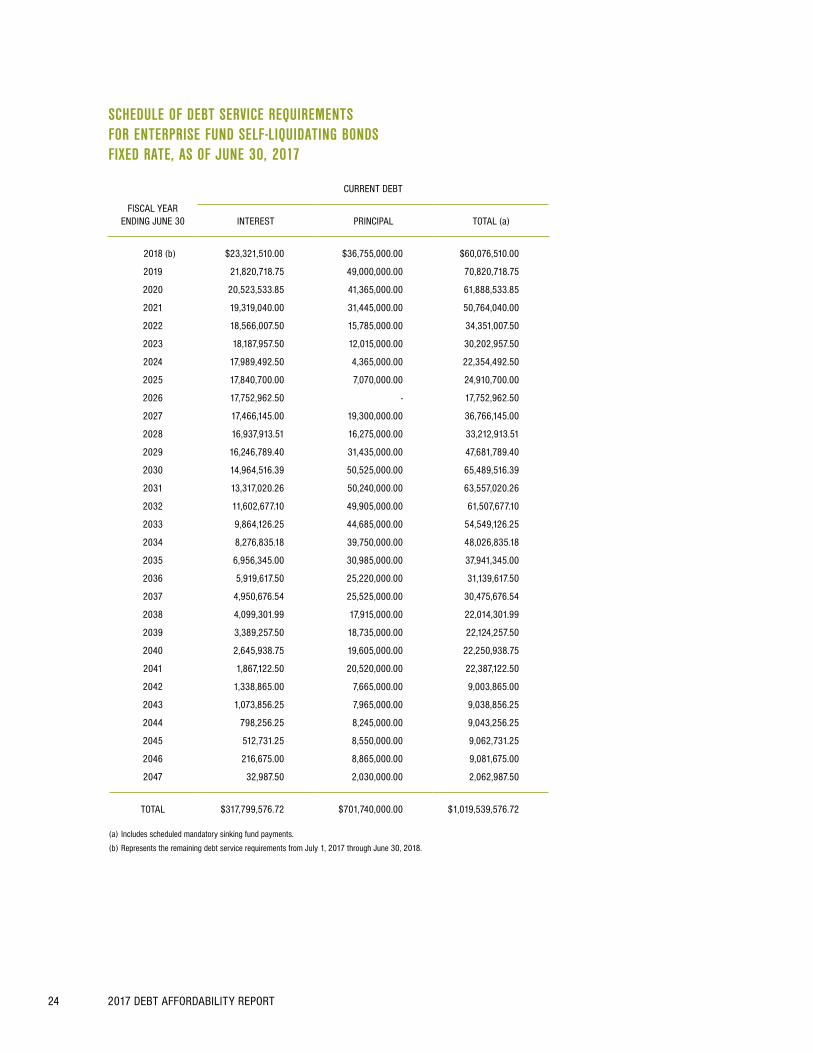
SCHEDULE OF DEBT SERVICE REQUIREMENTS FOR ENTERPRISE FUND SELF-LIQUIDATING BONDS FIXED RATE, AS OF JUNE 30, 2017
FISCAL YEARENDING JUNE 30
CURRENT DEBT
INTEREST PRINCIPAL TOTAL (a)
2018 (b) $23,321,510.00 $36,755,000.00 $60,076,510.00
2019 21,820,718.75 49,000,000.00 70,820,718.75
2020 20,523,533.85 41,365,000.00 61,888,533.85
2021 19,319,040.00 31,445,000.00 50,764,040.00
2022 18,566,007.50 15,785,000.00 34,351,007.50
2023 18,187,957.50 12,015,000.00 30,202,957.50
2024 17,989,492.50 4,365,000.00 22,354,492.50
2025 17,840,700.00 7,070,000.00 24,910,700.00
2026 17,752,962.50 - 17,752,962.50
2027 17,466,145.00 19,300,000.00 36,766,145.00
2028 16,937,913.51 16,275,000.00 33,212,913.51
2029 16,246,789.40 31,435,000.00 47,681,789.40
2030 14,964,516.39 50,525,000.00 65,489,516.39
2031 13,317,020.26 50,240,000.00 63,557,020.26
2032 11,602,677.10 49,905,000.00 61,507,677.10
2033 9,864,126.25 44,685,000.00 54,549,126.25
2034 8,276,835.18 39,750,000.00 48,026,835.18
2035 6,956,345.00 30,985,000.00 37,941,345.00
2036 5,919,617.50 25,220,000.00 31,139,617.50
2037 4,950,676.54 25,525,000.00 30,475,676.54
2038 4,099,301.99 17,915,000.00 22,014,301.99
2039 3,389,257.50 18,735,000.00 22,124,257.50
2040 2,645,938.75 19,605,000.00 22,250,938.75
2041 1,867,122.50 20,520,000.00 22,387,122.50
2042 1,338,865.00 7,665,000.00 9,003,865.00
2043 1,073,856.25 7,965,000.00 9,038,856.25
2044 798,256.25 8,245,000.00 9,043,256.25
2045 512,731.25 8,550,000.00 9,062,731.25
2046 216,675.00 8,865,000.00 9,081,675.00
2047 32,987.50 2,030,000.00 2,062,987.50
TOTAL $317,799,576.72 $701,740,000.00 $1,019,539,576.72
(a) Includes scheduled mandatory sinking fund payments.
(b) Represents the remaining debt service requirements from July 1, 2017 through June 30, 2018.
STATE TREASURER’S OFFICE 25
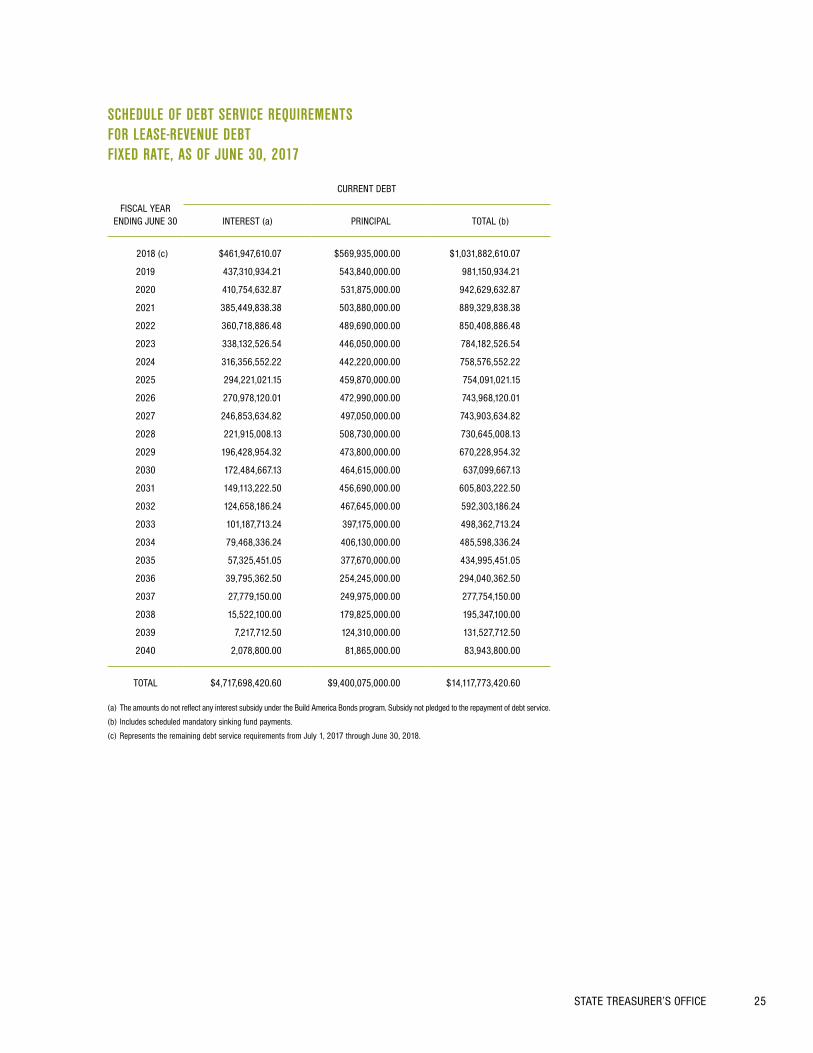
SCHEDULE OF DEBT SERVICE REQUIREMENTS FOR LEASE-REVENUE DEBT FIXED RATE, AS OF JUNE 30, 2017
FISCAL YEARENDING JUNE 30
CURRENT DEBT
INTEREST (a) PRINCIPAL TOTAL (b)
2018 (c) $461,947,610.07 $569,935,000.00 $1,031,882,610.07
2019 437,310,934.21 543,840,000.00 981,150,934.21
2020 410,754,632.87 531,875,000.00 942,629,632.87
2021 385,449,838.38 503,880,000.00 889,329,838.38
2022 360,718,886.48 489,690,000.00 850,408,886.48
2023 338,132,526.54 446,050,000.00 784,182,526.54
2024 316,356,552.22 442,220,000.00 758,576,552.22
2025 294,221,021.15 459,870,000.00 754,091,021.15
2026 270,978,120.01 472,990,000.00 743,968,120.01
2027 246,853,634.82 497,050,000.00 743,903,634.82
2028 221,915,008.13 508,730,000.00 730,645,008.13
2029 196,428,954.32 473,800,000.00 670,228,954.32
2030 172,484,667.13 464,615,000.00 637,099,667.13
2031 149,113,222.50 456,690,000.00 605,803,222.50
2032 124,658,186.24 467,645,000.00 592,303,186.24
2033 101,187,713.24 397,175,000.00 498,362,713.24
2034 79,468,336.24 406,130,000.00 485,598,336.24
2035 57,325,451.05 377,670,000.00 434,995,451.05
2036 39,795,362.50 254,245,000.00 294,040,362.50
2037 27,779,150.00 249,975,000.00 277,754,150.00
2038 15,522,100.00 179,825,000.00 195,347,100.00
2039 7,217,712.50 124,310,000.00 131,527,712.50
2040 2,078,800.00 81,865,000.00 83,943,800.00
TOTAL $4,717,698,420.60 $9,400,075,000.00 $14,117,773,420.60
(a) The amounts do not reflect any interest subsidy under the Build America Bonds program. Subsidy not pledged to the repayment of debt service.
(b) Includes scheduled mandatory sinking fund payments.
(c) Represents the remaining debt service requirements from July 1, 2017 through June 30, 2018.

2017 DEBT AFFORDABILITY REPORT26
ESTIMATED DEBT SERVICE REQUIREMENTS ON INTENDED SALES OF AUTHORIZED BUT UNISSUED BONDS DURING FISCAL YEARS 2017-18 AND 2018-19
FISCAL YEARENDINGJUNE 30
FY 2017-18GO SALES
DEBT SERVICE
FY 2018-19GO SALES
DEBT SERVICE
FY 2017-18LRB SALES
DEBT SERVICE
FY 2018-19LRB SALES
DEBT SERVICE
TOTALDEBT SERVICE
ALL SALES
2018 $51,450,000 $ - $5,292,870 $ - $56,742,870
2019 355,545,190 51,000,000 46,882,085 4,148,178 $457,575,453
2020 355,544,110 130,177,668 46,884,910 15,125,458 $547,732,145
2021 355,543,515 130,179,370 46,901,280 15,128,460 $547,752,625
2022 355,544,510 130,176,895 46,879,445 15,125,660 $547,726,510
2023 355,542,755 130,181,035 46,882,790 15,121,130 $547,727,710
2024 355,548,700 130,177,455 46,888,745 15,128,413 $547,743,313
2025 355,542,090 130,181,565 46,884,090 15,126,183 $547,733,928
2026 355,547,695 130,178,520 46,886,880 15,123,380 $547,736,475
2027 355,549,135 130,178,348 46,878,945 15,123,548 $547,729,975
2028 355,545,030 130,180,565 46,878,205 15,125,095 $547,728,895
2029 355,543,450 130,179,563 46,886,000 15,126,433 $547,735,445
2030 355,546,680 130,179,475 46,878,940 15,125,970 $547,731,065
2031 355,541,535 130,179,055 46,884,590 15,126,985 $547,732,165
2032 355,544,385 130,181,673 46,883,690 15,127,623 $547,737,370
2033 355,545,475 130,180,443 46,882,985 15,126,028 $547,734,930
2034 355,545,050 130,178,225 16,329,090 15,120,345 $517,172,710
2035 355,547,100 130,177,370 16,331,400 - $502,055,870
2036 355,545,300 130,179,718 16,339,860 - $502,064,878
2037 355,542,515 130,176,853 16,328,270 - $502,047,638
2038 355,545,720 130,179,850 16,326,165 - $502,051,735
2039 355,545,975 130,179,275 16,326,990 - $502,052,240
2040 355,543,660 130,180,310 16,329,300 - $502,053,270
2041 355,543,370 130,177,628 16,326,540 - $502,047,538
2042 355,543,340 130,180,263 16,332,535 - $502,056,138
2043 355,546,255 130,176,740 16,330,485 - $502,053,480
2044 355,543,415 130,179,948 - - $485,723,363
2045 355,545,360 130,177,135 - - $485,722,495
2046 355,546,375 130,179,915 - - $485,726,290
2047 355,544,490 130,179,135 - - $485,723,625
2048 355,541,845 130,180,005 - - $485,721,850
2049 130,176,970 - - $130,176,970
TOTAL $10,717,794,025 $3,956,370,965 $871,857,085 $231,028,886 $15,777,050,960


JOHN CHIANG | CALIFORNIA STATE TREASURER
915 Capitol Mall, Room 110 Sacramento, California 95814
(916) 653-2995
WWW.TREASURER.CA.GOV