strength characteristics of compressed …
TRANSCRIPT

STRENGTH CHARACTERISTICS OF
COMPRESSED STABILIZED EARTH BLOCK MADE WITH
SELECTED REGIONAL SOIL
KAMRUN NAHAR
MASTER OF SCIENCE IN CIVIL ENGINEERING (GEOTECHNICAL)
DEPARTMENT OF CIVIL ENGINEERING
BANGLADESH UNIVERSITY OF ENGINEERING AND TECHNOLOGY
DHAKA-1000, BANGLADESH
AUGUST, 2018

STRENGTH CHARACTERISTICS OF COMPRESSED STABILIZED EARTH BLOCK MADE WITH
SELECTED REGIONAL SOIL
By Kamrun Nahar
Student ID: 0413042204
A thesis submitted to the Department of Civil Engineering, Bangladesh University of
Engineering and Technology, Dhaka, in partial fulfillment of the requirements for the
degree of
Master of Science in Civil Engineering (Geotechnical)
DEPARTMENT OF CIVIL ENGINEERING
BANGLADESH UNIVERSITY OF ENGINEERING AND TECHNOLOGY
DHAKA-1000
August, 2018


i
ACKNOWLEDGEMENT
All praise is due to the Almighty, the most merciful and the most beneficent.
Then I would like to express my humble gratitude to my supervisor Dr. Mohammad
Shariful Islam for his continuous guidance, invaluable constructive suggestions,
encouragement, generous help and unfailing enthusiasm at every stage of the study.
Sincere appreciation goes to Mr. Kalipada Sarker, Managaer, CCDB HOPE
CENTRE, Savar, Dhaka to lend the earth block press machine “Auram Earth Block
3000 Press”. Also, thanks to all the members of CCDB HOPE CENTRE for helping
in this research. I would also like to take the opportunity of expressing sincere
appreciation to Mr. Willem Gees, Managing Director, Inclusive Home Solution Ltd.,
for his essential support, cooperation and suggestions throughout the research work,
without which this study would have been impossible.
Thanks are due to all staffs and lab instructor of Geotechnical and Structural
Engineering Laboratory in the Department of Civil Engineering for their help for
successful completion of all lab experiments.
Finally, and most importantly, I am forever grateful to my parents specially my
mother and to my family for their love, concern, care and faith. I also greatly
appreciate my husband for his continuous inspiration and support during my research
work. Lastly, I want to dedicate this work in the memory of my late father who
always inspires me silently to move forward.
ii
ABSTRACT
Earth as a construction material has been used for thousands of years by civilizations
all over the world. Due to low cost and relative abundance of materials, building with
Compressed Stabilized Earth Block (CSEB) is becoming popular now-a-days mainly
in less flood-prone areas. Strength-deformation characteristics of CSEB is the main
focus of this research. Soil samples were collected from Savar (red clay) and 7
different places of Shariatpur (floodplain) district in Bangladesh. For making CSEB,
sand, cement, jute and lime were used as stabilizer with the selected soil. This
research work evaluates the effects of sand, cement, jute, and lime on the
compressive strength and deformation characteristics of CSEB. In this research
work, a total of 57 groups CSEB was prepared. Extensive experimental investigation
has been carried out to evaluate the effects of different grain size of sand (coarse
sand, fine sand and mixes of fine and coarse sand) with the addition of cement in a
certain proportion on the compressive strength of Cement Sand Stabilized Block
(CSSB). For making CSSB, 3-9% cement was used with 20-60% coarse sand and in
some cases 30-60% mixed sand (mixes of coarse sand and fine sand) by weight. In
addition to that, one group of compressed earth block was prepared without any
stabilizer so that improvements due to stabilization can be studied as compared to the
performance of non-stabilized blocks. A series of blocks having dimension of 240
mm × 115 mm × 90 mm were molded using “Auram Earth Block Press 3000”. After
manufacturing, the blocks were cured for 28 days at natural weather condition. Unit
weight, moisture content, compressive strength and water absorption capacity test of
the CSEBs were conducted after proper curing. The compressive strength (average
strength of five blocks) of CSEB was found to be between 0.89 and 6.07 MPa
consisting of 3-9% cement, 20-60% coarse sand and 50-60% fine sand by weight.
Moisture content and unit weight of CSEBs were varied from 0.2 to 19% and 1.2 to
2.1 gm/cm3, respectively. However, the results obtained from this study may be
useful in reducing the consumption of fired brick used as non-load bearing building
block in construction sector of Bangladesh.

iii
TABLE OF CONTENTS
ACKNOWLEDGEMENT i
ABSTRACT ii
TABLE OF CONTENTS iii
LIST OF FIGURES vi
LIST OF TABLES xi
ACRONYMS xiii
Chapter 1: INTRODUCTION 1
1.1 General 1
1.2 Background of the Research Work 3
1.3 Methodology 5
1.4 Thesis Layout 5
Chapter 2: LITERATURE REVIEW 7
2.1 General 7
2.2 Techniques for Earth Construction 7
2.2.1 Cob 8
2.2.2 Adobe 9
2.2.3 Wattle and daub 10
2.2.4 Rammed earth 10
2.2.5 Compressed earth block 11
2.3 Stabilization of Soil 11
2.3.1 Methods and techniques of stabilization 12
2.4 Compaction of Soil as a Building Material 15
2.5 Performance of Soil as a Building Material 16
2.6 Earthen Construction Scenario in the World 17
2.7 Earthen House Practice in Bangladesh 20
2.8 Aspects of CSEB in Bangladesh 24
2.9 Benefits of Construction Houses with Soil 27
2.10 Disadvantages of Compressed Earth Block Technology 27
2.11 Solutions to the Problems of CSEB 28
2.12 Summary 29

iv
Chapter 3: EXPERIMENTAL PROGRAME 30
3.1 General 30
3.2 Collection of Soil Sample 31
3.3 Selection of Soil 34
3.4 Soil Classification 34
3.4.1 Laboratory tests on collected soil samples 34
3.5 Soil Stabilization 35
3.5.1 Stabilization of soil with lime 35
3.5.2 Stabilization of soil with cement and sand 36
3.5.3 Stabilization of soil with jute 37
3.6 CSEB Preparation 38
3.6.1 CSEB preparation for compressive strength test 38
3.6.2 CSEB preparation for crushing strength test 41
3.6.2.1 Soil preparation 41
3.6.2.2 Weathering 41
3.6.2.3 Pulverizing 42
3.6.2.4 Measuring and mixing 43
3.6.2.5 Pressing 43
3.6.2.6 Filling of mold 44
3.6.2.7 Pressing and handling the fresh block 44
3.6.2.8 Initial curing and stacking 44
3.6.2.9 Final stacking and curing 45
3.6.2.10 Proportions of soil-sand-cement mix 46
3.6.2.11 Definitions of CSSB specimens prepared for crushing strength test
47
3.7 Experimental Setup 50
3.7.1 Compressive strength test 50
3.7.2 Crushing strength test 52
3.7.3 Moisture content test 55
3.7.4 Water absorption capacity test on wet CSSB specimens 56
3.7.5 Crushing strength test on wet CSSB specimens 57
3.8 Test Plan 57

v
3.9 Summary 57
Chapter 4: TEST RESULTS AND DISCUSSIONS 58
4.1 General 58
4.2 Index Properties of Collected Soil Samples 58
4.3 CSEB Stabilization Plan 60
4.4 Properties of CSEB Specimens Made for Compressive Strength Test 61
4.4.1 Comparison of strength and deformation properties of CSEB specimens
69
4.5 Properties of CSSB Specimens Made for Crushing Strength Test 69
4.6 Compressive Strength of Unstabilized Block (USB) Prepared for Crushing Strength Test
75
4.7 Variation of Compressive Strength of CSSB Specimens with Cement Content
75
4.7.1 Variation of compressive strength of CSSB specimens with cement content for 20% coarse sand
76
4.7.2 Variation of compressive strength of CSSB specimens with cement content for 30% coarse sand
78
4.7.3 Variation of compressive strength of CSSB specimens with cement content for 40% coarse sand
80
4.7.4 Variation of compressive strength of CSSB specimens with cement content for 50% coarse sand
82
4.7.5 Variation of compressive strength of CSSB specimens with cement content for 60% coarse sand
84
4.8 Variation of Compressive Strength of CSSB Specimens with Coarse Sand Content
87
4.9 Variation of Compressive Strength of CSSB Specimens with Mixed Sand Content
94
4.10 Compressive Strength of CSSB Specimens Greater than 5 MPa 98
4.11 Tests on Wet CSSB Specimens 99
4.12 Summary 107
Chapter 5: CONCLUSIONS AND SUGGESTIONS 108
5.1 Findings of the Study 108
5.2 Suggestions for Future Study 108
REFERENCES 110
APPENDIX-A: LABORATORY TEST RESULTS 116

vi
LIST OF FIGURES
Figure 2.1 The 12 principal earth construction technique (Auroville Earth Institute, 2018)
8
Figure 2.2 Photograph of cob structure (Kim-Carberry, 2011) 9
Figure 2.3 Typical adobe blocks (Varga, 2009) 9
Figure 2.4 Photograph of wattle and daub (Dreamstime.com, 2010) 10
Figure 2.5 Photograph of rammed earth wall (Gowda, 2016) 10
Figure 2.6 Typical compressed earth blocks (Tadege, 2007) 11
Figure 2.7 Earth construction areas of the world (Auroville Earth Institute, 2018)
17
Figure 2.8 Photographs of earthen structures around the world: (a) Vaults of the Ramasseum, built in 1300 BC in Egypt, (b) Visitors center, finished on 1992 in Auroville and (c) 10.35 m span segmental vault at Deepanam school, Auroville
19
Figure 2.9 Map showing earthen house distribution of Bangladesh (Rural house, Banglapedia)
21
Figure 2.10 Photographs of typical earthen houses: (a) Mud house, (b) CI sheets as a building material and (c) Bamboo thatch material
22
Figure 2.11 Photographs of earthen structures: (a) METI (Modern Education and Training Institute) and (b) CSEB house in Rudrapur, Netrokona, Bangladesh
23
Figure 2.12 Photograph of CSEB building in CCDB HOPE CENTRE premises, Savar, Bangladesh
24
Figure 2.13 Photograph of pollution by brick kilns in Bangladesh (Published in Dhaka Tribune on 9 th November, 2017)
25
Figure 2.14 Comparison between FCB and CSEB with respect to: (a) Embodied energy value, (b) Pollution emission and (c) Production cost
26
Figure 3.1 Location of soil sample collection from Savar 32
Figure 3.2 Locations of soil sample collections from Shariatpur 33
Figure 3.3 Photographs of preparing quicklime: (a) Grinding the limestone and (b) Oven drying of lime
36
Figure 3.4 Photographs of: (a) 3 cm pieces jute and (b) Jute fiber 38
Figure 3.5 Photographs for production of CSEB specimens: (a) Soil grinding for making CSEB (b) Press 3000 Multi-Mold Manual Press Machine (c) Making earthen blocks in press machine and (d) Prepared blocks
39
vii
Figure 3.6 Photograph of CSEB specimens during curing period 40
Figure 3.7 Soil pulverizing machine: (a) and (b) “Soeng Thai Soil Pulverizer Model SP3”
42
Figure 3.8 Block producing machine: “Auram Earth Block Press 3000” 43
Figure 3.9 Preparation of CSSB specimens in Shariatpur by Inclusive Home Solution (IHS) Ltd.
45
Figure 3.10 Illustration for identification system of CSSB specimens 47
Figure 3.11 Photograph of Universal Testing Machine: Tinius Olsen Testing Machine Co. USA
51
Figure 3.12 Photographs of compressive strength testing process: (a) and (b) Test setup of Universal Testing Machine
51
Figure 3.13 Calibration chart of Universal Testing Machine used for compressive strength test
52
Figure 3.14 Photograph of crushing strength testing machine: Technotest Modena Italy
53
Figure 3.15 Calibration chart for crushing strength test machine 53
Figure 3.16 Photographs of CSSB specimens before cutting 54
Figure 3.17 Photograph of CSSB specimens cutting prior to testing 54
Figure 3.18 Photograph of CSSB specimen setup for crushing strength test 55
Figure 3.19 Photograph of crushed sample preserved for moisture content test 55
Figure 3.20 Photograph of CSSB specimens kept under submerged condition for 24 hours
56
Figure 3.21 Photograph of wet CSSB specimens after 24 hours immersion under water
57
Figure 4.1 Grain size distribution curves of collected soil samples 59
Figure 4.2 Grain size distribution curve of coarse sand used for making CSEB
59
Figure 4.3 Stress-strain relationship curve of Unstabilized Block (USB) 62
Figure 4.4 Stress-strain relationship curve of Cement Sand Stabilized Block (CSSB)
63
Figure 4.5 Stress-strain relationship curve of Lime Jute Stabilized Block (LJSB)
63
Figure 4.6 Stress-strain relationship curve of Lime Stabilized Block (LSB) 64
Figure 4.7 Curve showing a comparison of stress-strain relationship of CSSB, LJSB, LSB and USB specimens
64
Figure 4.8 Chart showing a comparison of ultimate compressive strength among different types of CSEB specimens
66

viii
Figure 4.9 Chart showing a comparison of ultimate failure strain among different types of CSEB specimens
66
Figure 4.10 Failure pattern of CSEB specimens after test: (a) Cement Sand Stabilized Block (CSSB), (b) Lime Jute Stabilized Block (LJSB), (c) Lime Stabilized Block (LSB) and (d) Unstabilized Block (USB)
68
Figure 4.11 Unit weight vs moisture content of CSSB specimens 73
Figure 4.12 Compressive strength vs moisture content of CSSB specimens 74
Figure 4.13 Chart showing compressive strength, moisture content and unit weight of Unstabilized Block (USB)
75
Figure 4.14 Compressive strength vs cement content (3%, 5%, 6%, 8% and 9% cement) for 20% coarse sand
76
Figure 4.15 Variation of compressive strength with cement content for 20% coarse sand
77
Figure 4.16 Compressive strength vs cement content (5%, 6% and 8% cement) for 30% coarse sand
78
Figure 4.17 Variation of compressive strength with cement content for 30% coarse sand
79
Figure 4.18 Compressive strength vs cement content (3%, 5%, 6%, 8% and 9% cement) for 40% coarse sand
80
Figure 4.19 Variation of compressive strength with cement content for 40% coarse sand
81
Figure 4.20 Compressive strength vs cement content (5%, 6%, 7% and 8% cement) for 50% coarse sand
82
Figure 4.21 Variation of compressive strength with cement content for 50% coarse sand
83
Figure 4.22 Compressive strength vs cement content (5%, 6%, 7%, 8% and 9% cement) for 60% coarse sand
84
Figure 4.23 Variation of compressive strength with cement content for 60% coarse sand
85
Figure 4.24 Line showing a comparison of compressive strength with cement content for different percentages of coarse sand
86
Figure 4.25 Variation of compressive strength with coarse sand for 3% cement stabilization
87
Figure 4.26 Variation of compressive strength with coarse sand for 5% cement stabilization
88
Figure 4.27 Variation of compressive strength with coarse sand for 6% cement stabilization
89

ix
Figure 4.28 Variation of compressive strength with coarse sand for 7% cement stabilization
90
Figure 4.29 Variation of compressive strength with coarse sand for 8% cement stabilization
91
Figure 4.30 Variation of compressive strength with coarse sand for 9% cement stabilization
92
Figure 4.31 Variation of compressive strength of CSSB specimens with coarse sand for different percentages of cement content (3%, 5%, 6%, 7%, 8% and 9%)
93
Figure 4.32 Variation of compressive strength of CSSB specimens with different percentages of mixed sand for 5% cement
94
Figure 4.33 Chart showing a comparison of compressive strength of CSSB specimens for 50% sand with 5% cement
95
Figure 4.34 Chart showing a comparison of compressive strength of CSSB specimens for 60% sand with 5% cement
96
Figure 4.35 Chart showing a comparison of compressive strength of CSSB specimens for 30% sand with 6% cement
97
Figure 4.36 Chart showing compressive strength of CSSB specimens greater than 5 MPa
98
Figure 4.37 Compressive strength vs moisture content of wet CSSB specimens 101
Figure 4.38 Unit weight vs moisture content of wet CSSB specimens 101
Figure 4.39 Compressive strength vs water absorption after 24 hours immersion under water
102
Figure 4.40 Chart showing percentages of water absorption of wet CSSB specimens
103
Figure 4.41 Comparison of unit weight between dry and wet CSSB specimens 104
Figure 4.42 Comparison of crushing strength between dry and wet CSSB specimens
105
Figure 4.43 Chart showing crushing strength, water absorption, moisture content and unit weight of the wet CSSB specimens
106
Figure A-1 Flow curve for determination of liquid limit of the soil sample SS
117
Figure A-2 Flow curve for determination of liquid limit of the soil sample SP3
119
Figure A-3 Flow curve for determination of liquid limit of the soil sample SP5
120
Figure A-4 Flow curve for determination of liquid limit of the soil sample SP6
122

x
Figure A-5 Flow curve for determination of liquid limit of the soil sample SP7
123
Figure A-6 Flow curve for determination of liquid limit of the soil sample SP8
125
Figure A-7 Flow curve for determination of liquid limit of the soil sample SP9
126

xi
LIST OF TABLES
Table 2.1 Soil stabilization techniques (after Rigassi, 1985) 12
Table 2.2 Suitability of soils for making earthen block houses (after Corps, 1981)
13
Table 2.3 The composition of good soil for CSEB according to Auroville Earth Institute
14
Table 2.4 The average stabilizer proportion for CSEB according to Auroville Earth Institute
14
Table 2.5 Suitable ranges of soil compositions for making CSEB (after Ahmed, 2010)
14
Table 2.6 Characterization of molding pressure for earth blocks (after Houben and Guillaud, 1994)
16
Table 2.7 Dwellings by structural types in Bangladesh, 2001 (Source: (Population Census 2001, Volume 3, Urban Area Report (BBS, 2008))
20
Table 2.8 Problems of CSEB with a possible solution 29
Table 3.1 Locations of collected soil samples 31
Table 3.2 Tests conducted for soil identification 34
Table 3.3 Combinations used for making CSEB for compressive strength test
40
Table 3.4 Technical specifications of Auram Earth Block Press 3000 44
Table 3.5 Different percentages of cement used to stabilize different proportions of soil-sand mixes
46
Table 3.6 Different percentages of sand used to stabilize different proportions of soil-cement mixes
46
Table 3.7 Explanation for identification system of CSSB specimens 47
Table 3.8 CSSB specimens group with material compositions 48
Table 3.9 CSSB combinations used for water absorption test 56
Table 4.1 Index properties and grain size distribution of collected soil samples
60
Table 4.2 Index properties and grain size distribution of sand used for making CSEB
60
Table 4.3 Specimens group with material compositions prepared for compressive strength test
62
Table 4.4 Stress and strain properties of CSEB specimens 65
Table 4.5 Comparison of average value of strength parameters of CSEB specimens
65

xii
Table 4.6 Compressive strength, unit weight and moisture content of CSSB specimens in various combinations
70
Table 4.7 Compressive strength, unit weight and moisture content of CSSB specimens in various combinations after 24 hours immersion under water
100
Table A-1 Liquid limit test of the soil sample SS 117
Table A-2 Plastic limit test of the soil sample SS 117
Table A-3 Liquid limit test of the soil sample SP3 118
Table A-4 Plastic limit test of the soil sample SP3 118
Table A-5 Shrinkage limit test of the soil sample SP3 118
Table A-6 Liquid limit test of the soil sample SP5 119
Table A-7 Plastic limit test of the soil sample SP5 119
Table A-8 Shrinkage limit test of the soil sample SP5 120
Table A-9 Liquid limit test of the soil sample SP6 121
Table A-10 Plastic limit test of the soil sample SP6 121
Table A-11 Shrinkage limit test of the soil sample SP6 121
Table A-12 Liquid limit test of the soil sample SP7 122
Table A-13 Plastic limit test of the soil sample SP7 122
Table A-14 Shrinkage limit test of the soil sample SP7 123
Table A-15 Liquid limit test of the soil sample SP8 124
Table A-16 Plastic limit test of the soil sample SP8 124
Table A-17 Shrinkage limit test of the soil sample SP8 124
Table A-18 Liquid limit test of the soil sample SP9 125
Table A-19 Plastic limit test of the soil sample SP9 125
Table A-20 Shrinkage limit test of the soil sample SP9 126

xiii
ACRONYMS
FCB Fired Clay Brick
CEB Compressed Earth Block
CSEB Compressed Stabilized Earth Block
USB Unstabilized Block
CSSB Cement Sand Stabilized Block
LSB Lime Stabilized Block
LJSB Lime Jute Stabilized Block
CS Coarse Sand
FS Fine Sand
MS Mixed Sand (Fine Sand + Coarse Sand)
AC23 3% Cement + 20% CS
AC43 3% Cement + 40% CS
AC63 3% Cement + 60% CS
AC25 5% Cement + 20% CS
AC35 5% Cement + 30% CS
AC45 5% Cement + 40% CS
AC55 5% Cement + 50% CS
AC65 5% Cement + 60% CS
AM35 5% Cement + 15% CS +15% FS
AF55 5% Cement + 50% FS
AM45 5% Cement + 20% CS +20% FS
AM45C+ 5% Cement + 26.67% CS + 13.33% FS
AM45F+ 5% Cement + 13.33% CS + 26.67% FS
AM55 5% Cement + 25% CS + 25% FS
AM55C+ 5% Cement + 33.33% CS + 16.67% FS
AM55F+ 5% Cement + 16.67% CS + 33.33% FS
AM55F+2 5% Cement + 30% CS + 20% FS
AM65 5% Cement + 30% CS + 30% FS
AM65C+ 5% Cement + 40% CS + 20% FS
AM65F+ 5% Cement + 20% CS + 40% FS
AF65 5% Cement + 60% FS

xiv
AC26 6% Cement + 20% CS
AC36 6% Cement + 30% CS
AC46 6% Cement + 40% CS
AC56 6% Cement + 50% CS
AC66 6% Cement + 60% CS
AM36 6% Cement + 15% CS + 15% FS
AM36C+ 6% Cement + 20% CS + 10% FS
AM36F+ 6% Cement + 10% CS + 20% FS
AM46 6% Cement + 20% CS + 20% FS
AM46C+ 6% Cement + 26.67% CS + 13.33% FS
AM56 6% Cement + 25% CS + 25% FS
AM56F+ 6% Cement + 16.67% CS + 33.33% FS
AC47 7% Cement + 40% CS
AC57 7% Cement + 50% CS
AC67 7% Cement + 60% CS
AM37 7% Cement + 15% CS + 15% FS
AC28 8% Cement + 20% CS
AC38 8% Cement + 30% CS
AC48 8% Cement + 40% CS
AC58 8% Cement + 50% CS
AC68 8% Cement + 60% CS
AM48 8% Cement + 20% CS + 20% FS
AM68F+ 8% Cement + 20% CS + 40% FS
AC29 9% Cement + 20% CS
AC49 9% Cement + 40% CS
AC69 9% Cement + 60% CS

1
Chapter 1
INTRODUCTION
1.1 General
Since ancient time soil is being used as a building material and one of the major reasons
behind it is its availability. It was one of the oldest and most traditional building
materials used by human beings dating back over at least 10, 000 years (Islam, 2010).
From the civilization of Mesopotamia dated 6000 years back the use of earth as a
building material is very evident (Deboucha and Hashim, 2011). Still today 50% of
the population in developing countries, including the majority of the rural population
and at least 20% of the urban and suburban population, live in earthen dwellings
(Houben and Guillaud, 2005). The earthen house construction has drawn the attention
of developed countries in the past 40 to 50 years (Islam, 2010).
In developing countries, the provision of housing is one of the most important basic
needs of the low income community. It is very difficult to meet their requirements
since the land and construction cost for housing is mostly beyond their ability. In order
to address this problem, the governments in the developing countries take initiatives
for housing scheme to facilitate some forms of housing ownership by low-income
groups. These ideas afford for the self-housing scheme at low cost and easy
construction. Due to limited resources within the developing countries, it is necessary
to seek ways to reduce construction costs especially for a low income group as well as
adopting an easy and effective solution for their repair and maintenance. Such
objectives can be achieved partially through the production and use of cheap, durable
and locally available building materials. Ideally, it may contribute to the improvement
of development objectives of developing countries by generating local employment
and rural development.
Being a densely populated country, in Bangladesh abundant use of Fired Clay Brick
(FCB) is observed both in the urban, semi-urban and rural areas also. This culture leads
to deforestation and generation of a huge amount of greenhouse gases. If earthen
blocks can be prepared with as much strength and durability as that of fired bricks it
might be a suitable alternative to fired brick and can save both money and environment.
That is why, consciousness is growing day by day on this indigenous earth material.

2
There are some drawbacks of earth construction. The earth construction suffers from
shrinkage cracking, erosion due to wind or driving rain and poor dimensional stability
which necessitates the need for continuous maintenance (Islam and Haque, 2009;
Islam and Iwashtia, 2010; Bahar et al., 2004; Guttela et al., 2006). Another drawback
using earth alone as a building material is its durability which is strongly related to its
compressive strength (Venkatarama Reddy and Kumar, 2009; Morel et al., 2001;
Guettala et al., 2006; Heathcote, 1995). Because most soil in their natural condition
lacks structure, strength and durability required for building construction. These
inherent deficiencies may be overcome through a process of stabilization by
mechanical compaction with addition to the soil matrix of natural fibers (Islam et al.,
2016; Gowda, 2016; Islam and Rahman, 2010; Islam and Iwashtia, 2010; Islam, 2002;
Bouhicha et al., 2005) and chemical binders, such as cement or lime, or waterproofing
agents, such as bitumen (Walker, 1995). So, all the aspects should be considered to
produce sustainable, durable, safe and environment friendly building materials.
Considerable research has been undertaken in the modern times to make earth as a
sustainable construction material. This has led to the development of technology using
earth in the form of rammed earth and unfired bricks popularly known as Compressed
Stabilized Earth Block (CSEB). For six decades remarkable initiatives have been made
to make unfired stabilized bricks to be a reliable walling unit against the more
extensive fired bricks and concrete blocks (Deboucha and Hashim, 2011). This is
achieved by proper grading of soil mix, proper compaction and stabilization using
admixtures, which results in increased density, reduced water absorption, increased
frost resistance and mainly increased the wet compressive strength of masonry blocks
(Nagaraj et al., 2014). The compressive strength of the blocks has become a basic and
universally acceptable unit of measurement to specify the quality of the masonry units,
as this is an indirect measure of the durability of the blocks (Walker, 2004; Morel et
al., 2007). The compressed stabilized earth blocks are made out of the soil with
extraneous binding materials such as jute fiber, rice husk, banana fiber, cement, lime,
bitumen, rice husk ash etc. (Gowda, 2016; Danso, 2016; Mostafa and Uddin, 2016;
Ismail and Yaacob, 2011; Chan, 2011; Islam and Rahman, 2010; Islam, 2002; Guettala
et al., 2002 ).

3
In this research, attempts have been made particularly to determine the strength
characteristics of earthen blocks stabilized with jute fiber, cement and lime. In some
cases, deformation characteristics of the blocks were also determined. Special attempts
have been made to determine the strength characteristics of Cement Sand Stabilized
Earth Block (CSSB) added with different graded sand.
1.2 Background of the Research Work
The oldest structure with adobes and sun dried blocks were built in Egypt in 1300 BC,
the vault of Ramasseum. Human has been building structures with earth for more than
10,000 years ago which becomes evident obtained from the building remnants of the
Harappa, Mohenjo-Daro and Jericho (Jagadish, 2007). Since the early 1950’s
considerable attention has been focused on the importance to low cost housing for low
income population by researching building materials and techniques that are locally
available and abundant resources (Rigassi, 1985). In this sequence, the succession of
adobe brick is Compressed Earth Block (CEB). The turning point for use of
compressed earth block came after the invention of Cinva-Ram Pressing machine after
1952 in Columbia. This commenced the production and application of compressed
earth block throughout the world (Rigassi, 1985) and led to initiate many research
works to understand the parameters of the soil and stabilization technique. With this
sequence, the Auram Earth Block Press Machine was introduced to produce better
compressed earth blocks.
The choice of sustainable construction materials and design for low cost housing can
be helpful not only to address social and economic issues but also environmental issues
such as reduction of greenhouse gasses (GHG) emissions. Soil blocks possess long
lasting and less environmental impact. For this reason, in most parts of the world use
of earth as a building material can be noticed. Therefore, it demands research and
continuous investment in appropriate technologies that ensures low cost construction
materials and minimizes environmental impact (UN Habitat, 2009).
The pre-condition of low cost house construction is affordable and available building
materials. Earth is perhaps the most accessible and economical natural material used
for building blocks (Chan, 2011). Soil blocks are attractive materials because they are
inexpensive to produce (Ismail and Yaacob, 2011). The block made out soil for building

4
materials has existed many countries for a very long time. Earth has the advantages of
being recycled and hence soil blocks can be easily turned into the earth without
pollution to the environment and can be reused (Rigassi, 1985). Furthermore, the
energy required for producing soil blocks is relatively low as compared to burnt bricks
(Al-Sakkaf, 2009). Moreover, it has the advantages of being used for a variety of
building components such as walls, roofs and floors. Overall, it can be used as low
cost housing for its abundant availability and inexpensiveness in most countries
(Morris and Booyesen, 2000).
Fired Clay Brick (FCB) has been the chief building material for housing construction
in Bangladesh. It is regarded as a massive source of Greenhouse Gas (Rahman et al.,
2016; Riza et al., 2010; Morel et al., 2001). Moreover, a huge amount of agricultural
top soil is used yearly to produce FCB. Hence, in a country like Bangladesh to find a
low-cost, eco-friendly and sustainable building material is of paramount importance.
Compressed Stabilized Earth Block (CSEB) made with various additives is a potential
alternative to the FCB. Main factors affecting the CSEB’s strength are stabilizer
content and types of soil. Addition of stabilizer with soil for making CSEB plays an
important role to develop bonding between soil-stabilizer mixes and thus enhances its
strength and durability (Riza et al., 2011 and Anifowose, 2000). Therefore, CSEB has
a great potential as a building material.
In this research work, Compressed Stabilized Earth Block (CSEB) was produced with
jute fiber, lime, jute-lime and cement-sand. Different percentages of cement and sand
was added to reinforce Cement Sand Stabilized Block (CSSB). For making CSSB
specimens, fine sand and coarse sand was added at different proportions with varied
percentages of cement.
In order to accomplish the targets this research work includes following objectives:
(a) To determine the characteristics of collected regional soils.
(b) To obtain the effect of different stabilizers at varied proportions on the strength
and deformation characteristics of CSEB.
(c) To compare the characteristics of different stabilized CSEB to select the
suitable additive.

5
1.3 Methodology
The research work was conducted in the following ways:
(a) Three soil samples were used for this study. Two soil samples were collected
from Shariatpur and another one from Savar. Laboratory tests such as specific
gravity, grain size analysis, Atterberg limit tests were conducted to determine
the characteristics of the collected soil samples. Cement, sand (coarse and fine
sand), jute fiber and lime were used with the selected soil to stabilize the
earthen blocks.
(b) Compressive strength test was conducted on the CSEB specimens to know the
effect of jute fiber, lime and cement-sand on compressive strength and failure
strain.
(c) Crushing strength test was also performed to know the compressive strength of
CSSB specimens.
(d) Water absorption capacity test on some typical CSSB specimens was also
conducted to know the water absorption capacity. At a time, crushing strength
of these wet CSSB specimens were determined and compared with those of
dry CSSB specimens.
1.4 Thesis Layout
The complete research work for achieving the stated objectives is divided into some
chapters so that it becomes easier to understand the chronological development of the
work. The contents of each chapter are briefly presented below:
Chapter One is an introduction that includes the problem statement, background and
objective of this study along with the thesis organization.
Chapter Two presents the literature review which includes history, techniques of earth
construction, stabilization techniques of earth blocks and performance of soil as a
building material. This chapter also discusses the earthen construction scenario in the
world and earthen house practice in Bangladesh. Here, the aspects of CSEB in
Bangladesh considering the required energy value, pollution emission and cost for the
production of CSEB are briefly discussed. The advantages and disadvantages of CSEB

6
are also narrated in this chapter. Finally, the possible solutions against the
disadvantages of CSEB are discussed.
In Chapter Three, selection of study areas for the research has been discussed. Also,
the selection of stabilizing material with their mechanical properties are narrated. The
total compositions of CSEB specimens at different combinations are shown here.
Research methodology and experimental programs are also discussed here
sequentially.
Chapter Four presents the soil index properties of the collected soil samples. The
results from the compressive strength test and crushing strength test of CSEB
specimens are presented in this chapter. The results of the test parameters are discussed
with the help of relevant figures, graphs and charts.
Finally, in Chapter Five, the main conclusions drawn from the study are pointed out.
In addition to that, some suggestions for future work are also provided.

7
Chapter 2
LITERATURE REVIEW
2.1 General
Earth construction practice is widespread in different cultures and in different
country, both in industrialized and developing countries (Achenza and Fenu, 2006).
Based on the environmental conditions and traditions people used different materials
for habitats but the most prominently used building material is soil (Sharma et al.,
2015). It is evident that the start of civilization and the soil masonry is on the same
page in the history (Deboucha and Hashim, 2010).
This chapter presents a summary of research relevant to Compressed Stabilized Earth
Block (CSEB) to provide a satisfactory background of subsequent discussions. As
the research work aims to focus on the strength characteristics of CSEB, a brief
summary of existing research on relevant topic herein has been presented. In this
chapter, an attempt has been taken to present a selective overall summary of research
into the characteristics of CSEB and potential of CSEB as a building material.
Burroughs (2008) stated that although earth has been used in many developing and
developed countries, the modern construction technology and material science has
declined its popularity to a great extent. Indeed, the introduction of building
materials such as cement, lime, steel and others have caused the low interest in the
soil as building materials. This has led to not only the increased cost of housing but
also the environmental impact due to its manufacturing process and high energy
consumption worldwide. Considering the above facts, in this chapter of the factors
affecting the improvement and performance of CSEB and the probable solutions to
reduce the problems of CSEB are discussed.
2.2 Techniques for Earth Construction
Earth-based construction and building have existed for thousands of years and are
still practiced today. The 12 main construction technique using soil as a building
material has been shown in Fig. 2.1. Among the most extensively and popularly used
techniques are cob, adobe, wattle and daube method, rammed earth and compressed
earth. The above mentioned techniques are described here in a nutshell.

8
Figure 2.1: The 12 principal earth construction technique (Auroville Earth Institute, 2018)
2.2.1 Cob
Cob is one of the ancient earth construction techniques. The oldest cob house still
standing is 10,000 years old. Cob is a mixture of sandy-sub soil, clay and fibrous
organic material (typically straw). It is mixed by crushing the particles together by
either dancing on it or using the head of a digger. The procedure involves stacking
earth balls on top of one another and lightly compact them with hand or feet to form
a monolithic wall (Houben and Guillaud, 1994). Historically, cob might have been
mixed by farm animals who would walk up and down on the sand, clay and straw.
The sandy sub-soil must be sharp and ideally, contain angular stones and gravel
which will make it stronger. About 75% of cob is made up of this sandy aggregate.

9
Figure 2.2: Photograph of cob structure (Kim-Carberry, 2011)
2.2.2 Adobe
Adobe is the mixture of soil and natural fibers to which water is added to until it
attains plastic condition. Then it is molded into bricks and allowed to dry in climatic
weather condition (Illampas et al., 2014).
Figure 2.3: Typical adobe blocks (Varga, 2009)

10
2.2.3 Wattle and daub
Wattle and daub is an earth construction technique that consists of wooden strips
woven together (called wattle) which is covered with a mixture of soil and straw
(called daub). An extremely clayey earth is used which is mixed with a straw or other
vegetable fibers to prevent shrinkage cracks upon drying (Houben and Guillaud,
1994).
Figure 2.4: Photograph of wattle and daub (Dreamstime.com, 2010)
2.2.4 Rammed earth
For rammed earth wall, the humid soil is poured into the formwork in layers and
rammed manually or by pneumatic rammers to increase soil density. In modern
times, rebars are also used in the techniques. The thickness of the wall is usually
between 300 and 600 mm. It is one of the earth construction techniques that creates
dynamically compacting soil between temporary forms to make a monolithic wall
(Hall and Djerbib, 2004).
Figure 2.5: Photograph of rammed earth wall (Gowda, 2016)

11
2.2.5 Compressed earth block
Compressed Earth Block (CEB) is a construction technique in which earth block is
made by mechanically pressing soil particles into a mold. The CEBs are made in
small sizes (blocks) and installed onto the wall by hand with mortar, which is spread
very thinly between the blocks for bonding. The reason for compacting soil in a mold
is to improve the engineering properties of the material (Rigassi, 1985).
Figure 2.6: Typical compressed earth blocks (Tadege, 2007)
2.3 Stabilization of Soil
Stabilization of soil is the method of adding some materials to the natural soil in
order to increase its strength and other properties for the purpose of constructing
houses. It is done to improve the properties of a soil in the face of many constraints
(Rigassi, 1985). The objectives of stabilization according to Rigassi (1985) are:
(a) To acquire an improved mechanical capability, thus increase the
compressive and tensile strength of the soil
(b) To reduce the volume of voids created in the soil, thus reduce the shrinkage
cracks that would develop when the soil is mixed with water
(c) To improve the durability properties of the soil, thus increase the
performance of the soil against rain and any wearing condition

12
2.3.1 Methods and techniques of stabilization
There are several ways of stabilizing earth. According to Houben and Guillaud
(1994), there are four main methods of stabilizing earth blocks. They are:
(a) Stabilization by reinforcement
(b) Stabilization by water-proofing
(c) Stabilization by cementing and
(d) Stabilization by treatment with chemicals
Again, according to Rigassi (1985), there are six categories of stabilizing soil for
construction purposes as described in Table 2.1.
Table 2.1: Soil stabilization techniques (after Rigassi, 1985)
Technique Explanation of technique
Increasing density This is done by creating a dense environment reducing
blocks pores and capillary channels under application of
force (compression).
Cementation
In this technique, cementitious materials are used to bind
and improve the engineering properties of soil. Some of
the materials used are lime, Portland cement, glues and
resins.
Reinforcing
Fibrous materials such as fibers from organic origin
(agricultural waste), animal origin (wool or hair) and
synthetic origin (polythene) are used with a view to
increasing the properties of soil.
Bonding It involves the use of chemicals such as acids, flocculants,
lime, polymers, etc. to stabilize the soil.
Water-proofing This technique adds materials that expand and seal off
access to pores such as bitumen and bentonite to the soil to
stabilize it.
Water-dispersal
This is done by modifying the water in the soil to improve
the properties of the soil. It uses chemicals such as resins,
calcium chloride and acids to eliminate the absorption of
water.

13
Not every soil is suitable for earth construction. So some stabilizers must be used to
making earth block. Then the stabilized earth blocks may be used for building a
sustainable house. According to the original soil quality, adding materials like gravel
or sand can do some easy improvement. Mixing soil can also be a way for better
improvement. According to the technique, the improvement of soils will vary. Often
sand has to be added to the soil if CSEB’s have to be stabilized with cement.
Auroville Earth Institute has recommended some general guidelines and not as rules
for soil stabilization to make CSEB as shown in Table 2.2 to 2.5. The selection of a
stabilizer will depend upon the soil quality and the project requirements. Cement will
be preferable for sandy soils and to achieve quickly a higher strength. Lime will be
rather used for very clayey soil but will take a longer time to harden and to give
strong blocks (Auroville Earth Institute, 2018).
Table 2.2: Suitability of soils for making earthen block houses (after Corps, 1981)
Names of soil Suitability for earth homes Stabilizers Comments
Very fine sands,
silty fine sands,
clayey fine
sands, clayey
silts
Usually suitable for all
types, particularly adobe if
stabilized
Portland cement
most suitable.
Asphalt
emulsions also
work as do most
water proofers
May be
affected by
frost
Gravelly clay,
sandy clay, silty
clay ---
Lime, sand and
gravel
Can be very
good if the
amount of
sand or gravel
is high
Clays, fat clays Should never be used for
earth houses --- ---
Organic silt,
organic silty
clay, organic
clay
Should never be used for
earth houses --- ---

14
Table 2.3: The composition of good soil for CSEB according to Auroville Earth Institute
Type of stabilization Gravel
(%)
Sand
(%)
Silt
(%)
Clay
(%) Requirements
Cement stabilized
block 15 50 20 15
When the soil is more
sandy than claye
Lime stabilized
block 15 30 20 35
When the soil is more
claye than sandy
Table 2.4: The average stabilizer proportion for CSEB according to Aurovile Earth Institute
Stabilizer Minimum Average Maximum Comments
Cement
stabilization 3 % 5 %
No technical
maximum
Low percentages of the
stabilizers are considered
to the view point of cost
effectiveness
Lime
stabilization 2 % 6 % 10%
Table 2.5: Suitable ranges of soil compositions for making CSEB (after Ahmed, 2010)
Compositions of soil Range of compositions
Clay 15-40%
Silts 25-40%
Sands 40-70%
Gravel 0-40%

15
2.4 Compaction of Soil as a Building Material
One of the factors that affect the strength of earth blocks is the compaction.
Compaction is the process of mechanically densifying a soil by pressing the soil
particles together to come to a close state of contact so that the occupied air can be
expelled out from the soil mass. Compaction is usually referred to as tamping.
Traditional tamping used the wooden tamper to manually press the earth in a wooden
mold to form the blocks. Currently, earth blocks are compacted with compressed
earth block machines such as advance earth construction technologies (AECT)
compressed earth block machines (AECT, 2009), CINVA-RAM press (Taylor,
2011). These presses are not expensive as they do not require high energy to operate
and their maintenance is not complex (Al-Sakkaf, 2009). CINVA RAM press was
the first machine developed to compact soil into a high density block in Colombia
during 1952 (Venkatarama Reddy and Gupta, 2005). The Auroville Earth Institute, a
leading player in earth architecture and earth construction developed the only Indian-
made Earth Block Press (also known as "Mud Brick Press") and it’s widely
acclaimed Auram 3000. The Auroville Earth Institute developed the original Auram
3000 Earth Block Press in 1990. It has proved ideal for builders utilizing earth
architecture, earth construction and appropriate building technologies without
compromising the highest standards of quality, strength and durability. Today, it
ranks as one of the best earth block presses for CSEB manufacture in the world.
The concept of compacting earth is to improve the quality and performance of
molded earth blocks (Houben and Guillaud, 1994). According to Venkatarama
Reddy and Jagadish (1989), soils blocks are often compacted to improve their
engineering characteristics, and this can be done in three following ways:
(a) Dynamic compaction
(b) Static compaction
(c) Vibratory compaction for soil blocks improvement
Compressed soil blocks are generally produced by compaction of soil in a hydraulic
or electrical block making machine, in which static and control pressure is applied.
Houben and Guillaud (1994) have made a characterization of molding pressure for
earth blocks as shown in Table 2.6.

16
Table 2.6: Characterization of molding pressure for earth blocks (after Houben and Guillaud, 1994)
Characterization Range of pressure (MPa)
Very Low 1-2
Low 2-4
Average 4-6
High 6-10
Hyper 10-20
Mega 20-40 +
2.5 Performance of Soil as a Building Material
The performance of earth as a building material can be determined by three main
properties. These are:
(a) Physical properties
(b) Mechanical properties and
(c) Durability properties
The physical properties deal with the physics of the soil and hence undergo non-
destructive testing. It is concerned with the determination of shrinkage, apparent bulk
density, size or texture, moisture content, porosity, permeability, adhesion and linear
contraction.
The mechanical properties of soil involve the mechanics of the soil under applied
pressure that causes deformation to the soil. The tests applied are destructive to the
soil. Bouhicha et al. (2005) expressed mechanical performance of soil blocks with
compressive strength, flexural strength and shear strength.
The durability properties of soil are concerned with the long-term effect of the
environment on the soil as a building material. The tests applied are aggressive in
nature to predict the future weathering effect on the soil. Bui et al. (2009)
characterized the durability with long-term erosion of earthen walls by exposing
them in the weather for 20 years. Atzeni et al. (2008) investigated durability by using
wear resistance of chemically or thermally stabilized earth based materials.

17
2.6 Earthen Construction Scenario in the World
The practice of using the earthen house is very common in some of the world’s most
hazard prone regions, such as Latin America, Africa, the Indian subcontinent and
other parts of Asia, the Middle East and Southern Europe (Fig. 2.7). From the roof of
the world in Tibet, or the Andes Mountains in Peru, to the Niles shore in Egypt or the
fertile valleys of China, many are the examples of the earth as a building material.
Figure 2.7: Earth construction areas of the world (Auroville Earth Institute, 2018)
The world’s oldest earthen building still standing is about 3,300 years old. The
Ramasseum, made of adobes, was built around 1,300 BC in the old city of Thebes. It
can still be visited on the left shore of the Nile, opposite Luxor. In India, the oldest
earthen building is Tabo Monastery, in Spiti valley-Himachal Pradesh. It was also
built with adobe and has withstood Himalayan winters since 996 AD. But from the
end of the 19th century, the skills of earth builders have been progressively lost. Till
the half of the latter 20th century, building with earth became marginal. We owe a lot
to the Egyptian architect Hassan Fathy, for the renaissance from the middle of the
20th century of earthen architecture. It is evaluated that about 1.7 billion people of the
world’s population live in earthen houses (Auroville Earth Institute, 2018).

18
New development of earth construction really started in the nineteen fifties (1950’s)
with the technology of the Compressed Stabilized Earth Blocks (CSEBs). A research
program done in Colombia in the 1950’s for affordable houses proposed the first
manual press: Cinvaram. Since then, there have been conducted many scientific
researches by laboratories. Since 1960-1970, Africa has seen the widest world
developments for CSEB. Today, Africa knows a further development step with semi
industrialization and standards.
Stabilized rammed earth wall has been developed a lot in the USA. Developments
happen especially a lot in the south-west (California, Colorado, New Mexico and
Texas).
Today benefits can be got from a vast scientific and practical knowledge from the
group CRATerre (ENSAG), the International Centre for Earth Construction, which is
based in France and is the leading agency for the development of earthen
architecture. It is a research laboratory on earthen architecture. Since 1979, CRAterre
has worked towards the recognition of earth materials as a valid response to the
challenges linked to the protection of the environment, the preservation of cultural
diversity and the fight against poverty. In this perspective, CRAterre’s three main
objectives are centered on:
(a) Optimizing the use of local resources, human and natural
(b) Improving housing and living conditions
(c) Valorising and promoting cultural diversity
India experimented with CSEB technology only in the nineteen-eighties. In a decade,
India sees some wider dissemination and development of CSEB. Auroville Earth
Institute (AVEI), was founded by Government of India, in 1989. It has become one
of the world’s top centers for excellence in earthen architecture, working in 36
countries to promote and transfer knowledge in earth architecture. The work of the
institute has attempted to revive link of raw earth construction with the modern
technology of stabilized earth. A lot of developments are happening in Bangalore
under the impulse of the Indian Institute of Science and Architects like Chitra
Vishwanath. The achievements built at Auroville show how earthen buildings can
create a light and progressive architecture.

19
(a)
(b)
(c)
Figure 2.8: Photographs of earthen structures around the world: (a) Vaults of the Ramasseum, built in 1300 BC in Egypt, (b) Visitors center, finished on 1992 in Auroville and (c) 10.35 m span segmental vault at Deepanam school, Auroville

20
2.7 Earthen House Practice in Bangladesh
Rural house construction and distribution pattern of housing in a certain region
develops according to the need of the inhabitants under a set of geographic control
and changes with the evolution of the human needs at the different stages of the
socio-economic and cultural development. Building materials irrespective of
location, housing, in general, is classified by type of materials used for construction.
In this way, houses are classified into four categories as described in Table 2.7.
Table 2.7: Dwellings by structural types in Bangladesh, 2001 (Source: Population census 2001, Volume 3, Urban Area Report (BBS, 2008))
Structure Total
(%)
Urban
(%)
Rural
(%)
Jhupri (made of jute sticks, tree leaves, jute sacks etc.) 8.8 7.6 9.2
Kutcha (made of mud brick, bamboo, sun-grass, wood and occasionally corrugated iron sheets as roofs) 74.4 47.7 82.3
Semi-Pucca (walls are made partially of bricks, floors are cemented and roofs of corrugated iron sheets) 10.1 23.1 6.3
Pucca (walls of bricks and roofs of concrete) 6.7 21.7 2.2
Total 100.0 100.0 100.0
Earthen house construction practice is more than 200 years old in Bangladesh. In
Bangladesh, the mud house is one of the traditional housing types that are used by
poor families mainly in rural areas as well as in the outskirts of small cities. This
building type is typically one or two stories and preferably used for single-family
housing. Some greater districts of Bangladesh: Rajshahi, Potuakhali, Khulna,
Dinajpur, Bogra and Chittagong (Fig. 2.9) are the areas where mud house system is
widely practiced. It is more predominant in less flood-prone areas, i.e. in the
highlands or in mountainous regions. The main load bearing system consists of mud
walls of 1.5 to 3.0 feet thickness, which carry the roof load. Clay tiles, thatch or CI
sheets are used as roofing materials. The application of these materials depends on
their local availability and the ability of the house owners.

21
Figure 2.9: Map showing earthen house distribution of Bangladesh (Rural house, Banglapedia)
In Bangladesh, various building materials are used for construction. Mud, bamboo
and CGI sheets are widely used in rural areas. But these houses are not disaster
proof, and also the material are not environment friendly. In Fig. 2.10, a typical mud
wall house, CI sheets house (CGI sheet) and bamboo thatch houses have been shown.

22
(a)
(b)
(c)
Figure 2.10: Photographs of typical earthen houses: (a) Mud house, (b) CI Sheet as a building material and (c) Bamboo thatch material

23
Architect Anna Heringer has recently completed the project “Hand-made school”
with the help of Bangladeshi NGO “Dipshikha Society for Village Development”. It
is situated in a remote rural village in the north of Bangladesh, Rudrapur under
Netrokona district. To continue what has started with the Handmade METI (Modern
Education and Training Institute) School: to work together with the local people on a
model for a sustainable, modern architecture in a dynamic process. This is
accomplished by using modern mud and bamboo building techniques.
Earth Blocks techniques are used in constructing house recently in Bangladesh.
Habitat for Humanity in Bangladesh completes first house built with compressed
earth blocks in Durgapur, Netrokona on 12th November, 2010. Christian Commission
for development in Bangladesh Human and Organizational Potential Enhancement
Centre (CCDB HOPE CENTRE) (non-government organization) a newly built
training complex at Baroipara, Savar, about 40 km away from Dhaka has been built
in a semi-rural setting retaining the natural beauty and characteristics of the
landscape dotted with mounds and depressions. The institute covering an area of 7.5
acres has been constructed using a cost-effective environment-friendly technology
that avoids burnt bricks (compressed earth block). Compressed Stabilized Earth
Blocks were used to build structures here.
(a) (b)
Figure 2.11: Photographs of earthen structures: (a) METI (Modern Education and Training Institute) and (b) CSEB house in Rudrapur, Netrokona, Bangladesh

24
Figure 2.12: Photograph of CSEB building in CCDB HOPE CENTRE premises, Savar, Bangladesh
2.8 Aspects of CSEB in Bangladesh
From the perspective of Bangladesh, the concept of the low cost sustainable building
is a very important issue under the global climate change. In Bangladesh, around
70% of people are living in rural area. Masonry is one of the most common housing
construction systems for them. Also, Bangladesh is situated in a disaster prone zone.
Natural disasters like cyclone, flood, tidal surge, heavy rainfall visits almost every
year in the country. These disasters cause a great damage to rural non-engineered
houses. Lack of proper technological knowledge in housing pattern increase the
vulnerability of natural disaster.
The major problems with the fired bricks are firstly the emission of Green House
Gases (GHG) results to the air pollution caused by the kilns; and secondly, the use of
topsoil from agricultural lands as the main ingredient. For the country like
Bangladesh whose economy depends heavily on agriculture, this impact will be very
negative. Every time the topsoil is extracted from a certain piece of land, it goes
barren for at least three years which means nothing can be grown there over that
duration. According to the news report of Dhaka Tribune published on 9th November
2017, the country produces 25 billion bricks every year. To meet this demand it
requires excavating 60 million tons of topsoil, causing dust pollution and

25
degrading the ground. Brick kilns also consume 5 million tons of coal and 3
million tons of wood annually, in the process emitting 15 million tons of
carbon into the air.
Figure 2.13: Photograph of pollution by brick kilns in Bangladesh (Published in Dhaka Tribune on 9th November, 2017)
Rising housing needs are an obvious consequence of rapid development. So, the
demand for bricks cannot be reduced. Then again, agricultural Bangladesh must have
exclusive rights on the topsoil. Compressed Stabilized Earth Blocks (CSEBs),
Interlocking CSEB are some of the techniques for making such kinds of bricks.
Technically, they might be different but there is one thing common about all of them
- none of these require the clay-rich topsoil for making bricks. Now a days,
Compressed Stabilized Earth Blocks (CSEBs) are being produced considering its
strength and durability. They are highly cost-effective, environmentally-friendly; and
can be safely used for the construction of multi-story buildings with a variety of
creative and aesthetically pleasing effects.
Making CSEB is more convenient than conventional FCB with respective to
pollution emission, energy consumption and production cost. In Fig. 2.14, the
comparison between CSEB and FCB is shown with respect to cost, energy and
pollution emission for CSEB with 5% lime, modified CSEB with 6% cement and 3%
lime (Rahman et al., 2016).

26
(a)
(b)
(c)
Figure 2.14: Comparison between FCB and CSEB with respect to: (a) Embodied energy value, (b) Pollution emission and (c) Production cost
0.0
0.5
1.0
1.5
2.0
Embo
died
ene
rgy
valu
e (M
J/kg
)
FCBCSEB with CementCSEB with Lime
0.0
0.1
0.1
0.2
0.2
CO
2em
issi
on (k
g C
O2/b
rick)
FCBCSEB with CementCSEB with Lime
0.0
1.0
2.0
3.0
Prod
uctio
n co
st (
BD
T/kg
) FCBCSEB with CementCSEB with Lime

27
2.9 Benefits of Construction Houses with Soil
Constructing houses with soil has many benefits to users of the houses. Previous
studies (Rahman et al., 2016; Riza et al., 2011; Morel et al., 2007; Minke, 2009; Lal,
1995; Kateregga, 1983; Easton, 1998; Adam and Agib, 2001; Venkatarama Reddy,
2007; Morton, 2007; Walker and Stace, 1995) have expressed some of the advantages of
constructing houses with soil or earth as follows:
(a) Readily and locally available materials
(b) Environmentally sustainable as sundry and no firing or burning is required
(c) Valorize cultural heritage and values
(d) Saves energy
(e) Reduces construction cost
(f) Simplicity in manufacture as it requires simple equipment and less skilled
labour
(g) Good fire resistance
(h) Provides indoor thermal comfort
(i) Promotes self-help construction practices
(j) Noise control
(k) Preserves timber and other organic materials
(l) Brick can be made at the site with no transportation
2.10 Disadvantages of Compressed Earth Block Technology
Traditional wall construction using soil as a building material directly, without
burning, in any of the forms has certain disadvantages as mentioned. The
performance of this wall is not very satisfactory. CSEB as a building material has
several disadvantages. Some of these are:
(a) Proper soil identification is required or unavailability of soil
(b) Wide spans, high and long building are difficult to do
(c) Low technical performances compared to concrete
(d) Under-stabilization resulting in low quality products
(e) Low social acceptance due to counter examples by unskilled people, or bad
soil and equipment

28
The shrinkage or cracking is another disadvantage of CSEB technology.
Understanding this behavior is crucially important and may indicate the need for soil
amendments. In addition, uncertainty exists regarding soil behavior when exposed to
moisture and extreme temperatures throughout its lifetime. This is complicated by
the fact that the moisture content of even a cured earthen block fluctuates with
ambient conditions.
However, burnt brick walls consume significant amounts of fuel energy. Since the
country is facing energy crisis, alternatives to wood such as coal, are not cheap either
and in any case, are desperately needed for other purposes including cooking.
Therefore, there is a need for an alternative way of using soil as wall construction.
2.11 Solutions to the Problems of CSEB
The disadvantages of CSEB technology can be corrected by combined chemical and
mechanical action, technically known as soil stabilization. An additional binder, such
as cement, lime or fiber may be included to stabilize the mix. Additionally, local
fiber reinforcement may be added.
The material used for wall construction should possess adequate wet compressive
strength and erosion resistance. The technique to enhance natural durability and
strength of soil defined as soil stabilization. For stabilizing, cementitious admixtures
such as cement and lime and bitumen are added. Cement is the most widely used
stabilizing agent (Walker, 1995).
Compacted soil blocks, naturally dried are ecological and economical materials with
no air pollution arising from their fabrication process. However uses of these
additives also significantly increase both material cost and their environmental
impact (Morel et al., 2001 and Mesbah et al., 2004). The properties of stabilized soil
can be further improved by the process of compaction. The process of compaction
leads to higher densities, thereby higher compressive strength and better erosion
resistance can be achieved. Exploring the stabilization and compaction techniques, a
cheap, yet strong and durable material for wall construction is the stabilized pressed
block. The proposed solutions to the problems with CSEB are given in Table 2.8.

29
Table 2.8: Problems of CSEB with a possible solution
Problems of CSEB Possible solutions
(a) Durability
(b) Low compressive strength
(c) Shrinkage problem
(a) Selection of soil
(b) Addition of fiber
(c) Addition of stabilizer/ material
(d) Compaction
2.12 Summary
Due to change in social outlook, lack of knowledge about the manifold advantages of
earthen houses and unknowing of the consequences of the use of industrial building
products, earth construction has lost its popularity to some extent for the time being.
Another big issue is vulnerability at drought, moisture and earthquake forces. In most
of the cases, stabilization technique based on properties of soil is proposed as the best
solution to the problem.
It is a matter of great hope that very recently earth construction witnesses growing
interest both globally and locally. Model houses are being constructed at various
parts of the country and other parts of the world to motivate low income people
towards the use of it.
Building with earth is definitely an appropriate as well as cost and energy efficient
technology for half a century. Research and development have proved the potential
of earthen techniques. One of the main key points for a general revival and
dissemination of earthen techniques is respect for nature and management of
resources. So, it can be said building with earth had a great past, but also a promising
future everywhere in the world.
There is a little study on the effect of compressive strength with different percentages
of cement in addition with different grain size sand (coarse sand, fine sand and
mixture of coarse and fine sand) with soil. Thus, this study aims to determine the
strength characteristics of CSEB. Therefore, this study will try to fulfill the previous
knowledge gap in this field.

30
Chapter 3
EXPERIMENTAL PROGRAM
3.1 General
Soil samples were collected from 8 different places for this experimental program.
Among these collections, three soil samples were selected for making Compressed
Stabilized Earth Block (CSEB). One is from Savar, where there is an existing structure
with the earth of this soil sample. Lime, jute and cement were used with this soil
sample to make these CSEBs. The second and third ones are from Shariatpur. Cement
and sand were used to stabilize the blocks.
CSEB specimens were prepared using the soil samples collected from Savar and
Shariatpur. Compressive strength test was conducted on the blocks made with soil
sample collected from Savar to know the strength and deformation properties. Four
types of blocks were produced with this soil sample. They are Unstabilized Block,
Cement Sand Stabilized Block, Lime Stabilized Block and Lime Jute Stabilized Block.
The soil samples collected from Shariatpur were used to produce Cement Sand
Stabilized Blocks. There are total 47 types of combinations used to produce Cement
Sand Stabilized Blocks. Different proportions of cement, fine sand and coarse sand
were used to produce these blocks. Crushing strength test was conducted on Cement
Sand Stabilized Blocks. In addition to this, the water absorption capacity test was
conducted on some typical Cement Sand Stabilized Blocks. Wet crushing strength test
was also conducted on the same blocks selected for water absorption capacity test.
This chapter presents the collection and selection of soil as well as selection of
reinforcing materials. Properties of the selected reinforcing materials are described.
The earthen block specimens with their materials compositions are presented here.
CSEB specimens preparation and curing process, machine used for producing CSEB,
experimental set-up and the test parameters are also described here with relevant
figures. The identification system of CSSB specimens is illustrated here with relevant
figure and table. Finally, in this chapter the water absorption capacity test conducted
on some CSSB specimens are described.

31
3.2 Collection of Soil Sample
Soil samples were collected from Savar and Shariatpur district in Bangladesh. The
locations of soil sample collections are mentioned in Table 3.1 and shown in Fig. 3.1
and 3.2.
Table 3.1: Locations of collected soil samples
Soil sample location Soil
designation Latitude and longitude
CCDB HOPE CENTRE, Baroipara,
Savar, Dhaka SS 24°01'49.4"N 90°14'13.4"E
Purbo Char Rusundhi, 0.61 m
below ground, Shariatpur SP1 23°09'04.6"N 90°21'30.9"E
Purbo Char Rusundhi, 1.22 m
below ground, Shariatpur SP2 23°09'02.3"N 90°21'33.2"E
Middle Char Rusundhi, 0.61 m
below ground, Shariatpur SP3 23°09'23.2"N 90°20'51.4"E
Poschim Porondi, 0.61 m below
ground, Shariatpur SP4 23°11'29.6"N 90°19'06.1"E
Dorichar, Dattpara, 0.91 m below
ground, Shariatpur SP5 23°10'54.7"N 90°19'09.8"E
Bala-Bazar, Rudrokor East, 0.61 m
below ground, Shariatpur SP6 23°10'34.5"N 90°21'02.0"E
Char Jadobpur, Tula Tola Goja,
1.22 m below ground, Shariatpur SP7 23°09'50.8"N 90°19'02.3"E

32
Figure 3.1: Location of soil sample collection from Savar
Savar

33
Figure 3.2: Locations of soil sample collections from Shariatpur

34
3.3 Selection of Soil
After the collection of eight soil samples finally, three soil samples were used for this
study. One soil sample was collected from Christian Commission for Development in
Bangladesh Human and Organizational Potential Enhancement Centre (CCDB HOPE
CENTRE) which is located at Baroipara, Savar, under Dhaka district of Bangladesh.
The soil on the premises of that institution was used for making CSEB. The second
and third one is from Purbo Char Rusundhi two feet and four feet below from ground
level respectively which are located at Shariatpur. The second soil sample resembles
the third one.
3.4 Soil Classification
Every soil is not suitable for making CSEB. So, it is essential to ensure the properties
of soil samples before using it for construction. The soil sample is generally
characterized using the particle size distribution analysis. The particle size analysis
gives information on the soil ability to pack into a dense structure and the quantity of
fines present (combination of silt and fine fraction). Soil must be classified in order to
rationalize and optimize the exploration of knowledge of their properties (Houben and
Guillaud, 2005).
3.4.1 Laboratory tests on collected soil samples
The soil samples used for making CSEB were evaluated first by conducting some tests
for the purpose of classifying and identifying the type of soil sample. The tests were
conducted as per described in ASTM. The list of experiments and name of tests for
soil identification are presented in Table 3.2.
Table 3.2: Tests conducted for soil identification
Properties of soil Name of the test ASTM standard Parameters to be determined
from test
Inde
x pr
oper
ties
Grain size distribution ASTM C 136 Grain size distribution curve
Natural moisture content ASTM D 2974 Natural
moisture content Specific gravity
test ASTM D 854 Specific gravity
Atterberg limit test ASTM D 4318 Liquid limit and Plastic limit

35
3.5 Soil Stabilization
Many kinds of soils can be used for earth walls by adding substances known as
stabilizers. The technique to enhance natural durability and strength of soil is defined
as soil stabilization. It is a process of mixing admixtures with soil to improve its
volume stability, strength and durability (Bell, 1993). It is considered as one of the
most important attempts in the production of CSEB. The aim of the stabilization is to
improve the performance of soil as a construction material.
3.5.1 Stabilization of soil with lime
Soil samples were stabilized using quick lime. Lime is found in the form of quicklime
(calcium oxide: CaO), hydrated lime (calcium hydroxide: Ca[OH]2), or lime slurry
which can be used to treat soils. Quicklime is manufactured by chemically
transforming calcium carbonate (limestone: CaCO3) into calcium oxide. Hydrated
lime is created when quicklime chemically reacts with water. The hydrated lime reacts
with clay particles and permanently transforms them into a strong cementitious matrix.
Most lime used for soil treatment contains not more than 5 percent magnesium oxide
or hydroxide. On some occasions, however, dolomitic lime is used. Dolomitic lime
contains 35 to 46 percent magnesium oxide or hydroxide. Dolomitic lime can perform
well in soil stabilization, although the magnesium fraction reacts more slowly than the
calcium fraction.
By adding lime to the soil for stabilization, four basic reactions are believed to occur:
cation exchange, flocculation and agglomeration, carbonation and pozzolanic
reactions. The pozzolanic reaction is believed to be the most important and it occurs
between lime and certain clay minerals to form a variety of cementitious compounds
which bind the soil particles together. Lime can also reduce the degree to which the
clay absorbs water and so can make the soil less sensitive to changes in moisture
content and improve its workability. Lime is a suitable stabilizer for clay soils. The
advantages that lime has over Portland cement are that it requires less fuel to
manufacture and requires relatively simple equipment to make. It is, therefore, more
suitable for village scale production and use.

36
Here soil was stabilized using 5% quick lime. Quick lime was prepared by grinding
the limestone like powder using a hammer and then oven dried the powder for 24
hours. Fig. 3.3 shows the photographs of preparing quicklime.
(a) (b)
Figure 3.3: Photographs of preparing quicklime: (a) Grinding the limestone and (b) Oven drying of lime
3.5.2 Stabilization of soil with cement and sand
Ordinary Portland cement hydrates when water is added, the reaction produces a
cementitious gel that is independent of the soil. This gel is made up of calcium silicate
hydrates, calcium aluminate hydrates and hydrated lime. The first two compounds
form the main bulk of the cementitious gel, whereas the lime is deposited as a separate
crystalline solid phase. The cementation process results in deposition between the soil
particles of an insoluble binder capable of embedding soil particles in a matrix of
cementitious gel. Penetration of the gel throughout the soil hydration process is
dependent on time, temperature and cement type. The lime released during hydration
of the cement reacts further with the clay fraction forming additional cementitious
bonds. Soil-cement mixes should be compacted immediately after mixing in order not
to break down the newly created gel and therefore reduce strengthening. The basic
function of cementation is to make the soil water-resistant by reducing swelling and
increasing its compressive strength.
Cement stabilizers improve the bonding properties and add strength to the blocks.
When, the soil requires a large percentage of cement, it can be combined with an equal
amount of lime, which costs less.
Silt, sand and gravel particles supply the structural strength by combining to create a
compact matrix with little void space. For silty soil, a slight crushing might be

37
required. Sieving (6 to 10 mm) is required if the lumps are too big and cohesive.
Adding 10 to 20% coarse sand might be needed to give more skeletons to the soil.
Adding sand depends on the silt size. If the grain size of the silt is near to very fine
sand, no sand should be added. Stabilization should be 6% minimum by weight of
cement. Adding 20 to 40% coarse sand is needed to reduce the plasticity and give some
skeleton for soils high in clay content (Auroville Earth Institute, 2018).
3.5.3 Stabilization of soil with jute
Although various natural grass or vegetables are used with soil for stabilization, a few
efforts have been taken for the scientific analysis of soil fiber matrix. Fibers might be
effective in the following ways:
(a) It increases the tensile strength and elasticity of the material.
(b) Fibers in the matrix will provide a way to prevent the growth of crack in the
shear band when cracks will propagate due to the imposed loads and thus fiber
may improve the strength, ductility and toughness of the composite (Islam et
al., 2008).
Jute is used here for the reinforcement of lime stabilized earthen block. Jute is long,
soft and shiny, with a length of 1 to 4 m and a diameter of from 17 to 20 microns.
Though Bangladesh and India are the leading producers of jute, it is also grown in
different parts of the world. Jute fibers are composed primarily of the plant materials
cellulose (major component of plant fiber) and lignin (major components of wood
fiber). The fibers can be extracted by either biological or chemical retting processes.
Given the expense of using chemicals to strip the fiber from the stem biological
processes are more widely practices. Biological retting can be done by either by stack,
steep and ribbon processes which involve different techniques of bundling jute stems
together and soaking in water to help separate the fibers from the stem before stripping.
After the retting process, stripping begins. In the stripping process, non-fibrous matter
is scraped off, leaving the fibers to be pulled out from within the stem.
Jute fiber is 100% bio-degradable, photodegradable, thermally degradable, high
modulus, less extensible, hygroscopic and recyclable and thus environmentally
friendly. To overcome some disadvantage of jute, several researches have been done
by different researchers and organizations for the last few years. Recently, a wide

38
range of geojute has been developed in the laboratory of Bangladesh Jute Research
Institute (BJRI) by blending jute with hydrophobic fiber like coir or by modification
with bitumen, latex and wax resinous materials with the collaboration of Bangladesh
Jute Mills Corporation (BJMC). Fig. 3.4 shows the jute was used for stabilizing earthen
block. Jute was used after cutting into pieces (average 3 inches) for better bonding with
soil.
(a) (b)
Figure 3.4: Photographs of : (a) 3 cm pieces jute and (b) Jute fiber
3.6 CSEB Preparation
The CSEB production procedure with Savar and Shariatpur soil are quite different
from each other. The procedures are described here in a nutshell.
3.6.1 CSEB preparation for compressive strength test
First of all, the collected soil samples were sundried for about one month. Then the
soil was crushed manually by hammering. To produce the CSEB an earthen block
preparation machine, “Press 3000 Multi-Mold Manual Press” also known as “Auram
Earth Block Press 3000” was borrowed from CCDB HOPE CENTRE for preparing
compressed earth block sized 240 mm × 115 mm × 90 mm. In summary, a block mold
is loosely filled with soil particles passing a No. #8 sieve (2.36 mm). Stabilizers were
mixed with the crushed soil sample. When stabilizers are used they must be thoroughly
mixed with the soil or much of their benefits will be lost. The soil sample was mixed
with water until it was plastic enough to mold. A hand operated hydraulic pump,
connected to the mold frame through a hydraulic hose and cylinder, is used to
pressurize the cylinder gradually to which in turn applies pressure to the soil in the

39
mold. After the pressure is applied for a few seconds, it is released and the compressed
earth block is extruded by exchanging the mold base for an ejection base.
During block production, a pressure of 150 kN (15 tons) was applied to the soil. This
pressure is used to correspond with the applied pressure of the full-scale production
machine. Manpower needed: 3 men on the machine, plus 3 more mixing and handling.
Net weight of the machine was 415 kg. Immediately, after each mini-block is ejected
from the small block press its dimensions (height, length and width) were measured.
The blocks are carefully placed in a controlled environment and any shrinkage or
cracking effects are noted before commencing tests. The entire process of preparing
earthen blocks is shown in Fig. 3.5.
(a) (b)
(c) (d) Figure. 3.5: Photographs for production of CSEB specimens: (a) Soil grinding for
making CSEB (b) Press 3000 Multi-Mold Manual Press Machine (c) Making earthen blocks in press machine and (d) Prepared blocks

40
For preparing CSEB specimens for compressive strength test following combinations were followed.
Table. 3.3: Combinations used for making CSEB for compressive strength test
Blocks Percentages of compositions (% w/w)
Block designation Soil Cement Coarse
sand Lime Fiber Water
Unstabilized Block 93 - - - - 7 USB
Cement Sand
Stabilized Block
67 9 13 - - 11 CSSB
Lime Stabilized
Block 83 - - 5 - 12 LSB
Lime Jute Stabilized
Block 82 - - 5 0.3 12 LJSB
The natural moisture content of the selected soil was found at 17.4%. Water used for
making block was kept below natural moisture content. These blocks were cured for
28 days before commencing tests. Blocks were cured by keeping it at room
temperature (around 25 0C) and spraying water in every two days interval of time. Fig.
3.6 shows the blocks after 1 day of production at the time of curing.
Figure 3.6: Photograph of CSEB specimens during curing period
LJSB
CSSBB
USB LSB

41
3.6.2 CSSB preparation for crushing strength test
The basic materials required for the production of compressed stabilized earth building
blocks are soil, stabilizer and water. The stabilizer, whether lime or cement or some
other material, is usually available in powder or liquid form, ready for use. The soil
may be in wet or dry condition, when it is first obtained and will probably not be
homogeneous. In order to have uniform soil, it is often necessary to crush it so that it
can pass through a 5 to 6 mm mesh sieve.
Different soil types may also be needed to be used together so as to obtain good quality
products. For instance, heavy clay may be improved by the addition of a sandy soil. It
is not only important to measure the optimum proportion of ingredients, but also to
mix them thoroughly. Mixing brings the stabilizer and soil into direct contact, thus
improving the physical interactions as well as the chemical reaction and cementing
action. It also reduces the risk of uneven production of low quality blocks.
The preparation process of CSSB specimens comprised of soil preparation, measuring
and mixing, pressing, curing are described here in a nutshell.
3.6.2.1 Soil preparation
All soil sample was sieved almost. It is necessary to remove the gravel greater than 10
mm and most of the lumps. The size of the mesh (from 5 to 10 mm) must be adapted
according to soil type. It is also important to control the angle of the sieve. A very flat
sieve will let coarser particle pass through. A very vertical sieve will remove more
coarse particles and the soil will be thinner. Some soils, specially clayey ones were
crushed. As, crushing by hand is very difficult and labor intensive, therefore,
motorized crusher or pulverizer was used.
3.6.2.2 Weathering
Mostly, the dredged soil is wet and contain a high amount of moisture. Breaking into
powder and pulverizing the wet soil require complex machinery. To avoid complex
machinery, the collected dredged soil was kept under a shade for 15 to 25 days. In this
period, the soil was weathered and dried to ease the breaking operation.

42
3.6.2.3 Pulverizing
The foreign objects like glass shards, grass and stone were first sorted out from the air
dried soil sample. As crushing by hand is very difficult and about intensive so a
motorized crusher of pulverizer was preferred for soil crushing. The machine that was
used for soil pulverizing was Soeng Thai Soil Pulverizer Model SP3 as shown in Fig.
3.7. Before crushing, the soil samples were dried absolutely.
(a) (b)
Figure 3.7: Soil pulverizing machine: (a) and (b) “Soeng Thai Soil Pulverizer Model SP3”.
Main Features of the Soeng Thai Soil Pulverizer Model SP3 are:
(a) Appropriate for nodular lateritic (Stony laterite) soils or softer soils.
(b) The hopper will tilt away and screen can be removed for easy cleaning.
(c) Single-phase 3-hp electric motor or 4-hp Honda gasoline engine (CDI
electronic ignition)
(d) Replaceable high quality bearings (SKF or NTN)
(e) Hardened replaceable fingers
(f) High speed rotation for a fine grind (typical particle size is less than 4 mm)
(g) Electric motor has magnetic switch for overload protection

43
3.6.2.4 Measuring and mixing
Measuring: The volume of every container is known as the specifications are given
according to their size. All the containers used for soil and sand were filled till the top
and leveled with a straight edge.
Mixing: The sand was poured on the unloaded soil. The stabilizer will be also mixed
with them. This is a dry mixing. Water is mixed with dry mix uniformly. No lumps
were allowed to create. The pile was moved two times to get a homogenous mixture.
3.6.2.5 Pressing
Pressing is done by Auram 3000 (Fig. 3.8) the only Indian-made Earth Block Press
(also known as "Mud Brick Press").
Figure 3.8: Block producing machine: “Auram Earth Block Press 3000”

44
Main features of Auram Earth Block Press 3000 are:
(a) Block height is adjustable in 5 mm increments
(b) High and adjustable compression ratio
(c) Double compression (folding back lid)
(d) Easy interchangeability of molds
Table 3.4: Technical specifications of “Auram Earth Block Press 3000”
Parameters Value Available force 150 kN (15 tons) Compression ratio 1.60 to 1.83 Block height (mm) 25 and 50, them up to 100 in 1 to 5 mm increments Practical output 106 strokes per hour Daily output 1000 plain blocks Manpower needed 3 men on the machine, plus 4 more mixing and handling Net weight 365 kg to 415 kg
3.6.2.6 Filling of mold
The first condition for a consistent quality is to always fill the mold with the same
amount of soil. The mold was filled with a hand shovel. Soil was leveled with a ripper
to ensure good compression quality.
3.6.2.7 Pressing and handling the fresh block
Compression ratio was adjusted first as per the soil so as to have the maximum
compression of the soil. This was done by pocket penetrometer. The lid was not opened
until the lever has been fully operated otherwise the block will not be fully compressed.
Then they were pressed from sides and stacked on the initial curing and stacking area.
3.6.2.8 Initial curing and stacking
Immediately after pulled out from the mold, the stacking is started. They were stacked
near the press in long piles which were covered with a plastic sheet for two days. The
initial curing is necessary for the blocks to start immediately. The stacks were covered
in plastic sheets which is airtight to avoid the evaporation. When there were enough
chances of evaporation then a strip of humid jute cloth was used. 7 to 8 blocks are

45
stacked upon each other immediately after production. Only 5 cm gap was kept
between the blocks in the width of the row, so as to allow the hand to move out. But
in the length the gap is minimal.
3.6.2.9 Final stacking and curing
Fig. 3.9 shows the block making process sequentially. At first dredged soil are broken
by pulverizer machine and screened. Then raw soil is mixed with stabilizer and pressed
in a press machine. Curing for 4 weeks is done on blocks.
(a) Dredged soil sample (b) Soil pulverizing (c) Screened soil sample
(d) Mixing cement with water (e) Filling in the mold (f) Freshly made block
(g) Curing by water (h) Curing in open air (i) Block after curing
Figure 3.9: Preparation of CSSB specimens in Shariatpur by Inclusive Home Solution (IHS) Ltd.

46
After two days the blocks were moved to their final stacking and curing areas. They
were moved to flat wheel barrow so that the edge and corners are not damaged. Blocks
were stacked in a compact pile with a minimum gap between them. In final curing, for
cement sand stabilized blocks, as soon as the pile is completed, it was covered with
jute clothes. Curing was done for 4 weeks. Jute clothes were not allowed dry during
the curing time. Water is sprinkled on them daily, as many times as needed, during 28
days.
3.6.2.10 Proportions of soil-sand-cement mix
For preparing CSSB specimens having dimension 240 mm x 115 mm x 90 mm made
for crushing strength test following combinations were followed as shown in Table 3.5
to 3.6. In Table 3.7 identification system for CSSB specimens has been explained.
Detailed test programs for crushing strength test have been presented in Table 3.8.
Table 3.5: Different percentages of cement used to stabilize different proportions of soil-sand mixes
Table 3.6: Different percentages of sand used to stabilize the different proportions of soil-cement mixes
Cement (%) Amount of mixes
Fine sand Coarse sand Mixed sand Total 3 - 3 - 3 5 2 5 11 18 6 - 5 7 12 7 3 1 4 8 - 5 2 7 9 - 3 - 3
Unstabilized - - - 1 Total 48
Sand (%) Amount of mixes
Fine Coarse Mixed Total 20% - 5 - 5
30% - 3 5 8 40% - 6 6 12 50% 1 4 6 11 60% 1 6 4 11
Unstabilized - - - 1 Total 48
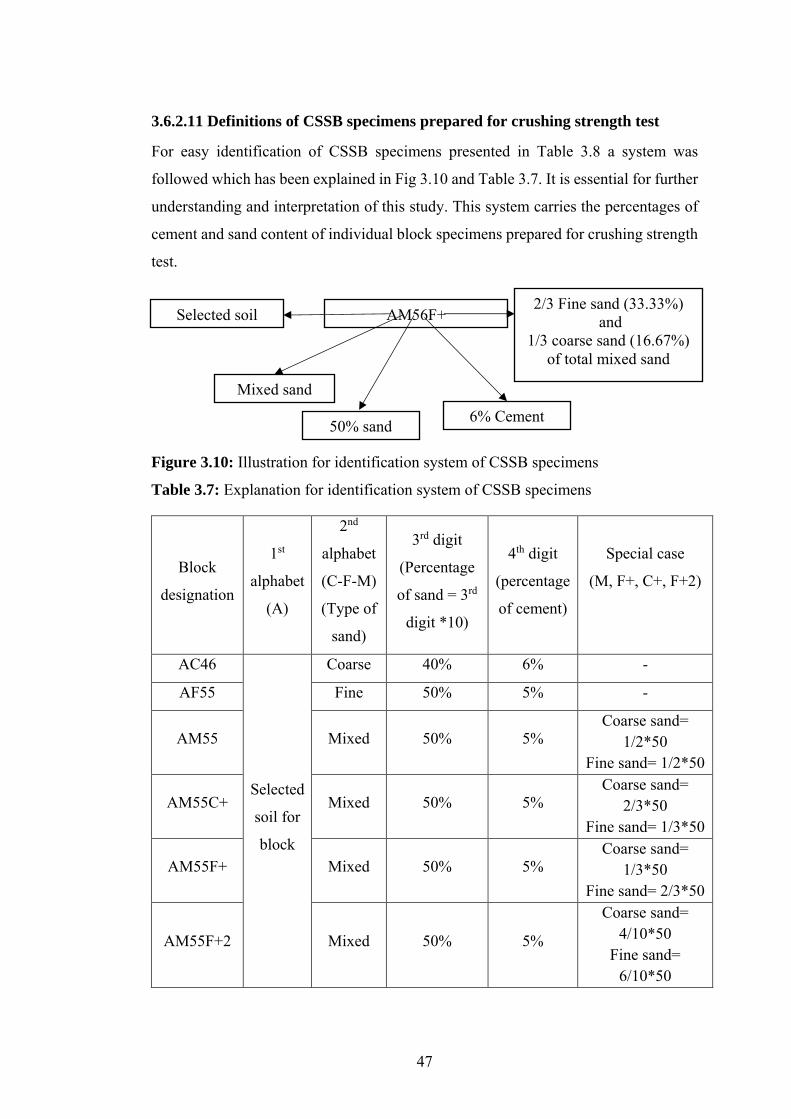
47
3.6.2.11 Definitions of CSSB specimens prepared for crushing strength test
For easy identification of CSSB specimens presented in Table 3.8 a system was
followed which has been explained in Fig 3.10 and Table 3.7. It is essential for further
understanding and interpretation of this study. This system carries the percentages of
cement and sand content of individual block specimens prepared for crushing strength
test.
Figure 3.10: Illustration for identification system of CSSB specimens
Table 3.7: Explanation for identification system of CSSB specimens
Block
designation
1st
alphabet
(A)
2nd
alphabet
(C-F-M)
(Type of
sand)
3rd digit
(Percentage
of sand = 3rd
digit *10)
4th digit
(percentage
of cement)
Special case
(M, F+, C+, F+2)
AC46
Selected
soil for
block
Coarse 40% 6% -
AF55 Fine 50% 5% -
AM55 Mixed 50% 5% Coarse sand=
1/2*50 Fine sand= 1/2*50
AM55C+ Mixed 50% 5% Coarse sand=
2/3*50 Fine sand= 1/3*50
AM55F+ Mixed 50% 5% Coarse sand=
1/3*50 Fine sand= 2/3*50
AM55F+2 Mixed 50% 5%
Coarse sand= 4/10*50
Fine sand= 6/10*50
AM56F+ Selected soil
Mixed sand
50% sand 6% Cement
2/3 Fine sand (33.33%) and
1/3 coarse sand (16.67%) of total mixed sand

48
Table 3.8: CSSB specimens group with material compositions
Cement
( %w/w)
CSEB
specimens
Sand (% w/w)
Fine Coarse Fine + Coarse
3
AC23 - 20 -
AC43 - 40 -
AC63 - 60 -
5
AC25 - 20 -
AC35 - 30 -
AC45 - 40 -
AC55 - 50 -
AC65 - 60 -
AM35 15 15 30
AF55 50 - -
AM45 20 20 40
AM45C+ 13.33 26.67 40
AM45F+ 26.67 13.33 40
AM55 25 25 50
AM55C+ 16.67 33.33 50
AM55F+ 33.33 16.67 50
AM55F+2 20 30 50
AM65 30 30 60
AM65C+ 20 40 60
AM65F+ 40 20 60
AF65 60 - -
6
AC26 - 20 -
AC36 - 30 -
AC46 - 40 -
AC56 - 50 -
AC66 - 60 -
AM36 15 15 30
AM36C+ 10 20 30

49
Cement
( %w/w)
CSEB
specimens
Sand (% w/w)
Fine Coarse Fine + Coarse
AM36F+ 20 10 30
AM46 20 20 40
AM46C+ 13.33 26.67 40
AM56 25 25 50
AM56F+ 33.33 16.67 50
7
AC47 - 40 -
AC57 - 50 -
AC67 - 60 -
AM37 15 15 30
8
AC28 - 20 -
AC38 - 30 -
AC48 - 40 -
AC58 - 50 -
AC68 - 60 -
AM48 20 20 40
AM68F+ 40 20 60
9
AC29 20 20 -
AC49 40 40 -
AC69 60 60 -
Unstabilized
block - - - -
Table 3.8: CSSB specimens group with material compositions (contd.)

50
3.7 Experimental Setup
3.7.1 Compressive strength test
A Universal Testing Machine (Tinius Olsen Testing Machine Co. USA) capacity
60000 lb was used to measure the compressive strength of the CSEBs according to
ASTM D143). The strain rate used did not allow for the stress rate to surpass the rate
given by the code.
Some procedures were followed to determine the strength of CSEB using the Universal
Testing Machine. These are:
(a) Bricks made by Press 3000 Multi-Mold Manual Press machine had taken to the
laboratory for testing stress and strain using Universal Testing Machine.
(b) Bedding surface was cleaned to ensure even contact.
(c) The width and length of the loaded area were measured.
(d) The specimen was aligned with the testing machine.
(e) The surface of the block was filled with sand to ensure uniform loading.
(f) An extra capping of steel plate made exclusively for blocks to ensure uniform
surface loading.
(g) A wooden block was placed between the plate and the machine to facilitate
loading.
(h) The load was incremented 1000 lb at a constant rate.
(i) For per 1000 lb the strain was recorded form strain gauge.
(j) The maximum load was recorded at which the material failed.
(k) The strength of each specimen was calculated by dividing the maximum load
by the loaded area.
To calculate compressive strength:
Compressive strength (MPa) = P/A ……………………………………………. (3.1)
Here, P = Force at failure (kN)
A = Cross-sectional area of the top face of the specimen.

51
Figure 3.11: Photograph of Universal Testing Machine (Tinius Olsen Testing Machine Co. USA)
(a) (b)
Figure 3.12: Photographs of compressive strength testing process: (a) and (b) Test setup of Universal Testing Machine

52
Figure 3.13: Calibration chart of Universal Testing Machine used for compressive strength test
3.7.2 Crushing strength test
The crushing strength test was done on the samples. The crushing strength test was
done according to ASTM C1314. The loading rate was 500. Machine name is
Tecnotest, Modena-Italy (Machine Series KD 300/R) Serial 2676. The capacity of the
machine is 3000 kN. Plywood sheet of ½ inch thick was placed on either face of the
half cut block as shown in Fig. 3.18 before the application of load. The calibration
equation used for actual crushing strength value from observed value is shown in Fig.
3.15.
To calculate crushing strength:
Crushing strength (MPa) = P/A …………….....…….…………………………… (3.2)
Here, P= Force at failure (kN)
A= Cross-sectional area of the top face of the specimen.
0
1000
2000
3000
4000
5000
6000
0 1000 2000 3000 4000 5000 6000
Act
ual l
oad
(lb)
Observed load (lb)
Calibration equation; y = 0.987x-27.9237
scale: 0-60,000 lb

53
Figure 3.14: Photograph of crushing strength testing machine (Technotest Modena Italy)
Figure 3.15: Calibration chart of crushing strength test machine
0
100
200
300
400
500
600
700
800
900
1000
0 200 400 600 800 1000 1200
Act
ual l
oad
(kN
)
Observed load (kN)
Calibration equation; y=1.0014x-111.03

54
Prior to the testing, the prepared CSSB specimens were stacked in the laboratory. In
Fig. 3.16 stacked CSSB specimens are shown prior to the testing. Before crushing
strength test, blocks were cut into halves and then unit weight was determined. In Fig.
3.17, the machine used for cutting the blocks is shown.
Figure 3.16: Photographs of CSSB specimens before cutting
Figure 3.17: Photograph of CSSB specimens cutting prior to testing

55
Figure 3.18: Photograph of CSSB specimen setup for crushing strength test
3.7.3 Moisture content test
The moisture content of the crushed sample was tested from the CSSB specimens after
crushing strength test. The samples were taken in the dishes. They were oven dried for
24 hours and then the moisture content was achieved by calculation.
Figure 3.19: Photograph of crushed sample preserved for moisture content test
1/2 inch plywood sheet
CSSB

56
3.7.4 Water absorption capacity test on CSSB specimens
Some CSSB specimens were selected for the water absorption capacity test according
to ASTM C 830. After complete curing, the specimens were cut into halves. Then the
mass of CSSB specimens were taken. After that, they were kept under water at the
fully submerged condition in a basin for 24 hours. After 24 hours immersion under
water, the mass of block specimens are again taken. The water absorption capacity of
the blocks are then calculated by the following formula.
To calculate water absorption:
Water absorption (%) = [(W-D)/D] *100% ……………………………………. (3.3)
Here, W= Mass of the wet block after 24 hours immersion under water
D= Mass of the block after oven dry at 1050C -1100C
Table 3.9: CSSB combinations used for water absorption test
Cement % CSSB
specimens Sand %
Fine Coarse Fine + Coarse
5 AF45 40 - -
AM45F+ 26.67 13.33 40
6
AM46 20 20 40 AM46C+ 13.33 26.67 40
AM56 25 25 50 AM56F+ 33.33 16.67 50
8 AC38 - 30 - AM48 20 20 40
Figure 3.20: Photograph of CSSB specimens kept under submerged condition for 24
hours

57
Figure 3.21: Photograph of wet CSSB specimens after 24 hours immersion under water
3.7.5 Crushing strength test on wet CSSB specimens
Crushing strength test was done on same wet CSSB specimens which were selected
for the water absorption capacity test. After immersion for 24 hours under the
submerged condition, they were kept in natural air condition for half an hour. Then
they were taken for crushing strength test. The testing method is the same as that of
crushing strength test for the specimens dried at natural weather condition.
3.8 Test Plan
First soil index properties were determined to classify the soil. Compressive strength
test and crushing strength test, unit weight test, moisture content test and water
absorption capacity test were performed on CSEB specimens prepared from selected
soil after curing.
3.9 Summary
The present study area for the experimental program is selected in Savar and
Shariatpur district in Bangladesh. The soil samples were collected from the selected
locations of Savar and Shariatpur and tested in the laboratory to determine the index
properties. The stabilizers used in preparing the specimens are also described. Finally,
the details of the laboratory tests which have been conducted to determine the strength
and deformation characteristics and in some cases, water absorption capacity test of
some selected CSSB specimens are also discussed in this chapter.

58
Chapter 4
TEST RESULTS AND DISCUSSIONS
4.1 General
The main purpose of this research is to investigate the effectiveness of cement and
sand with soil at different proportions to construct sustainable, environment friendly
earthen block that can be used for building construction. The obtained compressive
strength under different percentages of stabilizers is described here. Besides this, the
deformation characteristics of different types of Compressed Stabilized Earth Block
(CSEB) are evaluated here. Soil identification test was conducted to know if the soil
was suitable to prepare the compressed earth block. Otherwise, the structures of the
soil have to be improved. This chapter discusses the soil index properties, soil
stabilization plan, compressive strength, deformation characteristics and water
absorption capacity of the prepared earthen block specimens at different combinations.
Photographs of relevant test specimens have been presented here. The strength and
deformation characteristics of CSEB specimens prepared for compressive strength test
has been discussed with respective curves and comparison of charts. The crushing
strength of CSSB specimens has been compared with respect to different proportions
of sand and cement content. Effects of coarse sand, fine sand and mixed sand along
with different percentages of cement content on the crushing strength of CSSB
specimens have been discussed with respective graphs and charts. These graphs will
clearly show the ranges of crushing strength for different percentages of cement and
sand content. Percentages of water absorption of some selected CSSB specimens and
their wet crushing strength have been compared with those of dry CSSB specimens.
4.2 Index Properties of Collected Soil Sample
Three soil samples were used for this study. The grain size distribution of collected
soil samples and coarse sand which were used for making CSEB are presented in Fig.
4.1 and 4.2 respectively. The physical properties such as specific gravity, grain size
distribution, Atterberg limits of the collected soil samples have been presented in Table
4.1.
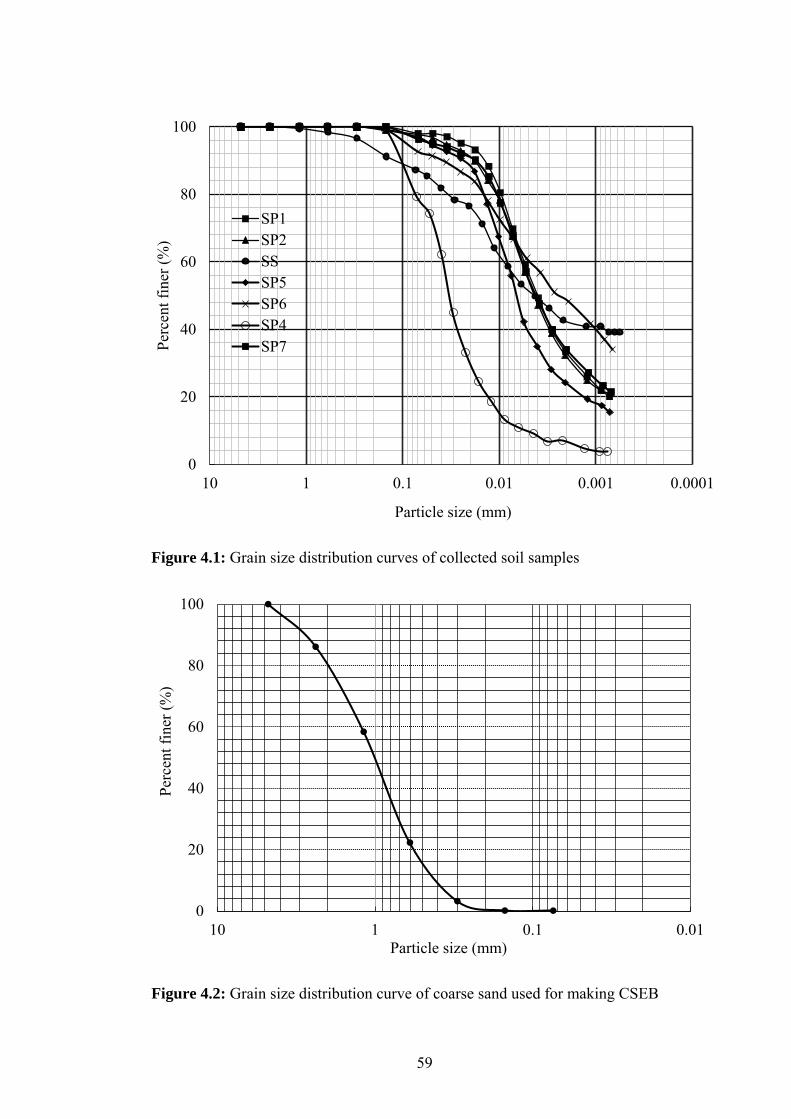
59
Figure 4.1: Grain size distribution curves of collected soil samples
Figure 4.2: Grain size distribution curve of coarse sand used for making CSEB
0
20
40
60
80
100
0.00010.0010.010.1110
Perc
ent f
iner
(%)
Particle size (mm)
SP1SP2SSSP5SP6SP4SP7
0
20
40
60
80
100
0.010.1110
Perc
ent f
iner
(%)
Particle size (mm)

60
Table 4.1: Index properties and grain size distribution of collected soil samples
Soil designation
Gs PI (%)
SL (%)
Sand (%)
Silt (%)
Clay (%)
SS 2.61 32 20 12 47 41
SP1 2.71 - - 1.2 41.5 57.3
SP2 2.68 - - 2.1 43.2 54.7
SP3 2.69 - - 0.50 62.60 36.90
SP4 2.70 - - 12.9 76.6 10.5
SP5 2.73 14 19 1.40 58.30 40.30
SP6 2.70 29 11 4.30 56.40 39.03
SP7 2.76 19 25 0.50 43.60 56
Note: Gs: Specific gravity; PI: Plasticity index ; SL : Shrinkage limit
Table 4.2: Index properties and grain size distribution of sand used for making CSEB
Sand Sand designation F.M Cu Cz
Coarse sand CS 3.29 4.06 1.18
Fine sand (River sand) FS 0.20 - -
Note: F.M: Fineness modulus, Cu: co-efficient of uniformity, Cz: Co-efficient of curvature
4.3 CSEB Stabilization Plan
The soil sample (SS) collected from Savar consists of 12% sand, 47% silt and 41%
clay as shown in Table 4.1. Compressive strength test was conducted upon the block
specimens made with SS soil to know the strength and deformation characteristics of
CSEB specimens. Four groups of specimens, i.e., Unstabilized Block (USB), Cement
Sand Stabilized Block (CSSB), Lime Stabilized Block (LSB) and Lime Jute Stabilized
Block (LJSB) were prepared for compressive strength test.
Seven soil samples collected from Shariatpur contain very low percentages of sand as
shown in Table 4.1. Finally, the soil samples (SP1 and SP2) which were selected from
Shariatpur consists of 1.2-2.1 % sand, 41.5-43.2% silt and 57.3-54.7% clay. Here, the
soil lacks structure and the binding capacity of silt is less than that of clay. According
to Auroville guideline, when the soil is more clayey than sandy it recommends the

61
addition of 20 to 40% coarse sand with soil to give some skeleton and reduce plasticity
of the soil. According to Rigassi (1985), cement mainly reacts with sand and gravels.
Hence, sufficient coarse sand, fine sand and mixed sand (coarse sand+fine sand) were
added with the selected soil to improve its granular structure. In this study, the sand
content for CSSB specimens was maintained in the range of 20-60% by weight of soil.
Cement was added as a stabilizer in six proportions by weight such as: 3%, 5%, 6%,
7%, 8% and 9%. From the existing literature, it has been found that the economic range
of cement is 7 to 8% and minimum average is 5% (Auroville Earth Institute, 2018). In
this study, the level of cement was used from 3 to 9%. To demonstrate the role of sand
and cement, total 47 types of different soil-sand-cement mixes blocks were produced
using aforementioned cement and sand content. And finally, some blocks were made
using only soil. These unstabilized blocks were prepared to compare with the stabilized
blocks. Crushing strength test was conducted upon the CSSB specimens.
4.4 Properties of CSEB Specimens Made for Compressive Strength Test
Compressive strength tests were performed upon the CSEB specimens made with SS
soil to compare the deformation characteristics of different types of earthen blocks.
List of specimens with their material compositions is presented in Table 4.3. The
typical stress-strain relationship for the above mentioned combinations are presented
in Fig. 4.3 to 4.6. Finally, in Fig. 4.7 a combined graph was developed for the
comparison of stress-strain relationship among CSSB, LJSB, LSB and USB
specimens. Description of the specimens group, compressive strength and failure
strain is shown in Table 4.4. Comparison of strength parameters of CSEB specimens
has been shown in Table 4.5. Moreover, comparisons of ultimate compressive strength
and failure strain among different types of CSEB specimens have been presented in
Fig. 4.8 and Fig. 4.9. Lastly, in Fig. 4.10, the failure pattern of CSEB specimens is
shown.

62
Table 4.3: Specimens group with material compositions prepared for compressive strength test
Specimens group
Soil type
Stabilizer content (% w/w)
Cement Coarse sand Lime Jute fiber
Jute length (cm)
USB
SS
- - - - -
CSSB 9 13 - - -
LSB - - 5 - 3-4
LJSB - - 5 0.3 3-4
Figure 4.3: Stress-strain relationship curve of Unstabilized Block (USB)
0
1
2
3
4
0 3 6 9 12 15
Stre
ss (M
Pa)
Axial strain (%)
USB-1USB-2

63
Figure 4.4: Stress-strain relationship curve of Cement Sand Stabilized Block (CSSB)
Figure 4.5: Stress-strain relationship curve of Lime Jute Stabilized Block (LJSB)
0
1
2
3
4
0 3 6 9 12 15
Stre
ss (M
Pa)
Axial strain (%)
CSSB-1CSSB-2
Failed
0
1
2
3
4
0 3 6 9 12 15
Stre
ss (M
Pa)
Axial strain (%)
LJSB-1LJSB-2

64
Figure 4.6: Stress-strain relationship curve of Lime Stabilized Block (LSB)
Figure: 4.7: Curve showing a comparison of stress-strain relationship of CSSB, LJSB,
LSB and USB specimens
0
1
2
3
4
0 3 6 9 12 15
Stre
ss (M
Pa)
Axial strain (%)
LSB-1LSB-2LSB-3
0
1
2
3
4
0 3 6 9 12 15
Stre
ss (M
Pa)
Axial strain (%)
LSB-1LSB-2LSB-3CSSB-1CSSB-2LJSB-1LJSB-2USB-1USB-2

65
Table 4.4: Stress and strain properties of CSEB specimens
Specimens group
Specimen group ID Ultimate compressive strength (MPa)
Failure strain (%)
LSB
LSB-1 2.1 2.4
LSB-2 1.9 2.3
LSB-3 3.4 3.1
CSSB CSSB-1 4.1 3.1
CSSB-2 3.8 2.3
LJSB LJSB-1 3.7 7.6
LJSB-2 3.3 8.9
USB USB-1 1.1 3.6
USB-2 1.4 2.6
Table 4.5: Comparison of average value of strength parameters of CSEB specimens
Specimens group
Average ultimate compressive
strength (MPa)
Average failure strain
(%) Remarks
LSB 2.5 2.6 For LJSB specimen, the
ultimate compressive strength
has been reduced by 13.2% and
failure strain has been
increased by 67% compared to
CSSB specimen
CSSB 3.9 2.7
LJSB 3.5 8.2
USB 1.2 3.1

66
Figure 4.8: Chart showing a comparison of ultimate compressive strength among different types of CSEB specimens
Figure 4.9: Chart showing a comparison of ultimate failure strain among different types of CSEB specimens
0
1
2
3
4
LSB CSSB LJSB USB
Ulti
mat
e co
mpr
essi
ve st
reng
th (M
Pa)
0
2
4
6
8
10
LSB CSSB LJSB USB
Failu
re st
rain
(%)

67
(a) Failure pattern of CSSB specimen
(b) Failure pattern of LJSB specimen
CSSB specimen cracked
LJSB specimen cracked
LJSB specimen bulged

68
(c) Failure pattern of LSB specimen
(d) Failure pattern of USB specimen
Figure 4.10: Failure pattern of CSEB specimens after test: (a) Cement Sand Stabilized Block (CSSB), (b) Lime Jute Stabilized Block (LJSB), (c) Lime Stabilized Block (LSB) and (d) Unstabilized Block (USB)
LSB specimen cracked
Brittle failure of USB specimen

69
4.4.1 Comparison of strength and deformation properties of CSEB specimens
CSSB specimen has improved compressive strength (3.9 MPa) than any other types of
block (Fig. 4.7). LJSB specimen has improved failure strain than any other types of
block (Fig. 4.7). CSSB specimens cracked but LJSB specimens bulged, continued to
carry load and sometimes after carrying the load it cracked (Fig. 4.10 (a) and (b)).
From Table 4.5, it is seen that the average failure strain of LJSB is 8.3%. The average
failure strain of the rest other blocks have in the range of 2.6 to 3.1%. The average
compressive strength of the LJSB has been found 3.5 MPa which is near to
compressive strength of CSSB. The average compressive strength of LSB and USB
was found 2.5 MPa and 1.2 MPa respectively.
Photographs of shear band of LJSB specimen (Fig. 4.10 (b)) indicates that after
inception of failure, the randomly distributed jute fibers resist the separation of broken
parts. So, the broken (but not separated) parts of the specimen continue to share in the
load carrying capacity which in turn increases the failure strain with the overall
increase in ductility. So, it is said that although the cement sand stabilized blocks
possess high compressive strength, it has low failure strain and ductility of this block
is comparatively low. Addition of small amount of lime and jute reinforcement with
soil offers considerable bond strength with the development of no shrinkage crack at
the time of curing. LJSB specimen stayed in one piece together for a long time at the
time of loading because they have high failure strain and considerably good ultimate
strength.
4.5 Properties of CSSB Specimens Made for Crushing Strength Test
Crushing strength test was performed upon the block specimens to determine the
strength characteristics of Cement Sand Stabilized Block (CSSB). The blocks were
prepared using SP1 and SP2 soil. Total 47 types of blocks were prepared stabilized
with cement. Description of the specimens group, compressive strength, unit weight
and moisture content are given in Table 4.6. Here, the results shown in Table 4.6 are
for average of each five numbers blocks of the same group. The data of unit weight,
moisture content and crushing strength of all the specimens are plotted in Fig. 4.11 and
Fig. 4.12.

70
Table 4.6: Compressive strength, unit weight and moisture content of CSSB specimens in various combinations
Cement ( %)
CSSB specimens
Sand (%) Average compressive
strength (MPa)
Average unit weight (gmcm-3)
Average moisture content (%) Fine Coarse Fine + Coarse
3 AC23 - 20 - 0.89 1.69 7.2 AC43 - 40 - 1.13 1.77 6.0 AC63 - 60 - 1.88 1.83 4.8
5
AC25 - 20 - 3.38 1.61 1.4 AC35 - 30 - 3.82 1.68 1.7 AC45 - 40 - 3.85 1.68 1.2 AC55 - 50 - 3.49 1.77 1.8 AC65 - 60 - 4.26 1.68 0.9 AM35 15 15 30 3.21 1.86 0.6 AF55 50 - - 5.35 1.74 0.7 AM45 20 20 40 2.98 1.69 1.9
AM45C+ 13.33 26.67 40 4.03 1.69 0.7 AM45F+ 26.67 13.33 40 5.32 1.76 0.8
AM55 25 25 50 4.51 2.00 3.1 AM55C+ 16.67 33.33 50 4.52 1.81 1.0 AM55F+ 33.33 16.67 50 4.56 1.79 1.0 AM55F+2 20 30 50 4.30 1.76 0.7

71
Cement ( %)
CSSB specimens
Sand (%) Average compressive
strength (MPa)
Average unit weight (gmcm-3)
Average moisture content (%) Fine Coarse Fine + Coarse
5
AM65 30 30 60 3.46 1.83 1.4 AM65C+ 20 40 60 4.23 1.87 1.0 AM65F+ 40 20 60 3.30 1.78 1.3
AF65 60 - - 3.25 1.74 1.2
6
AC26 - 20 - 3.57 1.68 5.0 AC36 - 30 - 3.96 1.72 2.8 AC46 - 40 - 4.25 1.73 3.6 AC56 - 50 - 4.53 1.82 3.1 AC66 - 60 - 4.73 1.87 2.3 AM36 15 15 30 4.08 1.72 1.6
AM36C+ 10 20 30 4.30 1.85 2.0 AM36F+ 20 10 30 3.71 1.71 1.0
AM46 20 20 40 5.23 1.68 0.9 AM46C+ 13.33 26.67 40 5.28 1.85 1.7
AM56 25 25 50 5.06 1.80 2.0 AM56F+ 33.33 16.67 50 6.07 1.79 0.4
7
AC47 - 40 - 5.64 1.79 3.6 AC57 - 50 - 5.62 1.82 3.3 AC67 - 60 - 4.42 1.79 1.5 AM37 15 15 30 4.66 1.74 1.6
Table 4.6: Compressive strength, unit weight and moisture content of CSSB specimens in various combinations (contd.)

72
Cement ( %)
CSSB specimens
Sand (%) Average compressive
strength (MPa)
Average unit weight (gmcm-3)
Average moisture content (%) Fine Coarse Fine + Coarse
8
AC28 - 20 - 3.54 1.68 5.6 AC38 - 30 - 5.17 1.61 4.0 AC48 - 40 - 5.41 1.71 2.1 AC58 - 50 - 5.58 1.79 3.8 AC68 - 60 - 5.62 1.82 1.1 AM48 20 20 40 4.98 1.79 4.1
AM68F+ 40 20 60 5.24 1.93 3.7
9 AC29 20 20 - 2.75 1.75 12.5 AC49 40 40 - 3.28 1.82 10.3 AC69 60 60 - 5.59 1.90 5.3
Unstabilized block
- - - - 1.37 1.65 4.8
Table 4.6: Compressive strength, unit weight and moisture content of CSSB specimens in various combinations (contd.)

73
Figure 4.11: Unit weight vs moisture content of CSSB specimens
1
1.5
2
2.5
0 2 4 6 8 10 12 14 16 18
Uni
t wei
ght (
gm/c
m3 )
Moisture content (%)AC23 AC43 AC63 AC25 AC35 AC45AC55 AC65 AF55 AM35 AM45 AM55AM55C+ AM55F+ AM55F+2 AM65 AM65C+ AM65F+AC26 AC46 AC56 AC66 AM36 AM36C+AM36F+ AM46 AM46C+ AM56 AM56F+ AC36AC47 AC57 AC67 AM37 AC28 AC38AC38 AC48 AC58 AC68 AM48 AM68F+AC29 AC49 AC69 Unstabilized block

74
Figure 4.12: Compressive strength vs moisture content of CSSB specimens
0
2
4
6
8
0 2 4 6 8 10 12 14 16 18
Com
opre
ssiv
e st
reng
th (M
Pa)
Moisture content (%)
AC23 AC43 AC63 AC25 AC35AC45 AC55 AC65 AF55 AM35AM45 AM55 AM55C+ AM55F+ AM55F+2AM65 AM65C+ AM65F+ AC26 AC46AC56 AC66 AM36 AM36 AM36C+AM36F+ AM46 AM46C+ AM56 AM56F+AC36 AC47 AC57 AC67 AM37AC28 AC38 AC38 AC48 AC58

75
4.6 Compressive Strength of Unstabilised Block (USB) Prepared for Crushing
Strength Test
Total 5 numbers of unstabilised block have been prepared for crushing strength test.
From the Fig. 4.13 compressive strength of unstabilized block (USB) has been found
in the range of 1 to 2 MPa in the condition of moisture content 4.58 to 5.08 % and unit
weight 1.58 to 1.82 gm/cm3.
Figure 4.13: Chart showing compressive strength, moisture content and unit weight of Unstabilized Block (USB)
4.7 Variation of Compressive Strength of CSSB specimens with Cement Content
From the Fig. 4.14 to 4.23, the variation of compressive strength of CSSB specimens
with cement content have been presented and lastly, a combined graph for variation of
compressive strength of CSSB specimens with cement content has been presented in
Fig. 4.24.
0
2
4
6
8
USB-A USB-B USB-C USB-D USB-E
Compressive strength (MPa) Moisture content (%)Unit weight (gm/cm^3)

76
4.7.1 Variation of compressive strength of CSSB specimens with cement content
for 20% coarse sand
In Fig. 4.14, the compressive strength of each five specimens prepared with 20%
coarse sand has been plotted against each level of cement stabilization. In Fig. 4.15,
the variation of compressive strength using an average of five specimens has been
presented with cement content for the specimens prepared with 20% coarse sand.
Figure 4.14: Compressive strength vs cement content (3%, 5%, 6%, 8% and 9%) for 20% coarse sand
0
2
4
6
8
0 2 4 6 8 10
Com
pres
sive
stre
ngth
(MPa
)
Cement (%)
AC23 AC25 AC26 AC28 AC29
AC23 (3% Cement + 20% CS), AC25 (5% Cement + 20% CS)AC26 (6% Cement + 20% CS), AC28 (8% Cement + 20% CS)AC29 (9% Cement + 20% CS)

77
Figure 4.15: Variation of compressive strength with cement content for 20% coarse sand
From the Fig. 4.15, it is seen that the compressive strength increases from 0.89 MPa
to 3.57 MPa with the increase of cement content from 3% to 6%. After this, the
increment of strength becomes steady up to 8% cement. Then, the compressive
strength decreases after the addition of 8% cement. From the Fig. 4.15, it can be seen
that the rate of increase of compressive strength from AC25 to AC26 is 5% only. From
the Fig. 4.15, it seems that 5% cement content is optimum for the CSSB specimens
containing 20% coarse sand.
0
2
4
6
8
0 2 4 6 8 10
Com
pres
sive
stre
ngth
(MPa
)
Cement (%)
AC23 (3% Cement + 20% CS), AC25 (5% Cement + 20% CS) AC26 (6% Cement + 20% CS), AC28 (8% Cement + 20% CS) AC29 (9% Cement + 20% CS)

78
4.7.2 Variation of compressive strength of CSSB specimens with cement content
for 30% coarse sand
In Fig. 4.16, the compressive strength of each five specimens prepared with 30%
coarse sand has been plotted against each level of cement stabilization. In Fig. 4.17,
the variation of compressive strength using an average of five specimens has been
presented with cement content for the specimens prepared with 30% coarse sand.
Figure 4.16: Compressive strength vs cement content (5%, 6% and 8%) for 30%
coarse sand
0
2
4
6
8
0 2 4 6 8 10
Com
pres
sive
stre
ngth
(MPa
)
Cement (%)
AC35 AC36 AC38
AC35 (5% Cement + 30% CS), AC36 (6% Cement + 30% CS) AC38 (8% Cement + 30% CS)

79
Figure 4.17: Variation of compressive strength with cement content for 30% coarse sand
From the Fig. 4.17, it is seen that the compressive strength increases with the increase
of cement content. The compressive strength increases from 3.82 MPa to 5.17 MPa
with the increase of cement content from 5% to 8% for the specimens prepared with
30% coarse sand. The compressive strength increases by 3.67% with the increase of
cement content from 5% to 6% for the specimens (AC35 and AC36) prepared with
30% coarse sand. Again, the rate of increase of compressive strength is 30.5% for the
specimens (AC36 and AC38) prepared with 30% coarse sand when cement content
increases from 6% to 8%.
0
2
4
6
8
0 2 4 6 8 10
Com
pres
sive
stre
ngth
(MPa
)
Cement (%)
AC35 (5% Cement + 30% CS), AC36 (6% Cement + 30% CS) AC38 (8% Cement + 30% CS)

80
4.7.3 Variation of compressive strength of CSSB specimens with cement content
for 40% coarse sand
In Fig. 4.18, the compressive strength of each five specimens prepared with 40%
coarse sand has been plotted against each level of cement stabilization. In Fig. 4.19,
the variation of compressive strength using an average of five specimens has been
presented with cement content for the specimens prepared with 40% coarse sand.
Figure 4.18: Compressive strength vs cement content (3%, 5%, 6%, 7%, 8% and 9%) for 40% coarse sand
0
2
4
6
8
10
0 2 4 6 8 10
Com
pres
sive
stre
ngth
(MPa
)
Cement (%)
AC43 AC45 AC46 AC47 AC48 AC49
AC43 (3% Cement + 40% CS), AC45 (5% Cement + 40% CS) AC46 (6% Cement + 40% CS), AC47 (7% Cement + 40% CS) AC48 (8% Cement + 40% CS), AC49 (9% Cement + 40% CS)

81
Figure 4.19: Variation of compressive strength with cement content for 40% coarse sand
From the Fig. 4.19, it is seen that the compressive strength increases from 1.12 MPa
to 6.1 MPa with the increase of cement content from 3% to 7%. After that, the
compressive strength decreases. From this, it seems that 7% cement content is
optimum for the CSSB specimens containing 40% coarse sand.
0
2
4
6
8
0 2 4 6 8 10
Com
pres
sive
stre
ngth
(MPa
)
Cement (%)
AC43 (3% Cement + 40% CS), AC45 (5% Cement + 40% CS) AC46 (6% Cement + 40% CS), AC47 (7% Cement + 40% CS) AC48 (8% Cement + 40% CS), AC49 (9% Cement + 40% CS)

82
4.7.4 Variation of compressive strength of CSSB specimens with cement content
for 50% coarse sand
In Fig. 4.20, the compressive strength of each five specimens prepared with 50%
coarse sand has been plotted against each level of cement stabilization. In Fig. 4.21,
the variation of compressive strength using an average of five specimens has been
presented with cement content for the specimens prepared with 50% coarse sand.
Figure 4.20: Compressive strength vs cement content (5%, 6%, 7% and 8%) for
50% coarse sand
0
2
4
6
8
10
0 2 4 6 8 10
Com
pres
sive
stre
ngth
(MPa
)
Cement (%)
AC55 AC56 AC57 AC58
AC55 (5% Cement + 50% CS), AC56 (6% Cement + 50% CS) AC57 (7% Cement + 50% CS), AC58 (8% Cement + 50% CS)

83
Figure 4.21: Variation of compressive strength with cement content for 50% coarse sand
From the Fig. 4.21, it is seen that the compressive strength increases from 3.49 MPa
to 5.58 MPa with the increase of cement content from 3% to 8%. The rate of increase
of compressive strength from AC57 to AC58 is 1.4% only. From this, it seems that 7%
cement content is optimum for the CSSB specimens containing 50% coarse sand.
0
2
4
6
8
0 2 4 6 8 10
Com
pres
sive
sren
gth
(MPa
)
Cement (%)
AC55 (5% Cement + 50% CS), AC56 (6% Cement + 50% CS) AC57 (7% Cement + 50% CS), AC58 (8% Cement + 50% CS)
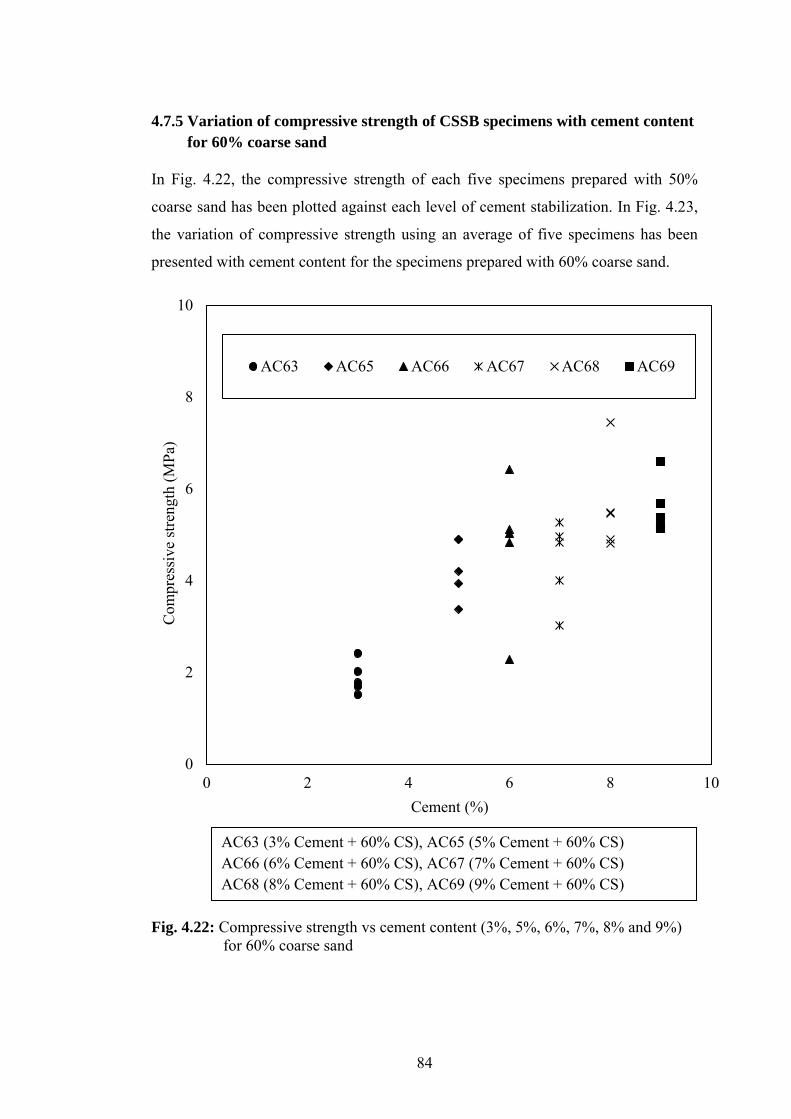
84
4.7.5 Variation of compressive strength of CSSB specimens with cement content
for 60% coarse sand
In Fig. 4.22, the compressive strength of each five specimens prepared with 50%
coarse sand has been plotted against each level of cement stabilization. In Fig. 4.23,
the variation of compressive strength using an average of five specimens has been
presented with cement content for the specimens prepared with 60% coarse sand.
Fig. 4.22: Compressive strength vs cement content (3%, 5%, 6%, 7%, 8% and 9%)
for 60% coarse sand
0
2
4
6
8
10
0 2 4 6 8 10
Com
pres
sive
stre
ngth
(MPa
)
Cement (%)
AC63 AC65 AC66 AC67 AC68 AC69
AC63 (3% Cement + 60% CS), AC65 (5% Cement + 60% CS) AC66 (6% Cement + 60% CS), AC67 (7% Cement + 60% CS) AC68 (8% Cement + 60% CS), AC69 (9% Cement + 60% CS)

85
Figure 4.23: Variation of compressive strength with cement content for 60% coarse
sand
From the Fig. 4.23, it is seen that the compressive strength increases from 1.18 MPa
to 5.62 MPa with the increase of cement content from 3% to 8%. After the addition of
9% cement the compressive strength decreases. From this figure, it can be seen that
the rate of increase of compressive strength from AC67 to AC68 is 2% only.
Therefore, it seems that 7% cement content is optimum for the CSSB specimens
containing 60% coarse sand.
0
2
4
6
8
0 2 4 6 8 10
Com
pres
sive
stre
ngth
(MPa
)
Cement (%)
AC63 (3% Cement + 60% CS), AC65 (5% Cement + 60% CS) AC66 (6% Cement + 60% CS), AC67 (7% Cement + 60% CS) AC68 (8% Cement + 60% CS), AC69 (9% Cement + 60% CS)

86
Figure 4.24: Line showing a comparison of compressive strength of CSSB specimens with cement content for different percentages of coarse sand
From the Fig. 4.15, it seems that for the CSSB specimens containing 20% coarse sand
optimum cement content is 5%. From the Fig. 4.17, it can be seen that for the CSSB
specimens containing 30% coarse sand, the compressive strength increases with the
increase of cement content. From the Fig. 4.19, 4.21 and 4.23, it can be seen that for
the CSSB specimens containing 40%, 50% and 60% coarse sand the optimum cement
content is 7%. From the Fig. 4.14 to 4.23, it also seems that after addition of 40%
coarse sand, compressive strength of CSSB specimens either decreases or rate of
increase of compressive strength becomes low.
0
2
4
6
8
0 2 4 6 8 10
Com
pres
sive
stre
ngth
(MPa
)
Cement (%)
20% coarse sand 30% coarse sand40% coarse sand 50% coarse sand60% coarse sand

87
4.8 Variation of Compressive Strength of CSSB Specimens with Coarse Sand
Content
From the Fig. 4.25 to 4.30, the variation of compressive strength of CSSB specimens
using an average of five specimens with coarse sand for the specimens prepared with
3%, 5%, 6%, 7%, 8% and 9% cement content have been presented. Lastly, a combined
graph has been developed in Fig. 4.31.
Figure 4.25: Variation of compressive strength with coarse sand for 3% cement stabilization
From the Fig. 4.25, it is seen that the compressive strength increases with the increase
of coarse sand. The compressive strength increases from 0.89 MPa to 1.89 MPa with
the increase of coarse sand from 20% to 60%. The rate of increase of compressive
strength from AC23 to AC43 and AC43 to AC63 is 36% and 69% respectively.
0
2
4
6
8
0 10 20 30 40 50 60 70
Com
pres
sive
stre
ngth
(MPa
)
Coarse sand (%)
AC23 (3% Cement + 20% CS), AC43 (3% Cement + 40% CS) AC63 (3% Cement + 60% CS)

88
Figure 4.26: Variation of compressive strength with coarse sand for 5% cement stabilization
From the Fig. 4.26, it is seen that the compressive strength increases from 3.38 MPa
to 3.85 MPa with the increase of coarse sand from 20% to 40%. After this, the
compressive strength decreases after adding 50% coarse sand. Again, the compressive
strength of the specimens (AC55 and AC65) prepared with 5% cement increases from
3.49 to 4.26 MPa with the increase of coarse sand from 50% to 60%. It is also observed
that the rate of increase of compressive strength for the specimens (AC55 and AC65)
prepared with 5% cement with the increase of coarse sand from 50% to 60% is 22%.
0
2
4
6
8
0 10 20 30 40 50 60 70
Com
pres
sive
stre
ngth
(MPa
)
Coarse sand (%)
AC25 (5% Cement + 20% CS), AC35 (5% Cement + 30% CS) AC45 (5% Cement + 40% CS), AC55 (5% Cement + 50% CS) AC65 (5% Cement + 60% CS)

89
Figure 4.27: Variation of compressive strength with coarse sand for 6% cement
stabilization
From the Fig. 4.27, it is seen that the compressive strength increases from 3.57 MPa
to 4.73 MPa with the increase of coarse sand from 20% to 60%. The rate of increase
of compressive strength from AC26 to AC36, AC36 to AC46, AC46 to AC56 and
AC56 to AC66 is 11%, 7%, 7% and 4% respectively.
0
2
4
6
8
0 10 20 30 40 50 60 70
Com
pres
sive
stre
ngth
(MPa
)
Coarse sand (%)
AC26 (6% Cement + 20% CS), AC36 (6% Cement + 30% CS) AC46 (6% Cement + 40% CS), AC56 (6% Cement + 50% CS) AC66 (6% Cement + 60% CS)

90
Figure 4.28: Variation of compressive strength with coarse sand for 7% cement stabilization
From the Fig. 4.28, it is seen that the compressive strength decreases from 6.51 MPa
to 5.5 MPa with the increase of coarse sand from 40% to 50%. After this, the increase
of compressive strength becomes steady up to 60% coarse sand.
0
2
4
6
8
0 10 20 30 40 50 60 70
Com
pres
sive
stre
ngth
(MPa
)
Coarse sand (%)
AC47 (7% Cement + 40% CS), AC57 (7% Cement + 50% CS) AC67 (7% Cement + 60% CS)

91
Figure 4.29: Variation of compressive strength with coarse sand for 8% cement stabilization
From the Fig. 4.29, it is seen that the compressive strength increases from 3.54 MPa
to 5.62 MPa with the increase of coarse sand from 20% to 60% for the specimens
prepared with 8% cement. The rate of increase of compressive strength from AC28 to
AC38, AC38 to AC48, AC48 to AC58 and AC58 to AC68 is 46%, 5%, 3% and 0.7%
respectively. From the Fig. 4.29, it also seems that after adding 40% coarse sand the
rate of increase of compressive strength becomes low for the CSSB specimens
containing 8% cement.
0
2
4
6
8
0 10 20 30 40 50 60 70
Com
pres
sive
stre
ngth
(MPa
)
Coarse sand (%)
AC28 (8% Cement + 20% CS), AC38 (8% Cement + 30% CS) AC48 (8% Cement + 40% CS), AC58 (8% Cement + 50% CS) AC68 (8% Cement + 60% CS)

92
Figure 4.30: Variation of compressive strength with coarse sand for 9% cement stabilization
From the Fig. 4.30, it is seen that the compressive strength increases from 2.75 MPa
to 5.59 MPa with the increase of coarse sand from 20% to 60% for the specimens
prepared with 8% cement. The rate of increase of compressive strength from AC29 to
AC49 and AC49 to AC69 is 19% and 70% respectively. From the Fig. 4.30, it also
seems that with the increase of coarse sand the rate of increase of compressive strength
becomes higher than the previous ones for the CSSB specimens containing 9% cement.
0
2
4
6
8
0 10 20 30 40 50 60 70
Com
pres
sive
stre
ngth
(MPa
)
Coarse sand (%)
AC29 (9% Cement + 20% CS), AC49 (9% Cement + 40% CS) AC69 (9% Cement + 60% CS)

93
Figure 4.31: Variation of compressive strength of CSSB specimens with coarse sand
for different percentages of cement content (3%, 5%, 6%, 7%, 8% and 9%)
From the Fig. 4.25 to 4.30, it seems that for 3%, 6%, 8% and 9% cement content with
the increase of coarse sand the compressive strength increases. For the CSSB
specimens in case of 5% cement, after addition of 50% coarse sand a tendency of
increasing compressive strength is observed. For the CSSB specimens containing 7%
cement with the increase of coarse sand the compressive strength decreases.
0
2
4
6
8
0 20 40 60 80
Com
pres
sive
stre
ngth
(MPa
)
Coarse sand (%)
3% cement 5% cement 6% cement7% cement 8% cement 9% cement

94
4.9 Variation of Compressive Strength of CSSB Specimens with Mixed Sand
Content
From the Fig. 4.32 to 4.35, the variation of compressive strength for the specimens prepared with mixed sand has been presented.
Figure 4.32: Variation of compressive strength of CSSB specimens with different percentages of mixed sand for 5% cement
In Fig. 4.32, for the specimens (AM35, AM45, AM55 and AM65) prepared for 50%
mixed sand with 5% cement the compressive strength decreases from 3.21 MPa to
2.98 MPa with the increase of mixed sand content from 30% to 40%. Again, the
compressive strength increases from 2.98 MPa to 3.46 MPa with the increase of mixed
sand content from 40% to 60%. From the Fig. 4.32, it is also seen that after aadding
20% mixed sand to AM45 the strength of the resulting AM65 becomes 16.10%
stronger (or 8.05% per 10% increase of mixed sand).
0
2
4
6
8
0 10 20 30 40 50 60 70
Com
pres
sive
stre
ngth
(MPa
)
Mixed sand (%)
AM35 (5% Cement + 15% CS + 15% FS) AM45 (5% Cement + 20% CS + 20% FS) AM55 (5% Cement + 25% CS + 25% FS) AM65 (5% Cement + 30% CS + 30% FS)

95
Figure 4.33: Chart showing a comparison of compressive strength of CSSB specimens for 50% sand with 5% cement
From the Fig. 4.33, it can be seen that all the specimens of 50% mixed sand with 5%
cement content (AM55F+, AM55F+2, AM55 and AM55C+) have compressive
strength in the range of 3.21 to 4.56 MPa. With the increase of fine sand when coarse
sand decreases, with respect to AM55 the compressive strength increases by 34% ,
42% and 67% for AM55F+2, AM55F+ and AF55 respectively. When AM55 (25%
coarse sand + 25% fine sand) is converted into AM55C+ (33.33% coarse sand and
16.67% fine sand) the compressive strength increases by 41%. From the Fig. 4.33, it
is also seen that AF55 possesses 26% higher compressive strength than AC55. From
the Fig. 4.33, it also seems that for the CSSB specimens containing 5% cement with
50% mixed sand, after adding 25% fine sand compressive strength increases with the
increase of fine sand.
0
2
4
6
8
AM
55C+
AM
55
AM
55F+2
AM
55F+
AF55
AC
55
Com
pres
sive
stre
ngth
(MPa
)
AM55C+ (5% Cement + 33.33% CS + 16.67% FS) AM55 (5% Cement + 25% CS+ 25% FS) AM55F+2 (5% Cement + 20% CS + 30% FS) AM55F+ (5% Cement + 16.67% CS + 33.33% FS) AF55 (5% Cement + 50% FS) AC55 (5% Cement + 50% CS) AC55 (5% Cement + 50% CS)

96
Figure 4.34: Chart showing a comparison of compressive strength of CSSB specimens for 60% sand with 5% cement
From Fig. 4.34, it is seen that all the specimens of 60% mixed sand with 5% cement
content (AM65F+, AM65 and AM65C+) have compressive strength in the range of
3.3 to 4.23 MPa. With the increase of coarse sand when fine sand is decreasing,
compressive strength increases with respect to AM65F+ by 5% and 29% for AM65
and AM65C+ respectively. When AC65 (60% coarse sand) is converted into AM65C+
(40% coarse sand and 20% fine sand) the compressive strength also remains almost
same, which reflects the lower effect of fine sand. When AM65 (30% coarse sand and
30% fine sand) is converted into AM65C+ (40% coarse sand and 20 % fine sand), the
compressive strength increases by 22.25%. From the Fig. 4.34, it is also seen that
AC65 possesses 31% higher compressive strength than AF65.
0
2
4
6
8
AM
65F+
AM
65
AM
65C+
AC
65
AF65
Com
pres
sive
stre
ngth
(MPa
)
AM65F+ (5% Cement + 20% CS + 40% FS) AM65 (5% Cement + 30% CS + 30% FS) AM65C+ (5% Cement + 40% CS + 20% FS) AC65 (5% Cement + 60% CS) AF65 (5% Cement + 60% FS)

97
Figure 4.35: Chart showing a comparison of compressive strength of CSSB specimens for 30% sand with 6% cement
From the Fig. 4.35, it is seen that all the CSSB specimens (AM36F+, AM36,
AM36C+) of 30% mixed sand with 6% cement have compressive strength in the range
of 3.71 to 4.03 MPa. With the increase of coarse sand when fine sand is decreasing,
with respect to AM36F+ the compressive strength increases by 10% and 16% for
AM36 and AM36C+ respectively.
0
2
4
6
8
AM
36F+
AM
36
AM
36C+
AC
36C
ompr
essi
ve st
reng
th (M
Pa)
AM36F+ (6% Cement + 10% CS + 20% FS) AM36 (6% Cement + 15% CS + 15% FS) AM36C+ (6% Cement + 20% CS + 10% FS) AC36 (6% Cement + 30% CS)

98
4.10 Compressive Strength of CSSB Specimens Greater than 5 MPa
There are total 14 numbers of CSSB specimens which have compressive strength
greater than 5 MPa (Fig. 4.36). Two numbers of CSSB specimens from 5% cement,
AM45F+ and AF55 have compressive strength of 5.32 and 5.35 MPa respectively.
Four numbers of CSSB specimens from 6% cement AM56, AM56F+, AM46,
AM46C+ have compressive strength of 5.06, 6.07, 5.23 and 5.28 MPa respectively.
Again from 8% cement, the five numbers of CSSB specimens AC38, AC48, AC58,
AC68 and AC68F+ have compressive strength of 5.17, 5.41, 5.58, 5.62 and 5.24 MPa
respectively. The one block from 9% cement carries compressive strength 5.59 MPa.
Figure 4.36: Chart showing compressive strength of CSSB specimens greater than 5 MPa
0
2
4
6
8
AM
45F+
AF55
AM
56
AM
56F+
AM
46
AM
46C+
AC
38
AC
48
AC
58
AC
68
AM
68F+
AC
47
AC
57
AC
69C
ompr
essi
ve st
reng
th (M
Pa)

99
4.11 Tests on Wet CSSB Specimens
Water absorption capacity test was conducted on some typical CSSB specimens.
Besides the water absorption capacity test, the crushing strength test and unit weight
test of the same wet CSSB specimens were also determined after 24 hours immersion
under water. Total eight numbers of CSSB specimens were selected for water
absorption capacity test. Descriptions of the respective specimens group with their
material compositions, compressive strength, unit weight and percentages of water
absorption of these groups are presented in Table 4.7. Also, unit weight, moisture
content, percentages of water absorption and crushing strength of these CSSB
specimens have been shown in Fig. 4.37 to 4.39. Percentages of water absorption of
the selected CSSB specimens have been presented in Fig. 4.40. Comparison of unit
weight and crushing strength of dry and wet CSSB specimens have been presented in
Fig. 4.41 and 4.42. Lastly, the crushing strength, water absorption, moisture content
and unit weight of the wet CSSB specimens is presented in Fig. 4.43.
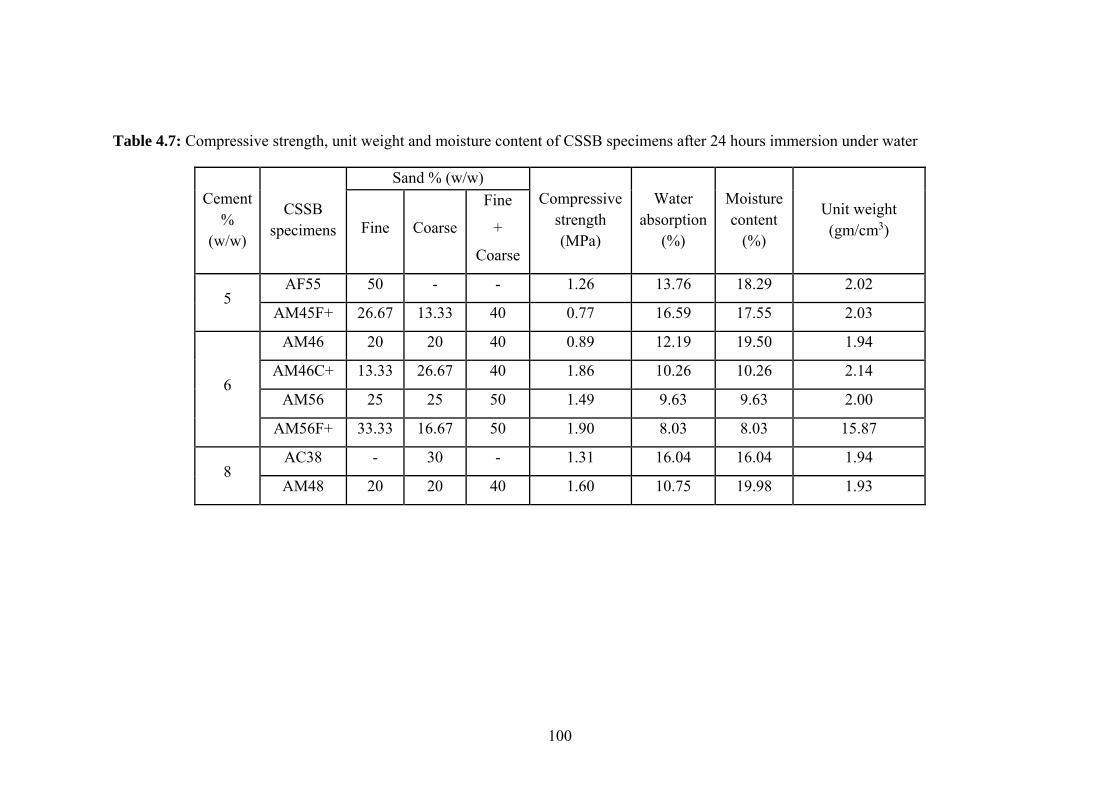
100
Table 4.7: Compressive strength, unit weight and moisture content of CSSB specimens after 24 hours immersion under water
Cement %
(w/w)
CSSB specimens
Sand % (w/w) Compressive
strength (MPa)
Water absorption
(%)
Moisture content
(%)
Unit weight (gm/cm3) Fine Coarse
Fine
+
Coarse
5 AF55 50 - - 1.26 13.76 18.29 2.02
AM45F+ 26.67 13.33 40 0.77 16.59 17.55 2.03
6
AM46 20 20 40 0.89 12.19 19.50 1.94
AM46C+ 13.33 26.67 40 1.86 10.26 10.26 2.14
AM56 25 25 50 1.49 9.63 9.63 2.00
AM56F+ 33.33 16.67 50 1.90 8.03 8.03 15.87
8 AC38 - 30 - 1.31 16.04 16.04 1.94
AM48 20 20 40 1.60 10.75 19.98 1.93

101
Figure 4.37: Compressive strength vs moisture content of wet CSSB specimens
Figure 4.38: Unit weight vs moisture content of wet CSSB specimens
0
1
2
3
4
0 10 20 30 40 50
Com
pres
sive
stre
ngth
(MPa
)
Moisture content (%)
AM48 AC38 AM46 AM56F+AF55 AM46C+ AM56 AM45F+
1.8
2
2.2
0 10 20 30 40 50
Uni
t wei
ght (
gm/c
m3 )
Moisture content (%)
AM48 AC38 AM46 AM56F+AF55 AM46C+ AM56 AM45F+

102
Figure 4.39: Compressive strength vs water absorption after 24 hours immersion under water
0
1
2
3
4
0 5 10 15 20 25 30
Com
pres
sive
stre
ngth
(MPa
)
Water absorption (%)
AM48 AC38 AM46 AM56F+AF55 AM46C+ AM56 AM45F+
AM45F+ (5% Cement + 13.33% CS + 26.67% FS) AF55 (5% Cement + 50% FS) AM56F+ (6% Cement + 16.67% CS + 33.33% FS) AM46 (6% Cement + 20% CS+ 20% FS) AM56 (6% Cement + 25% CS + 25% FS) AM46C+ (6% Cement + 26.67% CS + 13.33% FS) AM48 (8% Cement + 20% CS + 20% FS) AC38 (8% Cement + 30% CS)

103
Figure 4.40: Chart showing percentages of water absorption of wet CSSB specimens
0
5
10
15
20
AM
45F+
AF55
AM
56F+
AM
46
AM
56
AM
46C+
AM
48
AC
38
Wat
er a
bsor
ptio
n (%
)
AM45F+ (5% Cement + 13.33% CS + 26.67% FS) AF55 (5% Cement + 50% FS) AM56F+ (6% Cement + 16.67% CS + 33.33% FS) AM46 (6% Cement + 20% CS+ 20% FS) AM56 (6% Cement + 25% CS + 25% FS) AM46C+ (6% Cement + 26.67% CS + 13.33% FS) AM48 (8% Cement + 20% CS + 20% FS) AC38 (8% Cement + 30% CS)

104
Figure 4.41: Comparison of unit weight between dry and wet CSSB specimens
0
1
2
3
AM
45F+
AF55
AM
56F+
AM
46
AM
56
AM
46C+
AM
48
AC
38
Uni
t wei
ght (
gm/c
m3 )
Dry specimenImmersed specimen
AM45F+ (5% Cement + 13.33% CS + 26.67% FS)AF55 (5% Cement + 50% FS)AM56F+ (6% Cement + 16.67% CS + 33.33% FS)AM46 (6% Cement + 20% CS+ 20% FS) AM56 (6% Cement + 25% CS + 25% FS)AM46C+ (6% Cement + 26.67% CS + 13.33% FS)AM48 (5% Cement + 20% CS + 20% FSAC38 (8% Cement + 30% CS)

105
Figure 4.42: Comparison of crushing strength between dry and wet CSSB specimens
0
2
4
6
8
AM
45F+
AF55
AM
56F+
AM
46
AM
56
AM
46C+
AM
48
AC
38
Com
pres
sive
stre
ngth
(MPa
)Dry specimenImmersed specimen
AM45F+ (5% Cement + 13.33% CS + 26.67% FS)AF55 (5% Cement + 50% FS)AM56F+ (6% Cement + 16.67% CS + 33.33% FS)AM46 (6% Cement + 20% CS+ 20% FS) AM56 (6% Cement + 25% CS + 25% FS)AM46C+ (6% Cement + 26.67% CS + 13.33% FS)AM48 (5% Cement + 20% CS + 20% FSAC38 (8% Cement + 30% CS)

106
Figure 4.43: Chart showing crushing strength, water absorption, moisture content and unit weight of the wet CSSB specimens
1.60
1.31
0.89 1.
90
1.26 1.86
1.49
0.77
10.7
5
16.0
4
12.1
9
8.03
13.7
6
10.2
6
9.63
16.5
9
19.9
8
25.5
0
19.5
0
15.8
7 18.2
9
16.6
3
16.9
8
17.5
5
1.93
1.94
1.94 2.06
2.02
2.14
2.00
2.03
AM48 AC38 AM46 AM56F+ AF55 AM46C+ AM56 AM45F+
Compressive strength (MPa) Water absorption (%) Water content (%) Unit weight (gm/cm^3)

107
4.12 Summary
Laboratory tests were conducted to determine the soil properties. Compressive
strength test and crushing strength test were conducted to determine the strength and
deformation characteristics of Compressed Stabilized Earth Block (CSEB). Crushing
strength test was conducted on total 47 types of Cement Sand Stabilized Block (CSSB)
specimens. The comparisons of different combinations CSSB specimens have been
discussed with relevant graphs, charts and tables. Water absorption capacity of some
CSSB specimens was determined after 24 hours immersion under water. Finally, the
comparisons of crushing strength, unit weight and moisture content of some dry and
wet CSSB specimens are presented with relevant figures.

108
Chapter 5
CONCLUSIONS AND SUGGESTIONS
5.1 Findings of the Study
The main findings of this study are as follows:
(a) From the grain size distribution curve of collected soil samples, it can be seen that
the soil sample selected for making CSEB collected from Savar consists of 12%
sand, 47% silt, 41% clay; and the soil sample collected from Shariatpur consists of
1.2-2.1% sand, 41.5-43.2% silt and 54.7-57.3% clay.
(b) From the compressive strength test results, it has been found that the average
compressive strength of Lime Stabilized Block (LSB), Lime Jute Stabilized Block
(LJSB), Cement Sand Stabilized Block (CSSB) and Unstabilized Block (USB) is
2.5 MPa, 3.5 MPa and 1.2 MPa respectively. The average failure strain of LSB,
CSSB, LJSB and USB is 2.6%, 2.7%, 8.2% and 3.1% respectively. It is observed
that Lime Jute Stabilized Block (LJSB) has higher failure strain than any other
types of blocks. During the compressive strength test, the moisture content of the
blocks was in the range of 7-12%. All the Cement Sand Stabilized Blocks prepared
for crushing strength test contains 0.2-19% moisture content and the range of unit
weight 1.5-2.1 gm/cm3. In most of the cases, the moisture content of Cement Sand
Stabilized Block remained below 5%. From crushing strength test of Cement Sand
Stabilized Block (CSSB) it was found that the highest compressive strength is 6.07
MPa consisting of 6% cement, 17% coarse sand and 33% fine sand by weight in
the condition of moisture content 0.2-0.5% and unit weight of 1.76-1.82 gm/cm3.
(c) It is observed that for 20% and 40 to 60% coarse sand the optimum cement contents
are 5% and 7% respectively.
5.2 Suggestions for Future Study
The main objective of this research was to determine the strength characteristics of
CSEB. Moreover, opportunities for future researches are numerous. During this study
it was felt that the following studies can be conducted in the future:
(a) In this research, the soil was collected from limited sites of Shariatpur and
Savar. Soil collected from other parts of Bangladesh are not investigated for
the suitable soil of CSEB.

109
(b) From the investigation of various soil-sand-cement mixes more satisfactory
compressive strength has been found. But the ductile properties of Cement
Sand Stabilized Blocks was found very poor. Therefore, a study needs to be
carried out for microstructural experiment of natural fiber with cement to
improve its ductile properties. A clear understanding of microstructural
behavior will help in to select suitable fiber for a particular soil and
construction type.
(c) From the experimental results, the same crushing strength was found from
different mixes of cement-sand stabilized blocks. So, an economic analysis is
needed to be done for the production of the block with sufficient strength.
(d) Due to the limitation of scope, analysis of dynamic property was not carried
out. Dynamic test like Shaking Table Test can be conducted.
(e) Despite the possibilities and advantages offered by stabilized earth materials,
building with earth in Auroville is still not in the common practice. Either
people do not want to acknowledge the advantages of this material or they do
not want to get the burden to organize the block production. So, public
awareness must be risen by letting them know about CSEB.
Thus, it is recommended to work on these areas in future in order to address all the
problems and find out probable solutions encountered in CSEB. Finally, it is expected
that the present study will be useful to all those dealing with civil engineering projects
and research works on building materials. This research will also be useful to those
who are involved in the development of low cost and eco-friendly house construction.

110
REFERENCES
Ahmed, A. (2014). “Evaluation properties of compressed earth block”, M.Sc. Engg. Thesis, Department of Civil Engineering, Bangladesh University of Engineering and Technology.
Al-Kiki, I. M., Al-Atalla, M.A. and Al-Zubaydi, H.A. (2011). “Long term strength and durability of clayey soil stabilized with lime”, Eng.Technol. J. 29 (4), 725-735.
Anifowose, A.Y.B. (2000). “Stabilization of lateritic soils as a raw material for building blocks”, Buletin of Engineering Geology and the Environment, 58, 151-157.
Achenza, M. and Fenu, L. (2006). “On earth stabilization with natural polymers for earth masonry construction”, Materials and Structures, 39, 21-27.
Adam, E.A. and Agib, A.R.A. (2001). “Compressed stabilised earth block manufacture in Sudan”, printed by Graphoprint for the United Nations Educational, Scientific and Cultural Organization (UNESCO), Paris, France.
Al-Sakkaf, Y.K.A. (2009). “Durability properties of stabilized earth blocks”. Ph.D Thesis, Universiti Sains Malaysia, Penang, Malaysia.
Atzeni, C., Pia, G., Sanna, U. and Spanu, N. (2008). “A fractal model of the porous microstructure of earth-based materials”, Construction and Building Materials, 22, 1613-1697.
BBS (2008), “Statistical year book”, Bangladesh Bureau of Statistics.
Bahar, R., Benazzoug, M. and Kenai, S. (2004). “Performance of compacted cement-stabilised soil”, Cement and Concrete Composites, 26 (7), 811-820.
Bell, F.G. (1993). “Engineering treatment of soils: Soil stabilization”, 1st edition, publications by E and FN SPON, London, UK.
Bouhicha, M., Aouissi, F. and Kenai, S. (2005). “Performance of composite soil reinforced with barley straw”, Cement and Concrete Composites, 27, 617-621.
Burroughs, V.S. (2001). “Quantitative criteria for the selection of stabilization of soils for rammed earth wall construction, Ph.D Thesis, Faculty of the Built Environment, University of New South Wales, Sydney, Australia.
Burroughs, V.S. (2006). “Strength of compacted earth: linking soil properties to stabilizers”, Building Research and Information, 34, 55-65.
Burroughs, V.S. (2008). “Soil property criteria for rammed earth stabilization”, Journal of Materials in Civil Engineering, 20, 264-273.
Bui, Q.B., Morel, J.C., Venkatarama Reddy, B.V. and Ghayad, W. (2009). “Durability of rammed earth walls exposed for 20 years to natural weathering”, International Journal of Building and Environmental, 44, 912-919.
Chan, C.M. (2011). “Effect of natural fibers inclusion in clay bricks: Physio-mechanical properties”, International Journal of Civil and Environmental Engineering, 3, 51-57.

111
Corps, P. (1981). “Handbook for building homes of earth”, Department of Housing and Urban Development, Washington, D.C., Rep.112 pp.
Danso, H. (2016). “Use of agricultural waste fibers as enhancement of soil blocks for low-cost housing in Ghana”, Ph.D Thesis, University of Portsmouth, UK.
Deboucha, S. and Hashim, R. (2010). “Effect of OPC and PFA cement on stabilised peat bricks”, International Journal of the Physical Sciences, 5 (11), 1671-1677.
Deboucha, S. and Hashim, R. (2011). “A review on bricks and stabilized compressed earth blocks”, Sci. Res. Essays, 6 (3), 499-506.
Fopossi, A.J., Mutuku, R.N. and Ngapgue, F. (2014). “Physical behavior of clay mixed with stabilizer on linear shrinkage for making compressed soil blocks: A case study using Mangu soil”, Electronic Journal of Geotechnical Engineering, 19, 9965-9973.
Gowda, R.P.C. (2016). “Experimental study of cement stabilized fiber reinforced compressed earth blocks as an alternative building material”, M.Sc. Engg. Thesis, Arizona State University.
Garg, S.K. (2001). “Soil mechanics and foundation engineering”, Khanna Publishers, Delhi, India.
Guettala, A., Houari, H., Mezghiche, B. and Chebili, R. (2002). “Durability of lime stabilized earth blocks”, Journal of Courrier Du Savoir, 2 (1), 61-66.
Guettala, A., Abibsi, A. and Houari, H. (2006). “Durability study of stabilized earth concrete under both laboratory and climatic conditions exposure”, Construction and Building Materials, 20 (3), 119-127.
Hall, M. and Djerbib, Y. (2004). “Rammed earth sample production: Context, recommendations and consistency”, Construction and Building Materials, 18, 281-286.
Heathcote, K.A. (1995). “Durability of earth wall buildings”, Construction and Building Materials, 9 (3), 185-189.
Health, A., Walker, P. and Fourie, C. (2009). “Compressive strength of extruded unfired clay masonry units”, Proc. Int. Civil Eng., Constr. Mater., 162 (3), 105-112.
Holliday, L., Ramseyer, C., Reyes, M. and Butko, D. (2016). “Building with compressed earth block within the building code”. ASCE Journal of Architectural Engineering, 22 (3), 1-13.
Houben, H. and Guillaud, H. (1994). “Earth construction: A comprehensive guide”, Intermediate Technology Publications, London, UK.
Houben, H. and Guillaud, H. (2005). “Earth construction: A comprehensive guide”, Intermediate Technology Publications, London, UK.
Illampas, R., Ioannou, I. and Charmpis, D.C. (2014). “Adobe bricks under compression: Experimental investigation and derivation of stress–strain equation”, Construction and Building Materials, 53, 83-90.

112
Ismail, S. and Yaacob, Z. (2011). “Properties of laterite brick reinforced with oil palm empty fruit bunch fibers”, Pertanika Journal of Science and Technology, 19, 33-43.
Islam, M.S. and Rahman, M.M. (2010). “Strength and ductility characteristics of jute fiber reinforced earthen block-mortar system”, in Proceedings of the 3rd International Earthquake Symposium, Dhaka, Bangladesh, 41-48.
Islam, M.S. (2010). “Present status and problems of earthen architecture in Bangladesh: Role of education”, Proceedings of the Seminar TERRA Education, France, 176-184, 24-29 May.
Islam, M.S. and Haque, N. (2009). “Earthen housing for better adaption to climate change in Bangladesh”, Proc. of the Conference on Climate Change Impacts and Adaption Strategies for Bangladesh, International Training Network (ITN) Centre, BUET, Dhaka, Bangladesh.
Islam, M.S., Hossain, M.I., Islam, M.A., Shahriar, A.R. and Bose, B. (2016). “Construction of earthen houses using CSEB: Bangladesh perspective”, Proceedings of 3rd International Conference on Advance in Civil Engineering, 21-23 December, CUET, Chittagong, Bangladesh.
Islam, M.S. and Iwashtia, K. (2010). “Earthquake resistance of adobe reinforced by low cost traditional materials”, Journal of Natural Disaster Science, Japan Society for Natural Disaster and Science, Japan, 32 (1), 1-21.
Islam, M.S. (2002). “Research on earthquake resistant reinforcement for earthen houses”, Ph.D Thesis, Department of Civil and Environmental Engineering, Saitama University, Japan.
Jagadish, K.S. (2007). “Building with stabilized mud”, I.K. International Publishing House Pvt. Ltd., New Delhi, India.
Kateregga, J.K. (1983). “Improvement and use of earth construction products for low cost housing”, Proceedings of a Symposium on Appropriate Building Materials for Low Cost Housing, African region, Nairobi, Kenya, 7-14 November.
Kerali, A.G. (2001). “Durability of compressed and cement-stabilized building blocks”, Ph.D Thesis, University of Warwick, UK.
Kim-Carberry, S. (2011). “The year of the mud: Building a cob house documents green home building with cob”, Published on 16 April, 2011, 38 pp.
Lal, A.K. (1995). “Handbook of low cost housing, New Delhi, India, New Age International Publishers, 181 pp.
Mostafa, M. and Uddin, N. (2016). “Experimental analysis of Compressed Earth Block (CEB) with banana fibers resisting flexural and compression forces”, Construction Materials, 5, 53-56.
Minke, G. (2009). “Building with earth: Design and technology of a sustainable architecture”, Basle, Birkhauser, Publishers for architecture, 198 pp.

113
Morel, J.C. and Gourc, J.P. (1997). “Mechanical behavior of sand reinforced with mesh elements”. Geosynthetics International, 4, 481-508.
Morel, J.C. and Pkla, A. (2002). “A model to measure compressive strength of compressed earth blocks with the 3 points bending test’, Construction and Building Materials, 16, 303–310.
Morel, J.C., Pkla, A. and Walker, P. (2007). “Compressive strength testing of compressed earth blocks”, Construction and Building Materials, 21, 303–307.
Morel, J.C., Mesbah, A. and Walker, P. (2001). “Building houses with local material: means to drastically reduce the environmental impact of construction”, Building and Environment, 36, 1119-1126.
Mesbah, A., Morel, J.C., Walker, P. and Ghavimi, K. (2004). “Development of a direct tensile test for compacted earth blocks reinforced with natural fibers”. Journal of Materials in Civil Engineering, 16 (1), 95-98.
Morris, J. and Booysen, Q. (2000). “Earth construction in Africa”, Proceedings of the Strategies for a Sustainable Built Environment, Pretoria, 23-25 August.
Morton, T. (2007). “Towards the development of contemporary earth construction in the UK: Drivers and benefits of earth masonry as a sustainable mainstream construction technique”, Proceedings of International Symposium on Earthen Structures, Indian Institute of Science, Bangalore, India, 22-24 August.
Muntohar, A. (2011). “Engineering characteristics of the compressed stabilized earth block”, Construction and Building Materials, 25, 4215-4022.
Ngowi, A.B. (1997). “Improving the traditional earth construction: A case study of Botswana”, Construction and Building Materials, 11, 1-7.
Nagaraj, H.B. (2014). “Role of lime with cement in long-term strength of compressed stabilized earth blocks”, 3 (1), 54 -61.
Nagaraj, H.B., Sravan, M.V., Arun, T.G. and Jagadish, K.S. (2014). “Role of lime with cement in long term strength of compressed stabilized earth blocks”, International Journal of Sustainable Built Environment, 3, 54-61.
Riza, F.V., Rahman, I.A. and Zaidi, A.M.A. (2011). “Preliminary study of Compressed Stabilized Earth Brick (CSEB)”, Australian Journal of Basic and Applied Sciences, 5, 6-12.
Riza, F.V., Rahman, I.A. and Zaidi, A.M.A. (2010). “A brief review of Compressed Stabilized Earth Brick (CSEB)”, Proceedings of the International Conference on Science and Social Research (CSSR), Kuala Lumpur, Malaysia, 5 – 7 December.
Rigassi, V. (1985). “Compressed earth block: Manual of production”, CRATerre-EAG, Deutsche Development Agency, 143 pp.
Rahman, M.M. (2010). “Performance of natural fiber reinforced soil blocks for earthen houses”, M.Sc. Engg. Thesis, Department of Civil Engineering, Bangladesh University of Engineering and Technology.

114
Rahman, M.M., Rashiduzzaman, M.M., Akhand, F.Z. and Kabir, K.B. (2016). “Compressed stabilized earth block: A green alternative for non-load bearing block in developing countries like Bangladesh”, American Chemical Science Journal, 12 (3), 1-10.
Sharma, V., Vinayak, K.H and Marwaha, M.B. (2015). “Enhancing sustainability of rural adobe houses of hills by addition of vernacular fiber reinforcement, International Journal of Sustainable Building Environment, 4, 348-358.
Spence, R.J.S. (1975). “Predicting the performance of soil-cement as a building material in tropical countries”, Build. Sci., 10 (2), 155-159.
Stulz, R. and Mukerji, K. (1988). “Appropriate building materials: a catalogue of potential solutions”, 3rd revised edition, SKAT publications, Switzerland.
Tadege, B. (2007). “Study of compressed cement stabilized soil blocks as an alternative wall making material”, M.Sc. Engg. Thesis, The School of Graduate Studies of Addis Ababa University.
UN HABITAT (2009). “Interlocking stabilized soil blocks: Appropriate technology in Uganda”, UN Habitat.
Venkatarama Reddy, B.V. and Jagadish, K.S. (1989). “Properties of soil cement block masonry”, Masonry Int., 3(2), 80-84.
Venkatarama Reddy, B.V. (1991). “Studies on static soil compaction and compacted soil cement blocks for walls”, Ph.D Thesis, Department of Civil Engineering, IISC, Bangalore.
Venkatarama Reddy, B.V. and Kumar, P. (2009). “Embodied energy in cement stabilised rammed earth walls”, Energy and Buildings, 42 (3), 380-385.
Venkatarama Reddy, B.V. and Jagadish, K.S. (2003). “Embodied energy of common and alternative building materials and technologies”, Energy and Buildings, 35 (2), 129-137.
Venkatarama Reddy, B.V. and Walker, P. (2005). “Stabilized mud blocks: Problems, prospects”, Proc., Int. Earth Building confer., Earth build., Sydney, Australia, pp. 63-75.
Venkatarama Reddy, B.V. and Gupta, A. (2005). “Characteristics of soil-cement blocks using highly sandy soils”, Materials and Structures, 38 (5), 651-658.
Venkatarama Reddy, B.V. (2007). “Indian standard code of practice for manufacture and use of stabilised mud blocks for masonry”. International Symposium on Earthen Structures, Indian Institute of Science, Bangalore: Interline Publishing, India.
Vilane, B.R.T. (2010). “Assessment of stabilization of adobes by confined compression tests”, Bio Systems Engineering, 106, 551-558.
Walker, P.J. (1995). “Strength, durability and shrinkage characteristics of cement stabilized soil blocks”, Cement and Concrete Composites, 17 (4), 301-310.
Walker, P.J. and Stace, T. (1995). “Properties of some cement stabilized compressed earth blocks and mortars”, Cement and Concrete Composites, 17 (4), 301-310.
115
Walker, P.J. (2004). “Strength and erosion characteristics of earth blocks and earth blocks masonry”, Journal of Materials in Civil Engineering, 16 (5), 497-506.
Walker, P.J. and Stace, T. (1997). “Properties of some cement stabilized compressed earth blocks and mortars”, Mater. Struct., 30, 545-551.
Wang, L. (2002). “Cementitious stabilization of soils in the presence of sulfate”, Ph.D Thesis, Louisana State University, Baton Rogue, USA.
Web Site:
Aurovile Earth Institute (AVEI), Available at: www.earth-aurovile.com (Accessed on 12 October, 2017).
AECT (2009), AECT Compressed Earth Block, Advanced Earthen Construction Technologies, Available at: http://www.aectceb.com (Accessed on 14 December, 2017).
Dreamstime.com (2010), Royal free stock photograph: wattle-and-daub construction details, Available at: www.dreamstime.com/royalty-free-stock-photography-wattle-daub-construction-details-image15290967 (Accessed on 10 November, 2017).
Rural house, Banglapedia, National encyclopedia of Bangladesh (Accessed on 10 March, 2017).
School handmade in Bangladesh, METI School, Available at: http://www.meti-school.de/daten/projektbeschreibung_e.htm (Accessed on 10 September, 2017).
Taylor, C. (2011). Cinva Ram compressed earth block press plans, Available at: http://www.dirtcheapbuilder.com/Home_Building/Earth_Block_Construction.htm (Accessed on 15 October, 2017).
Varga, C. P. (2009). Available at: philadelphiaspeaks.com/forum/philadelphia-photos/6454-ollantaytambo-peru.html (Accessed on 10 September, 2017).
www.philadelphiaspeaks.com/forum/philadelphia-photos/6454-ollantaytambo-peru.html) (Accessed on 12 May, 2018).
http://greenbuildingelements.com/2011/05/09/the-year-of-the-mud-documents-green-home-building-with-cob (Accessed on 10 June, 2018).
https://www.dhakatribune.com/bangladesh/environment/2017/11/09/brick-kiln-pollution-bangladesh-new-building-materials (Accessed on 12 May, 2018).
CRAterre-ENSAG, International Centre for Earth Construction, Available at: https://www.preventionweb.net/organizations/8450 (Accessed on 10 May, 2018).

APPENDIX-A
LABORATORY TEST RESULTS

117
Atterberg Limit Test Results (SS)
Sample location: Baroipara, Savar
Table A-1: Liquid limit test of the soil sample SS
No. of blows 14 20 24 28 34 Weight of container + wet soil (gm) 26.3 23.1 24.5 24.4 21.2 Weight of container + dry soil (gm) 20.8 17.6 19.9 19 16.9 Weight of water (gm) 5.5 5.5 4.6 5.4 4.3 Weight of dry soil (gm) 9.9 10.7 9.3 11.7 9.7 Water content (%) 55.5 51.4 49.4 46.1 44.3 Liquid limit 48
Table A-2: Plastic limit test of the soil sample SS
Plastic Limit Container no. 191 721 Weight of container + wet soil (gm) 16.5 17.2 Weight of container + dry soil (gm) 15.2 15.7 Weight of water (gm) 1.3 1.5 Weight of dry soil (gm) 8.4 8.8 Water content (%) 15.4 17.1 Plastic limit 17 Plasticity Index (PI) 31
Figure A-1: Flow curve for determination of liquid limit of the soil sample SS
20
40
60
80
6.25 12.5 25 50
Wat
er c
onte
nt, %
No. of blows

118
Atterberg Limit Test Results (SP)
Sample Location: Middle Char Rusundhi (2 ft below ground), Shariatpur
Table A-3: Liquid limit test of the soil sample SP3
No. of blows 15 18 24 29 35
Weight of container + wet soil (gm) 23.4 24.5 24.6 22.1 24.1
Weight of container + dry soil (gm) 19 19.3 20 18 19.2
Weight of water (gm) 4.4 5.2 4.6 4.1 4.9
Weight of dry soil (gm) 9.1 11.9 10.3 11.2 11.8
Water content (%) 48.3 43.6 44.6 36.6 41.5
Liquid limit 42
Table A-4: Plastic limit test of the soil sample SP3
Container no. 2304 45
Weight of container + wet soil (gm) 19.6 17.9
Weight of container + dry soil (gm) 17.2 15.7
Weight of water (gm) 2.4 2.2
Weight of dry soil (gm) 8.4 8.5
Water content (%) 28.6 25.9
Plastic limit 28 Plasticity Index (PI) 14
Table A-5: Shrinkage limit test of the soil sample SP3
Dish no. 1 Weight of dish (gm) 29 Weight of dish + wet soil (gm) 57.6 Weight of dish + dry soil (gm) 49.6 Weight of dry soil pat (gm) 20.6 Weight of water (gm) 8 Weight of displaced Mercury (gm) 173.8 Volume of displaced Mercury (cc) 12.8 Volume of dish (cc) 15.1 Initial moisture content of soil pat (%) 38.8 Volume of moisture (cc) 2.2 Moisture content of dry soil pat (%) 10.7 Shrinkage limit 29

119
Figure A-2: Flow curve for determination of liquid limit of the soil sample SP3
Sample Location: Dorichar, Dattapara, Shariatpur
Table A-6: Liquid limit test of the soil sample SP5
No. of blows 15 20 24 29 33
Weight of container + wet soil (gm) 18.8 21.6 18.7 25.2 18.7
Weight of container + dry soil (gm) 15 16.8 15.5 21.1 15.6
Weight of water (gm) 3.8 4.8 3.2 4.1 3.1
Weight of dry soil (gm) 8.7 10.1 8 10.5 8.1
Water content (%) 43.7 47.5 40 39.0 38.2
Liquid limit 41
Table A-7: Plastic limit test of the soil sample SP5
Container no. 137 836 Weight of container + wet soil (gm) 17.8 17 Weight of container + dry soil (gm) 15.4 14.9 Weight of water (gm) 2.4 2.1 Weight of dry soil (gm) 8.5 8 Water content (%) 28.2 26.2 Plastic limit 28 Plasticity Index (PI) 13
20
40
60
80
6.25 12.5 25 50
Wat
er c
onte
nt, %
No. of blows

120
Table A-8: Shrinkage limit test of the soil sample SP5
Dish no. 7 Weight of dish (gm) 29.6 Weight of dish + wet soil (gm) 55.5 Weight of dish + dry soil (gm) 47.9 Weight of dry soil pat (gm) 18.3 Weight of water (gm) 7.6 Weight of displaced Mercury (gm) 145.1 Volume of displaced Mercury (cc) 10.7 Volume of dish (cc) 14.8 Initial moisture content of soil pat (%) 41.5 Volume of moisture (cc) 4.1 Moisture content of dry soil pat (%) 22.6 Shrinkage limit 19
Figure A-3: Flow curve for determination of liquid limit of the soil sample SP5
20
40
60
80
6.25 12.5 25 50
Wat
er c
onte
nt, %
No. of blows

121
Sample Location: Bala Bazar, Rudrokor East (2 ft below gorund), Shariatpur
Table A-9: Liquid limit test of the soil sample SP6
No. of blows 12 16 24 30 34 Weight of container + wet soil (gm) 19.7 20 23.4 18.4 17.8 Weight of container + dry soil (gm) 15.2 15 19.1 14.6 13.9 Weight of water (gm) 4.5 5 4.3 3.8 3.9 Weight of dry soil (gm) 7.9 8 8 7.4 6.8 Water content (%) 56.9 62.5 53.7 51.3 57.3 Liquid limit 57
Table A-10: Plastic limit test of the soil sample SP6
Container no. 25 875 Weight of container + wet soil (gm) 17.7 20 Weight of container + dry soil (gm) 15.4 17.1 Weight of water (gm) 2.3 2.9 Weight of dry soil (gm) 8.4 9.9 Water content (%) 27.4 29.3 Plastic limit 29 Plasticity Index (PI) 28
Table A-11: Shrinkage limit test of the soil sample SP6
Dish no. 9 Weight of dish (gm) 28 Weight of dish + wet soil (gm) 52.8 Weight of dish + dry soil (gm) 44.2 Weight of dry soil pat (gm) 16.2 Weight of water (gm) 8.6 Weight of displaced Mercury (gm) 110.9 Volume of displaced Mercury (cc) 8.19 Volume of dish (cc) 15.1 Initial moisture content of soil pat (%) 53.0 Volume of moisture (cc) 6.9 Moisture content of dry soil pat (%) 42.6 Shrinkage limit 11

122
Figure A-4: Flow curve for determination of liquid limit of the soil sample SP6
Sample Location: Chor Jadobpur, Tula Tola Goja, Shariatpur
Table A-12: Liquid limit test of the soil sample SP7
No. of blows 14 20 24 28 34 Weight of container + wet soil (gm) 19.2 23.5 18.5 19.1 21.1 Weight of container + dry soil (gm) 15.5 18.6 15.1 15.6 17.2 Weight of water (gm) 3.7 4.9 3.4 3.5 3.9 Weight of dry soil (gm) 8.1 11.3 7.9 8.6 9.7 Water content (%) 45.6 43.3 43.0 40.6 40.2 Liquid limit 42
Table A-13: Plastic limit test of the soil sample SP7
Container no. 191 721 Weight of container + wet soil (gm) 17.4 18.8 Weight of container + dry soil (gm) 15.5 16.6 Weight of water (gm) 1.9 2.2 Weight of dry soil (gm) 8.2 9.6 Water content (%) 23.1 22.9 Plastic limit 23 Plasticity Index (PI) 19
0
20
40
60
80
6.25 12.5 25 50
Wat
er c
onte
nt, %
No. of blows

123
Table A-14: Shrinkage limit test of the soil sample SP7
Dish no. 6 Weight of dish (gm) 22.2 Weight of dish + wet soil (gm) 47.9 Weight of dish + dry soil (gm) 40.2 Weight of dry soil pat (gm) 18 Weight of water (gm) 7.7 Weight of displaced Mercury (gm) 157.1 Volume of displaced Mercury (cc) 11.6 Volume of dish (cc) 14.8 Initial moisture content of soil pat (%) 42.7 Volume of moisture (cc) 3.2 Moisture content of dry soil pat (%) 17.8 Shrinkage limit 25
Figure A-5: Flow curve for determination of liquid limit of the soil sample SP7
20
40
60
80
6.25 12.5 25 50
Wat
er c
onte
nt, %
No. of blows

124
Sample Location: Bala Bazar, Rudrokor (West), Shariatpur
Table A-15: Liquid limit test of the soil sample SP8
No. of blows 15 18 23 32 35
Weight of container + wet soil (gm) 23.4 24.8 24.4 24.8 26.6
Weight of container + dry soil (gm) 17.4 19.6 18.8 19.7 21.5
Weight of water (gm) 6 5.2 5.6 5.1 5.1
Weight of dry soil (gm) 10.4 10.1 11.1 10.1 10.4
Water content (%) 57.7 51.4 50.4 50.5 49.0
Liquid limit 51
Table A-16: Plastic limit test of the soil sample SP8
Container no. 2255 2132 Weight of container + wet soil (gm) 22.9 25.1 Weight of container + dry soil (gm) 20.6 22.4 Weight of water (gm) 2.3 2.7 Weight of dry soil (gm) 9.9 12.3 Water content (%) 23.23 21.9 Plastic limit 23 Plasticity Index (PI) 28
Table A-17: Shrinkage limit test of the soil sample SP8
Dish no. 2 Weight of dish (gm) 28.9 Weight of dish + wet soil (gm) 53.4 Weight of dish + dry soil (gm) 44.9 Weight of dry soil pat (gm) 16 Weight of water (gm) 8.5 Weight of displaced Mercury (gm) 156.1 Volume of displaced Mercury (cc) 11.53 Volume of dish (cc) 15.03 Initial moisture content of soil pat (%) 53.12 Volume of moisture (cc) 3.5 Moisture content of dry soil pat (%) 21.87 Shrinkage limit 32

125
Figure A-6: Flow curve for determination of liquid limit of the soil sample SP8
Sample Location: Rudrokor, East Char Rushundi
Table A-18: Liquid limit test of the soil sample SP9
No. of blows 15 18 24 29 35 Weight of container + wet soil (gm) 21.6 20.2 27 23.2 20.2 Weight of container + dry soil (gm) 17 16.3 22.5 18.8 17.6 Weight of water (gm) 4.6 3.9 4.5 4.4 2.6 Weight of dry soil (gm) 9.6 9.4 11.8 12.3 7 Water content (%) 47.9 41.4 38.1 35.7 37.1 Liquid limit 38
Table A-19: Plastic limit test of the soil sample SP9
Container no. 48 847 Weight of container + wet soil (gm) 16.6 22.6 Weight of container + dry soil (gm) 14.8 20.4 Weight of water (gm) 1.8 2.2 Weight of dry soil (gm) 8 9.3 Water content (%) 22.5 23.6 Plastic limit 24 Plasticity Index (PI) 14
20
40
60
80
6.25 12.5 25 50
Wat
er c
onte
nt, %
No. of blows
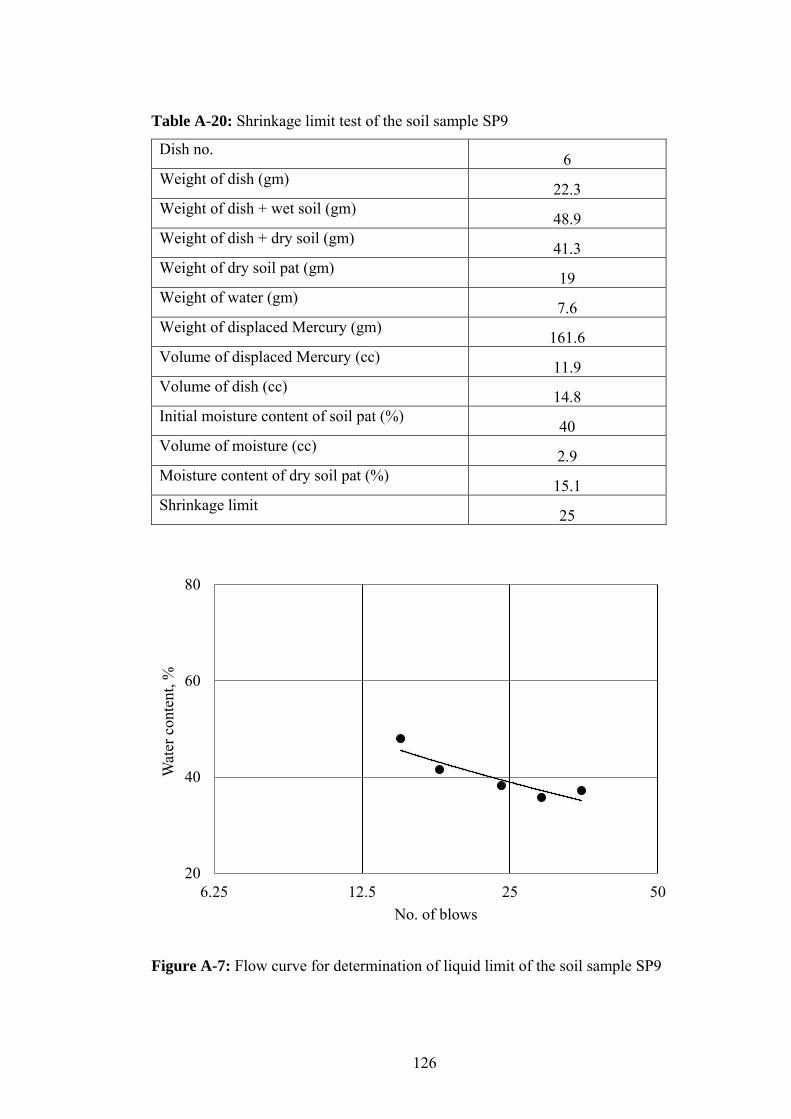
126
Table A-20: Shrinkage limit test of the soil sample SP9
Dish no. 6
Weight of dish (gm) 22.3
Weight of dish + wet soil (gm) 48.9
Weight of dish + dry soil (gm) 41.3
Weight of dry soil pat (gm) 19
Weight of water (gm) 7.6
Weight of displaced Mercury (gm) 161.6
Volume of displaced Mercury (cc) 11.9
Volume of dish (cc) 14.8
Initial moisture content of soil pat (%) 40
Volume of moisture (cc) 2.9
Moisture content of dry soil pat (%) 15.1
Shrinkage limit 25
Figure A-7: Flow curve for determination of liquid limit of the soil sample SP9
20
40
60
80
6.25 12.5 25 50
Wat
er c
onte
nt, %
No. of blows