strength and resistivity properties of fouled ballast
TRANSCRIPT
Strength and Resistivity Properties of Fouled Ballast
By Madan Neupane
Bachelor of Civil Engineering, Institute of Engineering, Tribhuvan University, Nepal, 2007
Submitted to
The Department of Civil, Environmental, and Architectural Engineering and Graduate Faculty of the University of Kansas in partial fulfillment of the requirements for the
degree of Master of Science
………………………
Dr. Robert L. Parsons, Chairperson
Committee Members
……………………..
Dr. Jie Han
…………………….
Dr. Anil Misra
Date Defended: 01/07/2015
The Thesis Committee for Madan Neupane certifies that this is the approved version of the
following thesis:
Strength and Resistivity Properties of Fouled Ballast
………………………
Dr. Robert L. Parsons, Chairperson
Committee Members
……………………..
Dr. Jie Han
…………………….
Dr. Anil Misra
Date Approved: 01/07/2015
Dedicated to my parents,
Keshab Prasad Neupane and Mrs. Indira Devi Neupane
i
Abstract
Maintaining rail track in good condition is essential for ensuring the overall performance and
safety of railway operations. Track support, structural integrity, and effectiveness of the
foundation structure depend on the characteristics and performance of the ballast and sub-ballast
layers. The ballast of the rail track may be fouled due to intrusion of fine particles from outside
the ballast as well as particles produced within the layer due to breakage over time. This fouling
can cause track support degradation and permanent settlement. Studies show that about one third
of the total freight operation cost is invested for the track maintenance. Therefore, methods for
locating and characterizing fouling that are faster, more effective, and less expensive would be
valuable to the industry. Since there are limited methods for fouling detection and these methods
are time consuming, tedious and require significant manpower; a simple approach of
identification of ballast fouling within a few minutes at low cost is discussed in this report.
Stone dust from ballast degradation caused by wear and tear of the ballast; intrusion of coal dust
due to spillage from train cars; and extrusion of fine particles from the subgrade are the major
contributors to ballast fouling. These particles have the capability to retain moisture and hence
reduce the friction between ballast particles. Previous studies show that the fouled ballast
electrical resistivity and hydraulic conductivity have certain relationships that can be used to
define the amount of fouling of the ballast. The fouling agents retain moisture which acts as the
medium of electrical conductivity, since there is almost no flow of electricity through the air
voids or solid ballast particles of the ballast layer. So, it is proposed that ballast fouling be
estimated by measuring the resistivity of the ballast. Static modulus, resilient modulus and
California bearing ratio (CBR) were also investigated to determine the impact of the ballast
fouling on strength properties.
ii
A vertical probe was designed at the University of Kansas (KU); Civil, Environmental and
Architectural Engineering department to measure the resistivity of the fouled ballast. The probe
was tested using both horizontal and vertical configurations and worked well for estimating
resistivity using the fall of potential method. Forty-eight test samples of fouled ballast were
prepared in a box of almost 11 cubic feet size with different degrees of fouling and with various
moisture contents. Resistivity tests using a Wenner 4 probe array in horizontal alignment and fall
of potential method with a vertical probe and vertical alignment were carried out. Also, the light
weight deflectometer (LWD) test for the measurement of resilient modulus, static plate loading
test for determination of static modulus, and dynamic cone penetration (DCP) test for California
bearing ratio (CBR) estimation were carried out.
The results from the vertical probe were consistent on most of the test samples when the Wenner
4 point array method. A boundary moisture content – termed as optimum moisture content for
resistivity (OMCR) was determined. The OMCR values were 6% for subgrade soil fouled
ballast, 5% for Gardner track ballast dust fouled ballast, and 5.5% of coal dust fouled ballast. The
resistivity of the fouled ballast can be estimated for moisture contents greater than OMCR. The
resilient modulus, static modulus and the CBR of the ballast decreased significantly for moisture
contents greater than OMCR. Static and resilient moduli peaked near the OMCR for all types of
fouling while the CBR was constant to slightly increasing with moisture content up to the
OMCR.
iii
Acknowledgements
I would like to express my deepest gratitude to my advisor, Professor Robert L. Parsons, for
giving me the opportunity to work on this research and for guiding me personally as well as
professionally to meet the academic challenges. His tutelage always guides and motivates me to
strive for and achieve useful skills for my future careers. I would also like to express my deep
appreciation to Professors Jie Han and Anil Misra for their valuable suggests and feedback on
the development and completion of this thesis and for serving as members on my examining
committee.
I would like to thank Mid-America Transportation Center (MATC) for providing financial
support for this research. I am also grateful to Mr. Hank Lees of BNSF for proving the fouled
sample ballast needed for the test and Michael A. Wnek of BNSF for coordinating and guiding in
field trip. I would also like to thank Mr. Matthew Maksimowicz, Eric Nicholson, and David
Woody for their technical support. I would also like to express my thanks to Mr. Zachary Aaron
Brady (undergraduate research assistant), Krisna Prasad Ghimire, Deep K. Khatri, Jun Geo and
other individuals who contributed to the completion of this research thesis both directly and
indirectly and for their help in the physical testing. The authors would like to express their
appreciations to the organizations and the individuals for their help and support.
Finally, I would like to thank my family and friends for their endless supports and love.
iv
Table of Contents
ABSTRACT .................................................................................................................................. II
ACKNOWLEDGEMENTS ....................................................................................................... IV
TABLE OF CONTENTS .............................................................................................................V
LIST OF TABLES ...................................................................................................................... XI
LIST OF FIGURES ................................................................................................................. XIII
CHAPTER ONE: INTRODUCTION ...................................................................................... 1
1.1. BACKGROUND .....................................................................................................................1
1.2. PROBLEM STATEMENT .........................................................................................................2
1.3. RESEARCH OBJECTIVE..........................................................................................................4
1.4. (FUKUE, MINATOA, HORIBE, & TAYA, 1999) RESEARCH METHODOLOGY................................4
1.5. THESIS ORGANIZATION ........................................................................................................5
CHAPTER TWO: LITERATURE REVIEW ......................................................................... 7
2.1. INTRODUCTION OF FOULED BALLAST....................................................................................7
2.2. EFFECTS OF FOULED BALLAST..............................................................................................8
2.3. RESISTIVITY OF FOULING AGENTS ...................................................................................... 11
2.4. MEASUREMENT MODULE OF ELECTRICAL RESISTANCE OF FOULED BALLAST........................ 14
2.5. RESISTANCE MEASUREMENT OF FOULED BALLAST AT LAB AND FIELD ................................. 18
2.6. FACTORS AFFECTING SOIL RESISTIVITY .............................................................................. 19
2.7. RESILIENT MODULUS OF BALLAST ...................................................................................... 21
2.8. CALIFORNIA BEARING RATIO (CBR) OF BALLAST................................................................ 22
v
2.9. SHEAR STRENGTH PROPERTIES OF BALLAST ........................................................................ 23
CHAPTER THREE: DETERMINATION OF MATERIAL PROPERTIES .................... 25
3.1. ENGINEERING PROPERTIES OF CLEAN BALLAST ................................................................... 25
3.1.1. General Information about Ballast ............................................................................... 25
3.1.2. Gradation of Clean Ballast .......................................................................................... 27
3.1.3. Other Engineering Properties....................................................................................... 28
3.2. ENGINEERING PROPERTIES OF SUBGRADE SOIL.................................................................... 30
3.2.1. General Information about Subgrade Soil ..................................................................... 30
3.2.2. Gradation of Subgrade Soil ......................................................................................... 31
3.2.3. Other Engineering Properties of Subgrade Soil ............................................................. 32
3.3. ENGINEERING PROPERTIES OF COAL DUST........................................................................... 32
3.3.1. General Information about Coal Dust ........................................................................... 32
3.3.2. Gradation of Coal Dust ............................................................................................... 34
3.3.3. Other Engineering Properties of Coal Dust ................................................................... 35
3.4. ENGINEERING PROPERTIES OF GARDNER TRACK BALLAST DUST .......................................... 36
3.4.1. General Information about Gardner Track Ballast Dust ................................................. 36
3.4.2. Gradation of Gardner Track Ballast Dust...................................................................... 37
3.4.3. Other Engineering Properties of Gardner Track Ballast Dust ......................................... 38
3.5. COMPARISON OF BASIC ENGINEERING PROPERTIES OF FOULING AGENTS .............................. 39
3.6. ELECTRICAL RESISTIVITY OF FOULING AGENTS ................................................................... 41
3.6.1. Small Box Resistivity Test of Fouling Materials ........................................................... 41
3.6.2. Sample Preparation and Testing................................................................................... 43
3.6.3. Resistivity Test Results ............................................................................................... 44
3.7. ENGINEERING PROPERTIES OF FIELD BALLAST .................................................................... 44
3.7.1. General ...................................................................................................................... 44
vi
3.7.2. Gradation of the Ballast and Fouling Index................................................................... 45
3.7.3. Field Moisture Content ............................................................................................... 47
3.8. QUANTIFICATION OF FOULED BALLAST............................................................................... 47
CHAPTER FOUR: TEST SETUP AND DATA COLLECTION ....................................... 49
4.1. LAB TEST SET UP FOR MOISTURE VARIATION SAMPLE ......................................................... 49
4.1.1 Sample Descriptions ................................................................................................... 49
4.1.2 Calculation of Fouling Index of ballast samples ............................................................ 50
4.1.3 Mixing Procedure ....................................................................................................... 51
4.1.4 Box Filling Procedure and Compaction ........................................................................ 52
4.1.5 Bulk Density Calculation ............................................................................................ 53
4.1.6 Tests Sequence and Tests Location .............................................................................. 53
4.2. HORIZONTAL PROBE RESISTANCE MEASUREMENT............................................................... 55
4.2.1 Construction of Horizontal Probe................................................................................. 55
4.2.2 AEMC Ground Resistance Tester ................................................................................ 56
4.2.3 Horizontally Aligned Probe Resistance Measurement by Wenner Four Point Method ..... 57
4.2.4 Horizontally aligned Probe Resistance Measurement by Single Electrode Method .......... 57
4.3. VERTICAL PROBE RESISTANCE MEASUREMENT ................................................................... 58
4.3.1 Construction of Vertical Probe .................................................................................... 58
4.3.2 Vertical Probe Resistance Measurement by Three Point Method .................................... 62
4.4. RESILIENT MODULUS MEASUREMENT BY LWD ................................................................... 63
4.4.1 Light Weight Deflectometer ........................................................................................ 63
4.4.2 Modulus Measurement by LWD Method...................................................................... 65
4.5. CALIFORNIA BEARING RATIO (CBR) MEASUREMENT BY DCP .............................................. 65
4.5.1 Dynamic Cone Penetrometer ....................................................................................... 65
4.5.2 California Bearing Ratio (CBR) Estimation by DCP ..................................................... 65
vii
4.6. STIFFNESS MODULUS DETERMINATION BY STATIC PLATE LOADING TEST ............................. 67
4.6.1 Static Plate Loading Test............................................................................................. 67
4.6.2 Plate Loading Test Procedure ...................................................................................... 68
4.7. CBR CALCULATION BY VERTICAL PROBE AFTER CORRELATION WITH DCP .......................... 69
4.8. MOISTURE CONTENT AND DRY DENSITY OF THE MIX .......................................................... 70
4.9. OPTIMUM MOISTURE CONTENT FOR FOULED SAMPLES ........................................................ 70
4.10. FIELD TEST PROCEDURE ................................................................................................. 71
4.10.1 General Comments about Field Testing ........................................................................ 71
4.10.2 Resistance Measurement by Ground Tester .................................................................. 73
4.10.3 Dynamic Cone Penetration Test................................................................................... 73
4.10.4 Light Weight Deflectometer Test ................................................................................. 74
CHAPTER FIVE: RESULTS AND DISCUSSION .............................................................. 75
5.1. ASSUMPTIONS OF ANALYSIS ............................................................................................... 75
5.2. TEST RESULTS OF CLEAN BALLAST..................................................................................... 75
5.2.1. Moist and Dry Density ................................................................................................ 75
5.2.2. Resistivity of Clean Ballast ......................................................................................... 76
5.2.3. CBR, Static Modulus, and Resilient Modulus of Clean Ballast....................................... 76
5.2.4. Discussion of Test Results of Clean Ballast .................................................................. 77
5.3. DRY DENSITY OF FOULED BALLAST.................................................................................... 77
5.3.1. Test Result of Dry Densities of Fouled Ballast.............................................................. 77
5.3.2. Discussion of Test Results of Dry Densities of Fouled Samples ..................................... 80
5.4. BOUNDARY EFFECT OF RESISTIVITY TEST ON TEST BOX ...................................................... 81
5.4.1. Test Result of Boundary Effect of Resistivity on Test Box ............................................ 81
5.4.2. Discussion on Boundary Effect of Resistivity on Test Box ............................................ 87
5.5. RESULT OF RESISTIVITY TESTING BY THE WENNER FOUR POINT METHOD ............................ 88
viii
5.5.1. Resistivity Test Result - Subgrade Soil Fouled Ballast .................................................. 88
5.5.2. Resistivity Test Results – Gardner Track Ballast Dust Fouled Ballast............................. 90
5.5.3. Resistivity Test Result – Coal Dust Fouled Ballast........................................................ 92
5.5.4. Validity of Resistivity Data from 2 Point Method for Horizontal Probe .......................... 94
5.5.5. Comparison of Resistivity for Fouled Ballast with Different Fouling Agents .................. 96
5.5.6. Discussion of Resistivity by Wenner 4 Point Method of Fouled Ballast .......................... 98
5.6. VALIDITY OF VERTICAL RESISTIVITY TESTER BY FALL OF POTENTIAL METHOD .................. 100
5.6.1. Validity of Vertical Probe for Subgrade Material in Open Space .................................. 100
5.6.2. Validity of Vertical Probe on Test Sample of Fouled Ballast ....................................... 102
5.6.3. Discussion of Validity of Vertical Resistivity Tester ................................................... 107
5.7. VARIATION OF CBR OF BALLAST DUE TO CHANGE IN MOISTURE CONTENT ........................ 107
5.7.1. CBR for Different Percentages of Fouling for Various Fouling Agents......................... 107
5.7.2. CBR Comparison of Different Fouling Agents for the Same Percentage of Fouling ...... 110
5.7.3. Discussion of CBR of Fouled Ballast ......................................................................... 113
5.8. RESILIENT MODULUS OF FOULED BALLAST DUE TO VARIATIONS OF MOISTURE .................. 113
5.8.1. Resilient Modulus for Different Percentages of Fouling for Various Fouling Agents ..... 113
5.8.2. Resilient Modulus Comparison of Various Fouled Ballasts.......................................... 116
5.8.3. Discussion of Resilient Modulus versus Moisture Content........................................... 118
5.9. STATIC MODULUS OF FOULED BALLAST RELATIONSHIP WITH MOISTURE CONTENT ............ 119
5.9.1. Variation of Static Modulus with Moisture Content for Subgrade Soil.......................... 119
5.9.2. Variation of Static Modulus with Moisture Content for Gardner Track Ballast Dust ...... 123
5.9.3. Variation of Static Modulus with Moisture Content for Coal Dust................................ 127
5.9.4. Comparison of Static Modulus for Different Fouling Agents ....................................... 131
5.9.5. Discussion of Static Modulus of Fouled Ballast .......................................................... 134
5.10. CORRELATION OF STRENGTH PROPERTIES OF FOULED BALLAST ..................................... 134
5.10.1. Correlation of Resilient Modulus and Static Modulus of Fouled Ballast ....................... 134
ix
5.10.2. Correlation of Resilient Modulus and CBR for Fouled Ballast ..................................... 135
5.10.3. Correlation of Static Modulus and CBR of Fouled Ballast ........................................... 136
5.10.4. Discussion of Correlation of Strength Properties ......................................................... 137
5.11. RESULT OF PROCTOR TEST............................................................................................ 137
5.12. FIELD TEST RESULTS .................................................................................................... 140
5.11.1. Resistivity Test Results ............................................................................................. 140
5.11.2. Test Results of DCP.................................................................................................. 141
5.11.3. Test Result of LWD .................................................................................................. 144
5.11.4. Discussion of Field Test ............................................................................................ 144
CHAPTER SIX: CONCLUSIONS AND RECOMMENDATIONS ................................. 146
6.1 INTRODUCTION ................................................................................................................ 146
6.2 DRY DENSITY TEST OF FOULED BALLAST ......................................................................... 146
6.3 RESISTIVITY ANALYSIS .................................................................................................... 147
6.3.1. Horizontal Probe Resistivity ...................................................................................... 147
6.3.2. Vertical Probe Resistivity.......................................................................................... 149
6.4 CBR TEST ....................................................................................................................... 149
6.5 RESILIENT MODULUS ....................................................................................................... 150
6.6 STATIC MODULUS ............................................................................................................ 151
6.7 CORRELATION OF CBR, STATIC MODULUS, AND RESILIENT MODULUS ............................... 151
6.8 FIELD TEST ...................................................................................................................... 152
6.9 RECOMMENDATIONS ........................................................................................................ 152
BIBLIOGRAPHY ..................................................................................................................... 154
x
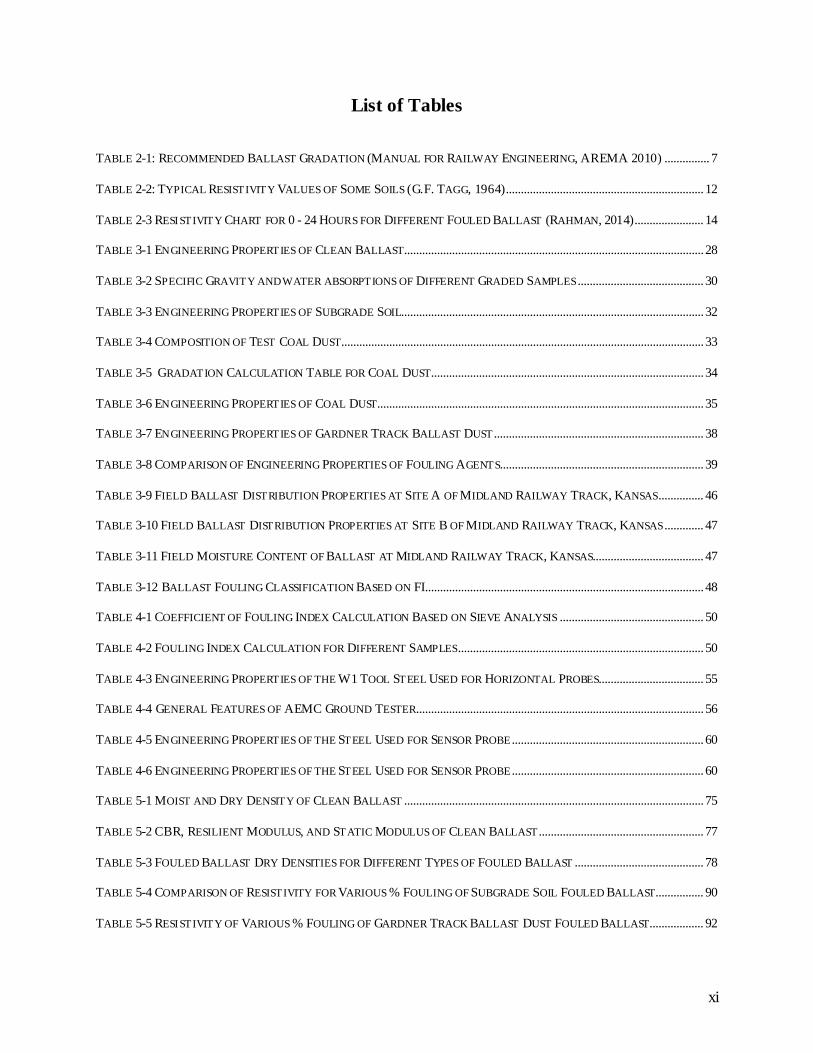
List of Tables
TABLE 2-1: RECOMMENDED BALLAST GRADATION (MANUAL FOR RAILWAY ENGINEERING, AREMA 2010) ............... 7
TABLE 2-2: TYPICAL RESISTIVITY VALUES OF SOME SOILS (G.F. TAGG, 1964).................................................................. 12
TABLE 2-3 RESISTIVITY CHART FOR 0 - 24 HOURS FOR DIFFERENT FOULED BALLAST (RAHMAN, 2014)....................... 14
TABLE 3-1 ENGINEERING PROPERTIES OF CLEAN BALLAST.................................................................................................... 28
TABLE 3-2 SPECIFIC GRAVITY AND WATER ABSORPTIONS OF DIFFERENT GRADED SAMPLES .......................................... 30
TABLE 3-3 ENGINEERING PROPERTIES OF SUBGRADE SOIL..................................................................................................... 32
TABLE 3-4 COMPOSITION OF TEST COAL DUST......................................................................................................................... 33
TABLE 3-5 GRADATION CALCULATION TABLE FOR COAL DUST........................................................................................... 34
TABLE 3-6 ENGINEERING PROPERTIES OF COAL DUST............................................................................................................. 35
TABLE 3-7 ENGINEERING PROPERTIES OF GARDNER TRACK BALLAST DUST ...................................................................... 38
TABLE 3-8 COMPARISON OF ENGINEERING PROPERTIES OF FOULING AGENTS.................................................................... 39
TABLE 3-9 FIELD BALLAST DISTRIBUTION PROPERTIES AT SITE A OF MIDLAND RAILWAY TRACK, KANSAS ............... 46
TABLE 3-10 FIELD BALLAST DISTRIBUTION PROPERTIES AT SITE B OF MIDLAND RAILWAY TRACK, KANSAS ............. 47
TABLE 3-11 FIELD MOISTURE CONTENT OF BALLAST AT MIDLAND RAILWAY TRACK, KANSAS..................................... 47
TABLE 3-12 BALLAST FOULING CLASSIFICATION BASED ON FI............................................................................................. 48
TABLE 4-1 COEFFICIENT OF FOULING INDEX CALCULATION BASED ON SIEVE ANALYSIS ................................................ 50
TABLE 4-2 FOULING INDEX CALCULATION FOR DIFFERENT SAMPLES .................................................................................. 50
TABLE 4-3 ENGINEERING PROPERTIES OF THE W1 TOOL STEEL USED FOR HORIZONTAL PROBES................................... 55
TABLE 4-4 GENERAL FEATURES OF AEMC GROUND TESTER ................................................................................................ 56
TABLE 4-5 ENGINEERING PROPERTIES OF THE STEEL USED FOR SENSOR PROBE ................................................................ 60
TABLE 4-6 ENGINEERING PROPERTIES OF THE STEEL USED FOR SENSOR PROBE ................................................................ 60
TABLE 5-1 MOIST AND DRY DENSITY OF CLEAN BALLAST .................................................................................................... 75
TABLE 5-2 CBR, RESILIENT MODULUS, AND STATIC MODULUS OF CLEAN BALLAST ....................................................... 77
TABLE 5-3 FOULED BALLAST DRY DENSITIES FOR DIFFERENT TYPES OF FOULED BALLAST ........................................... 78
TABLE 5-4 COMPARISON OF RESISTIVITY FOR VARIOUS % FOULING OF SUBGRADE SOIL FOULED BALLAST................ 90
TABLE 5-5 RESISTIVITY OF VARIOUS % FOULING OF GARDNER TRACK BALLAST DUST FOULED BALLAST.................. 92
xi
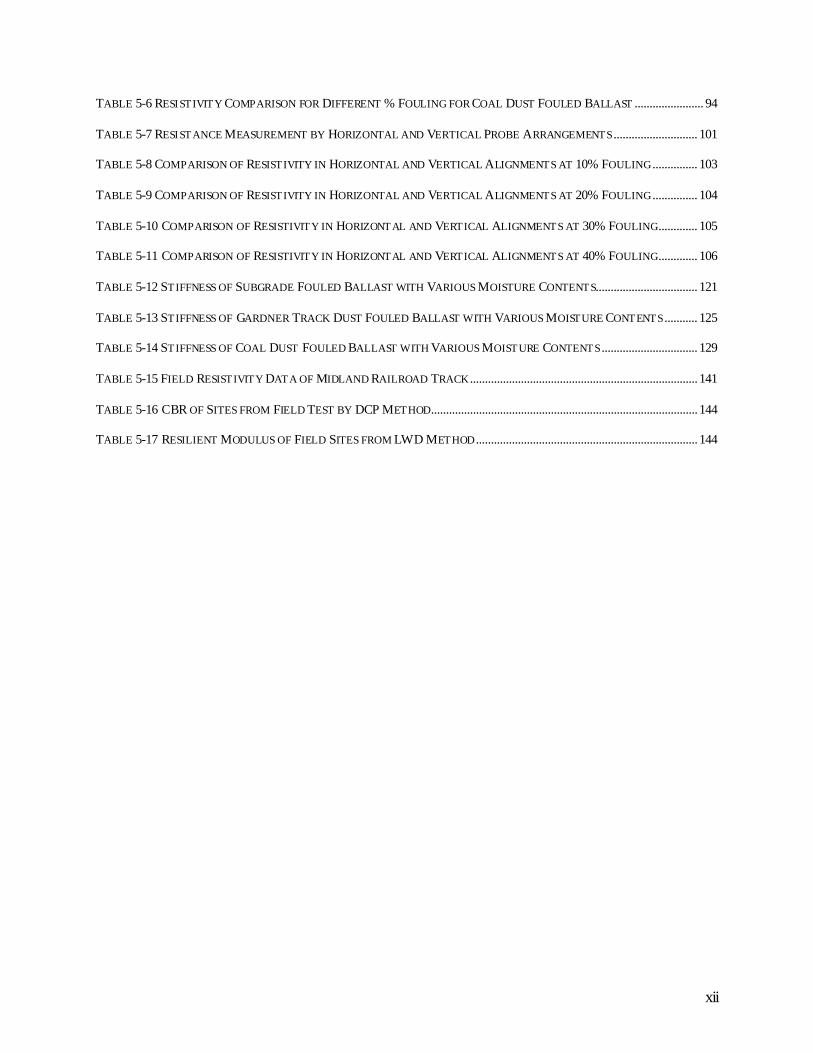
TABLE 5-6 RESISTIVITY COMPARISON FOR DIFFERENT % FOULING FOR COAL DUST FOULED BALLAST ....................... 94
TABLE 5-7 RESISTANCE MEASUREMENT BY HORIZONTAL AND VERTICAL PROBE ARRANGEMENTS ............................ 101
TABLE 5-8 COMPARISON OF RESISTIVITY IN HORIZONTAL AND VERTICAL ALIGNMENTS AT 10% FOULING ............... 103
TABLE 5-9 COMPARISON OF RESISTIVITY IN HORIZONTAL AND VERTICAL ALIGNMENTS AT 20% FOULING ............... 104
TABLE 5-10 COMPARISON OF RESISTIVITY IN HORIZONTAL AND VERTICAL ALIGNMENTS AT 30% FOULING ............. 105
TABLE 5-11 COMPARISON OF RESISTIVITY IN HORIZONTAL AND VERTICAL ALIGNMENTS AT 40% FOULING ............. 106
TABLE 5-12 STIFFNESS OF SUBGRADE FOULED BALLAST WITH VARIOUS MOISTURE CONTENTS .................................. 121
TABLE 5-13 STIFFNESS OF GARDNER TRACK DUST FOULED BALLAST WITH VARIOUS MOISTURE CONTENTS ........... 125
TABLE 5-14 STIFFNESS OF COAL DUST FOULED BALLAST WITH VARIOUS MOISTURE CONTENTS ................................ 129
TABLE 5-15 FIELD RESISTIVITY DATA OF MIDLAND RAILROAD TRACK ............................................................................ 141
TABLE 5-16 CBR OF SITES FROM FIELD TEST BY DCP METHOD ......................................................................................... 144
TABLE 5-17 RESILIENT MODULUS OF FIELD SITES FROM LWD METHOD .......................................................................... 144
xii
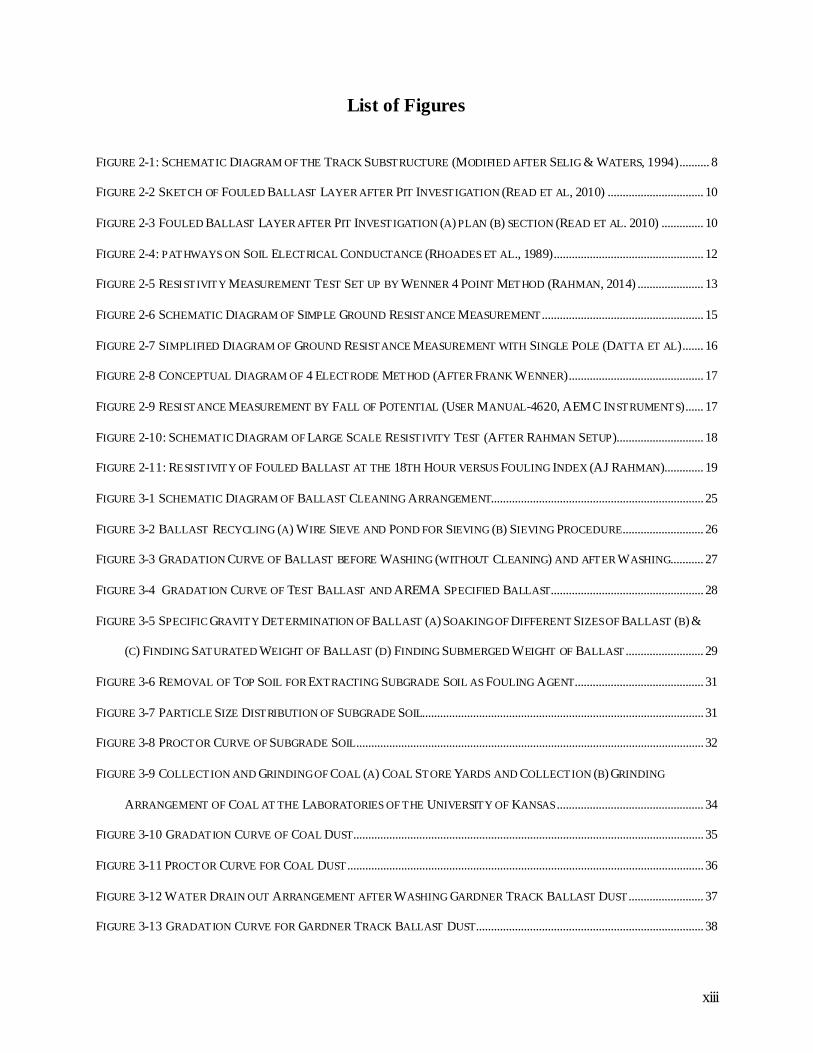
List of Figures
FIGURE 2-1: SCHEMATIC DIAGRAM OF THE TRACK SUBSTRUCTURE (MODIFIED AFTER SELIG & WATERS, 1994).......... 8
FIGURE 2-2 SKETCH OF FOULED BALLAST LAYER AFTER PIT INVESTIGATION (READ ET AL, 2010) ................................ 10
FIGURE 2-3 FOULED BALLAST LAYER AFTER PIT INVESTIGATION (A) PLAN (B) SECTION (READ ET AL. 2010) .............. 10
FIGURE 2-4: PATHWAYS ON SOIL ELECTRICAL CONDUCTANCE (RHOADES ET AL., 1989).................................................. 12
FIGURE 2-5 RESISTIVITY MEASUREMENT TEST SET UP BY WENNER 4 POINT METHOD (RAHMAN, 2014) ...................... 13
FIGURE 2-6 SCHEMATIC DIAGRAM OF SIMPLE GROUND RESISTANCE MEASUREMENT ...................................................... 15
FIGURE 2-7 SIMPLIFIED DIAGRAM OF GROUND RESISTANCE MEASUREMENT WITH SINGLE POLE (DATTA ET AL) ....... 16
FIGURE 2-8 CONCEPTUAL DIAGRAM OF 4 ELECTRODE METHOD (AFTER FRANK WENNER) ............................................. 17
FIGURE 2-9 RESISTANCE MEASUREMENT BY FALL OF POTENTIAL (USER MANUAL-4620, AEMC INSTRUMENTS) ...... 17
FIGURE 2-10: SCHEMATIC DIAGRAM OF LARGE SCALE RESISTIVITY TEST (AFTER RAHMAN SETUP) ............................. 18
FIGURE 2-11: RESISTIVITY OF FOULED BALLAST AT THE 18TH HOUR VERSUS FOULING INDEX (AJ RAHMAN)............. 19
FIGURE 3-1 SCHEMATIC DIAGRAM OF BALLAST CLEANING ARRANGEMENT....................................................................... 25
FIGURE 3-2 BALLAST RECYCLING (A) WIRE SIEVE AND POND FOR SIEVING (B) SIEVING PROCEDURE ........................... 26
FIGURE 3-3 GRADATION CURVE OF BALLAST BEFORE WASHING (WITHOUT CLEANING) AND AFTER WASHING ........... 27
FIGURE 3-4 GRADATION CURVE OF TEST BALLAST AND AREMA SPECIFIED BALLAST................................................... 28
FIGURE 3-5 SPECIFIC GRAVITY DETERMINATION OF BALLAST (A) SOAKING OF DIFFERENT SIZES OF BALLAST (B) &
(C) FINDING SATURATED WEIGHT OF BALLAST (D) FINDING SUBMERGED WEIGHT OF BALLAST .......................... 29
FIGURE 3-6 REMOVAL OF TOP SOIL FOR EXTRACTING SUBGRADE SOIL AS FOULING AGENT........................................... 31
FIGURE 3-7 PARTICLE SIZE DISTRIBUTION OF SUBGRADE SOIL.............................................................................................. 31
FIGURE 3-8 PROCTOR CURVE OF SUBGRADE SOIL .................................................................................................................... 32
FIGURE 3-9 COLLECTION AND GRINDING OF COAL (A) COAL STORE YARDS AND COLLECTION (B) GRINDING
ARRANGEMENT OF COAL AT THE LABORATORIES OF THE UNIVERSITY OF KANSAS ................................................. 34
FIGURE 3-10 GRADATION CURVE OF COAL DUST..................................................................................................................... 35
FIGURE 3-11 PROCTOR CURVE FOR COAL DUST ....................................................................................................................... 36
FIGURE 3-12 WATER DRAIN OUT ARRANGEMENT AFTER WASHING GARDNER TRACK BALLAST DUST ......................... 37
FIGURE 3-13 GRADATION CURVE FOR GARDNER TRACK BALLAST DUST............................................................................ 38
xiii
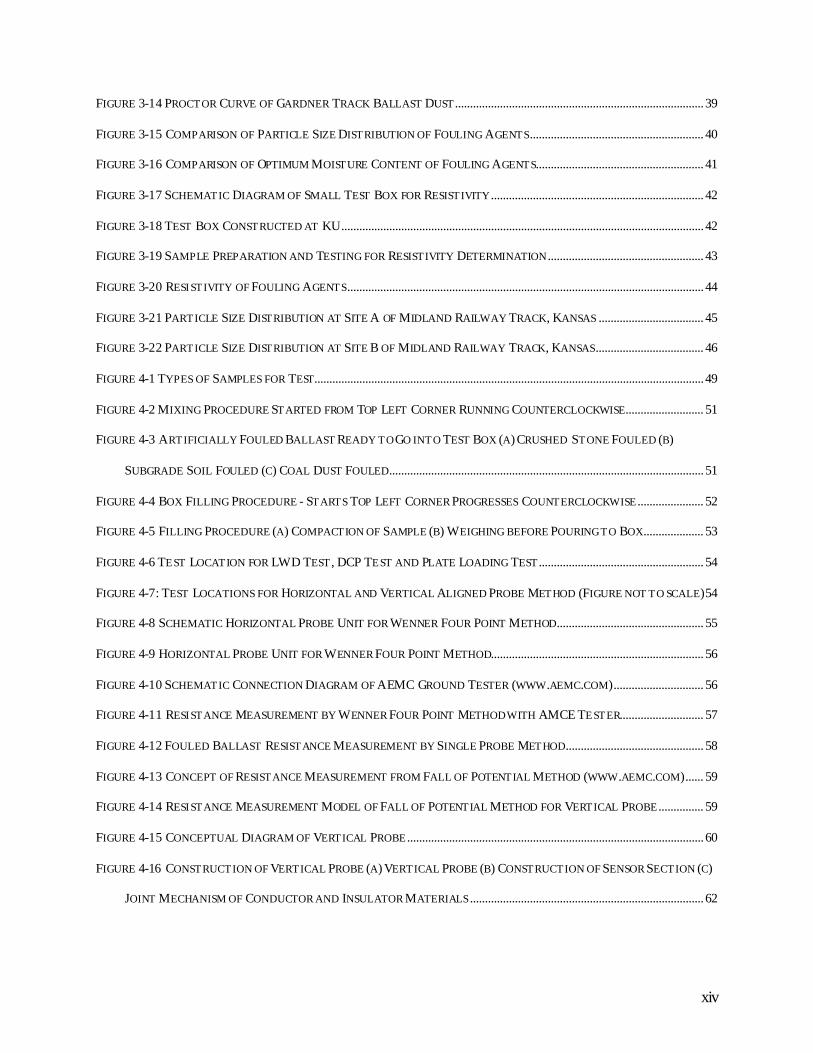
FIGURE 3-14 PROCTOR CURVE OF GARDNER TRACK BALLAST DUST ................................................................................... 39
FIGURE 3-15 COMPARISON OF PARTICLE SIZE DISTRIBUTION OF FOULING AGENTS .......................................................... 40
FIGURE 3-16 COMPARISON OF OPTIMUM MOISTURE CONTENT OF FOULING AGENTS........................................................ 41
FIGURE 3-17 SCHEMATIC DIAGRAM OF SMALL TEST BOX FOR RESISTIVITY ....................................................................... 42
FIGURE 3-18 TEST BOX CONSTRUCTED AT KU ......................................................................................................................... 42
FIGURE 3-19 SAMPLE PREPARATION AND TESTING FOR RESISTIVITY DETERMINATION .................................................... 43
FIGURE 3-20 RESISTIVITY OF FOULING AGENTS ....................................................................................................................... 44
FIGURE 3-21 PARTICLE SIZE DISTRIBUTION AT SITE A OF MIDLAND RAILWAY TRACK, KANSAS ................................... 45
FIGURE 3-22 PARTICLE SIZE DISTRIBUTION AT SITE B OF MIDLAND RAILWAY TRACK, KANSAS.................................... 46
FIGURE 4-1 TYPES OF SAMPLES FOR TEST.................................................................................................................................. 49
FIGURE 4-2 MIXING PROCEDURE STARTED FROM TOP LEFT CORNER RUNNING COUNTERCLOCKWISE.......................... 51
FIGURE 4-3 ARTIFICIALLY FOULED BALLAST READY TO GO INTO TEST BOX (A) CRUSHED STONE FOULED (B)
SUBGRADE SOIL FOULED (C) COAL DUST FOULED ......................................................................................................... 51
FIGURE 4-4 BOX FILLING PROCEDURE - STARTS TOP LEFT CORNER PROGRESSES COUNTERCLOCKWISE ...................... 52
FIGURE 4-5 FILLING PROCEDURE (A) COMPACTION OF SAMPLE (B) WEIGHING BEFORE POURING TO BOX .................... 53
FIGURE 4-6 TEST LOCATION FOR LWD TEST, DCP TEST AND PLATE LOADING TEST ....................................................... 54
FIGURE 4-7: TEST LOCATIONS FOR HORIZONTAL AND VERTICAL ALIGNED PROBE METHOD (FIGURE NOT TO SCALE) 54
FIGURE 4-8 SCHEMATIC HORIZONTAL PROBE UNIT FOR WENNER FOUR POINT METHOD ................................................. 55
FIGURE 4-9 HORIZONTAL PROBE UNIT FOR WENNER FOUR POINT METHOD....................................................................... 56
FIGURE 4-10 SCHEMATIC CONNECTION DIAGRAM OF AEMC GROUND TESTER (WWW.AEMC.COM) .............................. 56
FIGURE 4-11 RESISTANCE MEASUREMENT BY WENNER FOUR POINT METHOD WITH AMCE TESTER............................ 57
FIGURE 4-12 FOULED BALLAST RESISTANCE MEASUREMENT BY SINGLE PROBE METHOD .............................................. 58
FIGURE 4-13 CONCEPT OF RESISTANCE MEASUREMENT FROM FALL OF POTENTIAL METHOD (WWW.AEMC.COM) ...... 59
FIGURE 4-14 RESISTANCE MEASUREMENT MODEL OF FALL OF POTENTIAL METHOD FOR VERTICAL PROBE ............... 59
FIGURE 4-15 CONCEPTUAL DIAGRAM OF VERTICAL PROBE ................................................................................................... 60
FIGURE 4-16 CONSTRUCTION OF VERTICAL PROBE (A) VERTICAL PROBE (B) CONSTRUCTION OF SENSOR SECTION (C)
JOINT MECHANISM OF CONDUCTOR AND INSULATOR MATERIALS .............................................................................. 62
xiv
FIGURE 4-17 (A) SCHEMATIC DIAGRAM OF ZORN 3000 LWD (B) ACTUAL PHOTO OF ZORN 3000 LWD USED IN LAB
(WWW.ZORN-INSTRUMENTS.COM)...................................................................................................................................... 63
FIGURE 4-18 SCHEMATIC DIAGRAM OF DCP ............................................................................................................................. 66
FIGURE 4-19 PLATE LOADING TEST SET UP ............................................................................................................................... 68
FIGURE 4-20 LAYER DEPTH OF VERTICAL PROBE FOR CALIBRATION WITH DCP (SECTION MM IN FIGURE 4.7) .......... 69
FIGURE 4-21 PROCTOR TEST PROCEDURE AT LAB .................................................................................................................... 71
FIGURE 4-22 LOCATION MAP OF THE TEST SITES (WWW.MAPS.GOOGLE.COM).................................................................... 72
FIGURE 4-23 TESTS LOCATION AT FIELD TEST (NOT TO SCALE)............................................................................................. 72
FIGURE 4-24 FIELD PROCEDURE OF RESISTIVITY MEASUREMENT AT SITE B (PARALLEL TO TRACK) ............................. 73
FIGURE 5-1 UNIT LOAD VERSUS DEFLECTION CURVE BY STATIC PLATE LOADING TEST OF CLEAN BALLAST.............. 76
FIGURE 5-2 DRY DENSITY VERSUS PERCENTAGE FOULING FOR DIFFERENT TYPES OF FOULED BALLAST ..................... 79
FIGURE 5-3 DRY DENSITY DETERMINATION FROM SMALL BOX TEST .................................................................................. 80
FIGURE 5-4 BOUNDARY EFFECT STUDY FOR RESISTIVITY - 10% FOULED WITH SUBGRADE SOIL.................................... 82
FIGURE 5-5 BOUNDARY EFFECT STUDY FOR RESISTIVITY - 20% FOULED WITH SUBGRADE SOIL.................................... 83
FIGURE 5-6 BOUNDARY EFFECT STUDY FOR RESISTIVITY – 30% FOULED WITH SUBGRADE SOIL ................................... 83
FIGURE 5-7 BOUNDARY EFFECT STUDY FOR RESISTIVITY – 40% FOULED WITH SUBGRADE SOIL ................................... 84
FIGURE 5-8 BOUNDARY EFFECT STUDY FOR RESISTIVITY - 10% FOULED WITH TRACK DUST ........................................ 84
FIGURE 5-9 BOUNDARY EFFECT STUDY FOR RESISTIVITY - 20% FOULED WITH TRACK DUST ......................................... 85
FIGURE 5-10 BOUNDARY EFFECT STUDY FOR RESISTIVITY - 30% FOULED WITH TRACK DUST ....................................... 85
FIGURE 5-11 BOUNDARY EFFECT STUDY FOR RESISTIVITY - 40% FOULED WITH TRACK DUST ....................................... 86
FIGURE 5-12 BOUNDARY EFFECT STUDY FOR RESISTIVITY - 10% FOULED WITH COAL DUST ......................................... 86
FIGURE 5-13 BOUNDARY EFFECT STUDY FOR RESISTIVITY - 20% FOULED WITH COAL DUST ......................................... 87
FIGURE 5-14 BOUNDARY EFFECT STUDY FOR RESISTIVITY - 30% FOULED WITH COAL DUST ......................................... 87
FIGURE 5-15 RESISTIVITY OF SUBGRADE SOIL FOULED BALLAST FOR DIFFERENT MOISTURE CONTENTS..................... 89
FIGURE 5-16 RESISTIVITY OF SUBGRADE SOIL FOULED BALLAST FOR VARIOUS MC (ZOOM IN VIEW) ......................... 89
FIGURE 5-17 RESISTIVITY OF GARDNER TRACK DUST FOULED BALLAST FOR DIFFERENT MOISTURE CONTENTS ....... 91
FIGURE 5-18 RESISTIVITY OF GARDNER TRACK DUST FOULED BALLAST FOR VARIOUS MC (ZOOM IN VIEW) ............ 91
FIGURE 5-19 RESISTIVITY OF COAL DUST FOULED BALLAST FOR DIFFERENT MOISTURE CONTENTS............................. 93
xv
FIGURE 5-20 RESISTIVITY OF COAL DUST FOULED BALLAST FOR VARIOUS MC (ZOOM IN VIEW) ................................. 93
FIGURE 5-21 RESISTIVITY BY 2 & 4 POINT METHODS FOR SUBGRADE SOIL FOULED BALLAST........................................ 95
FIGURE 5-22 RESISTIVITY BY 2 POINT & WENNER METHODS OF GARDNER TRACK DUST FOULED BALLAST ............... 95
FIGURE 5-23 RESISTIVITY BY 2 POINT & 4 POINT METHODS FOR COAL DUST FOULED BALLAST.................................... 96
FIGURE 5-24 COMPARISON OF RESISTIVITY FOR DIFFERENT FOULED BALLAST AT 10% FOULING BY WEIGHT ............ 96
FIGURE 5-25 COMPARISON OF RESISTIVITY FOR DIFFERENT FOULED BALLAST AT 20% FOULING BY WEIGHT ............ 97
FIGURE 5-26 COMPARISON OF RESISTIVITY FOR DIFFERENT FOULED BALLAST AT 30% FOULING BY WEIGHT ............ 97
FIGURE 5-27 COMPARISON OF RESISTIVITY FOR DIFFERENT FOULED BALLAST AT 40% FOULING BY WEIGHT ............ 98
FIGURE 5-28 SKETCH OF VERTICAL PROBE RESISTANCE CHECK BY FALL OF POTENTIAL METHOD.............................. 100
FIGURE 5-29 FIELD SETUP OF HORIZONTAL VERSUS VERTICAL RESISTANCE MEASUREMENT ....................................... 101
FIGURE 5-30 RESISTANCE VS DEPTH ON SUBGRADE SOIL BY VERTICAL AND HORIZONTAL PROBES ............................ 102
FIGURE 5-31 COMPARISON OF RESISTIVITY USING HORIZONTAL AND VERTICAL ALIGNMENTS AT 10% FOULING..... 103
FIGURE 5-32 COMPARISON OF RESISTIVITY USING HORIZONTAL AND VERTICAL ALIGNMENTS AT 20% FOULING..... 104
FIGURE 5-33 COMPARISON OF RESISTIVITY USING HORIZONTAL AND VERTICAL ALIGNMENTS AT 30% FOULING..... 105
FIGURE 5-34 COMPARISON OF RESISTIVITY BY HORIZONTAL AND VERTICAL ALIGNMENTS AT 40% FOULING........... 106
FIGURE 5-35 MOISTURE CONTENT VERSUS CBR FOR SUBGRADE SOIL FOULED BALLAST ............................................. 108
FIGURE 5-36 MOISTURE CONTENT VERSUS CBR FOR GARDNER TRACK DUST FOULED BALLAST ................................ 109
FIGURE 5-37 MOISTURE CONTENT VERSUS CBR FOR COAL DUST FOULED BALLAST ..................................................... 110
FIGURE 5-38 MOISTURE CONTENT VERSUS CBR AT 10% FOULING WITH DIFFERENT FOULING AGENTS ..................... 111
FIGURE 5-39 MOISTURE CONTENT VERSUS CBR AT 20% FOULING WITH DIFFERENT FOULING AGENTS ..................... 112
FIGURE 5-40 MOISTURE CONTENT VERSUS CBR AT 30% FOULING WITH DIFFERENT FOULING AGENTS ..................... 112
FIGURE 5-41 MOISTURE CONTENT VERSUS CBR AT 40% FOULING WITH DIFFERENT FOULING AGENTS ..................... 113
FIGURE 5-42 RESILIENT MODULUS VS MC FOR SUBGRADE SOIL FOULED BALLAST........................................................ 114
FIGURE 5-43 RESILIENT MODULUS VS MC FOR GARDNER TRACK DUST FOULED BALLAST........................................... 115
FIGURE 5-44 RESILIENT MODULUS VS MC FOR COAL DUST FOULED BALLAST................................................................ 115
FIGURE 5-45 RESILIENT MODULUS VS MC FOR 10% FOULING FOR FOULED BALLAST WITH DIFFERENT AGENTS ..... 116
FIGURE 5-46 RESILIENT MODULUS VS MC FOR 20% FOULING FOR FOULED BALLAST WITH DIFFERENT AGENTS ..... 117
FIGURE 5-47 RESILIENT MODULUS VS MC FOR 30% FOULING FOR FOULED BALLAST WITH DIFFERENT AGENTS ..... 117
xvi
FIGURE 5-48 RESILIENT MODULUS VS MC FOR 40% FOULING FOR FOULED BALLAST WITH DIFFERENT AGENTS ..... 118
FIGURE 5-49 UNIT LOAD VERSUS DEFLECTION CURVE OF 10% FOULED BY SUBGRADE SOIL AT VARIOUS MC ......... 119
FIGURE 5-50 UNIT LOAD VERSUS DEFLECTION CURVE OF 20% FOULED BY SUBGRADE SOIL AT VARIOUS MC ......... 120
FIGURE 5-51 UNIT LOAD VERSUS DEFLECTION CURVE OF 30% FOULED BY SUBGRADE SOIL AT VARIOUS MC ......... 120
FIGURE 5-52 UNIT LOAD VERSUS DEFLECTION CURVE OF 40% FOULED BY SUBGRADE SOIL AT VARIOUS MC ......... 121
FIGURE 5-53 STIFFNESS OF SUBGRADE FOULED BALLAST WITH VARIOUS MOISTURE CONTENTS................................. 122
FIGURE 5-54 STATIC MODULUS OF SUBGRADE FOULED BALLAST WITH VARIOUS MOISTURE CONTENTS ................... 122
FIGURE 5-55 UNIT LOAD VERSUS DEFLECTION CURVE OF 10% FOULED BY GARDNER TRACK DUST........................... 123
FIGURE 5-56 UNIT LOAD VERSUS DEFLECTION CURVE OF 20% FOULED BY GARDNER TRACK DUST........................... 124
FIGURE 5-57 LOAD VERSUS DEFLECTION CURVE OF 30% FOULED BY GARDNER TRACK DUST..................................... 124
FIGURE 5-58 UNIT LOAD VERSUS DEFLECTION CURVE OF 40% FOULED BY GARDNER TRACK DUST........................... 125
FIGURE 5-59 STIFFNESS OF GARDNER TRACK DUST FOULED BALLAST WITH VARIOUS MOISTURE CONTENTS .......... 126
FIGURE 5-60 STATIC MODULUS OF GARDNER TRACK BALLAST DUST FOULED BALLAST .............................................. 126
FIGURE 5-61 UNIT LOAD VERSUS DEFLECTION CURVE OF 10% FOULED BALLAST BY COAL DUST .............................. 128
FIGURE 5-62 UNIT LOAD VERSUS DEFLECTION CURVE OF 20% FOULED BALLAST BY COAL DUST .............................. 128
FIGURE 5-63 UNIT LOAD VERSUS DEFLECTION CURVE OF 30% FOULED BALLAST BY COAL DUST .............................. 129
FIGURE 5-64 STIFFNESS OF COAL DUST FOULED BALLAST WITH VARIOUS MOISTURE CONTENTS ............................... 130
FIGURE 5-65 STATIC MODULUS OF COAL DUST FOULED BALLAST WITH VARIOUS MOISTURE CONTENTS ................. 131
FIGURE 5-66 COMPARISON OF STATIC MODULUS VERSUS MC AT 10% FOULING ............................................................. 132
FIGURE 5-67 COMPARISON OF STATIC MODULUS VERSUS MC AT 20% FOULING ............................................................. 132
FIGURE 5-68 COMPARISON OF STATIC MODULUS VERSUS MC AT 30% FOULING ............................................................. 133
FIGURE 5-69 COMPARISON OF STATIC MODULUS VERSUS MC AT 40% FOULING ............................................................. 133
FIGURE 5-70 CORRELATION OF RESILIENT MODULUS AND STATIC MODULUS OF FOULED BALLAST ........................... 135
FIGURE 5-71 CORRELATION OF RESILIENT MODULUS AND CBR OF FOULED BALLAST................................................... 136
FIGURE 5-72 CORRELATION OF STATIC MODULUS AND CBR OF FOULED BALLAST ........................................................ 136
FIGURE 5-73 DRY DENSITIES VERSUS MOISTURE CONTENT OF SUBGRADE SOIL FOULED BALLAST ............................. 138
FIGURE 5-74 DRY DENSITIES VERSUS MOISTURE CONTENT OF GARDNER TRACK DUST FOULED BALLAST ................ 138
FIGURE 5-75 DRY DENSITIES VERSUS MOISTURE CONTENT OF COAL DUST FOULED BALLAST ..................................... 139
xvii
FIGURE 5-76 OPTIMUM DRY DENSITIES VERSUS PERCENTAGE FOULING BY WEIGHT...................................................... 140
FIGURE 5-77 DEPTH VERSUS PENETRATION INDEX FOR SITE LOCATION A ........................................................................ 142
FIGURE 5-78 DEPTH VERSUS PENETRATION INDEX FOR SITE LOCATION B ........................................................................ 143
xviii
Chapter One: Introduction
1.1. Background
The United States freight rail system operates throughout the 48 continuous states and is the
safest, most affordable, and most reliable rail system in the world. The freight rail networks work
together on their nearly 140,000–mile system to deliver economic growth, support job creation,
and to provide huge environmental benefits by reducing highway gridlock and providing clearer
air (AAR, Overview of America's Freight Railroads, 2014). About 70% of the railroad network
is used by both freight and passenger trains. Maintaining tracks in good condition is a critical
need, as good track conditions are the only sustainable means for ensuring the overall
performance and safety of railway operations. Track conditions are governed by the rate of
deterioration of geometry, track buckling potential, and overall track support degradation and
integrity. Among these, track support, structural integrity, and performance of the overall
structure depend on the characteristics and performance of the ballast and sub-ballast layers.
Excessive ballast fouling in the railroad substructure is detrimental to the operation of the
railroad track and its structural capacity. The early detection of ballast fouling is of great
importance to the safety of the rail system and its life-cycle cost-effectiveness (Leng & Al-Qadi,
2010). Track instabilities caused by track support degradation and settlement as a result of
progressive fouling of ballast can be temporarily addressed by keeping the track geometry at an
acceptable level through a ballast tamping maintenance action, or more permanently by cleaning
the ballast and removing the fines. Studies in Australia have shown that track maintenance costs
comprise about 25-35% of total freight train operation costs (Majidzadeh, 2010).
1
There are currently three common ways to assess ballast fouling conditions, each falling into
either the destructive or non-destructive category.
Destructive method Non-destructive method
a) Visual Inspection c) Ground Penetrative Radar Method
b) Selective drilling / digging
The easiest way to detect ballast fouling is with visual inspection—however, it is difficult to
quantify the amount of fouling through inspection. The remaining two methods involve tedious
and time-consuming field and lab work and are expensive. A portion of this thesis describes the
development of a new device with the ability to determine the degree of fouling of ballast within
a few minutes and with much lower cost.
1.2. Problem Statement
The speed and freight capacity of train locomotives are both continually increasing due to new
innovations. However, these cost- and time-saving innovations are limited in the railroad system
by existing track condition/design and maintenance costs associated with degradation of track.
So, increased weight of locomotives and railcars could result in functional and/or structural
failure of track. In 2010, track defects caused 32.2% of the 2079 rail accidents in the U.S. and
caused $113 million in damage. Out of these track defect accidents, 622 (93%) involved the
derailment of the train (FRA Annual Report, 2012). Broken rails or welds (15.3%), track
geometry (7.3%), and bearing failure (5.9%) are some of the main causes of train derailments
(Liu, Saat, & Barkan, 2012). A broken rail is most likely caused by the differential settlement of
the track bed. Also, the geometry of the track can be distorted due to instability of the supporting
base of the rail.
2
To prevent functional failure due to fouled substructure materials, costly ballast maintenance is
routinely performed, especially on track serving heavy–axle–load unit trains – which includes
the investment of millions of dollars that may also include the removal and replacement of
fouled railway ballast (Ebrahimi, 2011). The Association of American Railroads (AAR) found
that America’s freight railroads spent $1 billion (11.0%) out of their $9.2 billion maintenance
budgets for track and property in 2012, including the addition of 12.7 million cubic yards of
ballast to build and maintain a rail network that is safe, reliable, efficient, and affordable (AAR,
Total Annual Spending - 2012 Data, 2013). Cleaning ballast to remove fine particles and/or
replacing fouled ballast are the major actions taken to correct track foundations of the railroad
network.
Accumulation of fine particles within the ballast due to intrusion from the exposed surface,
extrusion from subgrade soil, and wearing of ballast is the major factor that reduces the shear
strength and the stability of the ballast. Water promotes soil migration by washing surface
particles down into the ballast, and by softening subgrade soils that can migrate upward under
the dynamic loading from passing trains. Since fine particles tend to retain moisture, addition of
water to them in railroad ballast can create slurry, which can flow through the ballast layer and
may accumulate. This migration fills voids within the coarse aggregates and decreases drainage,
which leads to further reduction in stability due to a decrease in frictional force, subgrade
attrition, and ballast deterioration, caused by the delay in dissipation of excess pore water
pressure (Indraratna, Khabbaz, Salim, & Christie, 2006). Failure to quickly dissipate excess pore
water pressure prevents the ballast from performing properly, safely, and effectively.
Early detection of fouling is important for maintaining track alignments to prevent slow orders
and eventually rail accidents. Railroad civil engineers / geotechnical engineers are facing the
3
challenge of detecting and quantifying the degree of ballast fouling so that a recommended
action for correction can be developed in a timely manner. The established testing methods are
time consuming and costly. A new, non-destructive approach to ballast fouling detection is
needed by railroad civil engineers, an approach that can compute the degree of fouling quickly in
the field with limited investment and provided guidance for more detailed investigation and
maintenance and rehabilitation actions.
1.3. Research Objective
The objectives of this research are discussed as follows:
• To evaluate the resistivity of fouled ballast with different fouling agents for unsaturated
states (at different moisture contents).
• To propose a fouled ballast resistance measurement probe and to verify the accuracy of
this probe with existing approved methods of soil resistance measurement.
• To evaluate the shear strength and modulus of fouled ballast and to study the impact of
water content on fouled ballast.
• To characterize the correlation of strength parameters of fouled ballast at different fouling
levels.
1.4. (Fukue, Minatoa, Horibe, & Taya, 1999) Research Methodology
The research methodology adopted for this research included the following steps:
a. Literature review of the fouling mechanisms of ballast and soil resistivity methods.
b. Testing carried out to determine the engineering properties of major fouling agents of
fouled ballast, including resistivity.
4
c. Determination in the lab of fouled ballast resistivity using the Wenner 4-probe method
with horizontal probe alignments on samples with controlled moisture content.
d. Strength testing that included dynamic cone penetration (DCP), light weight
deflectometer (LWD), and plate loading tests for determination of California Bearing
Ratio (CBR), resilient modulus, and static modulus of fouled ballast.
e. The vertical probe designed and constructed at the University of Kansas (KU), which can
measure the soil resistivity by fall of potential method, was evaluated in lab.
f. Fouling detection at filed by resistivity method as well as strength determination by
above mentioned test.
1.5. Thesis Organization
Following are the details of the report organization of this thesis.
Chapter One introduces the topic, including the background, problem statement, research
objective, and research methodology.
Chapter Two contains a detailed literature review on the cause and effect of ballast fouling,
resistivity measurement methods of fouled ballast, factors affecting the soil resistivity, static and
resilient moduli of ballast, and CBR of ballast.
Chapter Three describes the gradation and other engineering properties of clean ballast as well as
other fouling materials used in this research. This chapter includes the quantification of the
properties of the ballast and fouling materials used in this research.
Chapter Four discusses the detailed methodology of measurement in this study. This includes the
method of preparation of samples. Measurement of resistivity by the four probe and fall of
5
potential methods are also discussed. The details about the Dynamic Cone Penetration (DCP)
test, Light Weight Deflectometer (LWD) test, and Plate Loading Test are discussed.
Chapter Five discusses the results obtained after data analysis. It also compares results of
different samples prepared in different proportions of various types of fouling materials.
Chapter Six contains a discussion of the conclusions reached based on the findings of this
research and recommendations for the direction of further study on this subject.
6
Chapter Two: Literature Review
2.1. Introduction of Fouled Ballast
Ballast is a free draining granular material that plays a crucial role in transmitting and distribut ing
the induced cyclic train loading to the underlying sub-ballast and subgrade at a reduced and
acceptable stress level (Selig & Waters, 1994). The recommended gradations of the railroad ballast
should have 100% passing through the 3” (76 mm) sieve and no more than 5% passing Sieve no 8
(2.36 mm) as recommended by American Railway Engineering and Maintenance-of-way
Association (AREMA) (AREMA manual for railway engineering, 2010). The detail of the ballast
gradation is given in table 2.1.
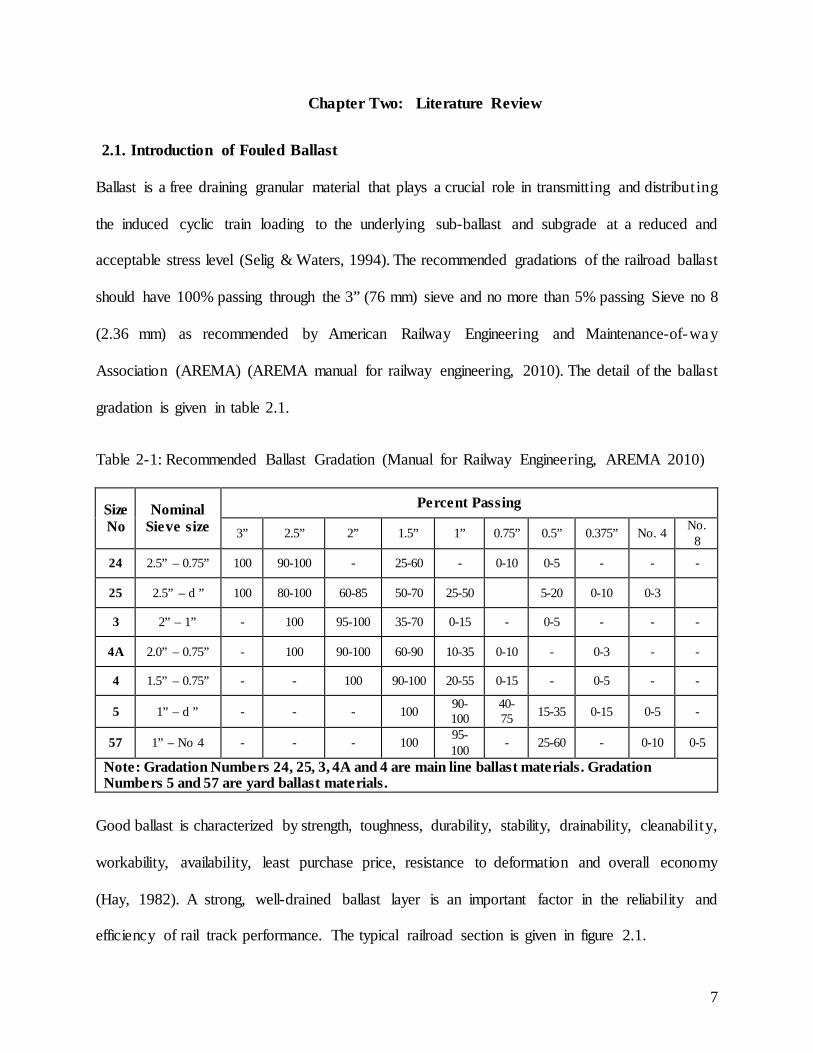
Table 2-1: Recommended Ballast Gradation (Manual for Railway Engineering, AREMA 2010)
Size No
Nominal Sieve size
Percent Passing
3” 2.5” 2” 1.5” 1” 0.75” 0.5” 0.375” No. 4 No. 8
24 2.5” – 0.75” 100 90-100 - 25-60 - 0-10 0-5 - - -
25 2.5” – d ” 100 80-100 60-85 50-70 25-50 5-20 0-10 0-3
3 2” – 1” - 100 95-100 35-70 0-15 - 0-5 - - -
4A 2.0” – 0.75” - 100 90-100 60-90 10-35 0-10 - 0-3 - -
4 1.5” – 0.75” - - 100 90-100 20-55 0-15 - 0-5 - -
5 1” – d ” - - - 100 90-100
40-75 15-35 0-15 0-5 -
57 1” – No 4 - - - 100 95-100 - 25-60 - 0-10 0-5
Note: Gradation Numbers 24, 25, 3, 4A and 4 are main line ballast materials. Gradation Numbers 5 and 57 are yard ballast materials.
Good ballast is characterized by strength, toughness, durability, stability, drainability, cleanability,
workability, availability, least purchase price, resistance to deformation and overall economy
(Hay, 1982). A strong, well-drained ballast layer is an important factor in the reliability and
efficiency of rail track performance. The typical railroad section is given in figure 2.1.
7
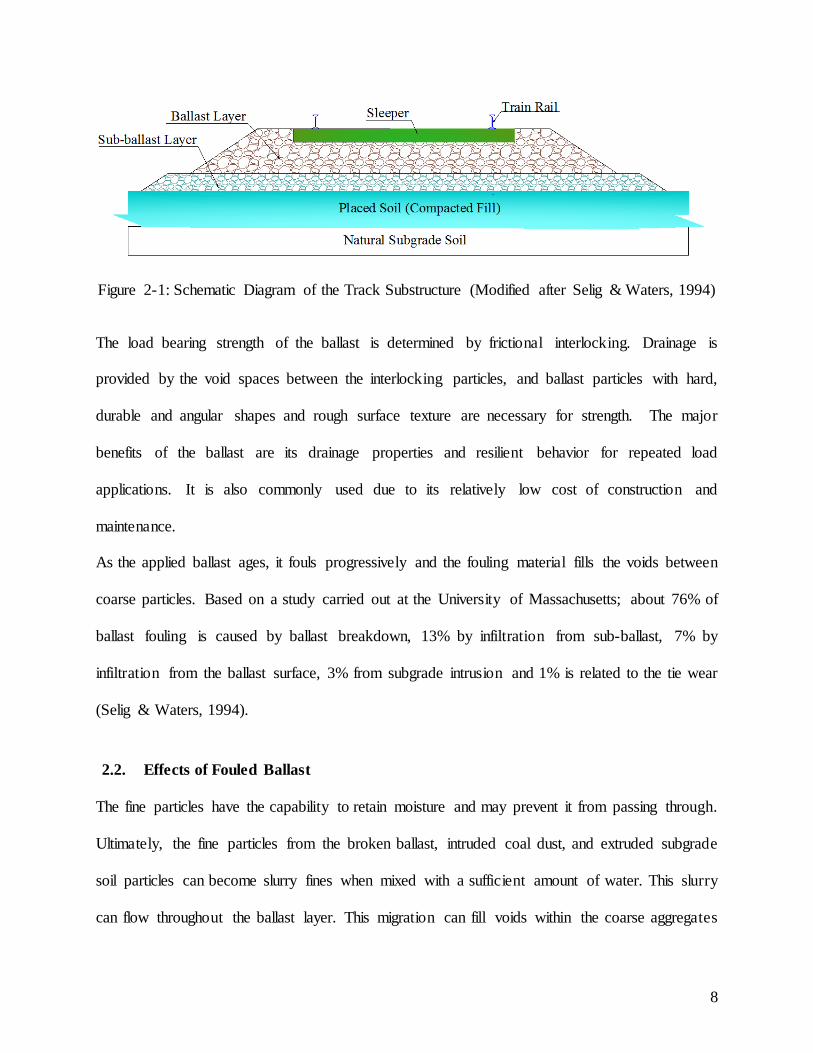
Figure 2-1: Schematic Diagram of the Track Substructure (Modified after Selig & Waters, 1994)
The load bearing strength of the ballast is determined by frictional interlocking. Drainage is
provided by the void spaces between the interlocking particles, and ballast particles with hard,
durable and angular shapes and rough surface texture are necessary for strength. The major
benefits of the ballast are its drainage properties and resilient behavior for repeated load
applications. It is also commonly used due to its relatively low cost of construction and
maintenance.
As the applied ballast ages, it fouls progressively and the fouling material fills the voids between
coarse particles. Based on a study carried out at the University of Massachusetts; about 76% of
ballast fouling is caused by ballast breakdown, 13% by infiltration from sub-ballast, 7% by
infiltration from the ballast surface, 3% from subgrade intrusion and 1% is related to the tie wear
(Selig & Waters, 1994).
2.2. Effects of Fouled Ballast
The fine particles have the capability to retain moisture and may prevent it from passing through.
Ultimately, the fine particles from the broken ballast, intruded coal dust, and extruded subgrade
soil particles can become slurry fines when mixed with a sufficient amount of water. This slurry
can flow throughout the ballast layer. This migration can fill voids within the coarse aggregates
8
and decrease drainage, which can lead to further accumulation of particles to hinder drainage and
reduction in stability due to loss of friction, subgrade attrition, and ballast deterioration due to
delay in dissipation of excess pore water pressure (Indraratna, Khabbaz, Salim, & Christie, 2006).
This creates serviceability problems in the superstructure.
Wallace (Wallace, 2003) and Rahman (Rahman, Parsons, Han, & Glavinich, 2014) found that an
increase in the percentage of fines resulted in a decrease in hydraulic conductivity and thus, the
drainage capacity of the ballast, with silt and clay particles having much more effect than sand
particles. Due to continuous wear and tear of ties with ballast, a pocket of very fine dust forms
beneath the tie. These fines may be added with coal dust intrusion from the surface or/and the fine
subgrade soil extrusion from subgrade. Viscous slurry beneath the ties is created due to the
combination of water and fine particles. As a result, a mud spot forms when the slurry is pushed
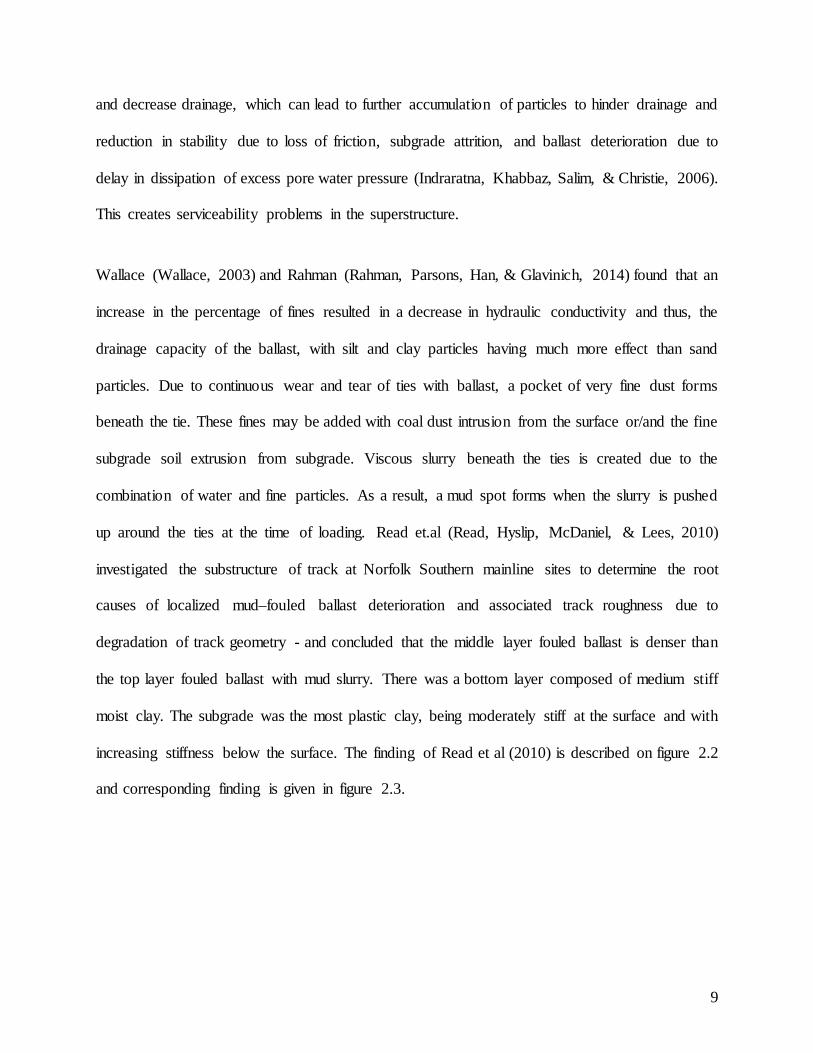
up around the ties at the time of loading. Read et.al (Read, Hyslip, McDaniel, & Lees, 2010)
investigated the substructure of track at Norfolk Southern mainline sites to determine the root
causes of localized mud–fouled ballast deterioration and associated track roughness due to
degradation of track geometry - and concluded that the middle layer fouled ballast is denser than
the top layer fouled ballast with mud slurry. There was a bottom layer composed of medium stiff
moist clay. The subgrade was the most plastic clay, being moderately stiff at the surface and with
increasing stiffness below the surface. The finding of Read et al (2010) is described on figure 2.2
and corresponding finding is given in figure 2.3.
9
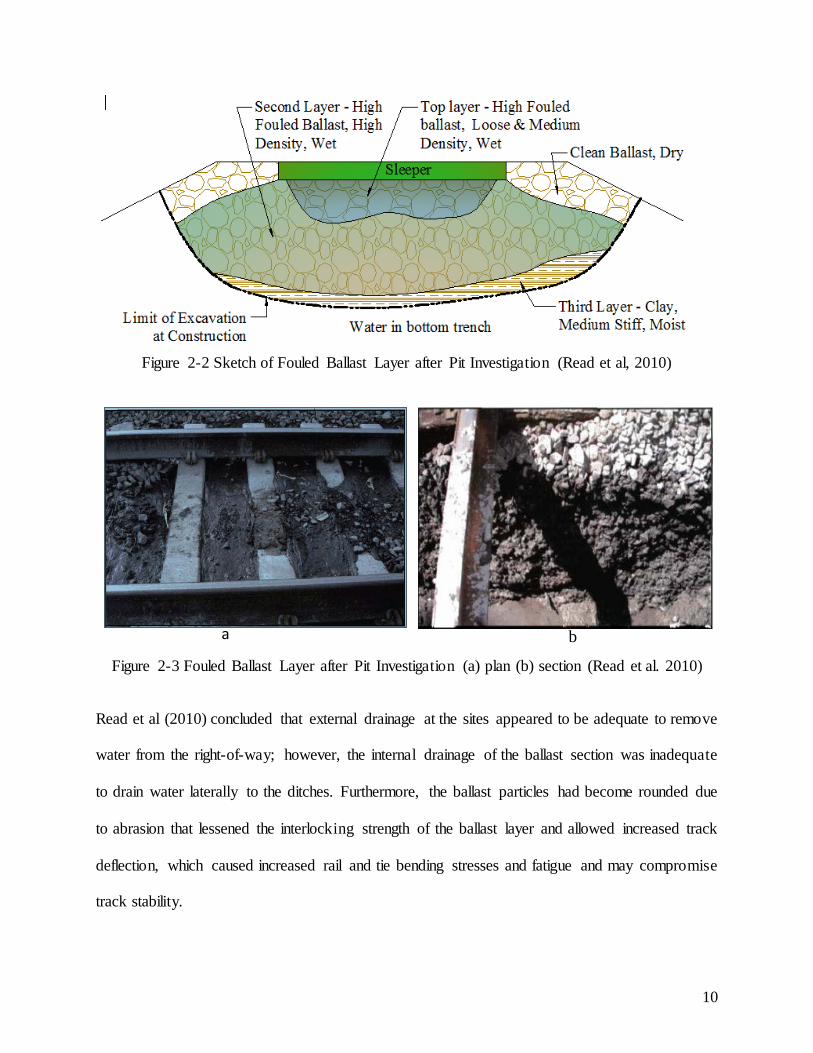
Figure 2-2 Sketch of Fouled Ballast Layer after Pit Investigation (Read et al, 2010)
Figure 2-3 Fouled Ballast Layer after Pit Investigation (a) plan (b) section (Read et al. 2010)
Read et al (2010) concluded that external drainage at the sites appeared to be adequate to remove
water from the right-of-way; however, the internal drainage of the ballast section was inadequate
to drain water laterally to the ditches. Furthermore, the ballast particles had become rounded due
to abrasion that lessened the interlocking strength of the ballast layer and allowed increased track
deflection, which caused increased rail and tie bending stresses and fatigue and may compromise
track stability.
a b
10
Track stability related failures vary from rapid deterioration with little warning to slow and
progressive deterioration. Visual evidence that fouling is present can often be seen during required
maintenance. In summary, blocked drainage caused by fouling of ballast can result in a saturated
roadbed that is not stable and can rapidly deteriorate to an unsafe condition with little warning
(Sussmann, Ruel, & Chrismer, 2012).
2.3. Resistivity of Fouling Agents
Soil and rock minerals - either in dust or chunk (ballast) form - are insulators and possess good
electrical resistance unless they have sufficient moisture. The electrical conductance in sufficient ly
moist soils is primarily via the electrolytes (salts) contained in the water occupying the larger pores
(Rhoades, Corwin, & Lesch, 1999). Though some types of soil minerals also contribute to current
transfer through surface conduction in moist soil – this is primarily via the exchangeable cation
associated with soil minerals - the amount of such types of conduction is relatively very small.
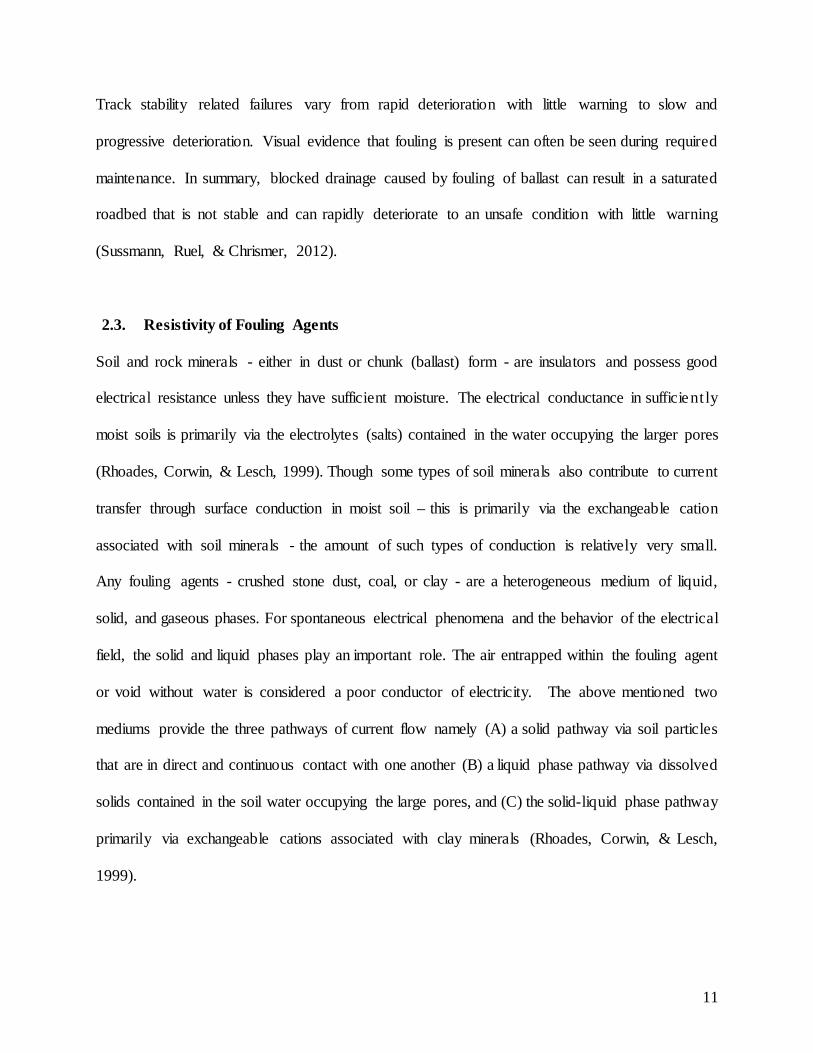
Any fouling agents - crushed stone dust, coal, or clay - are a heterogeneous medium of liquid,
solid, and gaseous phases. For spontaneous electrical phenomena and the behavior of the electrical
field, the solid and liquid phases play an important role. The air entrapped within the fouling agent
or void without water is considered a poor conductor of electricity. The above mentioned two
mediums provide the three pathways of current flow namely (A) a solid pathway via soil particles
that are in direct and continuous contact with one another (B) a liquid phase pathway via dissolved
solids contained in the soil water occupying the large pores, and (C) the solid-liquid phase pathway
primarily via exchangeable cations associated with clay minerals (Rhoades, Corwin, & Lesch,
1999).
11
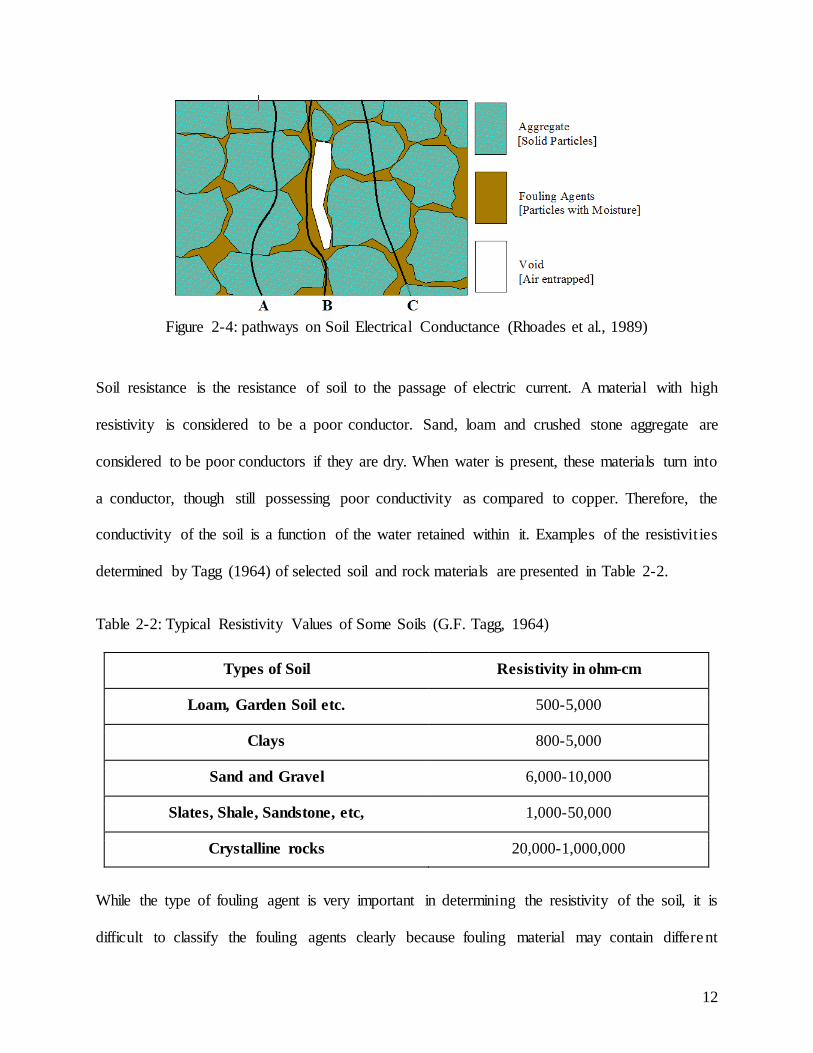
Figure 2-4: pathways on Soil Electrical Conductance (Rhoades et al., 1989)
Soil resistance is the resistance of soil to the passage of electric current. A material with high
resistivity is considered to be a poor conductor. Sand, loam and crushed stone aggregate are
considered to be poor conductors if they are dry. When water is present, these materials turn into
a conductor, though still possessing poor conductivity as compared to copper. Therefore, the
conductivity of the soil is a function of the water retained within it. Examples of the resistivit ies
determined by Tagg (1964) of selected soil and rock materials are presented in Table 2-2.
Table 2-2: Typical Resistivity Values of Some Soils (G.F. Tagg, 1964)
Types of Soil Resistivity in ohm-cm
Loam, Garden Soil etc. 500-5,000
Clays 800-5,000
Sand and Gravel 6,000-10,000
Slates, Shale, Sandstone, etc, 1,000-50,000
Crystalline rocks 20,000-1,000,000
While the type of fouling agent is very important in determining the resistivity of the soil, it is
difficult to classify the fouling agents clearly because fouling material may contain different
12
constituents at different site. Water content is another major factor that governs the conductivity
of the fouling agent. The exact value of electrical resistivity of fouling agents or fouled ballasts
will almost certainly vary as the water content changes.
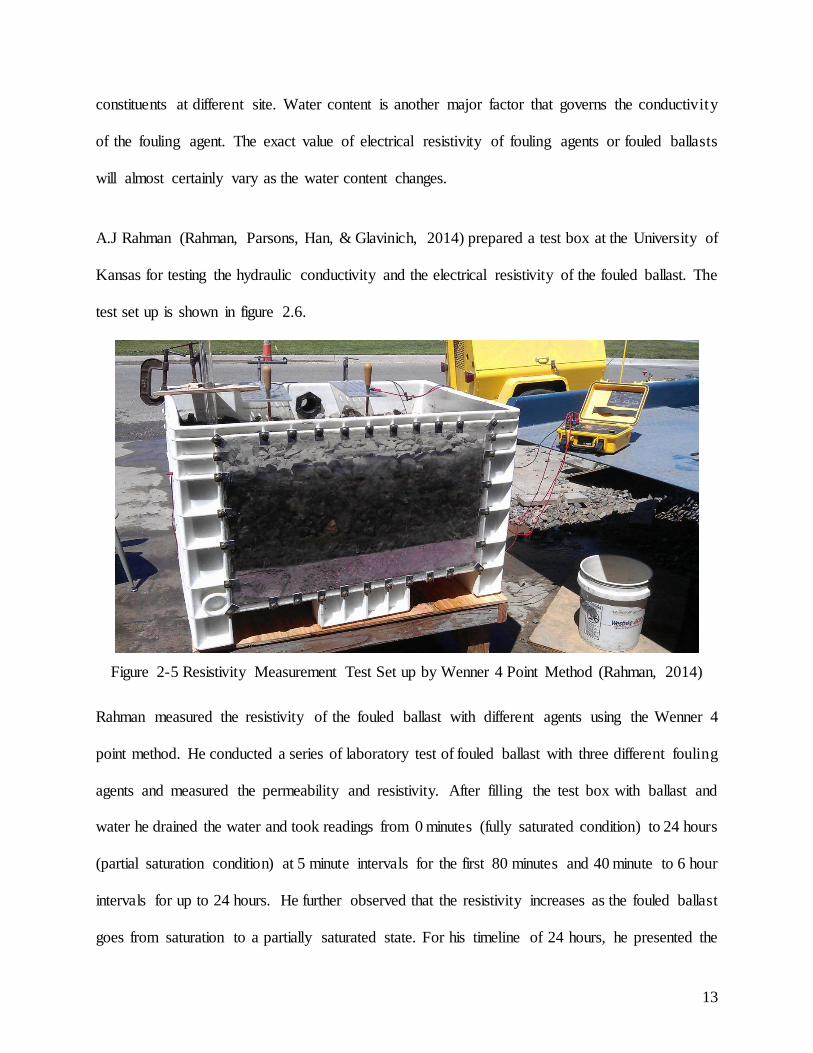
A.J Rahman (Rahman, Parsons, Han, & Glavinich, 2014) prepared a test box at the University of
Kansas for testing the hydraulic conductivity and the electrical resistivity of the fouled ballast. The
test set up is shown in figure 2.6.
Figure 2-5 Resistivity Measurement Test Set up by Wenner 4 Point Method (Rahman, 2014)
Rahman measured the resistivity of the fouled ballast with different agents using the Wenner 4
point method. He conducted a series of laboratory test of fouled ballast with three different fouling
agents and measured the permeability and resistivity. After filling the test box with ballast and
water he drained the water and took readings from 0 minutes (fully saturated condition) to 24 hours
(partial saturation condition) at 5 minute intervals for the first 80 minutes and 40 minute to 6 hour
intervals for up to 24 hours. He further observed that the resistivity increases as the fouled ballast
goes from saturation to a partially saturated state. For his timeline of 24 hours, he presented the
13
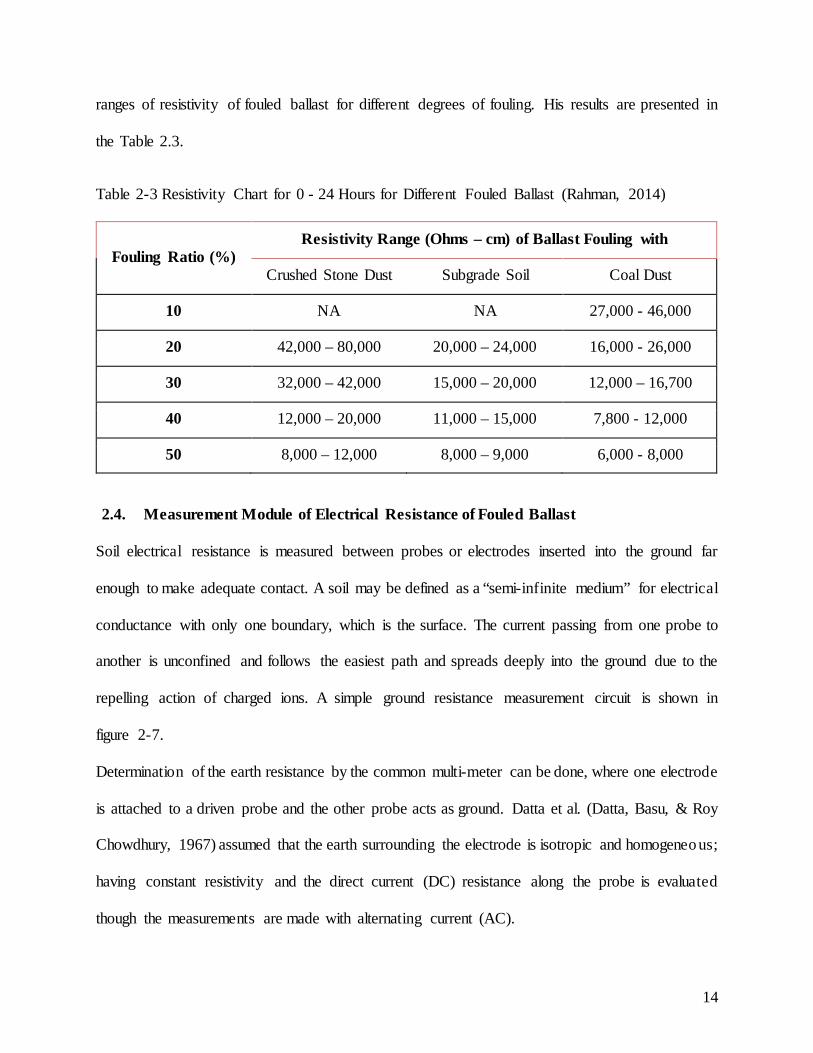
ranges of resistivity of fouled ballast for different degrees of fouling. His results are presented in
the Table 2.3.
Table 2-3 Resistivity Chart for 0 - 24 Hours for Different Fouled Ballast (Rahman, 2014)
Fouling Ratio (%) Resistivity Range (Ohms – cm) of Ballast Fouling with
Crushed Stone Dust Subgrade Soil Coal Dust
10 NA NA 27,000 - 46,000
20 42,000 – 80,000 20,000 – 24,000 16,000 - 26,000
30 32,000 – 42,000 15,000 – 20,000 12,000 – 16,700
40 12,000 – 20,000 11,000 – 15,000 7,800 - 12,000
50 8,000 – 12,000 8,000 – 9,000 6,000 - 8,000
2.4. Measurement Module of Electrical Resistance of Fouled Ballast
Soil electrical resistance is measured between probes or electrodes inserted into the ground far
enough to make adequate contact. A soil may be defined as a “semi-infinite medium” for electrical
conductance with only one boundary, which is the surface. The current passing from one probe to
another is unconfined and follows the easiest path and spreads deeply into the ground due to the
repelling action of charged ions. A simple ground resistance measurement circuit is shown in
figure 2-7.
Determination of the earth resistance by the common multi-meter can be done, where one electrode
is attached to a driven probe and the other probe acts as ground. Datta et al. (Datta, Basu, & Roy
Chowdhury, 1967) assumed that the earth surrounding the electrode is isotropic and homogeneous;
having constant resistivity and the direct current (DC) resistance along the probe is evaluated
though the measurements are made with alternating current (AC).
14
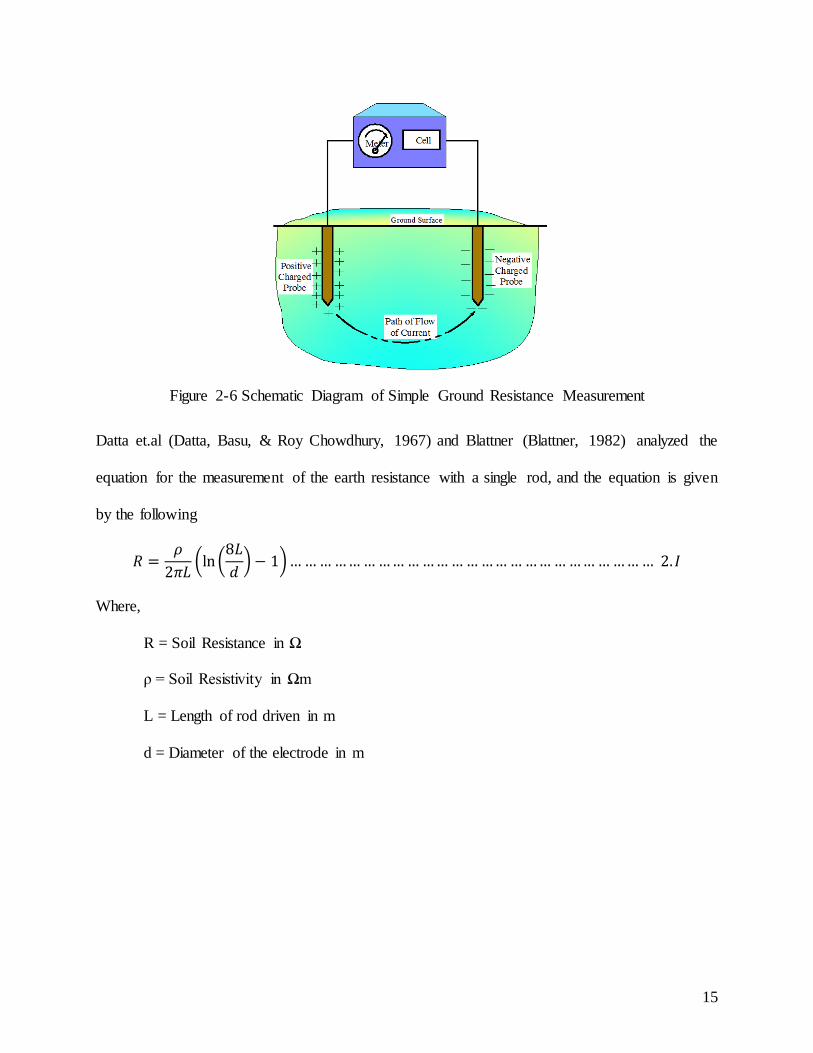
Figure 2-6 Schematic Diagram of Simple Ground Resistance Measurement
Datta et.al (Datta, Basu, & Roy Chowdhury, 1967) and Blattner (Blattner, 1982) analyzed the
equation for the measurement of the earth resistance with a single rod, and the equation is given
by the following
𝑅𝑅 =𝜌𝜌
2𝜋𝜋𝜋𝜋ln
8𝜋𝜋𝑑𝑑 − 1… … … … … … … … … … … … … … … … … … … … … … … … … 2.𝐼𝐼
Where,
R = Soil Resistance in Ω
ρ = Soil Resistivity in Ωm
L = Length of rod driven in m
d = Diameter of the electrode in m
15
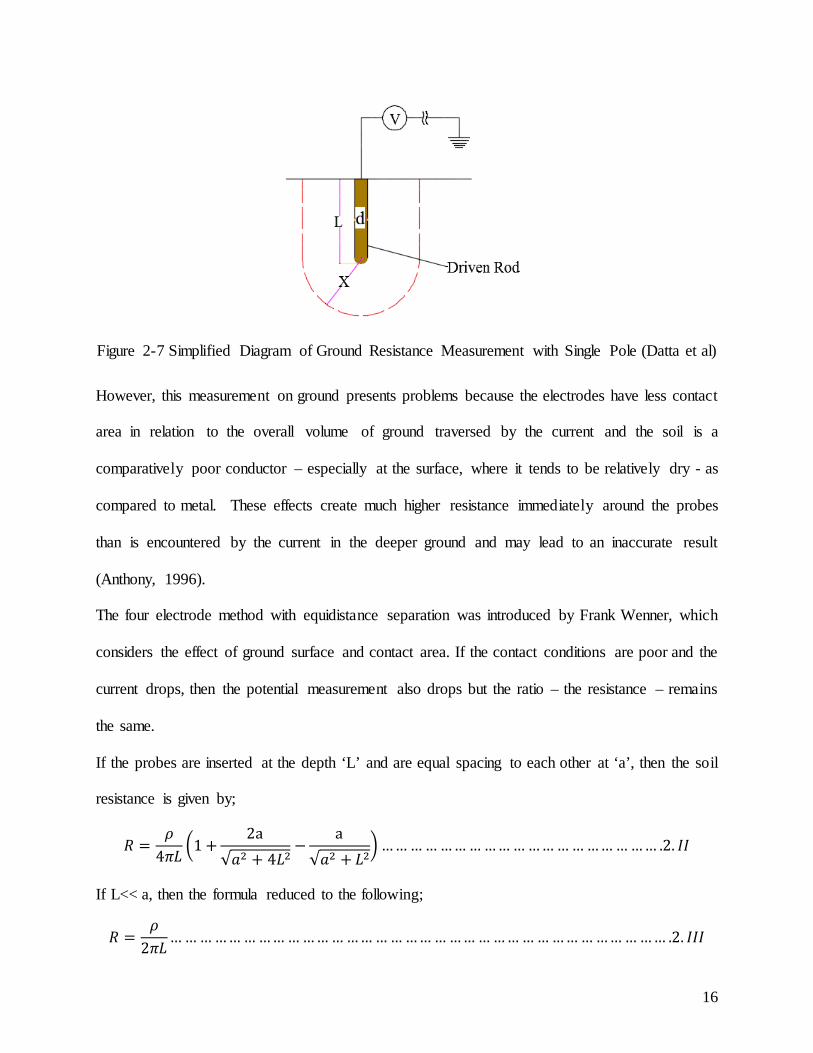
Figure 2-7 Simplified Diagram of Ground Resistance Measurement with Single Pole (Datta et al)
However, this measurement on ground presents problems because the electrodes have less contact
area in relation to the overall volume of ground traversed by the current and the soil is a
comparatively poor conductor – especially at the surface, where it tends to be relatively dry - as
compared to metal. These effects create much higher resistance immediately around the probes
than is encountered by the current in the deeper ground and may lead to an inaccurate result
(Anthony, 1996).
The four electrode method with equidistance separation was introduced by Frank Wenner, which
considers the effect of ground surface and contact area. If the contact conditions are poor and the
current drops, then the potential measurement also drops but the ratio – the resistance – remains
the same.
If the probes are inserted at the depth ‘L’ and are equal spacing to each other at ‘a’, then the soil
resistance is given by;
𝑅𝑅 =𝜌𝜌
4𝜋𝜋𝜋𝜋1 +
2a√𝑎𝑎2 + 4𝜋𝜋2
−a
√𝑎𝑎2 + 𝜋𝜋2… … … … … … … … … … … … … … … … … … … .2. 𝐼𝐼𝐼𝐼
If L<< a, then the formula reduced to the following;
𝑅𝑅 =𝜌𝜌
2𝜋𝜋𝜋𝜋… … … … … … … … … … … … … … … … … … … … … … … … … … … … … … … … … … .2. 𝐼𝐼𝐼𝐼𝐼𝐼
16
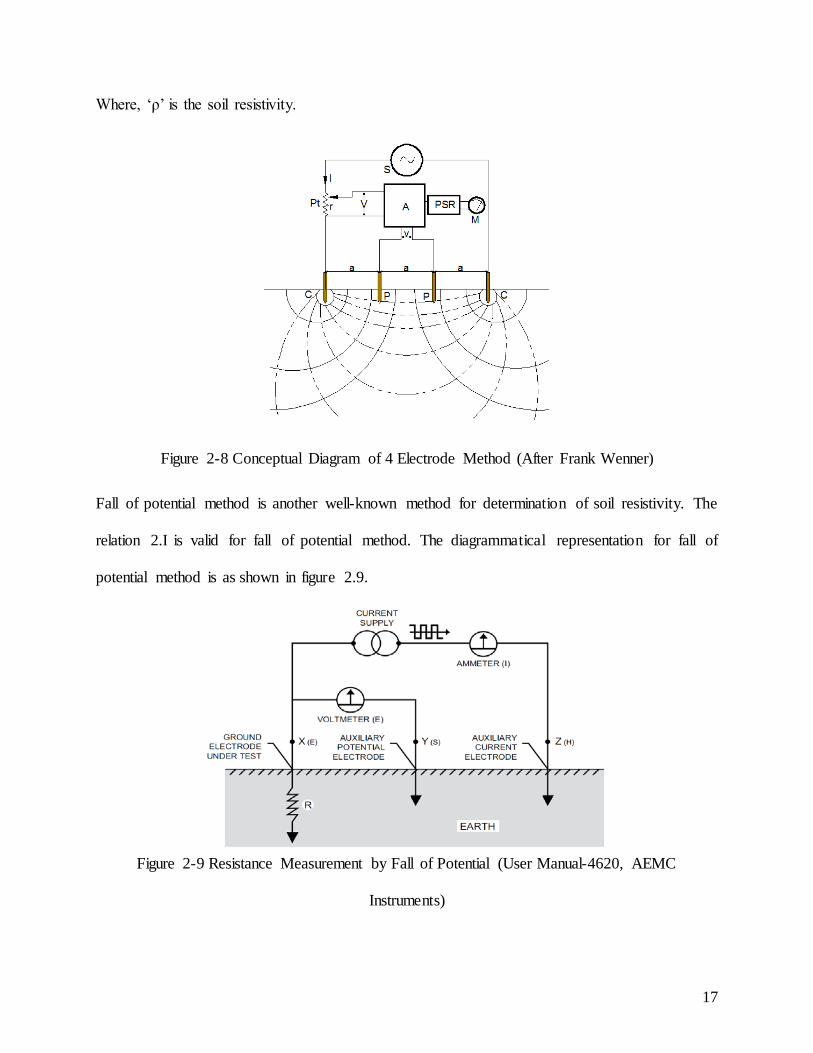
Where, ‘ρ’ is the soil resistivity.
Figure 2-8 Conceptual Diagram of 4 Electrode Method (After Frank Wenner)
Fall of potential method is another well-known method for determination of soil resistivity. The
relation 2.I is valid for fall of potential method. The diagrammatical representation for fall of
potential method is as shown in figure 2.9.
Figure 2-9 Resistance Measurement by Fall of Potential (User Manual-4620, AEMC
Instruments)
17
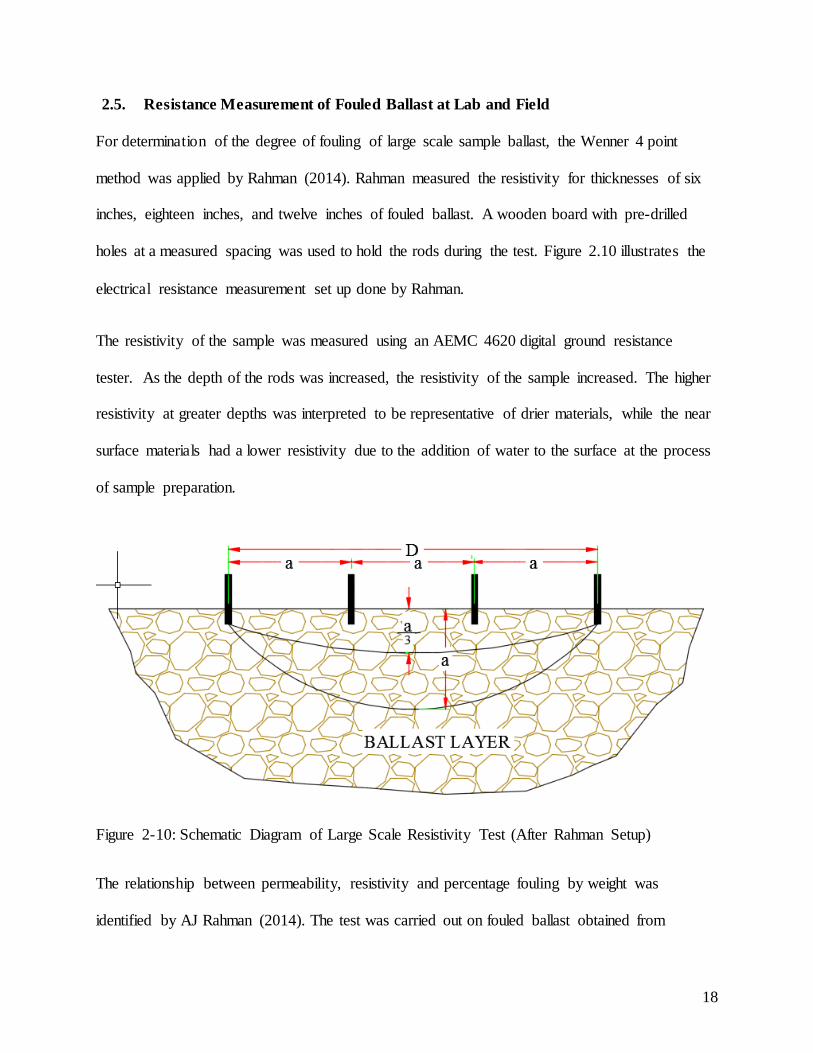
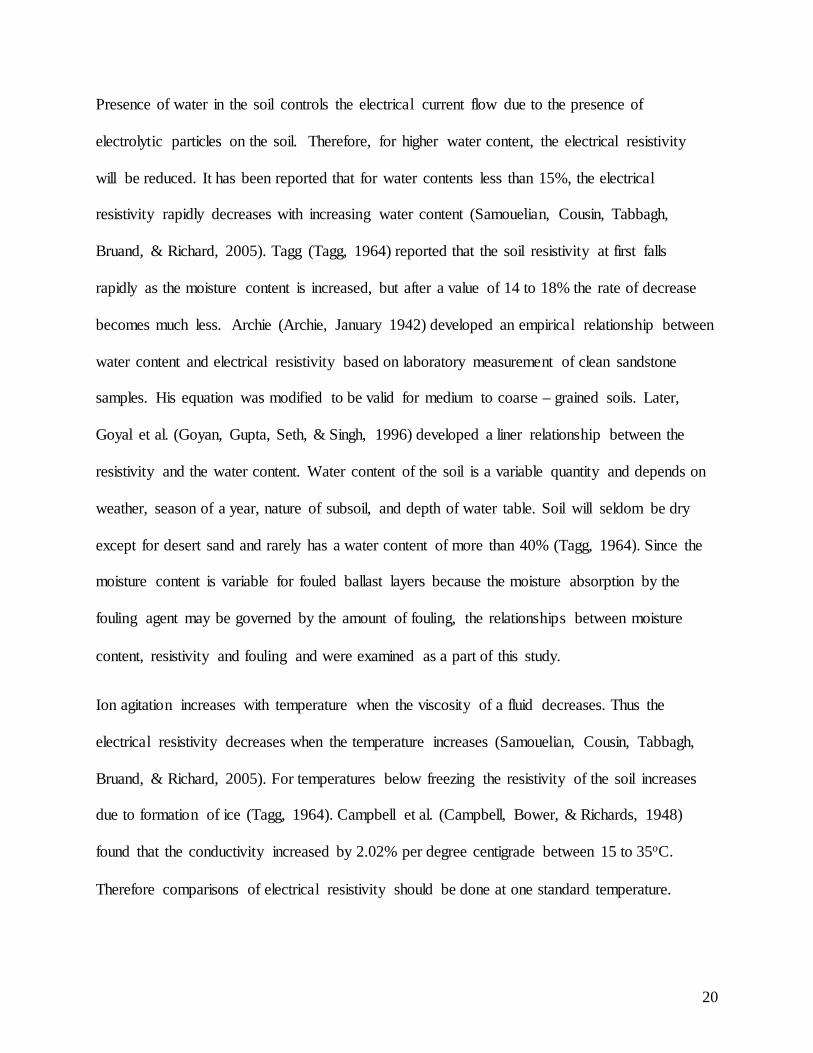
2.5. Resistance Measurement of Fouled Ballast at Lab and Field
For determination of the degree of fouling of large scale sample ballast, the Wenner 4 point
method was applied by Rahman (2014). Rahman measured the resistivity for thicknesses of six
inches, eighteen inches, and twelve inches of fouled ballast. A wooden board with pre-drilled
holes at a measured spacing was used to hold the rods during the test. Figure 2.10 illustrates the
electrical resistance measurement set up done by Rahman.
The resistivity of the sample was measured using an AEMC 4620 digital ground resistance
tester. As the depth of the rods was increased, the resistivity of the sample increased. The higher
resistivity at greater depths was interpreted to be representative of drier materials, while the near
surface materials had a lower resistivity due to the addition of water to the surface at the process
of sample preparation.
Figure 2-10: Schematic Diagram of Large Scale Resistivity Test (After Rahman Setup)
The relationship between permeability, resistivity and percentage fouling by weight was
identified by AJ Rahman (2014). The test was carried out on fouled ballast obtained from
18
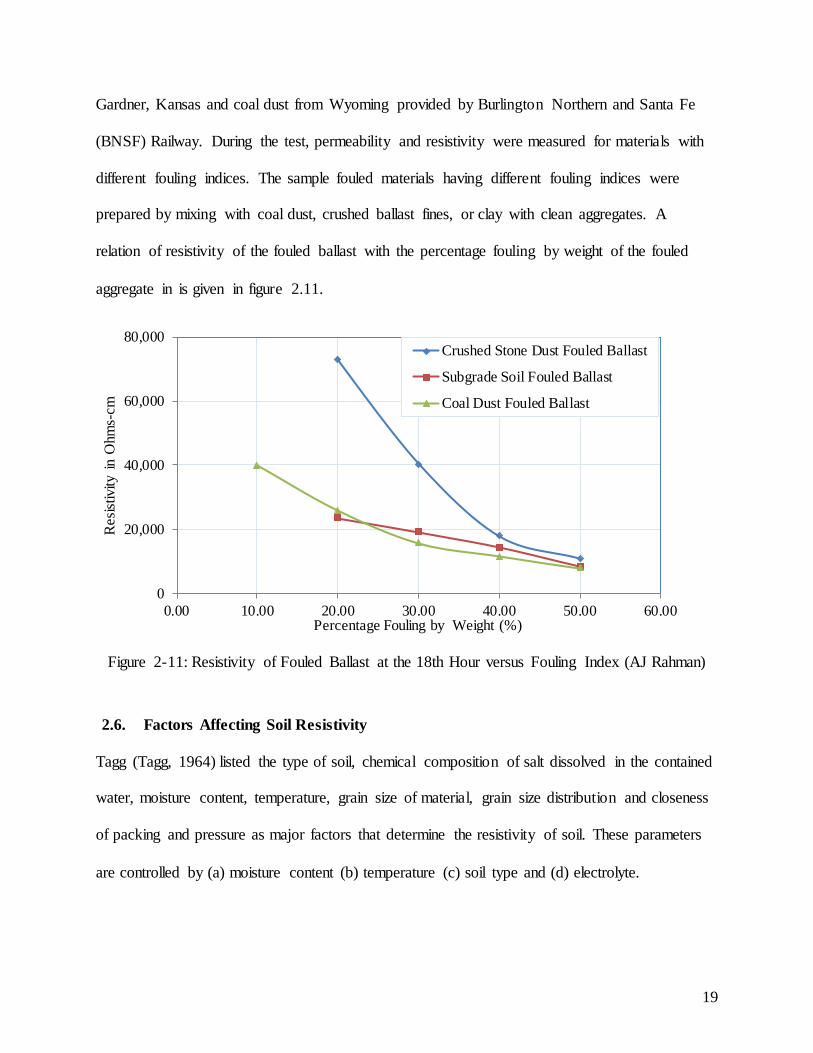
Gardner, Kansas and coal dust from Wyoming provided by Burlington Northern and Santa Fe
(BNSF) Railway. During the test, permeability and resistivity were measured for materials with
different fouling indices. The sample fouled materials having different fouling indices were
prepared by mixing with coal dust, crushed ballast fines, or clay with clean aggregates. A
relation of resistivity of the fouled ballast with the percentage fouling by weight of the fouled
aggregate in is given in figure 2.11.
Figure 2-11: Resistivity of Fouled Ballast at the 18th Hour versus Fouling Index (AJ Rahman)
2.6. Factors Affecting Soil Resistivity
Tagg (Tagg, 1964) listed the type of soil, chemical composition of salt dissolved in the contained
water, moisture content, temperature, grain size of material, grain size distribution and closeness
of packing and pressure as major factors that determine the resistivity of soil. These parameters
are controlled by (a) moisture content (b) temperature (c) soil type and (d) electrolyte.
0
20,000
40,000
60,000
80,000
0.00 10.00 20.00 30.00 40.00 50.00 60.00
Res
istiv
ity in
Ohm
s-cm
Percentage Fouling by Weight (%)
Crushed Stone Dust Fouled Ballast
Subgrade Soil Fouled Ballast
Coal Dust Fouled Ballast
19
Presence of water in the soil controls the electrical current flow due to the presence of
electrolytic particles on the soil. Therefore, for higher water content, the electrical resistivity
will be reduced. It has been reported that for water contents less than 15%, the electrical
resistivity rapidly decreases with increasing water content (Samouelian, Cousin, Tabbagh,
Bruand, & Richard, 2005). Tagg (Tagg, 1964) reported that the soil resistivity at first falls
rapidly as the moisture content is increased, but after a value of 14 to 18% the rate of decrease
becomes much less. Archie (Archie, January 1942) developed an empirical relationship between
water content and electrical resistivity based on laboratory measurement of clean sandstone
samples. His equation was modified to be valid for medium to coarse – grained soils. Later,
Goyal et al. (Goyan, Gupta, Seth, & Singh, 1996) developed a liner relationship between the
resistivity and the water content. Water content of the soil is a variable quantity and depends on
weather, season of a year, nature of subsoil, and depth of water table. Soil will seldom be dry
except for desert sand and rarely has a water content of more than 40% (Tagg, 1964). Since the
moisture content is variable for fouled ballast layers because the moisture absorption by the
fouling agent may be governed by the amount of fouling, the relationships between moisture
content, resistivity and fouling and were examined as a part of this study.
Ion agitation increases with temperature when the viscosity of a fluid decreases. Thus the
electrical resistivity decreases when the temperature increases (Samouelian, Cousin, Tabbagh,
Bruand, & Richard, 2005). For temperatures below freezing the resistivity of the soil increases
due to formation of ice (Tagg, 1964). Campbell et al. (Campbell, Bower, & Richards, 1948)
found that the conductivity increased by 2.02% per degree centigrade between 15 to 35oC.
Therefore comparisons of electrical resistivity should be done at one standard temperature.
20
The major role of electrical conductivity on soil is due to presence of electrolytes or dissolved
salts. Since the electrical conductivity is different for different salts, the same soil at different
locations may have a different electrical resistivity if different salts are present. The salts are not
conductive by themselves and need a medium of water. Since the rail track is fouled by coal
dust, subgrade soil or crushed stone dust ballast, the properties of the fouled ballast are the same
throughout the track for a given fouling agent unless the subgrade soil changes.
Soil types describe the nature and arrangement of solid constituents. The electrical conductivity
is a function of soil particle size and the electrical charge density at the surface of the soil solids.
Fukue et al. (Fukue, Minatoa, Horibe, & Taya, 1999) found that the electrical charges located at
the surface of clay particles lead to greater electrical conductivity than in coarse textured soils
because of the higher specific surface area. Pore geometry and void distribution generally
governs the amount of air and water in the voids based on water potential. Tagg (Tagg, 1964)
stated that the same general type of soil occurring in various localities is often found to have
different resistivities. Therefore, soil types describe in a general way the chemical composition,
grain size of material and its distribution, closeness of packing and applied pressure.
2.7. Resilient Modulus of Ballast
The resilient modulus (MR) is the elastic modulus based on the recoverable strain under repeated
loads. As ballast exhibits a nonlinear and time dependent elasto-plastic response under repeated
loading, the resilient modulus is often of more interest than the elastic modulus. The resilient
modulus is equal to the deviator stress (σd) divided by recoverable elastic strain (εr). The resilient
modulus of railroad ballast is influenced by several parameters including stress history, load
cycles and stress level; load duration, frequency and load sequence; density; grading, fines
content and maximum grain size; aggregate type and particle shape; and moisture content.
21
Among these factors, only the influence of stress and moisture content are consistent (Lekarp,
Isacsson, & Dawson, 2000) . The resilient modulus is generally taken to characterize the cyclic
densification of granular aggregates commonly used in pavements and rail lines. The resilient
behavior of railway track bed is complex as the properties of subgrade soil underlying the track
also affect the rate of settlement and partial ballast degradation.
The magnitude of the resilient modulus is very much stress-state dependent. The resilient
response of unbound granular materials greatly increases as the confining pressure increases and
the magnitude of the repeated deviator stress has little effect (Selig & Waters, 1994).
2.8. California Bearing Ratio (CBR) of Ballast
Evaluation of California Bearing Ratio (CBR) value by the dynamic cone penetrometer (DCP) is
useful for the determination of the bearing value of crushed stone ballast when subjected to
intense repeated loading. A cone tipped rod is driven with repeated blows with a weight falling
from certain height. The rate of penetration per blow is the dynamic penetration index (DPI) or
penetration index (PI) and is an indicator of the type and strength of the soil. There has been little
success on numerically relating dynamic PI to dry density and other parameters. Salgado and
Yoon (Salgado & Yoon, 2003) found that the CBR increases while dry unit weight increases.
However he proposed no exact numerical relationship. The DCP index is plotted against total
depth and is correlated with CBR. The US Army Corps of Engineers recommended numerical
relations that can relate the value of CBR to PI (Webster, Brown, & Porter, 1994).
Harison (Harison, 1987) describes the penetration index (PI) as a function of moisture content
and dry unit weight. He found that if the moisture content increased, the penetration index first
decreased and then increased after optimum moisture content of compaction curve. However,
22
Salgado and Yoon (Salgado & Yoon, 2003) found that the PI from DCP is very sensitive to
moisture conditions and PI for a given material slightly increases with increasing moisture
content. Sayers et al. (Ayers, Thompson, & Uzarski, 1989) developed a correlation between PI
and the shear strength of the granular soil. He ran the test for different materials including
crushed dolomitic ballast and other ballast having non plastic fines of 7.5%, 15% and 22.5% and
correlated the shear strength with PI at different confining stress. The PI for granular soil,
especially soils with gravel, can cause unrealistic PI measurements due to contact with the large
aggregate.
2.9. Shear Strength Properties of Ballast
Ballast loses strength as the amount of fouling increases. Strength can be determined by the Large
Direct Shear Test in the laboratory. Huang et.al (Huang, Tutumluer, & Dombrow, 2009) conducted
a study of the strength properties of clean and fouled ballast samples fouled with coal dust, plastic
clay, and mineral fillers at various percentages by weight. The result of the study showed that coal
dust is the worst fouling agent based on its impact on track substructures, though all types of
fouling agents cause decreasing trends in shear strength properties. Because of the increasing
cohesive nature with increasing fouling percentages, plastic clay fouled samples exhibit slight
increases in shear strength under both dry and wet conditions. Coal dust caused the most drastic
decreases in shear strength especially for highly fouled levels. Fifteen percent of dry coal dust by
weight was sufficient to cause critical fouling and decreased the ballast strength considerably
(Huang, Tutumluer, & Dombrow, 2009). Rahman (Rahman, Parsons, Han, & Glavinich, 2014)
conducted shear strength tests on fouled ballast samples in the large direct shear test box and
modified large direct shear box at the University of Kansas and concluded that coal dust and
subgrade soil caused a significant decrease in strength as compare to crushed stone dust. The
23
modified direct shear box test presented a clearer pattern of decreasing strength as fouling agent
content increased. Also, the Modified Direct Shear test results showed lower friction angles for
the same sample as compared with the Large Direct Shear Test (Rahman, Parsons, Han, &
Glavinich, 2014).
24
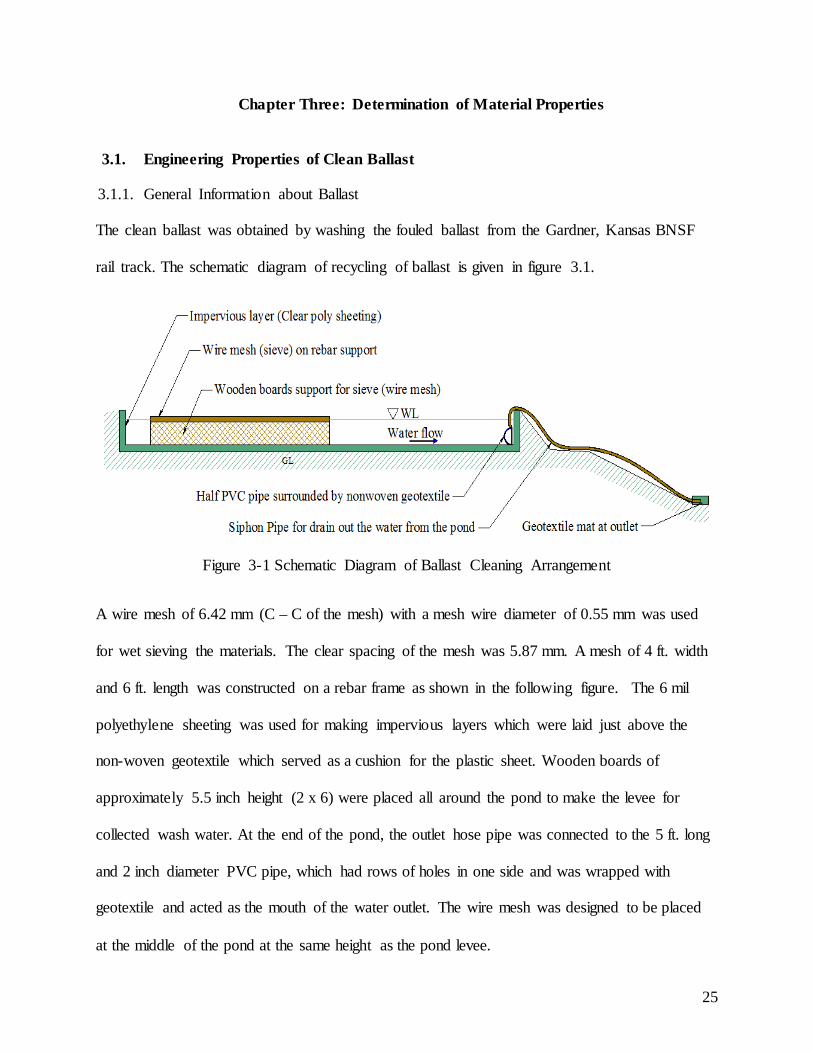
Chapter Three: Determination of Material Properties
3.1. Engineering Properties of Clean Ballast
3.1.1. General Information about Ballast
The clean ballast was obtained by washing the fouled ballast from the Gardner, Kansas BNSF
rail track. The schematic diagram of recycling of ballast is given in figure 3.1.
Figure 3-1 Schematic Diagram of Ballast Cleaning Arrangement
A wire mesh of 6.42 mm (C – C of the mesh) with a mesh wire diameter of 0.55 mm was used
for wet sieving the materials. The clear spacing of the mesh was 5.87 mm. A mesh of 4 ft. width
and 6 ft. length was constructed on a rebar frame as shown in the following figure. The 6 mil
polyethylene sheeting was used for making impervious layers which were laid just above the
non-woven geotextile which served as a cushion for the plastic sheet. Wooden boards of
approximately 5.5 inch height (2 x 6) were placed all around the pond to make the levee for
collected wash water. At the end of the pond, the outlet hose pipe was connected to the 5 ft. long
and 2 inch diameter PVC pipe, which had rows of holes in one side and was wrapped with
geotextile and acted as the mouth of the water outlet. The wire mesh was designed to be placed
at the middle of the pond at the same height as the pond levee.
25
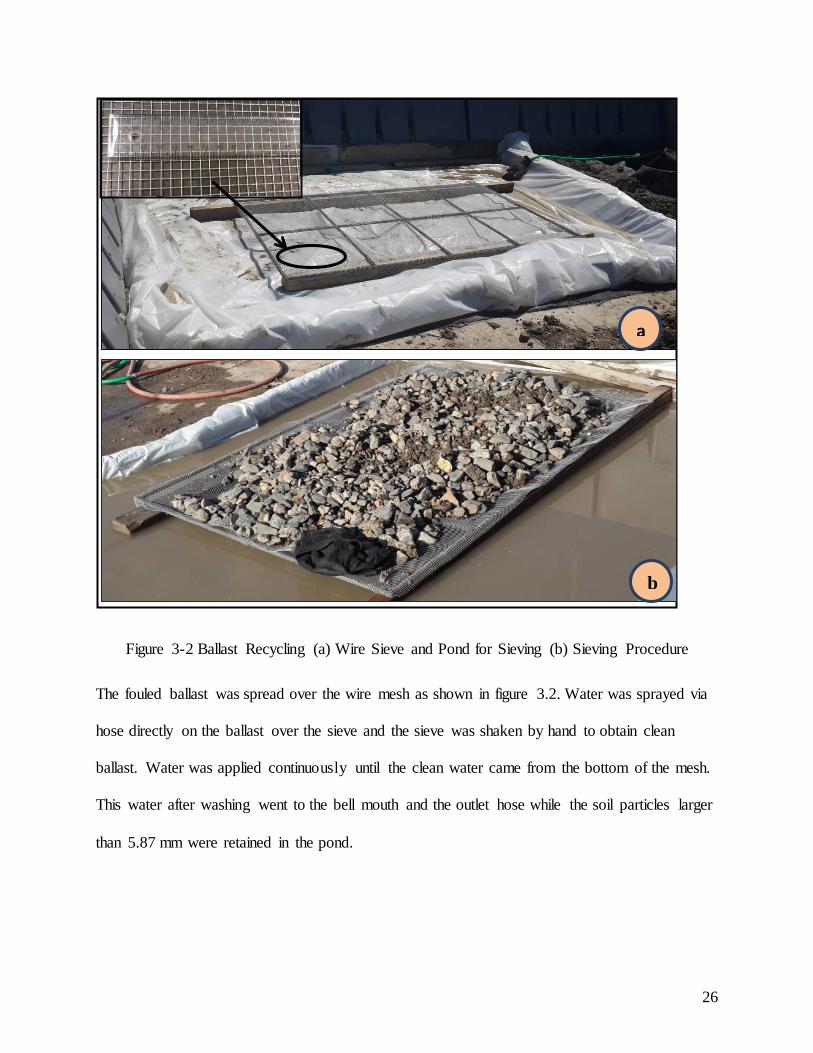
Figure 3-2 Ballast Recycling (a) Wire Sieve and Pond for Sieving (b) Sieving Procedure
The fouled ballast was spread over the wire mesh as shown in figure 3.2. Water was sprayed via
hose directly on the ballast over the sieve and the sieve was shaken by hand to obtain clean
ballast. Water was applied continuously until the clean water came from the bottom of the mesh.
This water after washing went to the bell mouth and the outlet hose while the soil particles larger
than 5.87 mm were retained in the pond.
a
b
26
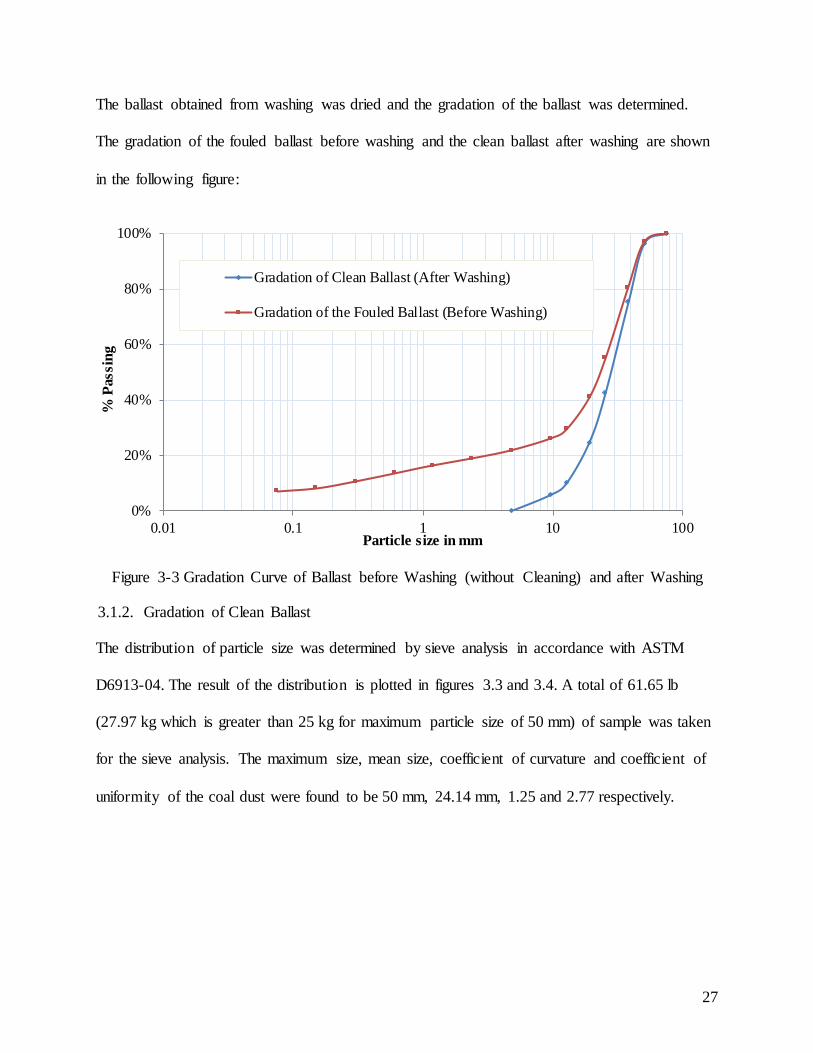
The ballast obtained from washing was dried and the gradation of the ballast was determined.
The gradation of the fouled ballast before washing and the clean ballast after washing are shown
in the following figure:
Figure 3-3 Gradation Curve of Ballast before Washing (without Cleaning) and after Washing
3.1.2. Gradation of Clean Ballast
The distribution of particle size was determined by sieve analysis in accordance with ASTM
D6913-04. The result of the distribution is plotted in figures 3.3 and 3.4. A total of 61.65 lb
(27.97 kg which is greater than 25 kg for maximum particle size of 50 mm) of sample was taken
for the sieve analysis. The maximum size, mean size, coefficient of curvature and coefficient of
uniformity of the coal dust were found to be 50 mm, 24.14 mm, 1.25 and 2.77 respectively.
0%
20%
40%
60%
80%
100%
0.01 0.1 1 10 100
% P
assi
ng
Particle size in mm
Gradation of Clean Ballast (After Washing)
Gradation of the Fouled Ballast (Before Washing)
27
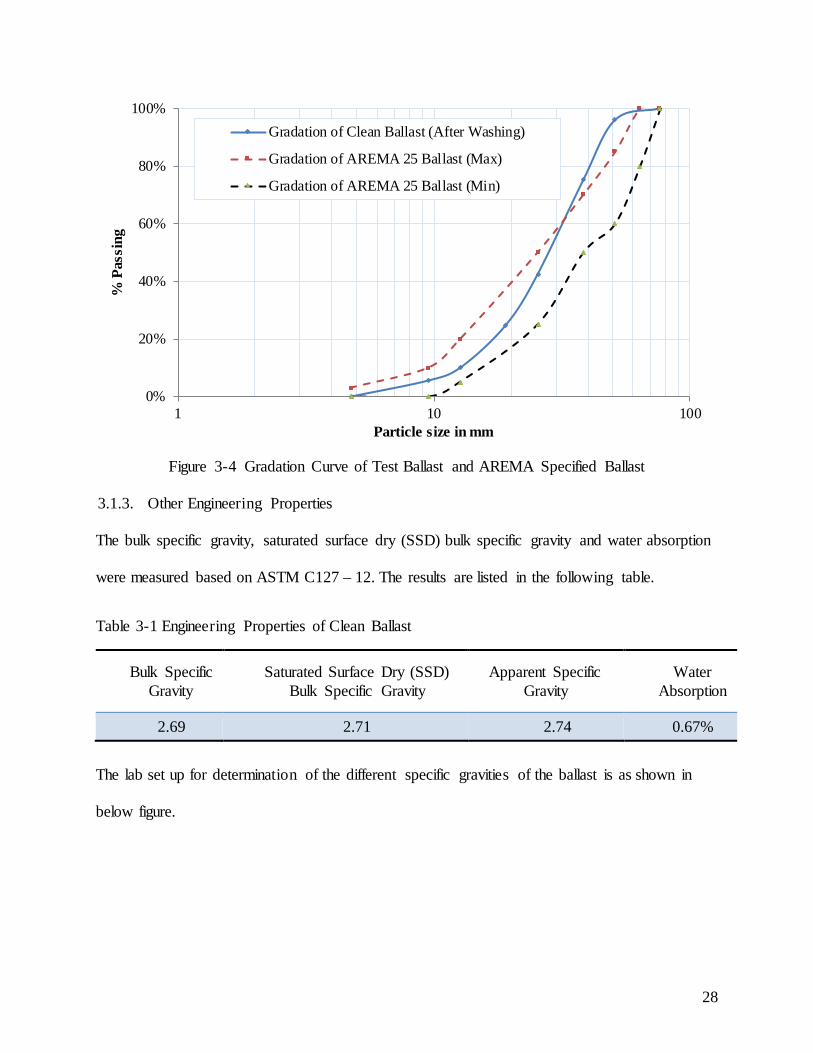
Figure 3-4 Gradation Curve of Test Ballast and AREMA Specified Ballast
3.1.3. Other Engineering Properties
The bulk specific gravity, saturated surface dry (SSD) bulk specific gravity and water absorption
were measured based on ASTM C127 – 12. The results are listed in the following table.
Table 3-1 Engineering Properties of Clean Ballast
Bulk Specific Gravity
Saturated Surface Dry (SSD) Bulk Specific Gravity
Apparent Specific Gravity
Water Absorption
2.69 2.71 2.74 0.67%
The lab set up for determination of the different specific gravities of the ballast is as shown in
below figure.
0%
20%
40%
60%
80%
100%
1 10 100
% P
assi
ng
Particle size in mm
Gradation of Clean Ballast (After Washing)
Gradation of AREMA 25 Ballast (Max)
Gradation of AREMA 25 Ballast (Min)
28
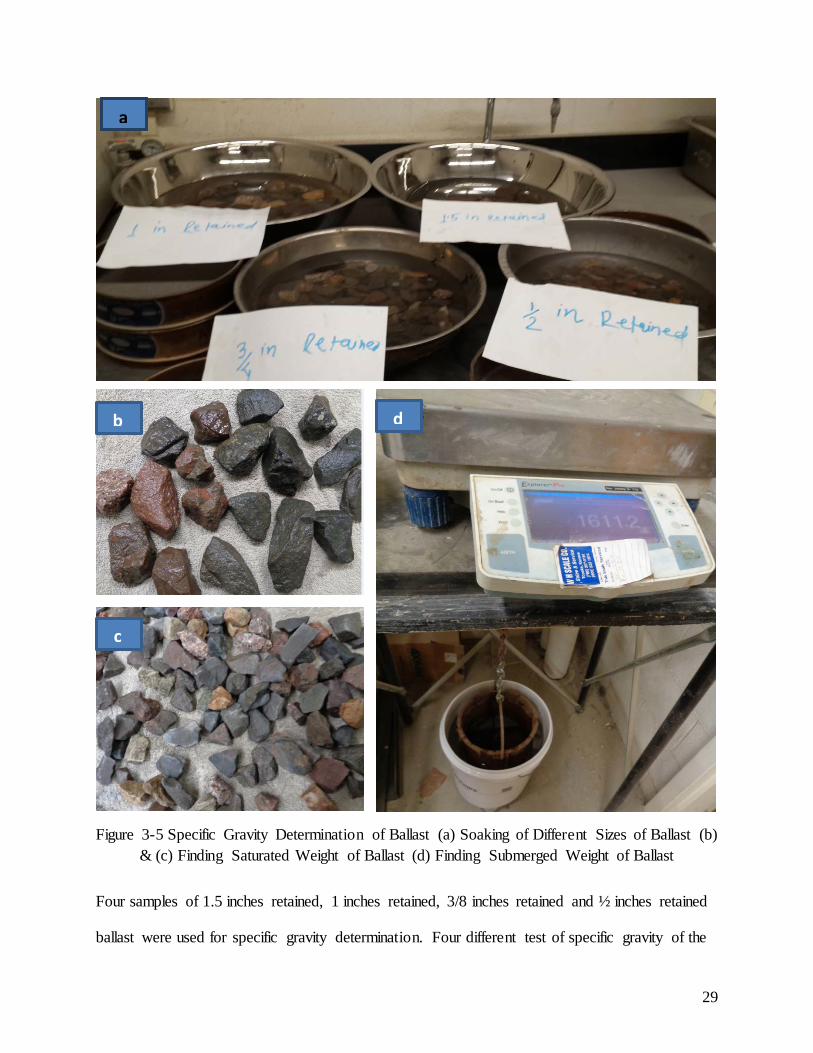
Figure 3-5 Specific Gravity Determination of Ballast (a) Soaking of Different Sizes of Ballast (b) & (c) Finding Saturated Weight of Ballast (d) Finding Submerged Weight of Ballast
Four samples of 1.5 inches retained, 1 inches retained, 3/8 inches retained and ½ inches retained
ballast were used for specific gravity determination. Four different test of specific gravity of the
a
b
c
d
29
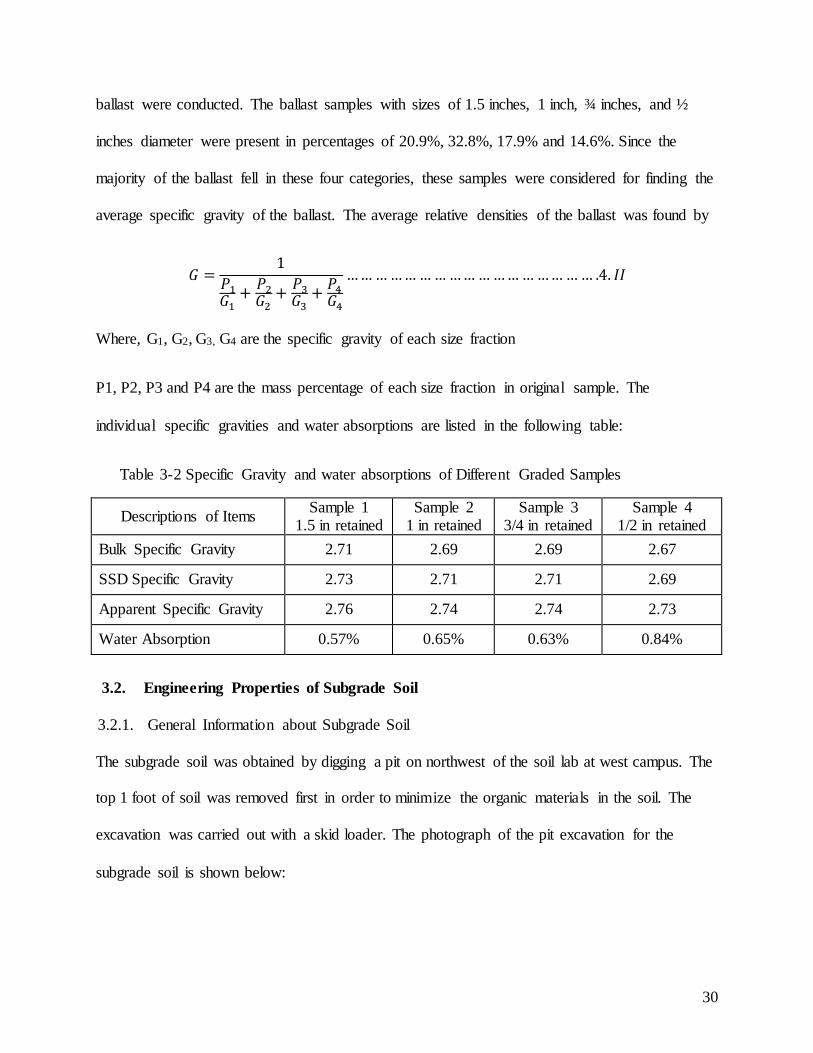
ballast were conducted. The ballast samples with sizes of 1.5 inches, 1 inch, ¾ inches, and ½
inches diameter were present in percentages of 20.9%, 32.8%, 17.9% and 14.6%. Since the
majority of the ballast fell in these four categories, these samples were considered for finding the
average specific gravity of the ballast. The average relative densities of the ballast was found by
𝐺𝐺 =1
𝑃𝑃1𝐺𝐺1
+ 𝑃𝑃2𝐺𝐺2
+ 𝑃𝑃3𝐺𝐺3
+ 𝑃𝑃4𝐺𝐺4
… … … … … … … … … … … … … … … … … .4. 𝐼𝐼𝐼𝐼
Where, G1, G2, G3, G4 are the specific gravity of each size fraction
P1, P2, P3 and P4 are the mass percentage of each size fraction in original sample. The
individual specific gravities and water absorptions are listed in the following table:
Table 3-2 Specific Gravity and water absorptions of Different Graded Samples
Descriptions of Items Sample 1 1.5 in retained
Sample 2 1 in retained
Sample 3 3/4 in retained
Sample 4 1/2 in retained
Bulk Specific Gravity 2.71 2.69 2.69 2.67
SSD Specific Gravity 2.73 2.71 2.71 2.69
Apparent Specific Gravity 2.76 2.74 2.74 2.73
Water Absorption 0.57% 0.65% 0.63% 0.84%
3.2. Engineering Properties of Subgrade Soil
3.2.1. General Information about Subgrade Soil
The subgrade soil was obtained by digging a pit on northwest of the soil lab at west campus. The
top 1 foot of soil was removed first in order to minimize the organic materials in the soil. The
excavation was carried out with a skid loader. The photograph of the pit excavation for the
subgrade soil is shown below:
30
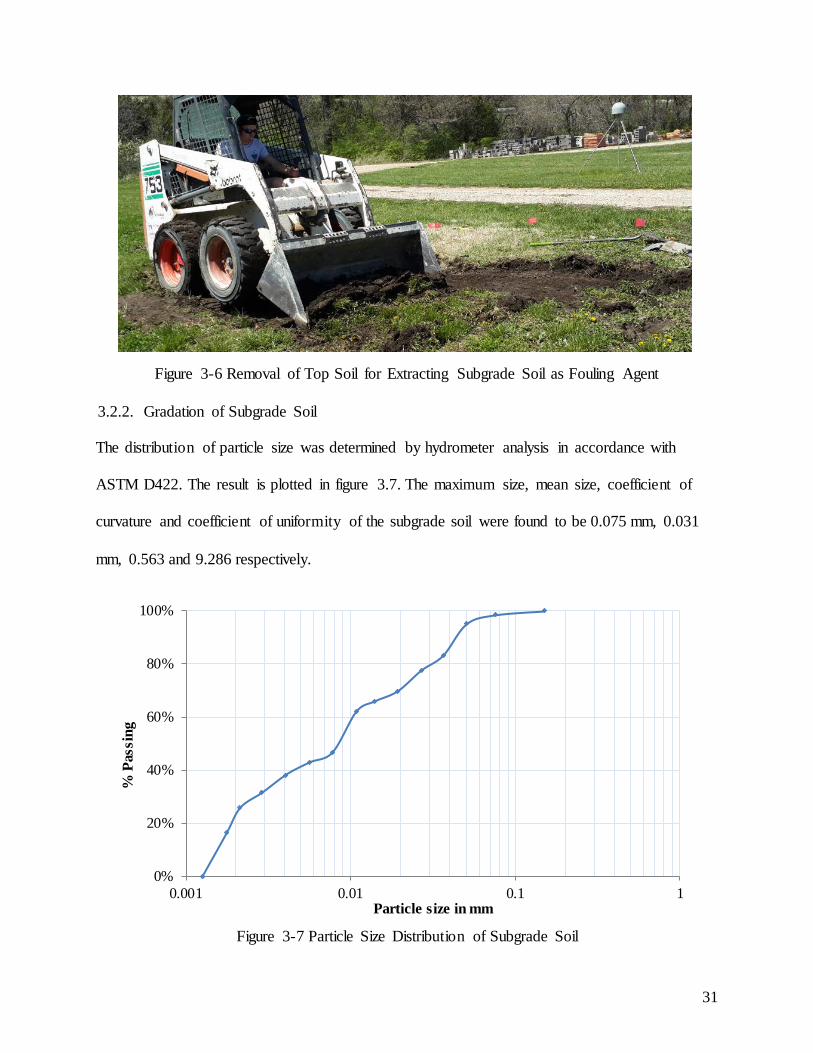
Figure 3-6 Removal of Top Soil for Extracting Subgrade Soil as Fouling Agent
3.2.2. Gradation of Subgrade Soil
The distribution of particle size was determined by hydrometer analysis in accordance with
ASTM D422. The result is plotted in figure 3.7. The maximum size, mean size, coefficient of
curvature and coefficient of uniformity of the subgrade soil were found to be 0.075 mm, 0.031
mm, 0.563 and 9.286 respectively.
Figure 3-7 Particle Size Distribution of Subgrade Soil
0%
20%
40%
60%
80%
100%
0.001 0.01 0.1 1
% P
assi
ng
Particle size in mm
31
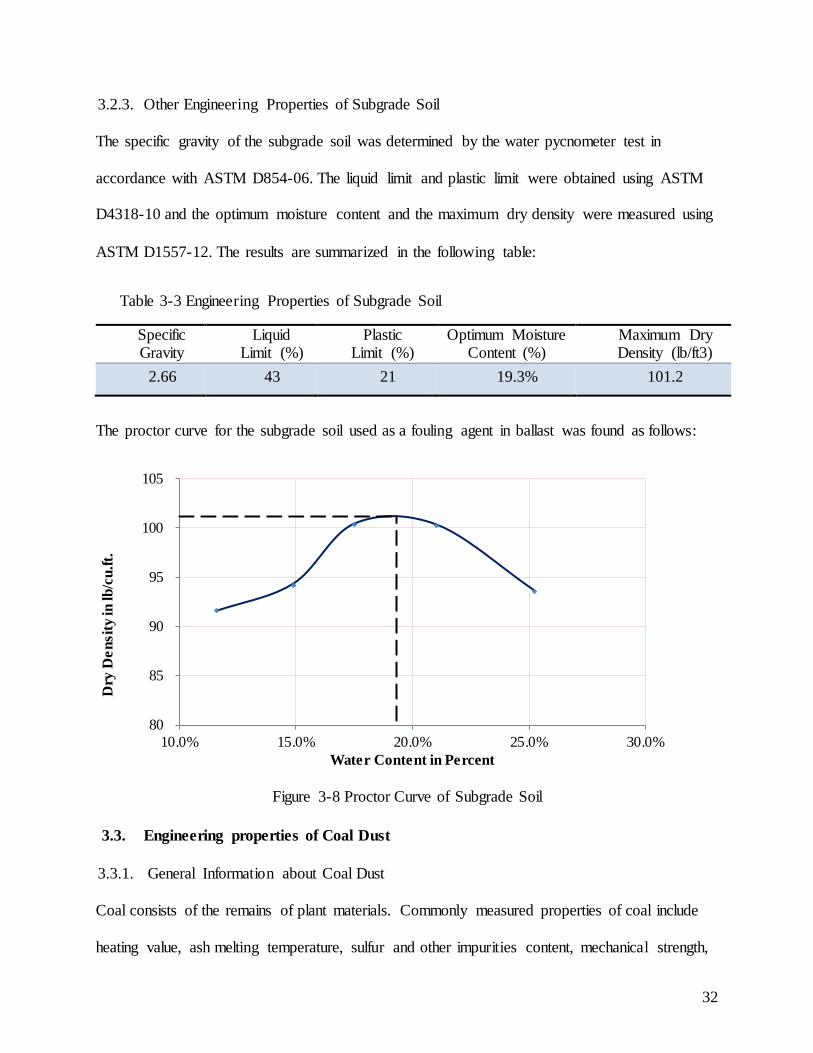
3.2.3. Other Engineering Properties of Subgrade Soil
The specific gravity of the subgrade soil was determined by the water pycnometer test in
accordance with ASTM D854-06. The liquid limit and plastic limit were obtained using ASTM
D4318-10 and the optimum moisture content and the maximum dry density were measured using
ASTM D1557-12. The results are summarized in the following table:
Table 3-3 Engineering Properties of Subgrade Soil
Specific Gravity
Liquid Limit (%)
Plastic Limit (%)
Optimum Moisture Content (%)
Maximum Dry Density (lb/ft3)
2.66 43 21 19.3% 101.2
The proctor curve for the subgrade soil used as a fouling agent in ballast was found as follows:
Figure 3-8 Proctor Curve of Subgrade Soil
3.3. Engineering properties of Coal Dust
3.3.1. General Information about Coal Dust
Coal consists of the remains of plant materials. Commonly measured properties of coal include
heating value, ash melting temperature, sulfur and other impurities content, mechanical strength,
80
85
90
95
100
105
10.0% 15.0% 20.0% 25.0% 30.0%
Dry
Den
sity
in lb
/cu.
ft.
Water Content in Percent
32
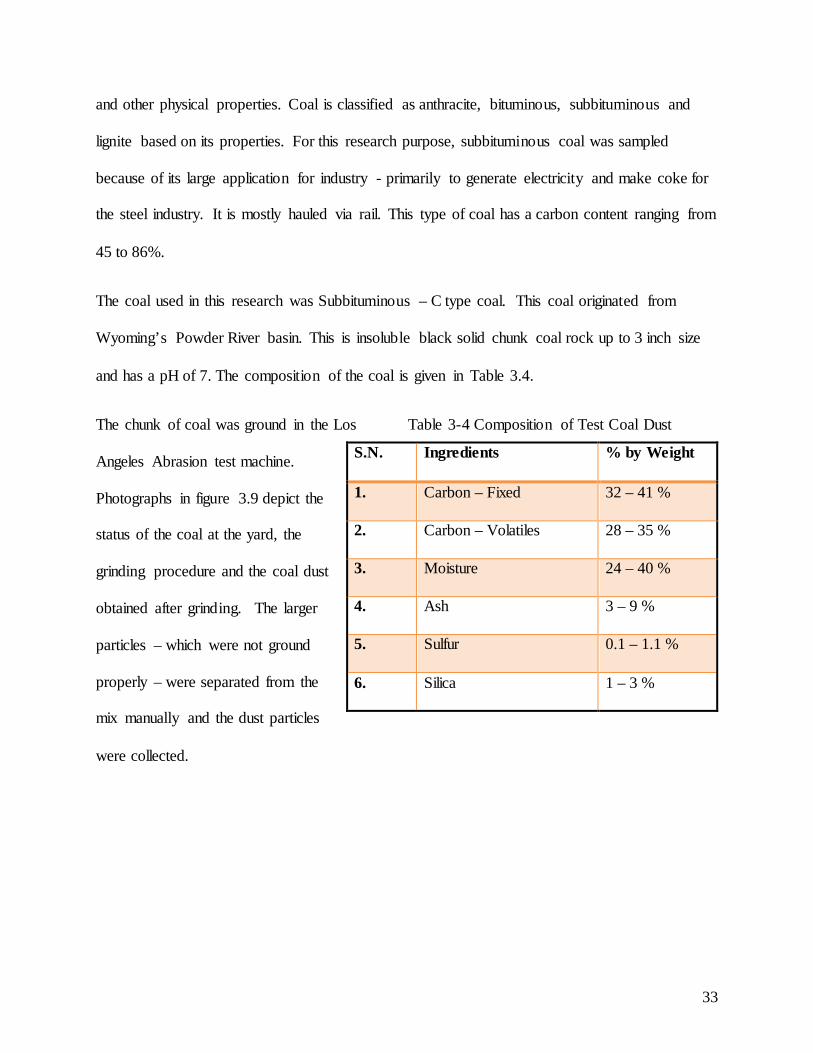
and other physical properties. Coal is classified as anthracite, bituminous, subbituminous and
lignite based on its properties. For this research purpose, subbituminous coal was sampled
because of its large application for industry - primarily to generate electricity and make coke for
the steel industry. It is mostly hauled via rail. This type of coal has a carbon content ranging from
45 to 86%.
The coal used in this research was Subbituminous – C type coal. This coal originated from
Wyoming’s Powder River basin. This is insoluble black solid chunk coal rock up to 3 inch size
and has a pH of 7. The composition of the coal is given in Table 3.4.
The chunk of coal was ground in the Los
Angeles Abrasion test machine.
Photographs in figure 3.9 depict the
status of the coal at the yard, the
grinding procedure and the coal dust
obtained after grinding. The larger
particles – which were not ground
properly – were separated from the
mix manually and the dust particles
were collected.
S.N. Ingredients % by Weight
1. Carbon – Fixed 32 – 41 %
2. Carbon – Volatiles 28 – 35 %
3. Moisture 24 – 40 %
4. Ash 3 – 9 %
5. Sulfur 0.1 – 1.1 %
6. Silica 1 – 3 %
Table 3-4 Composition of Test Coal Dust
33
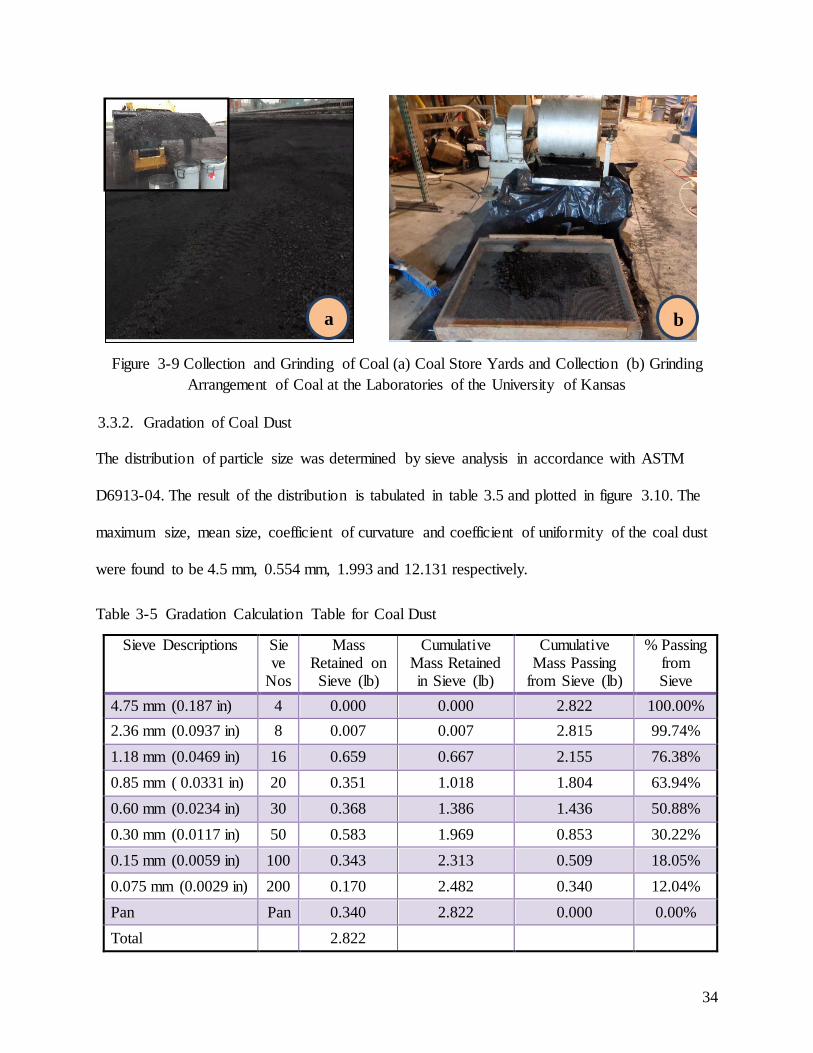
Figure 3-9 Collection and Grinding of Coal (a) Coal Store Yards and Collection (b) Grinding
Arrangement of Coal at the Laboratories of the University of Kansas
3.3.2. Gradation of Coal Dust
The distribution of particle size was determined by sieve analysis in accordance with ASTM
D6913-04. The result of the distribution is tabulated in table 3.5 and plotted in figure 3.10. The
maximum size, mean size, coefficient of curvature and coefficient of uniformity of the coal dust
were found to be 4.5 mm, 0.554 mm, 1.993 and 12.131 respectively.
Table 3-5 Gradation Calculation Table for Coal Dust
Sieve Descriptions Sieve
Nos
Mass Retained on Sieve (lb)
Cumulative Mass Retained in Sieve (lb)
Cumulative Mass Passing
from Sieve (lb)
% Passing from Sieve
4.75 mm (0.187 in) 4 0.000 0.000 2.822 100.00% 2.36 mm (0.0937 in) 8 0.007 0.007 2.815 99.74% 1.18 mm (0.0469 in) 16 0.659 0.667 2.155 76.38% 0.85 mm ( 0.0331 in) 20 0.351 1.018 1.804 63.94% 0.60 mm (0.0234 in) 30 0.368 1.386 1.436 50.88% 0.30 mm (0.0117 in) 50 0.583 1.969 0.853 30.22% 0.15 mm (0.0059 in) 100 0.343 2.313 0.509 18.05% 0.075 mm (0.0029 in) 200 0.170 2.482 0.340 12.04% Pan Pan 0.340 2.822 0.000 0.00% Total 2.822
a b
34
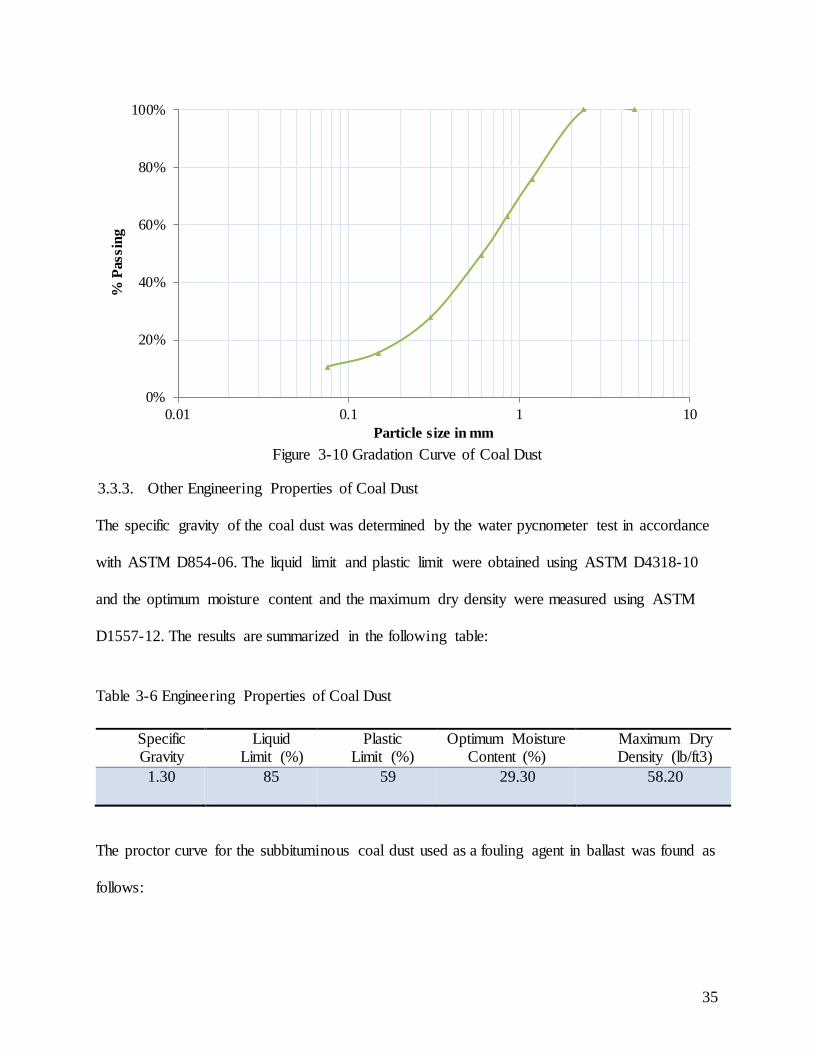
Figure 3-10 Gradation Curve of Coal Dust
3.3.3. Other Engineering Properties of Coal Dust
The specific gravity of the coal dust was determined by the water pycnometer test in accordance
with ASTM D854-06. The liquid limit and plastic limit were obtained using ASTM D4318-10
and the optimum moisture content and the maximum dry density were measured using ASTM
D1557-12. The results are summarized in the following table:
Table 3-6 Engineering Properties of Coal Dust
Specific Gravity
Liquid Limit (%)
Plastic Limit (%)
Optimum Moisture Content (%)
Maximum Dry Density (lb/ft3)
1.30 85 59 29.30 58.20
The proctor curve for the subbituminous coal dust used as a fouling agent in ballast was found as
follows:
0%
20%
40%
60%
80%
100%
0.01 0.1 1 10
% P
assi
ng
Particle size in mm
35
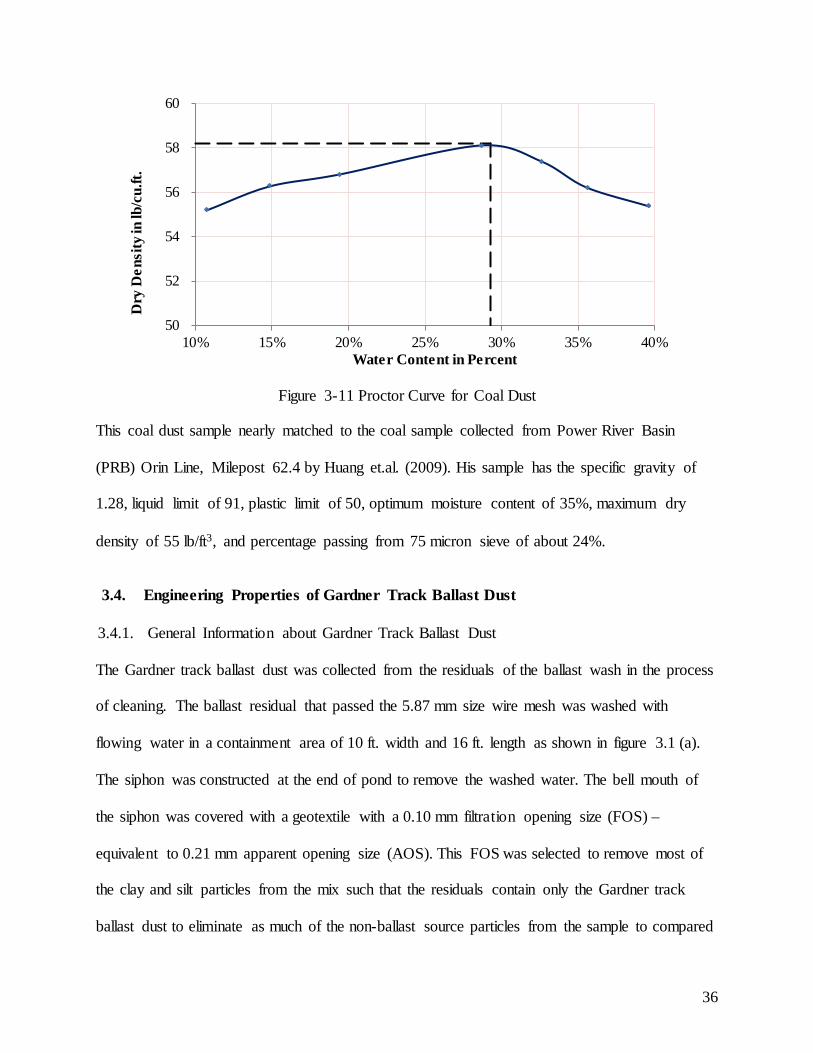
Figure 3-11 Proctor Curve for Coal Dust
This coal dust sample nearly matched to the coal sample collected from Power River Basin
(PRB) Orin Line, Milepost 62.4 by Huang et.al. (2009). His sample has the specific gravity of
1.28, liquid limit of 91, plastic limit of 50, optimum moisture content of 35%, maximum dry
density of 55 lb/ft3, and percentage passing from 75 micron sieve of about 24%.
3.4. Engineering Properties of Gardner Track Ballast Dust
3.4.1. General Information about Gardner Track Ballast Dust
The Gardner track ballast dust was collected from the residuals of the ballast wash in the process
of cleaning. The ballast residual that passed the 5.87 mm size wire mesh was washed with
flowing water in a containment area of 10 ft. width and 16 ft. length as shown in figure 3.1 (a).
The siphon was constructed at the end of pond to remove the washed water. The bell mouth of
the siphon was covered with a geotextile with a 0.10 mm filtration opening size (FOS) –
equivalent to 0.21 mm apparent opening size (AOS). This FOS was selected to remove most of
the clay and silt particles from the mix such that the residuals contain only the Gardner track
ballast dust to eliminate as much of the non-ballast source particles from the sample to compared
50
52
54
56
58
60
10% 15% 20% 25% 30% 35% 40%
Dry
Den
sity
in lb
/cu.
ft.
Water Content in Percent
36
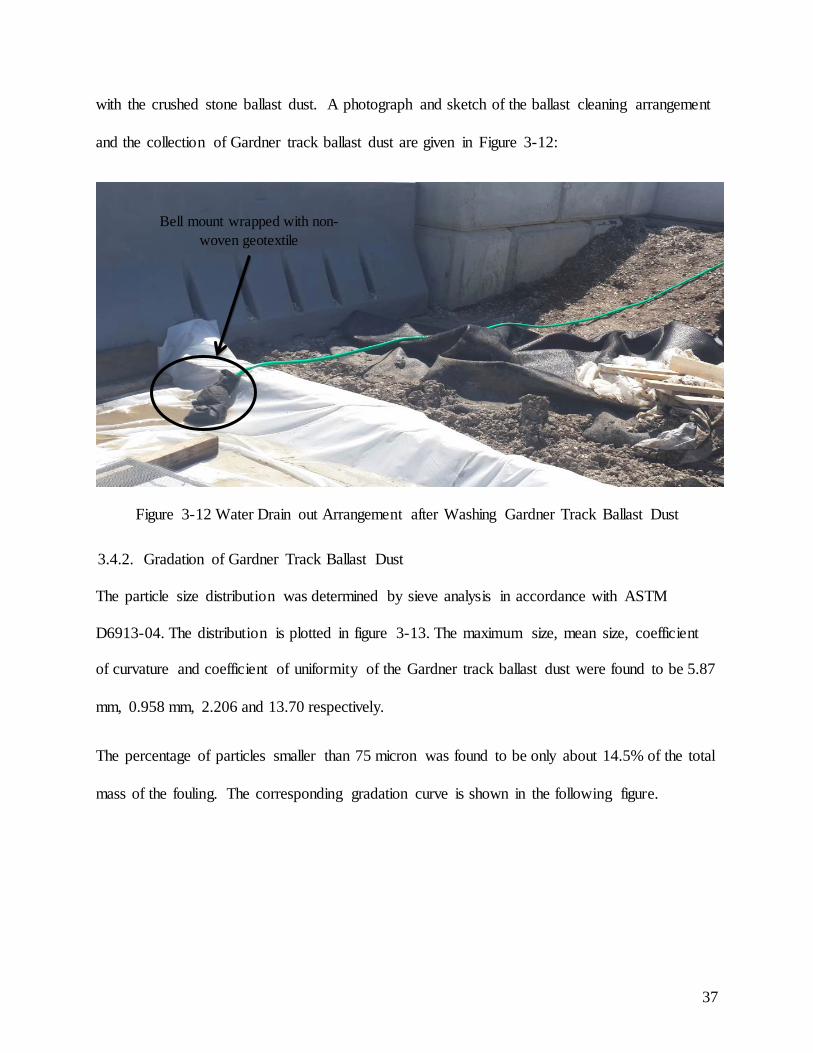
with the crushed stone ballast dust. A photograph and sketch of the ballast cleaning arrangement
and the collection of Gardner track ballast dust are given in Figure 3-12:
Figure 3-12 Water Drain out Arrangement after Washing Gardner Track Ballast Dust
3.4.2. Gradation of Gardner Track Ballast Dust
The particle size distribution was determined by sieve analysis in accordance with ASTM
D6913-04. The distribution is plotted in figure 3-13. The maximum size, mean size, coefficient
of curvature and coefficient of uniformity of the Gardner track ballast dust were found to be 5.87
mm, 0.958 mm, 2.206 and 13.70 respectively.
The percentage of particles smaller than 75 micron was found to be only about 14.5% of the total
mass of the fouling. The corresponding gradation curve is shown in the following figure.
Bell mount wrapped with non-woven geotextile
37
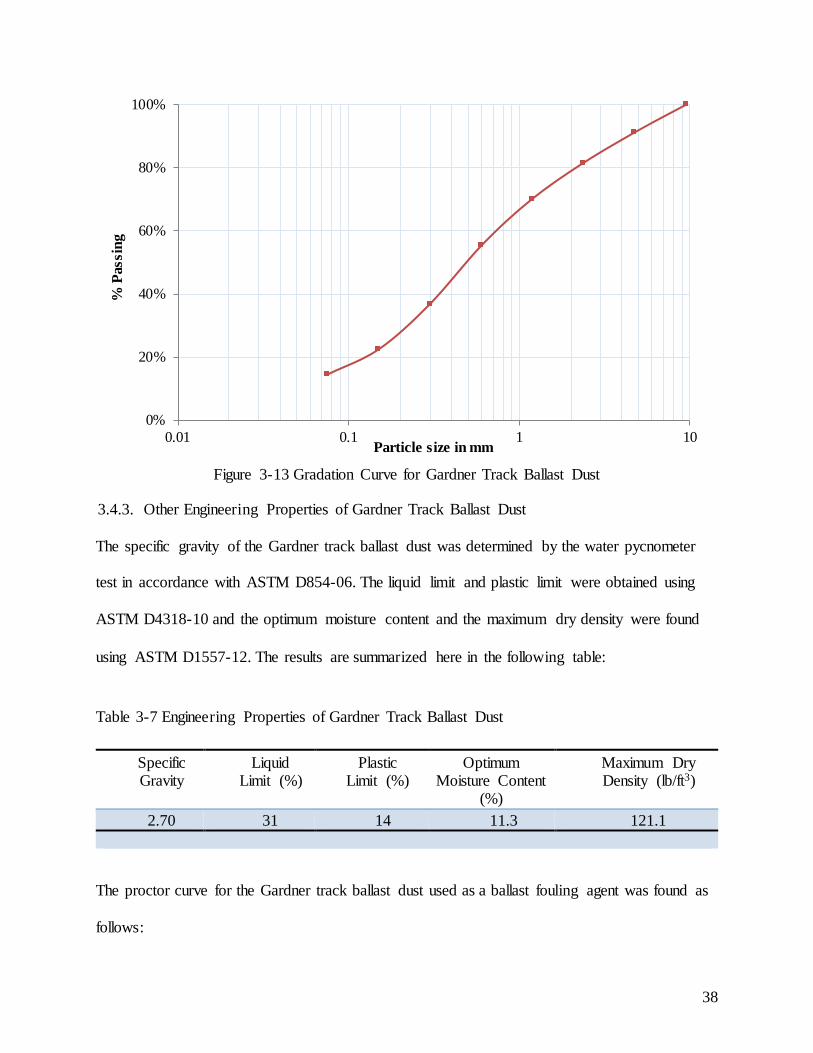
Figure 3-13 Gradation Curve for Gardner Track Ballast Dust
3.4.3. Other Engineering Properties of Gardner Track Ballast Dust
The specific gravity of the Gardner track ballast dust was determined by the water pycnometer
test in accordance with ASTM D854-06. The liquid limit and plastic limit were obtained using
ASTM D4318-10 and the optimum moisture content and the maximum dry density were found
using ASTM D1557-12. The results are summarized here in the following table:
Table 3-7 Engineering Properties of Gardner Track Ballast Dust
Specific Gravity
Liquid Limit (%)
Plastic Limit (%)
Optimum Moisture Content
(%)
Maximum Dry Density (lb/ft3)
2.70 31 14 11.3 121.1
The proctor curve for the Gardner track ballast dust used as a ballast fouling agent was found as
follows:
0%
20%
40%
60%
80%
100%
0.01 0.1 1 10
% P
assi
ng
Particle size in mm
38
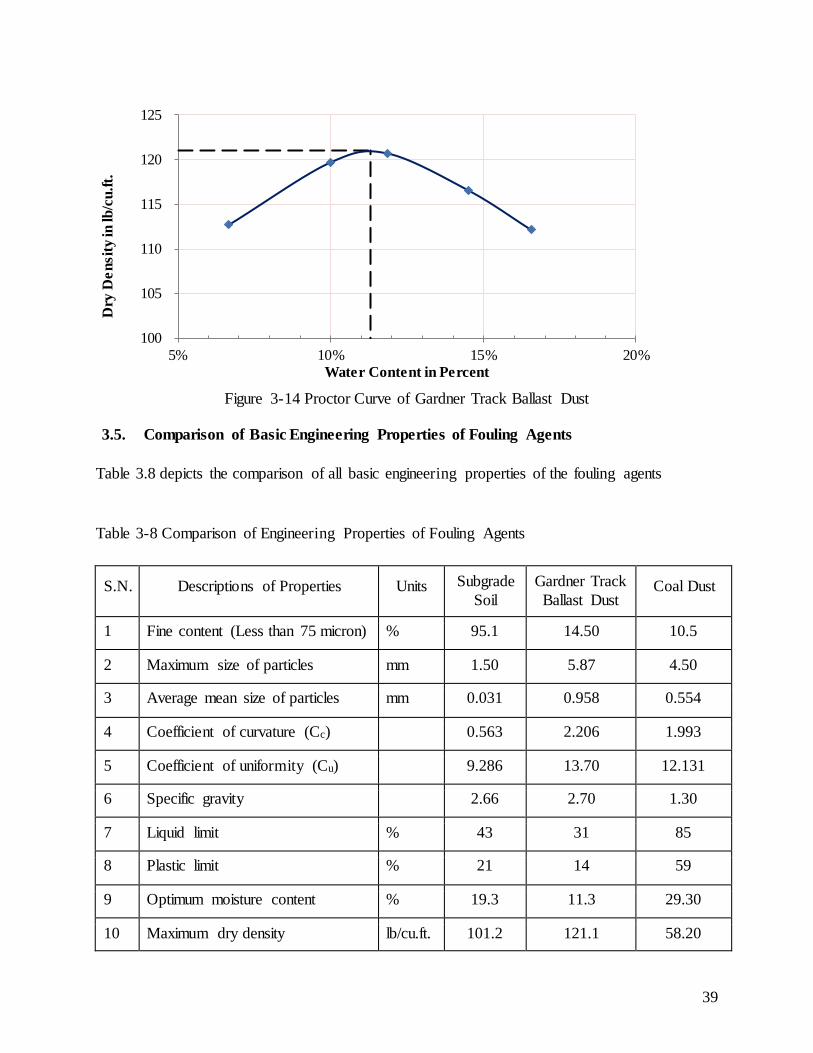
Figure 3-14 Proctor Curve of Gardner Track Ballast Dust
3.5. Comparison of Basic Engineering Properties of Fouling Agents
Table 3.8 depicts the comparison of all basic engineering properties of the fouling agents
Table 3-8 Comparison of Engineering Properties of Fouling Agents
S.N. Descriptions of Properties Units Subgrade Soil
Gardner Track Ballast Dust
Coal Dust
1 Fine content (Less than 75 micron) % 95.1 14.50 10.5
2 Maximum size of particles mm 1.50 5.87 4.50
3 Average mean size of particles mm 0.031 0.958 0.554
4 Coefficient of curvature (Cc) 0.563 2.206 1.993
5 Coefficient of uniformity (Cu) 9.286 13.70 12.131
6 Specific gravity 2.66 2.70 1.30
7 Liquid limit % 43 31 85
8 Plastic limit % 21 14 59
9 Optimum moisture content % 19.3 11.3 29.30
10 Maximum dry density lb/cu.ft. 101.2 121.1 58.20
100
105
110
115
120
125
5% 10% 15% 20%
Dry
Den
sity
in lb
/cu.
ft.
Water Content in Percent
39
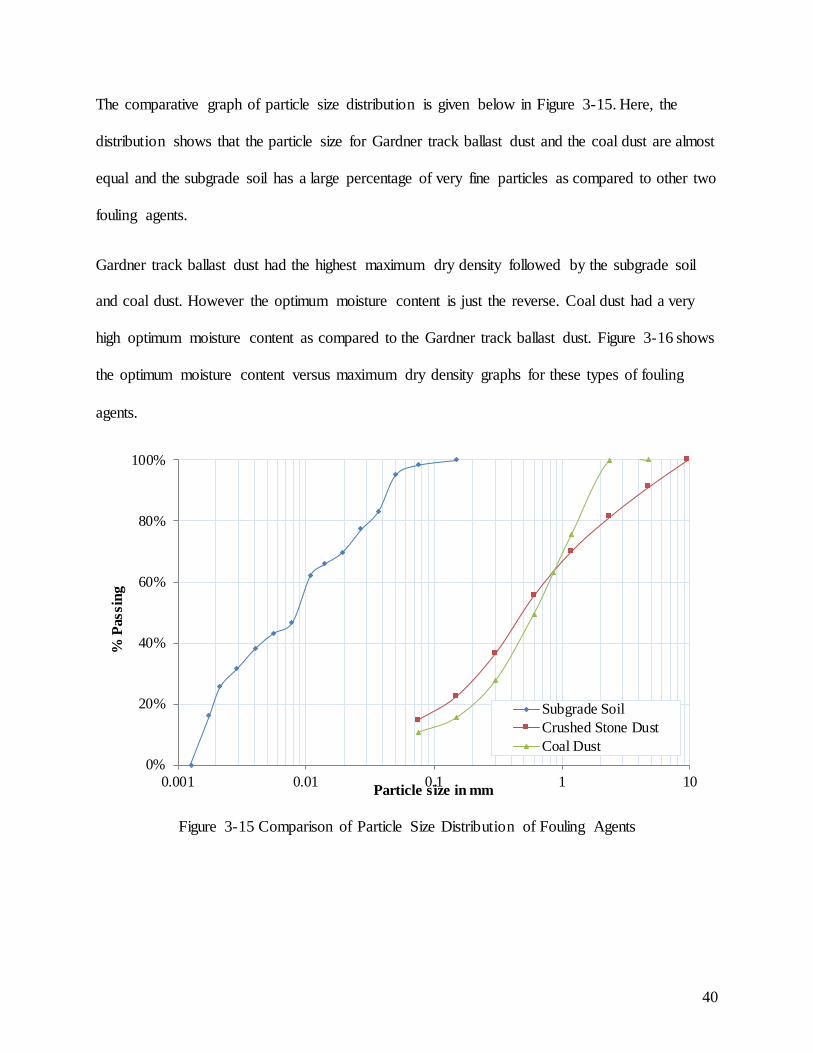
The comparative graph of particle size distribution is given below in Figure 3-15. Here, the
distribution shows that the particle size for Gardner track ballast dust and the coal dust are almost
equal and the subgrade soil has a large percentage of very fine particles as compared to other two
fouling agents.
Gardner track ballast dust had the highest maximum dry density followed by the subgrade soil
and coal dust. However the optimum moisture content is just the reverse. Coal dust had a very
high optimum moisture content as compared to the Gardner track ballast dust. Figure 3-16 shows
the optimum moisture content versus maximum dry density graphs for these types of fouling
agents.
Figure 3-15 Comparison of Particle Size Distribution of Fouling Agents
0%
20%
40%
60%
80%
100%
0.001 0.01 0.1 1 10
% P
assi
ng
Particle size in mm
Subgrade SoilCrushed Stone DustCoal Dust
40
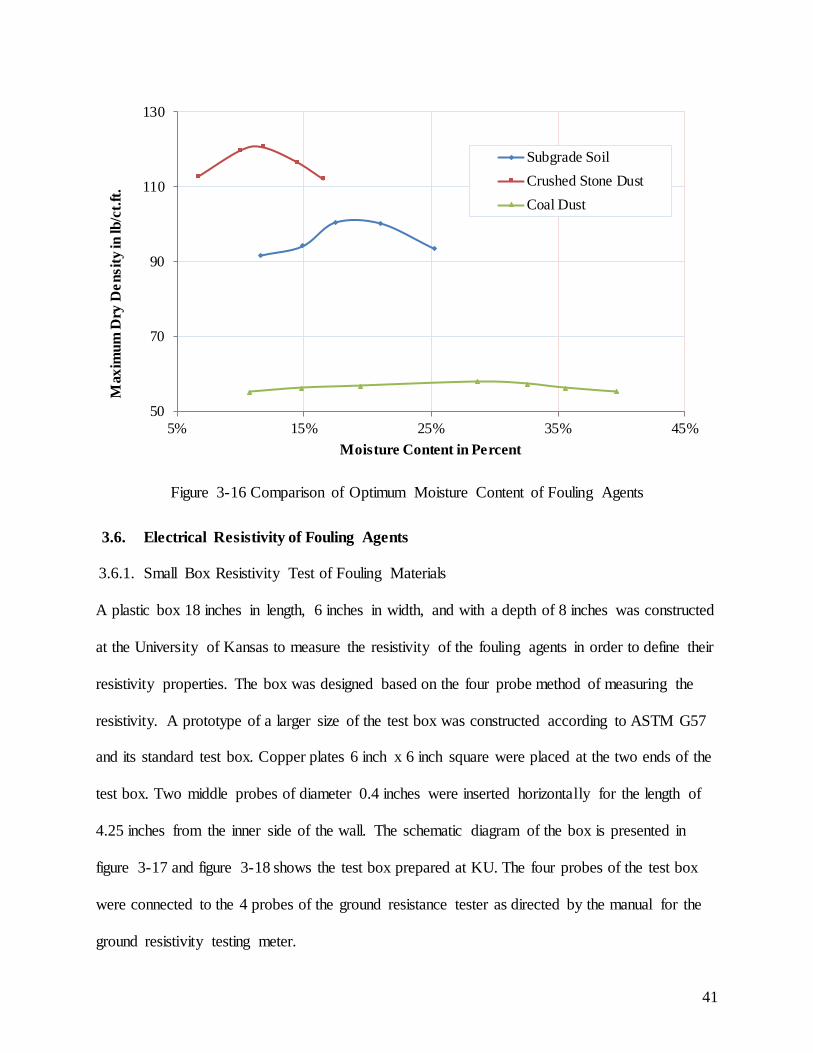
Figure 3-16 Comparison of Optimum Moisture Content of Fouling Agents
3.6. Electrical Resistivity of Fouling Agents
3.6.1. Small Box Resistivity Test of Fouling Materials
A plastic box 18 inches in length, 6 inches in width, and with a depth of 8 inches was constructed
at the University of Kansas to measure the resistivity of the fouling agents in order to define their
resistivity properties. The box was designed based on the four probe method of measuring the
resistivity. A prototype of a larger size of the test box was constructed according to ASTM G57
and its standard test box. Copper plates 6 inch x 6 inch square were placed at the two ends of the
test box. Two middle probes of diameter 0.4 inches were inserted horizontally for the length of
4.25 inches from the inner side of the wall. The schematic diagram of the box is presented in
figure 3-17 and figure 3-18 shows the test box prepared at KU. The four probes of the test box
were connected to the 4 probes of the ground resistance tester as directed by the manual for the
ground resistivity testing meter.
50
70
90
110
130
5% 15% 25% 35% 45%
Max
imum
Dry
Den
sity
in lb
/ct.f
t.
Moisture Content in Percent
Subgrade SoilCrushed Stone DustCoal Dust
41
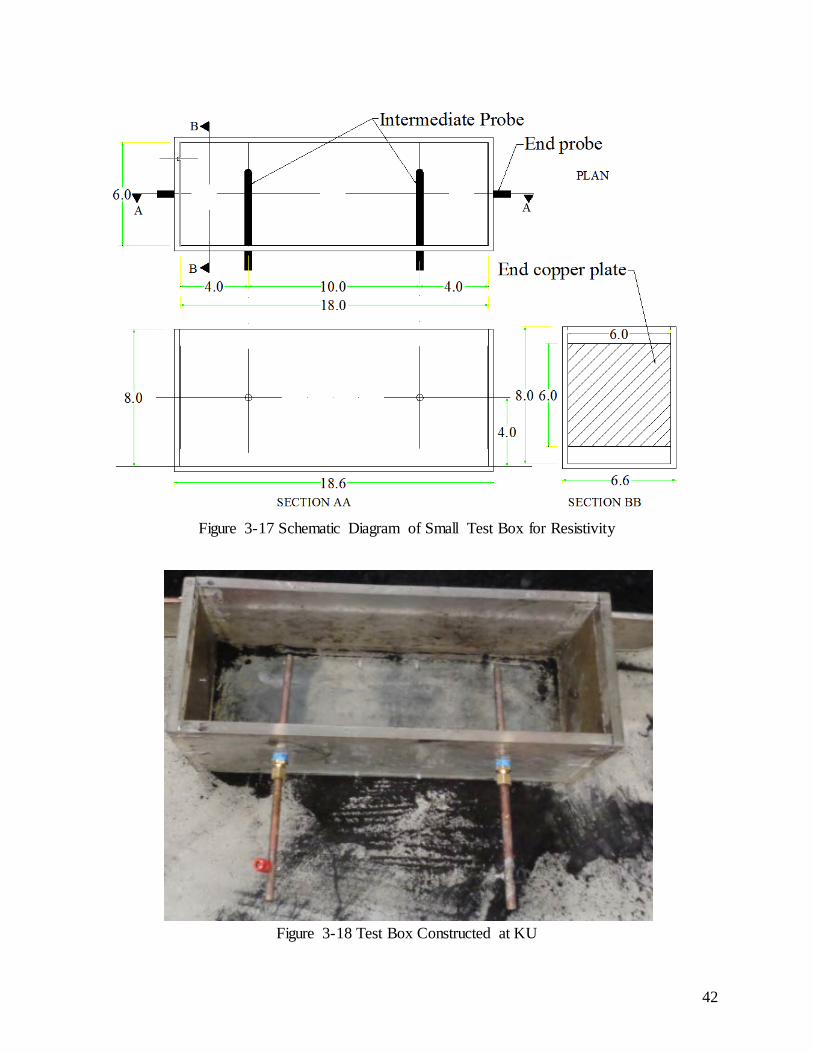
Figure 3-17 Schematic Diagram of Small Test Box for Resistivity
Figure 3-18 Test Box Constructed at KU
42
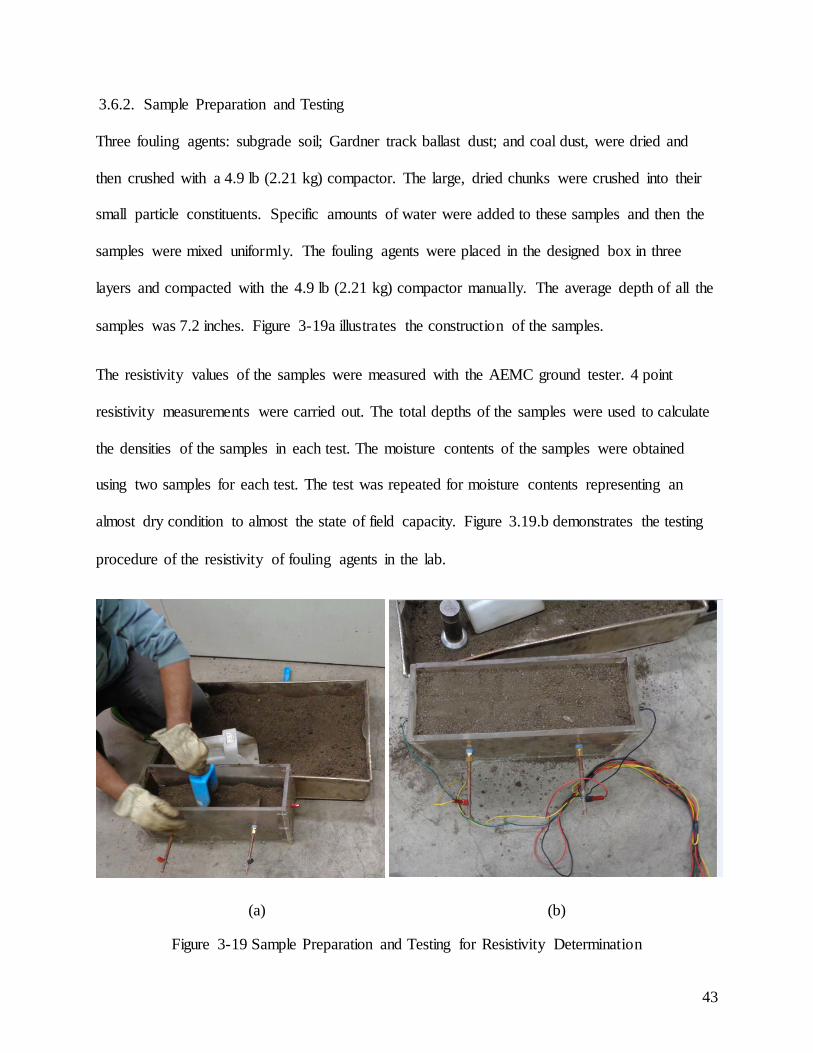
3.6.2. Sample Preparation and Testing
Three fouling agents: subgrade soil; Gardner track ballast dust; and coal dust, were dried and
then crushed with a 4.9 lb (2.21 kg) compactor. The large, dried chunks were crushed into their
small particle constituents. Specific amounts of water were added to these samples and then the
samples were mixed uniformly. The fouling agents were placed in the designed box in three
layers and compacted with the 4.9 lb (2.21 kg) compactor manually. The average depth of all the
samples was 7.2 inches. Figure 3-19a illustrates the construction of the samples.
The resistivity values of the samples were measured with the AEMC ground tester. 4 point
resistivity measurements were carried out. The total depths of the samples were used to calculate
the densities of the samples in each test. The moisture contents of the samples were obtained
using two samples for each test. The test was repeated for moisture contents representing an
almost dry condition to almost the state of field capacity. Figure 3.19.b demonstrates the testing
procedure of the resistivity of fouling agents in the lab.
(a) (b)
Figure 3-19 Sample Preparation and Testing for Resistivity Determination
43
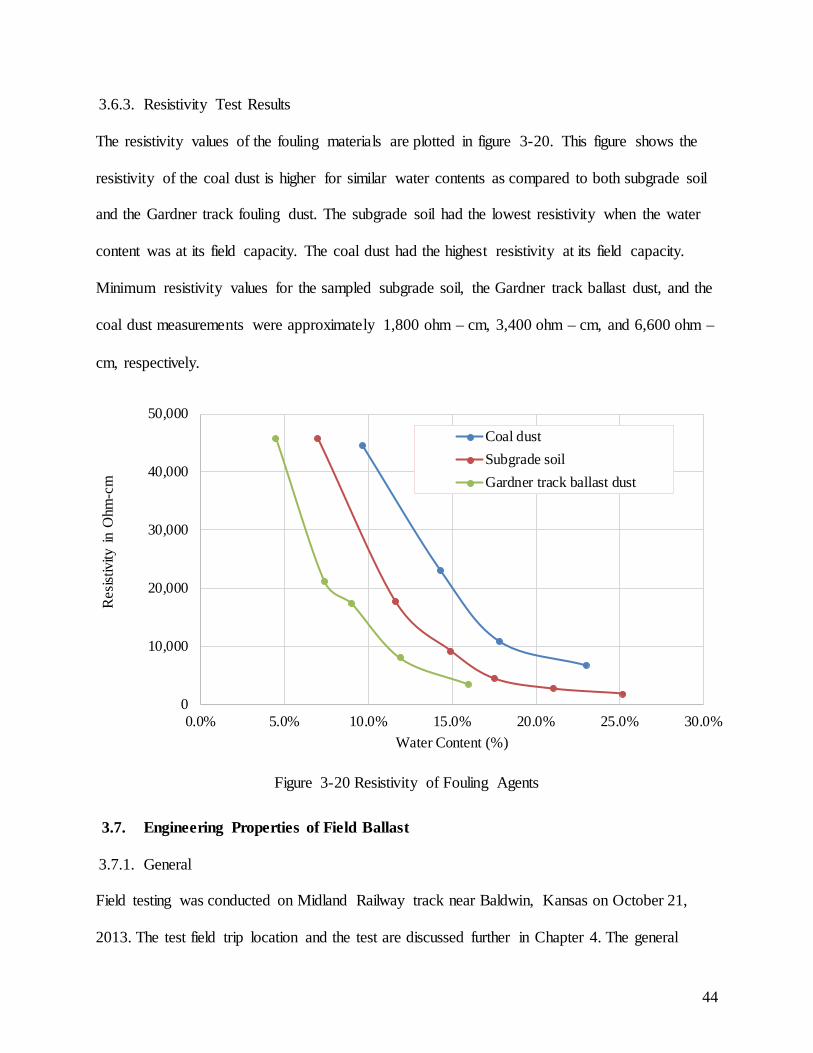
3.6.3. Resistivity Test Results
The resistivity values of the fouling materials are plotted in figure 3-20. This figure shows the
resistivity of the coal dust is higher for similar water contents as compared to both subgrade soil
and the Gardner track fouling dust. The subgrade soil had the lowest resistivity when the water
content was at its field capacity. The coal dust had the highest resistivity at its field capacity.
Minimum resistivity values for the sampled subgrade soil, the Gardner track ballast dust, and the
coal dust measurements were approximately 1,800 ohm – cm, 3,400 ohm – cm, and 6,600 ohm –
cm, respectively.
Figure 3-20 Resistivity of Fouling Agents
3.7. Engineering Properties of Field Ballast
3.7.1. General
Field testing was conducted on Midland Railway track near Baldwin, Kansas on October 21,
2013. The test field trip location and the test are discussed further in Chapter 4. The general
0
10,000
20,000
30,000
40,000
50,000
0.0% 5.0% 10.0% 15.0% 20.0% 25.0% 30.0%
Res
istiv
ity in
Ohm
-cm
Water Content (%)
Coal dustSubgrade soilGardner track ballast dust
44
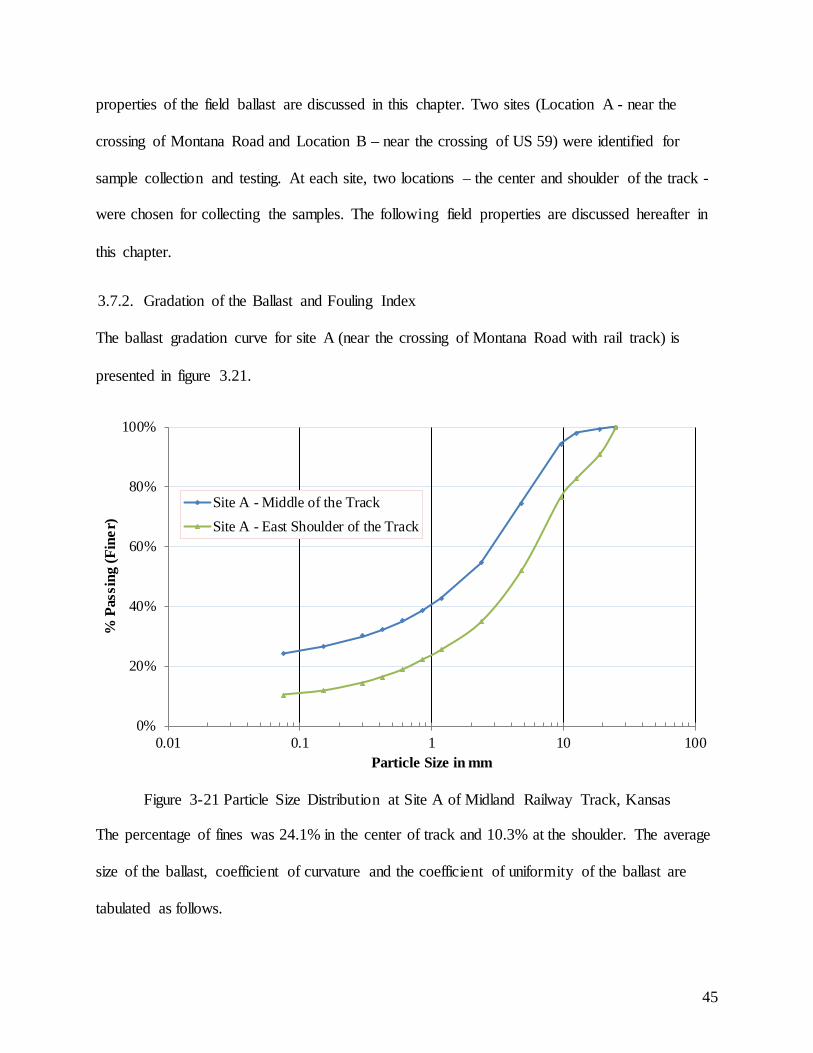
properties of the field ballast are discussed in this chapter. Two sites (Location A - near the
crossing of Montana Road and Location B – near the crossing of US 59) were identified for
sample collection and testing. At each site, two locations – the center and shoulder of the track -
were chosen for collecting the samples. The following field properties are discussed hereafter in
this chapter.
3.7.2. Gradation of the Ballast and Fouling Index
The ballast gradation curve for site A (near the crossing of Montana Road with rail track) is
presented in figure 3.21.
Figure 3-21 Particle Size Distribution at Site A of Midland Railway Track, Kansas
The percentage of fines was 24.1% in the center of track and 10.3% at the shoulder. The average
size of the ballast, coefficient of curvature and the coefficient of uniformity of the ballast are
tabulated as follows.
0%
20%
40%
60%
80%
100%
0.01 0.1 1 10 100
% P
assi
ng (F
iner
)
Particle Size in mm
Site A - Middle of the TrackSite A - East Shoulder of the Track
45
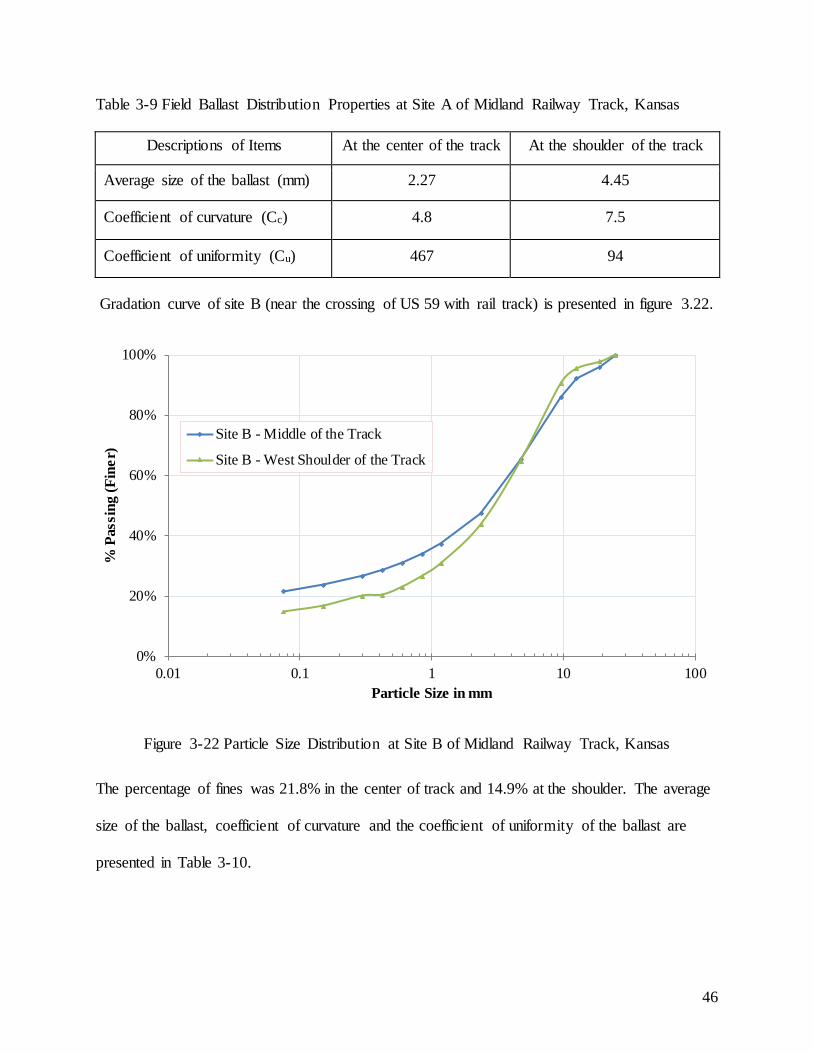
Table 3-9 Field Ballast Distribution Properties at Site A of Midland Railway Track, Kansas
Descriptions of Items At the center of the track At the shoulder of the track
Average size of the ballast (mm) 2.27 4.45
Coefficient of curvature (Cc) 4.8 7.5
Coefficient of uniformity (Cu) 467 94
Gradation curve of site B (near the crossing of US 59 with rail track) is presented in figure 3.22.
Figure 3-22 Particle Size Distribution at Site B of Midland Railway Track, Kansas
The percentage of fines was 21.8% in the center of track and 14.9% at the shoulder. The average
size of the ballast, coefficient of curvature and the coefficient of uniformity of the ballast are
presented in Table 3-10.
0%
20%
40%
60%
80%
100%
0.01 0.1 1 10 100
% P
assi
ng (F
iner
)
Particle Size in mm
Site B - Middle of the Track
Site B - West Shoulder of the Track
46
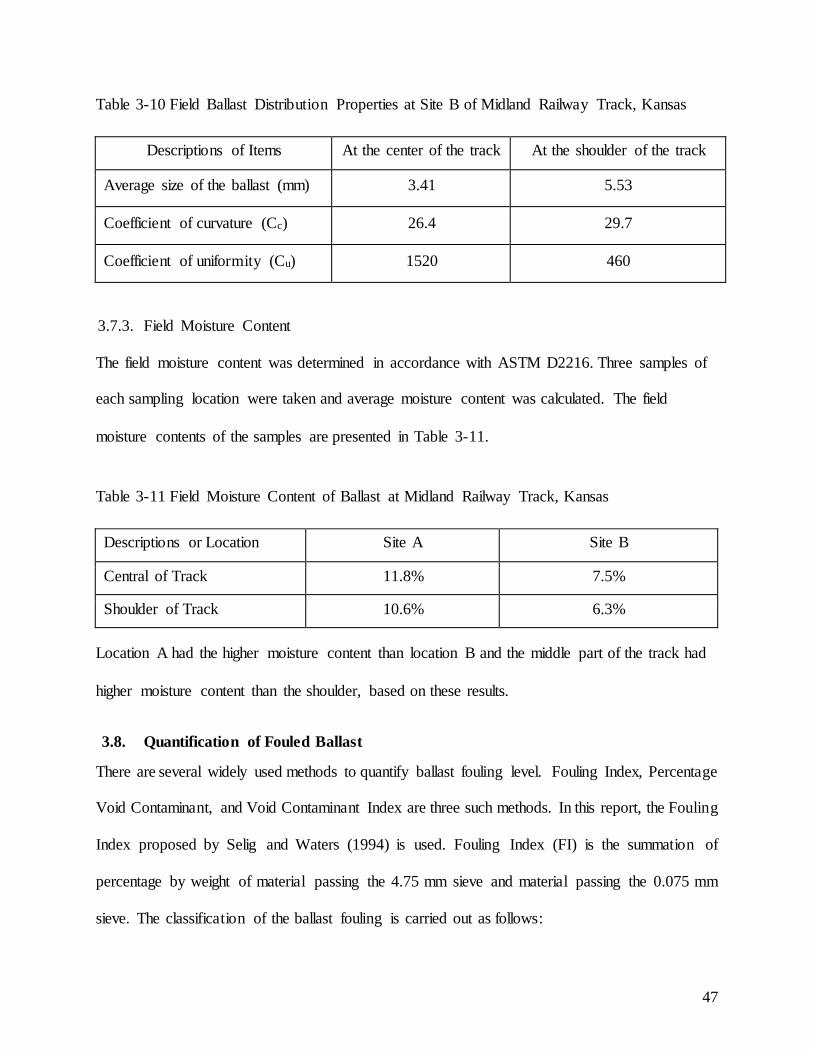
Table 3-10 Field Ballast Distribution Properties at Site B of Midland Railway Track, Kansas
Descriptions of Items At the center of the track At the shoulder of the track
Average size of the ballast (mm) 3.41 5.53
Coefficient of curvature (Cc) 26.4 29.7
Coefficient of uniformity (Cu) 1520 460
3.7.3. Field Moisture Content
The field moisture content was determined in accordance with ASTM D2216. Three samples of
each sampling location were taken and average moisture content was calculated. The field
moisture contents of the samples are presented in Table 3-11.
Table 3-11 Field Moisture Content of Ballast at Midland Railway Track, Kansas
Descriptions or Location Site A Site B
Central of Track 11.8% 7.5%
Shoulder of Track 10.6% 6.3%
Location A had the higher moisture content than location B and the middle part of the track had
higher moisture content than the shoulder, based on these results.
3.8. Quantification of Fouled Ballast
There are several widely used methods to quantify ballast fouling level. Fouling Index, Percentage
Void Contaminant, and Void Contaminant Index are three such methods. In this report, the Fouling
Index proposed by Selig and Waters (1994) is used. Fouling Index (FI) is the summation of
percentage by weight of material passing the 4.75 mm sieve and material passing the 0.075 mm
sieve. The classification of the ballast fouling is carried out as follows:
47
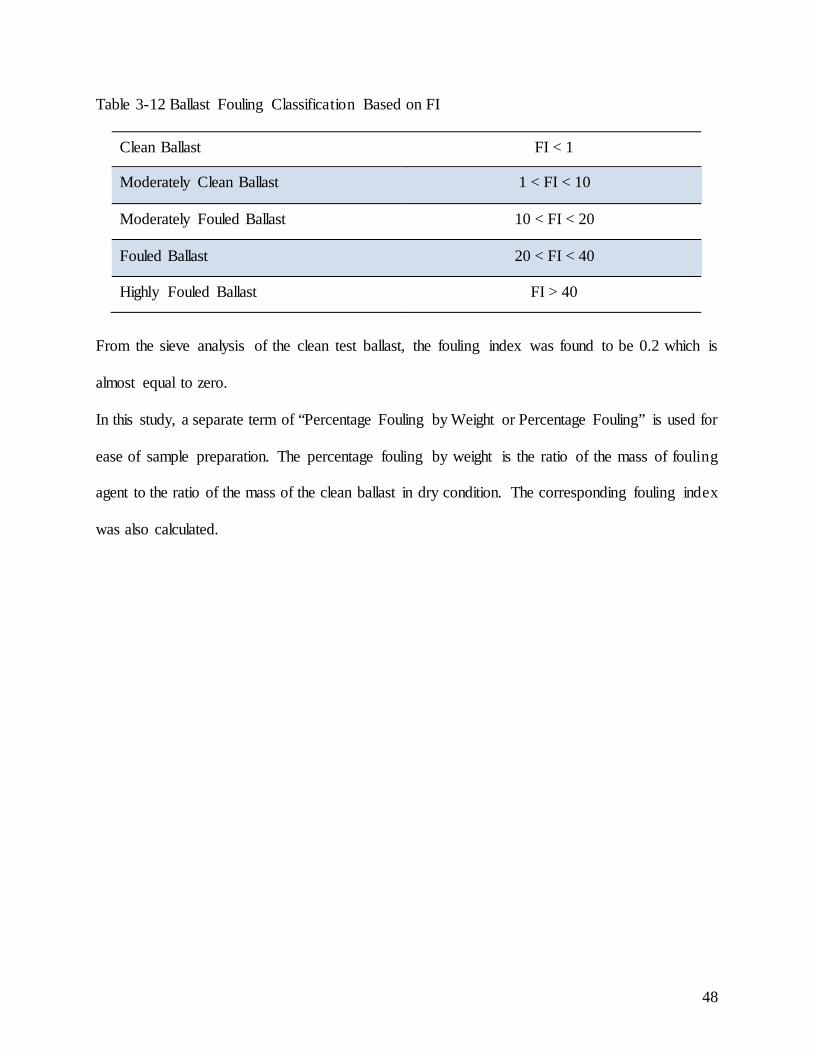
Table 3-12 Ballast Fouling Classification Based on FI
Clean Ballast FI < 1
Moderately Clean Ballast 1 < FI < 10
Moderately Fouled Ballast 10 < FI < 20
Fouled Ballast 20 < FI < 40
Highly Fouled Ballast FI > 40
From the sieve analysis of the clean test ballast, the fouling index was found to be 0.2 which is
almost equal to zero.
In this study, a separate term of “Percentage Fouling by Weight or Percentage Fouling” is used for
ease of sample preparation. The percentage fouling by weight is the ratio of the mass of fouling
agent to the ratio of the mass of the clean ballast in dry condition. The corresponding fouling index
was also calculated.
48
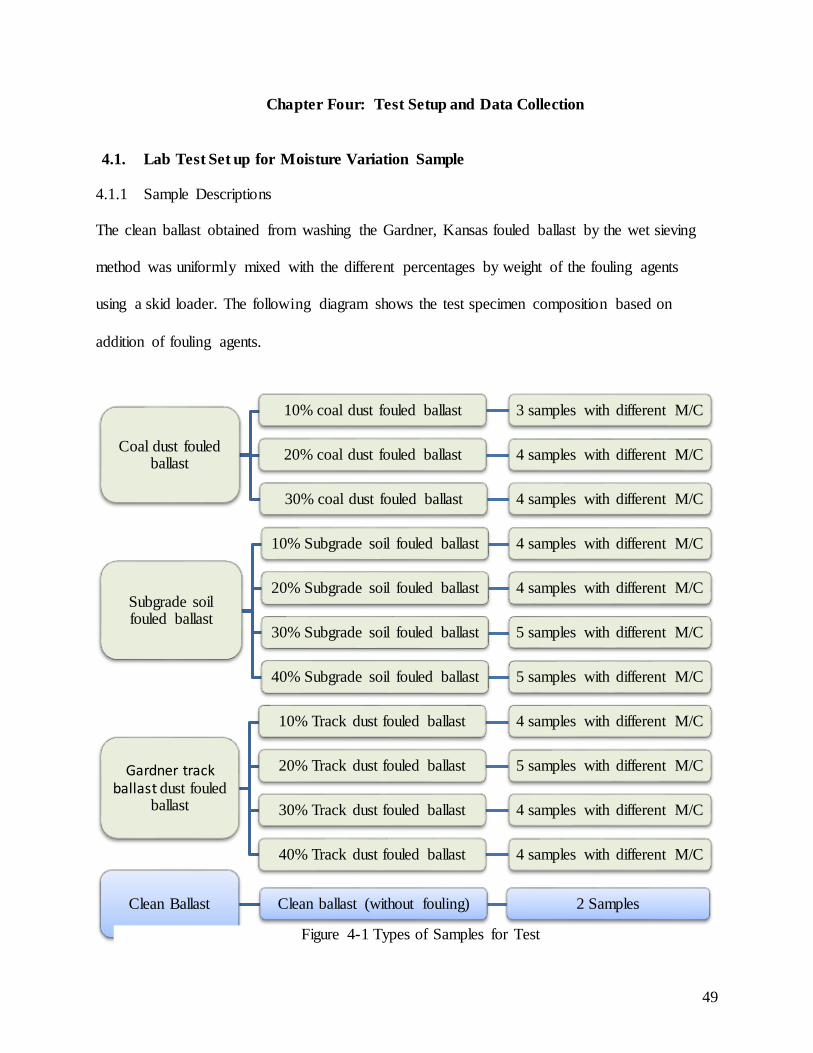
Chapter Four: Test Setup and Data Collection
4.1. Lab Test Set up for Moisture Variation Sample
4.1.1 Sample Descriptions
The clean ballast obtained from washing the Gardner, Kansas fouled ballast by the wet sieving
method was uniformly mixed with the different percentages by weight of the fouling agents
using a skid loader. The following diagram shows the test specimen composition based on
addition of fouling agents.
Coal dust fouled ballast
10% coal dust fouled ballast 3 samples with different M/C
20% coal dust fouled ballast 4 samples with different M/C
30% coal dust fouled ballast 4 samples with different M/C
Subgrade soil fouled ballast
10% Subgrade soil fouled ballast 4 samples with different M/C
20% Subgrade soil fouled ballast 4 samples with different M/C
30% Subgrade soil fouled ballast 5 samples with different M/C
40% Subgrade soil fouled ballast 5 samples with different M/C
Gardner track ballast dust fouled
ballast
10% Track dust fouled ballast 4 samples with different M/C
20% Track dust fouled ballast 5 samples with different M/C
30% Track dust fouled ballast 4 samples with different M/C
40% Track dust fouled ballast 4 samples with different M/C
Clean Ballast Clean ballast (without fouling) 2 Samples
Figure 4-1 Types of Samples for Test
49
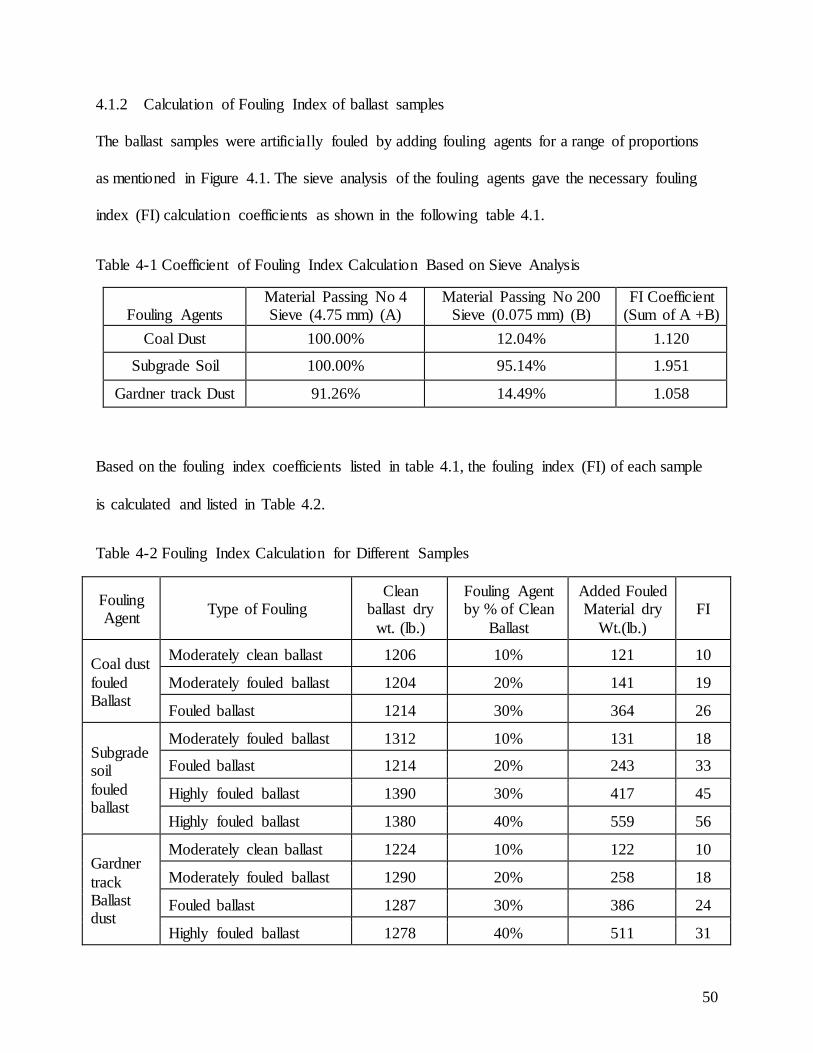
4.1.2 Calculation of Fouling Index of ballast samples
The ballast samples were artificially fouled by adding fouling agents for a range of proportions
as mentioned in Figure 4.1. The sieve analysis of the fouling agents gave the necessary fouling
index (FI) calculation coefficients as shown in the following table 4.1.
Table 4-1 Coefficient of Fouling Index Calculation Based on Sieve Analysis
Fouling Agents Material Passing No 4 Sieve (4.75 mm) (A)
Material Passing No 200 Sieve (0.075 mm) (B)
FI Coefficient (Sum of A +B)
Coal Dust 100.00% 12.04% 1.120
Subgrade Soil 100.00% 95.14% 1.951
Gardner track Dust 91.26% 14.49% 1.058
Based on the fouling index coefficients listed in table 4.1, the fouling index (FI) of each sample
is calculated and listed in Table 4.2.
Table 4-2 Fouling Index Calculation for Different Samples
Fouling Agent Type of Fouling
Clean ballast dry
wt. (lb.)
Fouling Agent by % of Clean
Ballast
Added Fouled Material dry
Wt.(lb.) FI
Coal dust fouled Ballast
Moderately clean ballast 1206 10% 121 10
Moderately fouled ballast 1204 20% 141 19
Fouled ballast 1214 30% 364 26
Subgrade soil fouled ballast
Moderately fouled ballast 1312 10% 131 18
Fouled ballast 1214 20% 243 33
Highly fouled ballast 1390 30% 417 45
Highly fouled ballast 1380 40% 559 56
Gardner track Ballast dust
Moderately clean ballast 1224 10% 122 10
Moderately fouled ballast 1290 20% 258 18
Fouled ballast 1287 30% 386 24
Highly fouled ballast 1278 40% 511 31
50
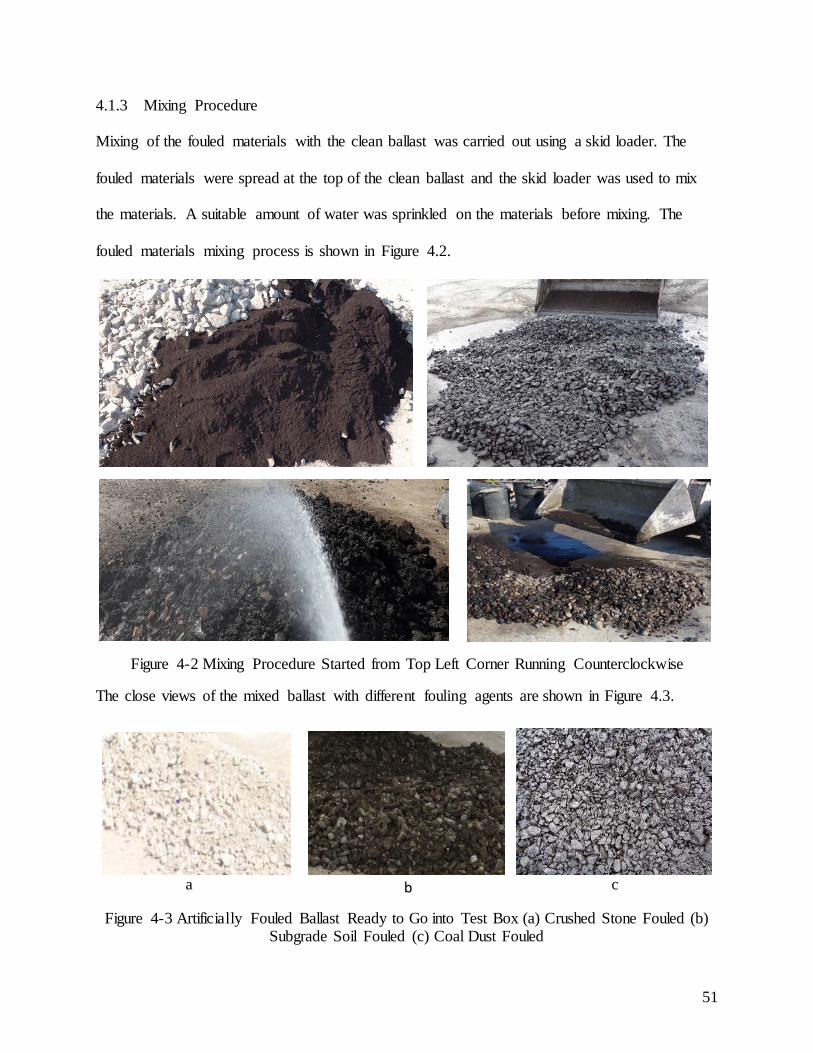
4.1.3 Mixing Procedure
Mixing of the fouled materials with the clean ballast was carried out using a skid loader. The
fouled materials were spread at the top of the clean ballast and the skid loader was used to mix
the materials. A suitable amount of water was sprinkled on the materials before mixing. The
fouled materials mixing process is shown in Figure 4.2.
Figure 4-2 Mixing Procedure Started from Top Left Corner Running Counterclockwise
The close views of the mixed ballast with different fouling agents are shown in Figure 4.3.
Figure 4-3 Artificially Fouled Ballast Ready to Go into Test Box (a) Crushed Stone Fouled (b)
Subgrade Soil Fouled (c) Coal Dust Fouled
b a c
51
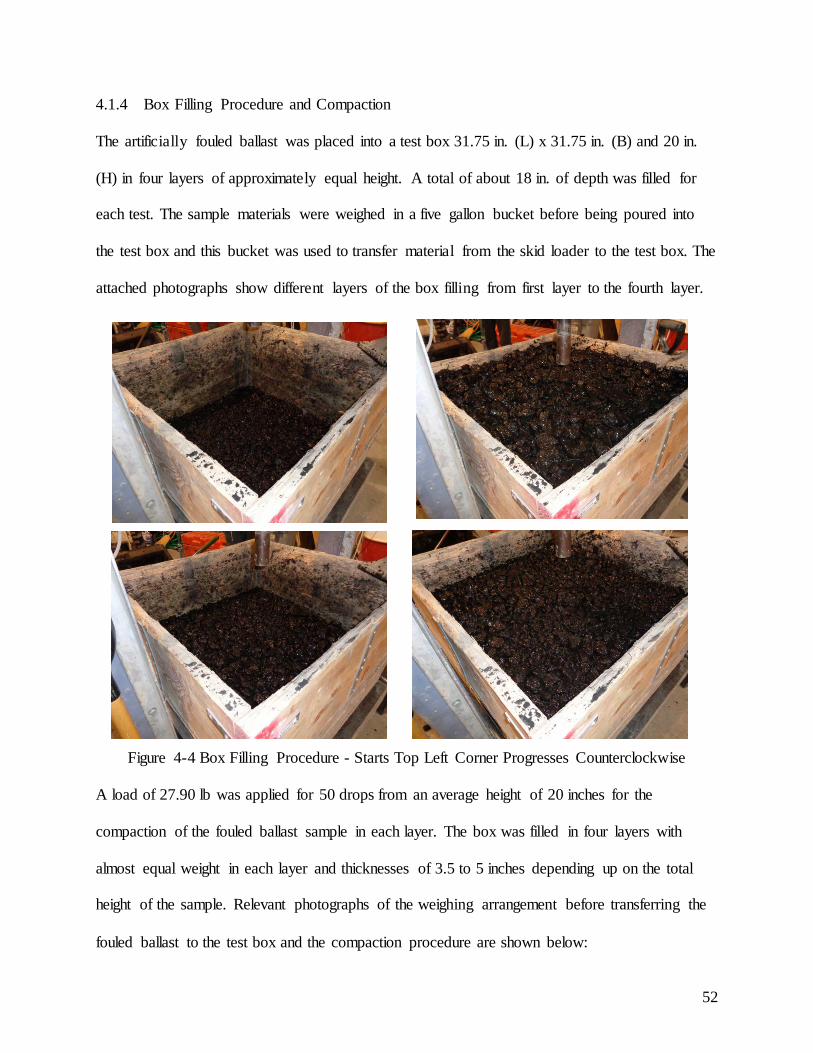
4.1.4 Box Filling Procedure and Compaction
The artificially fouled ballast was placed into a test box 31.75 in. (L) x 31.75 in. (B) and 20 in.
(H) in four layers of approximately equal height. A total of about 18 in. of depth was filled for
each test. The sample materials were weighed in a five gallon bucket before being poured into
the test box and this bucket was used to transfer material from the skid loader to the test box. The
attached photographs show different layers of the box filling from first layer to the fourth layer.
Figure 4-4 Box Filling Procedure - Starts Top Left Corner Progresses Counterclockwise
A load of 27.90 lb was applied for 50 drops from an average height of 20 inches for the
compaction of the fouled ballast sample in each layer. The box was filled in four layers with
almost equal weight in each layer and thicknesses of 3.5 to 5 inches depending up on the total
height of the sample. Relevant photographs of the weighing arrangement before transferring the
fouled ballast to the test box and the compaction procedure are shown below:
52
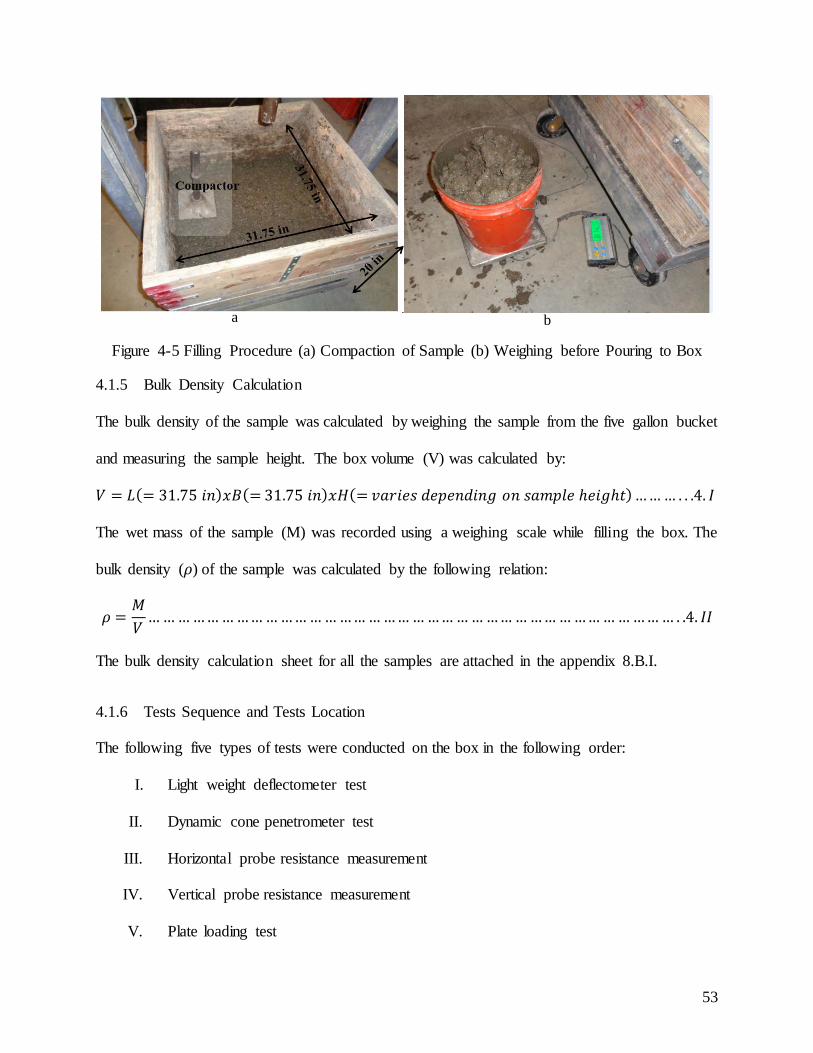
Figure 4-5 Filling Procedure (a) Compaction of Sample (b) Weighing before Pouring to Box
4.1.5 Bulk Density Calculation
The bulk density of the sample was calculated by weighing the sample from the five gallon bucket
and measuring the sample height. The box volume (V) was calculated by:
𝑉𝑉 = 𝜋𝜋(= 31.75 𝑖𝑖𝑖𝑖)𝑥𝑥𝑥𝑥(= 31.75 𝑖𝑖𝑖𝑖)𝑥𝑥𝑥𝑥(= 𝑣𝑣𝑎𝑎𝑣𝑣𝑖𝑖𝑣𝑣𝑣𝑣 𝑑𝑑𝑣𝑣𝑑𝑑𝑣𝑣𝑖𝑖𝑑𝑑𝑖𝑖𝑖𝑖𝑑𝑑 𝑜𝑜𝑖𝑖 𝑣𝑣𝑎𝑎𝑠𝑠𝑑𝑑𝑠𝑠𝑣𝑣 ℎ𝑣𝑣𝑖𝑖𝑑𝑑ℎ𝑡𝑡) … … … . . .4. 𝐼𝐼
The wet mass of the sample (M) was recorded using a weighing scale while filling the box. The
bulk density (𝜌𝜌) of the sample was calculated by the following relation:
𝜌𝜌 =𝑀𝑀𝑉𝑉
… … … … … … … … … … … … … … … … … … … … … … … … … … … … … … … … … … … … . .4. 𝐼𝐼𝐼𝐼
The bulk density calculation sheet for all the samples are attached in the appendix 8.B.I.
4.1.6 Tests Sequence and Tests Location
The following five types of tests were conducted on the box in the following order:
I. Light weight deflectometer test
II. Dynamic cone penetrometer test
III. Horizontal probe resistance measurement
IV. Vertical probe resistance measurement
V. Plate loading test
a b
53
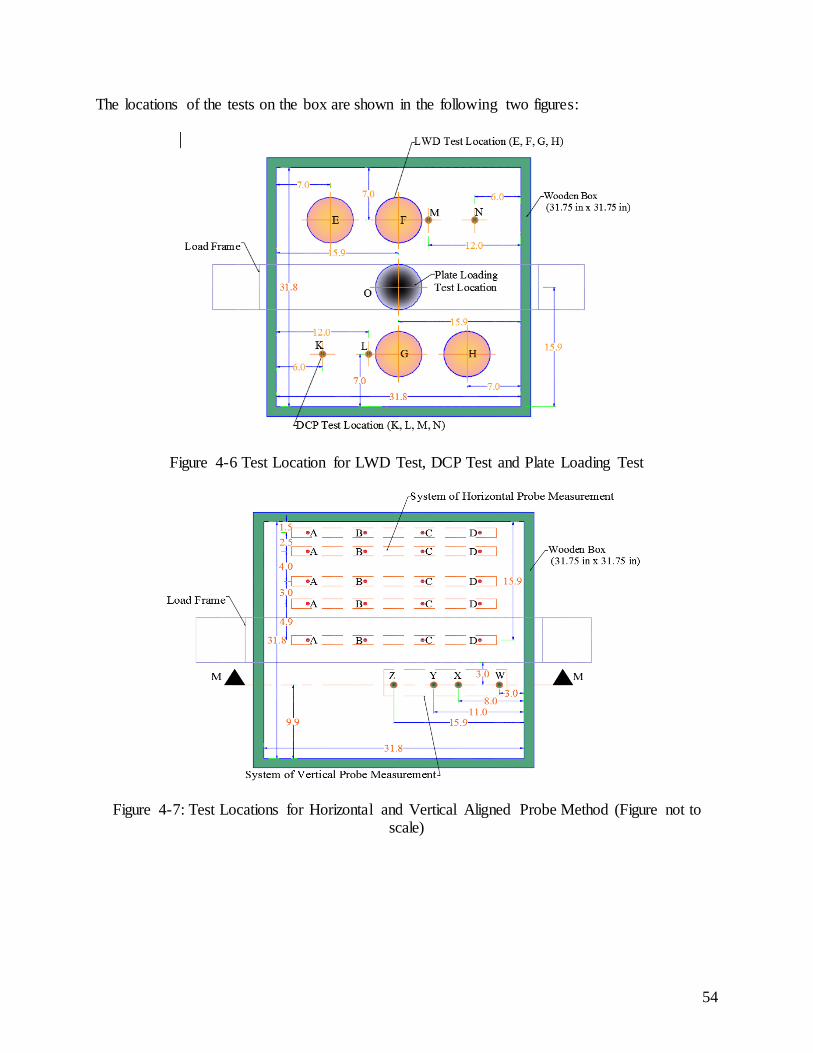
The locations of the tests on the box are shown in the following two figures:
Figure 4-6 Test Location for LWD Test, DCP Test and Plate Loading Test
Figure 4-7: Test Locations for Horizontal and Vertical Aligned Probe Method (Figure not to scale)
54
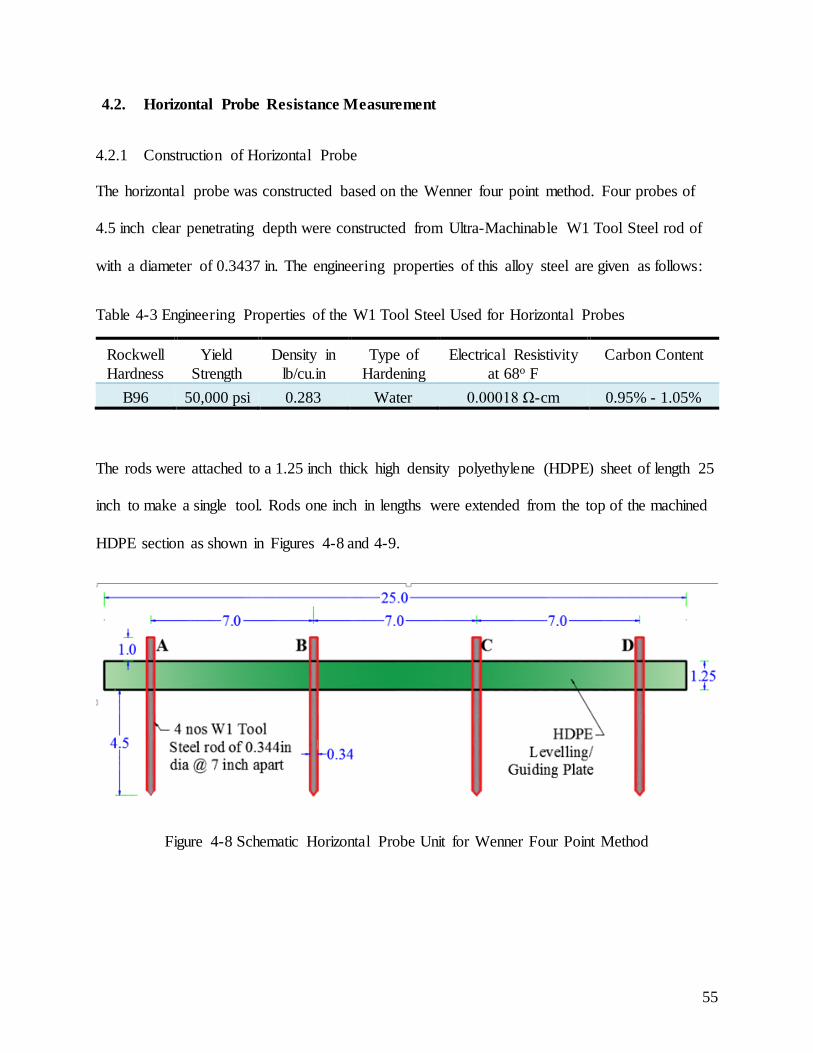
4.2. Horizontal Probe Resistance Measurement
4.2.1 Construction of Horizontal Probe
The horizontal probe was constructed based on the Wenner four point method. Four probes of
4.5 inch clear penetrating depth were constructed from Ultra-Machinable W1 Tool Steel rod of
with a diameter of 0.3437 in. The engineering properties of this alloy steel are given as follows:
Table 4-3 Engineering Properties of the W1 Tool Steel Used for Horizontal Probes
Rockwell Hardness
Yield Strength
Density in lb/cu.in
Type of Hardening
Electrical Resistivity at 68o F
Carbon Content
B96 50,000 psi 0.283 Water 0.00018 Ω-cm 0.95% - 1.05%
The rods were attached to a 1.25 inch thick high density polyethylene (HDPE) sheet of length 25
inch to make a single tool. Rods one inch in lengths were extended from the top of the machined
HDPE section as shown in Figures 4-8 and 4-9.
Figure 4-8 Schematic Horizontal Probe Unit for Wenner Four Point Method
55
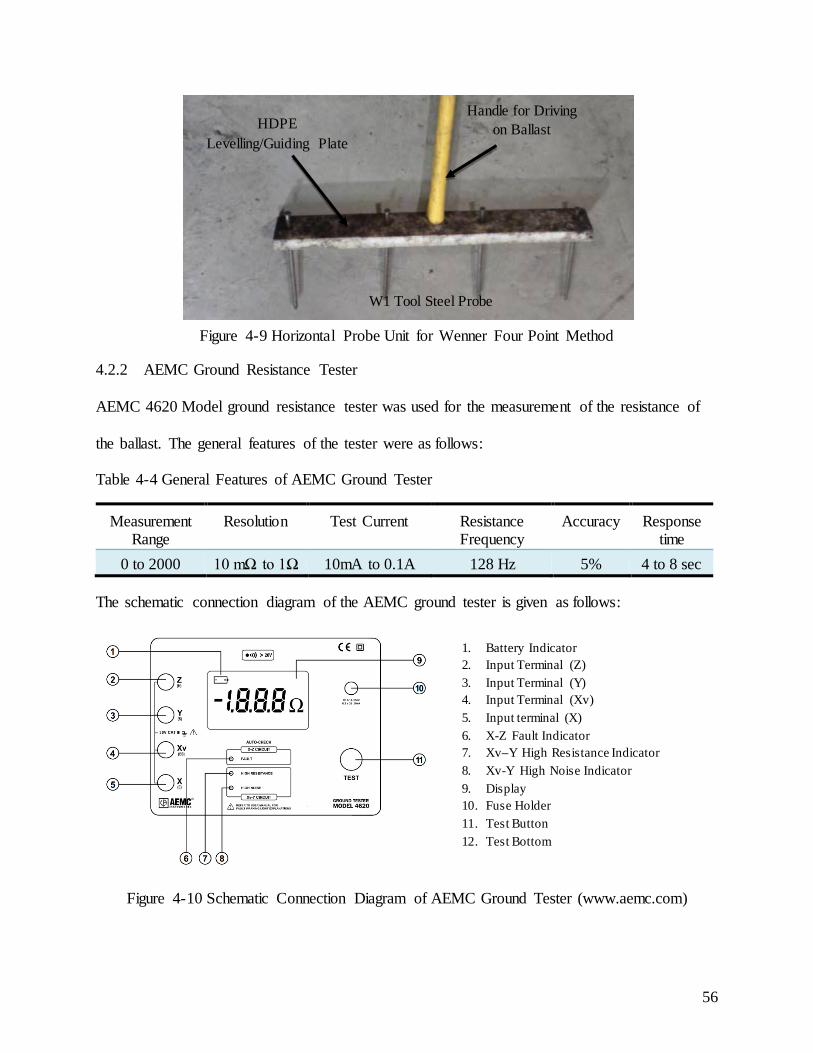
Figure 4-9 Horizontal Probe Unit for Wenner Four Point Method
4.2.2 AEMC Ground Resistance Tester
AEMC 4620 Model ground resistance tester was used for the measurement of the resistance of
the ballast. The general features of the tester were as follows:
Table 4-4 General Features of AEMC Ground Tester
Measurement Range
Resolution Test Current Resistance Frequency
Accuracy Response time
0 to 2000 10 mΩ to 1Ω 10mA to 0.1A 128 Hz 5% 4 to 8 sec
The schematic connection diagram of the AEMC ground tester is given as follows:
Figure 4-10 Schematic Connection Diagram of AEMC Ground Tester (www.aemc.com)
HDPE Levelling/Guiding Plate
Handle for Driving on Ballast
W1 Tool Steel Probe
1. Battery Indicator 2. Input Terminal (Z) 3. Input Terminal (Y) 4. Input Terminal (Xv) 5. Input terminal (X) 6. X-Z Fault Indicator 7. Xv–Y High Resistance Indicator 8. Xv-Y High Noise Indicator 9. Display 10. Fuse Holder 11. Test Button 12. Test Bottom
56
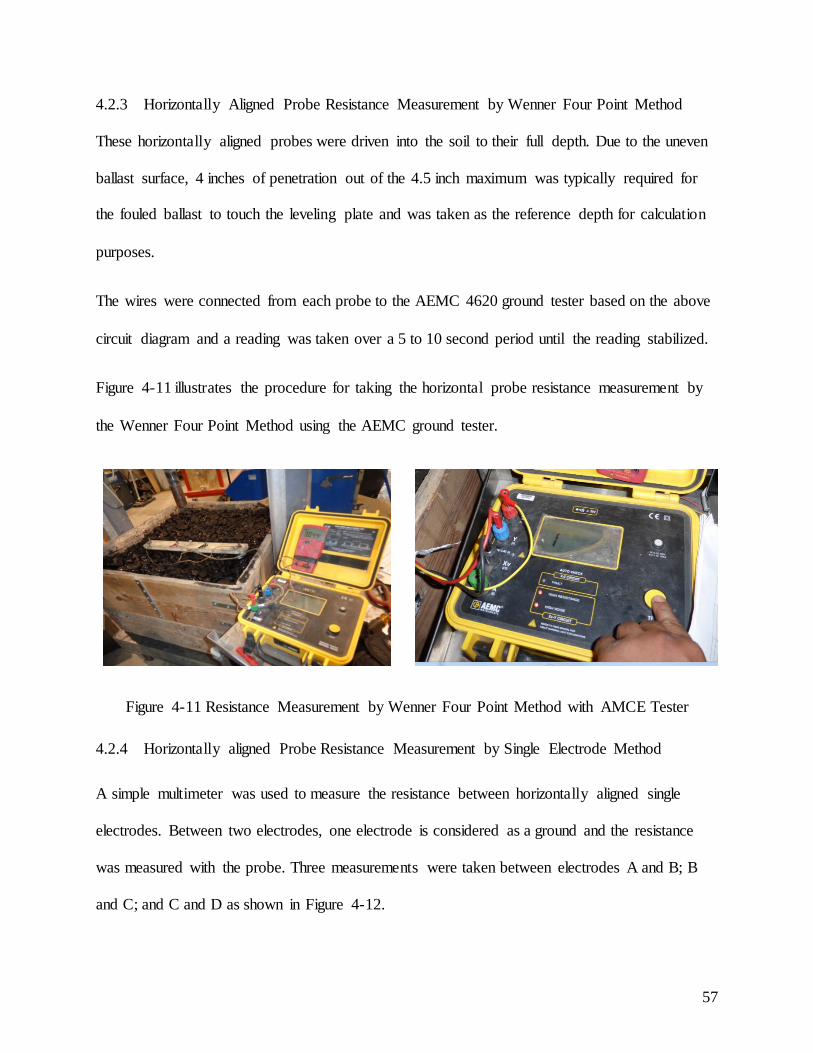
4.2.3 Horizontally Aligned Probe Resistance Measurement by Wenner Four Point Method
These horizontally aligned probes were driven into the soil to their full depth. Due to the uneven
ballast surface, 4 inches of penetration out of the 4.5 inch maximum was typically required for
the fouled ballast to touch the leveling plate and was taken as the reference depth for calculation
purposes.
The wires were connected from each probe to the AEMC 4620 ground tester based on the above
circuit diagram and a reading was taken over a 5 to 10 second period until the reading stabilized.
Figure 4-11 illustrates the procedure for taking the horizontal probe resistance measurement by
the Wenner Four Point Method using the AEMC ground tester.
Figure 4-11 Resistance Measurement by Wenner Four Point Method with AMCE Tester
4.2.4 Horizontally aligned Probe Resistance Measurement by Single Electrode Method
A simple multimeter was used to measure the resistance between horizontally aligned single
electrodes. Between two electrodes, one electrode is considered as a ground and the resistance
was measured with the probe. Three measurements were taken between electrodes A and B; B
and C; and C and D as shown in Figure 4-12.
57
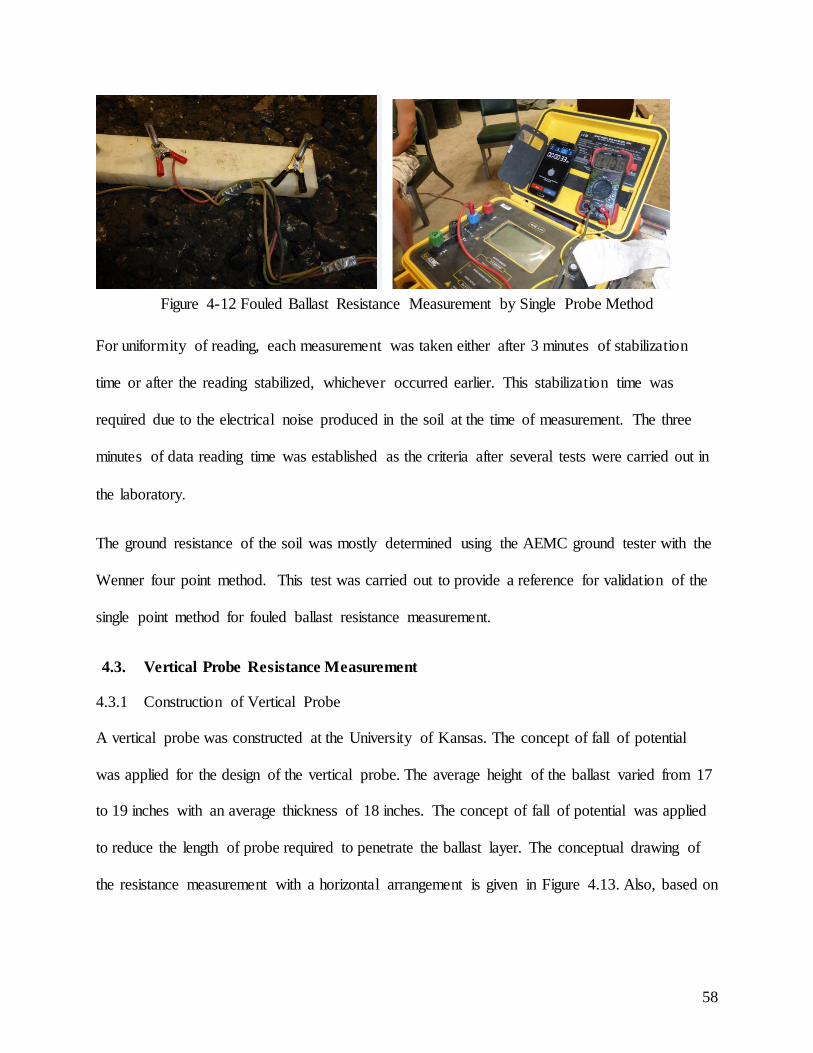
Figure 4-12 Fouled Ballast Resistance Measurement by Single Probe Method
For uniformity of reading, each measurement was taken either after 3 minutes of stabilization
time or after the reading stabilized, whichever occurred earlier. This stabilization time was
required due to the electrical noise produced in the soil at the time of measurement. The three
minutes of data reading time was established as the criteria after several tests were carried out in
the laboratory.
The ground resistance of the soil was mostly determined using the AEMC ground tester with the
Wenner four point method. This test was carried out to provide a reference for validation of the
single point method for fouled ballast resistance measurement.
4.3. Vertical Probe Resistance Measurement
4.3.1 Construction of Vertical Probe
A vertical probe was constructed at the University of Kansas. The concept of fall of potential
was applied for the design of the vertical probe. The average height of the ballast varied from 17
to 19 inches with an average thickness of 18 inches. The concept of fall of potential was applied
to reduce the length of probe required to penetrate the ballast layer. The conceptual drawing of
the resistance measurement with a horizontal arrangement is given in Figure 4.13. Also, based on
58
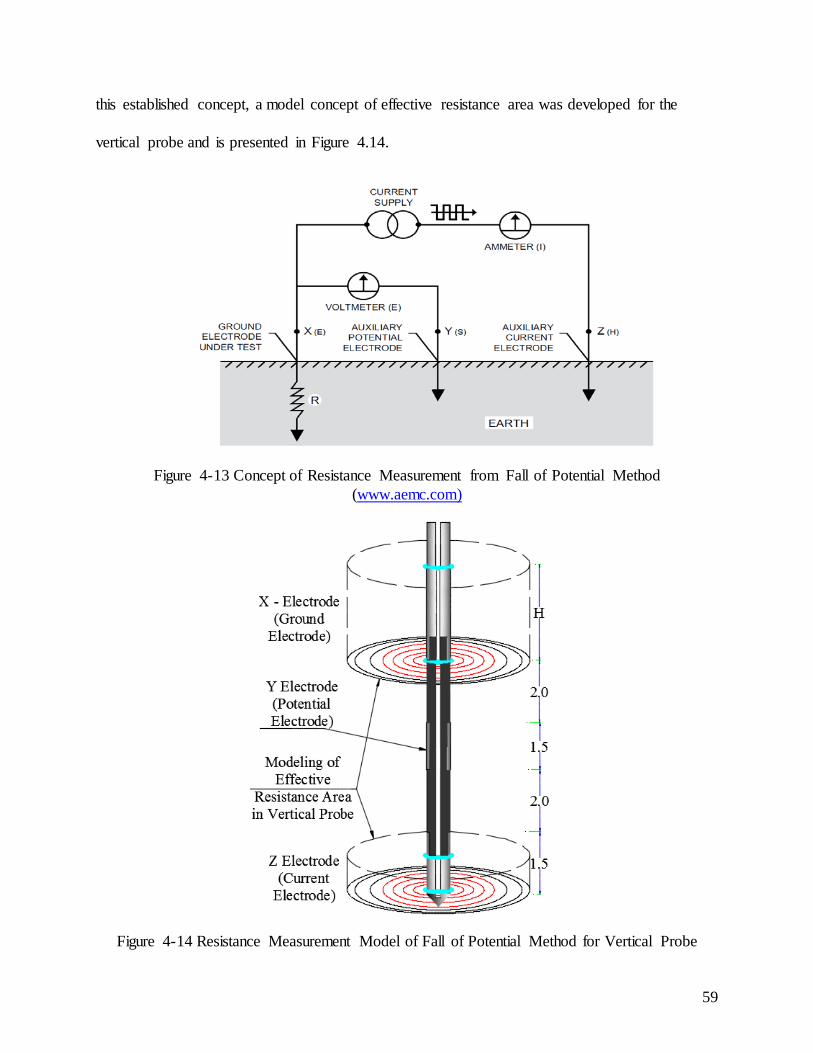
this established concept, a model concept of effective resistance area was developed for the
vertical probe and is presented in Figure 4.14.
Figure 4-13 Concept of Resistance Measurement from Fall of Potential Method (www.aemc.com)
Figure 4-14 Resistance Measurement Model of Fall of Potential Method for Vertical Probe
59
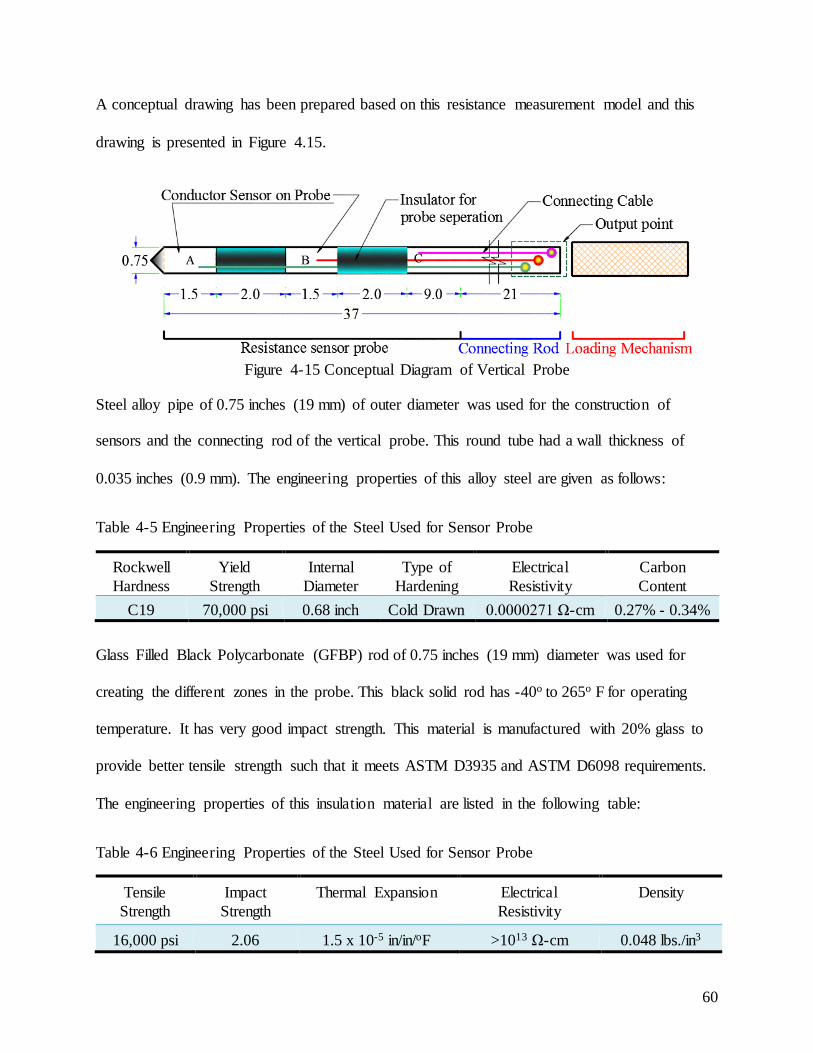
A conceptual drawing has been prepared based on this resistance measurement model and this
drawing is presented in Figure 4.15.
Figure 4-15 Conceptual Diagram of Vertical Probe
Steel alloy pipe of 0.75 inches (19 mm) of outer diameter was used for the construction of
sensors and the connecting rod of the vertical probe. This round tube had a wall thickness of
0.035 inches (0.9 mm). The engineering properties of this alloy steel are given as follows:
Table 4-5 Engineering Properties of the Steel Used for Sensor Probe
Rockwell Hardness
Yield Strength
Internal Diameter
Type of Hardening
Electrical Resistivity
Carbon Content
C19 70,000 psi 0.68 inch Cold Drawn 0.0000271 Ω-cm 0.27% - 0.34%
Glass Filled Black Polycarbonate (GFBP) rod of 0.75 inches (19 mm) diameter was used for
creating the different zones in the probe. This black solid rod has -40o to 265o F for operating
temperature. It has very good impact strength. This material is manufactured with 20% glass to
provide better tensile strength such that it meets ASTM D3935 and ASTM D6098 requirements.
The engineering properties of this insulation material are listed in the following table:
Table 4-6 Engineering Properties of the Steel Used for Sensor Probe
Tensile Strength
Impact Strength
Thermal Expansion Electrical Resistivity
Density
16,000 psi 2.06 1.5 x 10⁻⁵ in/in/oF >1013 Ω-cm 0.048 lbs./in3
60
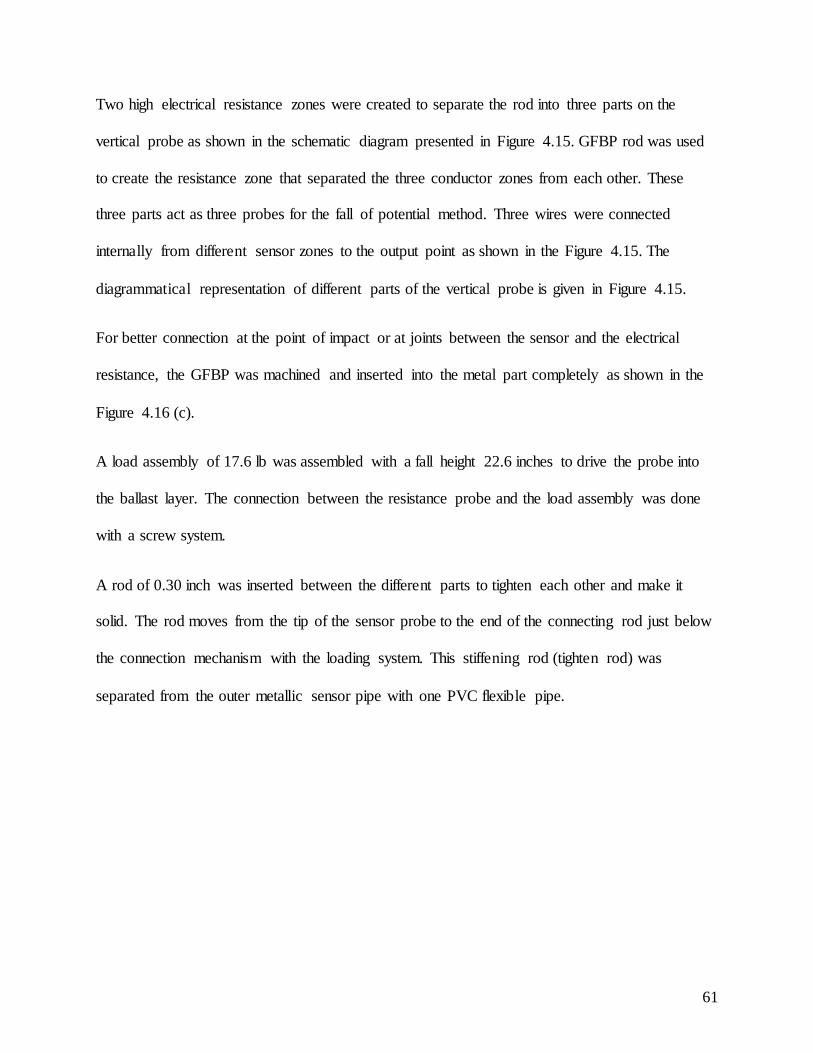
Two high electrical resistance zones were created to separate the rod into three parts on the
vertical probe as shown in the schematic diagram presented in Figure 4.15. GFBP rod was used
to create the resistance zone that separated the three conductor zones from each other. These
three parts act as three probes for the fall of potential method. Three wires were connected
internally from different sensor zones to the output point as shown in the Figure 4.15. The
diagrammatical representation of different parts of the vertical probe is given in Figure 4.15.
For better connection at the point of impact or at joints between the sensor and the electrical
resistance, the GFBP was machined and inserted into the metal part completely as shown in the
Figure 4.16 (c).
A load assembly of 17.6 lb was assembled with a fall height 22.6 inches to drive the probe into
the ballast layer. The connection between the resistance probe and the load assembly was done
with a screw system.
A rod of 0.30 inch was inserted between the different parts to tighten each other and make it
solid. The rod moves from the tip of the sensor probe to the end of the connecting rod just below
the connection mechanism with the loading system. This stiffening rod (tighten rod) was
separated from the outer metallic sensor pipe with one PVC flexible pipe.
61
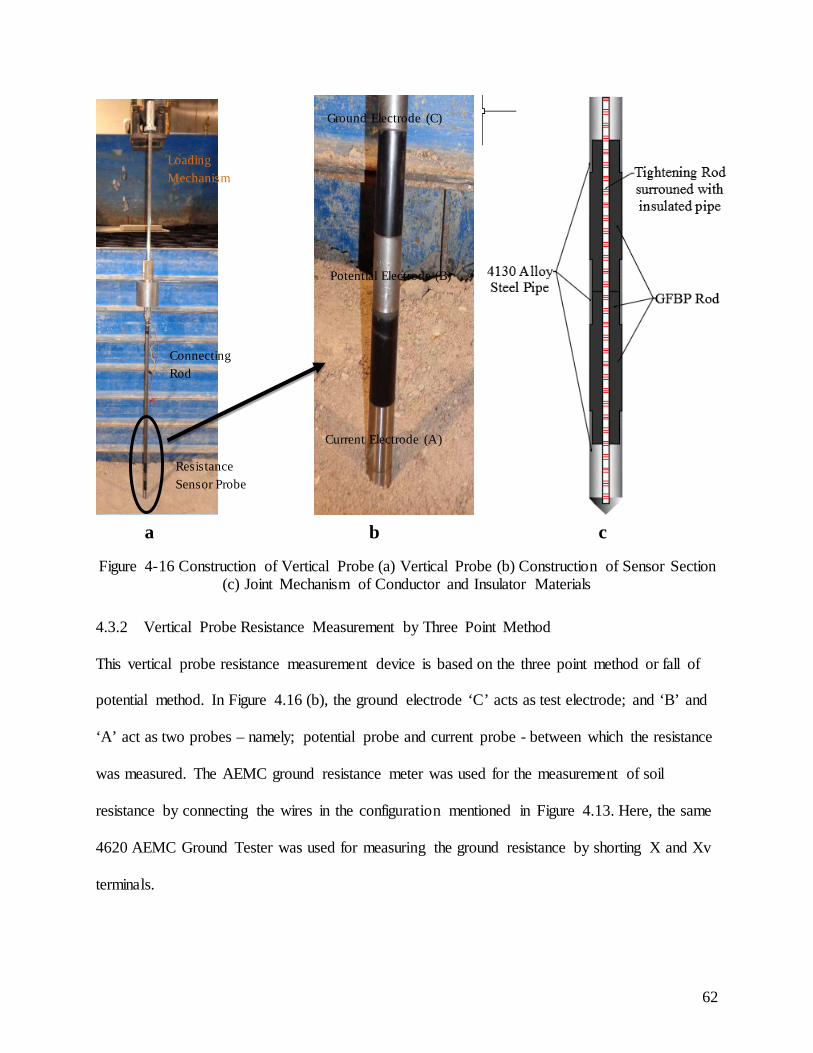
Figure 4-16 Construction of Vertical Probe (a) Vertical Probe (b) Construction of Sensor Section
(c) Joint Mechanism of Conductor and Insulator Materials
4.3.2 Vertical Probe Resistance Measurement by Three Point Method
This vertical probe resistance measurement device is based on the three point method or fall of
potential method. In Figure 4.16 (b), the ground electrode ‘C’ acts as test electrode; and ‘B’ and
‘A’ act as two probes – namely; potential probe and current probe - between which the resistance
was measured. The AEMC ground resistance meter was used for the measurement of soil
resistance by connecting the wires in the configuration mentioned in Figure 4.13. Here, the same
4620 AEMC Ground Tester was used for measuring the ground resistance by shorting X and Xv
terminals.
Resistance Sensor Probe
Connecting Rod
Loading Mechanism
Ground Electrode (C)
Potential Electrode (B)
a b c
Current Electrode (A)
62
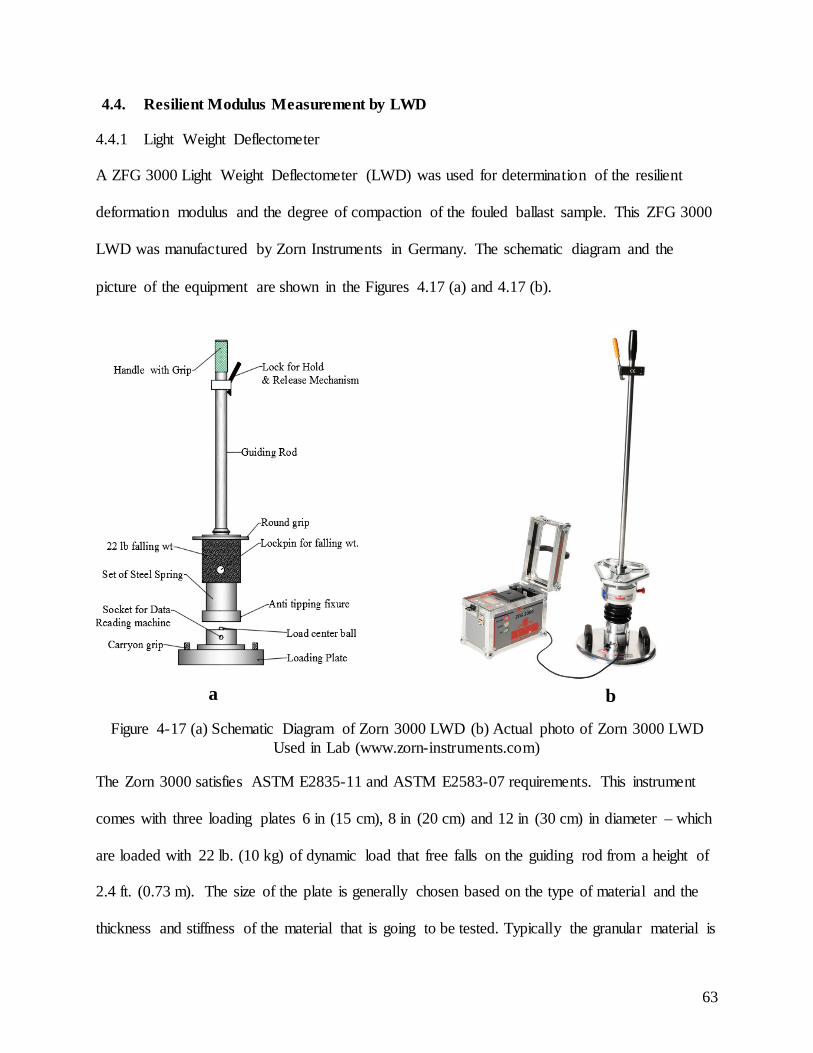
4.4. Resilient Modulus Measurement by LWD
4.4.1 Light Weight Deflectometer
A ZFG 3000 Light Weight Deflectometer (LWD) was used for determination of the resilient
deformation modulus and the degree of compaction of the fouled ballast sample. This ZFG 3000
LWD was manufactured by Zorn Instruments in Germany. The schematic diagram and the
picture of the equipment are shown in the Figures 4.17 (a) and 4.17 (b).
Figure 4-17 (a) Schematic Diagram of Zorn 3000 LWD (b) Actual photo of Zorn 3000 LWD
Used in Lab (www.zorn-instruments.com)
The Zorn 3000 satisfies ASTM E2835-11 and ASTM E2583-07 requirements. This instrument
comes with three loading plates 6 in (15 cm), 8 in (20 cm) and 12 in (30 cm) in diameter – which
are loaded with 22 lb. (10 kg) of dynamic load that free falls on the guiding rod from a height of
2.4 ft. (0.73 m). The size of the plate is generally chosen based on the type of material and the
thickness and stiffness of the material that is going to be tested. Typically the granular material is
a b
63

tested using the 6 in. diameter plate, and flat clay and sand are tested using the large diameter
plate (12 in.).
The resilient modulus is measured based on the settlement made on each drop. The relation of
this modulus and the settlement after each pulse from the dynamic load is given by:
𝐸𝐸𝐻𝐻𝐻𝐻 = 𝑓𝑓 ∗ (1−𝜗𝜗) ∗ 𝜎𝜎 ∗ 𝑟𝑟𝑠𝑠
… … … … … … … … … … … … … … … … … … … … . .4. 𝐼𝐼𝐼𝐼𝐼𝐼
Where;
f = shape factor = 2
υ = Poisson’s ratio = 0.30
σ = Pressure on plate due to dynamic loading = 𝑀𝑀.𝑎𝑎𝐴𝐴
M = Free fall weight = 22 lb.
a = acceleration of the drop
A = plate area (28.27 in2 for 6 inches diameter plate)
r = radius of the contact plate in inches = 6 inches
s = Settlement on each drop in inches
Since the samples were granular material fouled with different fouling agents and there was
limited space for the test in the test box, a 6 in diameter plate was used. The setting was also
adjusted based on the plate diameter selection.
64
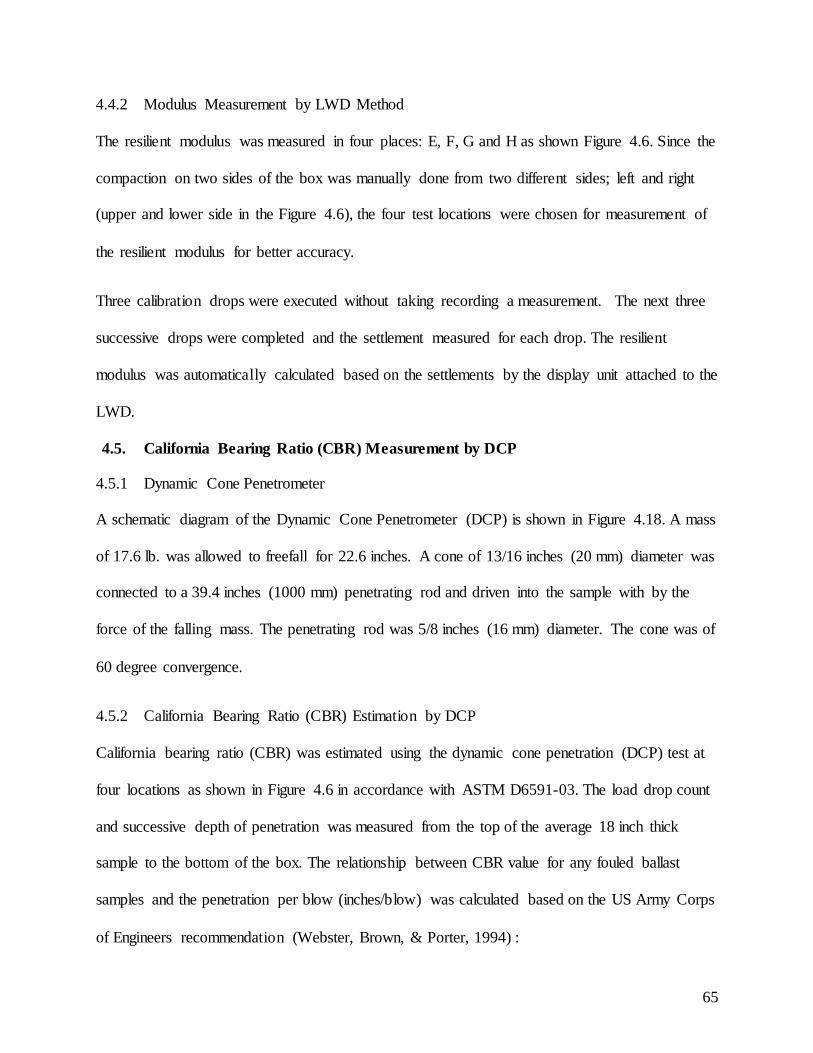
4.4.2 Modulus Measurement by LWD Method
The resilient modulus was measured in four places: E, F, G and H as shown Figure 4.6. Since the
compaction on two sides of the box was manually done from two different sides; left and right
(upper and lower side in the Figure 4.6), the four test locations were chosen for measurement of
the resilient modulus for better accuracy.
Three calibration drops were executed without taking recording a measurement. The next three
successive drops were completed and the settlement measured for each drop. The resilient
modulus was automatically calculated based on the settlements by the display unit attached to the
LWD.
4.5. California Bearing Ratio (CBR) Measurement by DCP
4.5.1 Dynamic Cone Penetrometer
A schematic diagram of the Dynamic Cone Penetrometer (DCP) is shown in Figure 4.18. A mass
of 17.6 lb. was allowed to freefall for 22.6 inches. A cone of 13/16 inches (20 mm) diameter was
connected to a 39.4 inches (1000 mm) penetrating rod and driven into the sample with by the
force of the falling mass. The penetrating rod was 5/8 inches (16 mm) diameter. The cone was of
60 degree convergence.
4.5.2 California Bearing Ratio (CBR) Estimation by DCP
California bearing ratio (CBR) was estimated using the dynamic cone penetration (DCP) test at
four locations as shown in Figure 4.6 in accordance with ASTM D6591-03. The load drop count
and successive depth of penetration was measured from the top of the average 18 inch thick
sample to the bottom of the box. The relationship between CBR value for any fouled ballast
samples and the penetration per blow (inches/blow) was calculated based on the US Army Corps
of Engineers recommendation (Webster, Brown, & Porter, 1994) :
65
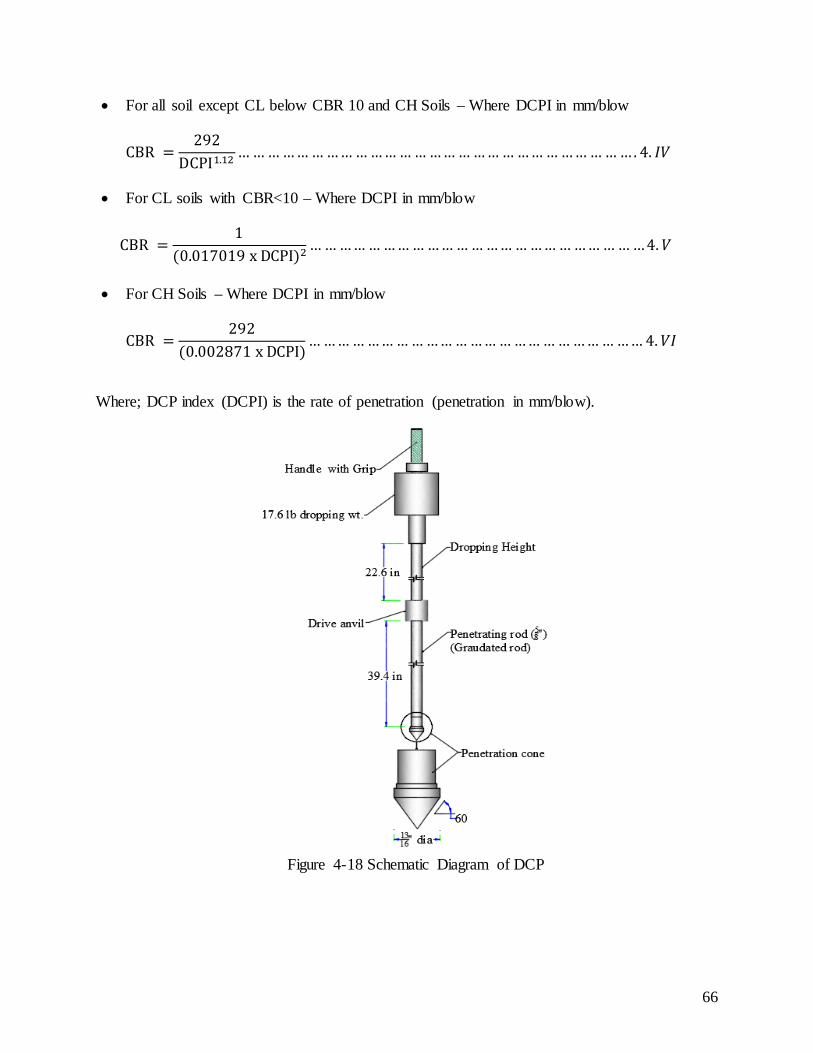
• For all soil except CL below CBR 10 and CH Soils – Where DCPI in mm/blow
CBR =292
DCPI1.12 … … … … … … … … … … … … … … … … … … … … … … … … … … … . 4. 𝐼𝐼𝑉𝑉
• For CL soils with CBR<10 – Where DCPI in mm/blow
CBR =1
(0.017019 x DCPI)2… … … … … … … … … … … … … … … … … … … … … … … 4.𝑉𝑉
• For CH Soils – Where DCPI in mm/blow
CBR =292
(0.002871 x DCPI)… … … … … … … … … … … … … … … … … … … … … … … 4.𝑉𝑉𝐼𝐼
Where; DCP index (DCPI) is the rate of penetration (penetration in mm/blow).
Figure 4-18 Schematic Diagram of DCP
66
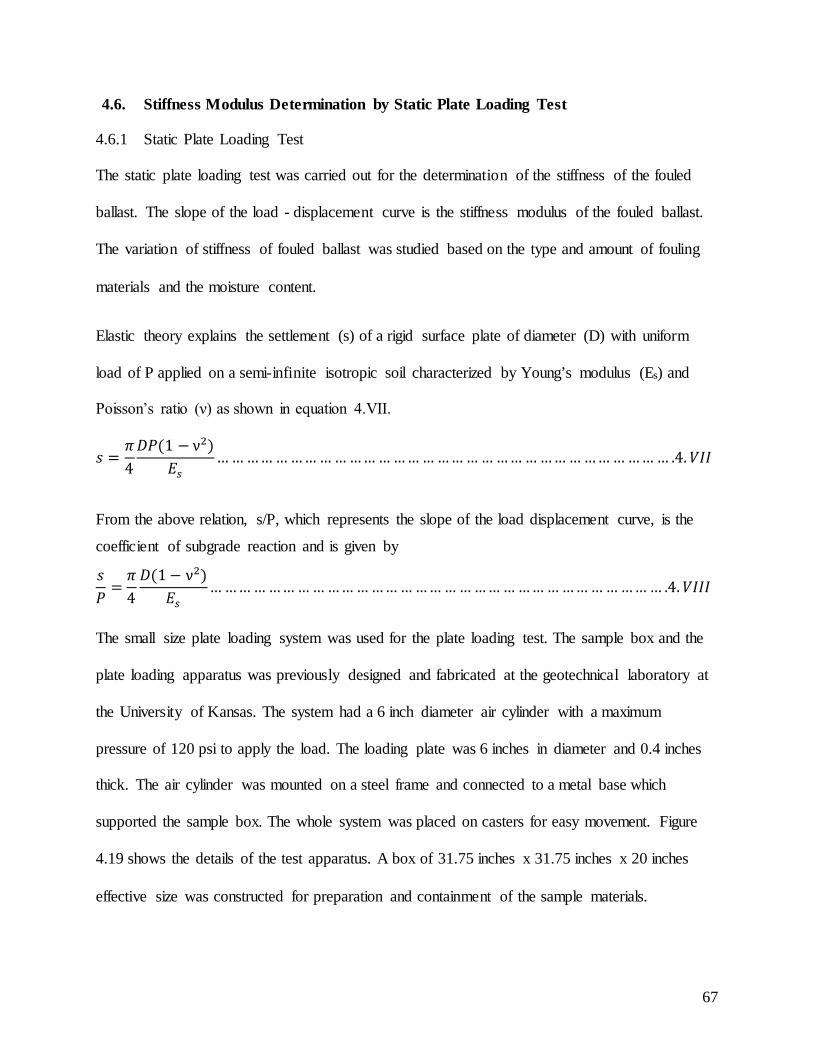
4.6. Stiffness Modulus Determination by Static Plate Loading Test
4.6.1 Static Plate Loading Test
The static plate loading test was carried out for the determination of the stiffness of the fouled
ballast. The slope of the load - displacement curve is the stiffness modulus of the fouled ballast.
The variation of stiffness of fouled ballast was studied based on the type and amount of fouling
materials and the moisture content.
Elastic theory explains the settlement (s) of a rigid surface plate of diameter (D) with uniform
load of P applied on a semi-infinite isotropic soil characterized by Young’s modulus (Es) and
Poisson’s ratio (ν) as shown in equation 4.VII.
𝑣𝑣 =𝜋𝜋4𝐷𝐷𝑃𝑃(1 − ν2)
𝐸𝐸𝑠𝑠… … … … … … … … … … … … … … … … … … … … … … … … … … … … … … … .4.𝑉𝑉𝐼𝐼𝐼𝐼
From the above relation, s/P, which represents the slope of the load displacement curve, is the
coefficient of subgrade reaction and is given by
𝑣𝑣𝑃𝑃
=𝜋𝜋4𝐷𝐷(1− ν2)
𝐸𝐸𝑠𝑠… … … … … … … … … … … … … … … … … … … … … … … … … … … … … … … .4.𝑉𝑉𝐼𝐼𝐼𝐼𝐼𝐼
The small size plate loading system was used for the plate loading test. The sample box and the
plate loading apparatus was previously designed and fabricated at the geotechnical laboratory at
the University of Kansas. The system had a 6 inch diameter air cylinder with a maximum
pressure of 120 psi to apply the load. The loading plate was 6 inches in diameter and 0.4 inches
thick. The air cylinder was mounted on a steel frame and connected to a metal base which
supported the sample box. The whole system was placed on casters for easy movement. Figure
4.19 shows the details of the test apparatus. A box of 31.75 inches x 31.75 inches x 20 inches
effective size was constructed for preparation and containment of the sample materials.
67
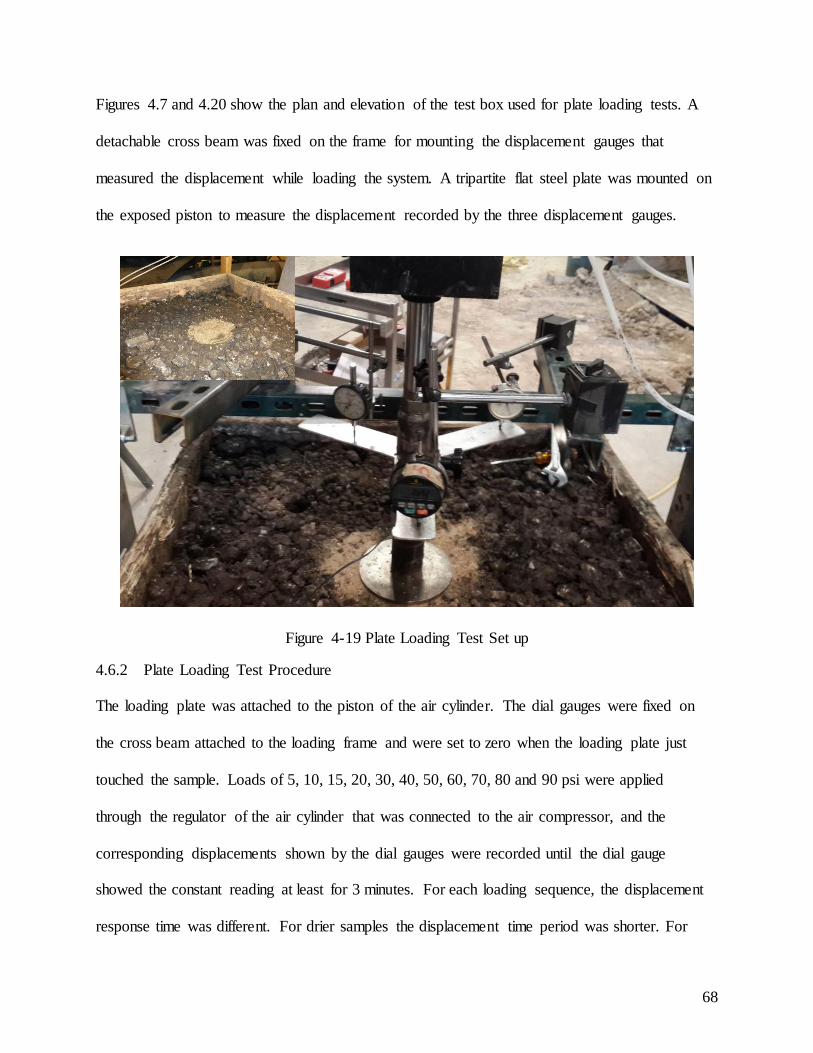
Figures 4.7 and 4.20 show the plan and elevation of the test box used for plate loading tests. A
detachable cross beam was fixed on the frame for mounting the displacement gauges that
measured the displacement while loading the system. A tripartite flat steel plate was mounted on
the exposed piston to measure the displacement recorded by the three displacement gauges.
Figure 4-19 Plate Loading Test Set up
4.6.2 Plate Loading Test Procedure
The loading plate was attached to the piston of the air cylinder. The dial gauges were fixed on
the cross beam attached to the loading frame and were set to zero when the loading plate just
touched the sample. Loads of 5, 10, 15, 20, 30, 40, 50, 60, 70, 80 and 90 psi were applied
through the regulator of the air cylinder that was connected to the air compressor, and the
corresponding displacements shown by the dial gauges were recorded until the dial gauge
showed the constant reading at least for 3 minutes. For each loading sequence, the displacement
response time was different. For drier samples the displacement time period was shorter. For
68
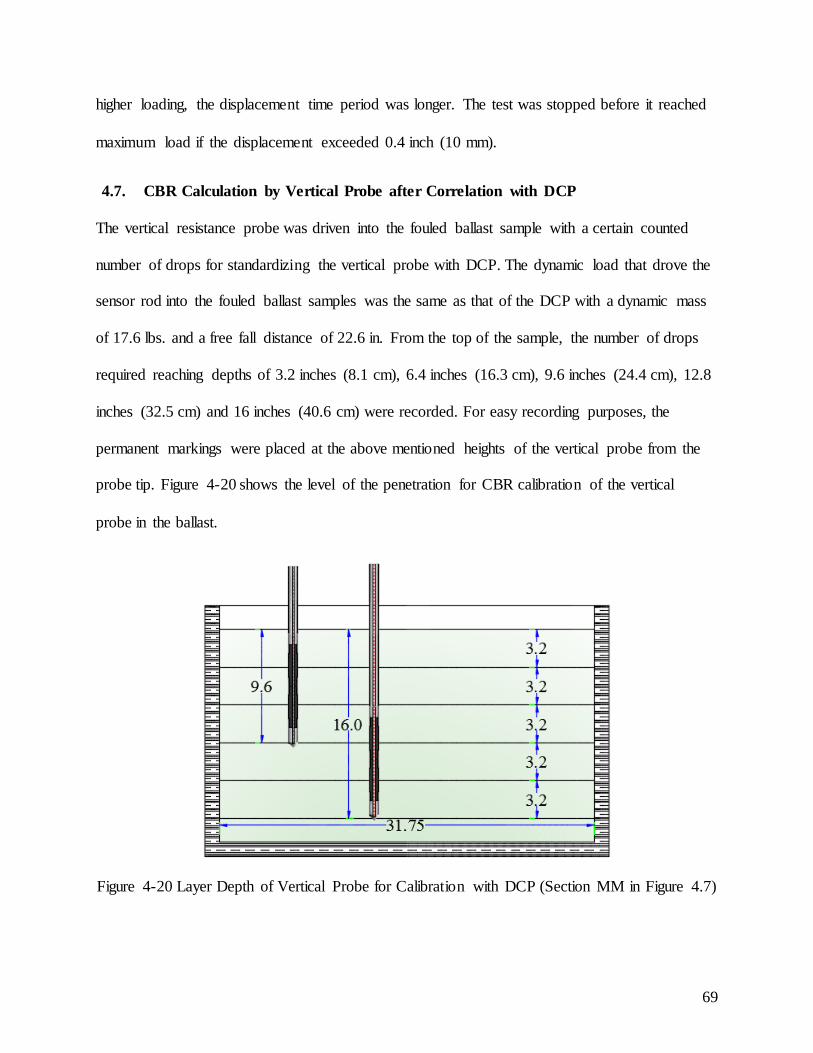
higher loading, the displacement time period was longer. The test was stopped before it reached
maximum load if the displacement exceeded 0.4 inch (10 mm).
4.7. CBR Calculation by Vertical Probe after Correlation with DCP
The vertical resistance probe was driven into the fouled ballast sample with a certain counted
number of drops for standardizing the vertical probe with DCP. The dynamic load that drove the
sensor rod into the fouled ballast samples was the same as that of the DCP with a dynamic mass
of 17.6 lbs. and a free fall distance of 22.6 in. From the top of the sample, the number of drops
required reaching depths of 3.2 inches (8.1 cm), 6.4 inches (16.3 cm), 9.6 inches (24.4 cm), 12.8
inches (32.5 cm) and 16 inches (40.6 cm) were recorded. For easy recording purposes, the
permanent markings were placed at the above mentioned heights of the vertical probe from the
probe tip. Figure 4-20 shows the level of the penetration for CBR calibration of the vertical
probe in the ballast.
Figure 4-20 Layer Depth of Vertical Probe for Calibration with DCP (Section MM in Figure 4.7)
69
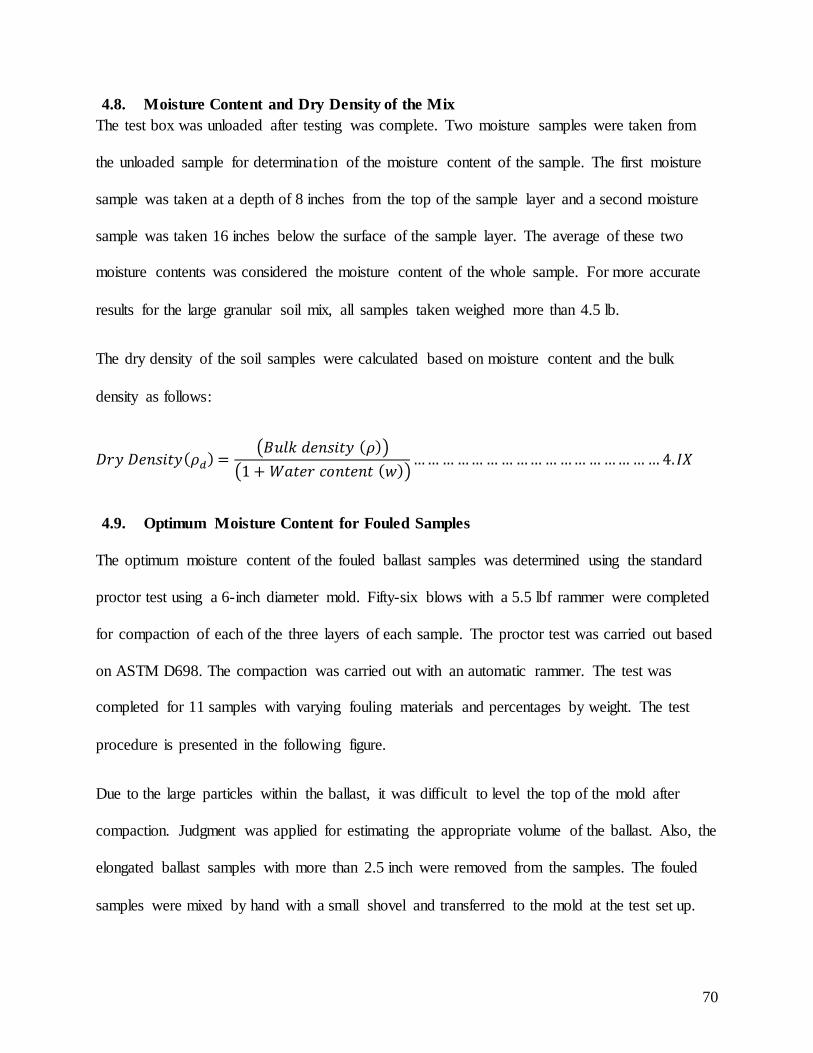
4.8. Moisture Content and Dry Density of the Mix The test box was unloaded after testing was complete. Two moisture samples were taken from
the unloaded sample for determination of the moisture content of the sample. The first moisture
sample was taken at a depth of 8 inches from the top of the sample layer and a second moisture
sample was taken 16 inches below the surface of the sample layer. The average of these two
moisture contents was considered the moisture content of the whole sample. For more accurate
results for the large granular soil mix, all samples taken weighed more than 4.5 lb.
The dry density of the soil samples were calculated based on moisture content and the bulk
density as follows:
𝐷𝐷𝑣𝑣𝐷𝐷 𝐷𝐷𝑣𝑣𝑖𝑖𝑣𝑣𝑖𝑖𝑡𝑡𝐷𝐷(𝜌𝜌𝐻𝐻) =𝑥𝑥𝐵𝐵𝑠𝑠𝐵𝐵 𝑑𝑑𝑣𝑣𝑖𝑖𝑣𝑣𝑖𝑖𝑡𝑡𝐷𝐷 (𝜌𝜌)
1 + 𝑊𝑊𝑎𝑎𝑡𝑡𝑣𝑣𝑣𝑣 𝑐𝑐𝑜𝑜𝑖𝑖𝑡𝑡𝑣𝑣𝑖𝑖𝑡𝑡 (𝑤𝑤)… … … … … … … … … … … … … … … … … 4.𝐼𝐼𝐼𝐼
4.9. Optimum Moisture Content for Fouled Samples
The optimum moisture content of the fouled ballast samples was determined using the standard
proctor test using a 6-inch diameter mold. Fifty-six blows with a 5.5 lbf rammer were completed
for compaction of each of the three layers of each sample. The proctor test was carried out based
on ASTM D698. The compaction was carried out with an automatic rammer. The test was
completed for 11 samples with varying fouling materials and percentages by weight. The test
procedure is presented in the following figure.
Due to the large particles within the ballast, it was difficult to level the top of the mold after
compaction. Judgment was applied for estimating the appropriate volume of the ballast. Also, the
elongated ballast samples with more than 2.5 inch were removed from the samples. The fouled
samples were mixed by hand with a small shovel and transferred to the mold at the test set up.
70
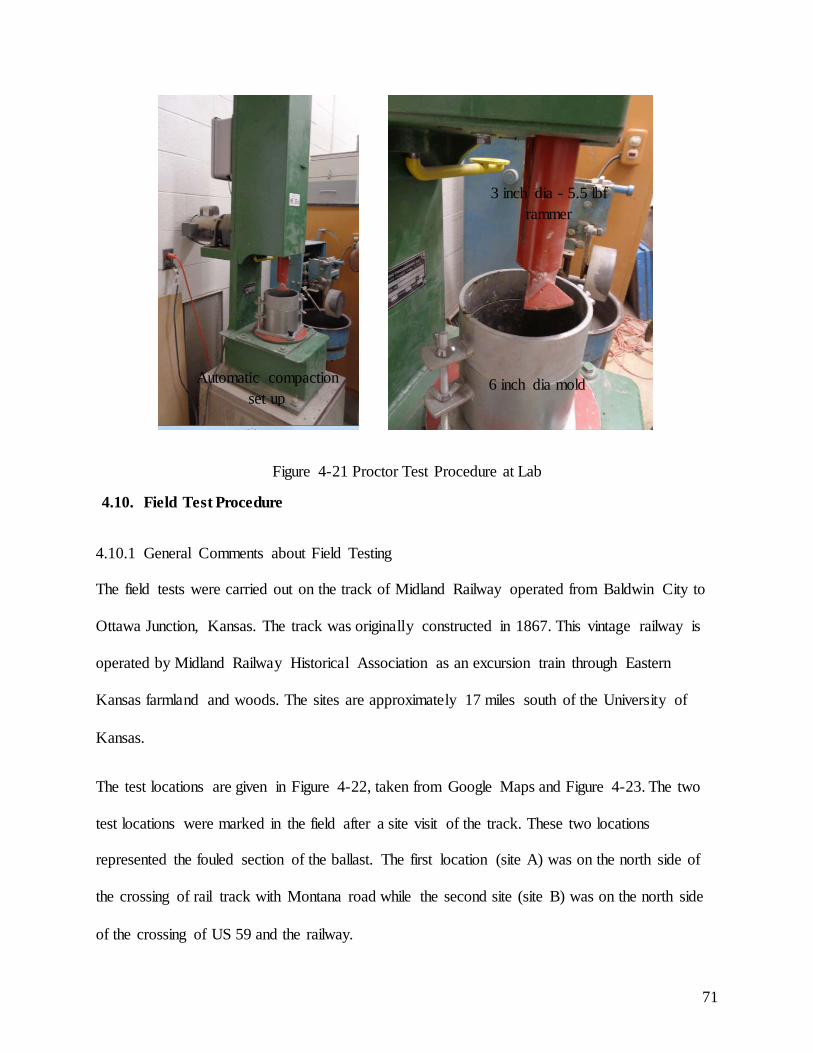
Figure 4-21 Proctor Test Procedure at Lab
4.10. Field Test Procedure
4.10.1 General Comments about Field Testing
The field tests were carried out on the track of Midland Railway operated from Baldwin City to
Ottawa Junction, Kansas. The track was originally constructed in 1867. This vintage railway is
operated by Midland Railway Historical Association as an excursion train through Eastern
Kansas farmland and woods. The sites are approximately 17 miles south of the University of
Kansas.
The test locations are given in Figure 4-22, taken from Google Maps and Figure 4-23. The two
test locations were marked in the field after a site visit of the track. These two locations
represented the fouled section of the ballast. The first location (site A) was on the north side of
the crossing of rail track with Montana road while the second site (site B) was on the north side
of the crossing of US 59 and the railway.
3 inch dia - 5.5 lbf rammer
6 inch dia mold Automatic compaction set up
71
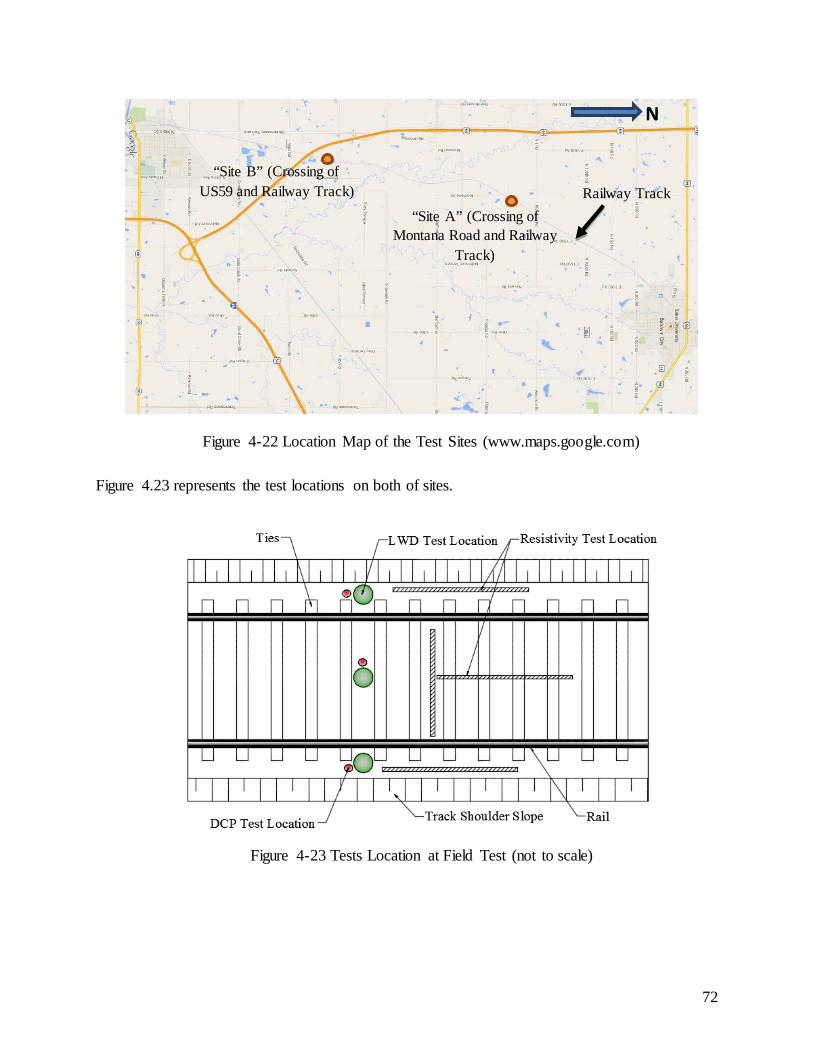
Figure 4-22 Location Map of the Test Sites (www.maps.google.com)
Figure 4.23 represents the test locations on both of sites.
Figure 4-23 Tests Location at Field Test (not to scale)
N
Railway Track “Site A” (Crossing of
Montana Road and Railway Track)
“Site B” (Crossing of US59 and Railway Track)
72
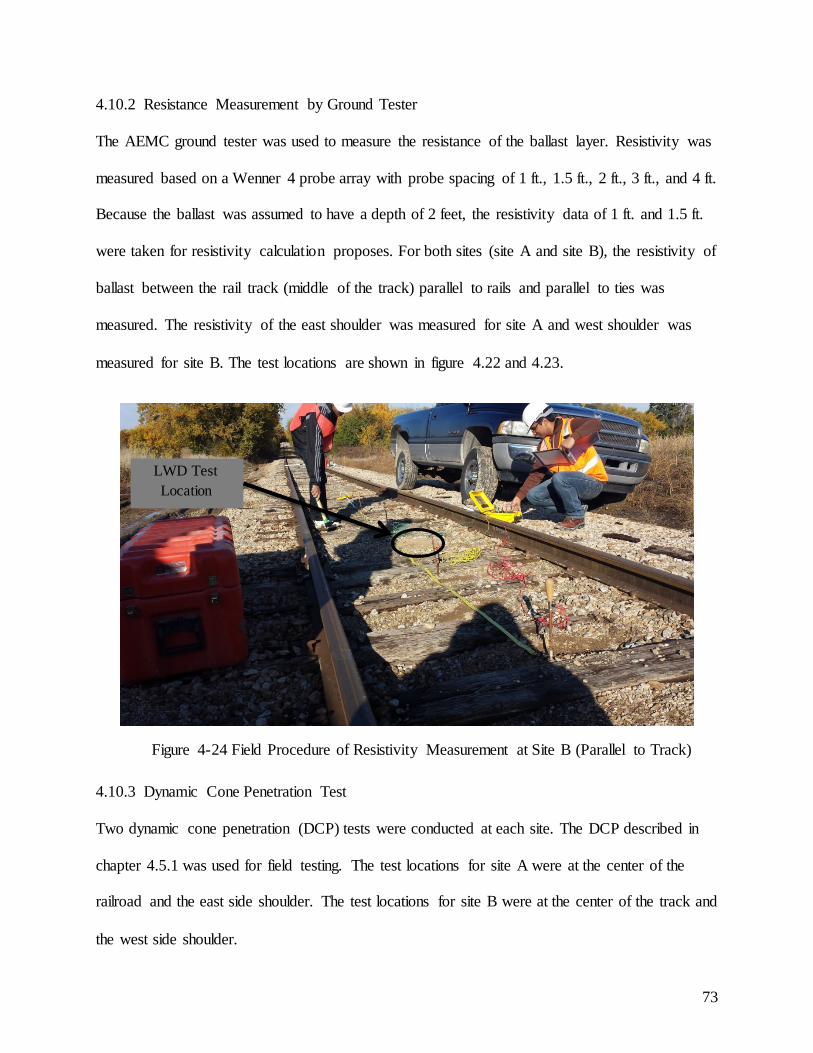
4.10.2 Resistance Measurement by Ground Tester
The AEMC ground tester was used to measure the resistance of the ballast layer. Resistivity was
measured based on a Wenner 4 probe array with probe spacing of 1 ft., 1.5 ft., 2 ft., 3 ft., and 4 ft.
Because the ballast was assumed to have a depth of 2 feet, the resistivity data of 1 ft. and 1.5 ft.
were taken for resistivity calculation proposes. For both sites (site A and site B), the resistivity of
ballast between the rail track (middle of the track) parallel to rails and parallel to ties was
measured. The resistivity of the east shoulder was measured for site A and west shoulder was
measured for site B. The test locations are shown in figure 4.22 and 4.23.
Figure 4-24 Field Procedure of Resistivity Measurement at Site B (Parallel to Track)
4.10.3 Dynamic Cone Penetration Test
Two dynamic cone penetration (DCP) tests were conducted at each site. The DCP described in
chapter 4.5.1 was used for field testing. The test locations for site A were at the center of the
railroad and the east side shoulder. The test locations for site B were at the center of the track and
the west side shoulder.
LWD Test Location
73
4.10.4 Light Weight Deflectometer Test
Two light weight deflectometer (LWD) tests were conducted at each site. The LWD described in
chapter 4.4.1 was used for field testing. The test locations for site A were at the center of the
railroad and the east side shoulder. The test locations for site B were at the center of the track and
the west side shoulder.
74
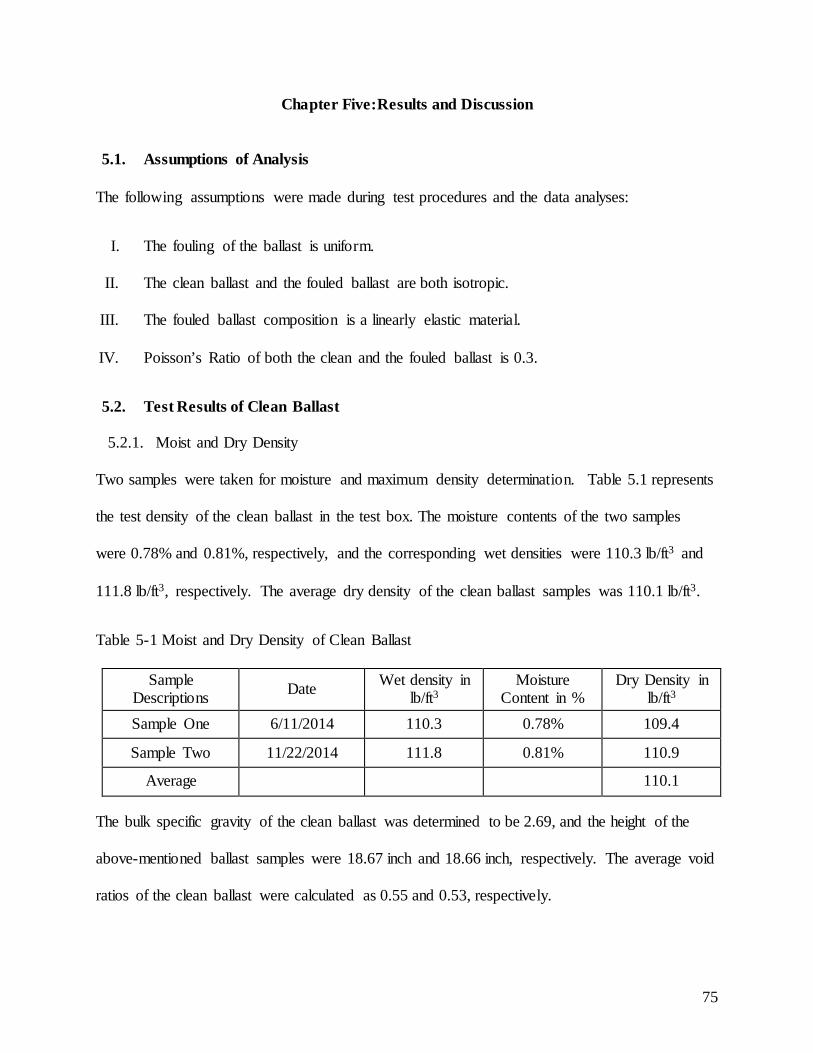
Chapter Five:Results and Discussion
5.1. Assumptions of Analysis
The following assumptions were made during test procedures and the data analyses:
I. The fouling of the ballast is uniform.
II. The clean ballast and the fouled ballast are both isotropic.
III. The fouled ballast composition is a linearly elastic material.
IV. Poisson’s Ratio of both the clean and the fouled ballast is 0.3.
5.2. Test Results of Clean Ballast
5.2.1. Moist and Dry Density
Two samples were taken for moisture and maximum density determination. Table 5.1 represents
the test density of the clean ballast in the test box. The moisture contents of the two samples
were 0.78% and 0.81%, respectively, and the corresponding wet densities were 110.3 lb/ft3 and
111.8 lb/ft3, respectively. The average dry density of the clean ballast samples was 110.1 lb/ft3.
Table 5-1 Moist and Dry Density of Clean Ballast
Sample Descriptions Date Wet density in
lb/ft3 Moisture
Content in % Dry Density in
lb/ft3 Sample One 6/11/2014 110.3 0.78% 109.4
Sample Two 11/22/2014 111.8 0.81% 110.9
Average 110.1
The bulk specific gravity of the clean ballast was determined to be 2.69, and the height of the
above-mentioned ballast samples were 18.67 inch and 18.66 inch, respectively. The average void
ratios of the clean ballast were calculated as 0.55 and 0.53, respectively.
75
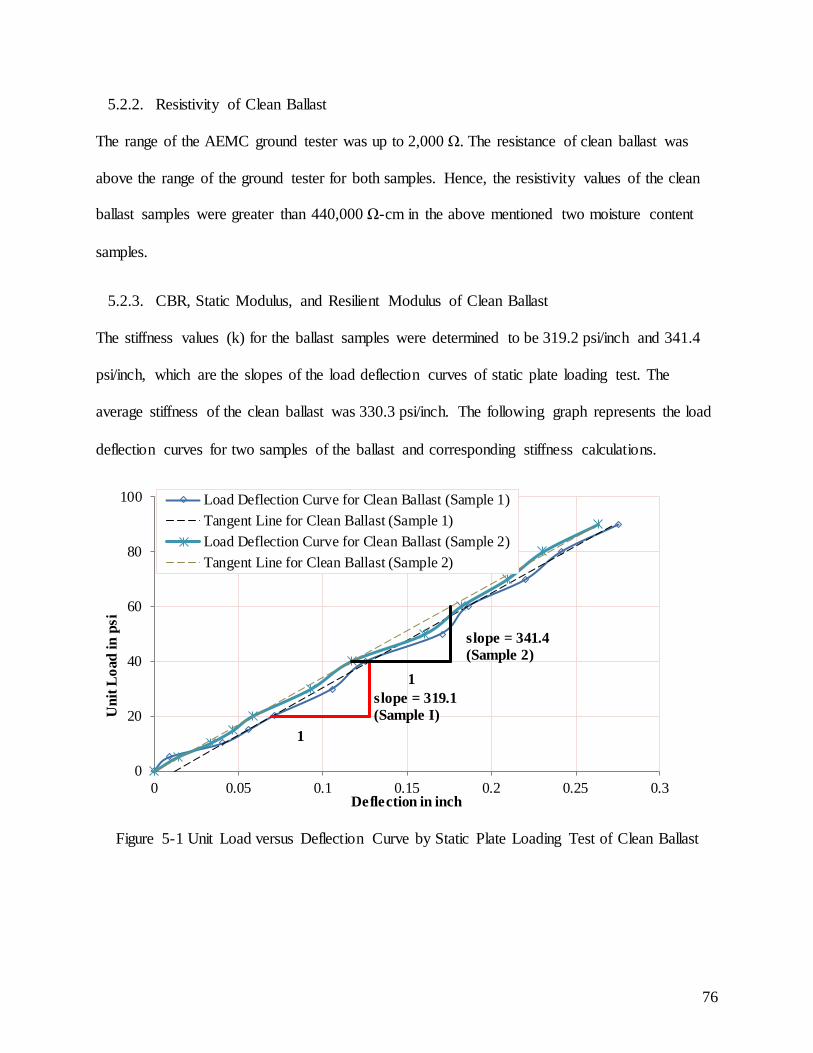
5.2.2. Resistivity of Clean Ballast
The range of the AEMC ground tester was up to 2,000 Ω. The resistance of clean ballast was
above the range of the ground tester for both samples. Hence, the resistivity values of the clean
ballast samples were greater than 440,000 Ω-cm in the above mentioned two moisture content
samples.
5.2.3. CBR, Static Modulus, and Resilient Modulus of Clean Ballast
The stiffness values (k) for the ballast samples were determined to be 319.2 psi/inch and 341.4
psi/inch, which are the slopes of the load deflection curves of static plate loading test. The
average stiffness of the clean ballast was 330.3 psi/inch. The following graph represents the load
deflection curves for two samples of the ballast and corresponding stiffness calculations.
Figure 5-1 Unit Load versus Deflection Curve by Static Plate Loading Test of Clean Ballast
0
20
40
60
80
100
0 0.05 0.1 0.15 0.2 0.25 0.3
Uni
t Loa
d in
psi
Deflection in inch
Load Deflection Curve for Clean Ballast (Sample 1)Tangent Line for Clean Ballast (Sample 1)Load Deflection Curve for Clean Ballast (Sample 2)Tangent Line for Clean Ballast (Sample 2)
1
slope = 319.1(Sample I)
slope = 341.4(Sample 2)
1
76
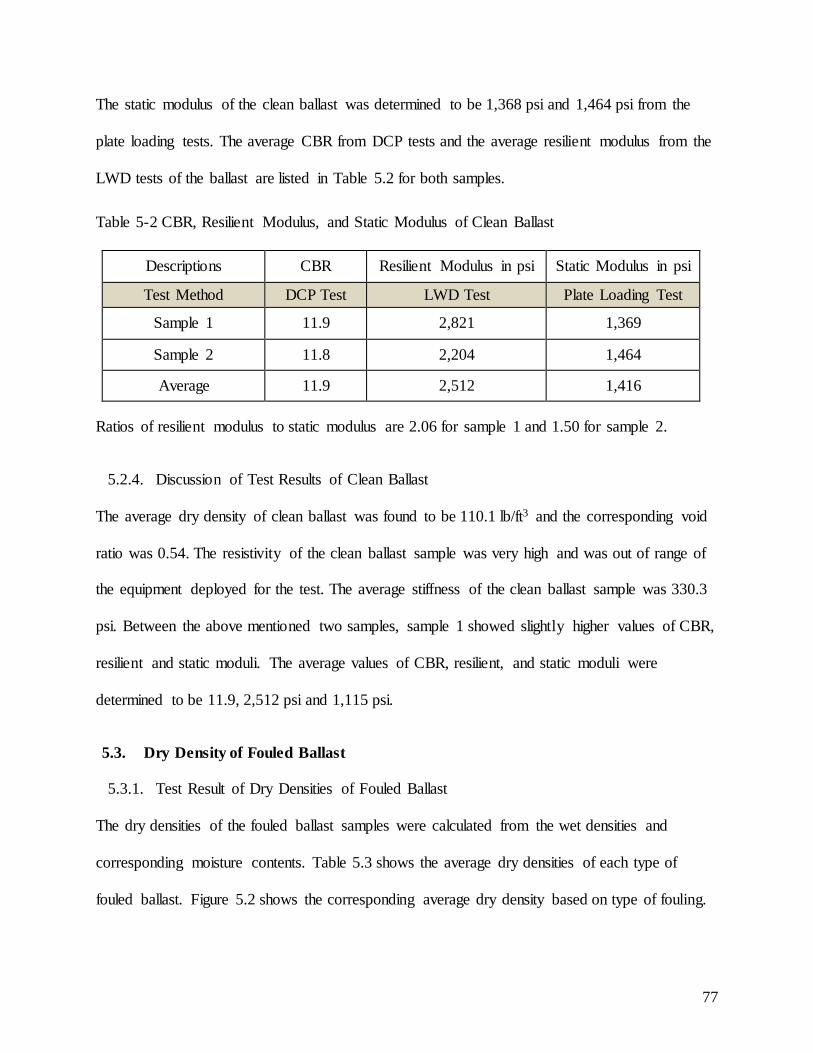
The static modulus of the clean ballast was determined to be 1,368 psi and 1,464 psi from the
plate loading tests. The average CBR from DCP tests and the average resilient modulus from the
LWD tests of the ballast are listed in Table 5.2 for both samples.
Table 5-2 CBR, Resilient Modulus, and Static Modulus of Clean Ballast
Descriptions CBR Resilient Modulus in psi Static Modulus in psi
Test Method DCP Test LWD Test Plate Loading Test
Sample 1 11.9 2,821 1,369
Sample 2 11.8 2,204 1,464
Average 11.9 2,512 1,416
Ratios of resilient modulus to static modulus are 2.06 for sample 1 and 1.50 for sample 2.
5.2.4. Discussion of Test Results of Clean Ballast
The average dry density of clean ballast was found to be 110.1 lb/ft3 and the corresponding void
ratio was 0.54. The resistivity of the clean ballast sample was very high and was out of range of
the equipment deployed for the test. The average stiffness of the clean ballast sample was 330.3
psi. Between the above mentioned two samples, sample 1 showed slightly higher values of CBR,
resilient and static moduli. The average values of CBR, resilient, and static moduli were
determined to be 11.9, 2,512 psi and 1,115 psi.
5.3. Dry Density of Fouled Ballast
5.3.1. Test Result of Dry Densities of Fouled Ballast
The dry densities of the fouled ballast samples were calculated from the wet densities and
corresponding moisture contents. Table 5.3 shows the average dry densities of each type of
fouled ballast. Figure 5.2 shows the corresponding average dry density based on type of fouling.
77
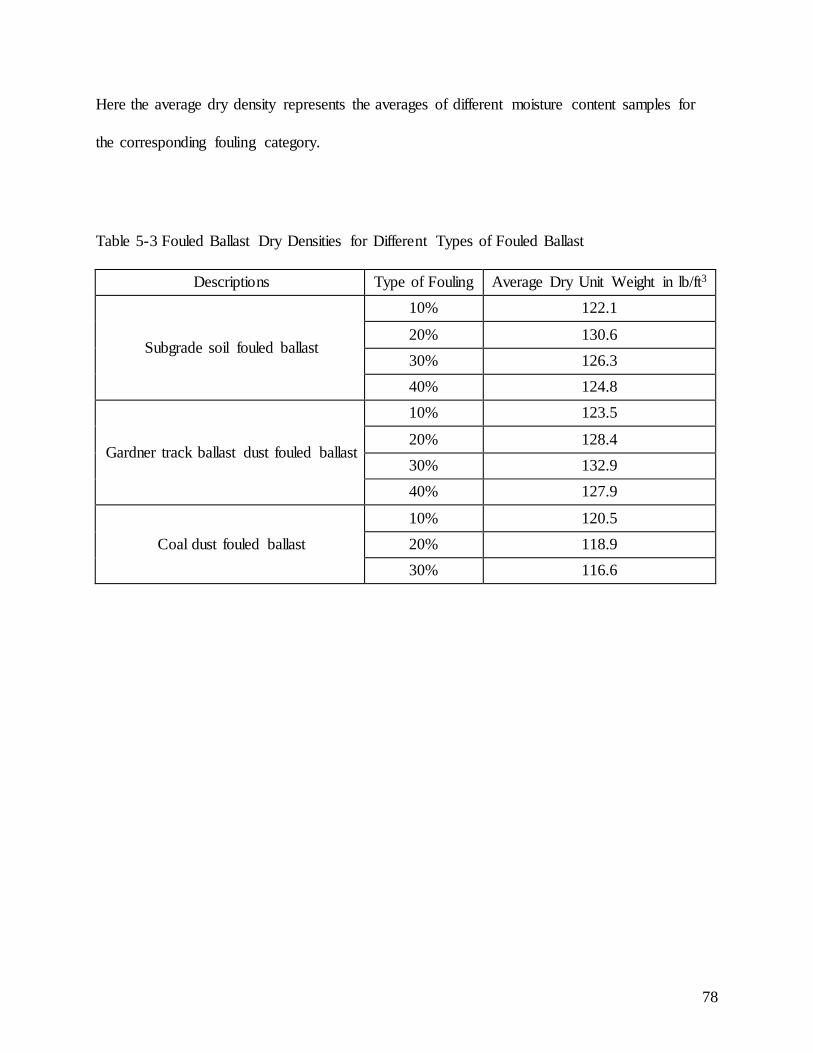
Here the average dry density represents the averages of different moisture content samples for
the corresponding fouling category.
Table 5-3 Fouled Ballast Dry Densities for Different Types of Fouled Ballast
Descriptions Type of Fouling Average Dry Unit Weight in lb/ft3
Subgrade soil fouled ballast
10% 122.1
20% 130.6 30% 126.3 40% 124.8
Gardner track ballast dust fouled ballast
10% 123.5
20% 128.4 30% 132.9 40% 127.9
Coal dust fouled ballast 10% 120.5 20% 118.9 30% 116.6
78
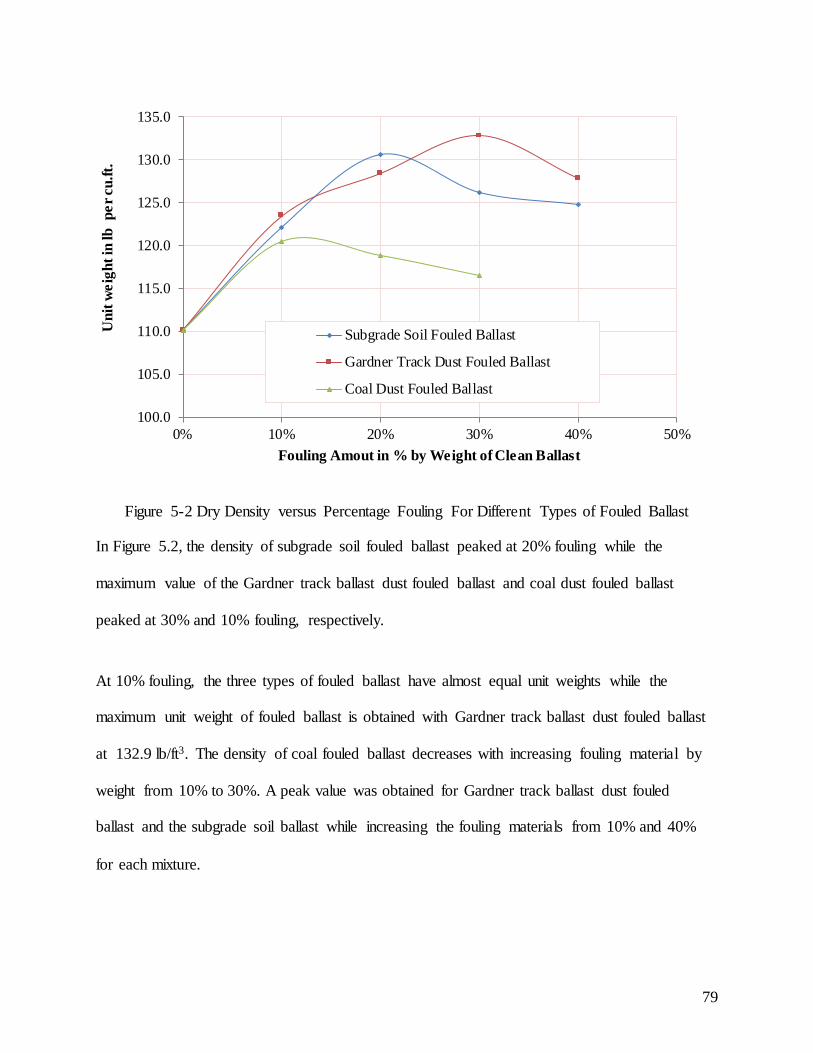
Figure 5-2 Dry Density versus Percentage Fouling For Different Types of Fouled Ballast
In Figure 5.2, the density of subgrade soil fouled ballast peaked at 20% fouling while the
maximum value of the Gardner track ballast dust fouled ballast and coal dust fouled ballast
peaked at 30% and 10% fouling, respectively.
At 10% fouling, the three types of fouled ballast have almost equal unit weights while the
maximum unit weight of fouled ballast is obtained with Gardner track ballast dust fouled ballast
at 132.9 lb/ft3. The density of coal fouled ballast decreases with increasing fouling material by
weight from 10% to 30%. A peak value was obtained for Gardner track ballast dust fouled
ballast and the subgrade soil ballast while increasing the fouling materials from 10% and 40%
for each mixture.
100.0
105.0
110.0
115.0
120.0
125.0
130.0
135.0
0% 10% 20% 30% 40% 50%
Uni
t wei
ght i
n lb
per
cu.
ft.
Fouling Amout in % by Weight of Clean Ballast
Subgrade Soil Fouled Ballast
Gardner Track Dust Fouled Ballast
Coal Dust Fouled Ballast
79
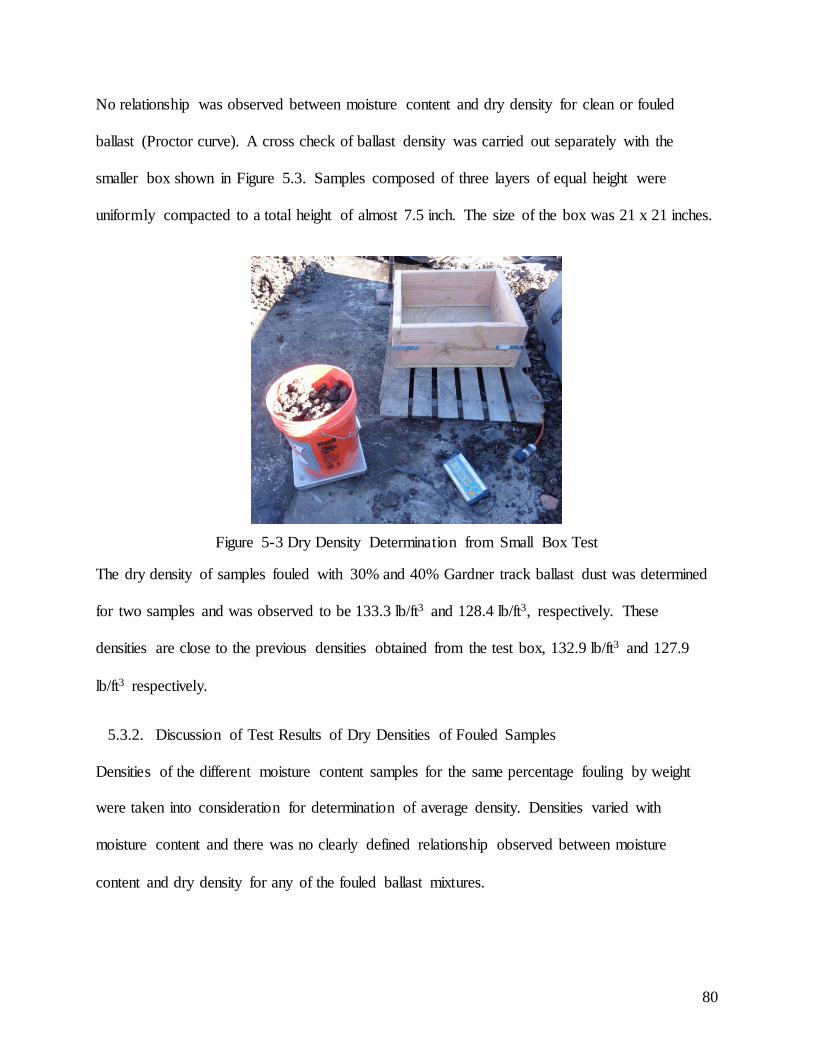
No relationship was observed between moisture content and dry density for clean or fouled
ballast (Proctor curve). A cross check of ballast density was carried out separately with the
smaller box shown in Figure 5.3. Samples composed of three layers of equal height were
uniformly compacted to a total height of almost 7.5 inch. The size of the box was 21 x 21 inches.
Figure 5-3 Dry Density Determination from Small Box Test
The dry density of samples fouled with 30% and 40% Gardner track ballast dust was determined
for two samples and was observed to be 133.3 lb/ft3 and 128.4 lb/ft3, respectively. These
densities are close to the previous densities obtained from the test box, 132.9 lb/ft3 and 127.9
lb/ft3 respectively.
5.3.2. Discussion of Test Results of Dry Densities of Fouled Samples
Densities of the different moisture content samples for the same percentage fouling by weight
were taken into consideration for determination of average density. Densities varied with
moisture content and there was no clearly defined relationship observed between moisture
content and dry density for any of the fouled ballast mixtures.
80
Gardner track ballast dust fouled ballast had the highest dry densities followed by the subgrade
soil fouled ballast and coal fouled ballast for a particular percentage of fouling by weight.
Densities of Gardner track ballast dust fouled ballast varied from 122.1 lb/ft3 to 130.6 lb/ft
depending upon the amount of fouling. The maximum dry density of Gardner track ballast dust
fouled ballast was 132.9 at 30% fouling by weight and the minimum value was 123.5 lb/ft3. The
coal fouled ballast density decreased as the percentage of fouling increased from 10% to 30%
fouling by weight. A cross check of densities from the small box test were valid for 30% and
40% by weight of Gardner track ballast dust fouled ballast and were very near to the previous
test results.
5.4. Boundary Effect of Resistivity Test on Test Box
5.4.1. Test Result of Boundary Effect of Resistivity on Test Box
The resistivity of the fouled ballast was calculated using the relationship mentioned in equation
2.II from the resistance obtained from the ground resistance tester. Resistivity measurements for
a series of fouled ballast moistures are shown in Figures 5.4 through 5.14. The resistivity
calculated from the data obtained by the Wenner four point method shows that the resistivity
changed substantially for measurements 1.5 inches and 4 inches from the boundary. However,
the resistivity measured for 8 inches, 11 inches, and 15.88 inches experienced significantly less
deviation.
81
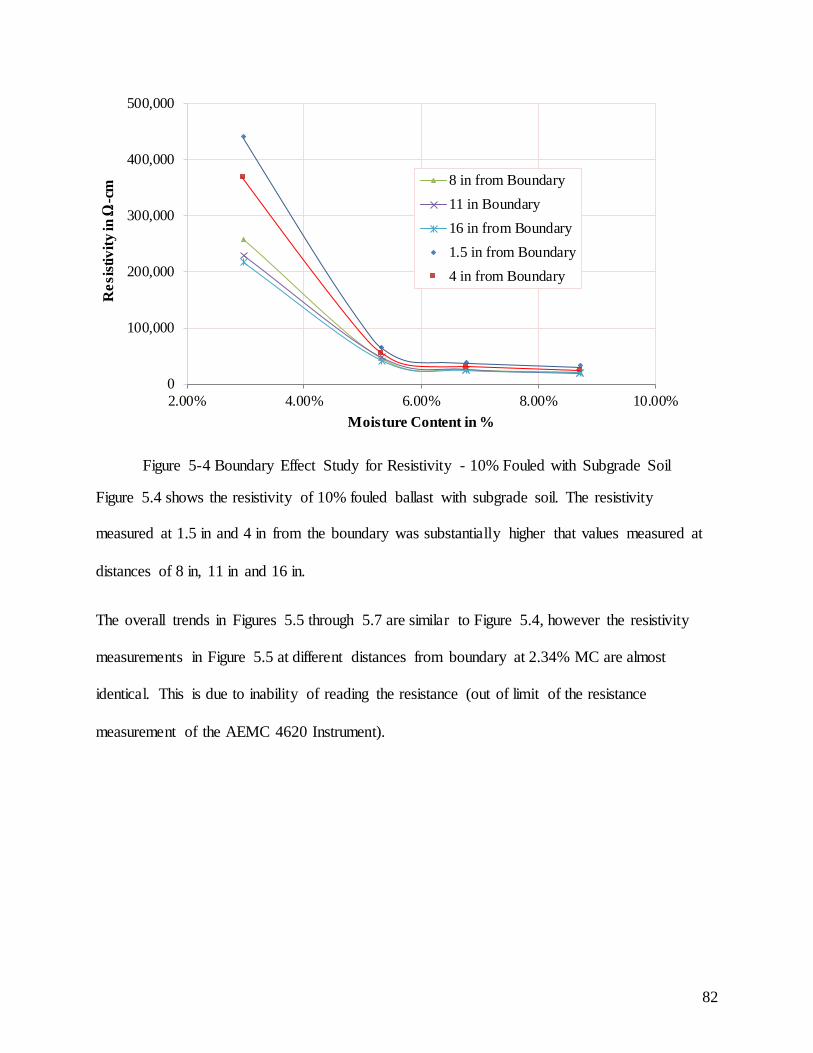
Figure 5-4 Boundary Effect Study for Resistivity - 10% Fouled with Subgrade Soil
Figure 5.4 shows the resistivity of 10% fouled ballast with subgrade soil. The resistivity
measured at 1.5 in and 4 in from the boundary was substantially higher that values measured at
distances of 8 in, 11 in and 16 in.
The overall trends in Figures 5.5 through 5.7 are similar to Figure 5.4, however the resistivity
measurements in Figure 5.5 at different distances from boundary at 2.34% MC are almost
identical. This is due to inability of reading the resistance (out of limit of the resistance
measurement of the AEMC 4620 Instrument).
0
100,000
200,000
300,000
400,000
500,000
2.00% 4.00% 6.00% 8.00% 10.00%
Res
istiv
ity in
Ω-c
m
Moisture Content in %
8 in from Boundary11 in Boundary16 in from Boundary1.5 in from Boundary4 in from Boundary
82
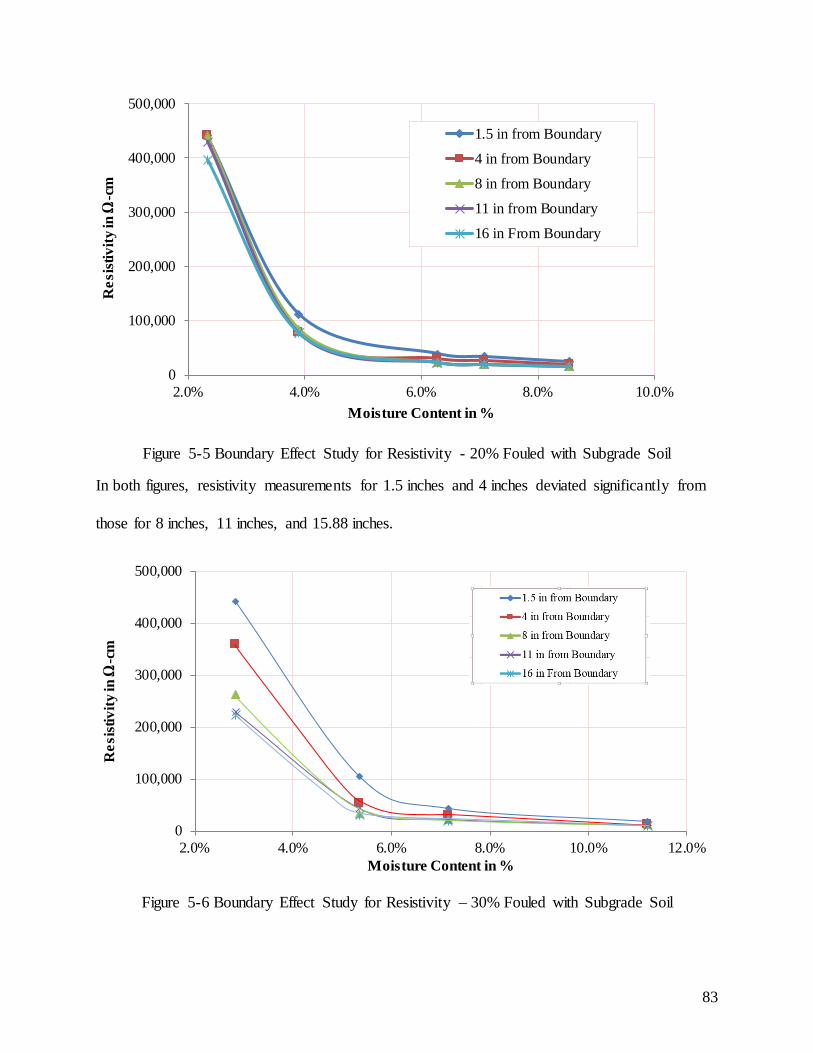
Figure 5-5 Boundary Effect Study for Resistivity - 20% Fouled with Subgrade Soil
In both figures, resistivity measurements for 1.5 inches and 4 inches deviated significantly from
those for 8 inches, 11 inches, and 15.88 inches.
Figure 5-6 Boundary Effect Study for Resistivity – 30% Fouled with Subgrade Soil
0
100,000
200,000
300,000
400,000
500,000
2.0% 4.0% 6.0% 8.0% 10.0%
Res
istiv
ity in
Ω-c
m
Moisture Content in %
1.5 in from Boundary
4 in from Boundary
8 in from Boundary
11 in from Boundary
16 in From Boundary
0
100,000
200,000
300,000
400,000
500,000
2.0% 4.0% 6.0% 8.0% 10.0% 12.0%
Res
istiv
ity in
Ω-c
m
Moisture Content in %
83
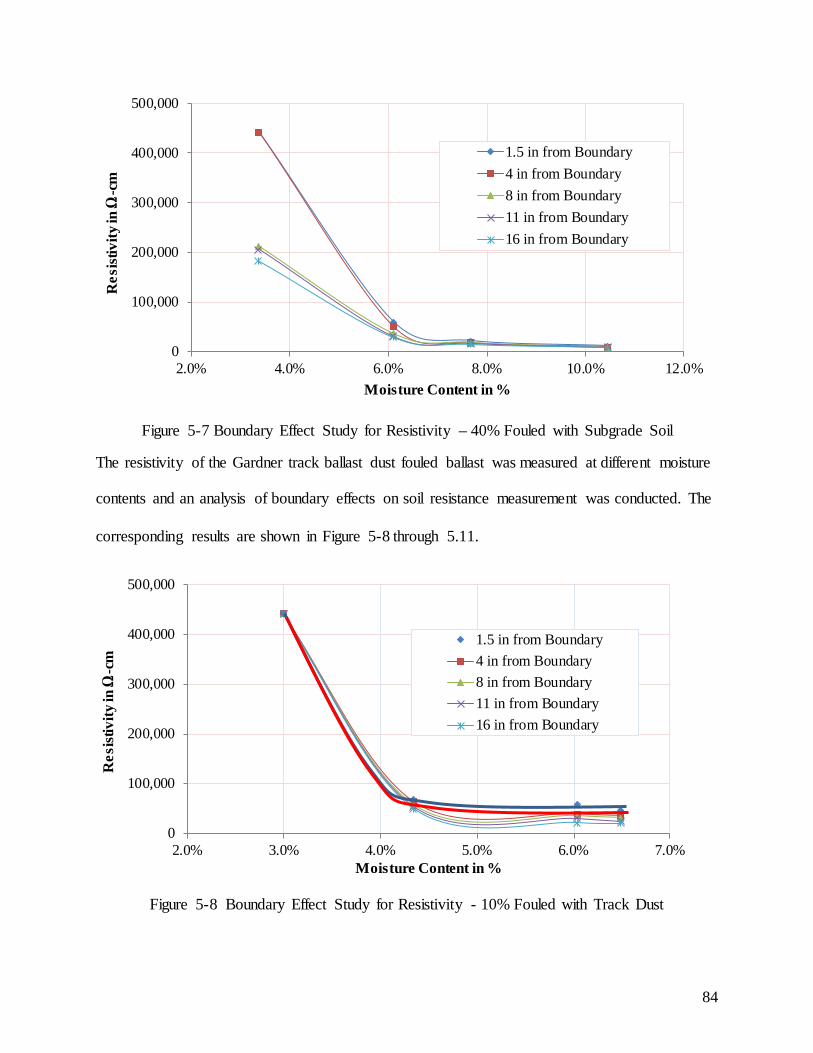
Figure 5-7 Boundary Effect Study for Resistivity – 40% Fouled with Subgrade Soil
The resistivity of the Gardner track ballast dust fouled ballast was measured at different moisture
contents and an analysis of boundary effects on soil resistance measurement was conducted. The
corresponding results are shown in Figure 5-8 through 5.11.
Figure 5-8 Boundary Effect Study for Resistivity - 10% Fouled with Track Dust
0
100,000
200,000
300,000
400,000
500,000
2.0% 4.0% 6.0% 8.0% 10.0% 12.0%
Res
istiv
ity in
Ω-c
m
Moisture Content in %
1.5 in from Boundary4 in from Boundary8 in from Boundary11 in from Boundary16 in from Boundary
0
100,000
200,000
300,000
400,000
500,000
2.0% 3.0% 4.0% 5.0% 6.0% 7.0%
Res
istiv
ity in
Ω-c
m
Moisture Content in %
1.5 in from Boundary4 in from Boundary8 in from Boundary11 in from Boundary16 in from Boundary
84
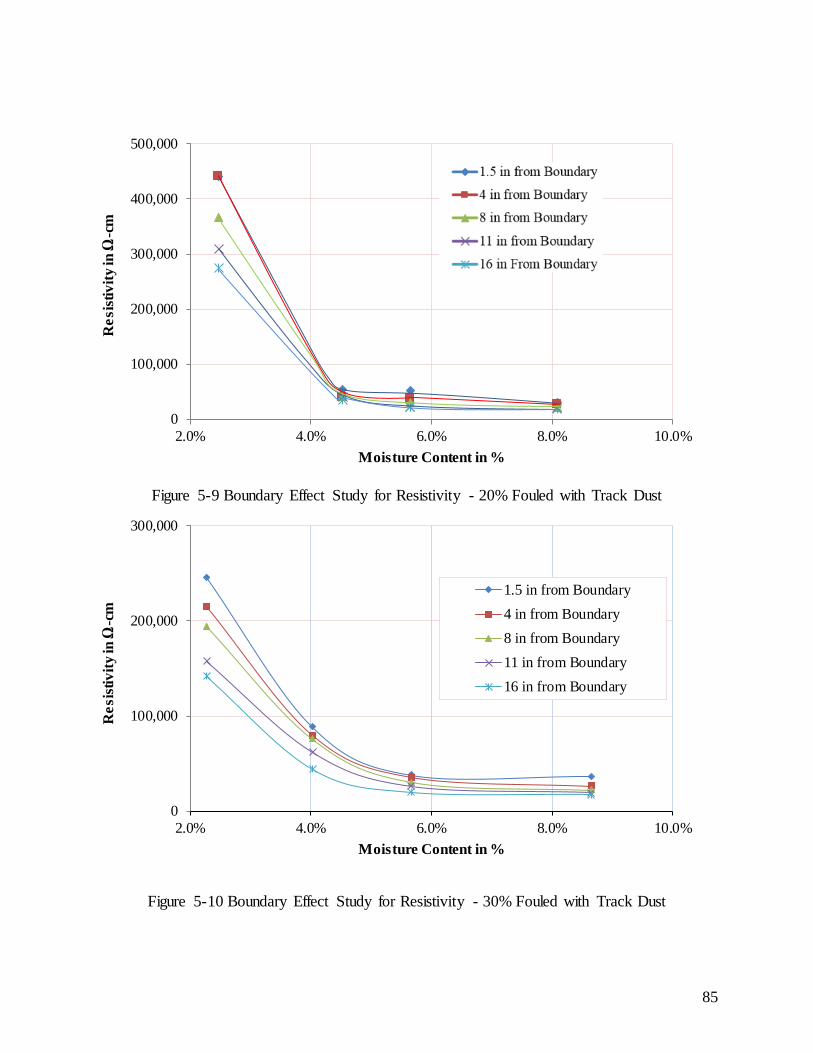
Figure 5-9 Boundary Effect Study for Resistivity - 20% Fouled with Track Dust
Figure 5-10 Boundary Effect Study for Resistivity - 30% Fouled with Track Dust
0
100,000
200,000
300,000
400,000
500,000
2.0% 4.0% 6.0% 8.0% 10.0%
Res
istiv
ity in
Ω-c
m
Moisture Content in %
0
100,000
200,000
300,000
2.0% 4.0% 6.0% 8.0% 10.0%
Res
istiv
ity in
Ω-c
m
Moisture Content in %
1.5 in from Boundary4 in from Boundary8 in from Boundary11 in from Boundary16 in from Boundary
85
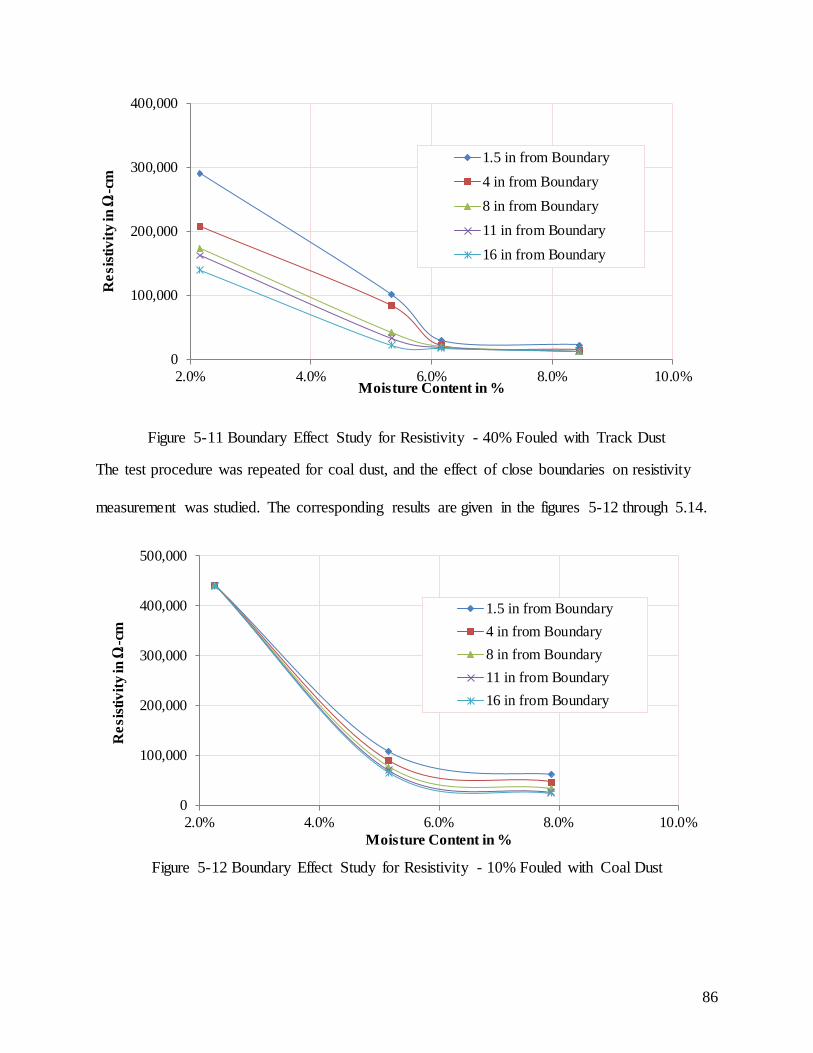
Figure 5-11 Boundary Effect Study for Resistivity - 40% Fouled with Track Dust
The test procedure was repeated for coal dust, and the effect of close boundaries on resistivity
measurement was studied. The corresponding results are given in the figures 5-12 through 5.14.
Figure 5-12 Boundary Effect Study for Resistivity - 10% Fouled with Coal Dust
0
100,000
200,000
300,000
400,000
2.0% 4.0% 6.0% 8.0% 10.0%
Res
istiv
ity in
Ω-c
m
Moisture Content in %
1.5 in from Boundary4 in from Boundary8 in from Boundary11 in from Boundary16 in from Boundary
0
100,000
200,000
300,000
400,000
500,000
2.0% 4.0% 6.0% 8.0% 10.0%
Res
istiv
ity in
Ω-c
m
Moisture Content in %
1.5 in from Boundary4 in from Boundary8 in from Boundary11 in from Boundary16 in from Boundary
86
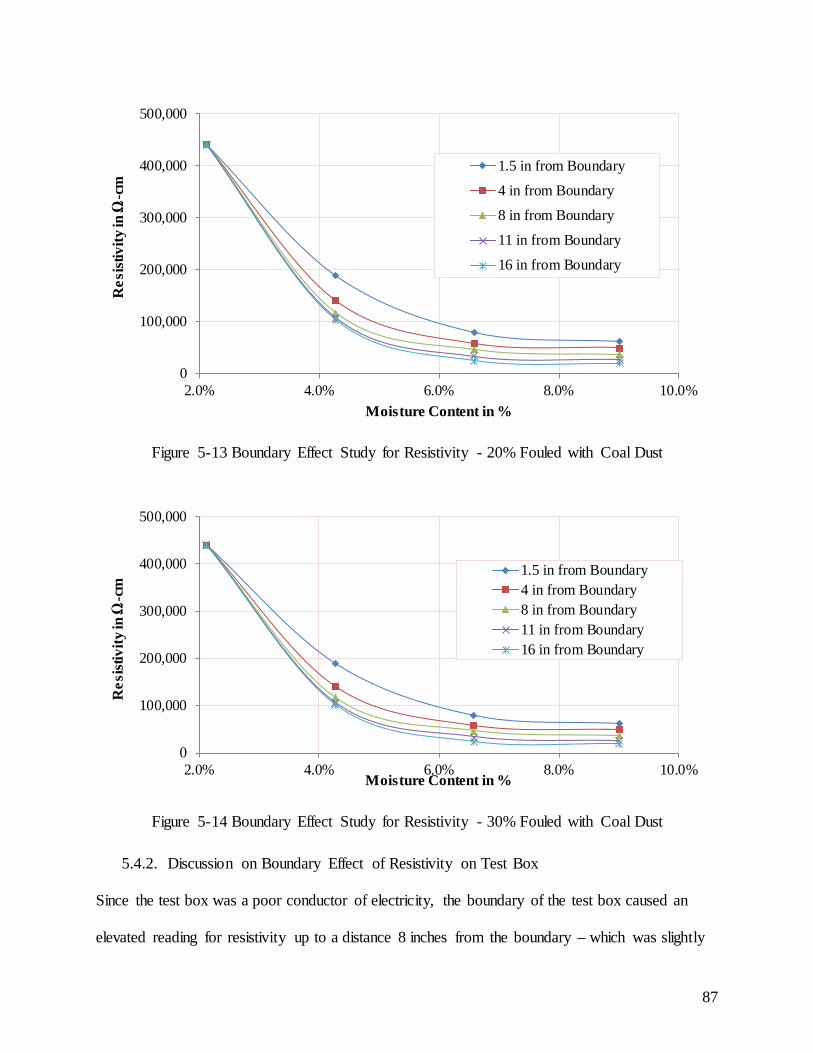
Figure 5-13 Boundary Effect Study for Resistivity - 20% Fouled with Coal Dust
Figure 5-14 Boundary Effect Study for Resistivity - 30% Fouled with Coal Dust
5.4.2. Discussion on Boundary Effect of Resistivity on Test Box
Since the test box was a poor conductor of electricity, the boundary of the test box caused an
elevated reading for resistivity up to a distance 8 inches from the boundary – which was slightly
0
100,000
200,000
300,000
400,000
500,000
2.0% 4.0% 6.0% 8.0% 10.0%
Res
istiv
ity in
Ω-c
m
Moisture Content in %
1.5 in from Boundary
4 in from Boundary
8 in from Boundary
11 in from Boundary
16 in from Boundary
0
100,000
200,000
300,000
400,000
500,000
2.0% 4.0% 6.0% 8.0% 10.0%
Res
istiv
ity in
Ω-c
m
Moisture Content in %
1.5 in from Boundary4 in from Boundary8 in from Boundary11 in from Boundary16 in from Boundary
87
greater than the probe spacing of 7 inches. The length of the probes may be the controlling
distance for the boundary effect. If the probe spacing was lower, the boundary effect distance
may be lower. Moreover, the penetration depth of the probe was 4 inches, and the effect was
negligible at twice the penetration depth. Hence, the boundary effect is likely a function of the
probe spacing and the penetration depth of probes.
It was observed that the variations of resistivity for subgrade soil due to the boundary effect were
lower as compared to Gardner track ballast dust fouled ballast and coal dust fouled ballast. This
suggests that if the medium is a comparatively good conductor, there is less effect from the
boundary.
5.5. Result of Resistivity Testing by the Wenner Four Point Method
5.5.1. Resistivity Test Result - Subgrade Soil Fouled Ballast
Figure 5.15 and 5.16 presents the test results of resistivity of subgrade soil fouled ballast for
different percentages of fouling by weight. Figure 5.16 is a close-up view of figure 5.15.
88
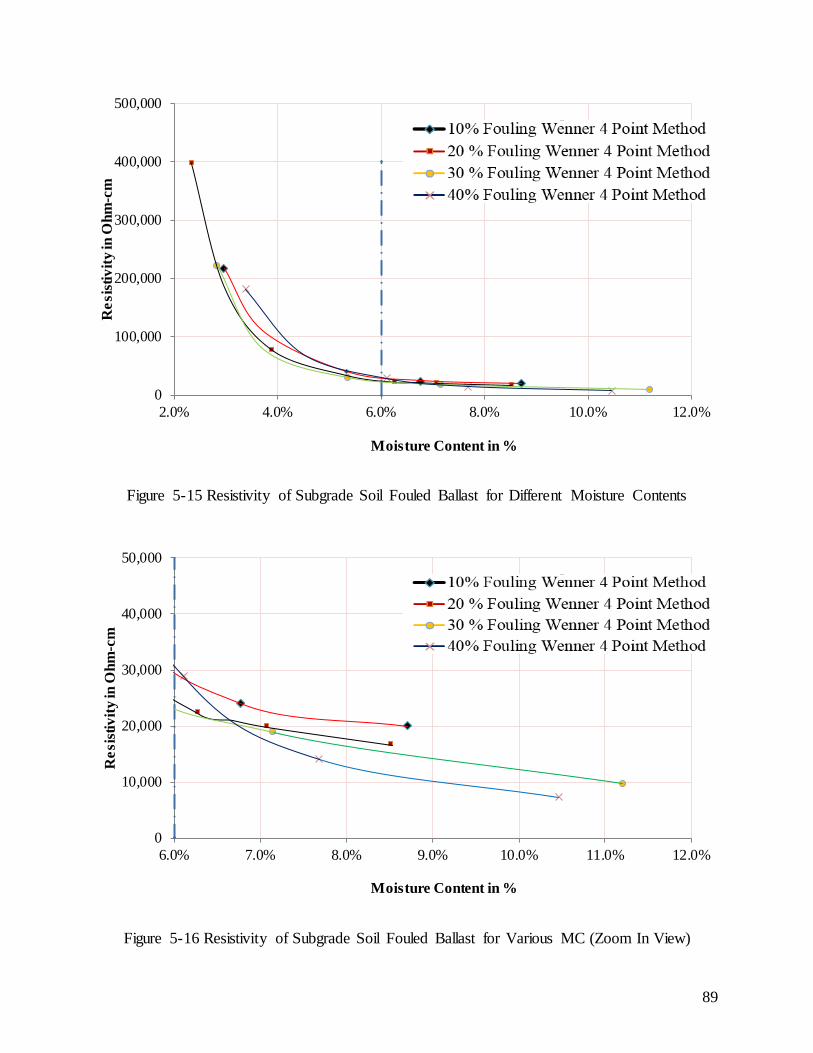
Figure 5-15 Resistivity of Subgrade Soil Fouled Ballast for Different Moisture Contents
Figure 5-16 Resistivity of Subgrade Soil Fouled Ballast for Various MC (Zoom In View)
0
100,000
200,000
300,000
400,000
500,000
2.0% 4.0% 6.0% 8.0% 10.0% 12.0%
Res
istiv
ity in
Ohm
-cm
Moisture Content in %
0
10,000
20,000
30,000
40,000
50,000
6.0% 7.0% 8.0% 9.0% 10.0% 11.0% 12.0%
Res
istiv
ity in
Ohm
-cm
Moisture Content in %
89
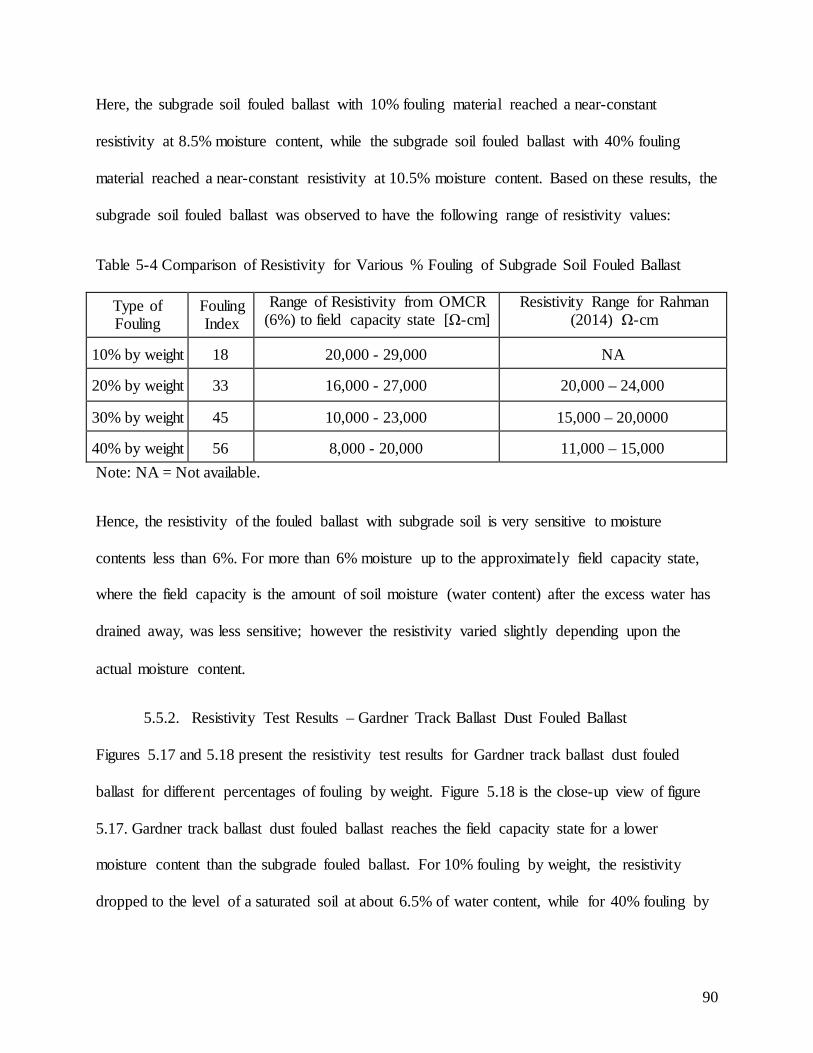
Here, the subgrade soil fouled ballast with 10% fouling material reached a near-constant
resistivity at 8.5% moisture content, while the subgrade soil fouled ballast with 40% fouling
material reached a near-constant resistivity at 10.5% moisture content. Based on these results, the
subgrade soil fouled ballast was observed to have the following range of resistivity values:
Table 5-4 Comparison of Resistivity for Various % Fouling of Subgrade Soil Fouled Ballast
Type of Fouling
Fouling Index
Range of Resistivity from OMCR (6%) to field capacity state [Ω-cm]
Resistivity Range for Rahman (2014) Ω-cm
10% by weight 18 20,000 - 29,000 NA
20% by weight 33 16,000 - 27,000 20,000 – 24,000
30% by weight 45 10,000 - 23,000 15,000 – 20,0000
40% by weight 56 8,000 - 20,000 11,000 – 15,000 Note: NA = Not available.
Hence, the resistivity of the fouled ballast with subgrade soil is very sensitive to moisture
contents less than 6%. For more than 6% moisture up to the approximately field capacity state,
where the field capacity is the amount of soil moisture (water content) after the excess water has
drained away, was less sensitive; however the resistivity varied slightly depending upon the
actual moisture content.
5.5.2. Resistivity Test Results – Gardner Track Ballast Dust Fouled Ballast
Figures 5.17 and 5.18 present the resistivity test results for Gardner track ballast dust fouled
ballast for different percentages of fouling by weight. Figure 5.18 is the close-up view of figure
5.17. Gardner track ballast dust fouled ballast reaches the field capacity state for a lower
moisture content than the subgrade fouled ballast. For 10% fouling by weight, the resistivity
dropped to the level of a saturated soil at about 6.5% of water content, while for 40% fouling by
90
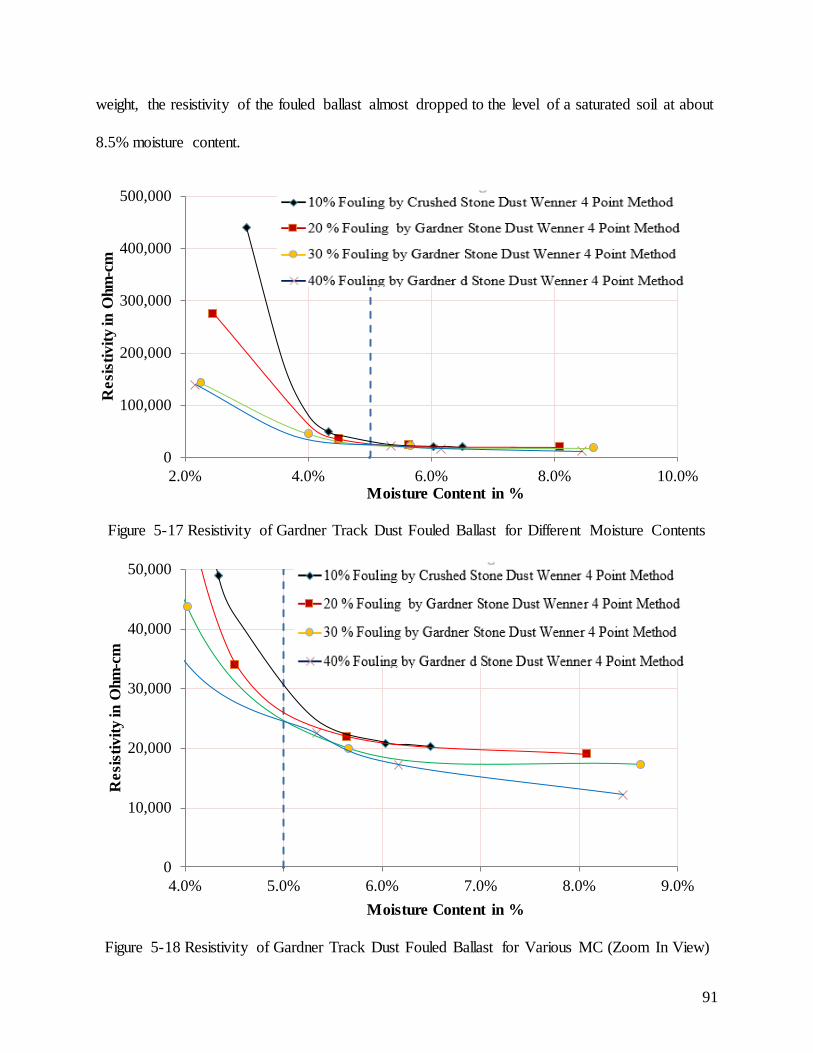
weight, the resistivity of the fouled ballast almost dropped to the level of a saturated soil at about
8.5% moisture content.
Figure 5-17 Resistivity of Gardner Track Dust Fouled Ballast for Different Moisture Contents
Figure 5-18 Resistivity of Gardner Track Dust Fouled Ballast for Various MC (Zoom In View)
0
100,000
200,000
300,000
400,000
500,000
2.0% 4.0% 6.0% 8.0% 10.0%
Res
istiv
ity in
Ohm
-cm
Moisture Content in %
0
10,000
20,000
30,000
40,000
50,000
4.0% 5.0% 6.0% 7.0% 8.0% 9.0%
Res
istiv
ity in
Ohm
-cm
Moisture Content in %
91
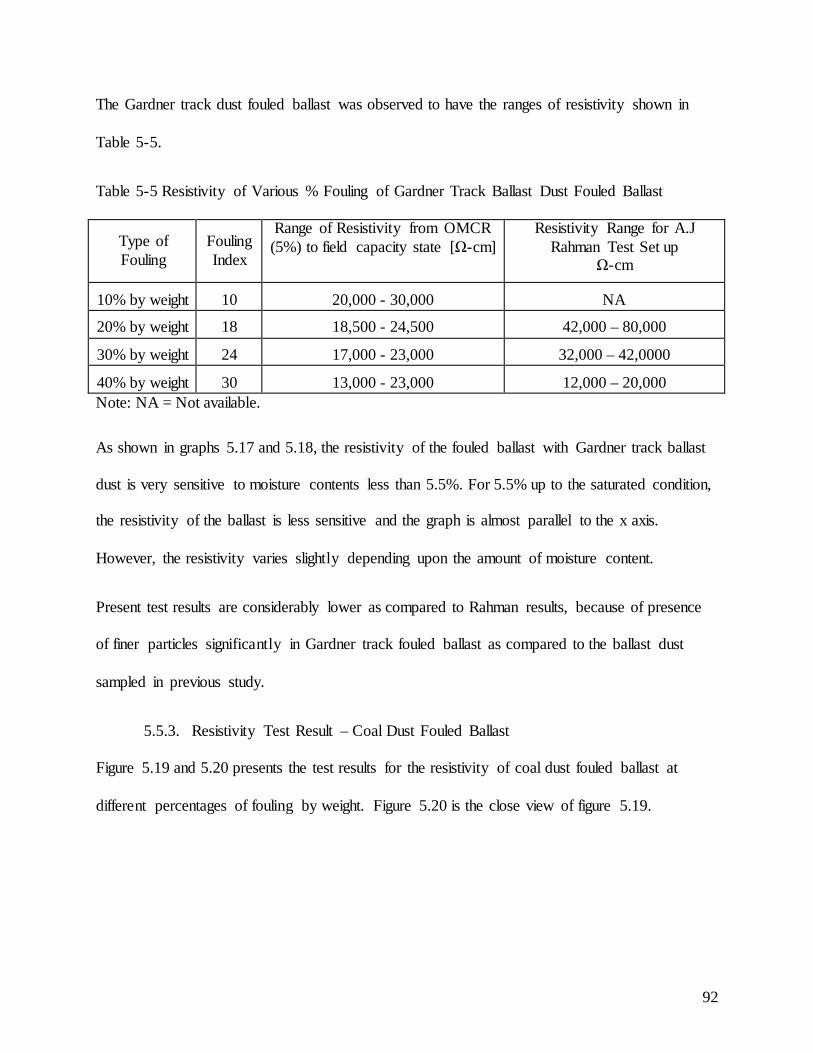
The Gardner track dust fouled ballast was observed to have the ranges of resistivity shown in
Table 5-5.
Table 5-5 Resistivity of Various % Fouling of Gardner Track Ballast Dust Fouled Ballast
Type of Fouling
Fouling Index
Range of Resistivity from OMCR (5%) to field capacity state [Ω-cm]
Resistivity Range for A.J Rahman Test Set up
Ω-cm
10% by weight 10 20,000 - 30,000 NA
20% by weight 18 18,500 - 24,500 42,000 – 80,000
30% by weight 24 17,000 - 23,000 32,000 – 42,0000
40% by weight 30 13,000 - 23,000 12,000 – 20,000 Note: NA = Not available.
As shown in graphs 5.17 and 5.18, the resistivity of the fouled ballast with Gardner track ballast
dust is very sensitive to moisture contents less than 5.5%. For 5.5% up to the saturated condition,
the resistivity of the ballast is less sensitive and the graph is almost parallel to the x axis.
However, the resistivity varies slightly depending upon the amount of moisture content.
Present test results are considerably lower as compared to Rahman results, because of presence
of finer particles significantly in Gardner track fouled ballast as compared to the ballast dust
sampled in previous study.
5.5.3. Resistivity Test Result – Coal Dust Fouled Ballast
Figure 5.19 and 5.20 presents the test results for the resistivity of coal dust fouled ballast at
different percentages of fouling by weight. Figure 5.20 is the close view of figure 5.19.
92
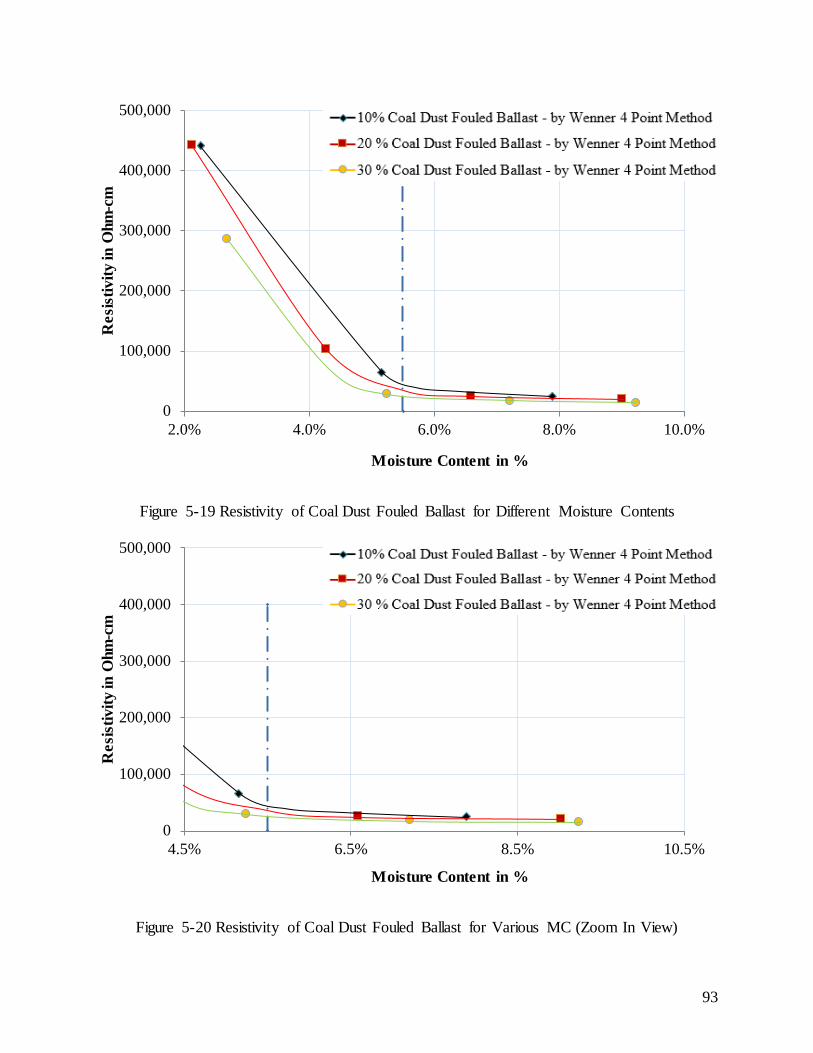
Figure 5-19 Resistivity of Coal Dust Fouled Ballast for Different Moisture Contents
Figure 5-20 Resistivity of Coal Dust Fouled Ballast for Various MC (Zoom In View)
0
100,000
200,000
300,000
400,000
500,000
2.0% 4.0% 6.0% 8.0% 10.0%
Res
istiv
ity in
Ohm
-cm
Moisture Content in %
0
100,000
200,000
300,000
400,000
500,000
4.5% 6.5% 8.5% 10.5%
Res
istiv
ity in
Ohm
-cm
Moisture Content in %
93
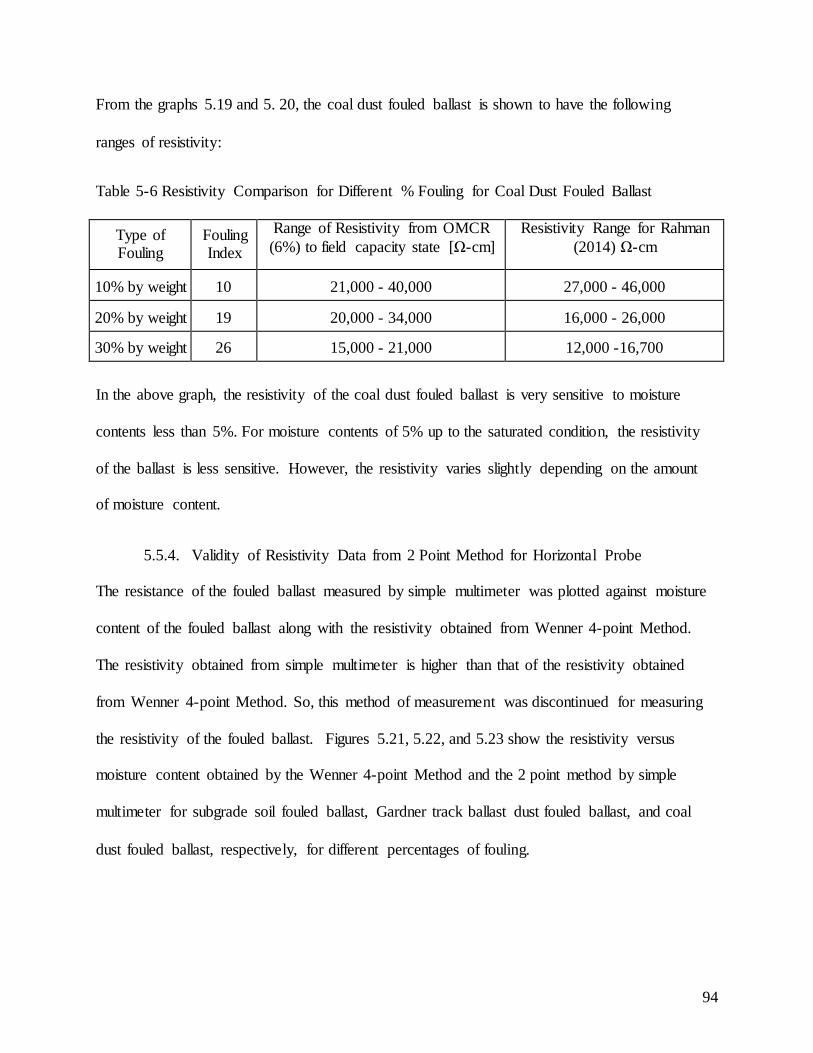
From the graphs 5.19 and 5. 20, the coal dust fouled ballast is shown to have the following
ranges of resistivity:
Table 5-6 Resistivity Comparison for Different % Fouling for Coal Dust Fouled Ballast
Type of Fouling
Fouling Index
Range of Resistivity from OMCR (6%) to field capacity state [Ω-cm]
Resistivity Range for Rahman (2014) Ω-cm
10% by weight 10 21,000 - 40,000 27,000 - 46,000
20% by weight 19 20,000 - 34,000 16,000 - 26,000
30% by weight 26 15,000 - 21,000 12,000 -16,700
In the above graph, the resistivity of the coal dust fouled ballast is very sensitive to moisture
contents less than 5%. For moisture contents of 5% up to the saturated condition, the resistivity
of the ballast is less sensitive. However, the resistivity varies slightly depending on the amount
of moisture content.
5.5.4. Validity of Resistivity Data from 2 Point Method for Horizontal Probe
The resistance of the fouled ballast measured by simple multimeter was plotted against moisture
content of the fouled ballast along with the resistivity obtained from Wenner 4-point Method.
The resistivity obtained from simple multimeter is higher than that of the resistivity obtained
from Wenner 4-point Method. So, this method of measurement was discontinued for measuring
the resistivity of the fouled ballast. Figures 5.21, 5.22, and 5.23 show the resistivity versus
moisture content obtained by the Wenner 4-point Method and the 2 point method by simple
multimeter for subgrade soil fouled ballast, Gardner track ballast dust fouled ballast, and coal
dust fouled ballast, respectively, for different percentages of fouling.
94
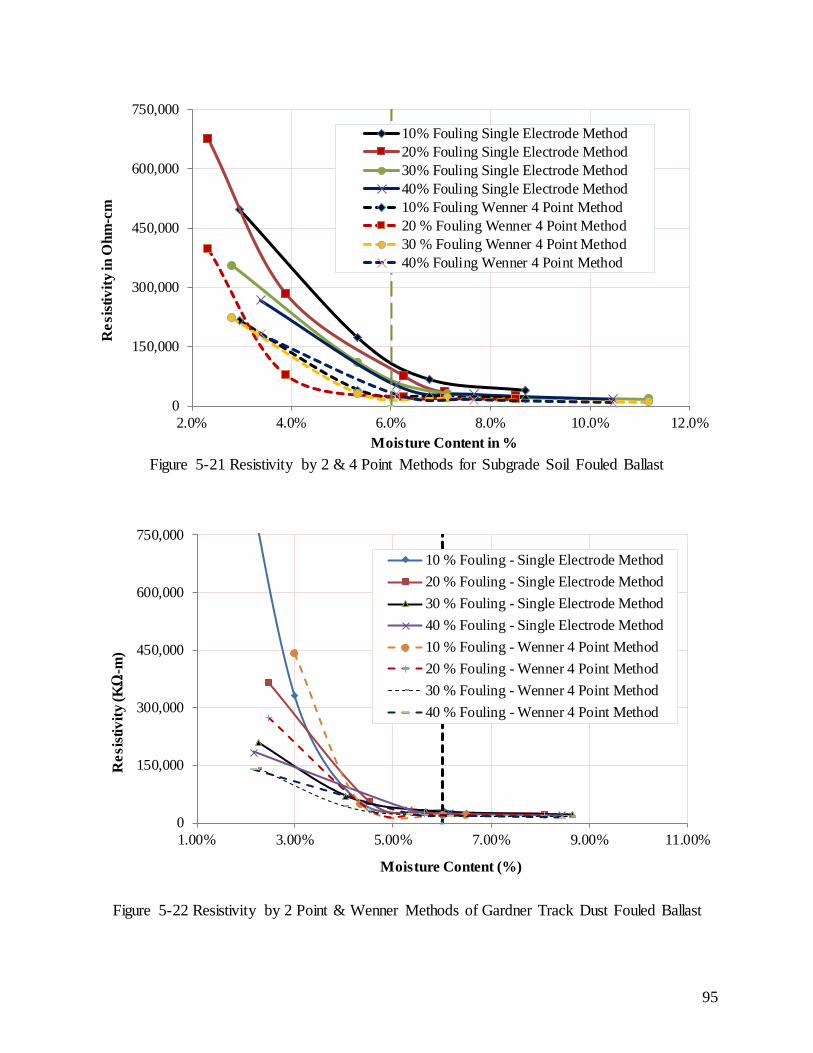
Figure 5-21 Resistivity by 2 & 4 Point Methods for Subgrade Soil Fouled Ballast
Figure 5-22 Resistivity by 2 Point & Wenner Methods of Gardner Track Dust Fouled Ballast
0
150,000
300,000
450,000
600,000
750,000
2.0% 4.0% 6.0% 8.0% 10.0% 12.0%
Res
istiv
ity in
Ohm
-cm
Moisture Content in %
10% Fouling Single Electrode Method20% Fouling Single Electrode Method30% Fouling Single Electrode Method40% Fouling Single Electrode Method10% Fouling Wenner 4 Point Method20 % Fouling Wenner 4 Point Method30 % Fouling Wenner 4 Point Method40% Fouling Wenner 4 Point Method
0
150,000
300,000
450,000
600,000
750,000
1.00% 3.00% 5.00% 7.00% 9.00% 11.00%
Res
istiv
ity (K
Ω-m
)
Moisture Content (%)
10 % Fouling - Single Electrode Method20 % Fouling - Single Electrode Method30 % Fouling - Single Electrode Method40 % Fouling - Single Electrode Method10 % Fouling - Wenner 4 Point Method20 % Fouling - Wenner 4 Point Method30 % Fouling - Wenner 4 Point Method40 % Fouling - Wenner 4 Point Method
95
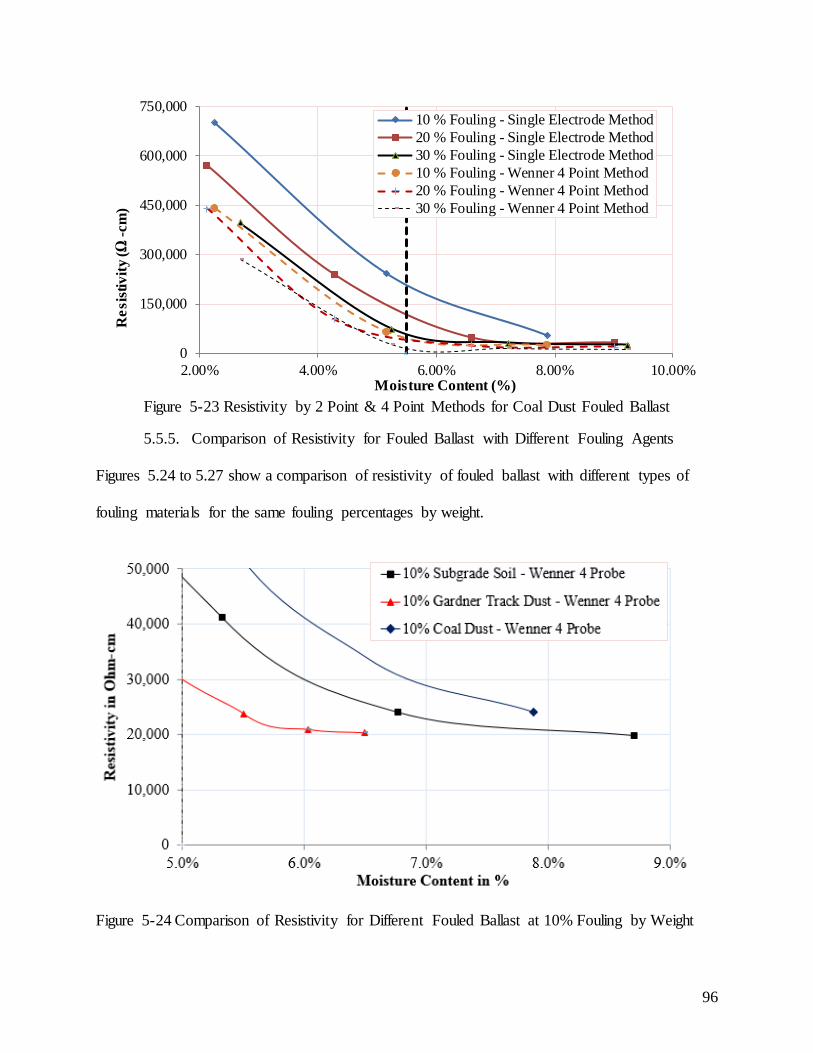
Figure 5-23 Resistivity by 2 Point & 4 Point Methods for Coal Dust Fouled Ballast
5.5.5. Comparison of Resistivity for Fouled Ballast with Different Fouling Agents
Figures 5.24 to 5.27 show a comparison of resistivity of fouled ballast with different types of
fouling materials for the same fouling percentages by weight.
Figure 5-24 Comparison of Resistivity for Different Fouled Ballast at 10% Fouling by Weight
0
150,000
300,000
450,000
600,000
750,000
2.00% 4.00% 6.00% 8.00% 10.00%
Res
istiv
ity (Ω
-cm
)
Moisture Content (%)
10 % Fouling - Single Electrode Method20 % Fouling - Single Electrode Method30 % Fouling - Single Electrode Method10 % Fouling - Wenner 4 Point Method20 % Fouling - Wenner 4 Point Method30 % Fouling - Wenner 4 Point Method
96
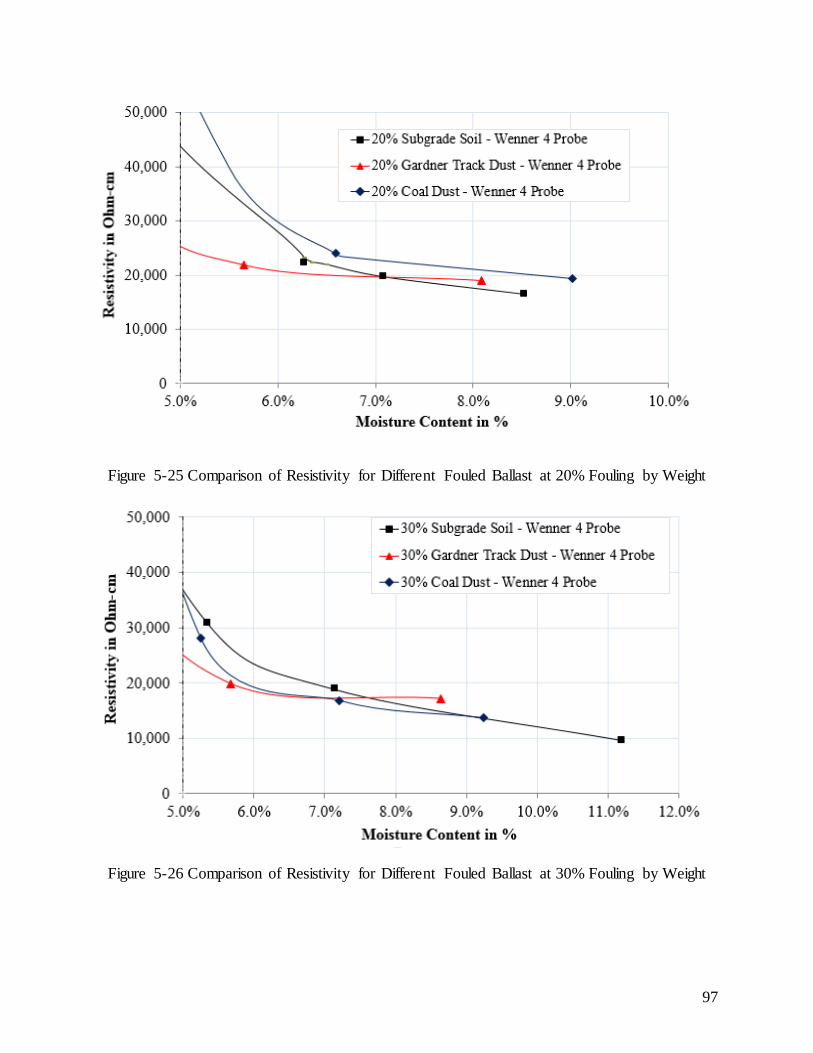
Figure 5-25 Comparison of Resistivity for Different Fouled Ballast at 20% Fouling by Weight
Figure 5-26 Comparison of Resistivity for Different Fouled Ballast at 30% Fouling by Weight
97
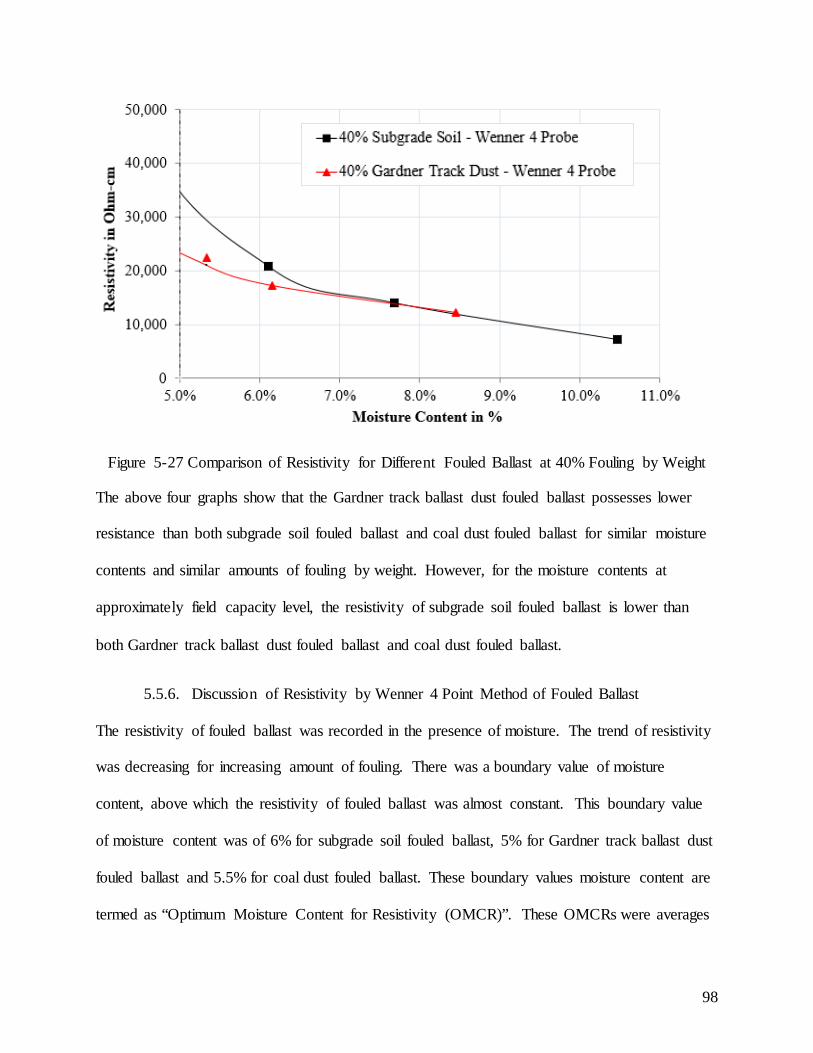
Figure 5-27 Comparison of Resistivity for Different Fouled Ballast at 40% Fouling by Weight
The above four graphs show that the Gardner track ballast dust fouled ballast possesses lower
resistance than both subgrade soil fouled ballast and coal dust fouled ballast for similar moisture
contents and similar amounts of fouling by weight. However, for the moisture contents at
approximately field capacity level, the resistivity of subgrade soil fouled ballast is lower than
both Gardner track ballast dust fouled ballast and coal dust fouled ballast.
5.5.6. Discussion of Resistivity by Wenner 4 Point Method of Fouled Ballast
The resistivity of fouled ballast was recorded in the presence of moisture. The trend of resistivity
was decreasing for increasing amount of fouling. There was a boundary value of moisture
content, above which the resistivity of fouled ballast was almost constant. This boundary value
of moisture content was of 6% for subgrade soil fouled ballast, 5% for Gardner track ballast dust
fouled ballast and 5.5% for coal dust fouled ballast. These boundary values moisture content are
termed as “Optimum Moisture Content for Resistivity (OMCR)”. These OMCRs were averages
98
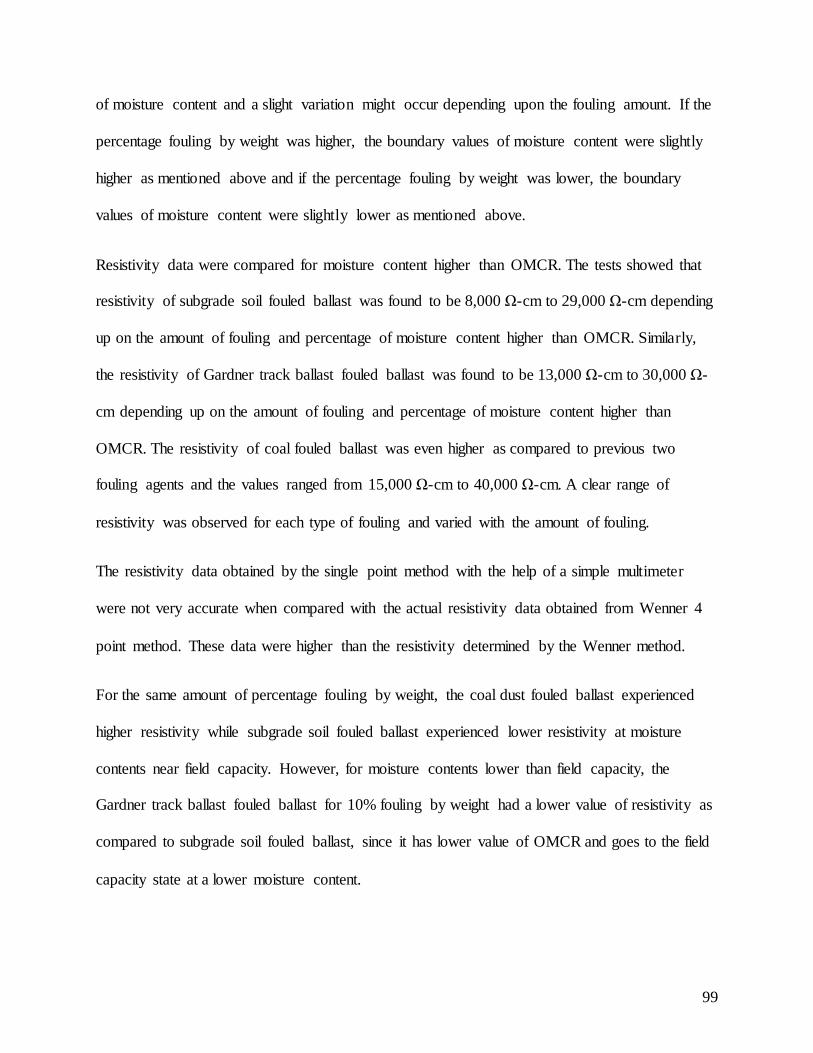
of moisture content and a slight variation might occur depending upon the fouling amount. If the
percentage fouling by weight was higher, the boundary values of moisture content were slightly
higher as mentioned above and if the percentage fouling by weight was lower, the boundary
values of moisture content were slightly lower as mentioned above.
Resistivity data were compared for moisture content higher than OMCR. The tests showed that
resistivity of subgrade soil fouled ballast was found to be 8,000 Ω-cm to 29,000 Ω-cm depending
up on the amount of fouling and percentage of moisture content higher than OMCR. Similarly,
the resistivity of Gardner track ballast fouled ballast was found to be 13,000 Ω-cm to 30,000 Ω-
cm depending up on the amount of fouling and percentage of moisture content higher than
OMCR. The resistivity of coal fouled ballast was even higher as compared to previous two
fouling agents and the values ranged from 15,000 Ω-cm to 40,000 Ω-cm. A clear range of
resistivity was observed for each type of fouling and varied with the amount of fouling.
The resistivity data obtained by the single point method with the help of a simple multimeter
were not very accurate when compared with the actual resistivity data obtained from Wenner 4
point method. These data were higher than the resistivity determined by the Wenner method.
For the same amount of percentage fouling by weight, the coal dust fouled ballast experienced
higher resistivity while subgrade soil fouled ballast experienced lower resistivity at moisture
contents near field capacity. However, for moisture contents lower than field capacity, the
Gardner track ballast fouled ballast for 10% fouling by weight had a lower value of resistivity as
compared to subgrade soil fouled ballast, since it has lower value of OMCR and goes to the field
capacity state at a lower moisture content.
99
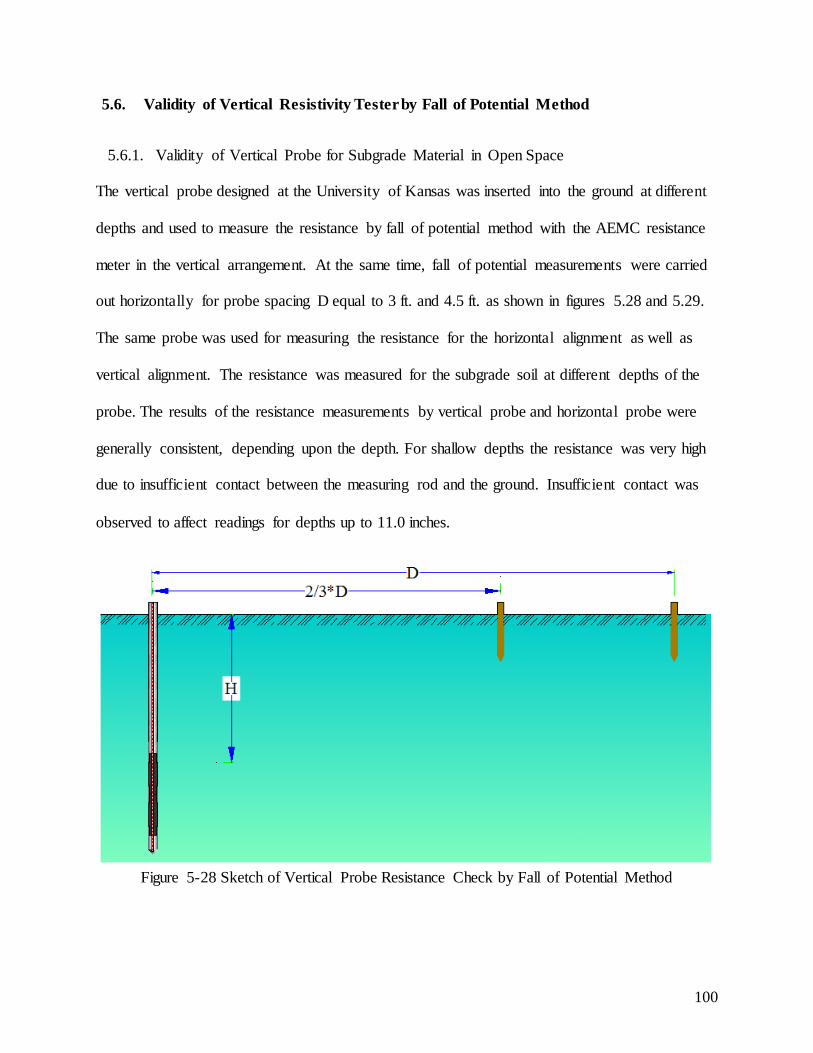
5.6. Validity of Vertical Resistivity Tester by Fall of Potential Method
5.6.1. Validity of Vertical Probe for Subgrade Material in Open Space
The vertical probe designed at the University of Kansas was inserted into the ground at different
depths and used to measure the resistance by fall of potential method with the AEMC resistance
meter in the vertical arrangement. At the same time, fall of potential measurements were carried
out horizontally for probe spacing D equal to 3 ft. and 4.5 ft. as shown in figures 5.28 and 5.29.
The same probe was used for measuring the resistance for the horizontal alignment as well as
vertical alignment. The resistance was measured for the subgrade soil at different depths of the
probe. The results of the resistance measurements by vertical probe and horizontal probe were
generally consistent, depending upon the depth. For shallow depths the resistance was very high
due to insufficient contact between the measuring rod and the ground. Insufficient contact was
observed to affect readings for depths up to 11.0 inches.
Figure 5-28 Sketch of Vertical Probe Resistance Check by Fall of Potential Method
100
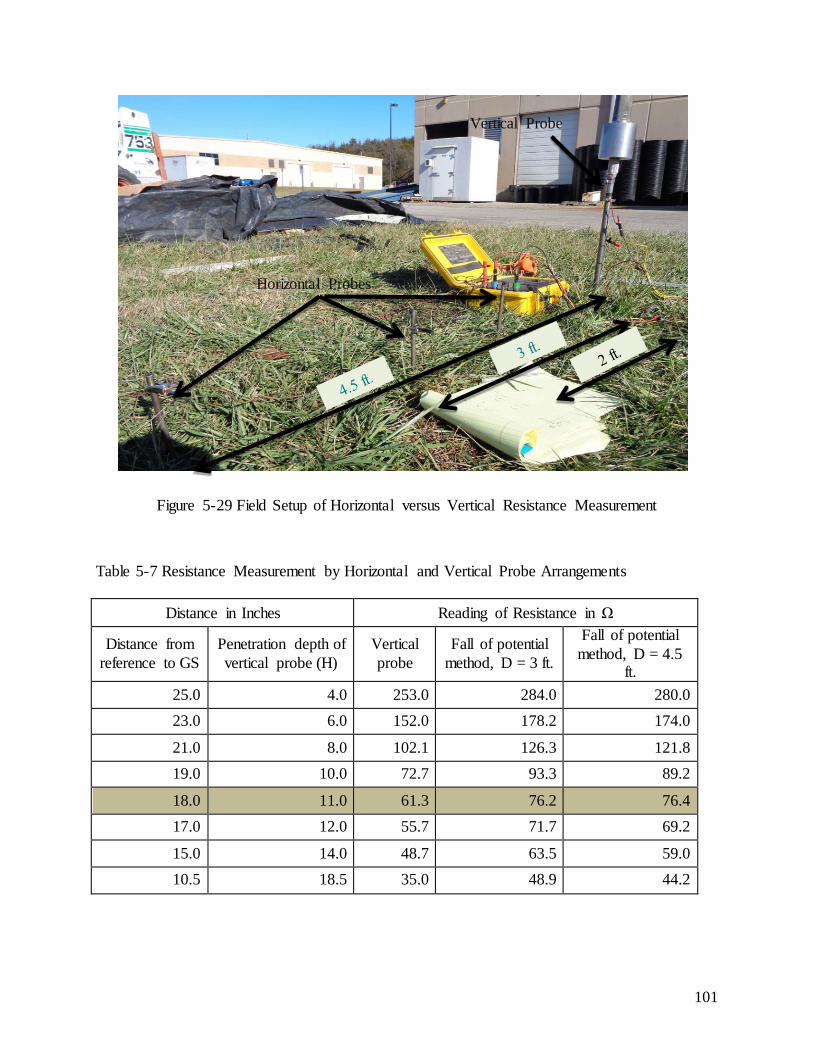
Figure 5-29 Field Setup of Horizontal versus Vertical Resistance Measurement
Table 5-7 Resistance Measurement by Horizontal and Vertical Probe Arrangements
Distance in Inches Reading of Resistance in Ω
Distance from reference to GS
Penetration depth of vertical probe (H)
Vertical probe
Fall of potential method, D = 3 ft.
Fall of potential method, D = 4.5
ft. 25.0 4.0 253.0 284.0 280.0 23.0 6.0 152.0 178.2 174.0
21.0 8.0 102.1 126.3 121.8 19.0 10.0 72.7 93.3 89.2
18.0 11.0 61.3 76.2 76.4 17.0 12.0 55.7 71.7 69.2
15.0 14.0 48.7 63.5 59.0 10.5 18.5 35.0 48.9 44.2
Vertical Probe
Horizontal Probes
101
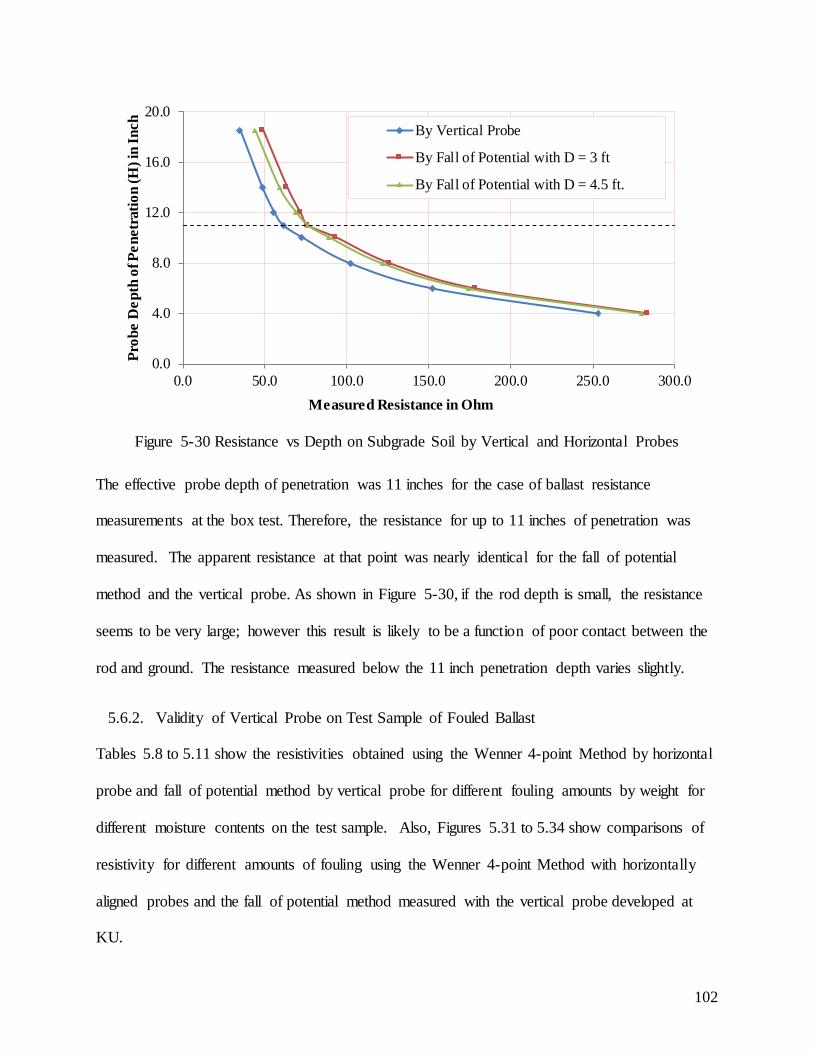
Figure 5-30 Resistance vs Depth on Subgrade Soil by Vertical and Horizontal Probes
The effective probe depth of penetration was 11 inches for the case of ballast resistance
measurements at the box test. Therefore, the resistance for up to 11 inches of penetration was
measured. The apparent resistance at that point was nearly identical for the fall of potential
method and the vertical probe. As shown in Figure 5-30, if the rod depth is small, the resistance
seems to be very large; however this result is likely to be a function of poor contact between the
rod and ground. The resistance measured below the 11 inch penetration depth varies slightly.
5.6.2. Validity of Vertical Probe on Test Sample of Fouled Ballast
Tables 5.8 to 5.11 show the resistivities obtained using the Wenner 4-point Method by horizontal
probe and fall of potential method by vertical probe for different fouling amounts by weight for
different moisture contents on the test sample. Also, Figures 5.31 to 5.34 show comparisons of
resistivity for different amounts of fouling using the Wenner 4-point Method with horizontally
aligned probes and the fall of potential method measured with the vertical probe developed at
KU.
0.0
4.0
8.0
12.0
16.0
20.0
0.0 50.0 100.0 150.0 200.0 250.0 300.0
Prob
e D
epth
of P
enet
ratio
n (H
) in
Inch
Measured Resistance in Ohm
By Vertical Probe
By Fall of Potential with D = 3 ft
By Fall of Potential with D = 4.5 ft.
102
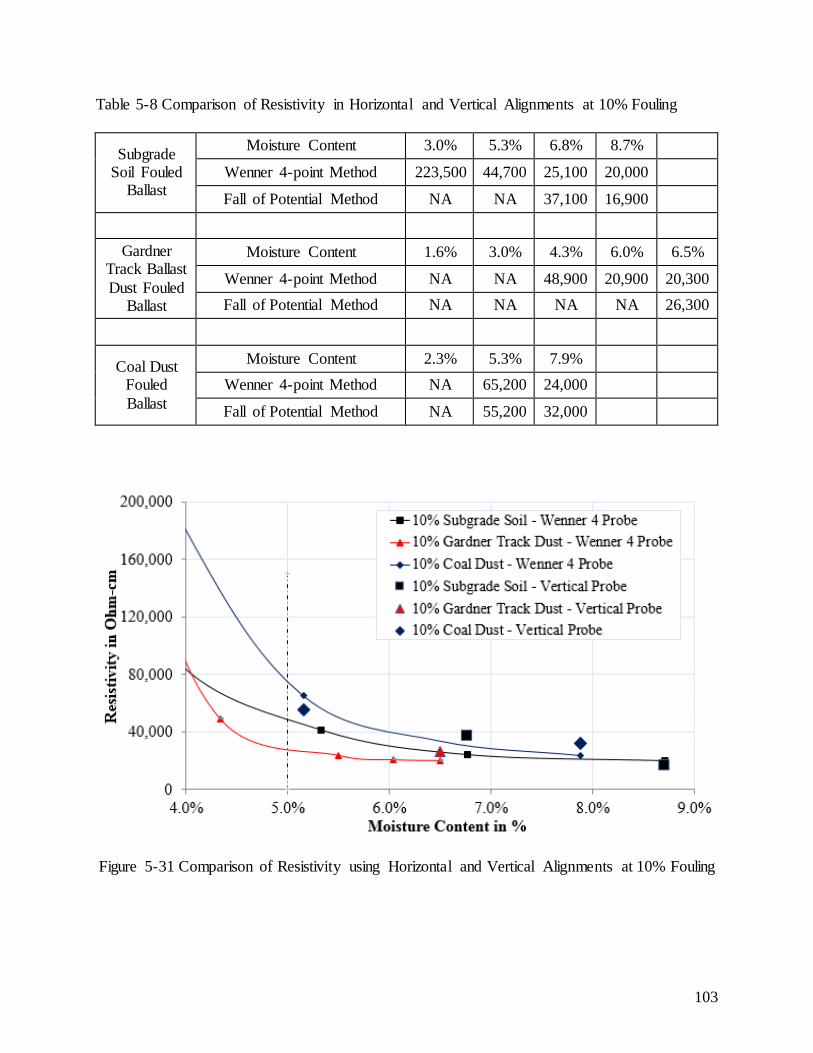
Table 5-8 Comparison of Resistivity in Horizontal and Vertical Alignments at 10% Fouling
Subgrade Soil Fouled
Ballast
Moisture Content 3.0% 5.3% 6.8% 8.7%
Wenner 4-point Method 223,500 44,700 25,100 20,000
Fall of Potential Method NA NA 37,100 16,900
Gardner Track Ballast Dust Fouled
Ballast
Moisture Content 1.6% 3.0% 4.3% 6.0% 6.5%
Wenner 4-point Method NA NA 48,900 20,900 20,300 Fall of Potential Method NA NA NA NA 26,300
Coal Dust Fouled Ballast
Moisture Content 2.3% 5.3% 7.9% Wenner 4-point Method NA 65,200 24,000
Fall of Potential Method NA 55,200 32,000
Figure 5-31 Comparison of Resistivity using Horizontal and Vertical Alignments at 10% Fouling
103
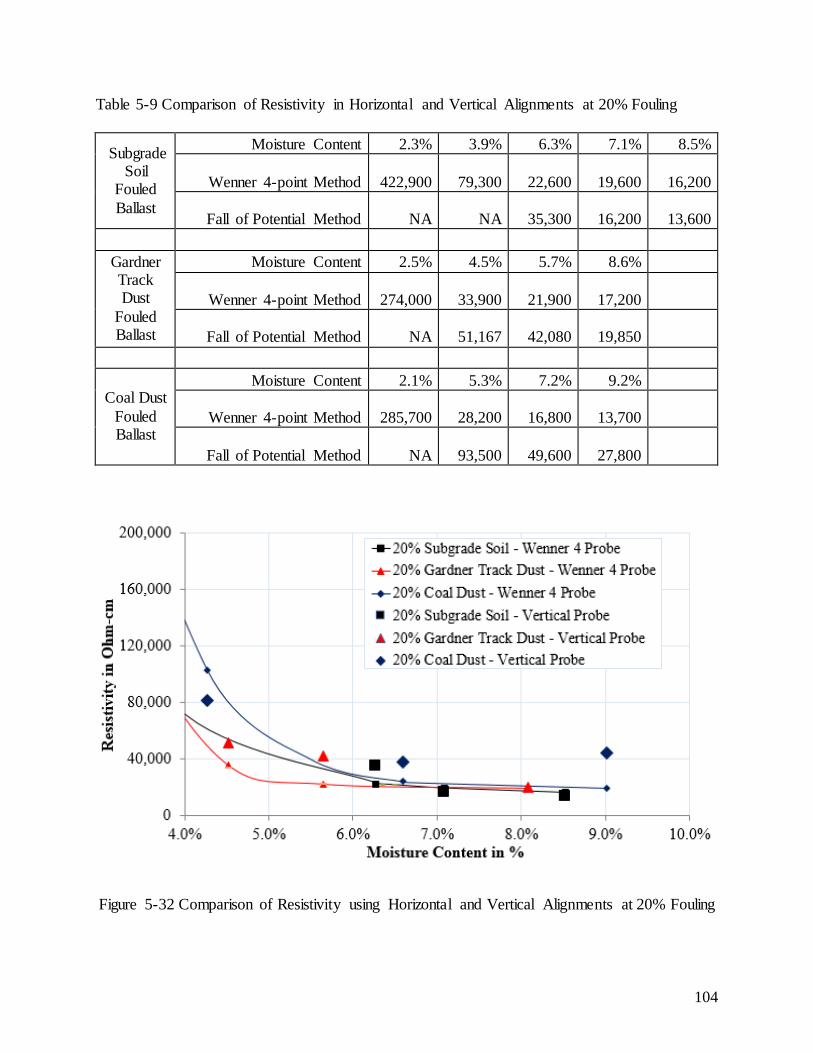
Table 5-9 Comparison of Resistivity in Horizontal and Vertical Alignments at 20% Fouling
Subgrade Soil
Fouled Ballast
Moisture Content 2.3% 3.9% 6.3% 7.1% 8.5%
Wenner 4-point Method 422,900
79,300
22,600
19,600
16,200
Fall of Potential Method NA NA
35,300
16,200
13,600
Gardner Track Dust
Fouled Ballast
Moisture Content 2.5% 4.5% 5.7% 8.6%
Wenner 4-point Method
274,000
33,900
21,900
17,200
Fall of Potential Method NA
51,167
42,080
19,850
Coal Dust Fouled Ballast
Moisture Content 2.1% 5.3% 7.2% 9.2%
Wenner 4-point Method
285,700
28,200
16,800
13,700
Fall of Potential Method NA
93,500
49,600
27,800
Figure 5-32 Comparison of Resistivity using Horizontal and Vertical Alignments at 20% Fouling
104
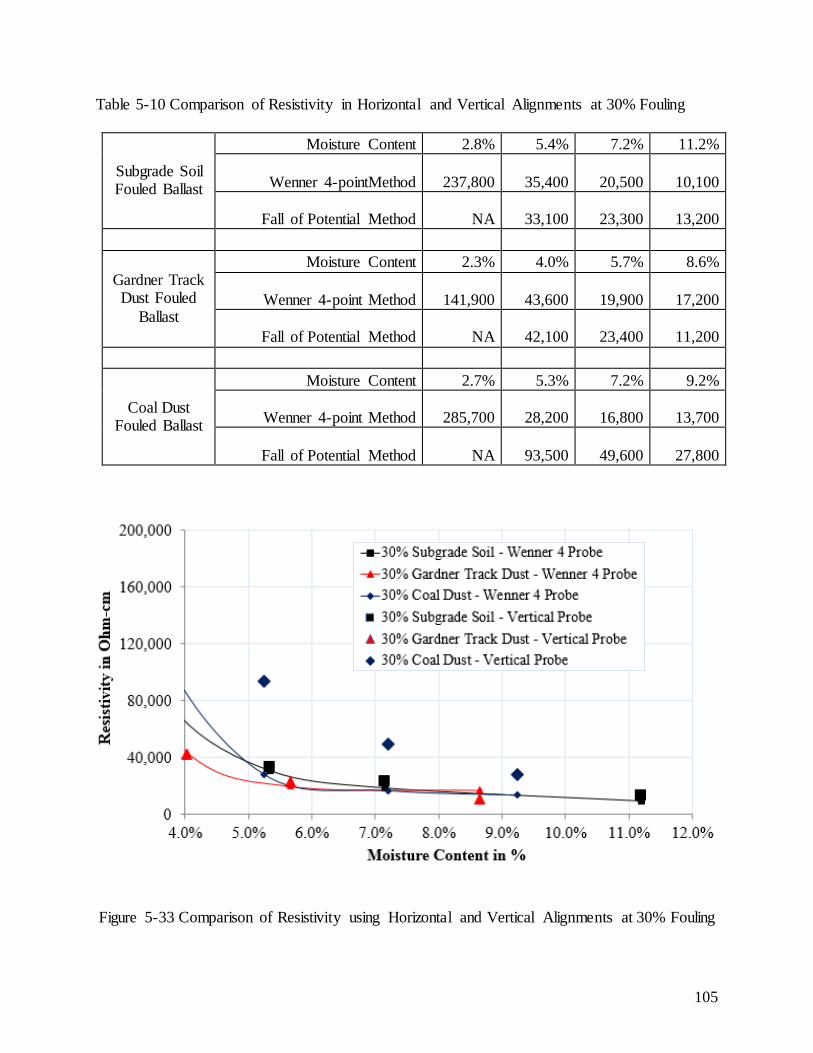
Table 5-10 Comparison of Resistivity in Horizontal and Vertical Alignments at 30% Fouling
Subgrade Soil Fouled Ballast
Moisture Content 2.8% 5.4% 7.2% 11.2%
Wenner 4-pointMethod 237,800
35,400
20,500 10,100
Fall of Potential Method NA
33,100
23,300 13,200
Gardner Track Dust Fouled
Ballast
Moisture Content 2.3% 4.0% 5.7% 8.6%
Wenner 4-point Method
141,900
43,600
19,900 17,200
Fall of Potential Method NA
42,100
23,400 11,200
Coal Dust Fouled Ballast
Moisture Content 2.7% 5.3% 7.2% 9.2%
Wenner 4-point Method
285,700
28,200
16,800 13,700
Fall of Potential Method NA
93,500
49,600 27,800
Figure 5-33 Comparison of Resistivity using Horizontal and Vertical Alignments at 30% Fouling
105
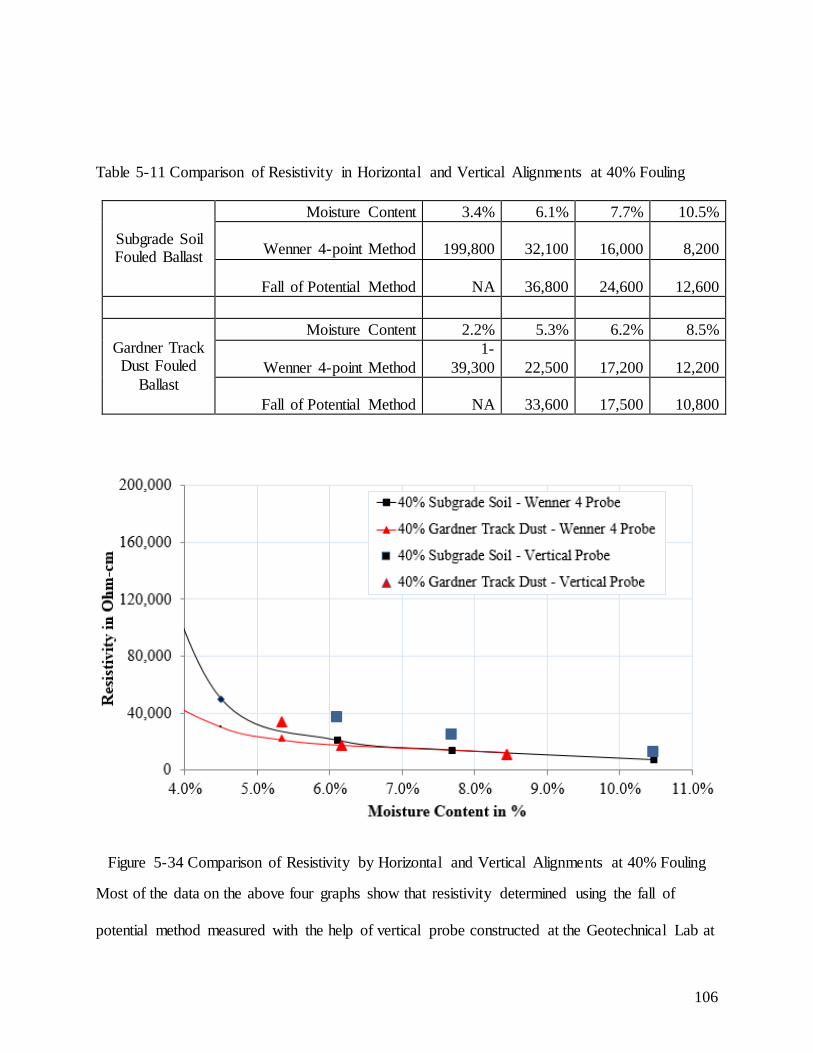
Table 5-11 Comparison of Resistivity in Horizontal and Vertical Alignments at 40% Fouling
Subgrade Soil Fouled Ballast
Moisture Content 3.4% 6.1% 7.7% 10.5%
Wenner 4-point Method
199,800
32,100
16,000 8,200
Fall of Potential Method NA
36,800
24,600 12,600
Gardner Track Dust Fouled
Ballast
Moisture Content 2.2% 5.3% 6.2% 8.5%
Wenner 4-point Method 1-
39,300
22,500
17,200 12,200
Fall of Potential Method NA
33,600
17,500 10,800
Figure 5-34 Comparison of Resistivity by Horizontal and Vertical Alignments at 40% Fouling
Most of the data on the above four graphs show that resistivity determined using the fall of
potential method measured with the help of vertical probe constructed at the Geotechnical Lab at
106
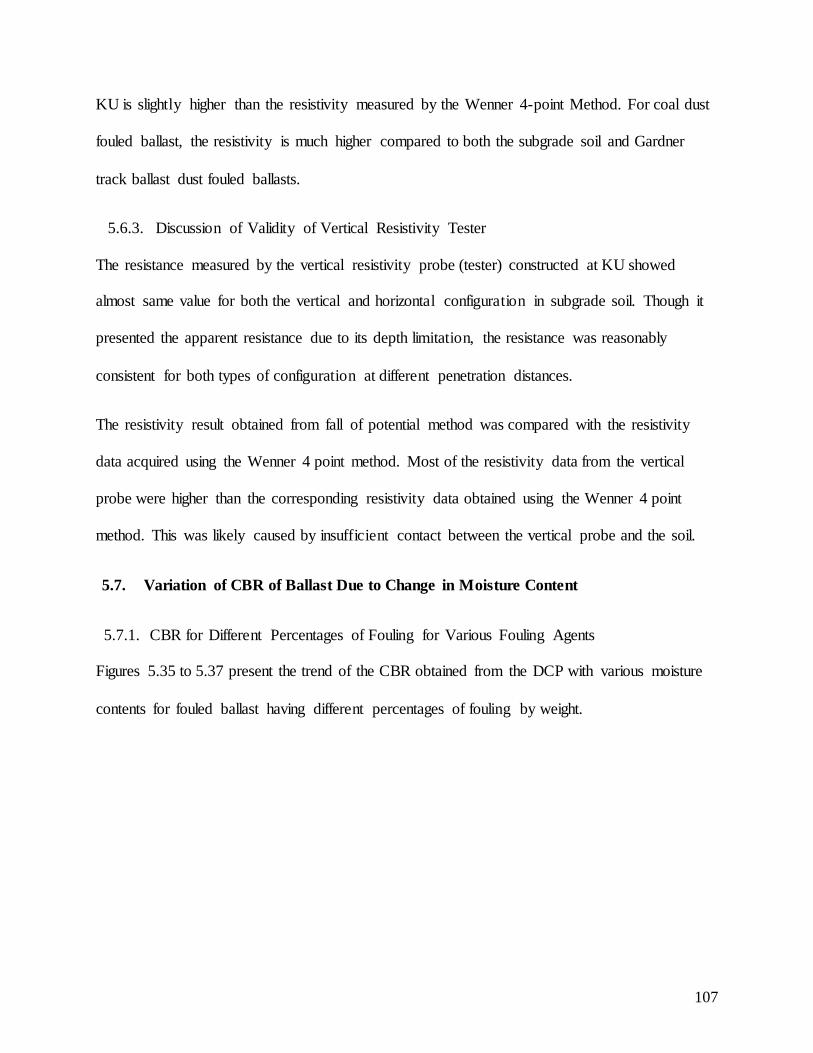
KU is slightly higher than the resistivity measured by the Wenner 4-point Method. For coal dust
fouled ballast, the resistivity is much higher compared to both the subgrade soil and Gardner
track ballast dust fouled ballasts.
5.6.3. Discussion of Validity of Vertical Resistivity Tester
The resistance measured by the vertical resistivity probe (tester) constructed at KU showed
almost same value for both the vertical and horizontal configuration in subgrade soil. Though it
presented the apparent resistance due to its depth limitation, the resistance was reasonably
consistent for both types of configuration at different penetration distances.
The resistivity result obtained from fall of potential method was compared with the resistivity
data acquired using the Wenner 4 point method. Most of the resistivity data from the vertical
probe were higher than the corresponding resistivity data obtained using the Wenner 4 point
method. This was likely caused by insufficient contact between the vertical probe and the soil.
5.7. Variation of CBR of Ballast Due to Change in Moisture Content
5.7.1. CBR for Different Percentages of Fouling for Various Fouling Agents
Figures 5.35 to 5.37 present the trend of the CBR obtained from the DCP with various moisture
contents for fouled ballast having different percentages of fouling by weight.
107
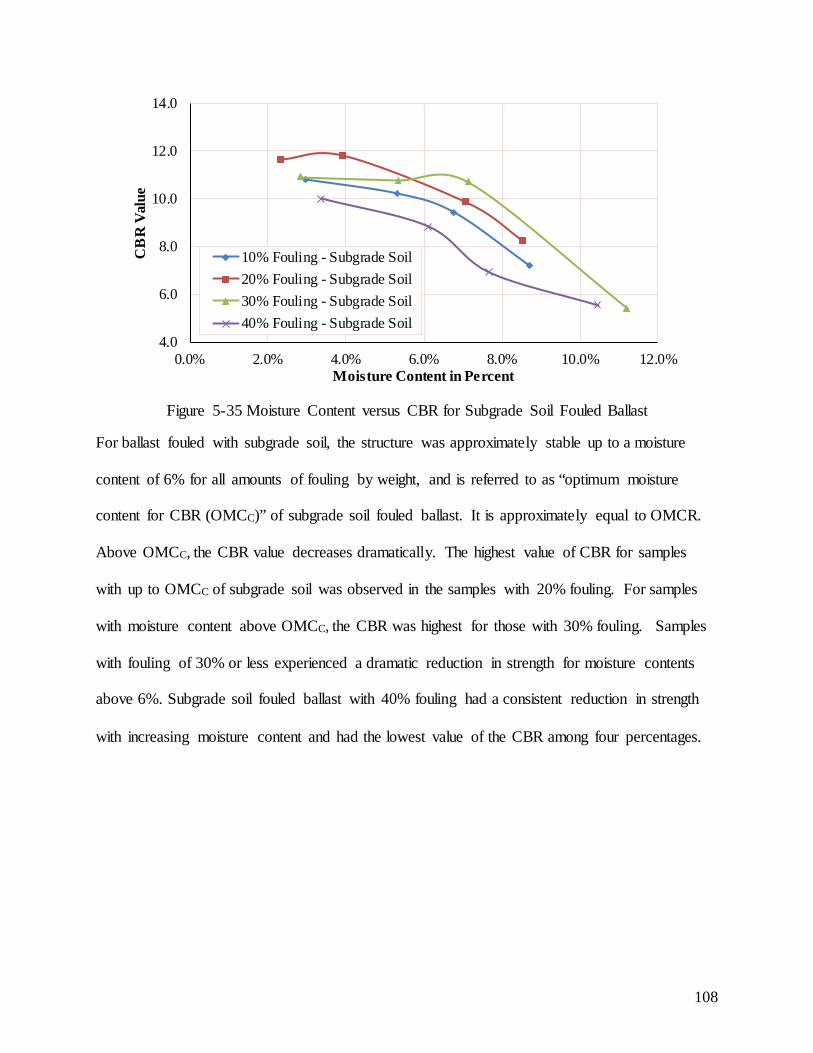
Figure 5-35 Moisture Content versus CBR for Subgrade Soil Fouled Ballast
For ballast fouled with subgrade soil, the structure was approximately stable up to a moisture
content of 6% for all amounts of fouling by weight, and is referred to as “optimum moisture
content for CBR (OMCC)” of subgrade soil fouled ballast. It is approximately equal to OMCR.
Above OMCC, the CBR value decreases dramatically. The highest value of CBR for samples
with up to OMCC of subgrade soil was observed in the samples with 20% fouling. For samples
with moisture content above OMCC, the CBR was highest for those with 30% fouling. Samples
with fouling of 30% or less experienced a dramatic reduction in strength for moisture contents
above 6%. Subgrade soil fouled ballast with 40% fouling had a consistent reduction in strength
with increasing moisture content and had the lowest value of the CBR among four percentages.
4.0
6.0
8.0
10.0
12.0
14.0
0.0% 2.0% 4.0% 6.0% 8.0% 10.0% 12.0%
CB
R V
alue
Moisture Content in Percent
10% Fouling - Subgrade Soil20% Fouling - Subgrade Soil30% Fouling - Subgrade Soil40% Fouling - Subgrade Soil
108
Figure 5-36 Moisture Content versus CBR for Gardner Track Dust Fouled Ballast
Ballast fouled with Gardner track ballast dust was observed to have similar moisture-strength
relationships as the ballast fouled with subgrade soil. However, the CBR versus moisture content
curves show that ballast shear strength declined dramatically above 5% moisture content and is
referred to as “optimum moisture content for CBR (OMCC)” of Gardner track ballast dust fouled
ballast. It is approximately equal to OMCR. All Gardner track ballast dust fouled ballast samples
possessed relatively high strength up to OMCC as compared with the corresponding degree of
fouling of subgrade soil fouled ballast. The CBR of all types of Gardner track ballast dust fouled
ballast was in the range of 10.3 to 12. For the case of Gardner track ballast dust fouled ballast,
the CBR value decreased sharply above OMCC for all degrees of fouling, which was consistent
with the subgrade fouled ballast except the critical moisture content was slightly lower. The
highest value of CBR was for 30% fouling and the CBR value was almost 13. For Gardner track
ballast dust fouled ballast, the CBR for 20% and 30% fouling was higher than for 10% and 40%
fouling. For the case of Gardner track ballast dust fouled ballast, 10% and 40% fouling gave
4.0
6.0
8.0
10.0
12.0
14.0
0.0% 2.0% 4.0% 6.0% 8.0% 10.0% 12.0%
CB
R V
alue
Moisture Content in Percent
10% Fouling - Gardner Track Ballast Dust20% Fouling - Gardner Track Ballast Dust30% Fouling - Gardner Track Ballast Dust40% Fouling - Gardner Track Ballast Dust
109
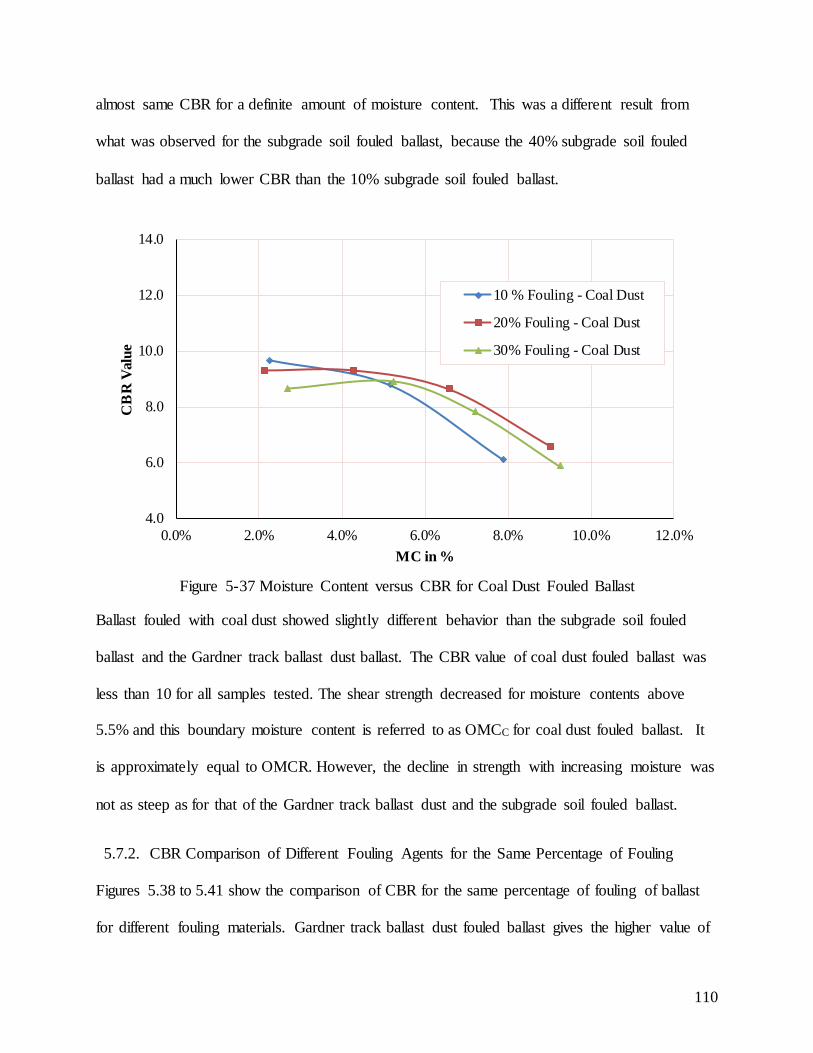
almost same CBR for a definite amount of moisture content. This was a different result from
what was observed for the subgrade soil fouled ballast, because the 40% subgrade soil fouled
ballast had a much lower CBR than the 10% subgrade soil fouled ballast.
Figure 5-37 Moisture Content versus CBR for Coal Dust Fouled Ballast
Ballast fouled with coal dust showed slightly different behavior than the subgrade soil fouled
ballast and the Gardner track ballast dust ballast. The CBR value of coal dust fouled ballast was
less than 10 for all samples tested. The shear strength decreased for moisture contents above
5.5% and this boundary moisture content is referred to as OMCC for coal dust fouled ballast. It
is approximately equal to OMCR. However, the decline in strength with increasing moisture was
not as steep as for that of the Gardner track ballast dust and the subgrade soil fouled ballast.
5.7.2. CBR Comparison of Different Fouling Agents for the Same Percentage of Fouling
Figures 5.38 to 5.41 show the comparison of CBR for the same percentage of fouling of ballast
for different fouling materials. Gardner track ballast dust fouled ballast gives the higher value of
4.0
6.0
8.0
10.0
12.0
14.0
0.0% 2.0% 4.0% 6.0% 8.0% 10.0% 12.0%
CB
R V
alue
MC in %
10 % Fouling - Coal Dust
20% Fouling - Coal Dust
30% Fouling - Coal Dust
110
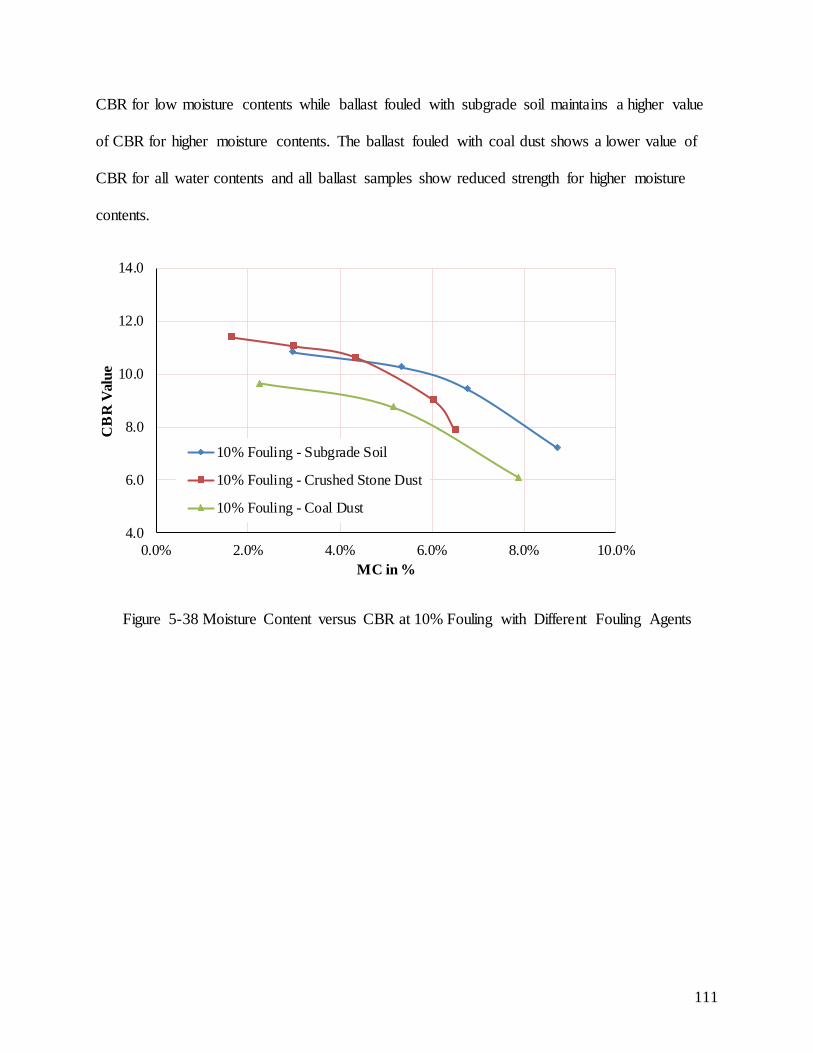
CBR for low moisture contents while ballast fouled with subgrade soil maintains a higher value
of CBR for higher moisture contents. The ballast fouled with coal dust shows a lower value of
CBR for all water contents and all ballast samples show reduced strength for higher moisture
contents.
Figure 5-38 Moisture Content versus CBR at 10% Fouling with Different Fouling Agents
4.0
6.0
8.0
10.0
12.0
14.0
0.0% 2.0% 4.0% 6.0% 8.0% 10.0%
CB
R V
alue
MC in %
10% Fouling - Subgrade Soil
10% Fouling - Crushed Stone Dust
10% Fouling - Coal Dust
111
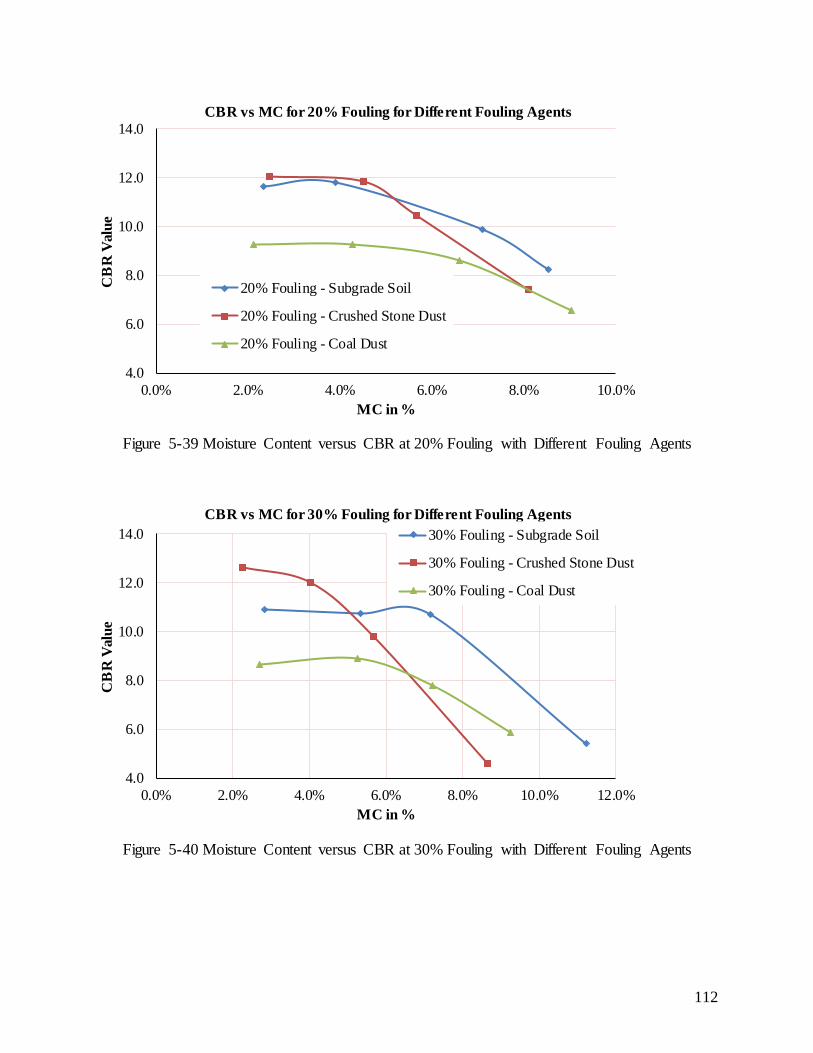
Figure 5-39 Moisture Content versus CBR at 20% Fouling with Different Fouling Agents
Figure 5-40 Moisture Content versus CBR at 30% Fouling with Different Fouling Agents
4.0
6.0
8.0
10.0
12.0
14.0
0.0% 2.0% 4.0% 6.0% 8.0% 10.0%
CB
R V
alue
MC in %
CBR vs MC for 20% Fouling for Different Fouling Agents
20% Fouling - Subgrade Soil
20% Fouling - Crushed Stone Dust
20% Fouling - Coal Dust
4.0
6.0
8.0
10.0
12.0
14.0
0.0% 2.0% 4.0% 6.0% 8.0% 10.0% 12.0%
CB
R V
alue
MC in %
CBR vs MC for 30% Fouling for Different Fouling Agents 30% Fouling - Subgrade Soil
30% Fouling - Crushed Stone Dust
30% Fouling - Coal Dust
112
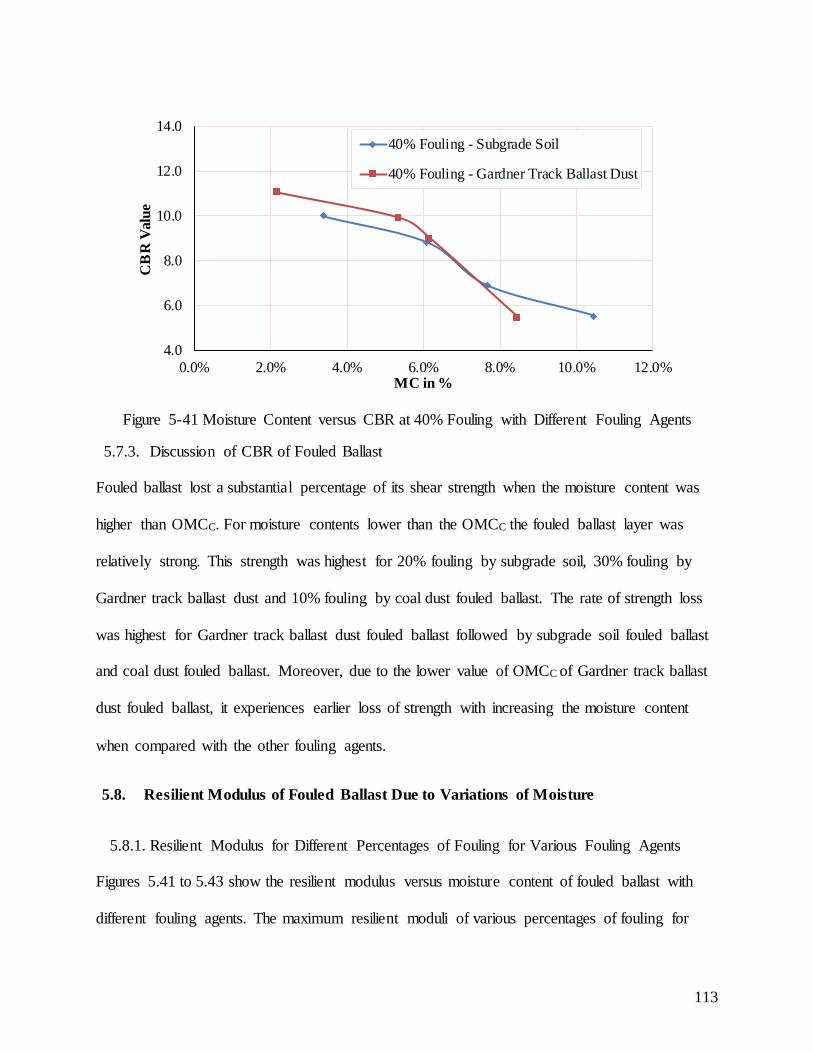
Figure 5-41 Moisture Content versus CBR at 40% Fouling with Different Fouling Agents
5.7.3. Discussion of CBR of Fouled Ballast
Fouled ballast lost a substantial percentage of its shear strength when the moisture content was
higher than OMCC. For moisture contents lower than the OMCC the fouled ballast layer was
relatively strong. This strength was highest for 20% fouling by subgrade soil, 30% fouling by
Gardner track ballast dust and 10% fouling by coal dust fouled ballast. The rate of strength loss
was highest for Gardner track ballast dust fouled ballast followed by subgrade soil fouled ballast
and coal dust fouled ballast. Moreover, due to the lower value of OMCC of Gardner track ballast
dust fouled ballast, it experiences earlier loss of strength with increasing the moisture content
when compared with the other fouling agents.
5.8. Resilient Modulus of Fouled Ballast Due to Variations of Moisture
5.8.1. Resilient Modulus for Different Percentages of Fouling for Various Fouling Agents
Figures 5.41 to 5.43 show the resilient modulus versus moisture content of fouled ballast with
different fouling agents. The maximum resilient moduli of various percentages of fouling for
4.0
6.0
8.0
10.0
12.0
14.0
0.0% 2.0% 4.0% 6.0% 8.0% 10.0% 12.0%
CB
R V
alue
MC in %
40% Fouling - Subgrade Soil
40% Fouling - Gardner Track Ballast Dust
113
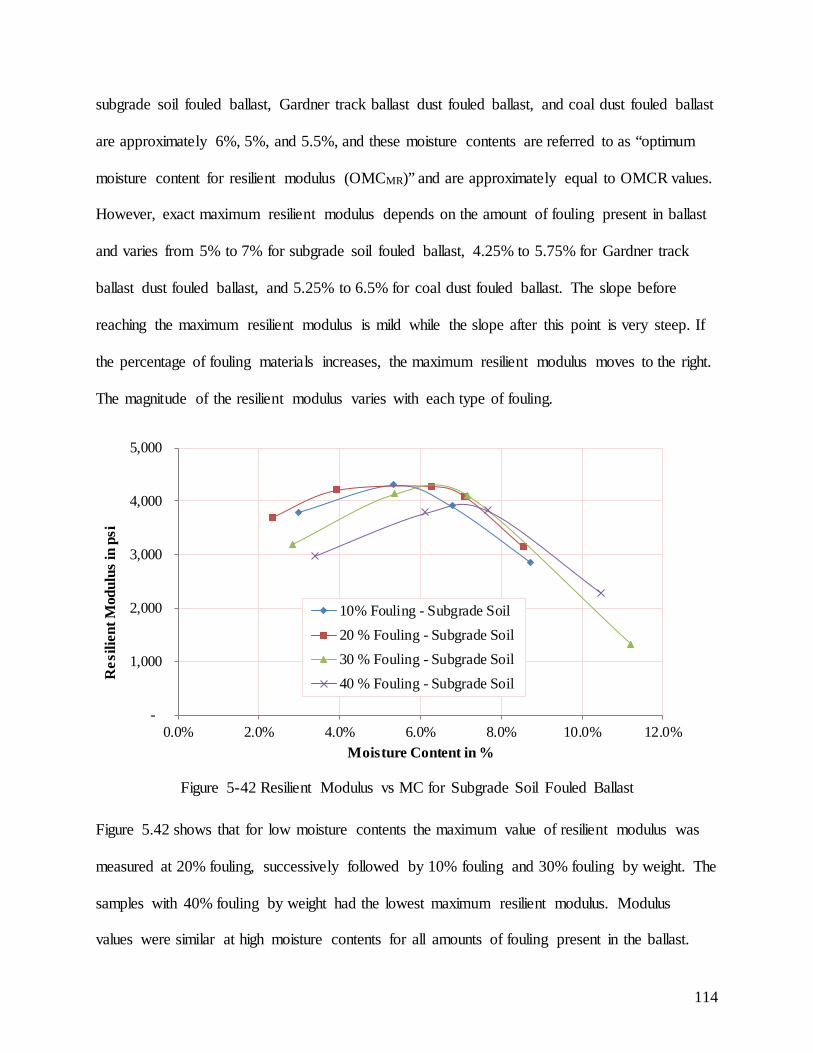
subgrade soil fouled ballast, Gardner track ballast dust fouled ballast, and coal dust fouled ballast
are approximately 6%, 5%, and 5.5%, and these moisture contents are referred to as “optimum
moisture content for resilient modulus (OMCMR)” and are approximately equal to OMCR values.
However, exact maximum resilient modulus depends on the amount of fouling present in ballast
and varies from 5% to 7% for subgrade soil fouled ballast, 4.25% to 5.75% for Gardner track
ballast dust fouled ballast, and 5.25% to 6.5% for coal dust fouled ballast. The slope before
reaching the maximum resilient modulus is mild while the slope after this point is very steep. If
the percentage of fouling materials increases, the maximum resilient modulus moves to the right.
The magnitude of the resilient modulus varies with each type of fouling.
Figure 5-42 Resilient Modulus vs MC for Subgrade Soil Fouled Ballast
Figure 5.42 shows that for low moisture contents the maximum value of resilient modulus was
measured at 20% fouling, successively followed by 10% fouling and 30% fouling by weight. The
samples with 40% fouling by weight had the lowest maximum resilient modulus. Modulus
values were similar at high moisture contents for all amounts of fouling present in the ballast.
-
1,000
2,000
3,000
4,000
5,000
0.0% 2.0% 4.0% 6.0% 8.0% 10.0% 12.0%
Res
ilien
t Mod
ulus
in p
si
Moisture Content in %
10% Fouling - Subgrade Soil20 % Fouling - Subgrade Soil30 % Fouling - Subgrade Soil40 % Fouling - Subgrade Soil
114
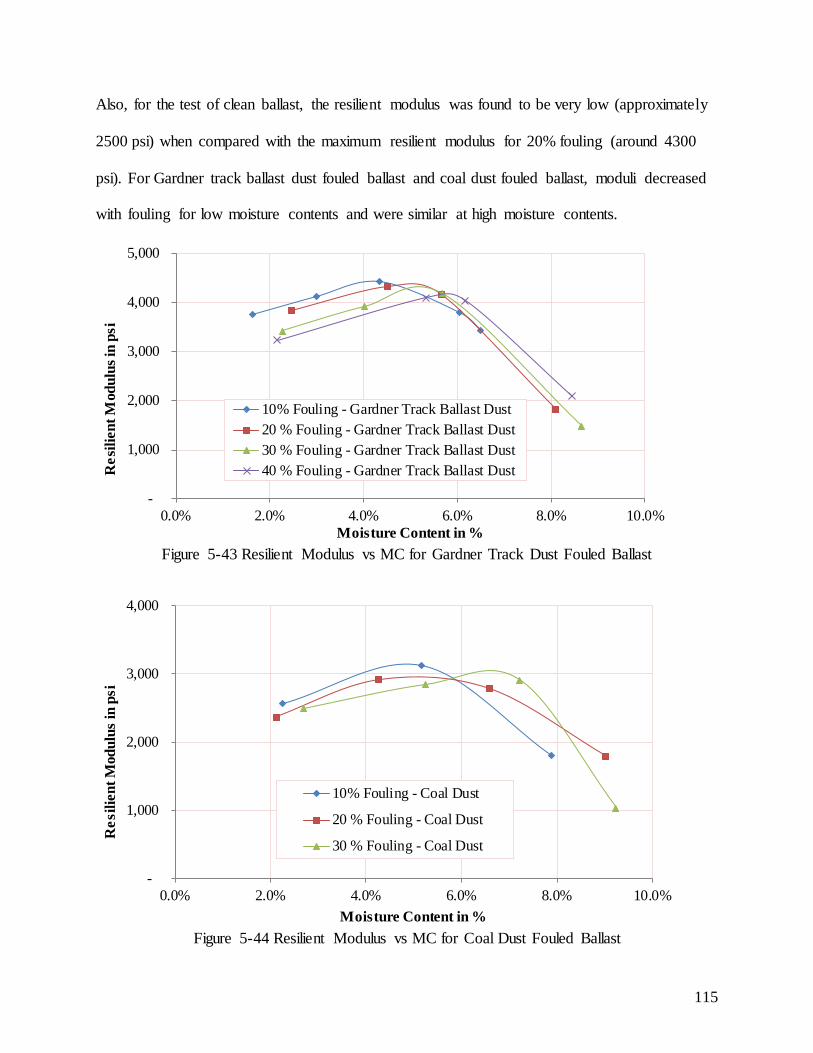
Also, for the test of clean ballast, the resilient modulus was found to be very low (approximately
2500 psi) when compared with the maximum resilient modulus for 20% fouling (around 4300
psi). For Gardner track ballast dust fouled ballast and coal dust fouled ballast, moduli decreased
with fouling for low moisture contents and were similar at high moisture contents.
Figure 5-43 Resilient Modulus vs MC for Gardner Track Dust Fouled Ballast
Figure 5-44 Resilient Modulus vs MC for Coal Dust Fouled Ballast
-
1,000
2,000
3,000
4,000
5,000
0.0% 2.0% 4.0% 6.0% 8.0% 10.0%
Res
ilien
t Mod
ulus
in p
si
Moisture Content in %
10% Fouling - Gardner Track Ballast Dust20 % Fouling - Gardner Track Ballast Dust30 % Fouling - Gardner Track Ballast Dust40 % Fouling - Gardner Track Ballast Dust
-
1,000
2,000
3,000
4,000
0.0% 2.0% 4.0% 6.0% 8.0% 10.0%
Res
ilien
t Mod
ulus
in p
si
Moisture Content in %
10% Fouling - Coal Dust
20 % Fouling - Coal Dust
30 % Fouling - Coal Dust
115
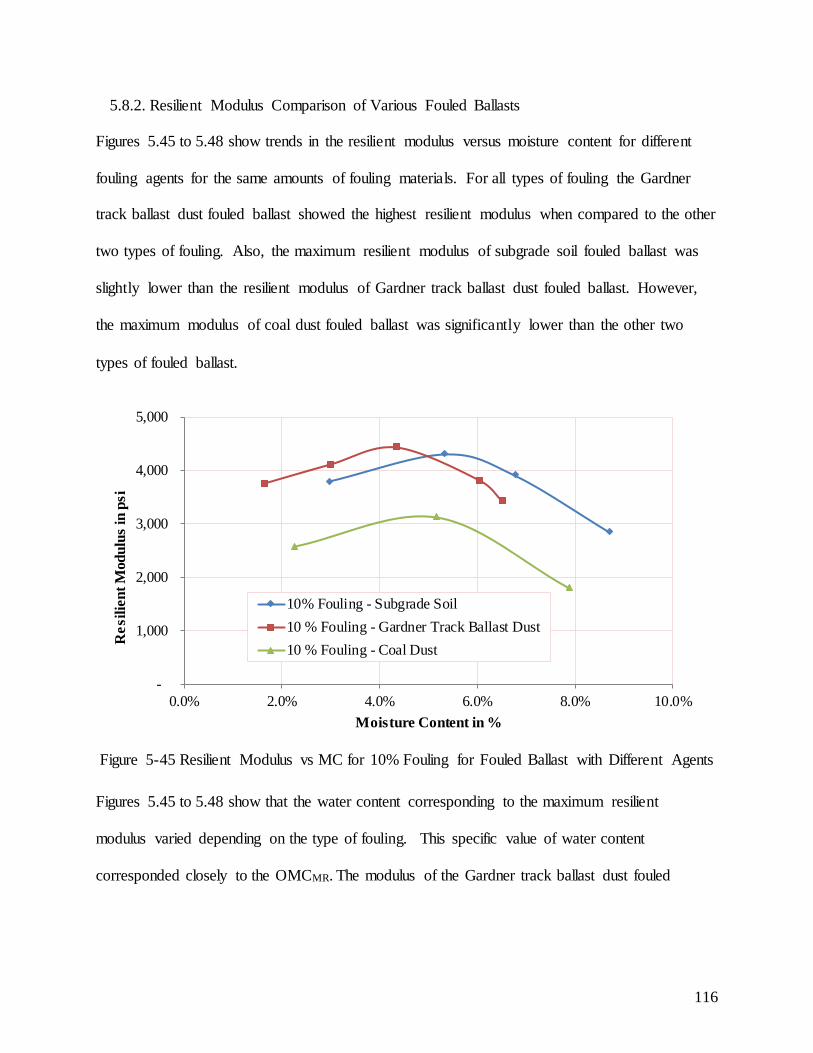
5.8.2. Resilient Modulus Comparison of Various Fouled Ballasts
Figures 5.45 to 5.48 show trends in the resilient modulus versus moisture content for different
fouling agents for the same amounts of fouling materials. For all types of fouling the Gardner
track ballast dust fouled ballast showed the highest resilient modulus when compared to the other
two types of fouling. Also, the maximum resilient modulus of subgrade soil fouled ballast was
slightly lower than the resilient modulus of Gardner track ballast dust fouled ballast. However,
the maximum modulus of coal dust fouled ballast was significantly lower than the other two
types of fouled ballast.
Figure 5-45 Resilient Modulus vs MC for 10% Fouling for Fouled Ballast with Different Agents
Figures 5.45 to 5.48 show that the water content corresponding to the maximum resilient
modulus varied depending on the type of fouling. This specific value of water content
corresponded closely to the OMCMR. The modulus of the Gardner track ballast dust fouled
-
1,000
2,000
3,000
4,000
5,000
0.0% 2.0% 4.0% 6.0% 8.0% 10.0%
Res
ilien
t Mod
ulus
in p
si
Moisture Content in %
10% Fouling - Subgrade Soil10 % Fouling - Gardner Track Ballast Dust10 % Fouling - Coal Dust
116
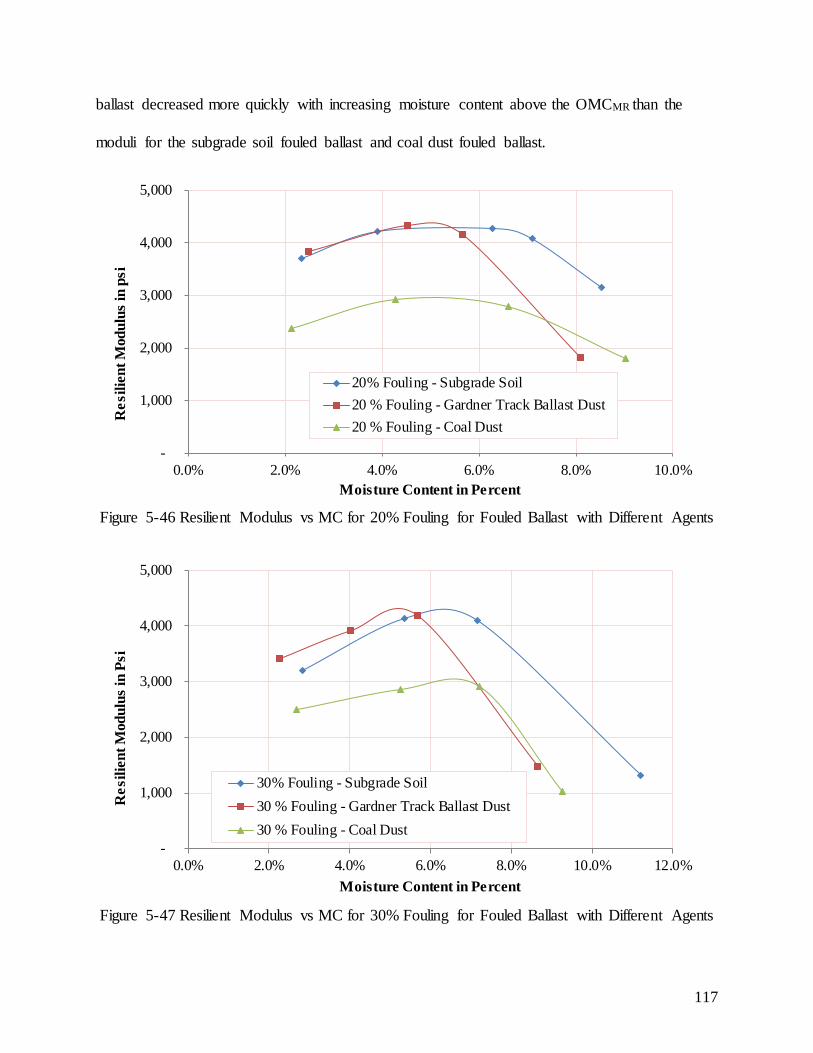
ballast decreased more quickly with increasing moisture content above the OMCMR than the
moduli for the subgrade soil fouled ballast and coal dust fouled ballast.
Figure 5-46 Resilient Modulus vs MC for 20% Fouling for Fouled Ballast with Different Agents
Figure 5-47 Resilient Modulus vs MC for 30% Fouling for Fouled Ballast with Different Agents
-
1,000
2,000
3,000
4,000
5,000
0.0% 2.0% 4.0% 6.0% 8.0% 10.0%
Res
ilien
t Mod
ulus
in p
si
Moisture Content in Percent
20% Fouling - Subgrade Soil20 % Fouling - Gardner Track Ballast Dust20 % Fouling - Coal Dust
-
1,000
2,000
3,000
4,000
5,000
0.0% 2.0% 4.0% 6.0% 8.0% 10.0% 12.0%
Res
ilien
t Mod
ulus
in P
si
Moisture Content in Percent
30% Fouling - Subgrade Soil30 % Fouling - Gardner Track Ballast Dust30 % Fouling - Coal Dust
117
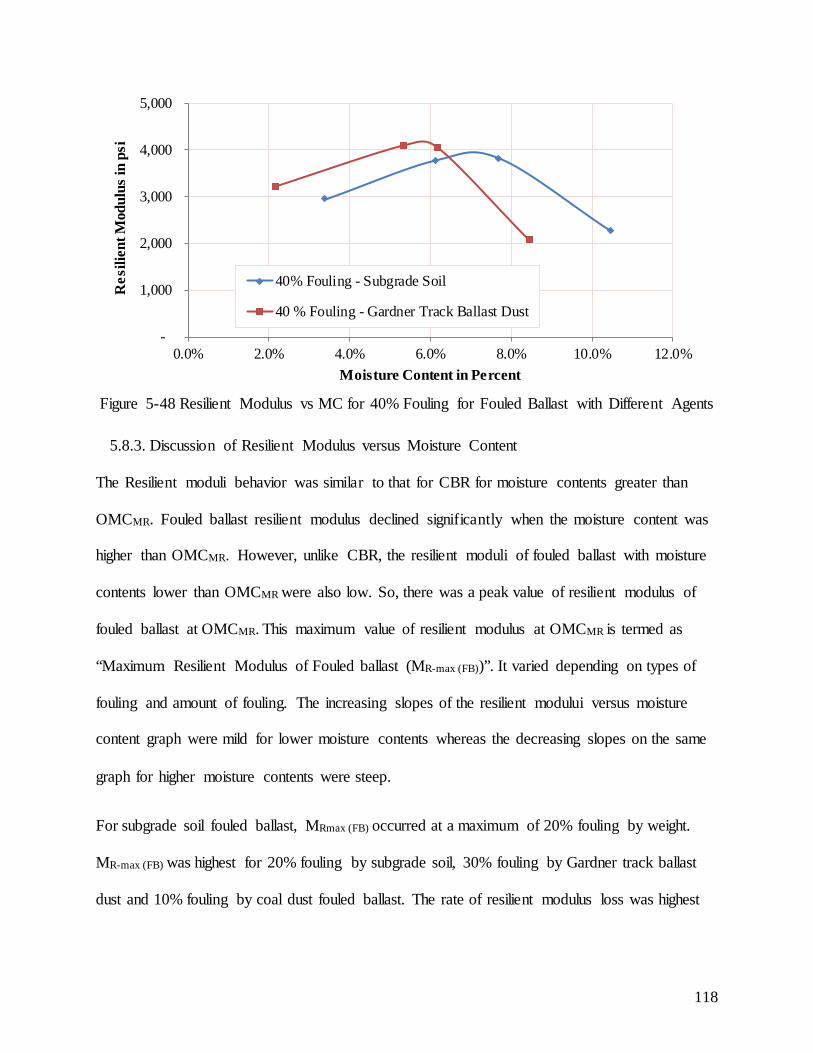
Figure 5-48 Resilient Modulus vs MC for 40% Fouling for Fouled Ballast with Different Agents
5.8.3. Discussion of Resilient Modulus versus Moisture Content
The Resilient moduli behavior was similar to that for CBR for moisture contents greater than
OMCMR. Fouled ballast resilient modulus declined significantly when the moisture content was
higher than OMCMR. However, unlike CBR, the resilient moduli of fouled ballast with moisture
contents lower than OMCMR were also low. So, there was a peak value of resilient modulus of
fouled ballast at OMCMR. This maximum value of resilient modulus at OMCMR is termed as
“Maximum Resilient Modulus of Fouled ballast (MR-max (FB))”. It varied depending on types of
fouling and amount of fouling. The increasing slopes of the resilient modului versus moisture
content graph were mild for lower moisture contents whereas the decreasing slopes on the same
graph for higher moisture contents were steep.
For subgrade soil fouled ballast, MRmax (FB) occurred at a maximum of 20% fouling by weight.
MR-max (FB) was highest for 20% fouling by subgrade soil, 30% fouling by Gardner track ballast
dust and 10% fouling by coal dust fouled ballast. The rate of resilient modulus loss was highest
-
1,000
2,000
3,000
4,000
5,000
0.0% 2.0% 4.0% 6.0% 8.0% 10.0% 12.0%
Res
ilien
t Mod
ulus
in p
si
Moisture Content in Percent
40% Fouling - Subgrade Soil
40 % Fouling - Gardner Track Ballast Dust
118
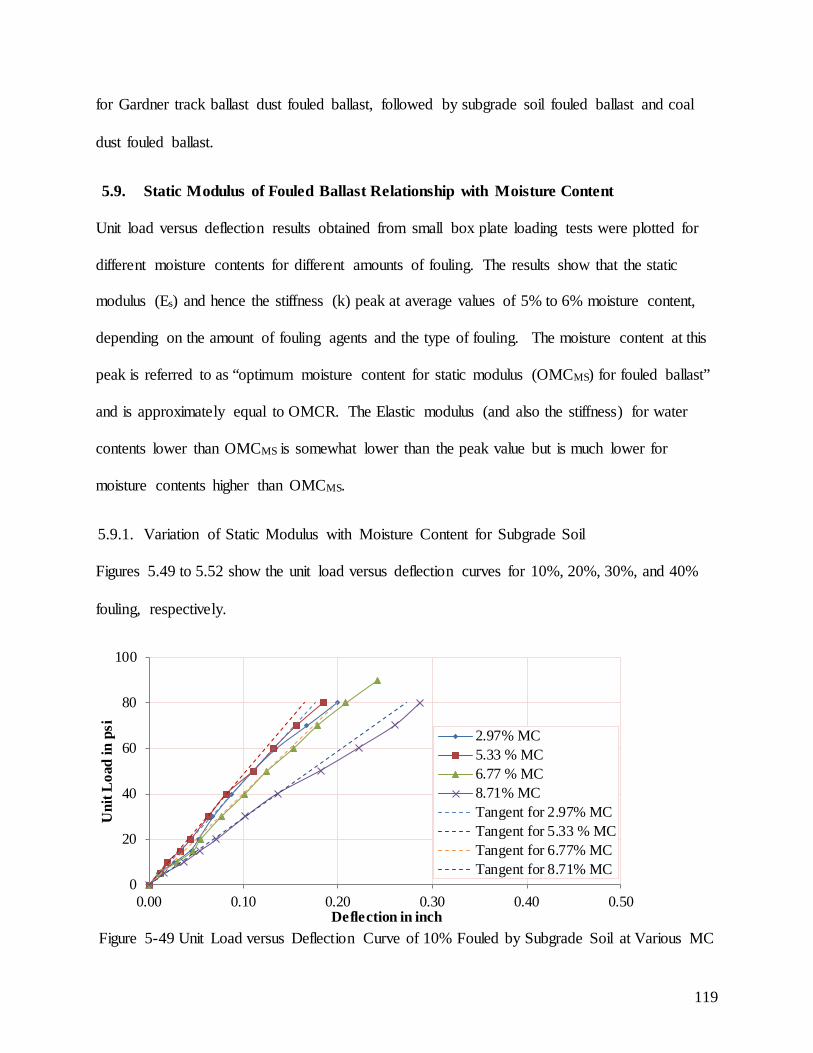
for Gardner track ballast dust fouled ballast, followed by subgrade soil fouled ballast and coal
dust fouled ballast.
5.9. Static Modulus of Fouled Ballast Relationship with Moisture Content
Unit load versus deflection results obtained from small box plate loading tests were plotted for
different moisture contents for different amounts of fouling. The results show that the static
modulus (Es) and hence the stiffness (k) peak at average values of 5% to 6% moisture content,
depending on the amount of fouling agents and the type of fouling. The moisture content at this
peak is referred to as “optimum moisture content for static modulus (OMCMS) for fouled ballast”
and is approximately equal to OMCR. The Elastic modulus (and also the stiffness) for water
contents lower than OMCMS is somewhat lower than the peak value but is much lower for
moisture contents higher than OMCMS.
5.9.1. Variation of Static Modulus with Moisture Content for Subgrade Soil
Figures 5.49 to 5.52 show the unit load versus deflection curves for 10%, 20%, 30%, and 40%
fouling, respectively.
Figure 5-49 Unit Load versus Deflection Curve of 10% Fouled by Subgrade Soil at Various MC
0
20
40
60
80
100
0.00 0.10 0.20 0.30 0.40 0.50
Uni
t Loa
d in
psi
Deflection in inch
2.97% MC5.33 % MC6.77 % MC8.71% MCTangent for 2.97% MCTangent for 5.33 % MCTangent for 6.77% MCTangent for 8.71% MC
119
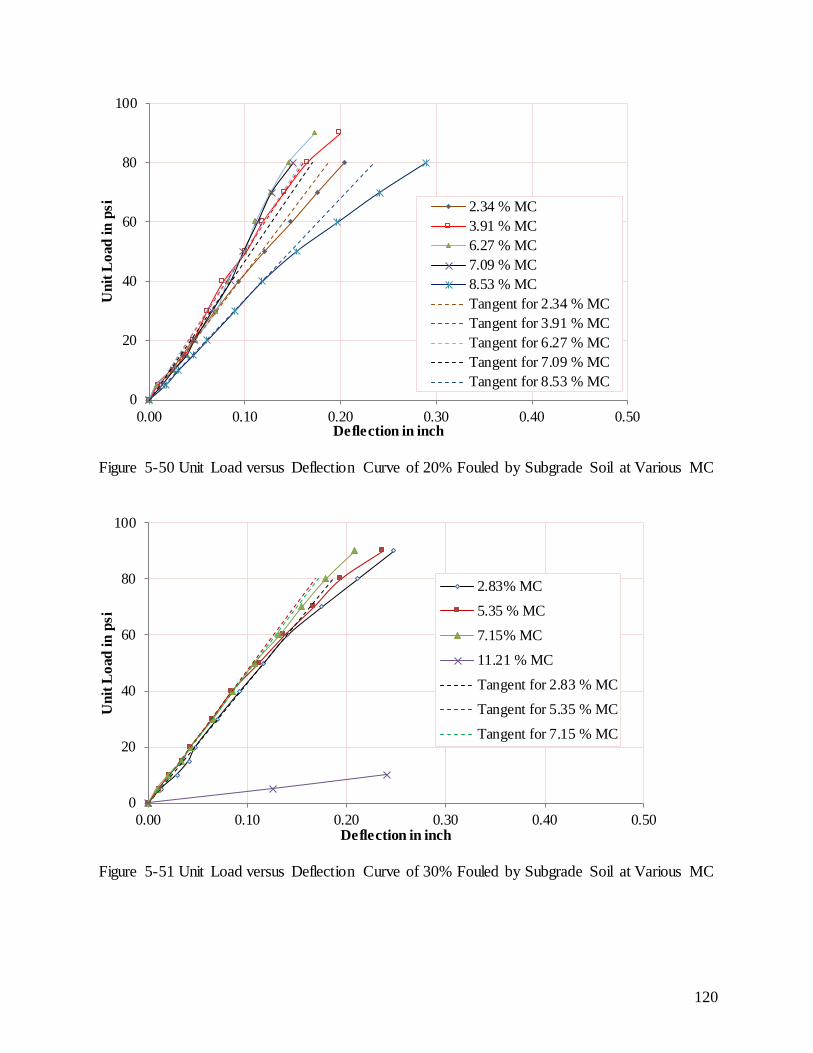
Figure 5-50 Unit Load versus Deflection Curve of 20% Fouled by Subgrade Soil at Various MC
Figure 5-51 Unit Load versus Deflection Curve of 30% Fouled by Subgrade Soil at Various MC
0
20
40
60
80
100
0.00 0.10 0.20 0.30 0.40 0.50
Uni
t Loa
d in
psi
Deflection in inch
2.34 % MC3.91 % MC6.27 % MC7.09 % MC8.53 % MCTangent for 2.34 % MCTangent for 3.91 % MCTangent for 6.27 % MCTangent for 7.09 % MCTangent for 8.53 % MC
0
20
40
60
80
100
0.00 0.10 0.20 0.30 0.40 0.50
Uni
t Loa
d in
psi
Deflection in inch
2.83% MC
5.35 % MC
7.15% MC
11.21 % MC
Tangent for 2.83 % MC
Tangent for 5.35 % MC
Tangent for 7.15 % MC
120
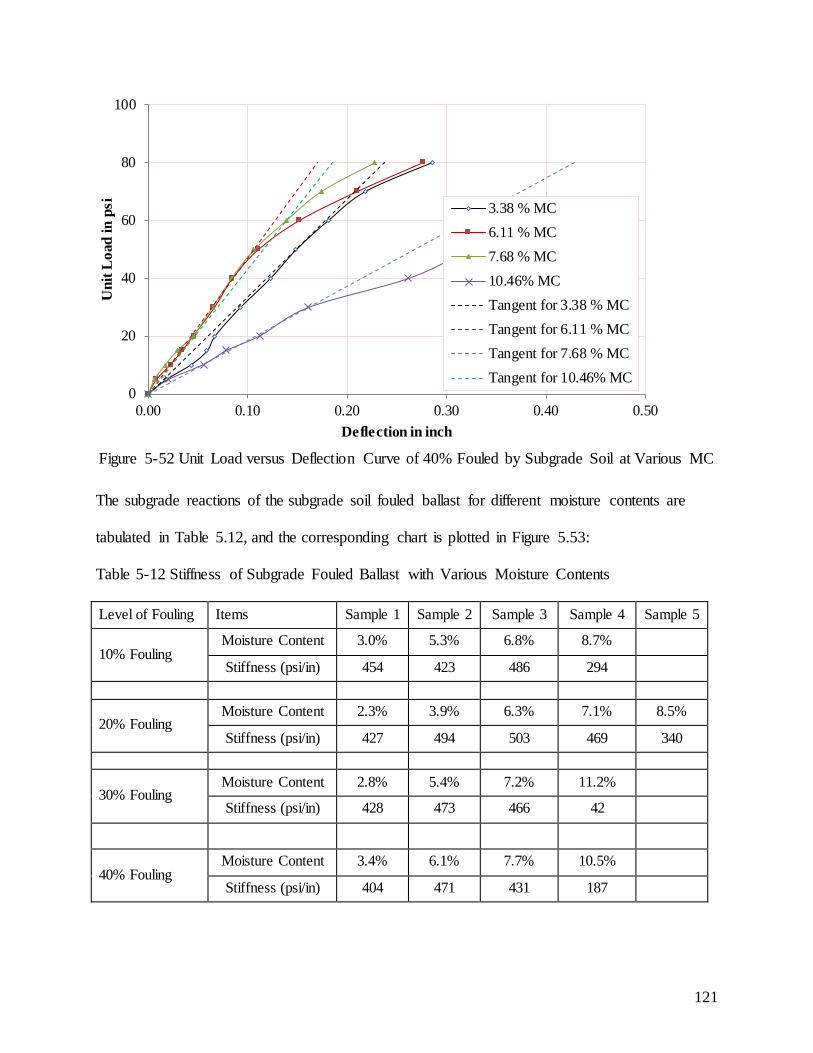
Figure 5-52 Unit Load versus Deflection Curve of 40% Fouled by Subgrade Soil at Various MC
The subgrade reactions of the subgrade soil fouled ballast for different moisture contents are
tabulated in Table 5.12, and the corresponding chart is plotted in Figure 5.53:
Table 5-12 Stiffness of Subgrade Fouled Ballast with Various Moisture Contents
Level of Fouling Items Sample 1 Sample 2 Sample 3 Sample 4 Sample 5
10% Fouling Moisture Content 3.0% 5.3% 6.8% 8.7%
Stiffness (psi/in) 454 423 486 294
20% Fouling Moisture Content 2.3% 3.9% 6.3% 7.1% 8.5%
Stiffness (psi/in) 427 494 503 469 340
30% Fouling Moisture Content 2.8% 5.4% 7.2% 11.2%
Stiffness (psi/in) 428 473 466 42
40% Fouling Moisture Content 3.4% 6.1% 7.7% 10.5%
Stiffness (psi/in) 404 471 431 187
0
20
40
60
80
100
0.00 0.10 0.20 0.30 0.40 0.50
Uni
t Loa
d in
psi
Deflection in inch
3.38 % MC6.11 % MC7.68 % MC10.46% MCTangent for 3.38 % MCTangent for 6.11 % MCTangent for 7.68 % MCTangent for 10.46% MC
121
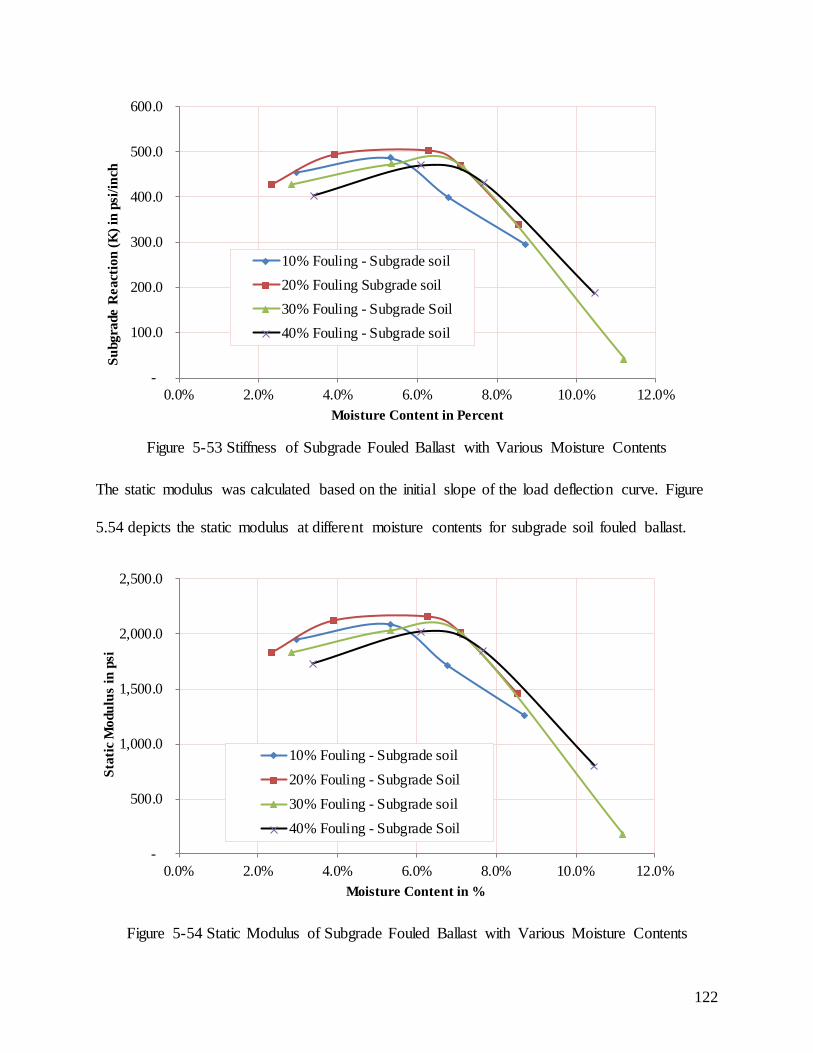
Figure 5-53 Stiffness of Subgrade Fouled Ballast with Various Moisture Contents
The static modulus was calculated based on the initial slope of the load deflection curve. Figure
5.54 depicts the static modulus at different moisture contents for subgrade soil fouled ballast.
Figure 5-54 Static Modulus of Subgrade Fouled Ballast with Various Moisture Contents
-
100.0
200.0
300.0
400.0
500.0
600.0
0.0% 2.0% 4.0% 6.0% 8.0% 10.0% 12.0%
Subg
rade
Rea
ctio
n (K
) in
psi/i
nch
Moisture Content in Percent
10% Fouling - Subgrade soil20% Fouling Subgrade soil30% Fouling - Subgrade Soil40% Fouling - Subgrade soil
-
500.0
1,000.0
1,500.0
2,000.0
2,500.0
0.0% 2.0% 4.0% 6.0% 8.0% 10.0% 12.0%
Stat
ic M
odul
us in
psi
Moisture Content in %
10% Fouling - Subgrade soil20% Fouling - Subgrade Soil30% Fouling - Subgrade soil40% Fouling - Subgrade Soil
122
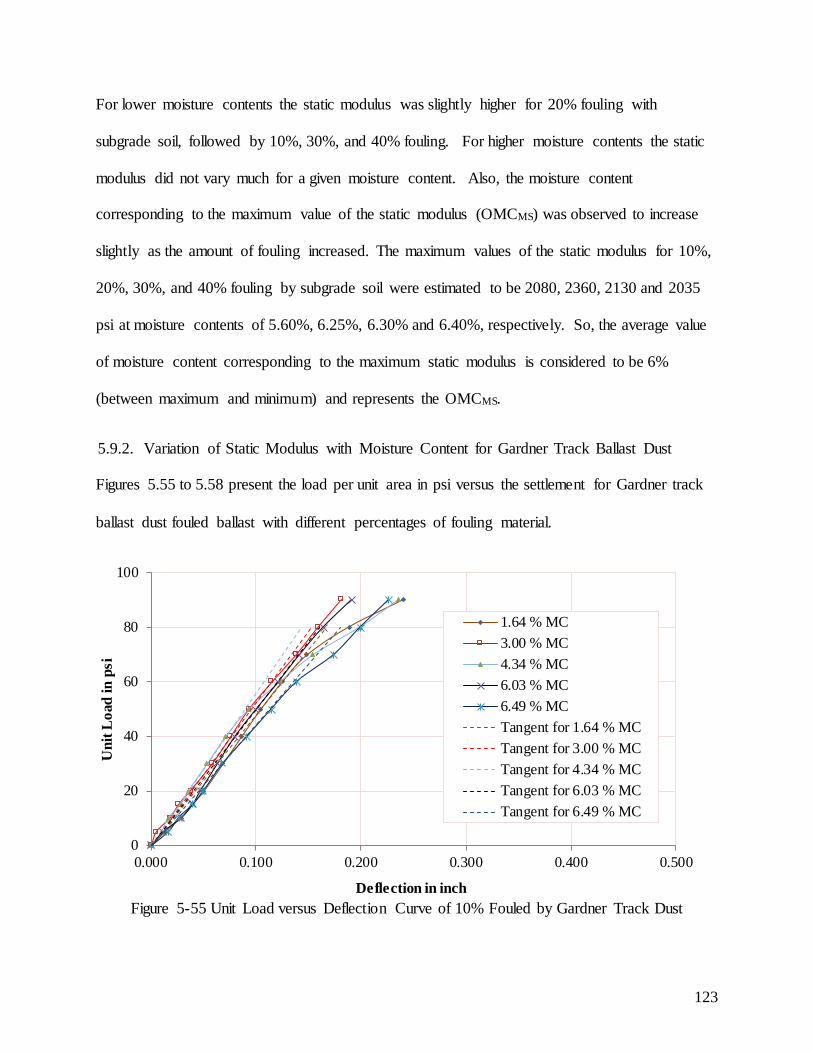
For lower moisture contents the static modulus was slightly higher for 20% fouling with
subgrade soil, followed by 10%, 30%, and 40% fouling. For higher moisture contents the static
modulus did not vary much for a given moisture content. Also, the moisture content
corresponding to the maximum value of the static modulus (OMCMS) was observed to increase
slightly as the amount of fouling increased. The maximum values of the static modulus for 10%,
20%, 30%, and 40% fouling by subgrade soil were estimated to be 2080, 2360, 2130 and 2035
psi at moisture contents of 5.60%, 6.25%, 6.30% and 6.40%, respectively. So, the average value
of moisture content corresponding to the maximum static modulus is considered to be 6%
(between maximum and minimum) and represents the OMCMS.
5.9.2. Variation of Static Modulus with Moisture Content for Gardner Track Ballast Dust
Figures 5.55 to 5.58 present the load per unit area in psi versus the settlement for Gardner track
ballast dust fouled ballast with different percentages of fouling material.
Figure 5-55 Unit Load versus Deflection Curve of 10% Fouled by Gardner Track Dust
0
20
40
60
80
100
0.000 0.100 0.200 0.300 0.400 0.500
Uni
t Loa
d in
psi
Deflection in inch
1.64 % MC3.00 % MC4.34 % MC6.03 % MC6.49 % MCTangent for 1.64 % MCTangent for 3.00 % MCTangent for 4.34 % MCTangent for 6.03 % MCTangent for 6.49 % MC
123
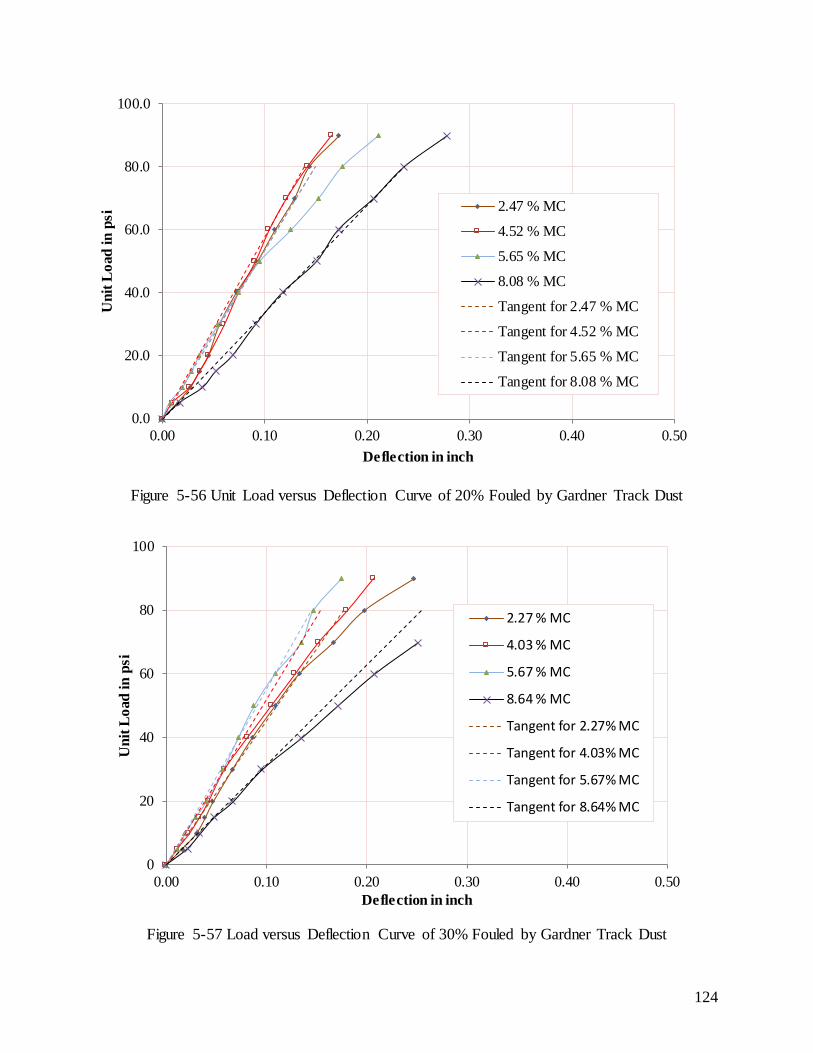
Figure 5-56 Unit Load versus Deflection Curve of 20% Fouled by Gardner Track Dust
Figure 5-57 Load versus Deflection Curve of 30% Fouled by Gardner Track Dust
0.0
20.0
40.0
60.0
80.0
100.0
0.00 0.10 0.20 0.30 0.40 0.50
Uni
t Loa
d in
psi
Deflection in inch
2.47 % MC
4.52 % MC
5.65 % MC
8.08 % MC
Tangent for 2.47 % MC
Tangent for 4.52 % MC
Tangent for 5.65 % MC
Tangent for 8.08 % MC
0
20
40
60
80
100
0.00 0.10 0.20 0.30 0.40 0.50
Uni
t Loa
d in
psi
Deflection in inch
2.27 % MC
4.03 % MC
5.67 % MC
8.64 % MC
Tangent for 2.27% MC
Tangent for 4.03% MC
Tangent for 5.67% MC
Tangent for 8.64% MC
124

Figure 5-58 Unit Load versus Deflection Curve of 40% Fouled by Gardner Track Dust
The subgrade reactions of the Gardner track ballast dust fouled ballast for different moisture
contents are tabulated in Table 5.13, and the corresponding chart is plotted in Figure 5.59:
Table 5-13 Stiffness of Gardner Track Dust Fouled Ballast with Various Moisture Contents
Fouling Level Items Sample 1 Sample 2 Sample 3 Sample 4 Sample 5
10% Fouling Moisture Content 1.6% 3.0% 4.3% 6.0% 6.5%
subgrade reaction (psi/in) 478 522 558 498 435
20% Fouling Moisture Content 2.5% 4.5% 5.7% 8.1%
subgrade reaction (psi/in) 536 576 536 339
30% Fouling Moisture Content 2.3% 4.0% 5.7% 8.6%
subgrade reaction (psi/in) 452 519 553 314
40% Fouling Moisture Content 2.2% 5.3% 6.2% 8.5%
subgrade reaction (psi/in) 398 484 453 236
0
20
40
60
80
100
0.00 0.10 0.20 0.30 0.40 0.50
Uni
t Loa
d in
psi
Deflection in inch
2.16% MC5.34% MC6.16% MC8.45% MCTangent for 2.16% MCTangent for 5.34% MCTangent for 6.16% MCTangent for 8.45% MC
125
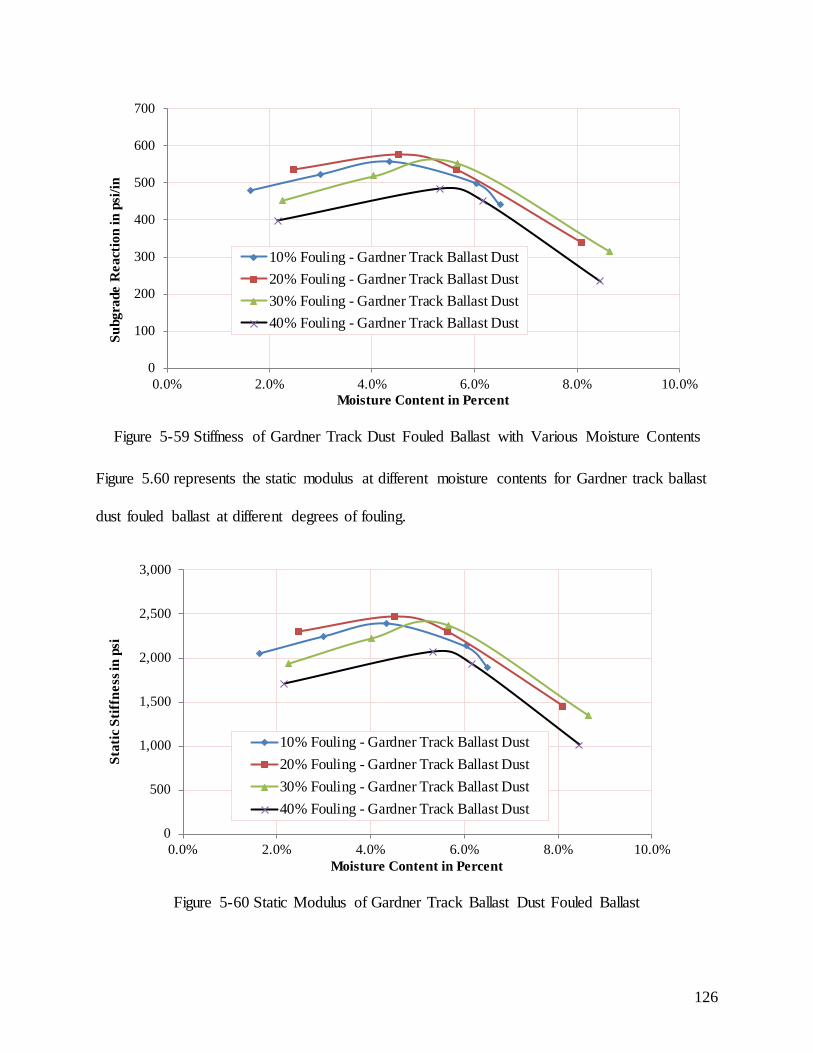
Figure 5-59 Stiffness of Gardner Track Dust Fouled Ballast with Various Moisture Contents
Figure 5.60 represents the static modulus at different moisture contents for Gardner track ballast
dust fouled ballast at different degrees of fouling.
Figure 5-60 Static Modulus of Gardner Track Ballast Dust Fouled Ballast
0
100
200
300
400
500
600
700
0.0% 2.0% 4.0% 6.0% 8.0% 10.0%
Subg
rade
Rea
ctio
n in
psi
/in
Moisture Content in Percent
10% Fouling - Gardner Track Ballast Dust20% Fouling - Gardner Track Ballast Dust30% Fouling - Gardner Track Ballast Dust40% Fouling - Gardner Track Ballast Dust
0
500
1,000
1,500
2,000
2,500
3,000
0.0% 2.0% 4.0% 6.0% 8.0% 10.0%
Stat
ic S
tiffn
ess i
n ps
i
Moisture Content in Percent
10% Fouling - Gardner Track Ballast Dust20% Fouling - Gardner Track Ballast Dust30% Fouling - Gardner Track Ballast Dust40% Fouling - Gardner Track Ballast Dust
126
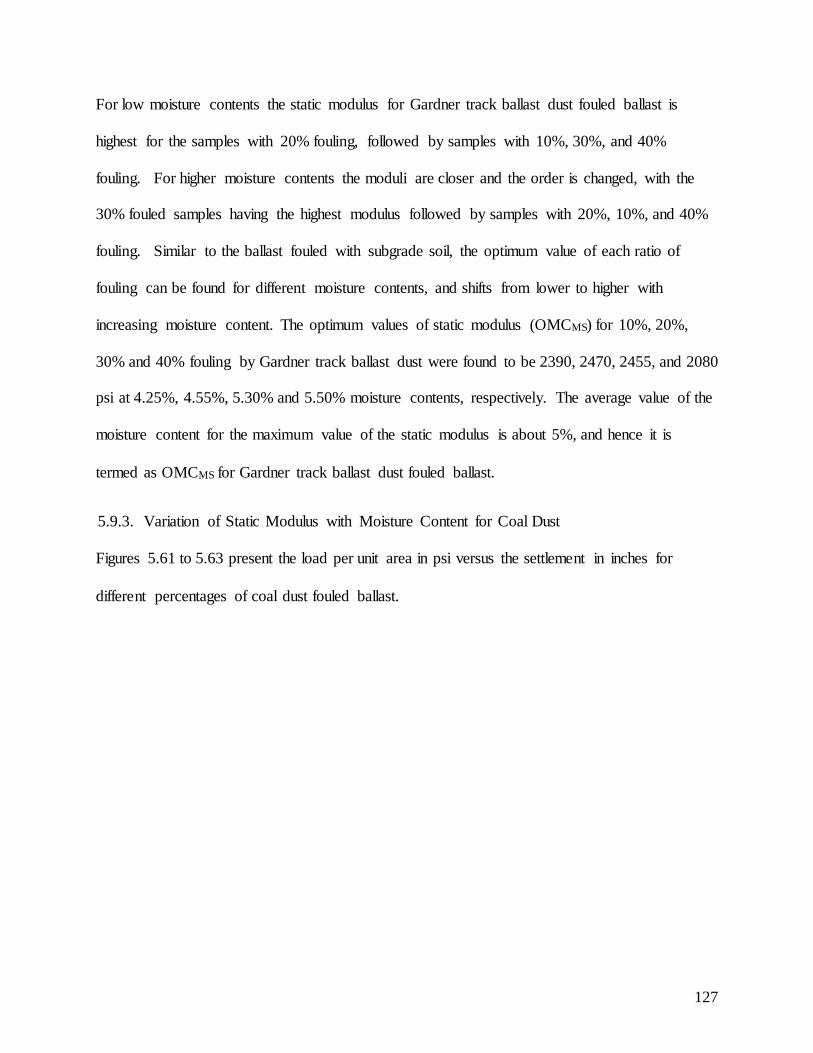
For low moisture contents the static modulus for Gardner track ballast dust fouled ballast is
highest for the samples with 20% fouling, followed by samples with 10%, 30%, and 40%
fouling. For higher moisture contents the moduli are closer and the order is changed, with the
30% fouled samples having the highest modulus followed by samples with 20%, 10%, and 40%
fouling. Similar to the ballast fouled with subgrade soil, the optimum value of each ratio of
fouling can be found for different moisture contents, and shifts from lower to higher with
increasing moisture content. The optimum values of static modulus (OMCMS) for 10%, 20%,
30% and 40% fouling by Gardner track ballast dust were found to be 2390, 2470, 2455, and 2080
psi at 4.25%, 4.55%, 5.30% and 5.50% moisture contents, respectively. The average value of the
moisture content for the maximum value of the static modulus is about 5%, and hence it is
termed as OMCMS for Gardner track ballast dust fouled ballast.
5.9.3. Variation of Static Modulus with Moisture Content for Coal Dust
Figures 5.61 to 5.63 present the load per unit area in psi versus the settlement in inches for
different percentages of coal dust fouled ballast.
127
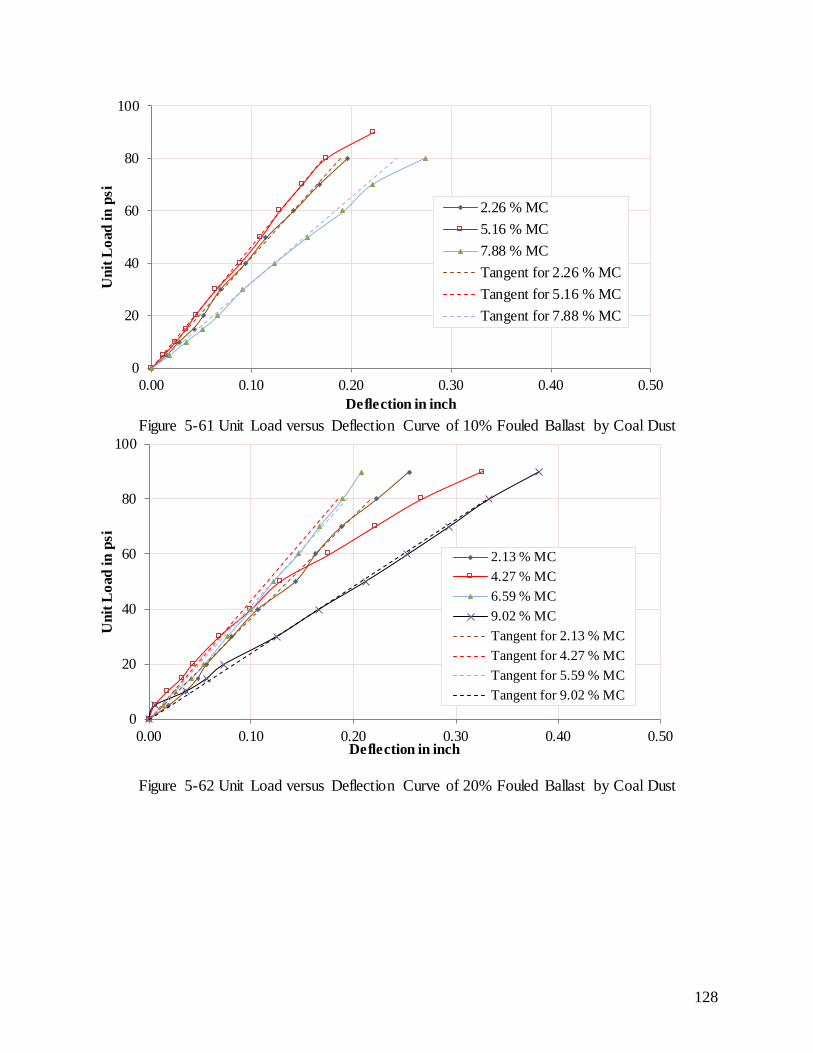
Figure 5-61 Unit Load versus Deflection Curve of 10% Fouled Ballast by Coal Dust
Figure 5-62 Unit Load versus Deflection Curve of 20% Fouled Ballast by Coal Dust
0
20
40
60
80
100
0.00 0.10 0.20 0.30 0.40 0.50
Uni
t Loa
d in
psi
Deflection in inch
2.26 % MC5.16 % MC7.88 % MCTangent for 2.26 % MCTangent for 5.16 % MCTangent for 7.88 % MC
0
20
40
60
80
100
0.00 0.10 0.20 0.30 0.40 0.50
Uni
t Loa
d in
psi
Deflection in inch
2.13 % MC4.27 % MC6.59 % MC9.02 % MCTangent for 2.13 % MCTangent for 4.27 % MCTangent for 5.59 % MCTangent for 9.02 % MC
128
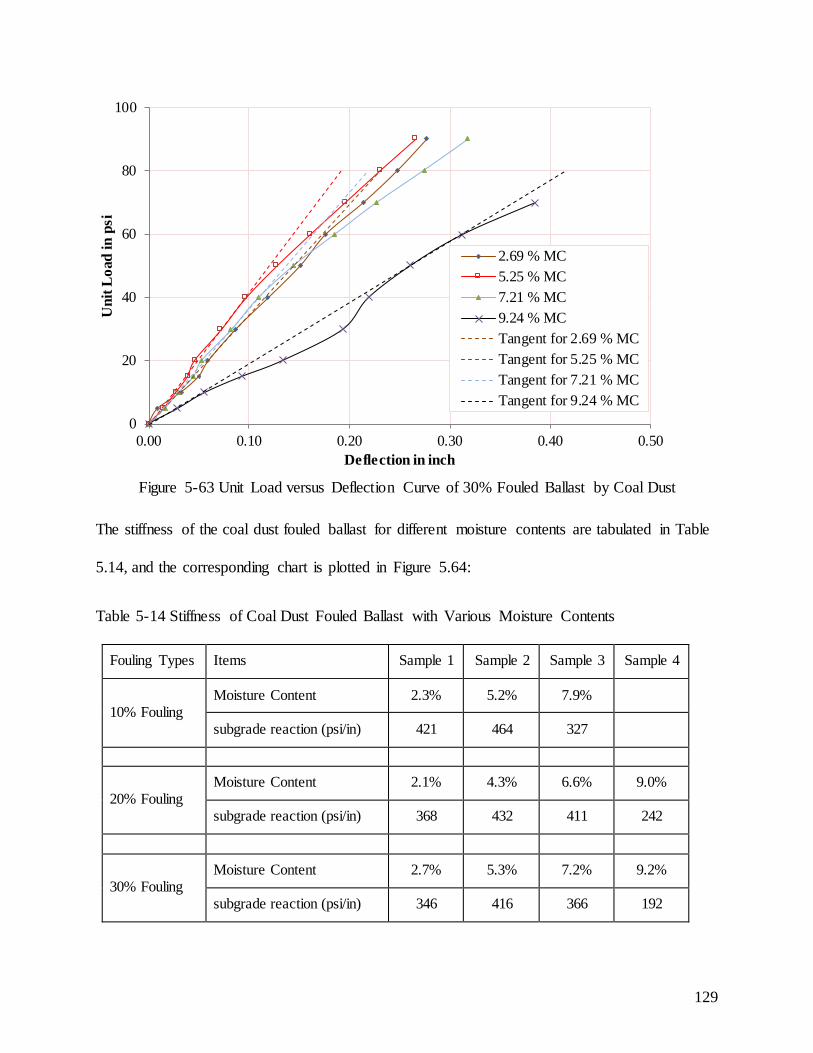
Figure 5-63 Unit Load versus Deflection Curve of 30% Fouled Ballast by Coal Dust
The stiffness of the coal dust fouled ballast for different moisture contents are tabulated in Table
5.14, and the corresponding chart is plotted in Figure 5.64:
Table 5-14 Stiffness of Coal Dust Fouled Ballast with Various Moisture Contents
Fouling Types Items Sample 1 Sample 2 Sample 3 Sample 4
10% Fouling Moisture Content 2.3% 5.2% 7.9%
subgrade reaction (psi/in) 421 464 327
20% Fouling Moisture Content 2.1% 4.3% 6.6% 9.0%
subgrade reaction (psi/in) 368 432 411 242
30% Fouling Moisture Content 2.7% 5.3% 7.2% 9.2%
subgrade reaction (psi/in) 346 416 366 192
0
20
40
60
80
100
0.00 0.10 0.20 0.30 0.40 0.50
Uni
t Loa
d in
psi
Deflection in inch
2.69 % MC5.25 % MC7.21 % MC9.24 % MCTangent for 2.69 % MCTangent for 5.25 % MCTangent for 7.21 % MCTangent for 9.24 % MC
129
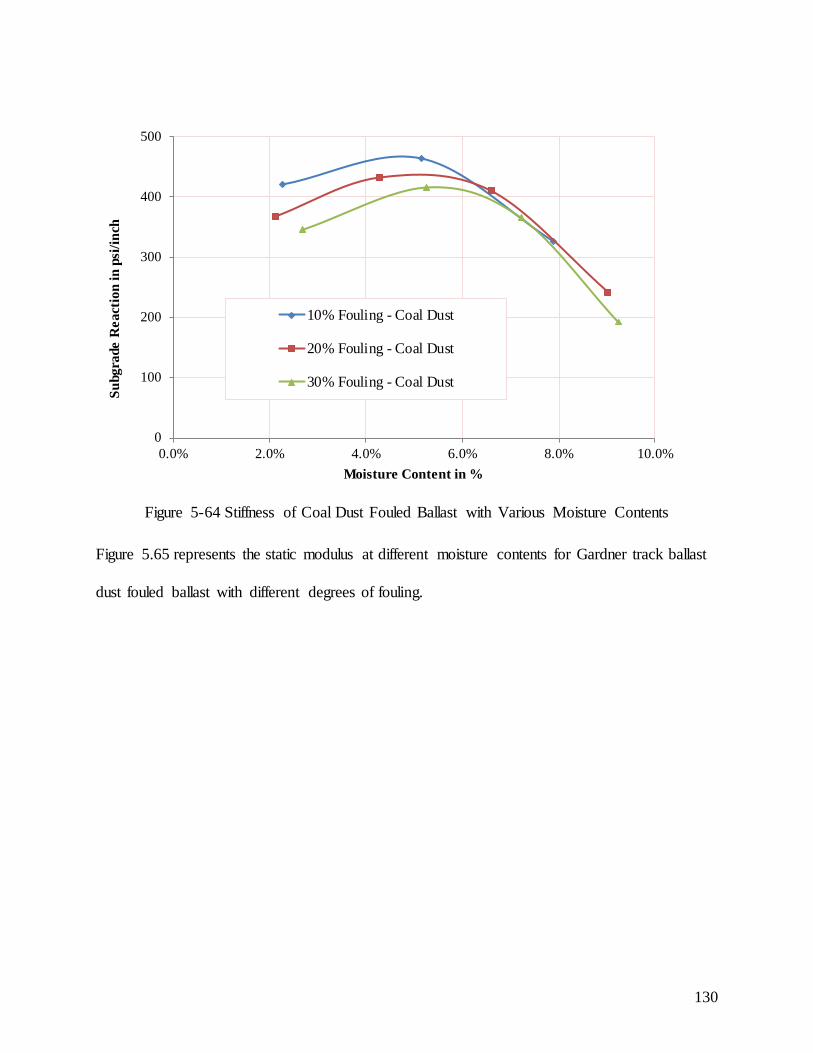
Figure 5-64 Stiffness of Coal Dust Fouled Ballast with Various Moisture Contents
Figure 5.65 represents the static modulus at different moisture contents for Gardner track ballast
dust fouled ballast with different degrees of fouling.
0
100
200
300
400
500
0.0% 2.0% 4.0% 6.0% 8.0% 10.0%
Subg
rade
Rea
ctio
n in
psi
/inch
Moisture Content in %
10% Fouling - Coal Dust
20% Fouling - Coal Dust
30% Fouling - Coal Dust
130
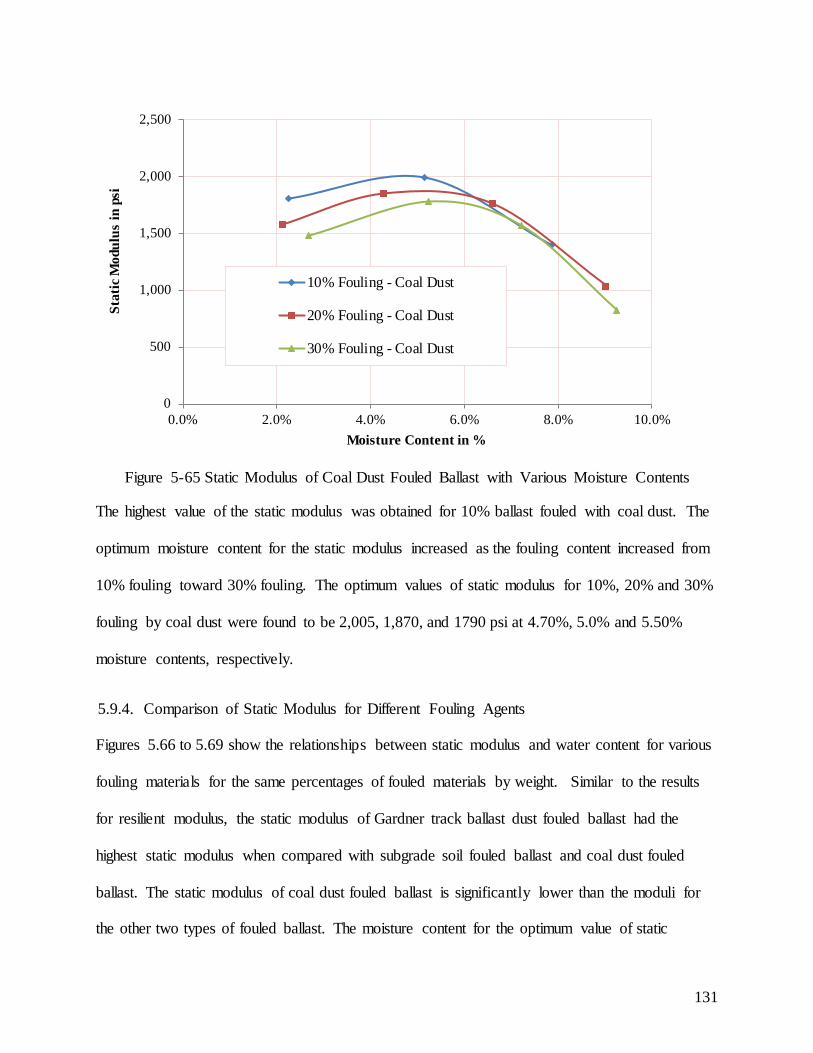
Figure 5-65 Static Modulus of Coal Dust Fouled Ballast with Various Moisture Contents
The highest value of the static modulus was obtained for 10% ballast fouled with coal dust. The
optimum moisture content for the static modulus increased as the fouling content increased from
10% fouling toward 30% fouling. The optimum values of static modulus for 10%, 20% and 30%
fouling by coal dust were found to be 2,005, 1,870, and 1790 psi at 4.70%, 5.0% and 5.50%
moisture contents, respectively.
5.9.4. Comparison of Static Modulus for Different Fouling Agents
Figures 5.66 to 5.69 show the relationships between static modulus and water content for various
fouling materials for the same percentages of fouled materials by weight. Similar to the results
for resilient modulus, the static modulus of Gardner track ballast dust fouled ballast had the
highest static modulus when compared with subgrade soil fouled ballast and coal dust fouled
ballast. The static modulus of coal dust fouled ballast is significantly lower than the moduli for
the other two types of fouled ballast. The moisture content for the optimum value of static
0
500
1,000
1,500
2,000
2,500
0.0% 2.0% 4.0% 6.0% 8.0% 10.0%
Stat
ic M
odul
us in
psi
Moisture Content in %
10% Fouling - Coal Dust
20% Fouling - Coal Dust
30% Fouling - Coal Dust
131
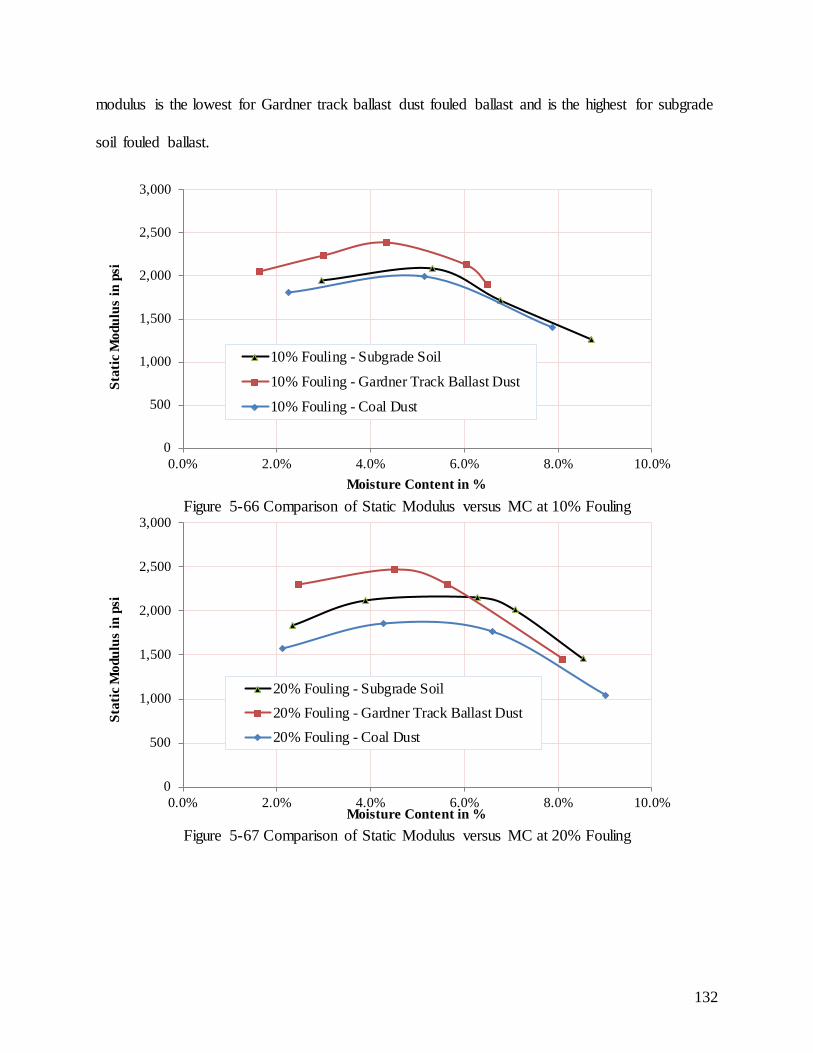
modulus is the lowest for Gardner track ballast dust fouled ballast and is the highest for subgrade
soil fouled ballast.
Figure 5-66 Comparison of Static Modulus versus MC at 10% Fouling
Figure 5-67 Comparison of Static Modulus versus MC at 20% Fouling
0
500
1,000
1,500
2,000
2,500
3,000
0.0% 2.0% 4.0% 6.0% 8.0% 10.0%
Stat
ic M
odul
us in
psi
Moisture Content in %
10% Fouling - Subgrade Soil
10% Fouling - Gardner Track Ballast Dust
10% Fouling - Coal Dust
0
500
1,000
1,500
2,000
2,500
3,000
0.0% 2.0% 4.0% 6.0% 8.0% 10.0%
Stat
ic M
odul
us in
psi
Moisture Content in %
20% Fouling - Subgrade Soil20% Fouling - Gardner Track Ballast Dust20% Fouling - Coal Dust
132
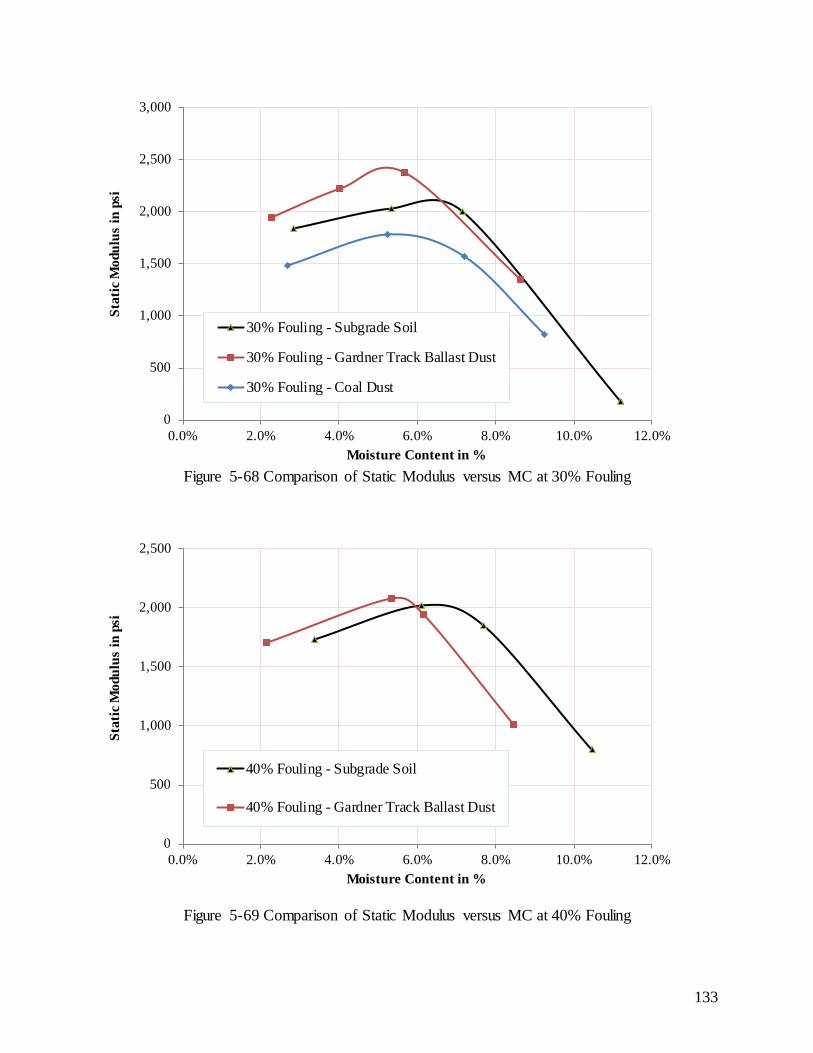
Figure 5-68 Comparison of Static Modulus versus MC at 30% Fouling
Figure 5-69 Comparison of Static Modulus versus MC at 40% Fouling
0
500
1,000
1,500
2,000
2,500
3,000
0.0% 2.0% 4.0% 6.0% 8.0% 10.0% 12.0%
Stat
ic M
odul
us in
psi
Moisture Content in %
30% Fouling - Subgrade Soil
30% Fouling - Gardner Track Ballast Dust
30% Fouling - Coal Dust
0
500
1,000
1,500
2,000
2,500
0.0% 2.0% 4.0% 6.0% 8.0% 10.0% 12.0%
Stat
ic M
odul
us in
psi
Moisture Content in %
40% Fouling - Subgrade Soil
40% Fouling - Gardner Track Ballast Dust
133
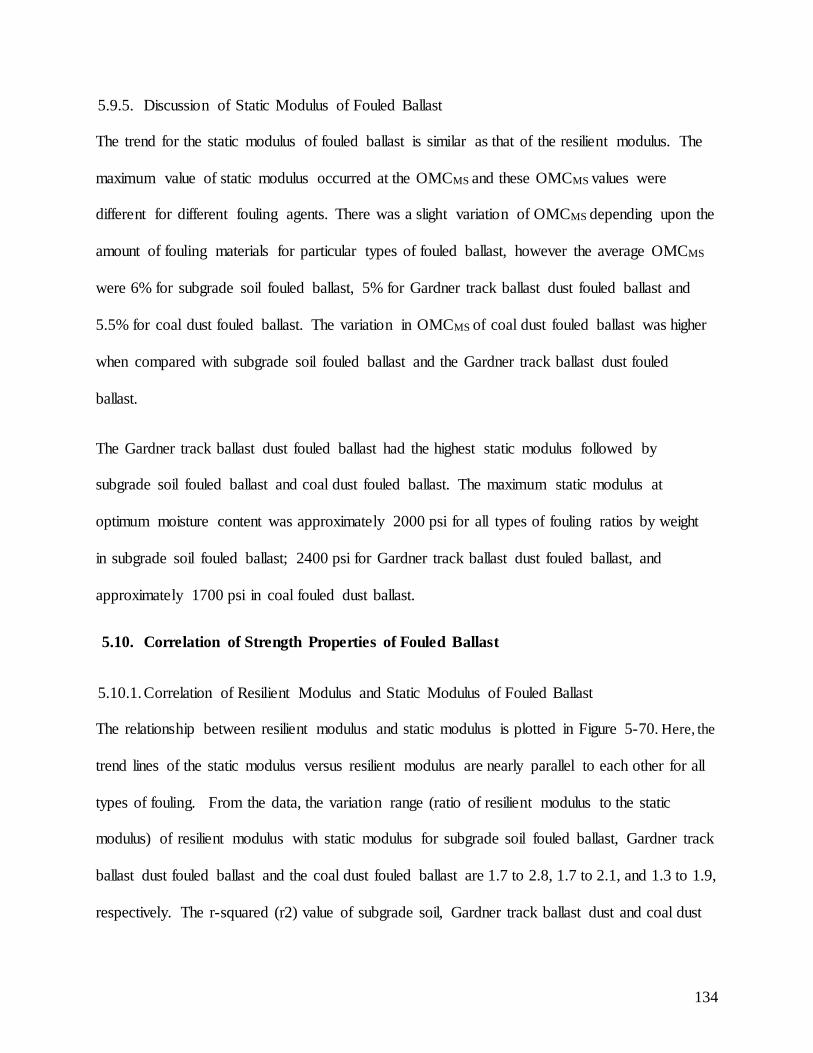
5.9.5. Discussion of Static Modulus of Fouled Ballast
The trend for the static modulus of fouled ballast is similar as that of the resilient modulus. The
maximum value of static modulus occurred at the OMCMS and these OMCMS values were
different for different fouling agents. There was a slight variation of OMCMS depending upon the
amount of fouling materials for particular types of fouled ballast, however the average OMCMS
were 6% for subgrade soil fouled ballast, 5% for Gardner track ballast dust fouled ballast and
5.5% for coal dust fouled ballast. The variation in OMCMS of coal dust fouled ballast was higher
when compared with subgrade soil fouled ballast and the Gardner track ballast dust fouled
ballast.
The Gardner track ballast dust fouled ballast had the highest static modulus followed by
subgrade soil fouled ballast and coal dust fouled ballast. The maximum static modulus at
optimum moisture content was approximately 2000 psi for all types of fouling ratios by weight
in subgrade soil fouled ballast; 2400 psi for Gardner track ballast dust fouled ballast, and
approximately 1700 psi in coal fouled dust ballast.
5.10. Correlation of Strength Properties of Fouled Ballast
5.10.1. Correlation of Resilient Modulus and Static Modulus of Fouled Ballast
The relationship between resilient modulus and static modulus is plotted in Figure 5-70. Here, the
trend lines of the static modulus versus resilient modulus are nearly parallel to each other for all
types of fouling. From the data, the variation range (ratio of resilient modulus to the static
modulus) of resilient modulus with static modulus for subgrade soil fouled ballast, Gardner track
ballast dust fouled ballast and the coal dust fouled ballast are 1.7 to 2.8, 1.7 to 2.1, and 1.3 to 1.9,
respectively. The r-squared (r2) value of subgrade soil, Gardner track ballast dust and coal dust
134
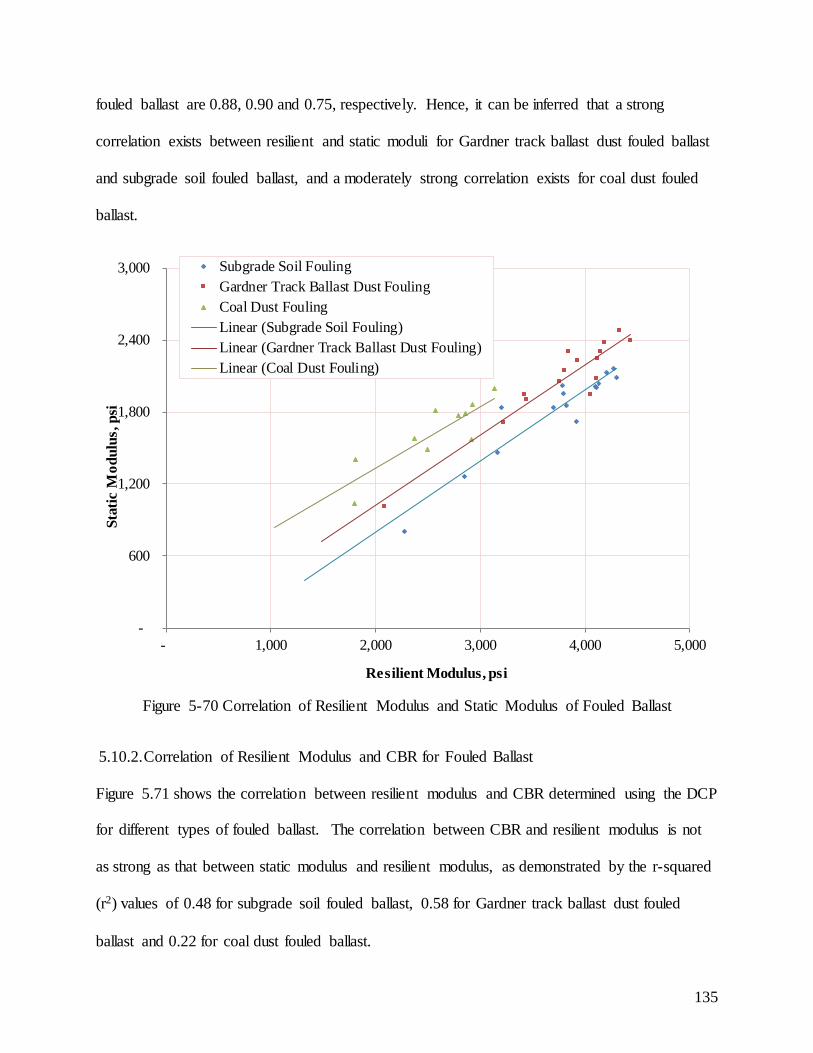
fouled ballast are 0.88, 0.90 and 0.75, respectively. Hence, it can be inferred that a strong
correlation exists between resilient and static moduli for Gardner track ballast dust fouled ballast
and subgrade soil fouled ballast, and a moderately strong correlation exists for coal dust fouled
ballast.
Figure 5-70 Correlation of Resilient Modulus and Static Modulus of Fouled Ballast
5.10.2. Correlation of Resilient Modulus and CBR for Fouled Ballast
Figure 5.71 shows the correlation between resilient modulus and CBR determined using the DCP
for different types of fouled ballast. The correlation between CBR and resilient modulus is not
as strong as that between static modulus and resilient modulus, as demonstrated by the r-squared
(r2) values of 0.48 for subgrade soil fouled ballast, 0.58 for Gardner track ballast dust fouled
ballast and 0.22 for coal dust fouled ballast.
-
600
1,200
1,800
2,400
3,000
- 1,000 2,000 3,000 4,000 5,000
Stat
ic M
odul
us, p
si
Resilient Modulus, psi
Subgrade Soil FoulingGardner Track Ballast Dust FoulingCoal Dust FoulingLinear (Subgrade Soil Fouling)Linear (Gardner Track Ballast Dust Fouling)Linear (Coal Dust Fouling)
135
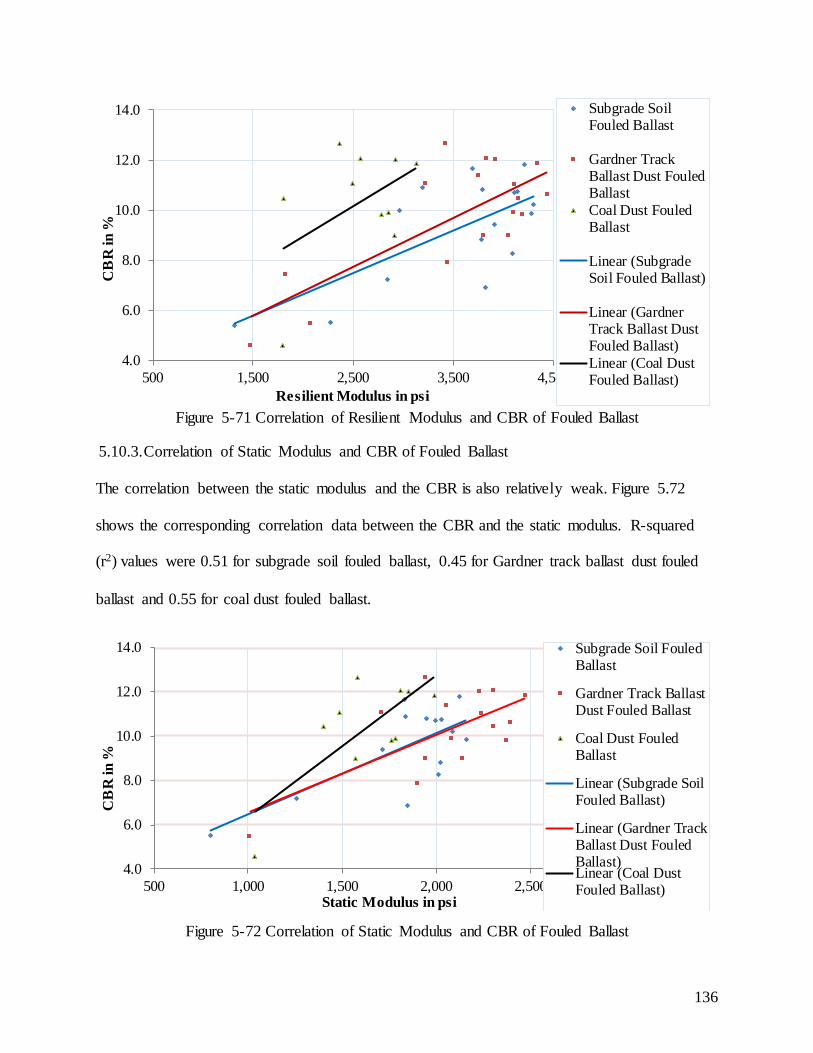
Figure 5-71 Correlation of Resilient Modulus and CBR of Fouled Ballast
5.10.3. Correlation of Static Modulus and CBR of Fouled Ballast
The correlation between the static modulus and the CBR is also relatively weak. Figure 5.72
shows the corresponding correlation data between the CBR and the static modulus. R-squared
(r2) values were 0.51 for subgrade soil fouled ballast, 0.45 for Gardner track ballast dust fouled
ballast and 0.55 for coal dust fouled ballast.
Figure 5-72 Correlation of Static Modulus and CBR of Fouled Ballast
4.0
6.0
8.0
10.0
12.0
14.0
500 1,500 2,500 3,500 4,500
CB
R in
%
Resilient Modulus in psi
Subgrade SoilFouled Ballast
Gardner TrackBallast Dust FouledBallastCoal Dust FouledBallast
Linear (SubgradeSoil Fouled Ballast)
Linear (GardnerTrack Ballast DustFouled Ballast)Linear (Coal DustFouled Ballast)
4.0
6.0
8.0
10.0
12.0
14.0
500 1,000 1,500 2,000 2,500 3,000
CB
R in
%
Static Modulus in psi
Subgrade Soil FouledBallast
Gardner Track BallastDust Fouled Ballast
Coal Dust FouledBallast
Linear (Subgrade SoilFouled Ballast)
Linear (Gardner TrackBallast Dust FouledBallast)Linear (Coal DustFouled Ballast)
136
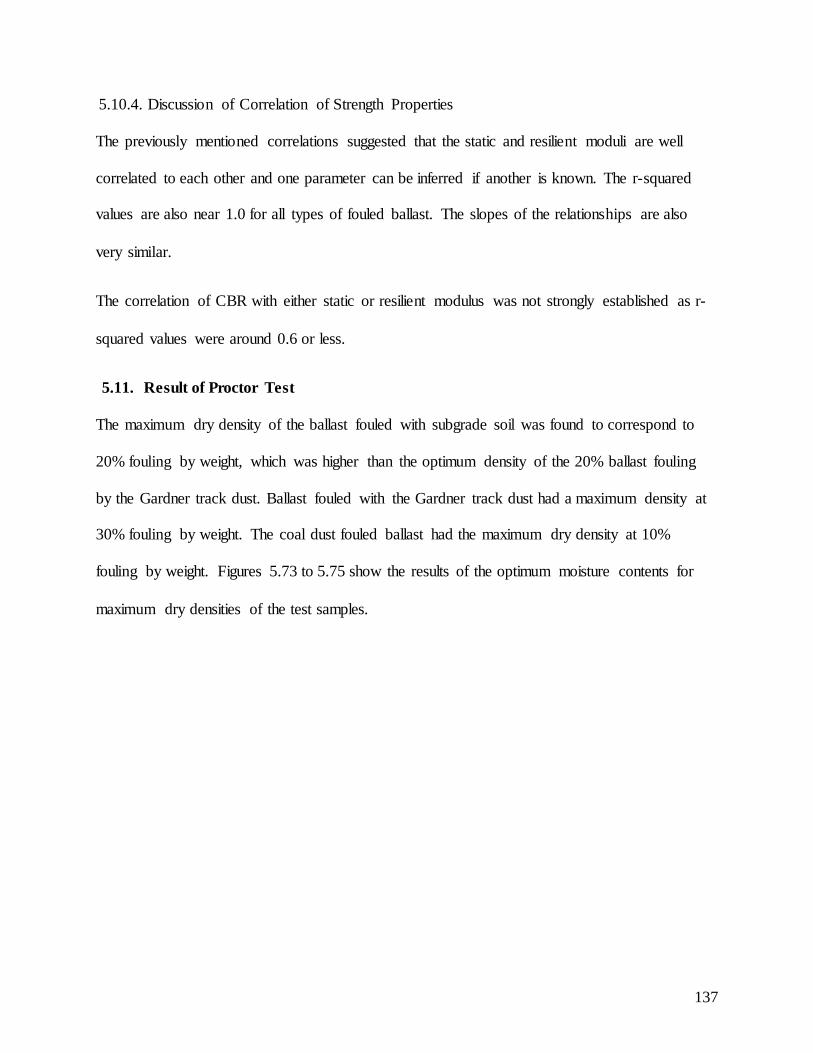
5.10.4. Discussion of Correlation of Strength Properties
The previously mentioned correlations suggested that the static and resilient moduli are well
correlated to each other and one parameter can be inferred if another is known. The r-squared
values are also near 1.0 for all types of fouled ballast. The slopes of the relationships are also
very similar.
The correlation of CBR with either static or resilient modulus was not strongly established as r-
squared values were around 0.6 or less.
5.11. Result of Proctor Test
The maximum dry density of the ballast fouled with subgrade soil was found to correspond to
20% fouling by weight, which was higher than the optimum density of the 20% ballast fouling
by the Gardner track dust. Ballast fouled with the Gardner track dust had a maximum density at
30% fouling by weight. The coal dust fouled ballast had the maximum dry density at 10%
fouling by weight. Figures 5.73 to 5.75 show the results of the optimum moisture contents for
maximum dry densities of the test samples.
137
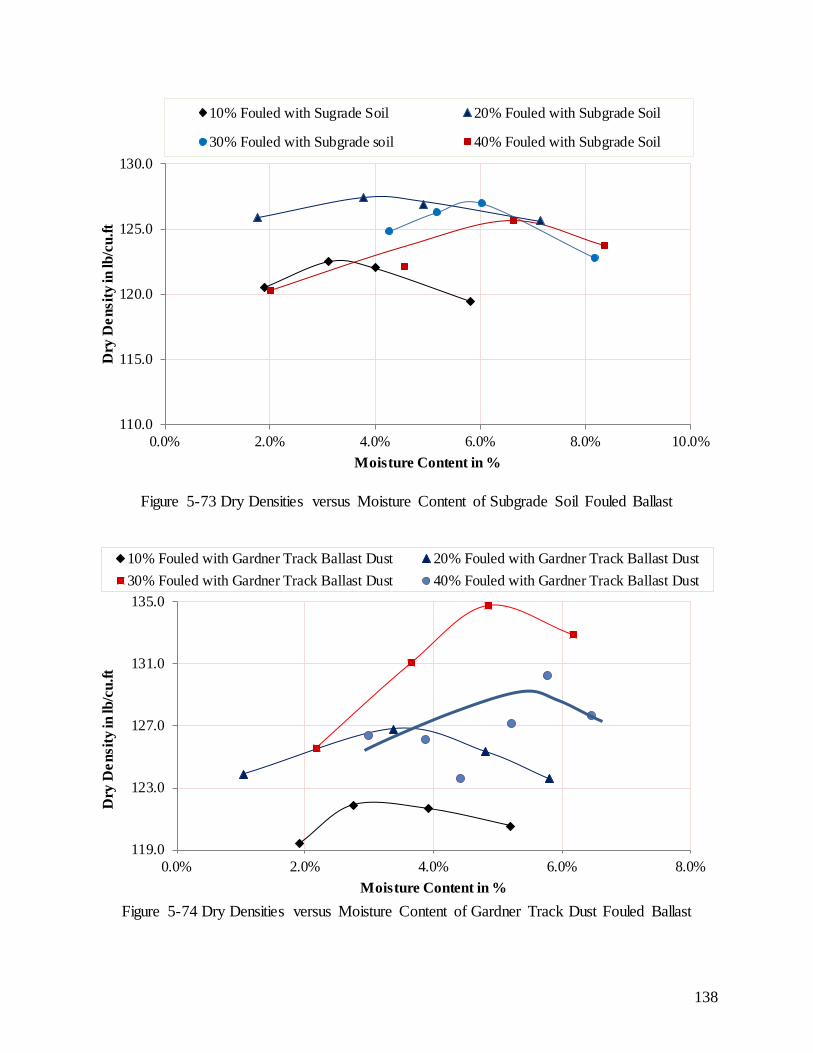
Figure 5-73 Dry Densities versus Moisture Content of Subgrade Soil Fouled Ballast
Figure 5-74 Dry Densities versus Moisture Content of Gardner Track Dust Fouled Ballast
110.0
115.0
120.0
125.0
130.0
0.0% 2.0% 4.0% 6.0% 8.0% 10.0%
Dry
Den
sity
in lb
/cu.
ft
Moisture Content in %
10% Fouled with Sugrade Soil 20% Fouled with Subgrade Soil
30% Fouled with Subgrade soil 40% Fouled with Subgrade Soil
119.0
123.0
127.0
131.0
135.0
0.0% 2.0% 4.0% 6.0% 8.0%
Dry
Den
sity
in lb
/cu.
ft
Moisture Content in %
10% Fouled with Gardner Track Ballast Dust 20% Fouled with Gardner Track Ballast Dust30% Fouled with Gardner Track Ballast Dust 40% Fouled with Gardner Track Ballast Dust
138
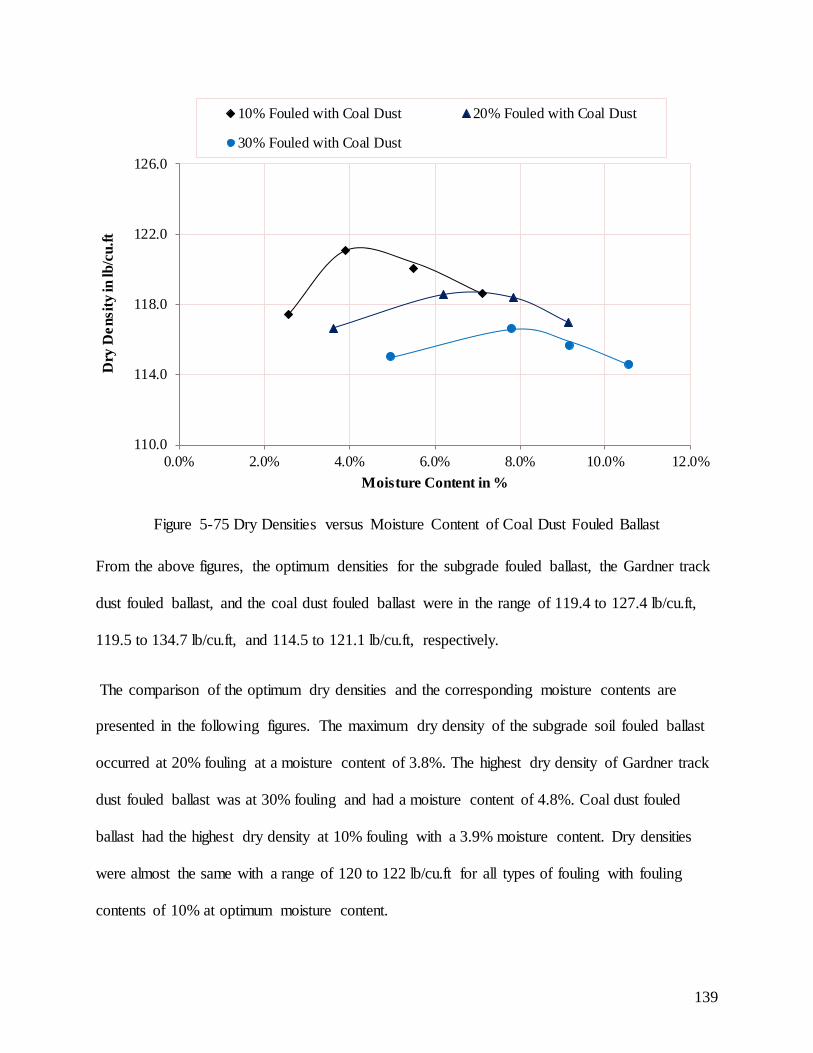
Figure 5-75 Dry Densities versus Moisture Content of Coal Dust Fouled Ballast
From the above figures, the optimum densities for the subgrade fouled ballast, the Gardner track
dust fouled ballast, and the coal dust fouled ballast were in the range of 119.4 to 127.4 lb/cu.ft,
119.5 to 134.7 lb/cu.ft, and 114.5 to 121.1 lb/cu.ft, respectively.
The comparison of the optimum dry densities and the corresponding moisture contents are
presented in the following figures. The maximum dry density of the subgrade soil fouled ballast
occurred at 20% fouling at a moisture content of 3.8%. The highest dry density of Gardner track
dust fouled ballast was at 30% fouling and had a moisture content of 4.8%. Coal dust fouled
ballast had the highest dry density at 10% fouling with a 3.9% moisture content. Dry densities
were almost the same with a range of 120 to 122 lb/cu.ft for all types of fouling with fouling
contents of 10% at optimum moisture content.
110.0
114.0
118.0
122.0
126.0
0.0% 2.0% 4.0% 6.0% 8.0% 10.0% 12.0%
Dry
Den
sity
in lb
/cu.
ft
Moisture Content in %
10% Fouled with Coal Dust 20% Fouled with Coal Dust
30% Fouled with Coal Dust
139
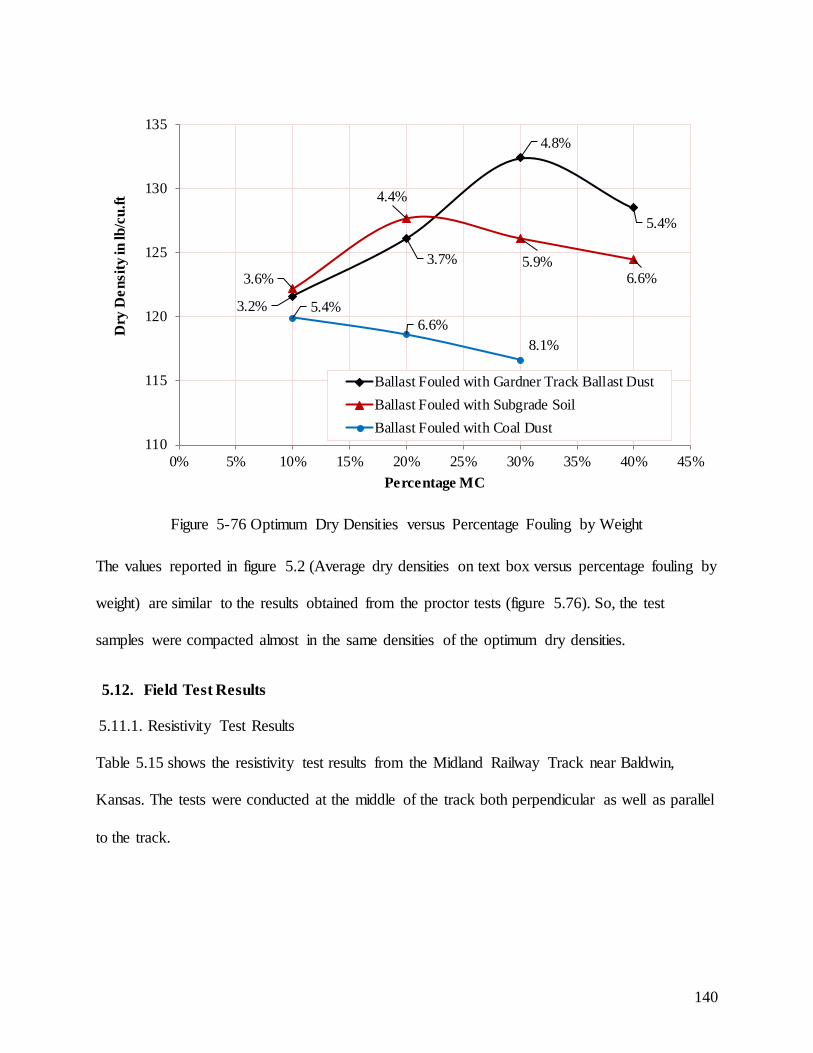
Figure 5-76 Optimum Dry Densities versus Percentage Fouling by Weight
The values reported in figure 5.2 (Average dry densities on text box versus percentage fouling by
weight) are similar to the results obtained from the proctor tests (figure 5.76). So, the test
samples were compacted almost in the same densities of the optimum dry densities.
5.12. Field Test Results
5.11.1. Resistivity Test Results
Table 5.15 shows the resistivity test results from the Midland Railway Track near Baldwin,
Kansas. The tests were conducted at the middle of the track both perpendicular as well as parallel
to the track.
3.2%
3.7%
4.8%
5.4%
3.6%
4.4%
5.9%6.6%
5.4%6.6%
8.1%
110
115
120
125
130
135
0% 5% 10% 15% 20% 25% 30% 35% 40% 45%
Dry
Den
sity
in lb
/cu.
ft
Percentage MC
Ballast Fouled with Gardner Track Ballast DustBallast Fouled with Subgrade SoilBallast Fouled with Coal Dust
140
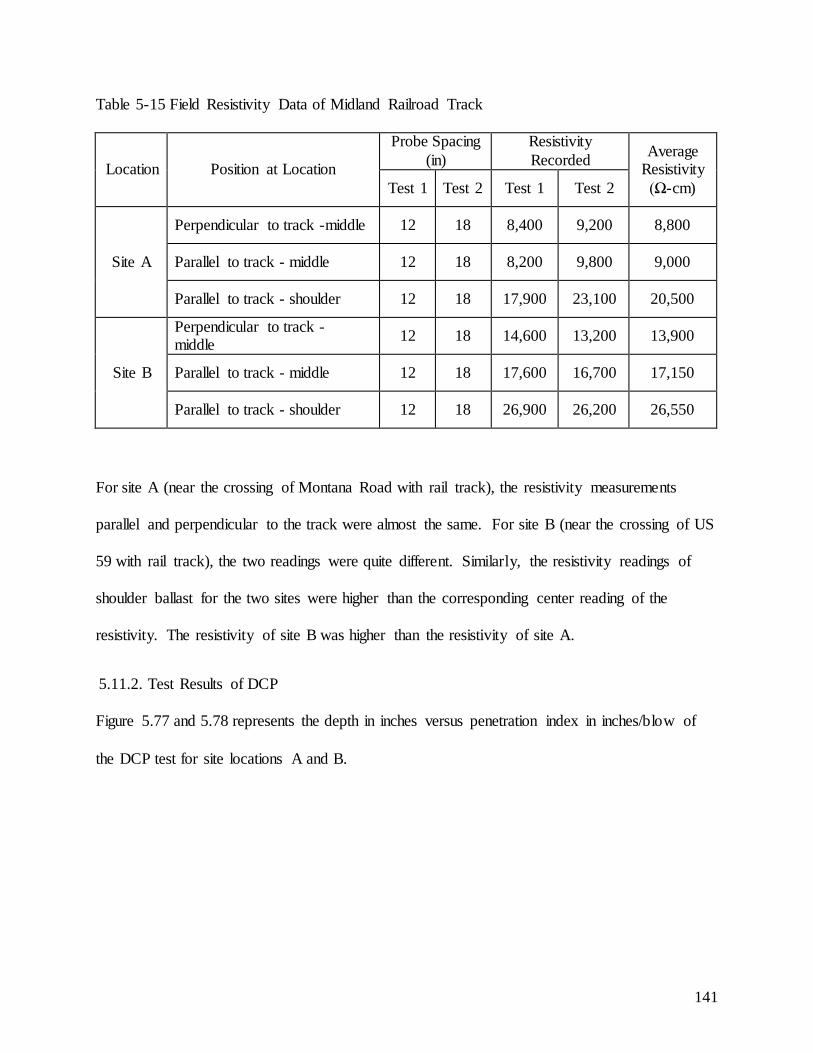
Table 5-15 Field Resistivity Data of Midland Railroad Track
Location Position at Location
Probe Spacing (in)
Resistivity Recorded Average
Resistivity (Ω-cm) Test 1 Test 2 Test 1 Test 2
Site A
Perpendicular to track -middle 12 18 8,400 9,200 8,800
Parallel to track - middle 12 18 8,200 9,800 9,000
Parallel to track - shoulder 12 18 17,900 23,100 20,500
Site B
Perpendicular to track - middle 12 18 14,600 13,200 13,900
Parallel to track - middle 12 18 17,600 16,700 17,150
Parallel to track - shoulder 12 18 26,900 26,200 26,550
For site A (near the crossing of Montana Road with rail track), the resistivity measurements
parallel and perpendicular to the track were almost the same. For site B (near the crossing of US
59 with rail track), the two readings were quite different. Similarly, the resistivity readings of
shoulder ballast for the two sites were higher than the corresponding center reading of the
resistivity. The resistivity of site B was higher than the resistivity of site A.
5.11.2. Test Results of DCP
Figure 5.77 and 5.78 represents the depth in inches versus penetration index in inches/blow of
the DCP test for site locations A and B.
141
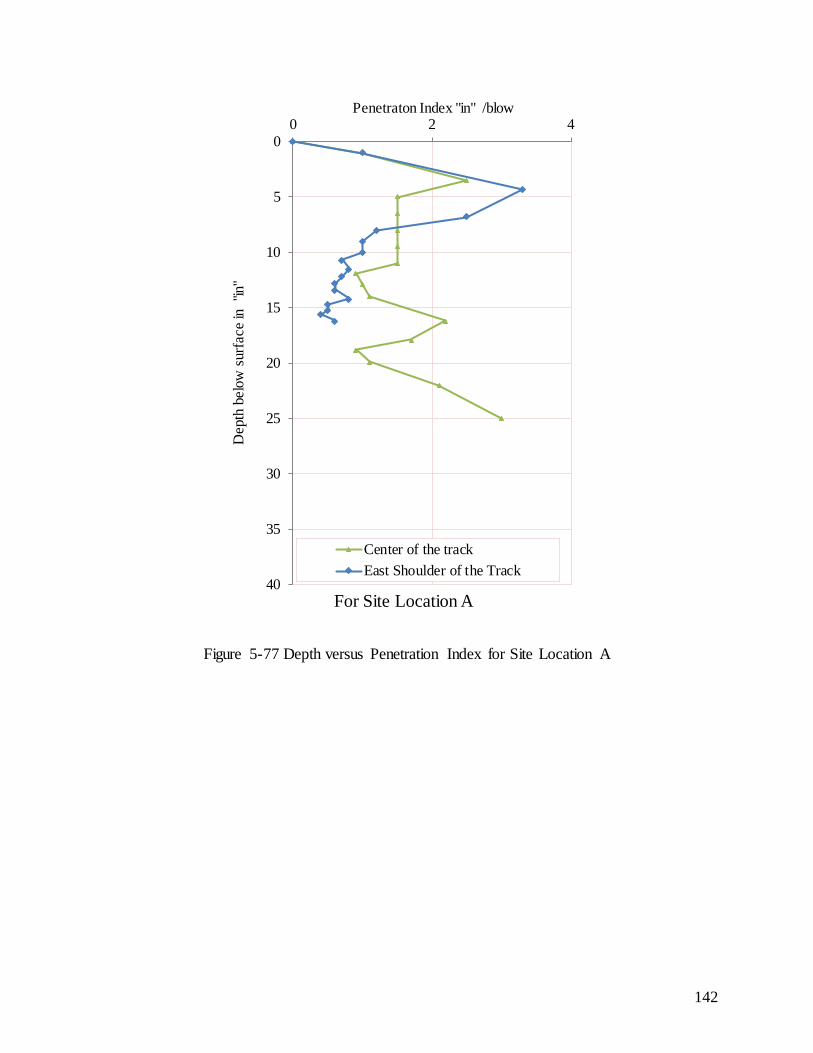
Figure 5-77 Depth versus Penetration Index for Site Location A
0
5
10
15
20
25
30
35
40
0 2 4
Dep
th b
elow
sur
face
in "
in"
Penetraton Index "in" /blow
For Site Location A
Center of the trackEast Shoulder of the Track
142
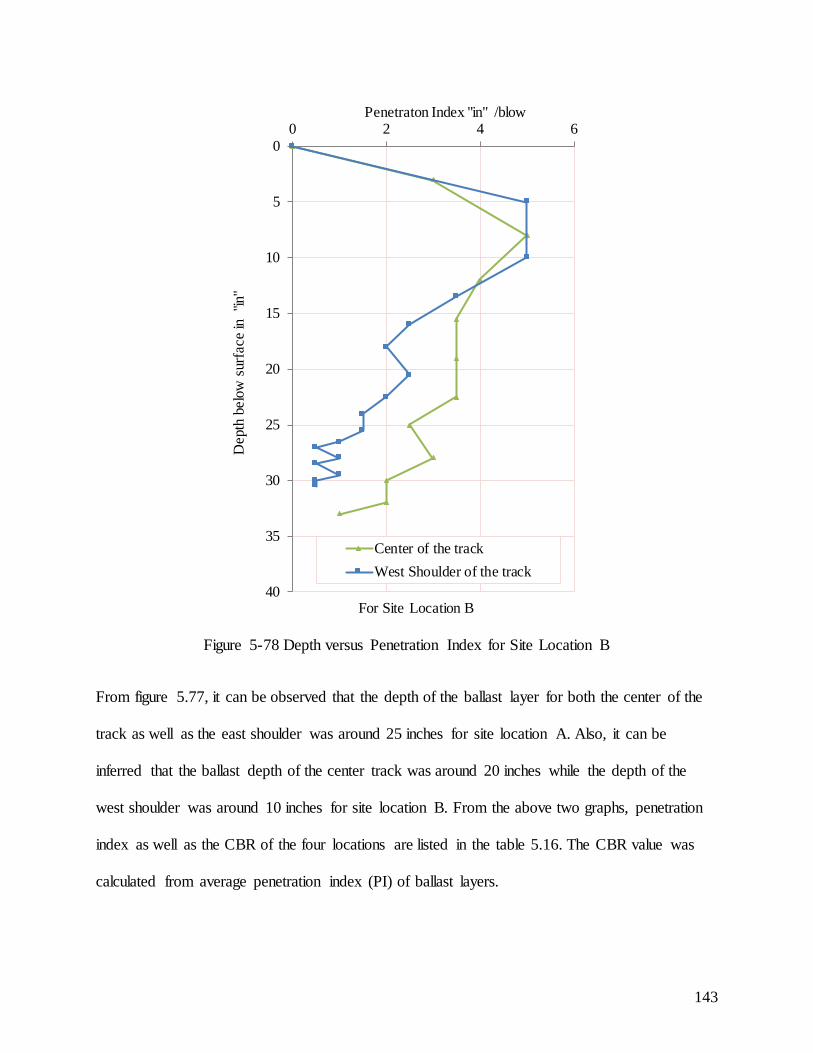
Figure 5-78 Depth versus Penetration Index for Site Location B
From figure 5.77, it can be observed that the depth of the ballast layer for both the center of the
track as well as the east shoulder was around 25 inches for site location A. Also, it can be
inferred that the ballast depth of the center track was around 20 inches while the depth of the
west shoulder was around 10 inches for site location B. From the above two graphs, penetration
index as well as the CBR of the four locations are listed in the table 5.16. The CBR value was
calculated from average penetration index (PI) of ballast layers.
0
5
10
15
20
25
30
35
40
0 2 4 6
Dep
th b
elow
sur
face
in "
in"
Penetraton Index "in" /blow
For Site Location B
Center of the trackWest Shoulder of the track
143
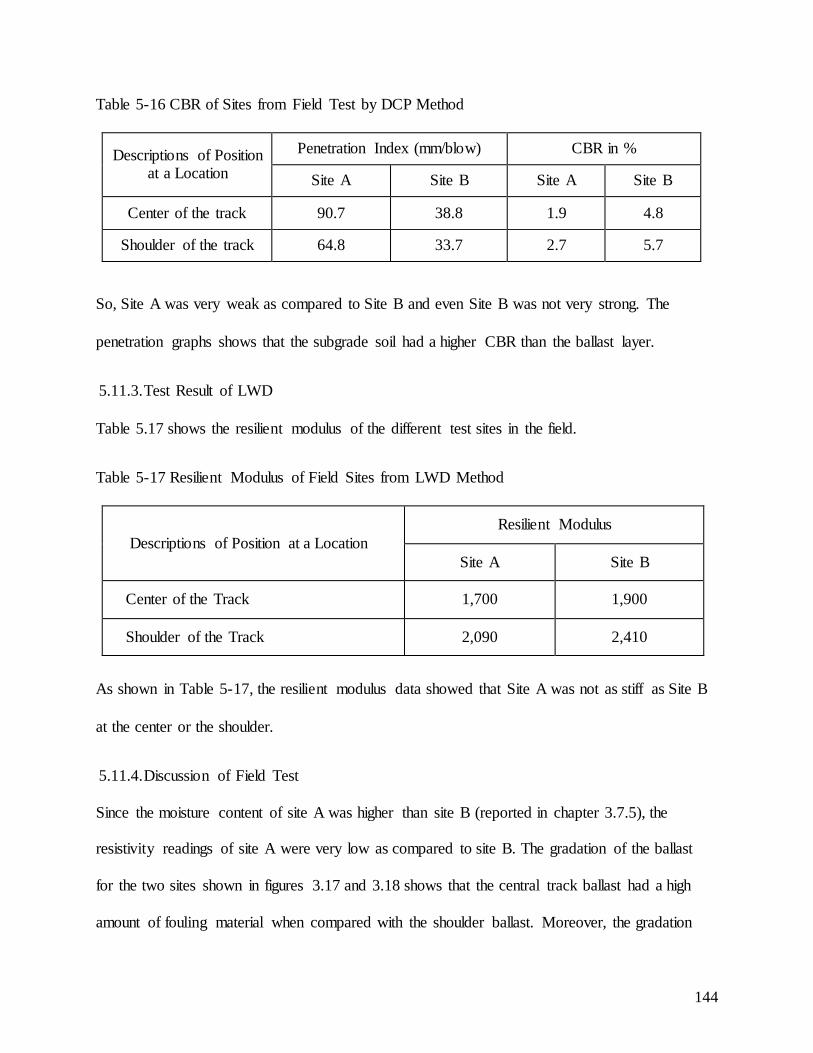
Table 5-16 CBR of Sites from Field Test by DCP Method
Descriptions of Position at a Location
Penetration Index (mm/blow) CBR in %
Site A Site B Site A Site B
Center of the track 90.7 38.8 1.9 4.8
Shoulder of the track 64.8 33.7 2.7 5.7
So, Site A was very weak as compared to Site B and even Site B was not very strong. The
penetration graphs shows that the subgrade soil had a higher CBR than the ballast layer.
5.11.3. Test Result of LWD
Table 5.17 shows the resilient modulus of the different test sites in the field.
Table 5-17 Resilient Modulus of Field Sites from LWD Method
Descriptions of Position at a Location Resilient Modulus
Site A Site B
Center of the Track 1,700 1,900
Shoulder of the Track 2,090 2,410
As shown in Table 5-17, the resilient modulus data showed that Site A was not as stiff as Site B
at the center or the shoulder.
5.11.4. Discussion of Field Test
Since the moisture content of site A was higher than site B (reported in chapter 3.7.5), the
resistivity readings of site A were very low as compared to site B. The gradation of the ballast
for the two sites shown in figures 3.17 and 3.18 shows that the central track ballast had a high
amount of fouling material when compared with the shoulder ballast. Moreover, the gradation
144
and the resistivity results showed that more fouling was present at Site A when compared with
Site B.
The CBR of the track was very low. The subgrade soil of the rail track had a higher CBR than
the ballast layer. It was reported that the track was laid on the top of an existing old blacktopped
road, however this was not confirmed. During the field visit some chunks of bituminous road top
were found at the side of the track.
LWD results were consistent with CBR and resistivity in showing that Site A was comparatively
weaker than B. For both sites, the center of track was weaker when compared with the shoulder,
this was likely due to the higher percentage of fouling material.
Field test results are comparable to the lab test samples. Field test resistivity data shows that the
sample fouling fell between 30% and 40% by weight of subgrade soil fouled ballast for site A
and is consistent with 30% fouled by subgrade soil fouled ballast for site B. Similarly, CBR
values for both sites were very low due to the high amount of fouling as well as the high water
contents. Also, the resilient modulus of the ballast was very low and was likely caused by the
highly fouled ballast having higher amount of water content. Hence, it could be concluded from
the non-destructive and rapid test methods that this ballast had in excess of 30% fouling. This
was confirmed by the soil samples excavated from the sites and the results are presented in
chapter 3.7.
145
Chapter Six: Conclusions and Recommendations
6.1 Introduction
Forty-eight small box tests were carried out to relate resistivity with amount of ballast fouling
based on different types of fouling materials. Among the 48 tests, 18 tests were conducted on
sample ballast fouled with a series of percentages of subgrade soil, another 17 tests were
conducted on sample ballast fouled with a series of percentages of Gardner track ballast dust, and
11 tests were conducted on ballast fouled with a series of percentages of coal dust.
Section 6.2 contains conclusions developed from the results of density tests of the ballast and
section 6.3 contains conclusions developed from the resistivity testing with different fouling
agents based on different moisture contents. Sections 6.4, 6.5, and 6.6 describe the conclusions
of CBR tests carried out by DCP, resilient modulus tests carried out by LWD, and static modulus
carried out by plate loading test, respectively. Section 6.7 describes the results from the field test.
Section 6.8 contains recommendations for future work on this research topic.
6.2 Dry Density Test of Fouled Ballast
• The average dry density of the clean ballast was 110.1 lb/ft3. This density was lower than
all types of fouled samples tested. All of samples were compacted with the same
compaction energy. The average void ratio of the clean ballast was 0.54.
• The proctor test shows that the maximum dry density was for subgrade soil fouled ballast at
20% fouling and is equal to 127.4 lb/ft3. The Gardner track dust fouled ballast had a
maximum dry density of 30% having a value of 134.7 lb/ft3. However the coal dust fouled
ballast has a maximum dry density of about 121.1 lb/ft3 for 10% fouling by weight.
146
• The proctor test sample densities and the average dry densities obtained from the test box
were consistent.
• For 10% fouling, all types of fouled samples had almost the same average unit weight. This
indicates that all types fouling materials settle into the voids of the ballast for 10% fouling
by weight.
• The peak of the coal dust fouled ballast decreased as fouling by weight increased from 10%
to 30%. The density of the subgrade soil and Gardner track ballast dust increased as
fouling by weight increased initially, and then decreased after their optimum values of 20%
and 30% fouling by weight, respectively.
• The relationship between moisture content and dry density (Proctor curve) with percentage
of fouling was weak to very weak for all types of fouled ballast.
6.3 Resistivity Analysis
6.3.1. Horizontal Probe Resistivity
• The resistivity of the clean ballast was higher than 440,000 Ω-cm for low water contents.
• The resistivity of the fouling agents were very small when compared with the fouled ballast
mix.
• When using a test box of 32 inches square and a 7 inch Wenner probe spacing, the
resistance should be measured at a distance of more than 8 inches from the boundary
parallel to the horizontal probe alignment direction. The current paths are spread almost at
equal distance to the probe spacing in the horizontal plane when the array is at least this far
from the boundary.
• The resistivity of subgrade soil fouled ballast was low and nearly constant for moisture
content levels above 6%. Resistivity values for ballast fouled with the Gardner track
147
ballast dust were low and nearly constant for moisture content levels above 5%, and for
coal dust fouled ballast the resistivity was low and nearly constant for moisture content
levels above 5.5%. This moisture content required for resistivity definition is referred to as
“optimum moisture content for resistivity” (OMCR).
• The exact value of OMCR varied slightly depending upon the amount of fouling agent
present in the mix. The higher the amount of fouling materials, the higher the OMCR
observed. OMCR varied most in coal dust fouled ballast, followed by subgrade soil fouled
ballast. The least variance was observed in the ballast fouled with Gardner track ballast
dust.
• The higher the amount of fouling, the lower the electrical resistance for moisture content
levels near the field capacity state. The Gardner track ballast dust fouled ballast has a lower
OMCR and hence has a lower resistance than ballast fouled with other fouling agents for
moisture contents near its OMCR. For saturated conditions the coal dust has the highest
resistance, followed by Gardner track ballast dust and then subgrade soil fouled ballast.
Therefore, water content plays an important role for resistivity detection of fouled ballast
along with the types and amount of fouling agents.
• Resistivity of fouled ballast is much lower and more stable for soil samples with a moisture
content above the OMCR.
• Resistivity values generally decreased with increased fouling and water content and values
were generally consistent with those reported by A.J. Rahman (Rahman, Parsons, Han, &
Glavinich, 2014).
148
• Resistivities estimated by the single point method with a simple multimeter were higher
than those measured using the Wenner method. Most of the time measurements with a
multimeter were inconsistent, hence it was considered as less reliable test.
6.3.2. Vertical Probe Resistivity
• The vertical probe designed and constructed at the KU CEAE department generated values
similar to the horizontal array probe. The apparent resistance from both the methods gives
almost the same value for similar vertical and horizontal distances, indicating that this
probe is valid for measurement of the resistivity.
• The vertical probe measures a higher resistance consistently when compared with the
Wenner 4 point method in the box test. This is likely because it also measures the apparent
resistance caused by insufficient penetration depth.
6.4 CBR Test
• The highest CBR was found at 20% fouling by weight in subgrade soil fouled ballast, 30%
fouling by weight in Gardner track ballast dust fouled ballast, and 10% fouling by weight
in coal fouled ballast.
• Strength dropped significantly when moisture content exceeded a threshold value. This
threshold value was found at higher moisture content for the samples with more fouling.
Samples with less fouling experienced strength loss at lower moisture contents. This
threshold moisture was termed as “optimum moisture content for CBR (OMCC)” and this
value was very similar to the threshold value of resistivity (OMCR).
• Gardner track ballast dust fouled ballast lost strength quickly as moisture content increased
above OMCC. Subgrade soil fouled ballast and coal dust fouled ballast also lost strength
with increasing moisture above the OMCC, but at a slower rate.
149
• As moisture contents decreased below the OMCC, CBR decreased slightly or
approximately constant. However, the slope of the CBR versus moisture content below the
OMCC is very gentle and constant.
• Coal dust fouled ballast always has a smaller value of CBR when compared with subgrade
soil fouled ballast and Gardner track ballast dust ballast. However, the coal dust fouled
ballast CBR, while it decreases with increasing moisture, is not as sensitive to the moisture
content as the other fouling agents.
6.5 Resilient Modulus
• The average maximum values for resilient modulus corresponded to approximately 6%,
5%, and 5.5% for subgrade soil, Gardner track ballast dust, and coal dust fouled ballast,
respectively. Actual values varied slightly based on the percentage of fouling. These
moisture contents are represented by “optimum moisture content for resilient modulus
(OMCMR)”. This value is similar to the OMCR.
• The maximum resilient modulus of Gardner track ballast dust fouled ballast occurs in a
narrower range when compared to the subgrade soil fouled ballast and the coal dust fouled
ballast.
• For moisture contents less than OMCMR, the resilient modulus has a positive mild slope
(i.e. increasing modulus with increasing moisture). The resilient modulus at moisture
contents greater than OMCMR has a steep negative slope (i.e. decreasing with increasing
moisture).
• The negative slope after reaching OMCMR of the resilient modulus versus moisture content
curve is steeper for Gardner track ballast dust fouled ballast than it is for both subgrade soil
fouled ballast and coal dust fouled ballast.
150
• The Gardner track ballast dust fouled ballast had the highest maximum resilient modulus,
followed by subgrade soil fouled ballast and coal dust fouled ballast for the same
percentages of fouling by weight.
6.6 Static Modulus
• The average maximum values for static modulus were approximately 6%, 5%, and 5.5%
moisture content for subgrade soil, Gardner track ballast dust and coal dust fouled ballast,
respectively and these moisture contents are termed as OMCMS. Actual values varied
slightly depending on the percentage of fouling. This is similar to the OMCR.
• The maximum static modulus for Gardner track ballast dust fouled ballast varies less when
compared with both the subgrade soil fouled ballast and the coal dust fouled ballast.
• For the same percentage of fouling material by weight, the Gardner track ballast dust
fouled ballast has the highest stiffness, followed by subgrade soil fouled ballast and then
coal dust fouled ballast.
6.7 Correlation of CBR, Static Modulus, and Resilient Modulus
• The static and resilient moduli both showed a high degree of correlation for all types of
fouling agents having r2 values of 0.88, 0.90 and 0.75 for subgrade soil, Gardner track
ballast dust and coal dust fouled ballast. The slopes of all correlation lines were very
similar.
• There was limited correlation between CBR and either static or resilient moduli since r2
values were around 0.6 or lower.
151
6.8 Field Test
• Both field sites had more than 15% of fines and moisture contents greater than OMCR
(10% at site A and 6% at site B). Therefore, these sites were suitable for fouling detection
by the resistivity method.
• Resistivity test were carried out and very low resistivity values were measured. It was
concluded that the sites were highly fouled. The center of the track was highly fouled as
compared to the shoulder – which was also supported by the grain size distribution
analysis. When comparing the two sites, site A had a higher amount of fouling material and
a higher water content.
• The CBR of the ballast layer was lower than the CBR of the subgrade at the test sites. It
was reported that the track line was originally a roadway and had very strong subgrade soil,
although this was not confirmed.
• The CBR of Site A was very low when compared with Site B, although Site B also had a
very low CBR.
• The resilient modulus of Site B was higher than the resilient modulus of Site A.
6.9 Recommendations
The following recommendations are suggested for future research on this topic.
• Since temperature is another major factor for governing the resistivity of fouled ballast,
studies on temperature effects on resistivity are recommended.
• The four probe method is recommended instead of fall of potential method for construction
of vertical probe.
152
• A mechanical method of compaction with uniform load application throughout the section
is recommended for the compaction of soil in box tests in future works since errors may
occur in test results due to non-uniform compaction carried out with the manual rammer.
• It is recommended that extensive field testing be carried out to evaluate the validity of the
resistivity method for practical applications.
153

Bibliography
AAR. (2013). Total Annual Spending - 2012 Data. Washington, DC: Association of American Railroads : https://www.aar.org/.
AAR. (2014). Overview of America's Freight Railroads. https://www.aar.org/: Association of American Railroads.
Anthony, C. (1996). Seeing Beneath Soil. London: Routledge, c/o Taylor & Francis Group LLC.
Archie, G. E. (January 1942). The Electrical Resistivity Log as an Aid in Determining Some Reservoir Characteristics. Petroleum Technology.
(2010). AREMA manual for railway engineering. AREMA, American Railway Engineering and Maintenance-of-Way Association.
Ayers, M. E., Thompson, M. R., & Uzarski, D. R. (1989). Rapid Shear Strength Evaluation of in situ Granular Materials. Transportation Research Record 1227, 134-146.
Blattner, C. J. (1982). Study of Driven Ground Rods and Four Point Soil Resistivity Tests. IEEE Transactions on Power Apparatus and Systems, Vol. PAS-101, No. 8 .
Campbell, R. B., Bower, C. A., & Richards, L. A. (1948). Change of electrical conductivity with Temperature and the Relation of Osmotic Pressure to Electrical Conductivity and Ion Concentration for Soil Extracts. Soil Science Society of America, Proceedings 13, 66–69.
Datta, M., Basu, A. K., & Roy Chowdhury, M. M. (1967). Determination of earth resistance of multiple driven-rod electrodes. Institution of Electrical Engineers - IEE, Vol. 114, No. 7.
Ebrahimi, A. (2011). Behavior of Fouled Ballast. Railway Track and Structures, Aug 2011; 107, 8, 25.
FRA Annual Report. (2012). Railroad Safety Statistics - 2010 Annual Report. Washington, DC: U.S. Department of Tranportation, Federal Railroad Administration (FRA).
Fukue, M., Minatoa, T., Horibe, H., & Taya, N. (1999). The microstructure of clay given by resistivity measurements. Engineering geology, Volume 54, 43-53.
Goyan, V. C., Gupta, P. K., Seth, S. M., & Singh, V. N. (1996). Estimation of temporal changes in soil moisture using resistivity method. Hydrological Processes, John Wiley & Sons, Ltd.
Harison, J. A. (1987). California Bearing Ratio and Dynamic Cone Penetrometer Strength Measurement of Soils. Proceedings - Institution of Civil Engineers, Part 2, 834 - 844.
154
Hay, W. W. (1982). Railroad Engineering (Second ed.). NY: A Wiley - Interscience Publication.
Huang, H., Tutumluer, E., & Dombrow, W. (2009). Laboratory Characterization of Fouled Railroad Ballast Behavior. Transportation Research Record: Journal of the Transportation Research Board, No 2117, 93 - 101.
Indraratna, B., Khabbaz, H., Salim, W., & Christie, D. (2006). Geotechnical properties of ballast and the role of geosynthetics in rail track stabilisation. International Society for Soil Mechanics and Geotechnical Engineering (ISSMGE), Vol. 10(3) , 91-102.
Lekarp, F., Isacsson, U., & Dawson, A. (2000). State of Art. I: Resilient Response of Unbound Aggregates. Journal of Transportation Engineering, Vol. 126, No. 1, 66-75.
Leng, Z., & Al-Qadi, I. L. (2010). Railroad Ballast Evaluation Using Ground - Penetrating Radar - Laboratory Investigation and Field Validation. Transportation Research Record: Journa lof the Transportation Research Board, No 2159, 110-117.
Liu, X., Saat, R., & Barkan, C. P. (2012). Analysis of Causes of Major Train Derailment and Their Effect on Accident Rates. Transportation Research Record: Journal of the Transportation Research Board, No. 2289, 154–163.
Majidzadeh, K. (2010). Innovative Methodology in Railroad Track Substructure Integrity Investigations. Ohio Transportation Engineering Conference . Ohio.
Rahman, A. (2013). Permiability, Resistivity and Strength of Fouled Railroad Ballast. Lawrence: Department of Civil Environmental, and Architechtural Engineering, The University of Kansas.
Rahman, A., Parsons, R. L., Han, J., & Glavinich, T. E. (2014). Permiability, Resistivity and Strength of Fouled Railroad Ballast. Lincoln, NE: Mid-America Transportation Center, University of Nebraska-Lincoln.
Read, D., Hyslip, J., McDaniel, R., & Lees, H. (2010). Track substructure research - ballast fouling investigations. Railway Track & Structures; Dec 2010; 106, 12, 19-24.
Rhoades, J. D., Corwin, D. L., & Lesch, S. M. (1999). GeospatialM easurementso f Soil ElectricalC onductivityt o AssessS oil Salinity and Diffuse Salt Loading from Irrigation. The American Geophysical Union - Assessment of Non-Point Source Pollution in the Vadose Zone GeophysicaMl onograph1 08 .
Salgado, R., & Yoon, S. (2003). Dynamic Cone Penetration Test for Subgrade Assessment. Purdue University, Joint Transportation Research Program. Proj. No. C-36-45S.
Samouelian, A., Cousin, I., Tabbagh, A., Bruand, A., & Richard, G. (2005). Electrical resistivity survey in soil science: a review. Soil and Tillage Research, 83, 783-193.
155
Selig, E. T., & Waters, J. M. (1994). Track Geotechnology and Substructure Management. London: Thomas Telford Publications.
Sussmann, T. R., Ruel, M., & Chrismer, S. M. (2012). Source of Ballast Fouling and Influence Considerations for Condition Assessment Criteria. Transportation Research Record: Journal of the Transportation Research Board, Washington, 87-94.
Tagg, G. F. (1964). Earth Resistaces. New York: Pitman Publishing Corporation.
Wallace, A. J. (2003). Permiability of Fouled Ballast. Wollongong, Australia: School of Civil, Mining and Environmental Engineering, University of Wollongong, Wollongong.
Webster, S. L., Brown, R. W., & Porter, J. R. (1994). Force Projection Site Evaluation Using the Electric Cone Penetrometer (ECP) and the Dynamic Cone Penetrometer (DC). Tyndall AFB, FL: Headquarters, U. S. Air Force Civil Engineering Supply Agency.
156