stream science: programmatic music marketing
TRANSCRIPT

STREAM SCIENCE : PROGRAMMATIC MUSIC MARKETING
Q4 2016
AuDigentAUDIENCE INTELLIGENCE
Q4.2016

Preface
Disclaimer
Sources of Data
Stream Science Methodology
The Audience Engagement Power Law
Power Law and Audience Earnings
Power Law and Audience Conversion
Power Law and Audience Fluidity
Optimizing ROI for Music and Artist
Marketing Campaigns
Methods and Formulas
Power Distribution
References and Citations
About
Contact
3
3
3
4
5
6
7
8
9
10
10
11
12
12
TABLE OF CONTENTS
3
This white paper shares findings from a three year study on the retail sales, social engagement, radio airplay, and streaming activity surrounding 1,500 of the recording industry’s most prominent recording artists (sometimes referred to by our team as ‘influencers’). The cross-section of artists selected aimed to be representative of the music industry’s signed and independent recording acts (both contemporary and legacy) and to be sizable enough that methods could be tested which could then be applied to the wider recording industry. The sample included the highest-selling prominent artists, mid-tier artists, independent, legacy and emerging artists who have all released singles or albums in the three year time-frame. However, since this was a randomly selected sub-group, our findings are not exhaustive and further research would be necessary before they can be considered conclusive.
Disclaimer
This research is the result of a private study that has in no way been verified or endorsed by the artists, record labels, data providers, or industry associations mentioned.
While we have access to artist social, sales, and streaming data across many different record labels and management companies, we’ve redacted any significant earnings and performance figures that might be considered sensitive. In some cases, specific details of our methods may be omitted for the same reasons.
Sources of Data
The data used in this study was procured from audience measurement companies which monitor radio airplay, retails sales, social media activity, and streaming channels on behalf of the recording industry. Other data was collected from social media channels (Twitter, Facebook, Instagram and YouTube directly) via their APIs. We also used proprietary audience tracking data collected by our own team at Audigent. Many of the methods and terminology used are based on concepts borrowed from marketing and advertising. But note, this white paper is about audience behavior around music sales and streaming channel engagement, not ad performance. While it might be assumed that many of the characteristics of audiences would be consistent with ad engagement, we will research that as part of a future study.
PREFACE

4
THE STREAM SCIENCE METHODOLOGY
The basis for all stream science is the measurement of music sales using their actual (or assumed) per stream values while non-stream sales (retail and digital downloads) are measured using their industry defined stream equivalents. The resulting dollar values make up the revenue numbers that other audience behaviors are measured against. Actual revenue numbers can of course be substituted. Where actual revenue was used as part of this study, the audience observations were the same. These methods are more clearly outlined on Page 9.
STREAM EQUIVALENTS: THE MUSIC INDUSTRY STANDARD FOR MEASUREMENT
Stream Science is the practice of studying the consumption of music using streams as the base unit of value. It builds on the stream equivalent metrics established by the Recording Industry Association of America (RIAA) - the Stream Equivalent and Album Equivalent - which serve as the new standard for recording industry measurement and payouts.1 In short:
• 1,500 Streams = 1 Album Sale Equivalent • 150 Streams = 1 Track Sale Equivalent
These equivalents are how publishers, record labels, and streaming music services like Spotify value music consumption and payouts to artists and labels.
This white paper outlines an approach for measuring, forecasting, and interpreting the behavior of music listening audiences, with the economics of streaming and stream equivalents at the foundation.
1 “RIAA: Streaming to Contribute to Gold and Platinum Album Certifications”. The Hollywood Reporter, February 12th, 2016. Retrieved from http://www.hollywoodreporter.com/news/riaa-streaming-contribute-gold-platinum-861101
5
THE AUDIENCE ENGAGEMENT POWER LAW
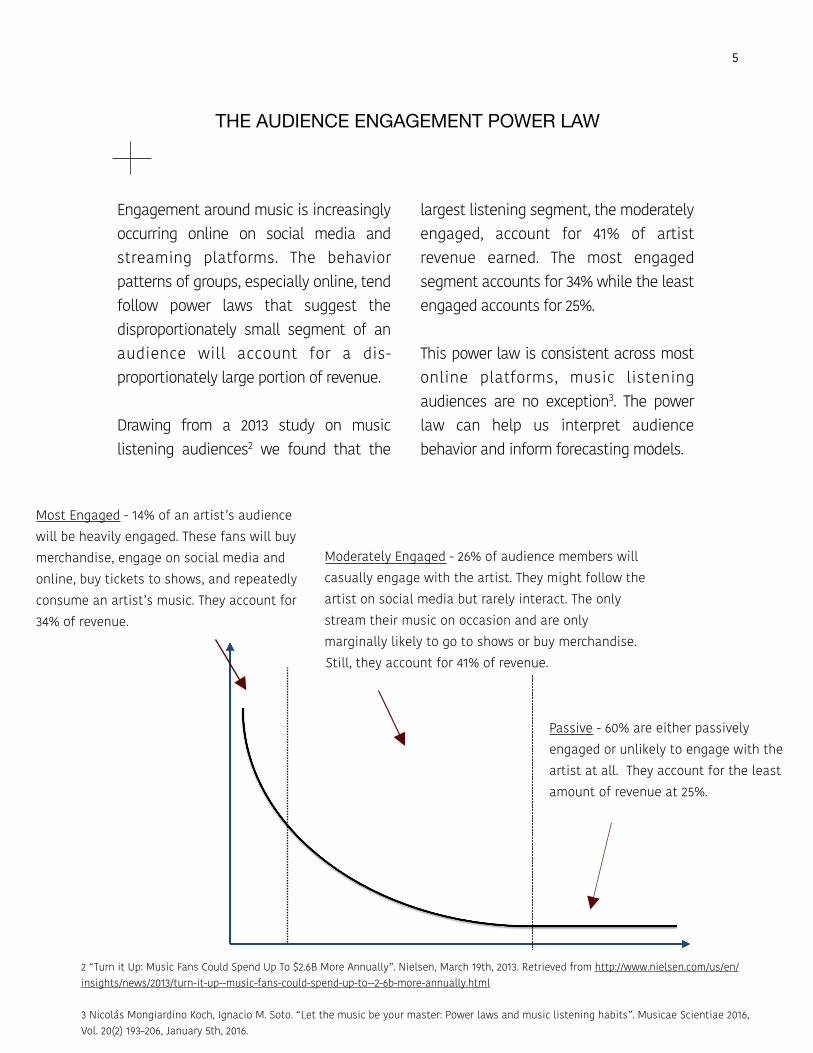
Engagement around music is increasingly occurring online on social media and streaming platforms. The behavior patterns of groups, especially online, tend follow power laws that suggest the disproportionately small segment of an audience will account for a dis-proportionately large portion of revenue.
Drawing from a 2013 study on music listening audiences2 we found that the
largest listening segment, the moderately engaged, account for 41% of artist revenue earned. The most engaged segment accounts for 34% while the least engaged accounts for 25%.
This power law is consistent across most online platforms, music listening audiences are no exception3. The power law can help us interpret audience behavior and inform forecasting models.
Moderately Engaged - 26% of audience members will casually engage with the artist. They might follow the artist on social media but rarely interact. The only stream their music on occasion and are only marginally likely to go to shows or buy merchandise. Still, they account for 41% of revenue.
Most Engaged - 14% of an artist’s audience will be heavily engaged. These fans will buy merchandise, engage on social media and online, buy tickets to shows, and repeatedly consume an artist’s music. They account for 34% of revenue.
Passive - 60% are either passively engaged or unlikely to engage with the artist at all. They account for the least amount of revenue at 25%.
2 “Turn it Up: Music Fans Could Spend Up To $2.6B More Annually”. Nielsen, March 19th, 2013. Retrieved from http://www.nielsen.com/us/en/insights/news/2013/turn-it-up--music-fans-could-spend-up-to--2-6b-more-annually.html
3 Nicolás Mongiardino Koch, Ignacio M. Soto. “Let the music be your master: Power laws and music listening habits”. Musicae Scientiae 2016, Vol. 20(2) 193–206, January 5th, 2016.

6
Its useful understand which audience segments are engaging and at what levels because revenue expectations are directly related.
A moderately successful marketing campaign targeting the only the most engaged audience segments might seem like the cheapest option but also might end up generating less revenue than a slightly more expensive campaign targeting the moderately engaged segment. Cheaper with a lower ROI isn’t necessarily better.
Understanding the behaviors to expect from audience segments is critical, then, when
designing successful and cost-effective marketing campaigns for artists/influencers.
The chart below illustrates these principles applied to recording artist Pharrell William’s earnings. The revenue was divided proportionately based on the audience engagement power law as described in Methods, formula D, Page 9. Blue represents value of the most engaged segment of his audience, red represents the moderately engaged segment’s value, and yellow represents his passive audience segments. This is value was calculated per engagement segment, on a per stream basis.
WHAT DOES THIS MEAN FOR THE ARTIST & INFLUENCER?
POWER LAW AND AUDIENCE EARNINGS

7
“To Pimp a Butterfly” Album Release
Week 11 & 12 (3-15-15)
PASSIVE ENGAGED + MOST ENGAGED
THE WHOLE AUDIENCE MATTERS
POWER LAW AND AUDIENCE CONVERSION
Passive audience segments are the hardest to reach, hardest to convert to revenue, and the least likely to engage (by definition) so they might seem unattractive. However, as a cohort their activity can be used to infer changes in the other engagement segments.
Remember, these segments are not fixed. People shift from die-hard fans, to casual-fans, to non-fans all the time. Intuitively we know this. The people who bought Kanye West’s most recent album may not be the same who bought the first or the second.
Audience measurement helps any artist, record label or marketing team understand how overall audience behavior affects revenue and the other outcomes they desire.
Below we look at another artist, Kendrick Lamarr, and his 2015 release “To Pimp a Butterfly”. His most engaged fans are pretty consistent. But the individuals normally considered his passive audience are those whose behavior changed the most, indicating an uptick in the conversion of passive listeners to engaged listeners and a more monetizable audience as a result.

8
MAKING THE MOST OF THE MOMENT
POWER LAW AND AUDIENCE FLUIDITY
The previous example might lead you to conclude that high-levels of conversion happen infrequently. This is not always the case.
Sudden shifts from one level of engagement to another can be more common. See “Methods and Formulas”, Page 10. In the example below we explore the audience of recording artist Lana Del Rey, purchases of her music, social media engagement patterns, stream consumption, and listener exposure to her music on radio airplay.
Notice the spikes in passive audience engagement around major events, album releases and other undefined events. In this case, early interest in an album release in Week 24 preceded a huge upswing in audience engagement the following week, Week 25. These are moments of opportunity that can be capitalized on.
How might an artist capitalize on music listener engagement trends? On Page 9, “Optimizing Campaign ROI for Artists and Influencers” we explain exactly how these methods can inform strategy.
Coachella + Single
“Ultraviolence” Album Release
Week 24 (7-13-14)
Peak interest in album Week 25 & 26
“Honeymoon” Album Release
Week 38 (9-18-15)
PASSIVE ENGAGED + MOST ENGAGED

9
PUTTING IT ALL TOGETHER
OPTIMIZING ROI FOR MUSIC AND ARTIST MARKETING CAMPAIGNS
How does an artist, influencer, or management team capitalize on music listener engagement trends?
When conversion of their audience segments is most fluid:
• it means the cost of converting passive listeners to engaged listeners has dropped;
• drop prices on an album or release new content to streaming channels;
• raise the price on supply-side ad inventory (ads on the artists website or web properties);
• time negotiations with brands around expected peaks and consider audience value and engagement into price.
When the value per stream is highest:
• it means programmatic inventory is most valuable;
• optimize marketing campaigns or new content to target engaged audiences;
• put supply-side ad inventory up for auction, this is when engaged segments are in demand, prices can rise from competitive bidding;
• use the artist’s music in ads - this period offers the highest ROI for sync, licensing, or activation deals;
• release music videos or other exclusive content, an engaged audience is more likely to make content go viral.
When the value per stream is low:
• it means demand is falling and inventory is less valuable,
• the artist or team should conduct media buys against their own audiences, less demand means its cheaper to target their own fans,
• increase offline and media appearances (interviews, events, touring) to stimulate demand again.

10
EQUATIONS AND FORMULAS TO USE
METHODS AND FORMULAS
[A] To calculate the per listener engagement time of the passive segment:
total engagement time ÷ size of audience
The result is an estimate of the amount of time the artist’s individual audience members spend engaging the artist’s music.
[B] To calculate the amount of time the remaining most engaged and moderately engaged segments of the audience are with the artist, we work backwards to account for the remaining audience:
engagement time ÷ audience conversation rate
[C] To calculate the passive to engaged audience conversion rate (fluidity) we borrow math from advertising 101 - “conversions over clicks”. Streams consumed on demand represents the converted audience while the total potential streamers (the measurable audience exposed to those streams) represents our click :
streams consumed ÷ streaming audience
Because the conversion rate is a variable that changes weekly, daily, or even hourly, this gives us the ability to track the differential between the two groups (passive and engaged).
This is only a crude estimate, though. Tracking actual conversion numbers requires far more data (individual user stream exposure and plays) than was available for this particular study, so it was not something we were concerned with here.
[D] Applying the power law distributions to revenues:
(earnings x segment % revenue ) ÷ (audience size x segment % audience)
Power Distribution
Segment % Audience % Revenue
Most Engaged
0.14 0.34
Mod. Engaged
0.26 0.41
Passive 0.60 0.25

11
Philip M. Napoli. “Audience Evolution: New Technologies and the Transformation of Media Audiences”. Columbia University Press, November 22nd, 2010.
Stuart Cunningham, Terry Flew, Adam Swift. “Media Economics”. Palgrave Macmillan, May 1, 2015.
Nicolás Mongiardino Koch, Ignacio M. Soto. “Let the music be your master: Power laws and music listening habits”. Musicae Scientiae 2016, Vol. 20(2) 193–206, January 5th, 2016.
“Turn it Up: Music Fans Could Spend Up To $2.6B More Annually”. Nielsen, March 19th, 2013. Retrieved from http://www.nielsen.com/us/en/insights/news/2013/turn-it-up--music-fans-could-spend-up-to--2-6b-more-annually.html
“New Study Sees Difference Between Passive & Active Music Listeners”. Nielsen. June 27, 2014. Retrieved from http://www.savingcountrymusic.com/new-study-sees-difference-between-passive-active-music-listeners/
“Scanning the Audio Demand Landscape”. Nielsen. June 06, 2014. Retrieved from http://www.nielsen.com/us/en/insights/news/2014/scanning-the-audio-demand-landscape.html
“Neuroscience study reveals music videos outperform television advertising impact” . Campaign Brief . November 28, 2012. Retrieved from http://www.campaignbrief.com/2012/11/neuroscience-study-reveals-mus.html
“Your average revenue per customer is meaningless”. Heap Analytics. March 31, 2014. Retrieved from http://data.heapanalytics.com/your-average-revenue-per-customer-is-meaningless
REFERENCES AND CITATIONS

12
Contact
For more information about our methods, research, or findings please contact Jon Gosier, at [email protected], or @jongos on Twitter.
You can visit our company on the web at audigent.com or @audigent on Twitter.
If you have questions about our team conducting research on your behalf, email [email protected] and our team will consider your request.
ABOUT
AuDigent is the industry’s leading audience measurement platform for influencers in music, sports and entertainment. We help brands that collectively spend more than $30 billion dollars on media discover and partner with the right influencers to target their audiences, giving them the programmatic buying edge needed to maximize ad performance and ROI.
The author of this white paper, Jon Gosier, works with the world's most prominent recording artists, management companies, record labels, and influencers as the Founder and Chief Data Scientist of AuDigent. He and his team are responsible for developing the algorithms that direct millions of dollars in opportunity and new revenue to the influencer economy.

AuDIGENT is an audience measurement and monetization platform for influencers in music, sports and entertainment. We help brands that collectively spend more than $30 billion dollars on media discover and partner with the right influencers to target, and connect with their audiences, giving them the programmatic buying edge needed to maximize ROI.
Your audience is one of your most valuable and most monetizable assets. But monetizing your audience, your social reach and influence, and fan engagement requires tools and technology currently not available to you.
AuDIGENT’s mission is to change that and to help you to plug your audiences into the places and advertising technology platforms that can drive new revenue streams. And best of all, you already have everything you need to make it happen . . . and you own it too.
It’s your audience data, unlocking its incredible potential in ways that drives meaningful value for brands and advertisers is a win-win for everyone.
Let AuDIGENT empower you…
• Own your links - Monetize artist content with branded hyperlinks. (ex. art.ist/song-name)
• Own your audience - You have the influence, you attract the audience, why don’t brands come to you to access your audience data? With our system, they will.
• Through Influencer & Brand Match-Making - Don’t leave lucrative brand and agency deals to chance. Our products help brands discover the right artists and influencers, we also help artists discover the right brands looking to activate their audiences.
Contact [email protected] to learn more about how we can support your needs.

Influencer Discovery. Brands discover the right artists and influencers to partner with.
Monitor. Easily track multiple artists at once. Campaign Monitoring. Monitor audience engagement with influencer-related ad inventory.
Measure Engagement Cross-Channel. Audigent tracks artist audiences wherever they are (Facebook, Instagram, YouTube, Twitter) and whatever devices
they use (Mobile, Tablets, Desktop)
Audience Insights. How big is your audience? How engaged are they? Where are they? How much of your content do they consume? On
which devices?