stream sampling protocols for the environmental monitoring ... · stream sampling protocols for the...
TRANSCRIPT

Stream Sampling Protocols for the Environmental Monitoring and
Trends Section
October 2001
Publication No. 01-03-036 printed on recycled paper

This report is available on the Department of Ecology home page on the World Wide Web at http://www.ecy.wa.gov/biblio/0103036.html For additional copies of this publication, please contact: Department of Ecology Publications Distributions Office
Address: PO Box 47600, Olympia WA 98504-7600 E-mail: [email protected] Phone: (360) 407-7472
Refer to Publication Number 01-03-036
The Department of Ecology is an equal opportunity agency and does not discriminate on the basis of race, creed, color, disability, age, religion, national origin, sex, marital status, disabled veteran's status, Vietnam era veteran's status, or sexual orientation. If you have special accommodation needs or require this document in alternative format, please contact Michelle Ideker, Environmental Assessment Program, at (360)-407-6677 (voice). Ecology's telecommunications device for the deaf (TDD) number at Ecology Headquarters is (360) 407-6006.

Stream Sampling Protocols for the Environmental Monitoring and
Trends Section
Edited by William J. Ward
Contributors Brad Hopkins, Dave Hallock, Chad Wiseman,
Rob Plotnikoff, and William Ehinger
Environmental Assessment Program Olympia, Washington 98504-7710
October 2001
Publication No. 01-03-036 printed on recycled paper

This page is purposely blank for duplex printing

Page i
Table of Contents
Page List of Tables .................................................................................................................................. ii Abstract .......................................................................................................................................... iii Introduction......................................................................................................................................1 Run Preparation ...............................................................................................................................3 Pre-Run Procedure (Morning of First Day) .....................................................................................4 Sampling Procedure .........................................................................................................................5 Field Processing ...............................................................................................................................7 Quality Assurance / Quality Control Samples .................................................................................9
Field Blanks ...............................................................................................................................9 Field Replicates..........................................................................................................................9 Field Splits .................................................................................................................................9
Quality Assurance / Quality Control Sampling Procedures ..........................................................10 Field Blank Samples ................................................................................................................10 Field Replicate Samples...........................................................................................................10 Field Split Samples ..................................................................................................................10
Sample Preservation and Shipment ...............................................................................................11 Methods and Procedures ................................................................................................................12
Barometric Pressure .................................................................................................................12 Conductivity.............................................................................................................................13 Dissolved Oxygen....................................................................................................................15 Fecal Coliform and Enterococci Bacteria ................................................................................19 Metals.......................................................................................................................................20 Nutrients...................................................................................................................................23 pH.............................................................................................................................................25 Stream Stage Height ................................................................................................................28 Suspended Solids .....................................................................................................................28 Temperature .............................................................................................................................29 Turbidity ..................................................................................................................................30
Appendices A. Freshwater Ambient Run Checklist B. Field Sampling Notification Form C. Contact Person Designation Form D. Meter Calibration Log Form E. Field Data Report Form

Page ii
List of Tables
Page Table 1. Parameters Measured in the Field.........................................................................2
Table 2. Parameters Measured at the Laboratory ...............................................................2
Table 3. Sample: Container, Preservation, and Holding Times........................................11

Page iii
Abstract This document describes the sample collection, shipment, and analysis procedures used by the Washington State Department of Ecology, Environmental Monitoring and Trends Section staff to collect water quality information at long-term stream monitoring stations. Although it is intended as a guidance manual for staff doing the field sampling, it may also be useful to individuals who would like to know more about Ecology protocols.

Page iv
This page is purposely blank for duplex printing
Page 1
Introduction This document describes the procedures for sample collection, shipment, and analysis used by the Environmental Monitoring and Trends Section staff involved in long-term stream monitoring. Although it is intended as a guidance manual for staff doing the field sampling, it may also be useful to individuals who would like to know more about Ecology protocols. Ecology has operated a long-term river and stream monitoring program since 1970. Prior to 1970, data were collected by other agencies under a variety of sampling schemes. The current program consists of monthly water quality monitoring for 14 conventional parameters (See Tables 1 and 2 below) at approximately 80 stations within the state. The goals of the program are to provide: ♦ Water quality information that can be used to characterize past and current conditions. ♦ Data that can be used to refine and verify total maximum daily load (TMDL) models or help
evaluate other site-specific water quality issues. ♦ Data from a representative sample of rivers and stream segments for the evaluation of
impairment of beneficial uses and the detection of violations of state water quality standards. The program consists of both long-term and basin monitoring stations. Long-term stations are monitored every year to track water quality changes over time (trends), assess inter-annual variability, and collect current water quality information. These stations are generally located near the mouths of major rivers and below major cities. However, some long-term stations were deliberately located upstream of major cities and downstream of where major streams enter the state to monitor background conditions. Basin stations are typically monitored for one year (although they may be re-visited every five years) to collect current water quality information. These stations are selected to support Ecology’s basin approach to water quality management and to address site-specific water quality issues. Further details may be found in Ehinger (1995). The sampling network is divided into four runs (roughly conforming to Ecology’s Eastern, Central, Northwest, and Southwest Regions) of three or four days duration. At the end of a sampling day, samples are shipped via commercial carrier to the Manchester Environmental Laboratory for chemical and bacteriological analyses.

Page 2
Table 1. Parameters Measured in the Field Variable Method Resolution
Temperature Thermistor 0.1˚C pH Glass electrode 0.1 unit Dissolved oxygen Winkler titration 0.1 mg/L Specific conductivity Electrode 1 µmhos/cm (µS/cm) Barometric pressure Aneroid barometer 0.02 inches Hg
Table 2. Parameters Measured at the Laboratory
Variable Method Reference Practical Quantitation Limit
Ammonia-N (NH3) Automated phenate EPA 350.1/ SM 4500-NH3 H
0.01 mg/L
Enterococci Membrane filter EPA 1600 1 colony/100 mL Fecal coliform Membrane filter SM 16-909C 1 colony/100 mL Nitrate + Nitrite (NO3
- + NO2-)
Colormetric EPA 353.2/ SM 4500-NO3
-I 0.01 mg/L
Orthophosphate, Dissolved Colormetric EPA 365.3/ SM 4500-P G
0.01 mg/L
Total Persulfate Nitrogen (TPN)
Colormetric SM 4500-N-B 0.01 mg/L
Total Phosphorus (TP) Colormetric EPA 365.3/ SM 4500-P I
0.01 mg/L
Total Suspended Solids Weighed Filter EPA 160.2/ SM 2540D
1 mg/L
Turbidity Nephelometric SM 2130 1 NTU EPA = Environmental Protection Agency Method SM = Standard Methods for the Examination of Water and Wastewater, 20th Edition.

Page 3
Run Preparation Each run schedule is compiled at least a month before the beginning of the water year (October 1) following selection of the basin stations. Also compiled are the sample bottle delivery and pickup schedules, and run directions based on the run schedule. Usually, one run is scheduled per week for four weeks each month, although periodic schedule changes may be necessary to accommodate holidays. The first run typically starts on the first Monday of the month. The usual run order is Central, Eastern, Northwest, and Southwest. Samplers usually prepare for a run at least two weeks in advance. A checklist (Appendix A) is used to ensure that all of the necessary tasks, sampling equipment, supplies, sample containers, and safety gear have been dealt with or loaded in the van. Note: Run sample bottles are delivered the to the bottle storage room by the lab courier the Wednesday before the scheduled run. The lab courier should be contacted if they are not there or the order is incorrect. Samplers must complete and submit the Field Sampling Notification Form (Appendix B) and Contact Person Designation Form (Appendix C) along with the Run Directions to the section secretary before beginning a run. This information enables family and program staff to call a sampler in case of an emergency or conduct a search if there was a mishap. If plans change (lodging, cell phone number, etc.) the sampler must contact a supervisor or to the section secretary to update the information. Also, if the sampler fails to check in with the contact person, then the contact person needs to notify the supervisor to begin efforts to locate the sampler. Note: Van cell phones need to be kept on during work hours to allow the lab courier or other staff to get shipment information or to discuss other program related needs. Following a run, malfunctioning equipment needs to be taken to the boat shed for repair. Failure to maintain equipment may result in unsafe sampling conditions and lost sampling opportunities.
Page 4
Pre-Run Procedure (Morning of First Day) ♦ Turn on the cell phone.
♦ Check the van oil and fluids.
♦ Calibrate the van barometer using the wet lab (OS-31) barometer (See Barometric Pressure on page 9).
♦ Check the calibration of the thermistor with an alcohol thermometer.
♦ Flush the filter apparatus with 10% HCl solution1 and rinse with deionized water.
♦ Rinse the DO sample bucket with deionized water.
♦ Select an empty BOD bottle from the DO sample box, record its number on the Field Data Report from (Appendix F), place it in the DO sample bucket, and replace the bucket lid.
♦ Acid wash a dedicated 1-L nutrient collection bottle with 10% HCl solution, triple rinse with deionized water, and place it in one of the bottle holders attached to the DO sample bucket. Also place a clean 1-L sample bottle in the other attached bottle holder.
♦ Place a bacteria sample bottle in the flow-orienting bacteria sampler.
♦ Change the pH and conductivity standards.
♦ Soak the conductivity probe in deionized water for at least 30 minutes before calibrating. Calibrate the meter and store the probe in tap or deionized water (Do not store the probe with the pH electrode).
♦ Record the conductivity meter calibration and other pertinent observations on the Meter Calibration Log Form (Appendix D).
♦ Change pH probe solution.
♦ Calibrate pH meter and store the probe in the pH 7 standard or tap water (Do not store the probe in deionized water).
♦ Re-calibrate the pH probe a second time after arriving at the first sample station to insure that it has warmed up.
♦ Record the second pH calibration on the Meter Calibration Log Form.
1The 10% HCl solution should be changed in advance of a run. Prepared solution is stored in an acid cabinet located in the hazardous chemical storage room (OL-14). The old solution may be discarded down the drain. All appropriate safety measures need to be used if more solution must be prepared. The Cleaning Room (OL-16) sink is the best location to use for this process because an emergency shower/eyewash station is located in the room in case there is a mishap. Also, add the concentrated hydrochloric acid to the measured amount of distilled water. Never add water to concentrated hydrochloric acid. The reaction with water generates enough heat to boil water instantly; the water expands explosively and can splatter acid. When adding acid to the water, the heat is absorbed by the relatively (to the quantity of acid) large mass of water.

Page 5
Sampling Procedure Safety is the primary concern when collecting samples. Since most sample sites are located on highway bridges, road and pass conditions should always be check the before departure (especially in winter). If roadside hazards, weather, accidents, on-going construction, new bridge, etc. make sample collection dangerous, then skip that station. Note the reason on the Field Data Report Form and notify your supervisor of the hazard when you return to the office. If the hazard is a permanent condition, relocation of the station may be necessary. Review Ecology’s Safety Program Manual periodically to assist with these safety determinations. Sample collection involves three to five of the following steps: 1. Temperature is measured in situ with a long-line thermistor. 2. Dissolved oxygen (DO), turbidity, pH, and conductivity samples are collected
simultaneously with a DO sample bucket with two attached 1-L bottles. Water for the Winkler titration is collected directly into a BOD bottle mounted inside the bucket. Also collected in the bucket is water for the turbidity sample, and for pH and conductivity analysis. One of the two 1-L bottles attached to the DO sample bucket has been acid-washed and collects water to be processed for nutrient analyses. The other 1-L sample bottle collects the total suspended solids sample.
3. Fecal coliform and enterococci samples are collected with the flow-orienting bacteria
sampler and an autoclaved bottle. 4. Stream stage height measurements are obtained from a reference point (RP) by using a
weighted measuring tape, a USGS weighted wire gage, or a staff gage. 5. Metal samples are collected using the metals sampler and specially prepared Teflon bottle. If
metal sampling is necessary, refer to Metals on page 20. A typical sampling routine consists of the following procedure: 1. Lower the thermistor probe into the water and allowed one to two minutes for it to
equilibrate. If conditions allow, complete steps two and three while the temperature reading stabilizes.
2. If called for, measure the stage height and record the measurement in the Yellow Flow Book.
Also, record the weighted measuring tape correction factor or check bar measurements. Note: The keys to the gage houses and wire weight gage boxes are located on the key chain stored in the van.
3. Remove the lids to the 1-L bottles attached to the DO sample bucket and lower it to the water
surface, taking care to not dislodge bridge debris into the bottles. Then lower the bucket rapidly into the water until it has completely submerged to a depth of at least 0.3 meters to minimize sampling of surface film. Retrieve the bucket when the bubbles from the vent tube

Page 6
stop (bucket is full). A swift current may take the bucket downstream before it completely fills. If so, pull the bucket from the water, allow it to swing upstream, and then drop it back into the water. This step may need to be repeated a few times until the bucket is full. Retrieve the bucket, taking care to not dislodge bridge debris into the bottles. Replace the bottle lids.
4. Memorize or record the water temperature and retrieve the thermistor. 5. Fit the bacteria sample bottle into the fecal coliform sampler. Remove the aluminum foil
covered stopper and place it where contamination to the stopper can be avoided. Lower the sampler in the thalweg (mid-channel) of the river or stream to water surface, taking care to not dislodge bridge debris into the bottle. When the sampler touches the water allow the fin to orient it in the current with the bottle upstream. Then lower the bottle rapidly into the water until it has completely submerged to minimize sampling of surface film. Retrieve the filled bottle taking care to not dislodge bridge debris into it. Before the foil-covered stopper is replaced, pour out a little of the sample to establish the water level at the bottle shoulder.
6. Return to the van with the samples and sampling gear.

Page 7
Field Processing Field processing fulfills two essential purposes: ♦ To prepare individual sample bottles for shipment to the lab; ♦ To preserve (fix) the DO sample, and ♦ To measure specific conductivity, pH, and barometric pressure. Typical field processing consists of the following procedure: 1. After returning to the van, label the fecal coliform/enterococci sample with the appropriate
sample tag and place it in a cooler of ice. Reload the sampler with an empty fecal coliform/entrococci sample bottle and set it aside for the next station.
2. Remove the 1-L bottles from the DO sample bucket and set them aside in the van. Then
carefully remove the bucket lid and set it aside in the van. Next, pull out the BOD bottle and set the DO sample bucket aside in the van. If necessary, tap the side of the BOD bottle to dislodge any air bubbles clinging inside. Insert a glass stopper in the bottle and discard the displaced water. Remove the stopper and fix the sample by adding approximately two milliliters of manganous sulfate solution followed by two milliliters of alkaline-azide solution using the disposable pipettes reserved for each solution. Add these reagents by immersing the tip of the pipette into the sample before injecting them into the solution (avoids splashing and entraining air bubbles in the reagent stream). Replace the stopper and mix the contents by inverting the bottle a few times. Add a few milliliters of deionized water around the stopper to form a water seal and cover the bottle top with a plastic cap. Place the fixed DO sample in the sample box. Note: The DO samples are titrated after the completion of the run (See Dissolved Oxygen on page 15).
3. Record the temperature and BOD bottle number on the Field Data Report Form (Appendix
F). 4. Remove the cap from an empty 500mL general chemistry (turbidity) sample bottle and place
the bottle in the sink bottle holder. Empty the previous sample water from the pH and specific conductivity measurement cups and rinse the cups and probes with deionized or sample water. Gently agitate the sample water in the DO sample bucket and fill the sample bottle and over fill the measurement cups. Cap the turbidity sample and set it aside.
5. Turn on the pH2 and conductivity meters and allow them a few minutes to stabilize before
recording the measurements on the Field Data Report Form. Check meter calibration if the pH measurement equals 8.5 or higher or equals 6.5 or less by measuring the 6.97 low ionic strength buffer. Record the reading(s) on the Field Data Report Form and if necessary, recalibrate meter. Note: Always record the pH as soon as the meter gives a stable measurement (sample pH changes with time).
2 The pH meter should notify and hold (beep and display freezes) when it has a stable measurement (see meter instrument manual).

Page 8
6. Open a 125mL preserved nutrient bottle (contains two milliliters of sulfuric acid) and set it in
the sink bottle holder. Avoid contact with the acid. Agitate the 1-L nutrient sample and pour approximately 100 mL of the sample into the 125mL bottle. Cap the 125mL bottle and agitate it to insure that the acid gets mixed into the sample.
7. Turn on the filter pump and put the intake hose in the remaining 1-L nutrient sample. Be
sure the filtration apparatus has been rinsed with deionized water and has a new filter. Allow the filtered sample water to run through the filter apparatus for 10-15 seconds to ensure that the deionized water has been purged from it. Then fill a 125-mL amber bottle (no preservative) with filtered sample water to the bottle shoulder, and cap it. Remove the intake hose from the 1-L nutrient sample bottle and the rinse hose exterior with deionized water. Then put the hose in deionized water and allow the pump to flush the interior of the filter apparatus with deionized water for 10-15 seconds. Cap the bottle and set it aside.
8. Record barometric pressure and any other measurements on the Field Data Report Form.
Also note any site or weather observations. 9. Label the sample bottles with the appropriate sample tags and place them in ice in a cooler. 10. Remove and discard the used filter from the filter apparatus, rinse the inside of the apparatus
with deionized water, and insert a new filter. Wet the new filter with deionized water to keep it in place and reassemble the filter apparatus. Then turn on the filter pump and allow the pump to flush the apparatus with deionized water for 10-15 seconds.
11. Rinse the inside of the stainless DO sample bucket with DI water and discard the rinse water. 12. Select an empty BOD bottle from the DO sample box, record its number on the Field Data
Report Form (Appendix F), place it in the stainless DO sample bucket, and replace the bucket lid.
13. Rinse the used nutrient sample bottle with deionized water and pour the 10% acid solution
from the spare bottle into the newly rinsed bottle. Cap it, shake it, and set it aside in the sink to soak until the next station. Rinse the empty 1-L nutrient sample bottle three times with deionized water, cap it, and place it in one of the bottle holders attached to the DO sample bucket. Also place a clean 1-L sample bottle in the other holder. Note: The dedicated nutrient sample bottles are used at alternating sites.
14. If required, check pH meter calibration (See pH on page 25).

Page 9
Quality Assurance / Quality Control Samples Stations for Quality Assurance / Quality Control (QA/QC) samples are selected at random prior to the water year. Two field blank stations and ten field replicate/field split stations are selected per year per run. The result is that one QA sample station is assigned per run for each month. Following are the three types of QA/QC samples that are collected and submitted blind to the lab.
Field Blanks Field blanks consist of deionized water processed as actual samples. Field blank results are expected to be below the method reporting limit. High results may indicate sample contamination. No fecal coliform/entrococci or DO samples, or pH or temperature measurements are necessary because they can not be correlated with contamination.
Field Replicates These consist of repeating the entire sampling procedure about 20 minutes after initial station samples have been collected. The sample results include variability due to short-term in-stream processes, sample collection and processing, and laboratory analysis.
Field Splits These consist of splitting samples from a single sampling event (usually the field replicate sample) that requires any field processing. The split samples eliminate the in-stream and isolate the field processing and laboratory variability. This includes DO, specific conductivity, pH, turbidity, and total and filtered nutrient samples. The total suspended solids, temperature, and fecal coliform/entrococci samples are not processed in the field and are excluded from these analyses. Adding a second BOD bottle to the DO sample bucket collects the split DO sample.

Page 10
Quality Assurance / Quality Control Sampling Procedures
Field Blank Samples Fill the DO sample bucket and the acid-rinsed 1-L sample bottle with deionized water. Then go through the normal process of obtaining the total nutrient, filtered nutrient, and turbidity samples. Also fill the conductivity cup and record the measurement. Do not collect fecal coliform /enterococci, Total Suspended Solid, and DO samples or take pH or Temperature measurements. Label the bottles with the appropriate QA_-1 tags, place them in ice in a cooler, and note the time and conductivity measurement on the Field Data Report Form.
Field Replicate Samples Put an additional DO bottle in the DO sample bucket and collect a second set of samples from the sample site. Go through the normal sampling process and label these samples with the appropriate QA_-1 tags (Also do Field Split samples).
Field Split Samples Split the collected total nutrient, filtered nutrient, and turbidity samples (samples that require field processing) and label these samples with the appropriate QA_-2 tags. Do not split the total suspended solids and fecal coliform samples or record the temperature, pH, conductivity, or barometric pressure. The second DO sample collected during the field replicate sampling is processed as a split sample.

Page 11
Sample Preservation and Shipment After collection, samples need to be placed in a cooler containing enough ice to keep them cool (below 4˚C) until all samples are collected. On hot days, two coolers may be necessary. At the end of the day, samples are shipped to the SeaTac Airport3, to the Olympia Greyhound Bus Station, or delivered to Lacey by the sampler. The lab courier picks them up at the pre-arranged location and delivers them to the lab. The courier must be notified immediately if the pick-up location changes or if the samples cannot arrive before the courier’s pickup time. If the courier cannot be reached then contact someone in the Freshwater Monitoring Unit or Environmental Monitoring and Trends Section who can verify that the courier receives the message. The short holding times for the bacteria and orthophosphate samples make timely deliveries imperative (See Table 3). Note: Samples shipped via air need to be transferred to a single cooler and packed with cold gel ice (use frozen gel ice that has been stored in another cooler of ice). Coolers containing samples being shipped on Greyhound or delivered to Lacey only need to be drained and repacked with enough ice to keep them cool. Table 3. Sample: Container, Preservation, and Holding Times
Variable Container Preservation Holding Time
Turbidity 500 mL wide-mouth poly Cool to <4˚C 48 hours
Suspended Solids 1000 mL wide-mouth poly Cool to <4˚C 7 days
Fecal coliform, Enterococci 500 mL glass/polypropylene autoclaved bottle2 Cool to <4˚C 24 hours
Total Phosphorus, Total Nitrogen, Nitrate + Nitrite, Ammonia
125 mL clear wide-mouth poly Acidify with H2SO4 to pH<2 and cool to <4˚C
28 days
Dissolved Orthophosphate 125 mL amber wide-mouth poly Filter in field and cool to <4˚ C
48 hours
Hardness 125 mL narrow-mouth poly Acidify with H2SO4 to pH<2 and cool to <4˚C 6 months
Low Level Total Metals 500 mL Teflon FEP bottle Acidify with HNO3 to <2 pH and cool to <4˚C 6 months
Low Level Total Mercury 500 mL Teflon FEP bottle Acidify with HNO3 to <2 pH and cool to <4˚C 28 days
Low Level Dissolved Metals 500 mL Teflon FEP bottle Filter, acidify with HNO3 to <2 pH and cool to <4˚C 6 months
3 Air shipments are usually shipped via overnight air freight. Always get a copy of the shipping invoice.

Page 12
Methods and Procedures Barometric Pressure Method - Field measurement Holding Time - NA Detection Limit - NA Precision - 0.02 inches Hg Overview Barometric pressure is measured with an aneroid barometer. The barometric pressure measurement is used in conjunction with other variables to determine the percent saturation of dissolved oxygen in water. See Dissolved Oxygen Method Overview for more a more complete discussion. Equipment ♦ Aneroid Barometer w/ .02" scale ♦ Mercury Barometer Calibration Prior to departing on the run take the aneroid barometer from the van to OS-31 (Wet Lab) to calibrate it against the mercury barometer. The adjustment screw for calibration is located on the back of the barometer. Mercury Barometer Reading Gently tap the glass tube and then turn the adjusting screw on the bottom of the barometer until the mercury just touches the white pointer, as viewed through the reservoir glass. Raise the vernier to the top of the mercury meniscus. Read the mercury scale in inches (to refine the estimate of the last digit read the two numbers that line up with the vernier). The reading on the mercury barometer must be adjusted for temperature and gravity variation. Read the thermometer attached to the barometer and look up the correction in the table located in the manila holder attached to the hood. For our latitude (46˚N) at 20˚C (71˚F) the gravity correction is + 0.004 and the temperature correction is - 0.109. The combined correction factor for the mercury barometer at 71˚F is - 0.105 inches of mercury. Aneroid Barometer Adjustment Adjust the aneroid barometer to the corrected mercury barometer reading with the adjustment screw located on the front or back of the instrument. Hold the aneroid barometer upright and gently tap the glass while making the adjustment to assure proper alignment of the black pointer.

Page 13
Field Measurement The barometric pressure is read by sighting down the measurement pointer with the barometer near eye level. The measurement is recorded to the nearest 0.01 of an inch on the Field Data Report Form. Note: Typical readings are between 27 and 30 inches.
Conductivity Method - Field measurement Holding Time - NA Detection Limit - NA Precision - 1 µmhos/cm @ 25˚C Overview Conductivity is measured with a meter. Conductivity measures of the ability of the water sample to carry an electrical current. It is dependent upon the concentration and type of dissolved (ions) and the water temperature. The conductivity meter standardizes the measurement to 25˚C (i.e. specific conductivity) for data comparison. Equipment ♦ Conductivity meter and probe ♦ Deionized water ♦ 99-109 µmhos/cm NIST Traceable Calibration Standard ♦ Plastic sample container ♦ Deionized water squirt bottle ♦ pH/Conductivity log form Calibration Soak the conductivity probe in deionized or tap water for at least 30 minutes. Replace the conductivity standard. Make sure that the meter is set to read in the non-linear function (nLF) mode for temperature compensation and the reference temperature for the meter is set at 25˚C. Follow the instrument manual to adjust the cell constant. Sample Collection Conductivity levels are measured on a sub sample of the water from the DO sample bucket. Sample Measurement Rinse the conductivity sample cup and conductivity probe with deionized water or sample water. Then agitate the water in the DO sample bucket and over fill the sample cup. Turn the meter "ON" and let the meter equilibrate. Record the conductivity measurement on the Field Data

Page 14
Report Form. Note: The meter displays to the nearest tenth, so in most cases, the measurement needs to be rounded to the nearest whole number. If the tenths digit > .5, round up, < .5, round down, and when = .5 always round to the nearest even number. For example, 103.5 would be rounded to 104 and 62.5 would be rounded to 62. Quality Control Check The conductivity meter is calibrated each morning as part of run preparation and checked using the calibration standard after the last station of the day. The results are recorded on the Meter Calibration Log Form (Appendix A). If the meter will not calibrate properly or if the end-of-the-day check is off by more than five µmhos/cm then see Troubleshooting below. Also, be sure to code the data with a “J”, note meter problems on the form, and report the problem to your supervisor when you return. Meter\Probe Storage Rinse probe with deionized water and store dry. Troubleshooting If you suspect an inaccurate measurement or the conductivity measurement is not within 5 µmhos/cm of the standard then do the following. 1. Make sure the meter is in the non-linear function (nLF) mode for temperature compensation. 2. Change the conductivity standard. This is an easily contaminated solution. A small quantity
of deionized water or even a single drop of pH buffer can have a noticeable impact on the standard.
3. Check the battery and probe connection. 4. Recalibrate the meter. Note this recalibration in the comment portion of the Field Data
Report Form. 5. Check the previous conductivity sample and if necessary, revise the recorded measurement. If these steps do not work, then review the troubleshooting section in the meter instruction manual. If you can not fix the problem, then fill out an equipment problem report form when you return from the run and place it and the defective equipment on the boat shed electronic repair bench.

Page 15
Dissolved Oxygen Method - Standard Methods for the Examination of Water and Wastewater. 20th Edition, No:4500-O C. Winkler Method, Azide Modification4. Holding time - up to 4 days Detection Limit - 0.1 mg/L Precision - 0.1 mg/L Limitations - ferrous iron/L should be < 1 mg/L in water sample. Overview Dissolved oxygen (DO) is the amount of oxygen dissolved in a water sample. The amount varies directly in response to changes in atmospheric pressure and water temperature. The higher the atmospheric pressure the higher the oxygen solubility in water and the higher the DO concentration. The opposite is true with temperature, the higher the temperature the lower the solubility and saturation concentration of oxygen in water. DO is one of the major factors that determine the type of biological communities that inhabit an aquatic system. The addition of organic or inorganic material that exerts an oxygen demand through respiration and biodegradation lowers the DO concentration and can facilitate the growth of nuisance organisms. Equipment ♦ Stainless steel sampling bucket (similar to design presented in Figure 4500-0:1 of the 20th
Edition of Standard Methods) ♦ Rope ♦ DO box ♦ BOD bottles, 300 mL ♦ Plastic BOD bottle water seal caps ♦ Manganous sulfate solution ♦ Alkali-iodate-azide reagent ♦ 2 mL pipettes ♦ Deionized water squirt bottle ♦ Deionized water ♦ 10% HCl Cleaning The DO sample bucket and BOD bottles are rinsed with deionized water after each run. BOD bottles are stored upside down in the DO box to keep dust out and promote drying. The sample bucket is stored with at least 3 cm of deionized water standing in the bottom of the bucket.
4 This is a slight modification of azide modification method presented in the 20th edition of Standard Methods, which calls for the addition of 1 mL of manganous sulfate and azide instead of 2 mL. The excess reagents are accounted for by using 203mL volumetric flasks rather than 201mL flasks.

Page 16
Field Preparation Record the BOD bottle number(s) on the Field Data Report Form (Appendix F). Rinse the sampling bucket, top, and filler tubes with deionized water. Place the BOD bottle into the sampling bucket. Orient the top of the sampling bucket to insure that a filler tube is inserted into the BOD bottle and fitted into place Sample Collection The water sample should be taken from the main part of the channel or thalweg where possible. Lower the sample bucket to the water surface. Then lower the bucket rapidly into the water until it has completely submerged to minimize sampling of surface film. Retrieve the bucket when the bubbles from the vent tube stop (bucket is full). A swift current may take the bucket downstream before it completely fills. If so, pull the bucket from the water, allow it to swing upstream, and then drop it back into the water. This step may need to be repeated a few times until the bucket fills. Retrieve the filled bucket, taking care to not dislodge bridge debris into it. Field Processing At the van, carefully remove the top from the sampling bucket by standing on the bucket feet and pulling on the top. Remove the BOD bottle. Try to avoid contamination of the water remaining in the sampler. If necessary, tap the side of the BOD bottle to dislodge any air bubbles clinging inside. Insert a glass stopper in the bottle and carefully discard the displaced water. Remove the stopper and fix the sample by adding approximately two milliliters of manganous sulfate solution followed by two milliliters of alkaline-azide solution using the disposable pipettes reserved for each solution. Add these reagents by immersing the tip of the pipette in the water before injecting them into the solution (avoids splashing and entraining air bubbles in the reagent stream). Replace the stopper and mix the contents by inverting the bottle a few times. Add a few milliliters of deionized water around the stopper to form a water seal and cover the bottle top with a plastic cap. Place the fixed DO sample in the sample box. Laboratory Analysis Equipment ♦ Graduated burette, 25 mL w/ 3-way stopcock ♦ Volumetric burette, 10 mL w/ 3-way stopcock ♦ Erlenmeyer flasks, 1000 mL ♦ Magnetic stirrer ♦ Stirring bars ♦ 203 mL Volumetric flask ♦ Concentrated sulfuric acid ♦ Aqueous starch solution ♦ Sodium thiosulfate, 0.025 M ♦ Potassium bi-iodate, 0.025 M ♦ Liquinox soap
Page 17
Cleaning Thoroughly wash and rinse glassware using Liquinox soap and water before every analysis. Titration Procedure Note: It is important to dilute the chemicals going into the sink during the following process with a continuous stream of tap water to prevent damage to the building plumbing. 1. Put on the plastic apron and Nitrile gloves. 2. Remove the plastic caps from the BOD bottles. 3. Pour off the water seal and invert the bottle several times to mix the floc. 4. Allow the floc to settle into the lower half of the bottle while rinsing needed flasks, flasks,
and stirrers. 5. Put on the face shield. 6. Remove the glass stoppers. 7. Remove the bottle-top dispenser containing sulfuric acid from the acid storage cabinet and
make sure its volume adjustment is set to 2 ml. 8. Add 2 mL of sulfuric acid to each sample and put the acid bottle back into the cabinet. 9. Re-stopper the bottles and invert them several times over the sink until the precipitate has
completely dissolved. 10. Fill a 203 mL volumetric flask with a portion of a DO sample and transfer the sample to an
Erlenmeyer flask. 11. Empty any the sodium thiosulfate from the volumetric burette. 12. Agitate the sodium thiosulfate storage bottle and loosen the plastic lid. 13. Open the volumetric burete stopcock. Then lower and raise the sodium thiosulfate storage
bottle above and below the stopcock a few times to help flush the buret. 14. Fill the burete until sodium thiosulfate escapes from the top nipple. 15. Slide a stir bar into the flask containing a sample and place the flask on the magnetic stirrer. 16. Turn the stirrer on and titrate the sample, using the automatic burete with 0.025 N sodium
thiosulfate until it turns to a pale yellow color.

Page 18
17. Add 1 to 2 mL of the starch solution and continue titrating the sample until the purple color just disappears to establish the titration end point5. Record the measurement on the Field Data Report Form. Note: The titration end point should be sharp and distinct, if it is not, see trouble shooting section below.
Check the titration end points of questionable samples by adding a drop or two of bi-iodate into the flask. If the end point is correct, the purple color should reappear. If more than 1 or two drops of bi-iodate are required then the end point was overrun. Back-titrate the sample with the bi-iodate standard (1 drop = 0.05 mg/L) and correct the final value. Record the titration volume in the proper column on the Field Data Report Form. If the value is in between 0.1 mL marks on the burette, round the even numbers down and the odd numbers up (e.g., 10.25 to 10.2 and 10.35 to 10.4). After all titrations are completed, refill the burette, clean up all spills, and put away all equipment in clean working order. Sodium Thiosulfate Normality Check After the first sample has been titrated to its end point, add 10 mL of the bi-iodate standard6 to the sample and re-titrate. Repeat this procedure on the first sample of the third day of the run or when an additional amount of sodium thiosulfate has been added to the burete fill bottle. Record the volume of the sodium thiosulfate needed for each normality check on the Field Data Report Form and on sheet of paper located on the clipboard next to the titration station. The average of the two normality checks is entered into the correction factor field when entering the field data into the ambient database. These checks should be very close, within 0.2 mL. If they are not, then run several more until you have three very close readings. Trouble Shooting Problem: Floc remains in BOD bottle after the addition of sulfuric acid. Solution: Agitate again and allow 5-6 minutes for the precipitate to dissolve. If the floc still has not dissolved then add small amounts of sulfuric acid until floc is completely dissolved. Problem: Slight blue or purple flakes or specks that resist titration, or the end point is not clear (mushy). Solution: Replace starch solution. Problem: End point is over run by a large volume (> 5 drops of bi-iodate must be added for blue color to reappear). Solution: Titrate a 50-mL sample remaining in the BOD bottle. Use the following formula to calculate PPM DO. PPM DO = volume sodium thiosulfate x 203mL/50mL
5The volume of sodium thiosulfate used to titrate 203 mL of each sample equals the PPM of dissolved oxygen in the water. 6The automatic volumetric buret measures out the 10mL bi-iodate standard above the 3-way stopcock (no standard needs to be between the stopcock and buret tip). Air should be trapped in and below the stopcock and a drop of sample in the tip when dispensing the 10ml of standard.

Page 19
References SM 1998. Standard Methods for the Examination of Water and Wastewater, 20th Edition, American Public Health Association, Washington D.C. Mason, C.F., 1981. Biology of Freshwater Pollution, Longman Inc. New York, NY. 250 pp. Reed, G.K. and R.D. Wood. 1976. Ecology of Inland Waters and Estuaries, 2nd Edition, D. Van Nostrand, New York, NY. 485 pp.
Fecal Coliform and Enterococci Bacteria Fecal Coliform Method - Standard Methods for the Examination of Water and Wastewater. 20th
Edition. No: 9222D 24 hour Membrane Filter (MF) method. Enterococci Method - EPA 1600 24 hour MF method. Holding Time - 24 hours Detection Limit - 1 colony per 100 mL Precision - 1 colony per 100 mL Limitations - highly turbid waters Overview There are many potential disease-causing microorganisms that remain viable in freshwater. It is impractical, both with respect to time and money to test ambient water samples individually for the presence of all potential vectors. The practical approach is to test the water samples for the presence of indicator organisms. Fecal coliform bacteria concentration is currently used as the preferred indicator organism in Washington State. However, enterococci are being proposed as a replacement indicator. Fecal coliform and enterococci bacteria are present within the intestinal tract of warm-blooded animals and remain viable in freshwater for a variable period of time. Equipment ♦ Rope ♦ 250 mL autoclaved bacteria sample bottles7 ♦ Fecal coliform sampler Sample Collection Care should be used at all times to avoid contamination of the inside of the sample bottle, or the foil covered silicon stopper or bottle cap. Also, the sample needs to be placed in ice in a cooler as soon as possible after collection. Fit the bacteria sample bottle into the fecal coliform sampler. Remove the aluminum foil cover stopper and place it where contamination can be avoided. Lower the sampler in the thalweg 7 500 ml sample bottles may be necessary if both fecal coliform and enterococci tests are conducted.
Page 20
(mid-channel) of the river or stream to water surface, taking care to not dislodge bridge debris into the bottle. When the sampler touches the water allow the fin orient it in the current with the bottle upstream. Then lower the bottle rapidly into the water until it has completely submerged to minimize sampling of surface film. Retrieve the filled bottle taking care to not dislodge bridge debris into it. Before the foil-covered cap is replaced, pour out a little of the sample to establish the water level at the bottle shoulder. Field Processing No field processing is required. Label the sample bottle with the appropriate tag and place it in ice in a cooler.
Metals Dissolved Metals Method – Modified version of EPA 200.8 Method (Using inductive coupled
plasma (ICP) – mass spectrometry (MS)) Total Recoverable Metals Method – EPA 202.2 Method (Hotplate Assisted Digestion) and a
modified version of EPA 200.7 Method (ICP). Total Mercury Method – EPA 245.7 Method (Free Bromide Digestion) and EPA 245.1 Method
(Cold Vapor Absorbance) Holding Time – Mercury 28 days, all the rest 6 months Detection Limit – Refer to Table 6., Page 119, Manchester Lab Users Manual, Fifth Edition
(Oct. 2000) Overview The long-term river and stream monitoring of ambient metals by the program was most extensive in the early and mid 1990s. Equipment ♦ Stainless steel metals sampler ♦ Rope ♦ 500ml Teflon bottles ♦ Small Teflon vials containing 5 ml Concentrated Nitric Acid ♦ 125 ml narrow mouth poly bottle containing H2S04 preservative (hardness sample bottle) ♦ Disposable 0.45 micron cellulose nitrate filter unit (precleaned Nalgene #450-0045, type S) ♦ Hand pump for filter unit

Page 21
Sample Collection Water samples are collected as single grabs using the stainless steel metals sampler and a 500ml Teflon bottle. Care must be used at all times to avoid contaminating the inside of the sample bottle with debris or ambient air. Also, samples need to be placed in ice in a cooler as soon as possible after collection. The sample collection procedures are as follows: 1. Invert the Teflon bottle sample bottle, remove the cap, and let the deionized water empty out
of the bottle. 2. Replace the cap, as soon as the bottle has emptied, to minimize ambient air contamination. 3. Fit the sample bottle into the stainless steel metals sampler. 4. Completely loosen the lid and attach the sampler lid clamp while keeping the lid on the
bottle. 5. Remove the lid from the attached hardness sample collection container. 6. Lower the sampler in the thalweg (mid-channel) of the river or stream to the water surface,
taking care to not dislodge bridge debris into the bottle or the attached hardness sample container.
7. Allow the sampler to orient itself in the current with the metals sample bottle upstream.
Then lower the sampler rapidly into the water until it has completely submerged to minimize sampling of surface film. Note: At about 25 cm under the water surface, the sampler should automatically raise the bottle lid and allow the bottle to fill.
8. Retrieve the filled bottle taking care to not dislodge bridge debris. 9. Loosen the sampler lid clamp while keeping the lid on the bottle and tighten the bottle cap. 10. Cap and remove the filled sample bottle from the sampler, place it in the ziploc bag it
shipped in, empty the hardness sample collection container, and repeat steps 1-8 to obtain a second metals sample.
11. Cap the second metals sample. 12. Pour approximately 100 mL of the sample collected in the attached hardness sample
collection container into a 125 mL hardness sample bottle. Cap and agitate the hardness sample bottle to insure that the acid gets mixed into the sample. Note: Avoid contact with the acid.
13. Return to the van with the samples and sampling gear.

Page 22
14. Label the hardness sample and place the sample in ice in a cooler. 15. Rinse the hardness sample collection container attached to the metals sampler with deionized
water and recap it. Field Processing Dissolved Metals 1. Remove the disposable filter unit from its ziploc bag. 2. Attach the hand pump hose to the filter unit. 3. Loosen the tape on one side of the top of the filter unit. 4. Remove the cap from one of the filled sample bottles and empty the contents into the filter
unit. Note: Avoid touching or contaminating the inside of the filter unit. 5. Cap the used sample bottle and set it aside. 6. Draw a vacuum on the filter unit by squeezing the hand pump. 7. Filter as much of the sample as possible (at least half). 8. Empty the deionized water from an unused Teflon bottle and place the cap over the opening. 9. Remove the bottom of the filter apparatus containing the filtered sample, remove the cap
from the top of the unused sample bottle (do not set the cap down) and fill the bottle with the filtered sample.
10. Carefully add the nitric acid from a Teflon vial to the sample and screw the cap on tight. 11. Label the sample with the appropriate Dissolved Metals sample tag and place it into its
original ziploc bag along with the empty (capped) Teflon vial. 12. Then put the bagged filtered sample along with the empty Teflon bottle into the larger ziploc
bag that contained the filter unit. Total Recoverable and Total Mercury 1. Remove the cap from the second sample bottle (do not set the cap down) 2. If necessary, gently squeeze the side of the sample to liberate about 5 ml of sample to make
room for the Nitric acid. 3. Carefully add the Nitric acid from a Teflon vial to the sample and screw the cap on tight.
Page 23
4. Label the sample with the appropriate Total Metals sample tag(s). 5. Place the sample in its original ziploc bag along with the empty (capped) Teflon vial and put
them in the larger filter unit ziploc bag already containing the dissolved metals sample. 6. Eliminate air from the ziploc bags, fold the larger bag in half, put tape around the outside of
the bag, and place the bagged samples on ice in a cooler.
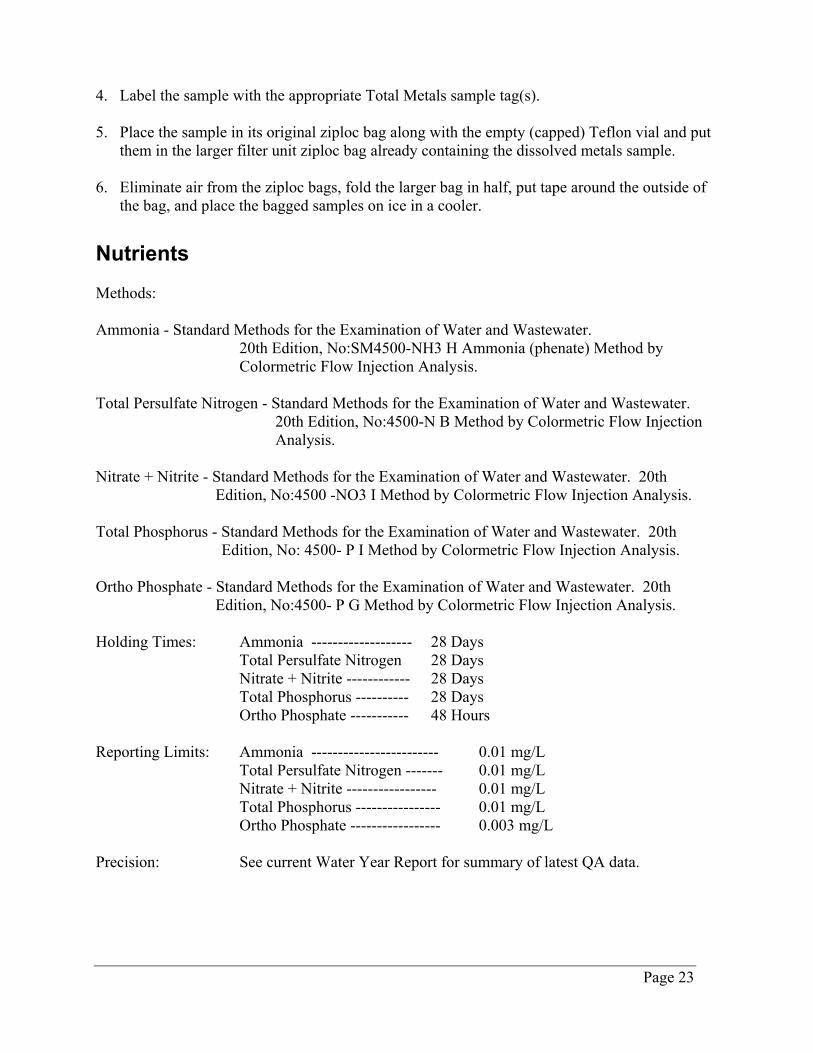
Nutrients Methods: Ammonia - Standard Methods for the Examination of Water and Wastewater.
20th Edition, No:SM4500-NH3 H Ammonia (phenate) Method by Colormetric Flow Injection Analysis.
Total Persulfate Nitrogen - Standard Methods for the Examination of Water and Wastewater.
20th Edition, No:4500-N B Method by Colormetric Flow Injection Analysis.
Nitrate + Nitrite - Standard Methods for the Examination of Water and Wastewater. 20th
Edition, No:4500 -NO3 I Method by Colormetric Flow Injection Analysis. Total Phosphorus - Standard Methods for the Examination of Water and Wastewater. 20th
Edition, No: 4500- P I Method by Colormetric Flow Injection Analysis. Ortho Phosphate - Standard Methods for the Examination of Water and Wastewater. 20th
Edition, No:4500- P G Method by Colormetric Flow Injection Analysis. Holding Times: Ammonia ------------------- 28 Days Total Persulfate Nitrogen 28 Days Nitrate + Nitrite ------------ 28 Days Total Phosphorus ---------- 28 Days Ortho Phosphate ----------- 48 Hours Reporting Limits: Ammonia ------------------------ 0.01 mg/L Total Persulfate Nitrogen ------- 0.01 mg/L Nitrate + Nitrite ----------------- 0.01 mg/L Total Phosphorus ---------------- 0.01 mg/L Ortho Phosphate ----------------- 0.003 mg/L Precision: See current Water Year Report for summary of latest QA data.

Page 24
Overview Nitrogen and phosphorus are the nutrients that most often limit aquatic algae growth in freshwater. When phosphorus is limiting, an increase in concentration can result in increased algal production, which can have aesthetic and ecological impacts. The typical phosphorus concentration of many of Washington's rivers and streams is very low, often less than 0.01 mg/L, which makes them especially susceptible to increases in phosphorus input. Equipment • Stainless steel DO sample bucket • One 1-L poly bottle • Rope • Peristaltic pump • Tubing (silicon) • Filter apparatus (stand, polyethylene mesh support screen, under- and over-drain support, • O-ring, wing nuts) • Filters, cellulose acetate 0.45 µm pore size • Deionized water squirt bottle • Bottles, 125mL, brown poly (w/o preservative) • Bottles, 125mL, clear poly (w/H2S04 preservative) • Deionized water • 10% HCl • Cleaning brush (toothbrush) Cleaning Contamination of the sampling equipment or sample bottles can result in an overestimate of phosphorus concentration. Cleanliness and standardized procedures are essential when collecting nutrient samples, particularly from oligotrophic streams. If soap is needed to clean the equipment, use "Liquinox". Other soaps usually contain trace amounts of phosphorus. Acid-Washing of Nutrient Sample Collection Bottles About 500 mL of 10% HCl is transferred from one 1-L poly nutrient sample bottle to the other. The acid-rinsed bottle is triple rinsed with deionized water and placed in the bottle holder attached to the DO sample bucket. The nutrient sample bottle containing the 10% HCl is shaken and set aside to soak. This process is repeated between each sampling event. Filter Apparatus The filter apparatus should be acid-washed before each run. Loosen the wing nuts and remove upper filter holder. Scrub the inside of both the upper and lower filter supports and the polyethylene screen with a brush. Then rinse the apparatus with deionized water, reassemble, and cycle 10% HCl solution through it (Start by placing the tubing from the pump in the 1-L

Page 25
bottle containing the 500ml of HCl and set the bottle under the filter outlet. Turn the pump on. After about 30 seconds remove the hose from the acid and let the tubing purge itself of the remaining acid). Then rinse the apparatus for 30 seconds with deionized water. Set up the apparatus for filtering (Loosen the wing nuts and remove the top of the apparatus. Insert a 0.45 µm cellulose nitrate filter on the filter holder. Prevent leaking by making sure the O-ring is in place. Wet the new filter with deionized water and reassemble the filter apparatus). Then turn on the filter pump and flush the apparatus with deionized water for 10-15 seconds). Sample Collection and Processing The nutrient samples are collected in the 1-L acid-washed bottle attached to the DO sample bucket. Open a 125 mL preserved nutrient bottle (contains two milliliters of sulfuric acid) and set it in the sink bottle holder. Avoid contact with the acid. Agitate the 1-L nutrient sample and pour approximately 100 mL of the sample into the 125 mL bottle. Cap and agitate the 125 mL bottle to insure that the acid gets mixed into the sample. Turn on the filter pump and put the intake hose in the 1-L nutrient sample. Be sure the filtration apparatus has been rinsed with deionized water and has a new filter (See cleaning above). Allow the filtered sample water to run through the filter for 10-15 seconds to ensure that the deionized water has been purged from the apparatus. Then fill the bottle to the shoulder, and cap it. Remove the inlet hose from the 1-L nutrient sample bottle and the rinse hose exterior with deionized water. Next put the hose in the deionized water and allow the pump to flush the filter apparatus for 10-15 seconds. Label the sample bottles with the appropriate sample tags and place them in the ice in a cooler.
pH Method - Field measurement Holding Time - NA Detection Limit - NA Precision - assumed 0.1 pH units Overview The pH of a water sample is defined as the negative logarithm of hydrogen ion activity. pH values range from 0 to 14, 0 being highly acidic, 14 being highly alkaline and 7 neutral. Each pH unit represents a tenfold change in the hydrogen ion activity. Natural waters usually fall within the pH range of 4 to 9, with Washington waters typically being from 6.5 to 8.5. The pH measurements made by the Freshwater Monitoring Unit are used in the calculation of ammonia toxicity and to determine if waters are in compliance with state pH standards.

Page 26
Equipment • pH meter • pH probes (2) • 1 M electrode filling solution (probe specific) • Deionized water • low ionic strength pH 4 buffer • low ionic strength pH 6.97 buffer • low ionic strength pH 9.27 buffer • Plastic pipette • Deionized water squirt bottle • Sample container • 10% HCl • Meter Calibration Log Form (Appendix B) Calibration Remove the storage cap on the pH probe. Rinse off all salt deposits with deionized water. Replace the pH electrode filler solution in the probe using the plastic pipette. Refill the probe with the correct (1 M KCl) reference solution. Soak the pH probe in tap water for at least thirty minutes before calibration. Replace the buffers. Follow instrument manual for a two-buffer calibration. Re-calibrate the pH probe a second time after arriving at the first sample station to insure that it has warmed up. If the meter fails to calibrate properly soak the probe for one minute in 10% HCl solution, then in deionized water. Recalibrate the meter. If calibration fails again, refer to the troubleshooting section. Sample Collection The pH levels are measured on a sub-sample of the water from the DO sample bucket. Sample Measurement Rinse the pH sample cup with deionized water or sample water. Then agitate the water in the DO sample bucket and over fill the sample cup. Place the pH probe in the sample, taking care to not submerge the probe fill hole. Turn the meter on and let it notify and hold on a stable reading (denoted by the word “ready” on the meter display and also signaled by an audible beep). Press the measure button and allow the meter to notify and hold on a stable reading a second time. Note: A small amount of drift is normal. If the drift is >0.1, the first reading was probably premature. Record the measurement on the Field Data Report Form to the nearest 0.01 pH units.
Page 27
Quality Control The calibration of the pH meter is checked against the 6.97 buffer three times a day: immediately after obtaining the first measurement of the day, at the midway point of a sampling day, and after the last station of the day. The process of checking the calibration is as follows: rinse the probe with deionized water, place it in the 6.97 buffer, and proceed as if the buffer were a typical water sample. The results are recorded on the Meter Calibration Log Form (Appendix D) and the Field Data Report Form (Appendix F). If the pH is not within 0.1 of the true pH, then recalibrate the meter. If the meter will not calibrate properly then refer to Troubleshooting below. Also, be sure to note meter problems on the forms and report them to your supervisor when you return. pH Meter\Probe Storage At the end of the day, fill the probe protective cap about half full of electrode reference solution and secure the cap to the electrode. Cover the fill hole with the protective sleeve or the rubber plug (depends upon electrode). During freezing weather store the meter, probe, and buffer in a heated room. Troubleshooting If you suspect an inaccurate measurement, the reading drifts, or the meter takes longer than 90 seconds to notify and hold on a stable reading then check the meter calibration after doing one or more of the following: 1. Change the pH buffer and pH probe solutions. 2. If there is a slow response or the reading drifts, then alternately soak the probe in 10% HCl
and deionized water several times for one to two minute intervals. 3. If the reading drifts, then alternately soak the probe in household ammonia and pH4 buffer
several times for up to five-minute intervals. Since the ammonia can be a problem for the conductivity probe and other equipment, you should do this process outside the van.
4. Refer to meter instrument manual and perform self-test. 5. Refer to probe manual and review the troubleshooting section. Replace the probe if this does
not fix the problem. 6. If you can not fix the problem, then fill out an equipment problem report form when you
return from the run and place it and the defective equipment on the boat shed electronic repair bench.

Page 28
Stream Stage Height Reference Point Measurement A reference point is a fixed point or datum on the bridge or other structure from which a measurement can made to the surface of the water under all flow conditions. The distance from this reference point to the water surface is measured with a weighted fiberglass measuring tape. The weighted tape is lowered to the water surface just to the point were the wake forms distinctive "V" behind the weight. The distance from the reference point to the water surface is recorded to the nearest 0.01 foot. Wire Weight Gage Measuring stage height with a wire weight gage is similar to using a reference point. A wire weight gage is a self-contained weighted measuring device that is permanently attached to the bridge. A wire weight gage is more accurate than the weighted fiberglass tape and the reference point for a wire weight gage is within the gage box itself. The first step is to move the check bar forward. Then drop the weight down until it touches the check bar, and record this number. Next move the check bar back and lower the weight to the water surface to a point where the wake from the water passing by the weight forms a slight distinctive "V" shape. Record the measurement and retrieve the weight. Note: Both of these measurements are recorded to the 0.01-foot. Staff Gage A Staff Gage is a graduated measuring device securely fixed to a permanent structure in the streambed from which stage height can be read directly to the 0.01 foot. Continuous Stage Height Recorder Some of the continuous stage-height recorders, located by the ambient stations are operated by the USGS. Current stage height can be read from the metal tape in the gage house or, with some models, by pressing a button next to the LCD display.
Suspended Solids Method - Standard Methods for the Examination of Water and Wastewater. 20th Edition, No: 2540 D. Total Suspended Solids dried at 103-105°C. Holding Time - 7 days Detection Limit - 1 mg/L Precision - 1 mg/L

Page 29
Overview Total suspended solids (TSS) refers to the material retained on a standard glass filter after filtration and heating to 103-105˚C. TSS is a direct measurement of the concentration of suspended material present in a water sample. Equipment 1-L poly bottle Sample Collection The water sample for TSS determination is collected in a 1-L poly bottle attached to the DO sample bucket. Field Processing The water sample for TSS determination does not require any field processing. The sample bottle is tagged and placed in a cooler of ice.
Temperature Overview Temperature is a major factor that influences the metabolism and structure of the biological communities in rivers and streams. Stream temperature can be influenced by many factors including: discharge (flow), stream gradient, depth, stream cover, water color, time of day, season, stream segment, intensity of solar radiation, and human activities. Temperature is inversely related to dissolved oxygen levels. As temperature levels increase the solubility of oxygen decreases. This relationship become more important as temperatures rises. Metabolism of most species within an aquatic community increases with temperature resulting in a higher oxygen demand for respiration. Increased demand for oxygen combined with reduced availability can lead to displacement of all but the least sensitive species. Possibly just as important as the relationship between temperature and dissolved oxygen is the effect temperature can have on the toxicity of various pollutants. Equipment • Thermistor with attached probe (50 meter) • Alcohol thermometer 1 - 50˚C Calibration Check the calibration of the thermistor before departing on a run by placing the probe and the thermometer in a bottle of tap or deionized water. Allow at least two minutes for them to

Page 30
equilibrate. Record the meter and thermometer readings on the Meter Calibration Log Form. Also note the correction factor for the thermistor on the form. Measurement The thermistor probe is lowered at the thalweg (mid channel) of the sampling location to about .03 meters below the water surface. Turn the meter on and allow the probe to equilibrate. Record the temperature. Note: Do not apply the correction factor prior to entering a result on the Field Data Report Form. The correction factor is applied when entering the result into the database. References SM 1998. Standard Methods for the Examination of Water and Wastewater, 20th Edition, American Public Health Association, Washington D.C. Mason, C.F., 1981. Biology of Freshwater Pollution, Longman Inc. New York, NY. 250 pp. Reed, G.K. and R.D. Wood. 1976. Ecology of Inland Waters and Estuaries, 2nd Edition, D. Van Nostrand, New York, NY. 485 pp.
Turbidity Method - Standard Methods for the Examination of Water and Wastewater. 20th Edition, No: 2130 B. Nephelometric Method Holding time - 48 hours Detection Limit - 0.5 NTU Precision - 0.5 NTU Overview Turbidity is often thought of as a decrease in water clarity and is a measurement of the ability of the water sample to scatter or absorb light. Turbidity increases with the concentration of suspended matter in the water and the light refracting or light absorbing characteristics of the suspended material. The Nephelometric method for turbidity determination measures the amount of light scattered at an angle perpendicular to the light source. This method compares the light scattering ability of a water sample to known standards. The results are expressed in NTU (Nephelometric Turbidity Units). Sample Collection The water sample for turbidity determination is taken from a sub-sample of the water in the DO sample bucket.

Page 31
Field Processing The water sample for turbidity determination is obtained from the remaining water in the DO sample bucket. Gently agitate the sample water in the DO sample bucket and fill a 500 mL sample bottle to the bottle shoulder. Cap and tag the sample, and place it in ice in a cooler.

This page is purposely blank for duplex printing

Appendix A
Freshwater Ambient Run Checklist

This page is purposely blank for duplex printing
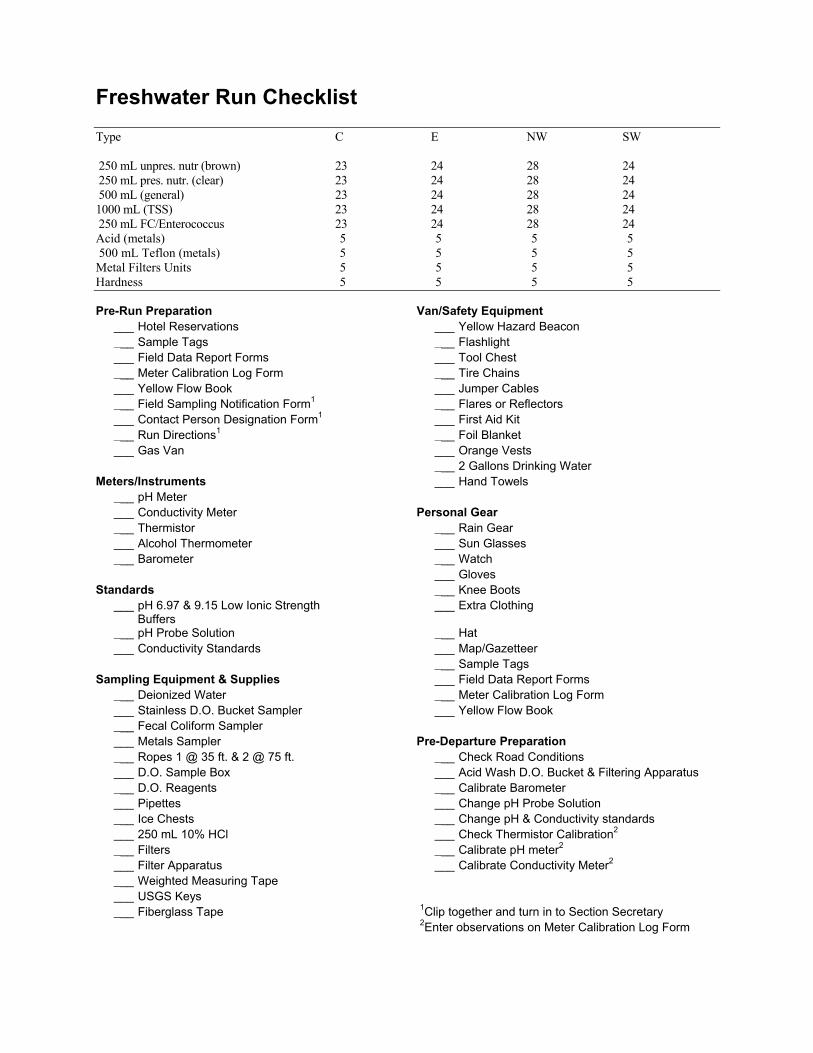
Freshwater Run Checklist Type C E NW SW 250 mL unpres. nutr (brown) 23 24 28 24 250 mL pres. nutr. (clear) 23 24 28 24 500 mL (general) 23 24 28 24 1000 mL (TSS) 23 24 28 24 250 mL FC/Enterococcus 23 24 28 24 Acid (metals) 5 5 5 5 500 mL Teflon (metals) 5 5 5 5 Metal Filters Units 5 5 5 5 Hardness 5 5 5 5 Pre-Run Preparation Van/Safety Equipment
___ Hotel Reservations ___ Yellow Hazard Beacon ___ Sample Tags ___ Flashlight ___ Field Data Report Forms ___ Tool Chest ___ Meter Calibration Log Form ___ Tire Chains ___ Yellow Flow Book ___ Jumper Cables ___ Field Sampling Notification Form1 ___ Flares or Reflectors ___ Contact Person Designation Form1 ___ First Aid Kit ___ Run Directions1 ___ Foil Blanket ___ Gas Van ___ Orange Vests
___ 2 Gallons Drinking Water Meters/Instruments ___ Hand Towels
___ pH Meter ___ Conductivity Meter Personal Gear ___ Thermistor ___ Rain Gear ___ Alcohol Thermometer ___ Sun Glasses ___ Barometer ___ Watch
___ Gloves Standards ___ Knee Boots
___ pH 6.97 & 9.15 Low Ionic Strength Buffers
___ Extra Clothing
___ pH Probe Solution ___ Hat ___ Conductivity Standards ___ Map/Gazetteer
___ Sample Tags Sampling Equipment & Supplies ___ Field Data Report Forms
___ Deionized Water ___ Meter Calibration Log Form ___ Stainless D.O. Bucket Sampler ___ Yellow Flow Book ___ Fecal Coliform Sampler ___ Metals Sampler Pre-Departure Preparation ___ Ropes 1 @ 35 ft. & 2 @ 75 ft. ___ Check Road Conditions ___ D.O. Sample Box ___ Acid Wash D.O. Bucket & Filtering Apparatus ___ D.O. Reagents ___ Calibrate Barometer ___ Pipettes ___ Change pH Probe Solution ___ Ice Chests ___ Change pH & Conductivity standards ___ 250 mL 10% HCl ___ Check Thermistor Calibration2 ___ Filters ___ Calibrate pH meter2 ___ Filter Apparatus ___ Calibrate Conductivity Meter2 ___ Weighted Measuring Tape ___ USGS Keys ___ Fiberglass Tape 1Clip together and turn in to Section Secretary
2Enter observations on Meter Calibration Log Form

This page is purposely blank for duplex printing

Appendix B
Field Sampling Notification Form

This page is purposely blank for duplex printing

Field Sampling Notification Form Name(s): ________________________________________________________ Vehicle description: _______________________ License #: _______________ Cell Phone Number: __________________________ Date/Time of Departure _________________________________ Estimated Date/Time of Return: __________________________ Sampling "Run" or station list: Describe here or attach separate sheet if preferred: Run/Station Location ______________________ _________________________________________ _______________________ _________________________________________ _______________________ _________________________________________ _______________________ _________________________________________ Driving directions: (attach separate sheet if preferred)
See Attached Lodging Plan: Date Hotel/Motel Phone ________ ______________________________________________ _____________ ________ ______________________________________________ _____________ ________ ______________________________________________ _____________ ADD: A Float Plan if you are planning to use a boat. A Contact Person form if you are travelling overnight or returning after hours (except
this is not required when using a float plane if the pilot files a flight plan with the FAA).

This page is purposely blank for duplex printing

Appendix C
Contact Person Designation Form

This page is purposely blank for duplex printing

Contact Person Designation Form Date: _____________________ Sampler's Name: ________________________________ Contact Person: ______________________________ Phone: ___________________ In case of emergency, Contact Person will call: Name: __________________________________ Phone: ____________________ Name: __________________________________ Phone: ____________________ Name: __________________________________ Phone: ____________________

This page is purposely blank for duplex printing

Appendix D
Meter Calibration Log Form

This page is purposely blank for duplex printing

Run: ______ Date: _________ Meter Calibration Log Form
Cond Meter#: Cell Const.
Initial.: Final: Standard: µmhos /cm Meter: µmhos
/cm
pH Meter #: pH Probe #:
Thermistor #: Thermistor: °C Thermometer: °C Correction:
DAY 1 Low Ionic Strength pH Value vs. Temp. °C Slope 92-102% 7 10 mv @ pH 7 ± 30 mv 10 7.01 9.27 mv @ pH 4/10 Difference between mv @ pH7 160-180 15 6.99/7.00 9.23 Response Time < 90 seconds 20 6.98 9.19 Time of Day
true pH
meter
time of day QA Check #1 Recalibrated Y / N QA Check #2 Recalibrated Y / N QA Check #3 Recalibrated Y / N If meter pH is not within 0.10 pH units of true value in pH 7 buffer, then recalibrate & re-read sample. Conductivity Standard: µmhos/cm Meter: µmhos/cm
DAY 2 Cell Const.Init.: Final: Standard: µmhos/cm Meter: µmhos/cm Slope 92-102% mv @ pH 7 ± 30 mv mv @ pH 4/10 Difference between mv @ pH7 160-180 Response Time < 90 seconds Time of Day
true pH
meter
time of day QA Check #1 Recalibrated Y / N QA Check #2 Recalibrated Y / N QA Check #3 Recalibrated Y / N If meter pH is not within 0.10 pH units of true value in pH 7 buffer, then recalibrate & re-read sample. Conductivity Standard: µmhos/cm Meter: µmhos/cm
DAY 3 Cell Const.Init.: Final: Standard: µmhos/cm Meter: µmhos/cm Slope 92-102% mv @ pH 7 ± 30 mv mv @ pH 4/10 Difference between mv @ pH7 160-180 Response Time < 90 seconds Time of Day
true pH
meter
time of day QA Check #1 Recalibrated Y / N QA Check #2 Recalibrated Y / N QA Check #3 Recalibrated Y / N If meter pH is not within 0.10 pH units of true value in pH 7 buffer, then recalibrate & re-read sample. Conductivity Standard: µmhos/cm Meter: µmhos/cm

DAY 4 Cell Const.Init.: Final: Standard: µmhos/cm Meter: µmhos/cm Slope 92-102% mv @ pH 7 ± 30 mv mv @ pH 4/10 Difference between mv @ pH7 160-180 Response Time < 90 seconds Time of Day
true pH
meter
time of day QA Check #1 Recalibrated Y / N QA Check #2 Recalibrated Y / N QA Check #3 Recalibrated Y / N If meter pH is not within 0.10 pH units of true value in pH 7 buffer, then recalibrate & re-read sample. Conductivity Standard: µmhos/cm Meter: µmhos/cm

Appendix F
Field Data Report Form

This page is purposely blank for duplex printing
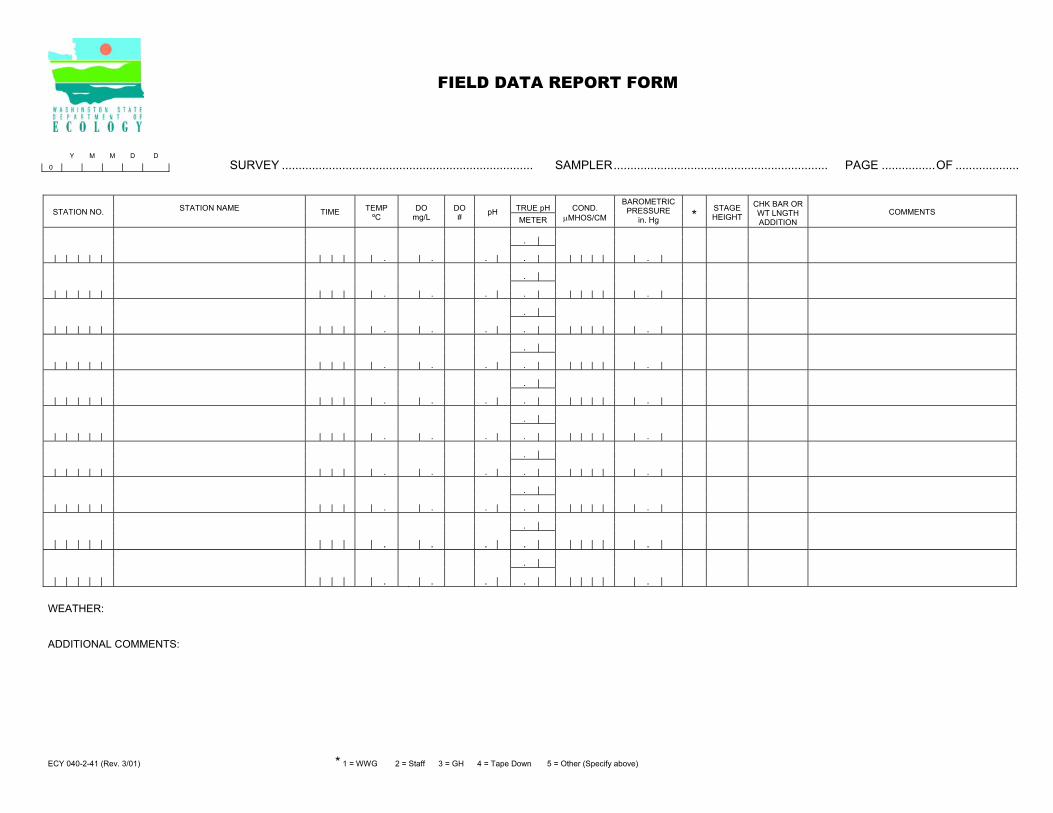
FIELD DATA REPORT FORM
Y M M D D
0
TRUE pH STATION NO. STATION NAME TIME TEMP
ºC DO
mg/L DO # pH
METER COND.
µMHOS/CM
BAROMETRIC PRESSURE
in. Hg * STAGE HEIGHT
CHK BAR OR WT LNGTH ADDITION
COMMENTS
.
. . . . .
.
. . . . .
.
. . . . .
.
. . . . .
.
. . . . .
.
. . . . .
.
. . . . .
.
. . . . .
.
. . . . .
.
. . . . .
WEATHER: ADDITIONAL COMMENTS: ECY 040-2-41 (Rev. 3/01) * 1 = WWG 2 = Staff 3 = GH 4 = Tape Down 5 = Other (Specify above)
SURVEY ........................................................................... SAMPLER................................................................ PAGE ................OF ...................