stratus–fog formation and dissipation: a 6-day case
TRANSCRIPT

Boundary-Layer Meteorol (2012) 143:207–225DOI 10.1007/s10546-012-9699-4
ARTICLE
Stratus–Fog Formation and Dissipation: A 6-Day CaseStudy
Jean-Charles Dupont · Martial Haeffelin ·Alain Protat · Dominique Bouniol · Neda Boyouk ·Yohann Morille
Received: 31 October 2010 / Accepted: 11 January 2012 / Published online: 2 March 2012© The Author(s) 2012. This article is published with open access at Springerlink.com
Abstract A suite of active and passive remote sensing instruments and in-situ sensorsdeployed at the SIRTA Observatory (Instrumented Site for Atmospheric Remote SensingResearch), near Paris, France, for a period of six months (October 2006–March 2007) doc-ument simultaneously radiative, microphysical and dynamic processes driving the continen-tal-fog life cycle. The study focuses on a 6-day period between 23 and 29 December 2006characterized by several stratus-cloud lowering and lifting events and almost 18 h of visibil-ity below 1 km. Conceptual models and different possible scenarios are presented here toexplain the formation, the development and the dissipation phases of three major stratus–fogevents and to quantify the impact of each driving process. For example, slowly evolvinglarge-scale conditions characterized by a slow continuous cloud-base lowering, followed bya rapid transient period conductive to fog formation and dissipation, are observed for cases1 and 3. During this stable period, continuous cloud-top radiative cooling (≈ −160 Wm−2)induces a progressive and slow lowering of the cloud base: larger droplets at cloud top (cloudreflectivity approximately equals to −20 dBZ) induce slow droplet fall to and beyond cloudbase (Doppler velocity ≈ −0.1 m s−1), cooling the sub-cloud layer by evaporation and low-ering the saturation level to 100 m (case 1) or to the surface (cases 2 and 3). Suddenly, asignificant increase in Doppler velocity magnitude ≈ −0.6 m s−1 and of turbulent kineticenergy dissipation rate around 10−3 m2 s−3 occurs at cloud base (case 1). These larger cloud
J.-C. Dupont (B) · M. HaeffelinInstitut Pierre Simon Laplace, Ecole Polytechnique, Palaiseau, Francee-mail: [email protected]
A. ProtatLaboratoire Atmospheres Milieux, Observations Spatiales, Guyancourt, France
D. BouniolGroupe d’étude de l’Atmosphère Metéorologique/Centre National de la Recherche en Météorologie,CNRS/Météo-France, Toulouse, France
N. Boyouk · Y. MorilleLaboratoire de Météorologie Dynamique, Institut Pierre Simon Laplace, Ecole Polytechnique, Palaiseau,France
123
208 J.-C. Dupont et al.
droplets reach the surface leading to fog formation over 1.5 h. The Doppler velocity continuesto increase over the entire cloud depth with a maximum value of around −1 m s−1 due to thecollection of fog droplets by the drizzle drops with high collection efficiency. As particlesbecome larger, they fall to the ground and lead to fog dissipation. Hence, falling particlesplay a major role in both the formation and also in the dissipation of the fog. These rolesco-exist and the balance is driven by the characteristics of the falling particles, such as theconcentration of drizzle drops, the size distribution of drizzle drops compared to fog droplets,Doppler velocity and thermodynamic state close to the surface.
Keywords Fog life cycle · Fog observations · In-cloud processes · Stratus cloud
1 Introduction
The most studied and therefore well-described fog type is that associated with radiative cool-ing, and which can be divided into: radiation fog, high inversion fog, and advection-radiationfog. Radiation fog usually forms near the surface under clear skies in stagnant air in asso-ciation with anticyclonic conditions (Gultepe et al. 2007). The high inversion fog usuallyforms in valleys within a deep moist layer capped by a strong inversion (Holets and Swanson1981). The inversion results from prolonged radiative cooling and subsidence associated witha persistent anticyclone. This type of fog is common during winter in the central valley ofCalifornia (Underwood et al. 2004). Advection-radiation fog is a coastal phenomenon andresults from the radiative cooling of moist air that has been advected over land from theocean or from any large water body during the previous daylight hours (Ryznar 1977). Thesedifferent types of fog have an impact on traffic safety and air quality due to the potentialrapid change in visibility range down to 50 m (Elias et al. 2009). During recent decades, theirimpact has significantly increased related to the increase in air, marine, rail and road traffic.To reduce the hazards in transportation activities, more accurate forecasting and nowcastingof fog events are needed.
The mechanisms of fog formation, development and dissipation are very complex and havebeen extensively studied with a series of numerical simulations and comprehensive observa-tional programs including in-situ measurements (Gultepe et al. 2007). From the numericalmodelling point of view, models usually lack accuracy due to the horizontal (Pagowski et al.2004) and vertical (Tardif 2007) resolutions, and physical parametrizations (Musson-Genon1987; Gultepe et al. 2007). One-dimensional models are computationally more economicaland are useful in some situations (Bergot et al. 2005), whereas detailed three-dimensionalmodels are needed to better understand the physical processes related to turbulence, radiativetransfer in the atmosphere, and aerosol/droplet microphysical properties (Müller et al. 2007).To evaluate the forecasting of the fog life cycle, and also to document the involved physicalprocesses, several field campaigns have been performed over the last few decades (Pilié et al.1975; Fuzzi et al. 1992; Bergot et al. 2008). However, progress in the operational forecastingof fog has been limited due to the numerous factors spanning spatial and temporal scales thatinfluence fog.
An investigation of stratus-lowering processes that lead to the formation of fog was car-ried out by Koracin et al. (2000) using a one-dimensional model and observations. Theirresults show that radiative cooling and large-scale subsidence are an important factor in fogformation. In fact, the radiative cooling at cloud top is the primary mechanism for coolingand mixing the cloud-topped marine layer and the subsidence acts to strengthen the inver-sion above the cloud top and forces lowering of the cloud. In addition, the one-dimensional
123

Stratus–Fog Formation and Dissipation 209
model indicates that the sensible and latent heat fluxes are of secondary importance. Oliveret al. (1978) studied in detail the interactions between radiative and turbulence processes andfound that radiative cooling at fog top is an important process in the fog life cycle. Telfordand Chai (1984) have shown that microphysical processes and entrainment are the two majormechanisms that drive the lowering of stratus to fog whereas Tag and Peak (1996) showedthat the presence of a sufficiently shallow stratus cloud capped by a strong inversion andmoist sub-cloud layer are important factors.
However, the stratus lowering has not been extensively discussed in the literature, par-ticularly for continental surfaces. Thus, in our study, we analyze the relative impact of eachmechanism (cloud-top radiative cooling, surface thermodynamic effects, cloud/drizzle micro-physics) during the stratus–fog life cycle over a continental site.
ParisFog was a 6-month field measurement campaign dedicated to the collection of acomprehensive dataset suitable for the study of multiple processes (thermodynamical, radi-ative, dynamical, microphysical) and their respective importance in driving fog formation,development and dissipation (Bergot et al. 2008; Haeffelin et al. 2010). The various processesinvolved in the fog life cycle may be determined and analyzed through a suite of active andpassive remote sensing instruments and in-situ sensors deployed at the SIRTA Observatory(Haeffelin et al. 2005).
We focus on a 6-day period characterized by persistent low stratus cloud producing threemajor fog periods and a total of 18 h with a visibility lower than 1 km. Section 2 describes theinstruments deployed in routine mode at SIRTA Observatory and the specific measurementsdedicated to documenting fog processes during the ParisFog campaign. Section 3 analyzesthe different processes involved in the lowering and lifting of the stratus cloud for three casestudies, while concluding remarks are given in Sect. 4.
2 Observational Dataset
2.1 The SIRTA Site and the ParisFog Campaign
The SIRTA (Site Instrumental de Recherches par Télédétection Atmosphérique) is a FrenchNational Observatory dedicated to the monitoring of clouds and aerosols occurring in thetroposphere, the dynamics and thermodynamics of the boundary layer, and the turbulentand organized transport of water and energy near the surface. The SIRTA observatory isa mid-latitude site (48.7◦N, 2.2◦E) located in a semi-urban area, on the Saclay plateau25 km south of Paris, and houses active and passive remote sensing instruments since2002 (Haeffelin et al. 2005). The SIRTA strategy is, on the one hand, to monitor con-tinuously an atmospheric column using a core ensemble of instruments and, on the otherhand, to coordinate field campaigns in order to address special scientific questions, suchas processes related to water vapour, the ultraviolet radiation or the aerosol physics andchemistry.
A suite of active and passive remote sensing instruments and in-situ sensors were deployedat the SIRTA site for a 6-month period (October 2006–March 2007). During this field exper-iment called ParisFog (Bergot et al. 2008), profiles of wind speed, turbulence, microphysicaland radiative properties, as well as temperature, humidity, aerosol and fog droplet-size dis-tribution and chemical composition in the surface layer, were monitored (Haeffelin et al.2010). Almost 100 fog and near-fog events were documented in order to provide a datasetwell-suited to study the dynamical, radiative and microphysical processes involved in the foglife cycle (Elias et al. 2009; Boyouk et al. 2011).
123

210 J.-C. Dupont et al.
Table 1 Active and passive remote sensing instruments and the in-situ sensors deployed at the SIRTA sitefor the ParisFog campaign and used for this study
Type of theinstruments
Name Measurements Sampling Uncertainty
Active remotesensing
Vaisala CT25Kceilometer (905 nm)
CBH 30 s 15 m
RASTADopplercloud radar(95 GHz)
CTH In-cloudreflectivity (dBz),Doppler velocity(m s−1) and TKErate (m2 s−3)
5 s 60 m
Passive remotesensing
Surface pyrgeometerand pyranometer
Shortwave andlongwavedownwelling andupwelling fluxes(W m−2)
1 min 4 W m−2 forlongwave 5 W m−2
for shortwave
In-situ sensors Degreanne DF20+visibilimeter
Horizontal visibility(km)
1 min ±15%
Temperature andhumidity sensorslocated at 1, 2, 5, 10and 30 m
Temperature andhumidity at fivelevels above theground
1 min 0.2◦C for temperature2% for relativehumidity
Young sonicanemometers andKH20 sensorlocated at 10 m
Turbulent kineticenergy, latent andsensible heat fluxes
5 min –
RS90 radiosondes Pressure, temperature,humidity, windspeed and direction(0–20 km)
0000 and1200UTC
0.2◦C for temperature2% for relativehumidity
Tapered elementoscillatingmicrobalance
PM2.5 massconcentration(µg m−3)
10 min ±1.5µg m−3
2.2 Instruments
Table 1 describes the active and passive remote sensing instruments and the in-situ sensorsdeployed at the SIRTA site for the ParisFog campaign and used in this study. Variables derivedfrom each instrument and the raw sampling resolutions are also given.
The cloud-base height (CBH) and the cloud-top height are derived from the CT25K ceil-ometer backscatter signal and the RASTA (Radar Aéroporté et Sol pour la Télédétection despropriétés nuAgeuses, Protat et al. 2004) cloud radar, respectively. The ceilometer and radarblind zones are equal to 60 and 180 m, with vertical resolutions of 15 and 60 m, respectively.This zone corresponds to the altitude that lacks information on lidar backscatter or radarreflectivity and Doppler velocity. In this study, all altitudes are considered above the groundlevel (denoted a.g.l.). In-cloud reflectivity, mean Doppler velocity and the turbulent kineticenergy (TKE) dissipation rate (ε) are derived from the RASTA cloud-radar measurements.This radar operates in a vertically-pointing mode and at a frequency of 95 GHz suited forthe characterization of microphysical properties of fog and stratus above 180 m height. Thesensitivity of this radar is about −52 dBZ at 1 km for a temporal resolution of 1 s used for thisstudy, allowing for most fog and all stratus events above 180 m to be detected. The Dopplervelocity measurement is the sum of vertical air motions and terminal fall speed of the droplets.
123

Stratus–Fog Formation and Dissipation 211
It can be reasonably assumed that it is a good proxy for vertical air motions in fog, giventhat fog droplets are very small and therefore fall at a slow terminal speed when compared tothe vertical air motions. The TKE dissipation rate is derived from the temporal variance ofthe mean Doppler velocity (Bouniol et al. 2003). The method assumes that the length scalesof the turbulent eddies observed by the radar are in the inertial subrange of the turbulencespectrum and that turbulence, rather than fluctuations in particle terminal velocities, is thedominant contribution to this variance for the time scale of interest (O’Connor et al. 2005;Shupe et al. 2007).
The SIRTA radiative flux station (Haeffelin et al. 2005) is a Baseline Surface RadiationNetwork station (Ohmura et al. 1998) and shortwave and longwave downwelling irradiancesare used to derive the surface radiative budget. An average surface albedo of 0.22 ± 0.02 andan average ground emissivity of 0.98 ± 0.01 are derived from the 30-m mast upwards anddownwards measurements. A Degreanne DF20+ visibilimeter was operated near the ground(4-m height). The instrument provided horizontal visibility range and particle extinction at550 nm, with a 10–25% uncertainty. The vertical profiles of thermodynamic variables aredocumented using a combined analysis of the output of in-situ sensors. The temperatureand humidity non-aspirated sensors located between 1 and 30 m height on an instrumentedmast provided continuous measurements (1-min temporal resolution). Measurements wereextended vertically by radiosonde profiles performed routinely at 0000 and 1200 UTC 15km west of SIRTA as part of the Météo-France national network.
2.3 Overview of the 6-Day Period
Figure 1 presents the temporal evolution of reflectivity profiles during the 6-day stratus cloudevent observed by the RASTA cloud radar. The CBH is derived from the ceilometer usingthe Morille et al. (2007) algorithm, while the cloud-top height (CTH) corresponds to themaximum altitude where the radar signal was detected above the noise level. It may notcorrespond exactly to the true cloud top, but it can be considered as a good proxy for cloudtop. The stratus cloud formed on 23 December at 1200 UTC and dissipated on 29 Decemberat 0000 UTC. During this 6-day period the CBH and CTH were observed between zeroand 400 m and between 300 and 880 m, respectively. The mean CBH and CTH over theperiod under study are 150 and 550 m, respectively. The minimum CBH measured by theceilometer is 60 and 180 m for the radar (the first useful range gate of these instruments).
Fig. 1 Radar reflectivity, cloud base and cloud-top altitude between 23 and 29 December 2009. The colourbar corresponds to the fast Fourier transform (FFT) reflectivity derived from the RASTA radar, the thin blacksolid line to the CBH and the black square marker to the cloud-top height during the 6-day period
123

212 J.-C. Dupont et al.
The backscatter ceilometer signal is proportional to the second power of the droplet diametersand the radar reflectivity to the sixth power. Hence, the largest droplets with a low concentra-tion are likely to be detected by the radar and not detected by the ceilometer. It correspondsto times where the ceilometer cloud base is higher than the radar cloud base in our case study(i.e. 24 December at 1200 UTC and 26 December at 1600 UTC). The period of interest ischaracterized by a 6-day anticyclonic period, with a near-constant surface pressure between1,012 and 1,016 hPa. We assume that the influence of the mesoscale dynamical processes islimited and does not modify significantly the much faster in-cloud and surface processes.
Table 2 presents the near-surface and the in-cloud properties observed during the fog,near-fog and clear events characterizing the 6-day low stratus period; fog events correspondto a horizontal visibility (noted vis) lower than 1 km, the near-fog event to 1 km < vis < 5 kmand clear event to vis > 5 km. We consider that we have a low visibility event if the durationfor vis < 1,000 m is greater than 50 min within 60 min of measurement. In fact, the Tardif andRasmussen (2007) methodology has been used with the proper adjustment of the constantsto account for the availability of observations at higher frequency. The temporal coverage,during this 6-day period, for the fog, the near-fog and the clear events is 12, 53 and 25%,respectively, corresponding to an average visibility of 514, 3268, 6551 m for the three types ofevents. Three main fog events are identified during the life cycle of the stratus: 24 Decemberfrom 0410 to 0530, 25 December from 1910 UTC to 26 December at 0320 UTC and 28December from 0200 to 1000 UTC. The average air temperature for the fog events is −1.3◦Ci.e almost 2◦C lower than the non-fog events. During this 6-day period, the fog events occurat nighttime, which corresponded to cold periods with a very high relative humidity: about100% for the fog period and 91% for the clear periods. The 10-m horizontal wind speed is
Table 2 Average near-surface and in-cloud properties for the fog, near-fog and clear events calculated duringthe 6-day period
Fog (i.e. vis < 1 km) Near-fog (i.e. 1 km < vis < 5 km) Clear (i.e. vis > 5 km)
Duration 17 h 40 min 75 h 30 min 50 h 50 min
Near surface properties
2-m temperature (◦C) −1.3 0.2 0.5
2-m relativehumidity (%)
100 95.5 91.4
10-m wind speed (m s−1) 1.6 1.4 1.8
10-m wind direction (◦) 116 118 156
10-m TKE (m2 s−2) 0.5 0.6 0.7
Horizontal visibility (m) 514 3,268 6,552
PM2.5 mass concentration(µg m−3)
12 22 24
In-cloud properties
Cloud-base altitude (m a.g.l.) <60 158 192
Cloud-top altitude (m a.g.l.) 250 512 620
Average reflectivity (dBZ) −23.0 −28.1 −25.5
Average Dopplervelocity (m s−1)
−0.17 −0.14 −0.32
Average TKEdissipation rate(m2 s−3)
7 × 10⁻⁴ 16 × 10−4 19 × 10−4
123
Stratus–Fog Formation and Dissipation 213
small and very similar for all the events (≈1.5 m s−1). Large differences in reflectivity, Dopp-ler velocity and TKE dissipation rate are found between fog, near-fog and clear events, andthe values shown in Table 2 correspond to the vertical average between cloud base and cloudtop. Doppler velocity (vertical air motion + droplet terminal fall velocity) for clear events(−0.32 m s−1) is twice as large as during fog events (−0.17 m s−1). Hence the presence oflarger droplets tends to increase the height of the stratus cloud layer (see explanation in thenext part). The opposite tendency is observed for the TKE dissipation rate; TKE dissipationrate inside the stratus cloud for the clear periods is three times smaller than for fog events(ε=7×10⁻⁴ and 19×10−4 m2 s−3, respectively). The increase in evaporation at cloud baseinduces a decoupling between the surface and cloud and therefore the dissipation of the fog.A more detailed description of the role of drizzle evaporation will be provided in a latersection.
This 6-day period is characterized by an inversion height ranging from 400 to 800 mdepending on the stratus top altitude. On 23 December 2006 at 1200 UTC (i.e. just beforethe formation of the stratus cloud) the inversion height is 420 m a.g.l. with a lapse rate of−8.5 K km−1 observed up to the inversion level. Such a negative lapse rate is a necessarycondition for the existence of the stratus fog (Oliver et al. 1978). During this entire stratuscloud event, the lapse rate inside the cloud was ranging from −6 to −9 K km−1. The vari-ations in temperature and relative humidity at cloud top inside a very thin transition regionof around 40 m reach 10◦C and 50%, respectively. Infrared radiative cooling related to theliquid droplet emissivity is responsible for cooling at cloud-top height and hence the wetadiabatic cooling inside the stratus cloud layer.
The PM2.5 mass concentration is monitored by a tapered element oscillating microbal-ance. The PM2.5 mass concentration ranges from 5 to 35µg m−3 during this 6-day period,with PM2.5 and PM10 very well correlated (correlation coefficient of 0.91). We do not notesignificant correlation with the CBH and the PM2.5 (correlation coefficient of 0.51). How-ever, the three minimum values of PM2.5 are found at the same time as the three major fogevents (see Table 2). The average PM2.5 mass concentration for fog, near fog and clear eventsis 12, 22 and 24µg m−3, respectively, and appears to indicate that the PM2.5 is activatedduring a fog event and hence the droplets are not included in the PM2.5 mass concentration.The PM2.5 mass concentration experiences a decrease from 25 to 5µg m−3 between the24 and 26 December 2006 phases with a progressive but constant decrease of the visibility(decreasing from 10 km to 300 m). On 28 December 2006, when the wind direction changes,the visibility follows the same trend during this time. On 27 December between 1500 and1700 UTC, the wind direction and the wind speed range from westerly to southerly andfrom 3 to 1 m s−1, respectively. This non-polluted air mass does not affect the simultaneousdecrease of the visibility and PM2.5 mass concentration.
3 Stratus-Fog Formation and Dissipation
3.1 Coupling with the Surface Temperature and Humidity
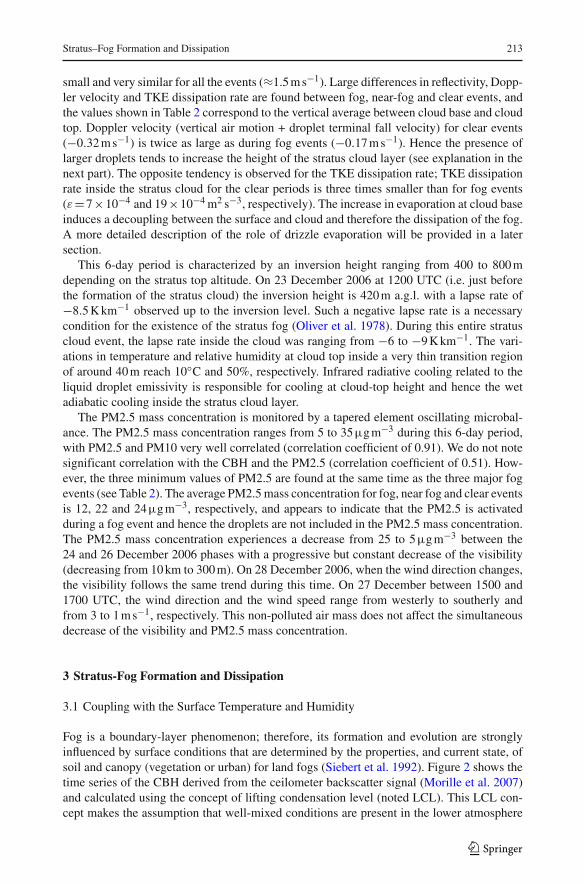
Fog is a boundary-layer phenomenon; therefore, its formation and evolution are stronglyinfluenced by surface conditions that are determined by the properties, and current state, ofsoil and canopy (vegetation or urban) for land fogs (Siebert et al. 1992). Figure 2 shows thetime series of the CBH derived from the ceilometer backscatter signal (Morille et al. 2007)and calculated using the concept of lifting condensation level (noted LCL). This LCL con-cept makes the assumption that well-mixed conditions are present in the lower atmosphere
123
214 J.-C. Dupont et al.
and that the vertical profile of water vapour mixing ratio is constant until cloud base wheresaturated conditions are reached. In this study, CBH measurements and LCL agree wellexcept when in-cloud dynamics change significantly. This will be explained in more detail inSect. 3.2. A comparison between LCL and ceilometer CBH allows us to calculate the slopeof this relationship, reaching 0.91 with an intercept around −62m and a root-mean-squareerror <37 m for this dataset. For this calculation, the period when the CBH is inside the blindzone of the ceilometer is not considered (i.e. fog event). The bottom panel in Fig. 2 showsthe absolute difference between modelled and measured CBH and the horizontal visibility.A possible source of discrepancy between the LCL and measured CBH could be explainedby a ceilometer retrieval bias of 20–30 m. The CBH derived from the ceilometer algorithm isfound to be 20–30 m higher than the “true CBH” that can be derived from visual inspection.Another source of uncertainty could be the temperature and humidity accounted for in thecalculation: we consider here the 2-m properties but an average temperature and humiditybetween the surface and 30 m a.g.l. would be more representative of surface parcels. Below,we consider that we have a good agreement when the difference between the measuredcloud-base altitude and the LCL is < 60 m.
The two main important lifting-stratus periods between 24 December 0600 and 2200UTC and between 26 December 0300 and 2400 UTC are very well documented by the LCL(Fig. 2). This agreement shows the role of the coupling between temperature and humid-ity close to the ground and the altitude of the saturated parcel. For example, the fog eventbetween 25 December 1900 UTC and 26 December 0300 UTC is very well reproduced bythe LCL concept. This case will be detailed in a following section. However, during this6-day period important discrepancies between the CBH and LCL are also observed: (1) a2-h temporal shift on 24 December at 0600 UTC and on 28 December at 0300 UTC dueto the effects of in-cloud dynamics occurring during fog dissipation, (2) a 250-m differ-ence between measured CBH and LCL due to the effect of higher altitude clouds on in-cloud dynamics. These specific periods are noted in Fig. 2 and are discussed in more detailbelow.
Fig. 2 Time series of the measured and modelled CBH for the 6-day stratus cloud event at the top panel.Absolute difference between modelled and measured CBH in grey line and horizontal visibility in black linein bottom panel
123

Stratus–Fog Formation and Dissipation 215
3.2 Effects of In-Cloud Dynamics During Case Study 1
The reflectivity measured by the RASTA cloud radar is mainly sensitive to droplet size( Z ∝ D6 where D is the droplet diameter), but is also sensitive to droplet concentration(Battan 1973). The vertical Doppler velocity corresponds to the sum of vertical droplet veloc-ity and vertical air velocity (noted here as positive for upward velocity). In this study, weuse the Doppler velocity as a proxy of vertical droplet velocity assuming that the mean ver-tical air velocity is negligible. The TKE dissipation rate is correlated to the turbulent mixingwithin the cloud layer (Bouniol et al. 2003). Figure 3 shows in-cloud properties provided bythe RASTA cloud radar between 23 December 1200 and 24 December 1200 UTC, wherewe add the cloud-base altitude derived from the ceilometer (solid line) and from the LCLcalculation (dashed line). The two large vertical dash-dot lines correspond to the fog periodcharacterized by a horizontal visibility below 1000 m (minimum of 240 m at 0430 UTC).
The fog period commences at 0400 UTC and ends at 0530 UTC; however, the history ofthis stratus fog covers a much longer time span. In fact, the favourable conditions began at2000 UTC when the stratus forms at 200 m above ground level. Over seven hours (2000–0300UTC), cloud-top radiative cooling induces a progressive and slow lowering of the cloud-baseheight. Cloud-top infrared cooling induces droplet growth at cloud top (Z ≈ −22 dBZ atcloud top and −30 dBZ at cloud base) with a relatively low vertical Doppler velocity near−0.1 m s−1, constant between cloud base and cloud top. Droplets fall slowly to and beyondcloud base leading to cooling of the sub-cloud layer by evaporation and to lowering thesaturation level (LCL). The stratus base lowering from 200 to 100 m in seven hours appearsto be a slow evolving process. The 2-m relative humidity increases from 90 to 98% and the2-m temperature increases from 1.2 to 2◦C. The near-surface moistening and warming maybe the result of competing processes between evaporating cooling/moistening and radiativewarming. The good agreement between the LCL and CBH measured by the ceilometer isan indicator of strong coupling between the surface and cloud base. This coupling could beexplained by evaporation at cloud base, which cools the top of the sub-cloud layer. Negativebuoyancy of cooled air destabilizes the sub-cloud layer and triggers turbulent mixing andhence coupling between surface and cloud base.
Between 0300 and 0600 UTC, we observe a radical change in in-cloud reflectivity, Dopp-ler velocity and TKE dissipation rate. This transient period can be divided into two parts: thefirst one leading to fog formation and persistence of fog conditions during 90 min and thesecond leading to rapid fog dissipation.
Between 0300 and 0400, the in-cloud Doppler velocity is drastically modified with a sig-nificant increase at cloud base: Doppler velocity increases from −0.1 to −0.7 m s−1 and thereflectivity becomes more homogeneous between cloud base and cloud top (Z ≈ −22 dBZ).The fall of the larger droplets induces an increase in Doppler velocity. During the sameperiod, the TKE dissipation rate ε at cloud base increases from 10−4 to 10−3 m2 s−3. Thistransient step is characterized by heterogeneous turbulence (ε ranging from 10−3 at cloudbase, 10−4 in mid-regions and 5×10⁻³ m2 s−3 at cloud top). After 0400 UTC, the dropletsize increases at cloud base (Z ≈ −20 dBZ), Doppler velocity reaches −0.7 m s−1 at 180 ma.g.l. while visibility decreases below 1 km at the surface.
During the fog event, i.e between 0400 and 0530 UTC, the reflectivity Z and the Dopplervelocity reach −5 dBZ and −1.1 m s−1 at 180 m a.g.l., respectively. This maximum neg-ative Doppler velocity around −1 m s−1 is a typical value for the fall speed of a drizzledrop of 0.25 mm diameter, assuming it is spherical (i.e a volume of 0.008 mm3). The largerdroplets fall to the ground with a quasi-homogeneous velocity within the cloud (averageDoppler velocity around −0.6 m s−1) while saturated conditions prevail all the way down to
123

216 J.-C. Dupont et al.
Fig. 3 The time series corresponds to the period between 23 December 1200 UTC and 24 December 1200UTC. The graphs a–c are the radar reflectivity, the Doppler velocity and the TKE dissipation rate, respectively.Solid line is the cloud base detected by the CT25K ceilometer and the dashed line is the LCL. The graphsd–f correspond to the horizontal visibility, surface temperature and humidity, and 10-m wind speed and 10-mTKE
the surface. These drizzle drops contribute themselves to lowering the visibility below thefog threshold. This phase is characterized by a relatively low turbulence intensity inside thefog with ε ≈ 5×10⁻⁴ m2 s−3. This could be explained by the more homogeneous Dopplervelocity throughout the cloud.
At 0530 UTC, Z reaches a maximum and is almost constant inside the cloud (betweensurface and 750 m a.g.l.). Negative Doppler velocities near −1 m s−1 appear from surface tocloud top. As droplet size and number reach a maximum, the cloud base begins to lift and
123

Stratus–Fog Formation and Dissipation 217
the fog starts to dissipate. A possible scenario is that the persistent radiative cooling at cloudtop induces continuous droplet growth and intensification of drizzle leading to increasedcollection of the smaller fog droplets by the drizzle drops and hence dissipation of the fogby removal of liquid water content. The typical size of a drizzle drop is 0.25 mm while themaximum of the fog droplet distribution is around 15µm (Elias et al. 2009) which inducesa collection efficiency around 90% (Hall 1980; Wood et al. 2009). Hence, the dissipation ofthe fog could be due to the strong collection effect close to the surface leading to the fall ofthe major part of the largest droplets to the ground.
At 0600 UTC, the cloud-base altitude provided by the CT25K ceilometer is 120 m higherthan that from the radar, which is consistent with drizzle particles below cloud base. The sur-face temperature decreases from 1.5 to 1.0◦C between 0530 and 0630 UTC and the relativehumidity decreases from 100 to 97%. It is likely that the CBH rises because the cloud loseswater though precipitation of large particles while surface conditions remain unchanged,resulting in a constant LCL.
Cloud-base height levels off near 200 m a.g.l. at 0630 UTC, while the LCL levels offbelow 200 m a.g.l. after 1000 UTC, 2 h after sunrise. During that time frame, the stratuscloud is characterized by temporally varying reflectivity with a negative vertical profile ofreflectivity (low reflectivity at cloud top), negative Doppler velocity throughout the cloud,except at cloud top and a significant TKE dissipation rate throughout the cloud. This periodis also characterized by drizzle below cloud base, evidenced by a ceilometer CBH locatedhigher than the lowest reflectivity signal. It is thus likely that evaporation of drizzle at cloudbase continues to occur throughout this period, hence continuously cooling the sub-cloudlayer from the top. Positive surface heat fluxes and negative buoyancy at the top result in awell mixed sub-cloud layer.
For this case study, the stratus to fog transition is presented as the following concep-tual model: a steady-state period (seven hours) characterized by a slow continuous cloud-base lowering followed by a rapid transient period conducting to fog formation and dissi-pation (two hours). During the 7-h period, continuous cloud-top radiative cooling (around−160 W m−2) induces a progressive and slow lowering of the CBH: larger droplets at cloudtop (Z ≈ −20 dBZ) induce slow droplet fall to and beyond cloud base (Doppler velocity−0.1 m s−1) cooling the sub-cloud layer by evaporation and lowering the saturation level pro-gressively to 100 m. The moistening (+8% for relative humidity) and the warming (+0.8◦Cfor temperature) close to the surface could be the result of competing radiative and evaporat-ing processes. Suddenly, a significant increase of Doppler velocity (velocity≈−0.6 m s−1)and of TKE dissipation rate (ε ≈ 10−3m2s−3) occurs at cloud base. These turbulent eddies actinside the cloud to mix the properties across the whole layer between cloud base and cloud topenlarging droplet size at cloud base by collection processes. These larger cloud droplets reachthe surface leading to fog formation over 1.5 h. The Doppler velocity continues to increaseover the entire cloud depth with a maximum near the surface (≈ −1 m s−1) due to collectionof fog droplets by the drizzle drops with high collection efficiency (around 90%) enlargingthe droplet size. As particles become larger, they fall to the ground leading to fog dissipation.Hence, falling particles play a major role in both the formation and dissipation of the fog.These roles co-exist and the balance is driven by the characteristics of the falling particlessuch as the concentration of drizzle drops (decoupling or not between cloud layer and sur-face), size distribution of drizzle drops compared to fog droplets (collection of the fog dropletor not), Doppler velocity (deposit on the ground or not) and thermodynamic state close to thesurface (warming of the atmosphere close to the surface or not). Table 3 summarizes typicalvalues of in-cloud properties, radiative properties and near-surface thermodynamic propertiesobserved during stratus-lowering, fog and stratus-rising stages of stratus-to-fog transitions.
123

218 J.-C. Dupont et al.
Table 3 In-cloud properties (case 1 and case 3 in italic), radiative properties and near-surface thermodynamicproperties leading to the stratus lowering, the fog formation and the stratus lifting
Stratus lowering → Fog formation → Stratus lifting
In-cloud properties
Droplet size and conc. −25 dBZ (+10 dBZ km−1) −20 dBZ (stable) −5 dBZ (−20 dBZ km−1)
Radar reflectivity (Z) −27 dBZ (+5 dBZ km−1) −23 dBZ (stable) −15 dBZ (−10 dBZ km−1)
Vertical velocity (m s−1) −0.2 −0.1 −0.8
Doppler velocity (DV)
In-cloud turbulence(m2 s−3)
1 × 10⁻⁴ 5 × 10⁻⁴ 10 × 10−4
TKE dissipation rate (ε)
Radiative properties (W m−2)
Infrared cooling −160 −130
Near-surface thermodynamic properties
Horizontal wind speed (m s−1) 1 3
TKE (m2 s−2) 0.75 0.25 1.75
Vertical wind speed (m s−1) −0.1 +0.2
Temperature (◦C) 1.8 1.4 1.2
Humidity (%) 94–99 100 92–99
These values correspond to the key thresholds favourable for each different process
3.3 Effects of Surface Dynamics During Case Study 2
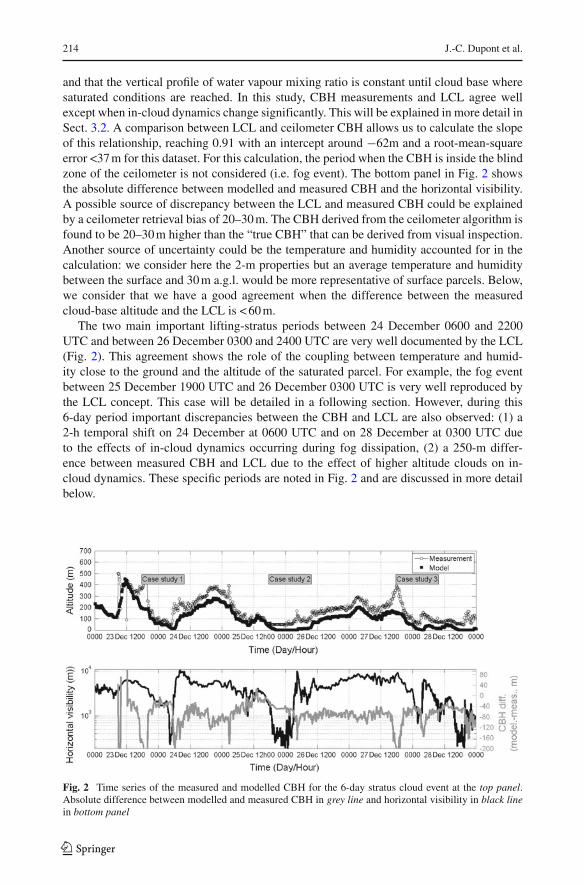
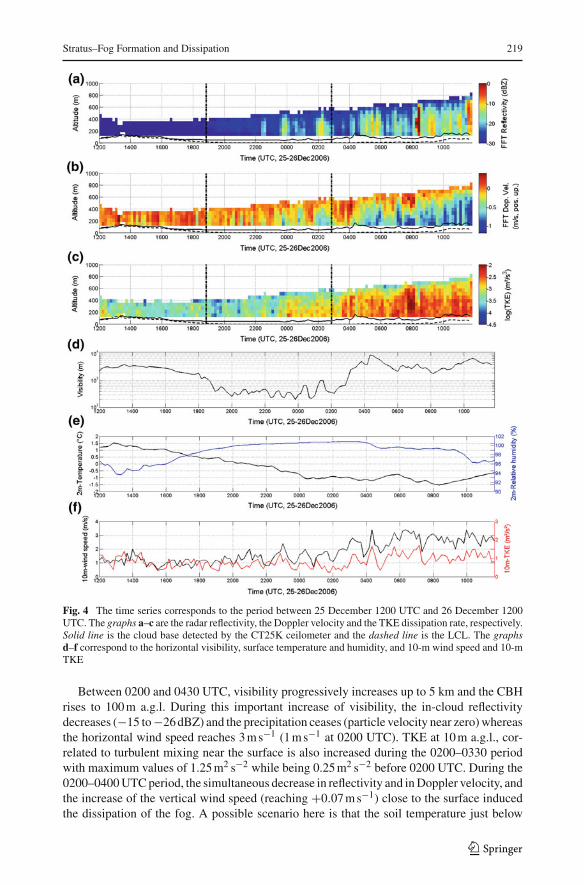
A deep and long-lived fog event occurred between 25 December at 1900 and 26 December at0300 UTC (Fig. 4). The lowest visibility is 200 m and appears at 0100 UTC associated witha weak subsidence event with a vertical wind speed around −0.01 m s−1. This fog event isassociated with a continuous decrease (increase) in temperature (relative humidity) from 0.5to −1◦C (94–100%) between 1300 and 0400 UTC. The horizontal wind speed is relativelylow (ranging from 0.5 to 2.5 m s−1) and the stratus-cloud thickness is less than 200 m.
The changes in visibility between 0000 and 0200 UTC ranging from 200 m to 1 kmare temporally correlated with surface dynamics, enhanced reflectivity and vertical veloci-ties. Horizontal wind-speed fluctuations close to the ground range between 0.8 and 2 m s−1,Doppler velocity inside the cloud from −0.1 to −0.5 m s−1 and reflectivity from −30 to−18 dBZ. Three visibility minima appear at 0000, 0045 and 0200 UTC and two maximaat 0030 and 0115 UTC. The minimum of visibility is phased with a minimum of the TKE(horizontal wind speed) at 10 m a.g.l. of 0.25 m2 s−2 (0.8 m s−1) and with a peak of cloudreflectivity and Doppler velocity reaching −15 dBZ and −0.5 m s−1, respectively. A pos-sible explanation is that when the horizontal wind speed is low (surface wind speed <
1 m s−1), radiative cooling at cloud top leads to droplet growth and increased droplet fall veloc-ity. Larger droplets and drizzle drops combined with high droplet concentration (Z around−15 dBZ at 200 m) tend to lower the visibility. Conversely, a larger horizontal wind speed(≈2 m s−1) inside the fog leads to a uniform vertical profile of reflectivity (Z around −25 dBZat 200 m) and a uniform Doppler velocity near zero within the entire fog layer. This is synon-ymous with a low concentration of smaller droplets resulting in higher visibility close to thesurface.
123
Stratus–Fog Formation and Dissipation 219
Fig. 4 The time series corresponds to the period between 25 December 1200 UTC and 26 December 1200UTC. The graphs a–c are the radar reflectivity, the Doppler velocity and the TKE dissipation rate, respectively.Solid line is the cloud base detected by the CT25K ceilometer and the dashed line is the LCL. The graphsd–f correspond to the horizontal visibility, surface temperature and humidity, and 10-m wind speed and 10-mTKE
Between 0200 and 0430 UTC, visibility progressively increases up to 5 km and the CBHrises to 100 m a.g.l. During this important increase of visibility, the in-cloud reflectivitydecreases (−15 to −26 dBZ) and the precipitation ceases (particle velocity near zero) whereasthe horizontal wind speed reaches 3 m s−1 (1 m s−1 at 0200 UTC). TKE at 10 m a.g.l., cor-related to turbulent mixing near the surface is also increased during the 0200–0330 periodwith maximum values of 1.25 m2 s−2 while being 0.25 m2 s−2 before 0200 UTC. During the0200–0400 UTC period, the simultaneous decrease in reflectivity and in Doppler velocity, andthe increase of the vertical wind speed (reaching +0.07 m s−1) close to the surface inducedthe dissipation of the fog. A possible scenario here is that the soil temperature just below
123

220 J.-C. Dupont et al.
the ground surface (−50 mm) is +3◦C while the 2-m air temperature is around −1◦C. Thisimplies a positive upward heat flux leading to the evaporation of fog droplets, increased sur-face turbulence with a constant surface temperature. The cloud base begins to rise due to thenear-surface turbulence that induces mixing and evaporation of the droplets in the sub-cloudlayer. A means of better understanding these different aspects would be to document the verti-cal profile of dynamical properties between the surface and the top of the boundary layer—seebelow.
3.4 Effects of Radiative Cooling, In-Cloud and Surface Dynamics During Case Study 3
On 27 December, a persistent high-altitude cloud around 7.2 km high is found between1100 and 1530 UTC (not shown). The cloud-top longwave radiative budget is defined asthe difference between the downwelling and the upwelling longwave fluxes at the cloud top,LWdn and LWup respectively. Here LWdn corresponds to the sum of the longwave irradianceemitted by the high altitude cloud and the longwave irradiance emitted by the clear sky. Thefirst is computed from Stephan–Boltzmann’s law (Angström 1918) on the basis of the cirruscloud infrared emissivity and thermodynamic temperature. The cloud infrared emissivitycan be derived from the cloud optical thickness on the basis of a parametric relationship(Rossow et al. 1996). The cloud thermodynamic temperature is derived by combining theradiosonde and the radar measurements that provide temperature profiles and cloud-basealtitude. The temperatures are interpolated between radiosoundings at the time and alti-tude of radar observations. A CALIPSO (cloud-aerosol lidar and infrared pathfinder satelliteobservations) overpass (Winker et al. 2009) over the SIRTA site at the same time providescollocated measurements of the cloud optical thickness for this high altitude cloud. The opti-cal thickness is relatively constant at 0.2 and the derived infrared emissivity γ is about 0.16(Rossow et al. 1996). The longwave irradiance emitted by the cirrus cloud is calculated fromγ σ T 4 (where T is the cirrus radiative temperature and σ is Stefan–Boltzmann’s constant,σ = 5.67 × 10⁻⁸ W m−2 K−4), and ranges between 10 to 35 W m−2.The same relation isapplied for the clear atmosphere longwave flux with γ representing the clear-sky emissivityof the atmosphere. It can be expressed as a function of cloud-top air temperature and watervapour pressure (Brutsaert 1975; Dupont et al. 2007). Finally, LWup at cloud-top is derivedconsidering that the stratus cloud has an emissivity near unity with a cloud-top temperaturecomputed using cloud-top altitude and radiosonde temperature profile. The longwave radi-ative budget (downwelling minus upwelling fluxes) at cloud top ranges between −162 to−125 W m−2.
Between 1100 and 1530 UTC, the net radiative cooling at cloud top is reduced by 30 W m−2
compared to the value before 1100 UTC. This period (1100–1530 UTC) is characterized bylow radar reflectivity −32 dBZ, instead of 2 dBZ before 1100 UTC (Fig. 5). Similarly thevertical Doppler velocity becomes close to zero during the 1100–1530 UTC period, whilebeing −0.3 m s−1 on average before 1100 UTC. The TKE dissipation rate is also reduced withaverage values of 6×10⁻⁴, and 24×10−4 m2 s−3 before 1100 UTC. During the 1100–1530UTC period, the lidar-based and radar-based CBH agree, which is evidence that there wasno drizzle below cloud base at that time; CBH rises slightly during these 4 h. The LCL isconsistent with the CBH evidence of coupling between the surface and cloud layer, a reason-able assumption in daytime and under moderate winds (TKE near 1 m2 s−2 and wind speedaround 3 m s−1).
After 1530 UTC, the high altitude cloud disappears and the stronger radiative coolingreaches −160 W m−2. Between 1530 and 2000 UTC, the mean reflectivity increases from
123

Stratus–Fog Formation and Dissipation 221
Fig. 5 The time series corresponds to the period between 27 December 1200 UTC and 28 December 1200UTC. The graphs a–c are the radar reflectivity, the Doppler velocity and the TKE dissipation rate, respectively.Solid line is the cloud base detected by the CT25K ceilometer and the dashed line is the LCL. The graphsd–f correspond to the horizontal visibility, surface temperature and humidity, and 10-m wind speed and 10-mTKE
−32 to −18 dBZ and the mean Doppler velocity increased from zero to −0.3 m s−1. Thevertical gradient of reflectivity is positive with Z = −13 dBZ at cloud top and Z = −22 dBZat cloud base. The vertical gradient of the Doppler velocity is positive with Doppler veloc-ity =−0.1 m s−1 at cloud top and Doppler velocity =−0.5 m s−1 at cloud base. Significantdrizzle appears below cloud base, as evidenced by the ceilometer CBH 240 m above thelowest radar return. Drizzle could be due to the collection/coalescence process (strong col-lection efficiency as shown previously) and the increase of the cloud-top height of 60 m could
123

222 J.-C. Dupont et al.
be related to the condensation process (small droplets and high radiative cooling favourcondensation). From 1530 to 2000 UTC, the surface temperature increases from −0.7 to−0.3◦C and the relative humidity is stable at 92%, suggesting the moistening of the sub-cloud layer.
Between 2000 and 0200 UTC, a slow evolving period occurs similar to the conditionsencountered in case 1 described in Sect. 3.2. At 2000 UTC, the Doppler velocity and thereflectivity decrease from −0.3 to −0.1 m s−1 and from −17 to −21 dBZ, respectively. Dopp-ler velocity, droplet size, and intensity of drizzle at cloud base decrease. Similarly to case 1,the droplets fall slowly to and beyond cloud base cooling the sub-cloud layer by evaporation.Negative buoyancy in the sub-cloud layer maintains coupling with the surface, as evidencedby the consistency between LCL and CBH lowering, until fog conditions appear at 0130UTC.
However, we note some differences between case 3 and to case 1. Firstly, between 2130and 0200 UTC, we observe a significant gradient of the TKE dissipation rate between cloudbase (ε ≈ 2 × 10⁻⁴m2 s−3) and cloud top (ε ≈ 8 × 10⁻⁴ m2 s−3) whereas droplet ver-tical velocity and reflectivity are low and stable in the vertical. A possible scenario is thatthe stable in-cloud dynamics is reinforced within 200 m of cloud base by the evaporativeprocesses tending to stabilize the cloud base. This halts the lowering of cloud layer (cloudbase stable at 140 m between 2200 and 0000 UTC) and induces a constant temperatureand humidity close to the surface which may induce a delay in the fog formation. Sec-ondly, the timing for the fog formation is different relative to the increase of reflectivityand Doppler velocity. In case 1, the increase of reflectivity and Doppler velocity is phasedwith the fog formation whereas here a 1-h delay is noted. We may explain this contrast withthe relative humidity difference close to the surface some hours before fog formation: incase 1 the relative humidity is 95% two hours before the fog formation compared to 98%for case 3. In case 1, significant drizzle is necessary to bring cloud base to the ground,whereas in case 3 the slow and progressive lowering of cloud base is sufficient to reachthe fog.
Between 0200 and 0500 UTC, the in-cloud reflectivity increases progressively startingfrom cloud base to reach a maximum of −10 dBZ relatively stable along the vertical at 0345UTC. At 0300, the Doppler velocity suddenly increases from zero to −0.5 m s−1: the fallof the larger droplets induces an increase in Doppler velocity and an increase in ε from5 × 10−4 to 10−3m2s−3. As with case 1, fog dissipation at 0300 UTC could be explainedby an intensification of drizzle throughout the cloud (surface to 600 m a.g.l.) increasing thecollection of fog droplets by large drizzle drops. The larger drops fall to the ground and thecloud base rises.
The period from 0500 to 1100 UTC is characterized by scenarios already encounteredin case study 2. From 0500 to 0700 UTC, under moderate horizontal wind, reflectivity islow (Z ≈ −25 dBZ), the Doppler velocity is moderate (≈ −0.5 m s−1), surface and cloudlayer are coupled, and the CBH subsides progressively. At 0915 UTC, a sudden increase ofreflectivity (Z ≈ −7 dBZ) and Doppler velocity (≈ −0.4 m s−1) is phased with a visibilityfall leading to fog conditions after 1 hour. This visibility around 900 m could be explainedby an enhanced concentration of drizzle drops phased with a constant and low surface windspeed around 1 m s−1. Two minutes later, a peak in in-cloud reflectivity at −5 dBZ occursphased with a reduction in TKE ranging from 1 to 0.5 m2 s−2. Low-visibility conditions lastonly 30 min as the collection of smaller fog droplets by larger settling drizzle drops falls tothe ground.
123

Stratus–Fog Formation and Dissipation 223
4 Conclusion
The ParisFog field campaign at the SIRTA instrumented site and more specifically the 6-dayperiod studied between the 23 and 29 December 2006 allows us to study different processesdriving the stratus-to-fog transition. A suite of active, passive and in-situ measurements doc-ument simultaneously the dynamical, radiative and microphysical processes responsible forthe formation and dissipation of three different stratus–fog events.
The 23–29 December period shows multiple transitions between stratus cloud and foglayers based on near-surface horizontal visibility, CBH derived from ceilometer and cloudradar vertical profiles of reflectivity, Doppler velocity and TKE dissipation rate. The periodis characterized by multiple events of cloud-base lowering followed by cloud-base liftingand by stratus–fog layers 200–1,000 m thick. Complex processes combining effects of in-cloud properties, surface coupling and infrared cooling at cloud top have been identified.Table 3 shows the threshold values of these effects conducive to fog formation and liftinginto a stratus layer. These values are averaged during the 6-day period for each stage, whichcorresponds to sub-sampling of stratus-lowering, fog formation and stratus-lifting periods.
The first major result of this study is the evidence that falling cloud droplets and drizzledrops affect both the formation and dissipation of stratus fog. In conditions of continuousinfrared cooling at cloud top (near −160 W m−2 in our case), the cloud-topped boundarylayer is destabilized leading to turbulent eddies. This in-cloud dynamics depends on the sizedistribution of cloud droplets and drizzle drops. In the case of moderate reflectivity and ver-tical Doppler velocity (Z ≈ 15 dBZ and velocity≈ −0.6 m s−1), drizzle drops evaporatebelow cloud base before they reach the ground, and hence cool the sub-cloud layer. Thiscooling effect destabilizes the sub-cloud layer, leading to efficient coupling with the surface.This cooling acts also to stabilize the cloud layer itself, hence vertical motions inside thecloud are typically moderate in this phase. In such conditions, and in the absence of otherforcings, the cloud base tends to subside progressively. When the Doppler velocity reaches≈ −1 m s−1 with a reflectivity =−5 dBZ, the collection of fog droplets by the drizzle dropsis very efficient (i.e near 90%). Drizzle drops become larger and fall to the surface, reducingthe liquid water content and inducing rapid fog dissipation.
A second result of this study is the evidence that stratus-cloud microphysics and dynamicscan be affected by higher altitude clouds through an impact on stratus-top radiative cooling.We noted a change of 30 W m−2 in the cloud-top infrared budget, from −160 W m−2 (with-out high altitude cloud) to −130 W m−2 (with high altitude cloud). The 30 W m−2 changeleads to a modification of the in-cloud dynamics. A clear atmosphere above the stratus cloudincreases the intensity of radiative cooling leading to enhance droplet growth and turbulentmixing (i.e. +10 dBZ compared to situation with high altitude cloud). In a first stage, clouddroplets are larger at the stratus top associated with larger particle velocities. This induces amore rapid redistribution of water in the cloud layer through a larger downward flux of water,leading in a second step to reversing the sign of the vertical gradient of reflectivity (−5 dBZat cloud base and −15 dBZ at cloud top). The droplet velocity may reach −1 m s−1 at cloudbase and −0.2 m s−1 at cloud top. These interactions between radiative cooling due to theclear sky above the stratus cloud and the particle velocity induce a subsequent depletion ofliquid water content by the enhanced gravitational settling of the larger droplets out of clouds.
The third result of this study is the evaluation of the effect of near-surface thermodynamicson stratus–fog transitions. Horizontal wind speed and TKE affect in-cloud processes such asturbulent mixing, vertical particle velocity and evaporation below cloud base (in conditions ofconstant cloud-top radiative cooling). At night, low wind speed and TKE, less than 1–2 m s−1
and 1 m2 s−2, respectively, are conditions favourable to the progressive lowering of the CBH,
123

224 J.-C. Dupont et al.
due to cooling of the sub-cloud layer by evaporation. During daytime, under more vigorousnear-surface dynamics (i.e wind speed around 2–3 m s−1), conditions can be favourable tostratus-cloud lifting. The solar irradiance induces a positive gradient of temperature betweenthe ground and atmosphere, reaching in this study 4◦C, and implying a positive upward heatflux warming the atmosphere close to the surface. This surface heat source combined withincreased turbulence leads to the evaporation of fog droplets. Another aspect analyzed hereis the variability of visibility during fog events (ranging from 200 to 900 m) coincident withthe variability in surface wind speed. In fog conditions, we observed that under low levelsof turbulence close to the surface (TKE of 1 m2 s−2 or less), reflectivity and Doppler veloc-ity increase, while visibility decreases. Conversely, under more vigorous turbulence (TKEof 2 m2 s−2 or more), reflectivity and Doppler velocity decrease, while visibility increases.Hence it is likely that in-cloud turbulence affects the size distribution of droplets and changesthe vertical distribution of droplets, hence affecting near-surface visibility.
Acknowledgments The authors would like to thank the Centre National de la Recherche Scientifique(CNRS) and the Centre National d’Etudes Spatiales (CNES) for their support in this study. We extend ouracknowledgments to the technical and computer staff of each observatory for taking the observations andmaking the data set easily accessible. The authors are grateful to the anonymous reviewers for their veryuseful comments that significantly improved the article.
Open Access This article is distributed under the terms of the Creative Commons Attribution License whichpermits any use, distribution, and reproduction in any medium, provided the original author(s) and the sourceare credited.
References
Angström A (1918) A study of the radiation of the atmosphere. Smithson Misc Collect 65:1–159Battan LJ (1973) Radar observation of the atmosphere. The University of Chicago Press, Chicago, 324 ppBergot T, Carrer D, Noilhan J, Bougeault P (2005) Improved site-specific numerical prediction of fog and low
clouds: a feasibility study. Weather Forecast 20:627–646Bergot T, Haeffelin M et al (2008) ParisFog: des chercheurs dans le brouillard. La Météorologie 62:1–10Bouniol D, Illingworth AJ, Hogan RJ (2003) Deriving TKE dissipation rate within clouds using ground based
94 GHz radar. Preprints, 31st conference on Radar Meteorology, Seattle, WA, American MeteorologicalSociety, pp 193–196. http://ams.confex.com/ams/pdfpapers/63826.pdf
Brutsaert W (1975) On a derivable formula for long-wave radiation from clear skies. Water Resour Res11:742–744
Dupont JC, Haeffelin M, Drobinski P, Besnard T (2007) Parametric model to estimate clear-sky longwaveirradiance at the surface based on vertical distribution of humidity and temperature. J Geophys Res 113.doi:10.1029/2007JD009046
Elias T, Haeffelin M, Drobinski P, Gomes L, Rangognio J, Bergot T, Chazette P, Raut J-C, Colomb M (2009)Particulate contribution to extinction of visible radiation: pollution, haze, and fog. Atmos Res. doi:10.1016/j.atmosres.2009.01.006
Fuzzi S, Facchini MC, Orsi G, Lind JA, Wobrock W, Kessel M, Maser R, Jaeschke W, Enderle KH, Arends BG,Berner A, Solly A, Kruisz C, Reischl G, Pahl S, Kaminski U, Winkler P, Ogren JA, Noone KJ, HallbergA, Fierlinger-oberlinninger H, Puwbaum H, Marzorati A, Hansson H-C, Wiedensohler A, SvenningssonIB, Martinsson BG, Schell D, Georgii HW (1992) The Po valley fog experiment 1989. An overview.Tellus 44:448–468
Gultepe I, Tardif R, Michaelides SC, Cermak J, Bott A, Bendix J, Müller MD, Pagowski M, Hansen B,Ellrod G, Jacobs W, Toth G, Cober SG (2007) Fog research: a review of past achievements and futureperspectives. Pure Appl Geophys 164:1121–1159
Haeffelin M, Barthès L, Bock O, Boitel C, Bony S, Bouniol D, Chepfer H, Chiriaco M, Cuesta J, Delanoe J,Drobinski P, Dufresne JL, Flamant C, Grall M, Hodzic A, Hourdin F, Lapouge F, Lemaitre Y, MathieuA, Morille Y, Naud C, Noel V, OH’irok B, Pelon J, Pietras C, Protat A, Romand B, Scialom G, VautardR (2005) SIRTA, a ground-based atmospheric observatory for cloud and aerosol research. Ann Geophys23:253–275
123

Stratus–Fog Formation and Dissipation 225
Haeffelin M, Bergot T, Elias T, Tardif R, Carrer D, Chazette P, Colomb M, Drobinski P, Dupont E, DupontJ-C, Gomes L, Musson-Genon L, Pietras C, Plana-Fattori A, Protat A, Rangognio J, Raut J-C, Rémy S,Richard D, Sciare J, Zhang X (2010) PARISFOG: shedding new light on fog physical processes. BullAm Meteorol Soc 91:767–783. doi:10.1175/2009BAMS2671.1
Hall WD (1980) A detailed microphysical model within a two-dimensional dynamic framework: modeldescription and preliminary results. J Atmos Sci 37:2486–2507
Holets S, Swanson RN (1981) High-inversion fog episodes in Central California. J Appl Meteorol 20:890–899Koracin D, Lewis J, Thompson WT, Dorman CE, Businger JA (2000) Transition of stratus into fog along the
California coast: observations and modeling. J Atmos Sci 58:1714–1731Morille Y, Haeffelin M, Drobinski P, Pelon J (2007) STRAT: An automated algorithm to retrieve the vertical
structure of the atmosphere from single-channel lidar data. J Atmos Oceanic Technol 24:761–775. doi:10.1175/JTECH2008.1
Müller MD, Schmutz C, Parlow E (2007) A one-dimensional ensemble forecast and assimilation system forfog prediction. Pure Appl Geophys 164:1241–1264
Musson-Genon L (1987) Numerical simulations of a fog event with a one- dimensional boundary layer model.Mon Weather Rev 115:592–607
O’Connor EJ, Hogan RJ, Illingworth AJ (2005) Retrieving stratocumulus drizzle parameters using Dopplerradar and lidar. J Appl Meteorol 44:14–27
Ohmura A et al (1998) Baseline Surface Radiation Network (BSRN/WCRP): new precision radiometry forclimate research. Bull Am Meteorol Soc 79(10):2115–2136. doi:10.1175/1520-0477(1998)079<2115:BSRNBW>2.0.CO;2
Oliver DA, Lewellen WS, Williamson GG (1978) The interaction between turbulent and radiative transportin the development of fog and low-level stratus. J Atmos Sci 35:301–316
Pagowski M, Gultepe I, King P (2004) Analysis and modeling of an extremely dense fog event in southernOntario. J Appl Meteorol 43:3–16
Pilié RJ, Mack EJ, Kocmond WC, Rogers CW, Eadie WJ (1975) The life cycle of valley fog. Part I: Micro-meteorological characteristics. J Appl Meteorol 14:347–363
Protat A, Pelon J, Testud J, Grand N, Delville P, Laborie P, Vinson J-P, Bouniol D, Bruneau D, Chepfer H,Delanoë J, Haeffelin M, Noël V, Tinel C (2004) Le projet RALI: Combinaison d’un radar nuage et d’unlidar pour l’étude des nuages faiblement précipitants. La Météorologie 8e série 47:23–33
Rossow WB, Walker AW, Beuschel D, Roitier M (1996) International Satellite Cloud Climatology Project(ISCCP): description of new cloud dataset. World Climate Research Programme, Geneva, WMO/TD-737,115 pp
Ryznar E (1977) Advection-radiation fog near Lake Michigan. Atmos Environ 11:427–430Shupe M, Kollias P, Poellot M, Eloranta E (2007) On deriving vertical air motions from cloud radar Doppler
spectra. J Atmos Oceanic Technol 25:547–557Siebert J, Bott A, Zdunkowski W (1992) Influence of a vegetation-soil model on the simulation of radiation
fog. Beitr Phys Atmos 65:93–106Tag PM, Peak JE (1996) Machine learning of maritime fog forecast rules. J Appl Meteorol 35:714–724Tardif R (2007) The impact of vertical resolution in the explicit numerical forecasting of radiation fog: a case
study. Pure Appl Geophys 164:1221–1240Tardif R, Rasmussen RM (2007) Event-based climatology and typology of fog in the New York City region.
J Appl Meteorol Climatol 46:1141–1167Telford J, Chai SK (1984) Inversions and fog, stratus and cumulus formation in warm air over cooler water.
Boundary-Layer Meteorol 29:109–137Underwood SJ, Ellrod GP, Kuhnert AL (2004) A multiple-case analysis of nocturnal radiation-fog devel-
opment in the central valley of California utilizing the GOES nighttime fog product. J Appl Meteorol43:297–311
Winker DM, Vaughan MA, Omar AH, Hu Y, Powell KA, Liu Z, Hunt WH, Young SA (2009) Overview of theCALIPSO mission and CALIOP data processing algorithms. J Atmos Oceanic Technol 26:2310–2323.doi:10.1175/2009JTECHA1281.1
Wood R, Kubar TL, Hartmann DL (2009) Understanding the importance of microphysics and macrophysicsfor warm rain marine low clouds. Part II: heuristic models and rain formation. J Atmos Sci 66:2973–2990
123