stratospheric warmings and their effects in the ionosphere · · 2012-06-28stratospheric warmings...
TRANSCRIPT

Stratospheric warmings and their effects in the
ionosphere
L. Goncharenko,
MIT Haystack Observatory
Prize Lecture, CEDAR workshop, June 25, 2012

• Unexplained behavior of the upper thermosphere and ionosphere
• Large day-to-day variability, in particular at low latitudes
• Forcing from below (e.g. “meteorological” forcing) accounts for 20-30% of ionospheric variability (Forbes et al., 2000, Mendillo et al. 2002) on average; case studies of much larger variations
• Forcing from below is comparable to ionospheric changes related to geomagnetic activity [e.g., Fuller‐Rowell et al., 2000; Rishbeth and Mendillo, 2001; Forbes et al., 2000]
2
How can we find a good approach to study lower atmospheric forcing?

3
2006 2007 2008 2009 2010 2011 2012
There is such a phenomenon as sudden stratospheric warming…
First ISR World day campaign; First evidence of ionospheric variations during SSW
Record strong SSW
Papers rejected
ISR campaign every winter
Special issue of JGR; joint between JGR-Atmospheres
and JGR-Space Physics
“These new results have triggered an explosion of studies of mechanisms and types of possible connections between terrestrial and space weather during SSW and other large-scale perturbations in the lower atmosphere” – Wang et al., 2011
Papers cited 25-45 times
We’ve made only first steps in this journey…
?
• Sudden stratospheric warming as meteorological event
• Known ionospheric responses associated with sudden stratospheric warmings
• Interpretation of the observed and modeled phenomena
• Where do we go from here?
4

• Largest known meteorological disturbance
• Rapid increase in temperature in the high-latitude stratosphere (25K+); from winter-time to summer-time
• Accompanied by a change in the zonal mean wind
5
Wind
Temperature

6
Before warming During warming
•Stratospheric sudden warming is a large-scale dramatic coupling event in the winter polar atmosphere •Results from interaction of planetary waves with zonal mean flow •Largest planetary waves recorded in nature •Involves changes in temperature, wind, gravity wave activity
North pole

• They are not sudden
• They are not only stratospheric
• They are not only warmings
7
Terminology is arbitrary; physics is not

8
Anomalous behavior in multiple stratospheric parameters prior to and after the SSW: 1. Cold polar vortex prior to the peak in temperature 2. Strong eastward wind prior to SSW 3. High planetary wave activity prior to SSW 4. Collapse of PW activity after the peak in SSW
2 3
4
4 1

9 Limpasuvan et al., 2004
• Several stages of SSW with regards to the central day:
• Onset (days -37 to -23) • Growth (days -22 to -8) • Maturity (days -7 to 7) • Decline (days 8 to 22) • Decay (days 24 to 37)
• Preconditioning includes anomalously strong zonal flow at high latitudes and weak flow below 60oN; warm pole above 30hPa
• During growth and mature stages, anomalies descend to the lower stratosphere
• Wind and temperature peaks in the mature stage; anomalously low PW begins
Mature stage is ~2 weeks; significant anomalies +/-40 days from central date

• First discovered 60 years ago • Mesospheric effects are known since
1970s – cooling of the polar mesosphere
(Labitzke 1972, 1981, Walterscheid 2000, Azeem 2005, changes in gravity waves, zonal mean flow, PW, tides (Hoffmann 2007, Yamashita 2010)
– Complex variations at middle and low latitudes (Pancheva 2008, Shepherd 2007, Sridharan and Sathiskumar, 2008, Lima 2011)
10
Siskind et al., 2010
Yuan et al., 2012 Fort Collins lidar

• Tropospheric effects are known since ~2001 (Quiroz 1977, Baldwin and Dunkerton, 2001, Thompson 2002, Charlton 2004); accepted only recently – include locations of
storm tracks and the likelihood of mid-latitude storms
– Active research area; >200 publications
11
Baldwin and Dunkerton, 2001
• Anomalies in stratospheric circulation descend to the troposphere and create tropospheric anomalies
• Can be used as a predictor of tropospheric weather up to 2 months in advance

• A bitter cold snap over much of the United States; temperatures below -22 F in Midwest
• 8 inches of snow in London; 12 inches in other areas
• Heaviest snowfall southeastern England had seen in nearly 20 years
• All London buses, trains and subway out of service
12
London, February 2, 2009
Atmospheric scientists use studies of stratospheric anomalies to transition to the long-term weather forecast and address critical needs in the society

13
January 2008 SSW
Vortex displacement event
January 2009 SSW
Vortex split event
Pre-SSW vortex
NCEP temperature, 10hPa (~32 km)
• Warming in the polar stratosphere is accompanied by a cooling in the polar mesosphere and a cooling of tropical stratosphere
• Areas of warm and cold cells develop in the polar stratosphere • The event is inherently asymmetric; variations at a particular location (ground-based
observer) can depend on location with regards to the disturbed polar vortex

14

15
•Data: warming at 120-140km; cooling above ~150 km; 12-hour wave;
•First experimental evidence of alternating warming and cooling of upper atmosphere
•Model: mesospheric cooling and secondary lower thermospheric warming
Goncharenko and Zhang, 2008
Data: Millstone Hill ISR, 42oN Model: TIMEGCM
Liu and Roble, 2002
You are here

16 Several studies demonstrate high-latitude warming at 120-150 km or cooling in the F –region related to SSW; response at low latitudes is a matter of a debate
Funke et al., 2010
• MIPAS on ENVISAT – Tn increase at 120-140 km during Jan 2009 SSW
• Wave 1 pattern • Stronger in the stratosphere and
thermosphere; weaker in the mesosphere
• Ti increase at 120-142 km in EISCAT data (Kurihara et al, 2010)
• Tn and Ti decrease in the F-region at Poker Flat – FPI and ISR data (Conde and Nicolls, 2010)
• Ongoing debate on the relative importance of geomagnetic activity and SSW forcing highlights the complexity of this topic [Liu et al., 2011, Fuller‐Rowell et al., 2011]

17
15 UT 21 UT
Entire daytime low to mid-latitude ionosphere is affected during stratwarming; TEC change 50-150%
Goncharenko et al., 2010a
Chau et al., 2009, 2011
•Upward drift in the morning, downward in the afternoon -12-h wave
•Interpreted as evidence of enhanced 12-tide & E-region dynamo

18
•Peak daytime TEC: 15 TECu
•No clear pattern prior to SSW
•Variation in TEC during stratwarming: semidiurnal wave, ~5-12 TEC
•Progressive shift to later local times
•Both high amplitude of the wave and rapid phase change lead to large variability in TEC
Goncharenko et al., 2010b
No SSW
SSW

19
DW1 SW2 TW3
No SSW
SSW
All migrating before SSW
All migrating during SSW
Difference
• Roles of different tides is a matter of a debate • COSMIC analysis indicates migrating tides are major drivers • Non-migrating tides responsible for ~20% of response
Lin et al., 2012 COSMIC results perfectly agree with GPS TEC results

20
0 4 8 12 16 20 240,00E+000
5,00E+011
1,00E+012
1,50E+012
2,00E+012
JAN 2009
SJC
NmF2
(/m
3 )
25 26 27 28 29 30
0 4 8 12 16 20 24
0 4 8 12 16 20 24
0 4 8 12 16 20 24
0 4 8 12 16 20 24
0 4 8 12 16 20 24UT
NIG
HTTI
ME
SPRE
AD-F
NO R
EFLE
CTIO
NSP
ORA
DIC-
E
•São José dos Campos digisonde (23.2 S, 45.9 W)
•January 2009 SSW event
•Decrease in NmF2 by a factor of 4 at sunset; persistent for several days
Courtesy of Y. Sahai and R. de Jesus Green – baseline Black - SSW

• Answer 1: Better data availability and better global models
• Answer 2: Solar minimum conditions + record strong stratwarmings enabled identification of SSW effects
• Answer 3: They did. Nobody believed them:
– Manson et al., ~1970s; Kazimirovskiy et al., 1970-1980s, Pancheva, 1980s, Stening, 1990s
21

22
• Unintentional blindness phenomenon • ~50% of busy audience does not see obvious objects • Our prior beliefs, interests and expectations shape the way we perceive
the world
EQUATOR
W
E
POLE
Mesosphere lower
thermosphere
stratosphere
troposphere
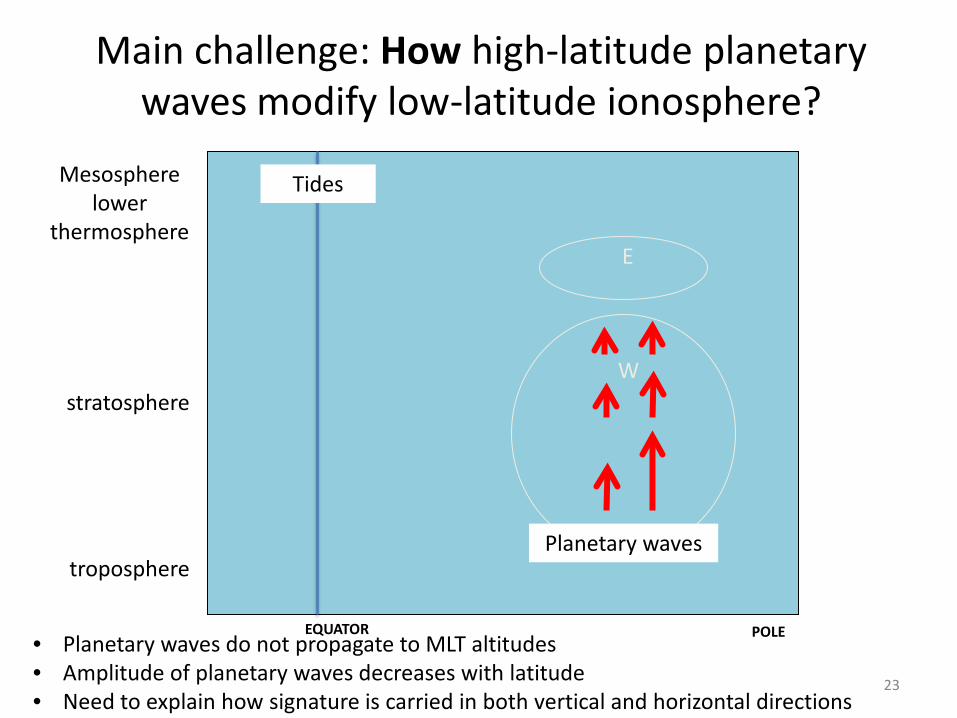
Main challenge: How high-latitude planetary waves modify low-latitude ionosphere?
Planetary waves
Tides
• Planetary waves do not propagate to MLT altitudes • Amplitude of planetary waves decreases with latitude • Need to explain how signature is carried in both vertical and horizontal directions
23

EQUATOR
W
E
WARMING
WARMING
COOLING
POLE
mesosphere
stratosphere
troposphere
Coupling mechanism (Matsuno, 1971, Plumb, 1986, Garcia, 1987)
Planetary wave forcing drives a global circulation with a clockwise lower cell (<40km) and a counterclockwise upper cell (>40km)
COOLING
24

EQUATOR
W
E
POLE
Possible influences on the upper atmosphere
Altered Rossby wave transmission?
Altered gravity wave transmission?
Induced meridional circulation?
Altered tide transmission?
Altered tide generation?
25

Suggested mechanisms: Interaction of planetary wave and tide
Pedatella and Forbes, 2010
• Non-linear interaction of planetary wave 1 and migrating semidiurnal tide generates non-migrating semidiurnal tide
• JPL TEC data; 2009 SSW • Increase in both migrating and
non-migrating semidiurnal tide • Partial explanation
26

Suggested mechanisms: disturbed wind dynamo
0 30 60 90 120 150 180-70
-50
-30
-10
10
30
50
70M
odip
Lat
itud
e (d
egre
e)COSMIC ZM foF2
2.53.03.54.04.55.05.56.06.57.0
Pancheva and Muhtarov, 2011
• Decrease in hmF2 and NmF2 in COSMIC data • Thermospheric warming reported by Goncharenko and Zhang, 2008, Funke et al., 2010,
Kurihara et al., 2010 • Similar to the disturbed wind dynamo due to geomagnetic storms
Day from Oct 1, 2008
27

Suggested mechanisms: lunar tide
Fejer et al., 2010
• Supporting experimental evidence found by Fejer et al., 2011, Park et al., 2012, Yamazaki et al., 2012a,b
• Regular lunar tide ~5m/s • Amplified during SSW by a factor of 2 • Lunar tide could be influenced by
propagation through the altered middle atmosphere (zonal wind, temperature)
28

EQUATOR
W
E
POLE
Suggested mechanisms: altered generation of tides
mesosphere
stratosphere
troposphere
WARMING
COOLING
O3
H2O
• Cooling and circulation changes lead to ozone anomalies in the stratosphere • Convection changes can lead to water vapor anomalies in the troposphere; 29

Change in the zonal mean ozone
• Perturbations in the ozone mass mixing ratio reach 25% in the upper stratosphere • The increase in the low-latitude ozone density between 30-50 km is driven by:
1) upward transport of ozone from the ozone-rich lower stratosphere, 2) meridional transport from the Southern to the Northern hemisphere, 3) longer ozone lifetime due to the tropical cooling
Goncharenko et al., 2012
Implications: Amplified semiduirnal migrating tide 30

Change in the longitudinal distribution of ozone
Low PW activity SSW peak
Implications: Amplified semiduirnal non-migrating tide of stratospheric origin (in addition to non-migrating tides of
tropospheric origin)
• Longitudinal distribution of ozone becomes strongly asymmetric during SSW
Concept: Planetary waves can indirectly drive short-term variability in tides through variations in the source region 31

Modeling and simulations of SSW events
• WACCM simulates well dynamical features of SSW in the stratosphere/mesosphere(Chandran 2011, Kvissel, 2011, de la Torre, 2012)
• Tidal changes in migrating and non-migrating tides in WACCM and GAIA due to PW+tides, ozone changes, and change in propagation conditions (Jin 2012, Pedatella 2012)
• Models predict the electrodynamic response (Liu et al., 2010, Fuller‐Rowell et al., 2010, 2011, Fang et al., 2012, Jin et al., 2012)
• WAM forecasts the response several days ahead (Fuller‐Rowell, 2011, Wang et al., 2011) 32
Wang et al., 2012 WAM model SW2 tide
Jin et al., 2012 GAIA model Variations in Ne and ExB drift

• Solid experimental evidence of profound ionospheric disturbances associated with stratwarming events
• Several mechanisms have been suggested to explain ionospheric anomalies during SSW
• Importance of most mechanisms is not known
• Superposition of effects from different mechanisms can be constructive or destructive; will vary with time, latitude, altitude
33

Going beyond SSW…
• Other amplifications in planetary waves generate similar variations in ozone • Consistent with ideas of Coughlin and Gray [2009] about continuum of SSW
Days from 01-Dec-2008 Days from 01-Dec-2008
Ozone 1hPa
PW1 PW2
34

Going beyond SSW: planetary wave activity
Northern Hemisphere Southern Hemisphere
• PW are amplified in Nov-Mar in the Northern Hemisphere; May-Nov in the Southern Hemisphere
• Anomalies in the equatorial ionosphere can be expected throughout the year
Suggested strategy: use stratwarmings to understand the mechanisms of lower/upper atmosphere coupling; apply knowledge throughout the year
35

What can we expect for higher solar activity?
36
Solar min, F10.7 = 72: Minor SSW Jan 2008
Max TEC = 25
Solar max, F10.7 = 148: Minor SSW Jan 2003;
Max TEC = 100
• Increased probability of stratwarmings • Measurable ionospheric effects (Fejer et al., 2010, 2011, Yamazaki, 2012); smaller
amplitudes in lunar tides, but large phase shift
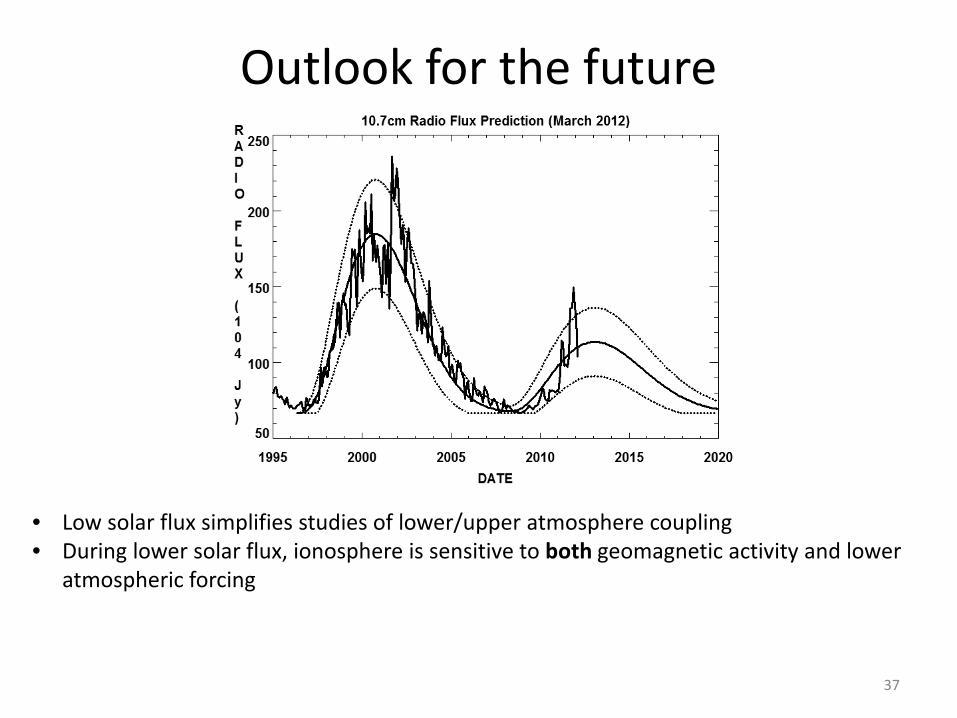
Outlook for the future
• Low solar flux simplifies studies of lower/upper atmosphere coupling • During lower solar flux, ionosphere is sensitive to both geomagnetic activity and lower
atmospheric forcing
37

38
Possible implications
Quasi-stationary planetary waves
Equatorial ExB drift
TEC gradients Irregularities
Link A - Demonstrated Link B - Demonstrated
Link C - Proposed
SSW
Predictable up to 8-10 days
Predictable ???
•Planetary waves can modify background ionosphere and provide pre-conditioning important for variety of mechanisms affecting irregularities
•Multiple evidence that PW-tide interaction leads to increased tidal variability in the MLT region; implications for F-region are not fully understood •SSW is a “proof of concept”; applicable to other planetary waves •Path to the multi-day ionospheric forecast
Focused studies of SSW have the potential of bringing transformative change to ionospheric research and address critical societal need

• We have build a tremendous momentum in studies of lower/upper atmosphere coupling – New understanding of ionospheric variability due to migrating and non-
migrating tides – Overwhelming experimental evidence of strong coupling between the
stratosphere and the thermosphere/ionosphere during stratwarmings • Rapidly developing modeling capabilities (Akmaev, 2011):
– WAM effort, Fuller‐Rowell et al., 2010, 2011, Wang et al, 2011, Fang et al., 2012;
– WACCM/WACCM-X (Liu et al., 2010, De la Torres et al., 2011) – GAIA (Jin et al., 2011, 2012)
• Rapid advances in the quality of data assimilation products: NASA MERRA, NOGAPS/ALPHA, ECMWF, UKMO – 20+ parameters, global, high temporal and spatial resolution
• Current and anticipated advances in ionospheric data availability – New missions - SWARM, RBSP, FORMOSAT-7/COSMIC-II, ICON) – Major improvements in CEDAR instruments (IS radars, lidars, LISN, FPIs)
• The nature is on our side (solar flux relatively low) 39 We have the means to address many questions

• Lower atmospheric community: “Raising the roof”, Shaw and Shepherd, 2008: – Only lowermost 10km was thought to be responsible for
weather and climate – Quality of the atmospheric models improves when upper
boundary increased to 50km – It took 10-20 years to recognize
• Upper atmospheric community - “lowering the floor”: – Acceptance of the role of migrating & non-migrating tides -
< 10 years (Hagan and Forbes, 2002, 2003, Immel et al., 2006, Kil and Paxton, 2011, England, 2011)
– Growing understanding of the role of planetary waves and stratwarming – 4 years
40
Rapid acceptance of recent advances is a tribute to the entire CEDAR community

These discoveries will be made by you.
41

My most sincere thanks • To Koki Chau and Anthea Coster – for being
the best collaborators and supporters one can imagine
• To the whole Millstone Hill group – for their patience
• To the International Space Science Institute (ISSI, Bern, Switzerland) - for support of the international group working on the topic
• To many people who said “I do not understand everything you are talking about, but this is what I can do”
42