stratigraphic and petrologic analysis of trends within the
TRANSCRIPT

Portland State University Portland State University
PDXScholar PDXScholar
Dissertations and Theses Dissertations and Theses
1986
Stratigraphic and petrologic analysis of trends within Stratigraphic and petrologic analysis of trends within
the Spencer Formation sandstones : from Corvallis, the Spencer Formation sandstones : from Corvallis,
Benton County, to Henry Hagg Lake, Yamhill and Benton County, to Henry Hagg Lake, Yamhill and
Washington counties, Oregon Washington counties, Oregon
Brent Joseph Cunderla Portland State University
Follow this and additional works at: https://pdxscholar.library.pdx.edu/open_access_etds
Part of the Geology Commons, and the Stratigraphy Commons
Let us know how access to this document benefits you.
Recommended Citation Recommended Citation Cunderla, Brent Joseph, "Stratigraphic and petrologic analysis of trends within the Spencer Formation sandstones : from Corvallis, Benton County, to Henry Hagg Lake, Yamhill and Washington counties, Oregon" (1986). Dissertations and Theses. Paper 3588. https://doi.org/10.15760/etd.5472
This Thesis is brought to you for free and open access. It has been accepted for inclusion in Dissertations and Theses by an authorized administrator of PDXScholar. Please contact us if we can make this document more accessible: [email protected].
AN ABSTRACT OF THE THESIS OF Brent Joseph Cunderla for the Master of
Science in Geology presented July 22, 1986.
Title: Stratigraphic and Petrologic Analysis of Trends Within the
Spencer Formation Sandstones; From Corvallis, Benton County,
to Henry Hagg Lake, Yamhill and Washington Counties, Oregon.
APPROVED BY MEMBERS OF THE THESIS COMMITTEE:
Ro v:tla, Chairman
Within the thesis study area Spencer Formation arkosic/arkosic
lithic sandstone lithofacies of Narizian age crop out in a sinuous
north-northwesterly band from the Corvallis area into the Henry Hagg
Lake vicinity ten kilometers southwest of Forest Grove, Oregon.
Twenty eight surface samples and eight sidewall cores from the
DeShazer 13-22 natural gas exploration well, were analyzed petrograph-
ically for detrital framework mineral composition and their major oxide
and rare earth element concentrations utilizing x-ray fluorescence
spectrometry (XRF) and inductively coupled plasma emission spectrometry

(ICP) analysis, respectively. Twelve samples representing both
lithofacies areally within the five separate Spencer Formation study
areas, and stratigraphically within the DeShazer 13-22 well were
selected for plagioclase composition, heavy mineral separates and
scanning electron microscopy (SEM) - energy dispersive spectrometry
(EDS) studies. These combined studies showed that two distinct
lithofacies or informal members are present within the Spencer Formation
in the thesis study area, they are; 1) a lower arkosic sandstone member,
and 2) an upper arkosic to lithic arkosic sandstone member.
Petrographic analysis showed that the lower member contains more
detrital grains of quartz and potassium feldspar, has two to three times
more epidote, and contains more schist and quartzite rock fragments than
the upper member lithofacies. In comparison the upper member sandstone
lithofacies contains abundant plagioclase feldspar, three to four times
more amphibole and pyroxene (commonly etched) detrital grains, and has
abundant microlithic volcanic rock fragments.
Based on petrologic and accompanying geochemical evidence,
provenance of the Spencer Formation sandstone lithofacies indicates both
proximal volcanic and distal plutonic/metamorphic sources.
Scanning electron microscopy proved most valuable for complementing
petrography and diagenetic studies. Elemental analysis and a variety of
mineral-pore relationships were observed. Porosity within selected
samples ranges from highly porous sandstones, to samples entirely
cemented with sparry crystalline calcite containing abundant authigenic
potassium feldspar and smectite, showing virtually no porosity.
Five individual clay species: chlorite, illite, smectite,
2

kaolinite, and mixed-layer illite/smectite were identified in selected
samples utilizing x-ray diffraction (XRD).
Diagenetic evidence found within the Spencer Formation sandstones
showed 1) compaction, 2) chemical etching of hornblende, augite and
plagioclase feldspar, 3) dissolution of silicate grains (mainly
plagioclase), 4) solution, and 5) formation of euhedral authigenic
minerals (K-feldspar and zeolites), clays (crenulated smectite), and
cement (crystalline sparry calcite).
Both major oxide and rare earth element geochemistry emphasized
pre-determined petrologic trends. Major oxide findings showed that the
upper member arkosic to lithic arkosic sandstone lithofacies are silica
deficient and have elevated amounts of alumina, iron and magnesium in
comparison to the lower member arkosic lithofacies. Concentrations of
rare earth elements are two to three times higher in the upper member
sandstone lithofacies, and have a europium fluctuation typical of the
introduction of intermediate (andesite to dacite) volcanics.
3

STRATIGRAPHIC AND PETROLOGIC ANALYSIS OF TRENDS WITHIN
THE SPENCER FORMATION SANDSTONES; FROM CORVALLIS,
BENTON COUNTY, TO HENRY HAGG LAKE, YAMHILL
AND WASHINGTON COUNTIES, OREGON
by
BRENT JOSEPH CUNDERLA
A thesis submitted in partial fulfillment of the requirements for the degree of
MASTER OF SCIENCE in
GEOLOGY
Portland State University
1986

TO THE OFFICE OF GRADUATE STUDIES AND RESEARCH:
The members of the Committee approve the thesis of Brent Joseph
Cunderla presented July 22, 1986.
APPROVED:
Paul E. Hammdnd, Head, Department of Earth Sciences
and Research

ACKNOWLEDGEMENTS
Sincere appreciation is warrantable to Dr. Robert Van Atta, the
advisor and chairman of my thesis committee. He provided valuable
guidance, insight, critical review and suggestions for this project.
Special thanks are given to the other two members of my thesis
committee, Dr.'s Marvin Beeson and Richard Thoms, for their review,
comments and suggestions on initial writings and thesis rough drafts.
I would like to thank Dr. John Dash of the Portland State
University Physics Department for his instruction, assistance and
guidance with the scanning electron microscopy portion of this study.
Without the monetary support from Oregon Natural Gas Development
Company, AMOCO Production Company and the Rockie Memorial Scholarship
awarded by the Portland State University Geology Department this study
would have been inconceivable.
Discussions with Jack Meyer from Oregon Natural Gas Development
Company offered the opportunity for me to hear industry's insight into
the stratigraphic and structural relations within the Cowlitz and
Spencer Formations. I wish to thank Dr. John Armentrout from Mobil Oil
Corporation for his review of my thesis proposal and suggestions on how
to approach the problems I might encounter in this project.
Lastly I would like to thank my parents, Don and Janean, for their
support of my education and finally my greatest appreciation goes to my
wife, Vickie, for her patience, confidence, love and emotional support
throughout the duration of this study.

TABLE OF CONTENTS
ACKNOWLEDGEMENTS
LIST OF TABLES • •
LIST OF FIGURES
CHAPTER I
II
III
INTRODUCTION .
Purpose and Scope of Investigation
Location of Thesis Area • . . •
Methodology of Investigation
Previous Work .
STRATIGRAPHY . • . .
Geologic Setting
Spencer Formation Stratigraphic Relationships
Lithofacies Descriptions
Lower Member (informal)
Upper Member (informal)
SEDIMENTARY PETROLOGY
Methods and Sample Preparation
Framework Mineral Grain Counting Techniques
Detrital Framework Mineral Grains •
Quartz • • • • . . • Monocrystalline Quartz Polycrystalline Quartz
Feldspar • . • • • . • • • . .
PAGE
iii
vii
ix
1
3
3
4
7
12
12
15
20
22
22
27
27
28
29
29 29 31 31

CHAPTER
Plagioclase Feldspar Potassium Feldspar
Rock Fragments • • . • • • .
Mica
Volcanic Rock Fragments Metamorphic Rock Fragments Sedimentary Rock Fragments
Glauconite •••• Clays • . . . . • • . Heavy Minerals • • • . .
Epidote • Hornblende • • • • Augite • • • . Zircon • • • • • • . Apatite Garnet Sphene Tourmaline Rutile Kyanite and Andalusite
Sandstone Petrography . .
Sandstone Classification
Detrital Modes
IV SCANNING ELECTRON MICROSCOPY •
Explanation of SEM Methods and Sample Preparation .
Photomicrograph Interpretation
X-ray Analysis of Minerals
Clay Mineral Relationships
Mineral Morphology and Pore Relationships •
V X-RAY DIFFRACTION ANALYSIS OF CLAY MINERALS
VI DIAGENESIS •
VII GEOCHEMISTRY .
X-ray Fluorecence (XRF) Analysis
Major Oxide Geochemistry • . . •
Inductively Coupled Plasma (ICP) Analysis
v
PAGE
32 33 34 34 35 35 35 35 36 36 37 38 39 39 39 42 42 43 43 43
44
47
53
62
62
63
63
70
72
79
83
89
90
90
97

CHAPTER
Rare Earth Element Geochemistry
VIII SUMMARY AND CONCLUSIONS
Summary • . • .
Conclusions •
REFERENCES • .
APPENDICES
PAGE
97
113
113
119
121
129
vi

TABLE
I
II
LIST OF TABLES
General Framework Grain Categories .
Total Detrital Framework Grain Point Count Data
III Plagioclase Composition of Selected Spencer Formation
Sandstone Lithofacies
IV Heavy Mineral Assembladges found in Selected Spencer
Formation Sandstone Outcrop Samples
V Definition of Grain Populations for Ternary Compositional
Diagrams • • • • . . .
VI Spencer Formation Normalized Point Count Data Utilized
for Ternary Diagrams
VII Lithic Rock Fragment Content in the Deshazer 13-22 Well
Sidewall Core Samples
VIII Constituents dissolved to produce solution pores within
Spencer Formation sandstones . • • .
IX Elements analyzed for in Spencer Formation Samples .
X Major Oxide Chemical Analysis of Spencer Formation
Samples
XI Rare Earth Element Concentrations of Analyzed Spencer
Formation Sandstone Samples • • .
XII Average Concentrations (ppm) of REE's in Sediments and
Sandstone
PAGE
29
30
33
40
48
54
59
86
90
91
98
100

LIST OF TABLES (Continued)
TABLE
XIII Chondrite Normalized Rare Earth Elememt Concentrations of
Analyzed Spencer Formation Samples
viii
PAGE
101

LIST OF FIGURES
FIGURE PAGE
1.
2.
Index map of the thesis area
Reconstruction of the Eocene tectonic and geologic
framework of northwestern Oregon and southwestern
Washington
3. Paleogeography of western Oregon and Washington during
middle to late Eocene
4. Correlation chart of the Willamette Valley and north-
western Oregon
5. Portion of Bruer and others (1984) Correlation Section
24 northwestern Oregon, depicting Spencer Formation
lithofacies within the study area
6. Generalized outcrop map of middle to late Eocene arkosic
sandstone formations in northwestern Oregon and western
Washington
7. Chronostratigraphic correlation chart of middle to late
Eocene arkosic sandstone formations in western Oregon
8.
and Washington • • . • • • . • . . . . • . . . .
Generalized stratigraphic model of the relationships
between the Spencer Formation informal lower and
upper members from Corvallis to Henry Hagg Lake,
Oregon
5
14
16
19
21
23
24
26

LIST OF FIGURES (Continued)
FIGURE
9. Folk's (1974) classification scheme for sandstone
composition modified with stability poles (Hayes,
1979)
10. Ratio of polycrystalline quartz (Qp) to total quartz (Q),
plagioclase (P) to total feldspar (F), and volcanic
x
PAGE
49
lithic fragments to total lithic fragments (Lv/L) for
Spencer Formation informal upper and lower members . 51
11. Dickinson and Suzek's (1979) QFL ternary diagram
utilized for sandstone classification emphasizing
mineral grain stability, provenance and transport . . 57
12. Dickinson and Suzek's (1979) QmFLt ternary diagram
utilized for sandstone classification emphasizing
mineral grain stability •
13. Dickinson and Suzek's (1979) QmPK ternary diagram
utilized for sandstone classification emphasizing the
dominant monocrystalline grain types
14. Ternary QmQpL diagram of Spencer Formation samples
emphasizing polycrystalline grains and lithic fragment
content . •
15. Photomicrograph showing euhedral authigenic crystals of
heulandite (zeolite) in sample ONG-12-2224
16. Photomicrograph showing euhedral authigenic potassium
feldspar, pyrite frambiod and whispy smectite in
sample ONG-17-2214 . . . . . . . . . . . . .
58
60
61
65
66

LIST OF FIGURES (Continued)
FIGURE
17. Photomicrograph showing a detrital grain of hornblende
xi
PAGE
which has been extensively etched in sample SP-74 • • 68
18. Photomicrograph showing a detrital grain of augite with
some sign of etching in sample SP-57
19. Photomicrograph showing authigenic smectite exhibiting a
crenulated form in sample ONG-12-2224 • . . • . . • .
20, Sample SP-1 showing detrital minerals grains, quartz,
plagioclase and potassium feldspar
21. Sample SP-81 showing detrital minerals grains of
glauconite and hornblende .
22. Sample SP-57A showing abundant clay mineral grains
and some sparry calcite filling pore spaces •.
23. Sample SP-87 showing abundant crystalline sparry
calcite cement
24. Major oxide cross plot diagram of silica (Si02) versus
Alumina (Al203) content in Spencer Formation
sandstones analyzed
25. Major oxide cross plot diagram of potasium (K20)
versus sodium (Na20) content in Spencer Formation
sandstones analyzed • . . • • .
26. Plot of rare earth elements versus chondrite/sample for
lower member (informal) sandstones
69
71
73
74
76
77
95
96
103

LIST OF FIGURES (Continued)
FIGURE
27. Plot of rare earth elements versus chondrite/sample for
upper member (informal) sandstones
xii
PAGE
105
28. Plot of rare earth elements versus chondrite/sample for
sidewall core samples taken from the Deshazer 13-22
natural gas exploration well • • • • • . . . • • . . 107
29. Rare earth element cross plot diagram of gadolinium (Gd)
versus europium (Eu) content in Spencer Formation
30.
sandstones analyzed • . . . • . . . . . • . . . .
Rare earth element cross plot diagram of europium/gado
linium (Eu/Gd) versus lanthinum (La) content in
Spencer Formation sandstones analyzed
31. Rare earth element cross plot diagram of lanthinum (La)
versus samarium (Sm) content in Spencer Formation
sandstones analyzed
110
111
112
32. Authors interpretation of provenance or source area for
Spencer Formation sands during late Eocene . . . • . 118

CHAPTER I
INTRODUCTION
Narizian-age Spencer Formation sandstone lithof acies are part of a
thick and extensive late Eocene depositional sequence, consisting
primarily of marine sandstone, mudrock and volcanic flowrock and
breccia, in western Oregon and Washington. Deposition probably occurred
within a volcanic fore-arc basin which occupied the present-day area of
the Willamette-Puget Lowland, Olympic Mountains and Coast Ranges of
Oregon and Washington (Snavely and Wagner, 1963; Armentrout and Suek,
1985).
Sandstone lithofacies, like those found within the Spencer
Formation, also occur in many other late Eocene sedimentary formations
of western Oregon and Washington. Variances in sandstone composition
reflect provenance and sediment distribution. Late Eocene arkosic
sandstone lithofacies found within the Pacific Northwest differ from
typical arkoses in that they contain dominantly plagioclase feldspar
(Winters, 1984 and Byrnes, 1985). The predominance of proximal volcanic
source material in certain geographic areas could vary sandstone
composition to that more typical of lithic sandstones (Armentrout and
Suek, 1985 and Van Atta, 1986).
Spencer Formation sandstone crops out discontinuously in the
eastern foothills of Oregon's Coast Range geomorphic province in a
narrow band, usually not more than a kilometer wide, forming a sinuous

outcrop belt with an average dip of fifteen degrees to the east
(Schlicker, 1962 & Schlicker and Deacon, 1967). Outcrop patterns within
the Spencer Formation are also greatly influenced by structure
throughout the Coast Range.
From the type locality southwest of Eugene, Oregon, the
north-northwesterly winding belt of arkosic and lithic arkosic Spencer
Formation sandstone crops out prominently near Corvallis, Albany, and
Dallas (Vokes and others, 1951), eventually ending north of Henry Hagg
Lake vicinity, to the west of Forest Grove, Oregon.
Exploration for oil and natural gas in western Oregon over the last
sixty years was intermittent with some sporadic noncommercial oil and
natural gas shows, until the discovery of economic natural gas reservoir
potential near Mist, Oregon, in May of 1979 (Bruer, 1980). Sandstone in
the Spencer Formation has, during the past five years, been a prime
target in exploration for natural gas in the Willamette Valley. The
majority of natural gas production at Mist Gas Field, occurs in the
"Clark and Wilson" arkosic sandstone lithofacies found within the lower
portion of the Cowlitz Formation according to Bruer and others (1984)
and Niem and others (1985). Clark and Wilson sands, according to Bruer
and others (1984), may be coeval with Spencer Formation arkosic
sandstone lithofacies, which occur stratigraphically within the lower
part of the Spencer Formation. Bruer and others (1984) denoted these
arkosic sandstones as the Spencer sand member (informal) within the
Willamette Valley.
2

Purpose and Scope of Investigation
The purpose of this study was to determine petrologic and
geochemical trends within the Spencer Formation in relation to
stratigraphic characteristics of the arkosic and lithic sandstone facies
denoted by Al-Azzaby (1980), Thoms and others (1983) and Van Atta
(1986). Major oxide and rare earth element geochemical studies
complemented petrographic trends established within the Spencer
Formation. Diagenetic and alteration products found within the Spencer
Formation sandstone lithofacies and their affects on sandstone porosity
were also studied.
There are three specific goals this study investigated: 1) to
define regional implications of the petrographic and geochemical
relationships of lithic arkose and arkose sandstone lithofacies of the
Spencer Formation, 2) use petrography, major oxide and rare earth
element (REE) geochemistry to establish chemical, compositional, and
mineralogical changes present both areally and stratigraphically within
Spencer Formation sandstones, and 3) to utilize the scanning electron
microscope (SEM) and accompanying energy dispersive spectrometer (EDS)
to aid in mineral identification and study the affects of diagenetic and
alteration products on porosity relationships within Spencer Formation
sandstone lithofacies.
Location of Thesis Area
In order to deal with regional implications of the stratigraphic
and petrographic relationships of lithic arkose and arkose sandstone
lithofacies of the Spencer Formation a large study area was needed.
3
Five separate smaller study areas, including the type area, where the
Spencer Formation sandstone crops out are established for this study
(Figure 1). These five areas include: 1) Western Tualatin Valley, 2)
Monmouth, 3) Albany, 4) Corvallis and 5) Spencer Formation type-section
southwest of Eugene, Oregon. The western Tualatin Valley study area
includes those Spencer Formation sandstone outcrops in the Henry Hagg
Lake, Patton Valley and Williams Canyon vicinities studied by Al-Azzaby
(1980), Thoms and others (1983) and Van Atta (1986). Some sample
localities from the type area are those studied by Gandera (1977).
Methodology of Investigation
Using existing maps and field study, outcrops were studied and
samples were collected from the Spencer Formation sandstone in the study
area. Study, sampling and stratigraphic measurement of exposed sections
of the sandstone lithofacies was done from late June until September of
1985. Location of the Spencer Formation outcrops are listed in Appendix
A. Description of primary sedimentary structures and lithology were
done at each sampling locality. Selected samples from Spencer Formation
sandstones characteristic of the four northern areas, excluding the type
area, were chosen for more detailed plagioclase composition, heavy
mineral separates, clay mineral assemblage and SEM-EDS studies. Samples
collected from the type locality along Spencer and Coyote Creeks
southwest of Eugene were utilized for comparison with the samples
collected within the four separate areas to the north within the thesis
study area.
Eight sidewall core samples from the Deshazer 13-22 natural gas
4

(J
G: 0 ~
~
~ (J 0
I 1 COLUMBIA
I -~-~1--~
TILLAMOOK ~ WASHINGTON • MULTNOMAH
r--_J T.'< I
YAMHILL ( CLACKAMAS Sher/den ~ --=r---·--- ~
I D•ll•• ) \ I [:l, / • S•l•m \....
L:~~}·~ MARION
-~ ---"--""--LINCOLN I
I
Newport I -..J
f sENTON
----1---
0
LINN
,r---'- ..r-..,,'- -...J
•Eugene LANE
124" 123•
Figure 1. Location map of the thesis area.
4r
44•
(r:::ON
0 At••• ot SlfldJ
f Weal•tll Tt1•l•llW
l/ellep A ree
Z Monmo.,tJt At••
J Alb•nr Ar••
4 Corwelll• At••
D
D D D
5
4 Spencer For••tlo•
Type S•ctlo• D ~ o.s-... , 13·:Z:Z
0 L
Well L ocello•
11 ____ _,_ 30 -----· _, I< 11011101•11

exploration well, located northeast of Salem, Oregon near the community
of St. Louis, were also analyzed.
Samples labeled with "SP" are surface samples while those starting
with the prefix "ONG" are sidewall core samples from the Deshazer 13-22
natural gas exploration well. The one or two digit number after "ONG"
indicates the sidewall core sample number. Sample number "l" being the
first and stratigraphically lowest sidewall core sample collected from
within the Spencer Formation. The last four digits, ie. "2319",
indicate depth in feet down hole at which the sidewall core sample was
collected, measured from the kelly bushing on the drill stem.
Lithofacies differentiation within the informal upper and lower
members are based on observations made in the field. Stratigraphic
findings reflect those observations made by Gandera (1977) and Al-Azzaby
(1980). No sedimentary texture analysis or paleontological work was
completed. Both Gandera (1977) and Al-Azzaby (1980) discuss these
topics.
During field reconnaissance of the thesis study area (Figure 1),
limited exposure of outcrops, long covered intervals and lack of fault
contacts cropping out at the surface, made it difficult to construct
composite stratigraphic columns and attempt surface correlations. Thus,
defining the stratigraphic and spatial relationships of the arkose and
lithic arkose sandstone of the Spencer Formation utilizing only
surficial data was very difficult. To overcome the stratigraphic
problems encountered in the field, the locations of underlying and
overlying formation contacts were obtained from previous workers and
their accompanying geologic maps. Together with strike and dip
-----,
6

measurements taken at each outcrop, an approximated position of the
outcrop being studied and where it occurred stratigraphically within the
Spencer Formation was determined.
Conventional and impregnated thin sections allowed petrographic
characteristics and some pore relationships to be determined. The
Scanning Electron Microscope (SEM) and the accompanying Energy
Dispersive Spectrometer (EDS) instrumentation were utilized to provide
additional information on porosity and mineralogy of selected samples.
SEM photomicrographs offer high resolution, magnification and excellent
depth of focus. They were utilized to: (1) examine size, shape and
distribution of pores as well as aperture characteristics, (2) examine
textural and morphological aspects of mineral grains, and (3)
differentiate between detrital and diagenetic clay minerals.
Both major oxide and rare earth element (REE) composition of
selected samples were determined, utilizing x-ray fluorescence
spectrometry (XRF) and inductively coupled plasma emission spectrometry
(ICP). Dr. Peter Hooper of Washington State University-Pullman, did
both the XRF and ICP geochemical analysis.
X-ray diffraction analysis provided determination of clay minerals
present within selected samples.
Previous Work
Turner (1938) first proposed the name Spencer Formation for a
sequence of marine sandstones and shales located approximately 16
kilometers west-southwest of Eugene in the vicinity of Spencer and
Coyote Creeks. Fossil assemblages collected by Turner in the Spencer
-------,
7
Formation correlate with late Eocene Tejon strata in California, and
with Coaledo and Cowlitz Formation fossils of Oregon. Turner proposed
the name Comstock Formation for those sediments stratigraphically
overlying the Spencer Formation and lying unconformably beneath the
Fisher Formation along Spencer Creek. Based on the fauna collected from
the Comstock Formation Turner believed it to be nonmarine. The Comstock
fauna described by Diller (1900) and Sanborn (1937) found in the lower
portion of the Fisher Formation near Comstock, Oregon should not be
confused with fauna present in the Comstock Formation proposed by Turner
(Beaulieu, 1971).
Mundorff (1939) described the geology of the Salem quadrangle. He
encountered a similar fauna characterized by Turner within the Comstock
Formation and termed them the "Helmick Beds". Allison (1953) also
described a similar fauna in the Albany area.
Baldwin (1947, 1964) described the geology in the Dallas-Valsetz,
Oregon area. There he found rocks with lithologies and marine fossil
assemblages earlier noted by Turner in his study of the Spencer
Formation type area, indicating that the Spencer Formation continued
north from the type section to Corvallis, Albany and Dallas.
Vokes and others (1951, 1954) mapped the Spencer Formation in the
southern and central portions of the Willamette Valley. They included
the Lorane Shale at the base of the Spencer Formation and combined the
Comstock Formation designated by Turner with part of the upper Spencer
Formation.
Schlicker (1962) noted the occurrence of the Spencer Formation in
the Yamhill quadrangle west of Gaston, Oregon, approximately 40
8

kilometers southwest of Portland. Hoover (1963) recognized and mapped
the Spencer Formation from the type section to the southern limit in the
Anlauf and Drain quadrangles west of Cottage Grove, Oregon. Hoover
(1963, p. 30-32) separated the Spencer from the underlying Tyee
Formation and overlying Fisher Formation based on lithology and
characteristic marine fossil species distinct to the Narizian-Refugian
Stages.
During the mid 1960's to early 1970's a series of U. S. Geological
Survey Water-Supply papers were published, all of which included
hydrologic and general geologic information about the Spencer
Formation. Hart and Newcomb (1965) investigated the Spencer Formation
in the Tualatin Valley area. Frank (1973, 1974 & 1976) did hydrologic
studies which included the Spencer Formation in the Eugene-Springfield,
Corvallis-Albany, and Harrisburg-Halsey areas. The most recent ground
water study including the Spencer Formation was done by Gonthier (1983)
in the Dallas-Monmouth area of Polk, Benton and Marion Counties. The
above U. S. Geological Survey Water Supply Papers listed chemical
analysis of water from wells which penetrate Spencer Formation sandstone
within the Willamette Valley. Most of the water samples collected
showed high concentrations of sodium, potassium, calcium and magnesium
which may be typical either of poorly recharged aquifers or of conate
water. According to Gonthier (1983), water sampled from some wells in
the Dallas-Monmouth area, contained such a high percent of dissolved
solids that it is unsuitable for irrigation or human consumption.
Enlows and Oles (1966) studied authigenic silicates within the
Spencer Formation in the Corvallis, Oregon area.
9

Gandera (1977) worked in the Spencer Formation type-section
designated by Turner (1938) southwest of Eugene. He revised work done
by Vokes and others (1951), subdividing the Spencer into informal upper
and lower members based on petrography, paleontology and lithology. He
also reclassified some Tyee Formation sediments as belonging to the
Spencer Formation. In the northern portion of the Spencer Formation
outcrop area, Al-Azzaby (1980) revised field mapping done by Schlicker
(1962) and Schlicker and Deacon (1967) near Henry Hagg Lake, Patton
Valley, and Williams Canyon. Al-Azzaby (1980) also informally
subdivided the Spencer Formation in his study area into an upper and a
lower member, based on field observations and petrography. He also
investigated the provenance, depositional environment, and diagenetic
characteristics of some of the late Eocene and Oligocene Formations
within the western Tualatin Valley, including the Spencer Formation.
A detailed description of the lithology including sedimentary
structures and textural analysis, petrology and paleontology found
within the Spencer Formation in the western Tualatin Valley area, are
10
given by Thoms and others (1983). Thoms and others (1983) and Van Atta
(1986), based on their findings, also subdivide the Spencer Formation
into upper and lower members (informal).
None of these previous works illustrate the regional petrologic or
geochemical trends within the Spencer Formation. Detailed petrographic
work done in this study complimented by the findings of previous workers
will better define the Spencer Formation lower and upper members
(informal) previously established by Gandera (1977), Al-Azzaby (1980),
Thoms and others (1983) and Van Atta (1986).

11
Linda Baker, a graduate student in geology at Oregon State
University, is currently working on a master's thesis study of the
Spencer Formation stratigraphy and depositional environment. Her area
of study includes Spencer Formation sandstone outcrops west and south of
Salem, Oregon, from Monmouth and Corvallis.
CHAPTER II
STRATIGRAPHY
Geologic Setting
The geologic history of western Oregon has been dominated by the
interactions of the Juan de Fuca Plate, (a remnant of the Farallon
Plate) the Pacific and the North America Plates. The Farallon Plate, an
oceanic lithospheric plate, was separated in the early Eocene from the
Pacific Plate by the East Pacific Rise (Drake, 1982). The Farallon
Plate was separated from the North America Plate by a trench (Drake,
1982).
According to Armentrout and Suek (1985) arc-type volcanism with
associated seamount chains developed during early Eocene (Figure 2a).
Umpqua, Siletz River, and Tillamook Volcanics in western Oregon are
representative of these seamount basalt sequences (Snavely and Wagner,
1963). In the early to mid-Eocene, this area was a deep marginal
oceanic basin with a base of oceanic rise basalt overlain by accreted
seamounts and oceanic islands.
According to Armentrout and Suek (1985), blockage of the subductiDn
zone occurred prior to mid-Eocene time. Sebsequent blockage of the
subduction zone caused it to jump westward and a forearc basin was
formed (Simpson and Cox, 1977). Middle Eocene Tyee and Fluornoy
Formation sediments were transported from uplifted Klamath sources into
the forearc basin located behind the trench (Snavely and MacLeod, 1977).
13
Molenaar (1985) interprets the Tyee Formation as marginal basin
deposits. The Yamhill Formation sediments were originally thought to be
the distal turbidite sequences associated with the Flournoy Formation
(Baldwin, 1976), but paleocurrent evidence studied by Heller (1983)
indicates that the source was from the east rather than the Klamaths in
the south.
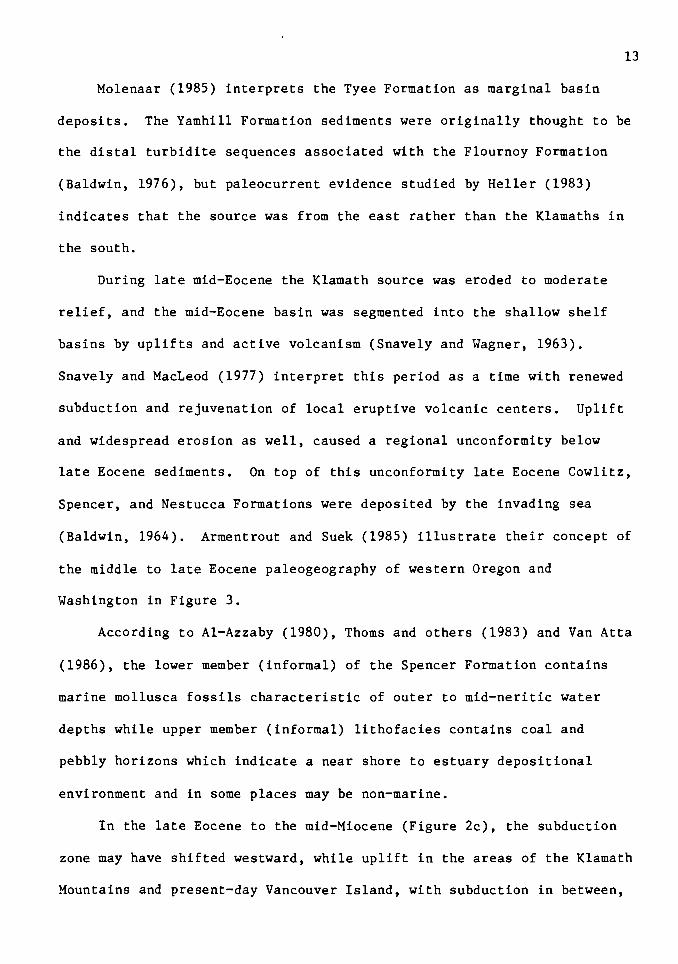
During late mid-Eocene the Klamath source was eroded to moderate
relief, and the mid-Eocene basin was segmented into the shallow shelf
basins by uplifts and active volcanism (Snavely and Wagner, 1963).
Snavely and MacLeod (1977) interpret this period as a time with renewed
subduction and rejuvenation of local eruptive volcanic centers. Uplift
and widespread erosion as well, caused a regional unconformity below
late Eocene sediments. On top of this unconformity late Eocene Cowlitz,
Spencer, and Nestucca Formations were deposited by the invading sea
(Baldwin, 1964). Armentrout and Suek (1985) illustrate their concept of
the middle to late Eocene paleogeography of western Oregon and
Washington in Figure 3.
According to Al-Azzaby (1980), Thoms and others (1983) and Van Atta
(1986), the lower member (informal) of the Spencer Formation contains
marine mollusca fossils characteristic of outer to mid-neritic water
depths while upper member (informal) lithofacies contains coal and
pebbly horizons which indicate a near shore to estuary depositional
environment and in some places may be non-marine.
In the late Eocene to the mid-Miocene (Figure 2c), the subduction
zone may have shifted westward, while uplift in the areas of the Klamath
Mountains and present-day Vancouver Island, with subduction in between,

EARLY EOCENE ( .. 48 m.)I.)
r11urc 2•. Early Coccnc tectonic and aculoalc fra .. work 1howtng ••••ounr c~ln1 for~d alon1 • 1preadtn1 rtdK• and v\llc•nl•• abo~ an eauward-dlpplna 1ubducted plate.
Flav.re 2b. Hlddle Eocene tectonic and 1colo1lc fra~vork 1hovtn1 weatward j'9p In 1ubductlon aone between rarallon-Kula plate1 and aor1 •••tern North AMrlc.,, phta
Flaur~ le. Late !ocene tectonic and 1eolo1tc fraawork 1howtng CO•ttal plaln pro1ra11htlon Into 1hclf ur1tn fore-arc ba1ln and local 1ub11a fan devclopeirnt vlthln Ow ba1ln.
Figure 2. Reconstruction of the Eocene tectonic and geologic framework of northwestern Oregon and southwestern Washington. Diagrams from Armentrout and Suek (1985, their Figures 19, 20 & 21). The relative direction of plate movement or faulting is shown with arrows.
14

produced a trough, within which locally shallow basins formed (Snavely
and others, 1980). The shoreline paralleled the present-day Cascade
Mountain foothills. During this time, sedimentation was continuous
within the trough and there was active tectonism in the area.
By early Oligocene time, the ancestral Cascades as well as locally
active volcanoes contributed volcaniclastic material to the trough.
Regional uplift during early and mid-Oligocene time shifted the
depositional environment northward (Snavely and Wagner, 1963).
Continental sediments of the Fisher Formation were deposited in the
southern Willamette Valley, while shallow water marine sediments of the
Eugene and Keasy Formations were deposited in the south-central and
northern Willamette Valley. Marine deposition was even more restricted
in late Oligocene time due to broad uplift associated with widespread
emplacement of gabbroic sills (Snavely and Wagner, 1963). There is no
record of marine sedimentary deposition in the southern and central
Willamette Valley after the Oligocene. By early Miocene time, the
shoreline was located west of the present day Coast Range. In the
mid-Miocene, flows of the Columbia River Basalt Group were erupted and
flowed as far west as the Pacific Ocean (Beeson and others, 1979). The
flows crop out from south of Salem to northwest of Portland. During
Pliocene and Pleistocene time, local sands and silts were deposited in
the northern Willamette Valley (Beaulieu, 1971) and marine deposition
was very restricted.
Spencer Formation Stratigraphic Relationships
To the north of the Corvallis-Albany area, Spencer Formation
15

Figure 3. Paleogeography of western Oregon and Washington during middle to late Eocene. Diagram after Armentrout and Suek (1985, their Figure 11). Figure shows a wide coastal plain across which quartoze and feldspathic sands were transported from metamorphic-plutonic sources inland. Localized volcanic activity caused sandstone composition to become more lithic. An increase in volcanic activity during late Eocene could have contributed elevated concentrations of plagioclase, hornblende and augite within Spencer Formation upper member (informal) sandstones. Armentrout and Suek (1985) did not incorporate Coast Range rotation models such as those developed by Simpson and Cox (1977), Magill and Cox (1980) and Heller (1983) into their paleogeographic reconstruction model. B = Bellingham, S = Seattle, O = Olympia, P = Portland, E = Eugene, CB = Coos Bay.
16
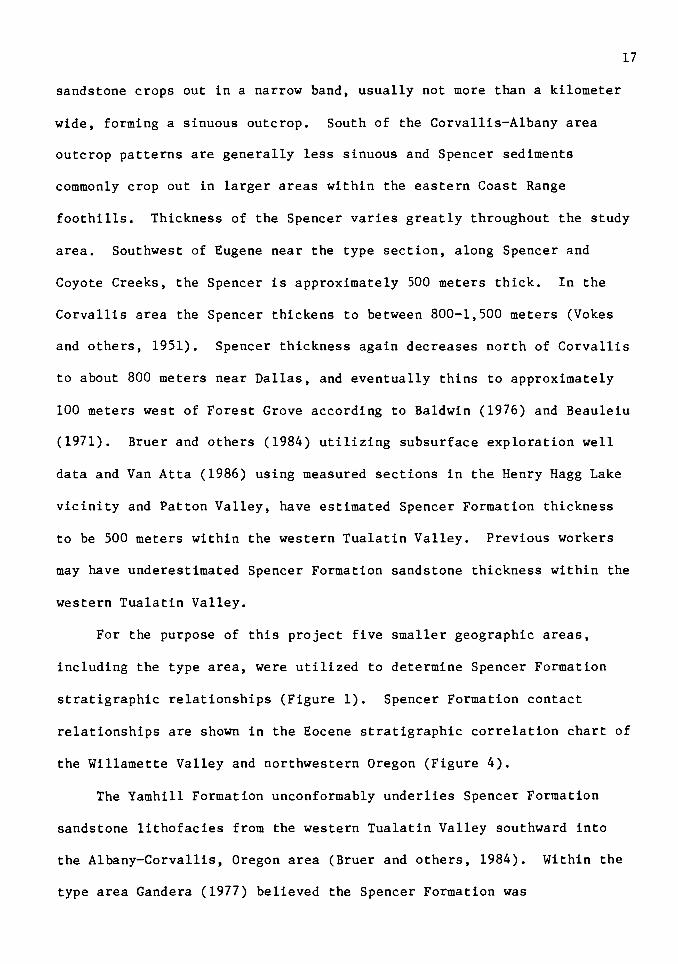
17
sandstone crops out in a narrow band, usually not more than a kilometer
wide, forming a sinuous outcrop. South of the Corvallis-Albany area
outcrop patterns are generally less sinuous and Spencer sediments
commonly crop out in larger areas within the eastern Coast Range
foothills. Thickness of the Spencer varies greatly throughout the study
area. Southwest of Eugene near the type section, along Spencer and
Coyote Creeks, the Spencer is approximately 500 meters thick. In the
Corvallis area the Spencer thickens to between 800-1,500 meters (Vokes
and others, 1951). Spencer thickness again decreases north of Corvallis
to about 800 meters near Dallas, and eventually thins to approximately
100 meters west of Forest Grove according to Baldwin (1976) and Beauleiu
(1971). Bruer and others (1984) utilizing subsurface exploration well
data and Van Atta (1986) using measured sections in the Henry Hagg Lake
vicinity and Patton Valley, have estimated Spencer Formation thickness
to be 500 meters within the western Tualatin Valley. Previous workers
may have underestimated Spencer Formation sandstone thickness within the
western Tualatin Valley.
For the purpose of this project five smaller geographic areas,
including the type area, were utilized to determine Spencer Formation
stratigraphic relationships (Figure 1). Spencer Formation contact
relationships are shown in the Eocene stratigraphic correlation chart of
the Willamette Valley and northwestern Oregon (Figure 4).
The Yamhill Formation unconformably underlies Spencer Formation
sandstone lithofacies from the western Tualatin Valley southward into
the Albany-Corvallis, Oregon area (Bruer and others, 1984). Within the
type area Gandera (1977) believed the Spencer Formation was
18
unconformably underlain by the Lorane Shale and Heller (1983) interprets
the underlying sediments to be upper Tyee which accompany the same
stratigraphic position.
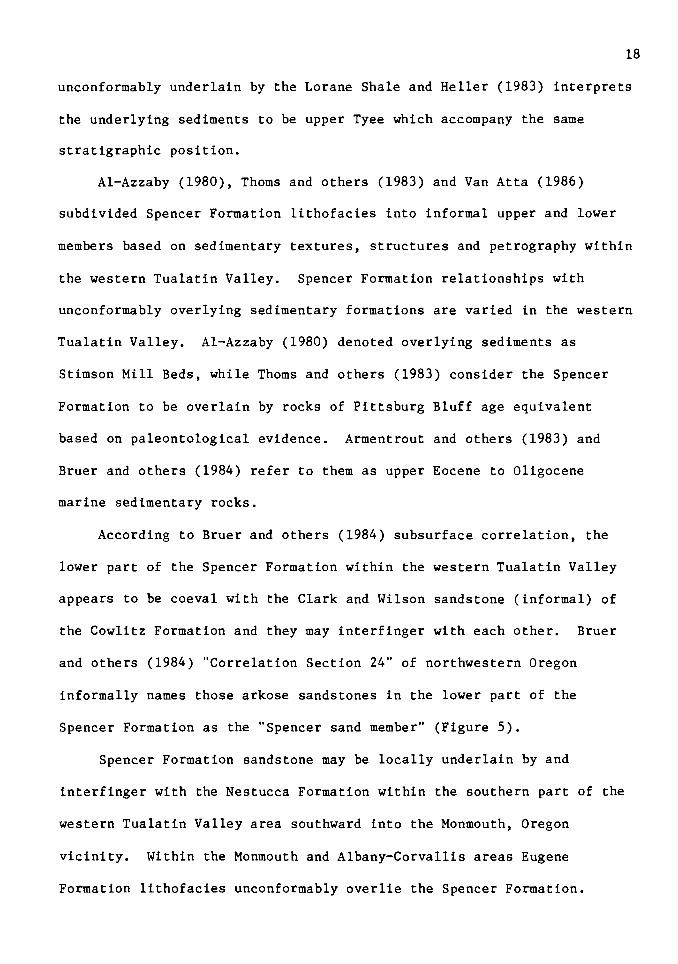
Al-Azzaby (1980), Thoms and others (1983) and Van Atta (1986)
subdivided Spencer Formation lithofacies into informal upper and lower
members based on sedimentary textures, structures and petrography within
the western Tualatin Valley. Spencer Formation relationships with
unconformably overlying sedimentary formations are varied in the western
Tualatin Valley. Al-Azzaby (1980) denoted overlying sediments as
Stimson Mill Beds, while Thoms and others (1983) consider the Spencer
Formation to be overlain by rocks of Pittsburg Bluff age equivalent
based on paleontological evidence. Armentrout and others (1983) and
Bruer and others (1984) refer to them as upper Eocene to Oligocene
marine sedimentary rocks.
According to Bruer and others (1984) subsurface correlation, the
lower part of the Spencer Formation within the western Tualatin Valley
appears to be coeval with the Clark and Wilson sandstone (informal) of
the Cowlitz Formation and they may interfinger with each other. Bruer
and others (1984) "Correlation Section 24" of northwestern Oregon
informally names those arkose sandstones in the lower part of the
Spencer Formation as the "Spencer sand member" (Figure 5).
Spencer Formation sandstone may be locally underlain by and
interfinger with the Nestucca Formation within the southern part of the
western Tualatin Valley area southward into the Monmouth, Oregon
vicinity. Within the Monmouth and Albany-Corvallis areas Eugene
Formation lithofacies unconformably overlie the Spencer Formation.

Q.
(/)
al
w
>. -
E
a:
z w
(/
) w
~
I-
a:
w
39
Q
. Q
.
~ 4
1
w
z w
w
...
.I 4
5
0 ()
0 0
~
w -5
0
a:
w
!:
0 ....I
55
EO
CE
NE
ST
RA
TIG
RA
PH
IC C
OR
RE
LA
TIO
N C
HA
RT
ST
AN
DA
RD
W
EST
M
cM
INN
VIL
LE
-C
OL
UM
BIA
C
OA
ST
S
EC
TIO
N
EU
GE
NE
S
HE
RID
AN
C
OU
NT
Y
AR
EA
A
RE
A
AR
EA
F
ora
min
ila
ra
Sta
ge
s
1 2
3
Euge
ne>~
R
EF
UG
IAN
m
eri
ne
a
ed
lme
nta
r y
Plt
tab
urg
B
luff
Fm
. F
iah
er
Fo
rma
tio
n
rock a
F
orm
etl
on
K
ea
ae
y F
orm
ati
on
---N
ea
tucc
Sp
en
ce
r F
orm
ati
on
F
orm
ati
on
o
l.
~ ... ".
' ~ble
Fo
rma
tio
C
ow
litz
Fm
. N
AR
IZIA
N
? 11
111
I II
Ill
I I
I I
I 1
111
Ill
!
Ya
mh
ill
Fo
rma
tio
n
?
~
r
11
11
11
11
11
1!!
11
11
11
11
11
U
LA
TIS
IAN
y
Fo
rma
tio
n
(or
Tye
e)
----
---?
----
--P
EN
UT
IAN
S
ile
tz R
ive
r
ba
ae
n
ot
exp
ose
d
Vo
lca
nic
s
BU
LIT
IAN
Fig
ure
4
, C
orr
ela
tio
n ch
art
o
f th
e W
illa
met
te V
all
ey
an
d n
ort
hw
est
ern
O
reg
on
, A
fter
Arm
entr
ou
t an
d o
thers
(1
98
3)
wit
h
stra
tig
rap
hic
co
lum
ns
com
pil
ed
by:
(1)
Bal
dw
in
and
B
row
nfi
eld
, (2
) B
row
nfi
eld
an
d B
eeso
n,
and
(3)
Arm
entr
ou
t an
d o
thers
.
ll
l l
l Ill
ll
ll I I
I II I I
~
Ya
mh
i
Fo
r m
a r
?-
~
Sile
tz
Riv
er
Vo
lca
nic
•
..... '°

South of the Corvallis, Oregon study area Fisher and Spencer Formation
lithofacies may interfinger (Bruer and others, 1984).
20
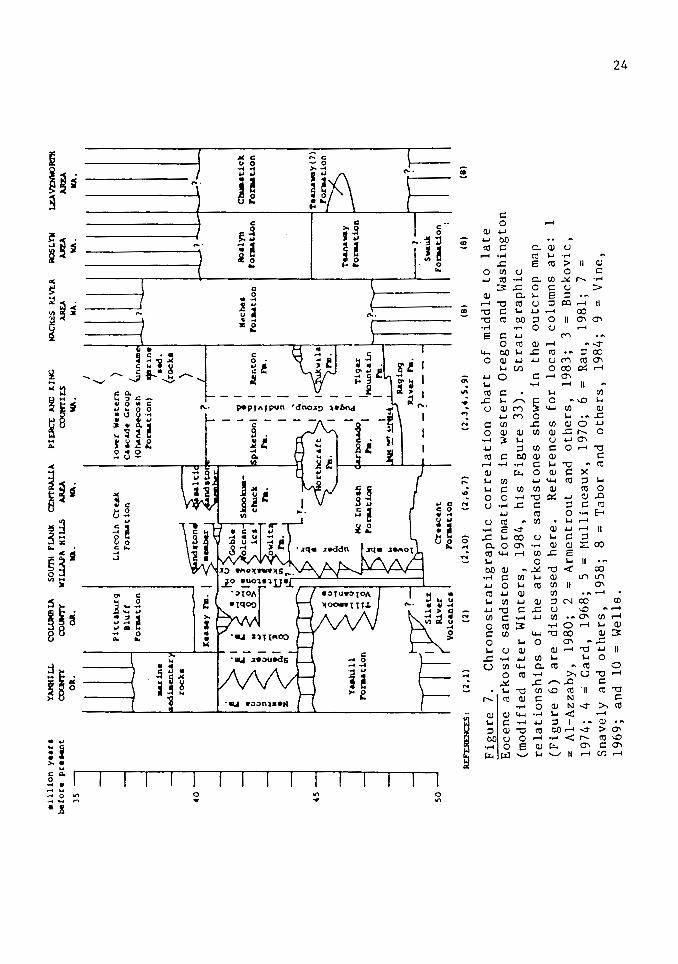
Spencer Formation arkose to lithic arkose sandstone lithofacies are
similar to many of the middle to late Eocene arkosic sandstones of
western Oregon and Washington. The Coaledo Formation found in the Coos
Bay, Oregon area, Nestucca Formation of the west-central Willamette
Valley and Cowlitz Formation of northwestern Oregon and southwestern
Washington correlate with the Spencer Formation. Spencer Formation
arkosic sandstone correlates with the mid- to late-Eocene Skookumchuck,
Spiketon, Renton, Naches, Roslyn and Chumstick Formations in western
Washington (Armentrout and others, 1983). Figure 6 shows the areas
where the above arkosic sandstone formations crop out and Figure 7 shows
an accompanying correlation chart which illustrates stratigraphic
relationships.
Lithofacies Descriptions
It is shown by this present study that trends within Spencer
Formation arkose to lithic arkose sandstone lithofacies generally
reflect the textural and petrographic variations within the informal
upper and lower members, which agrees with Gandera (1977), Al-Azzaby
(1980), Thoms and others (1983), and Van Atta (1986). Sandstone
lithofacies characteristic of the lower and upper members are not
present or could not be differentiated within every one of the five
smaller study areas (Figure 1). Petrographic and geochemical data
obtained from the findings in this report aided in the separation of the
informal upper and lower members (Figure 8) in those areas where Spencer

-1~
... ~ ....
/.«
/'
,~{/
,,.
;,;
//
.. ~·-
•"'"' .. "'
0 0
e 0
_ ... -...
-"'
-"'
.•.• .... ,
. ·-
-·· -··
_ .. I
I I
<> <>
<>
<>
!I!!
=.
1';~
~~;\
~"§;
7·
Fig
ure
5
. P
ort
ion
o
f B
ruer
an
d
oth
ers
(1
98
4)
Co
rrela
tio
n
Secti
on
2
4,
no
rth
west
ern
O
reg
on
, d
ep
icti
ng
S
pen
cer
Fo
rmat
ion
li
tho
facie
s
wit
hin
th
e st
ud
y a
rea.
N .....

Formation sandstone was difficult to distinguish stratigraphically.
Lower Member (informal)
The lower lithofacies consists predominately of a gray to greenish
gray (5 GY 6/1) highly micaceous, arkosic sandstone which weathers to
orange brown (10 YR 6/4) • Sandstone beds are massive and generally
lack cementing agents, causing them to be extremely friable. Despite
the lack of cement, massive friable sandstone outcrops commonly form
steep almost vertical exposures with little slumping. Outcrop exposure
may be related to good permeability, causing sandstone to readily drain
off water before slope rotation occurs. Sample locality SP-12 was
collected from one of the most southerly exposures of the lower member
lithofacies, which consists of 12 meters of vertical, friable
sandstone. Limonite partings, which commonly cut at angles to the
massive sandstone, give a sense of false bedding planes. Sedimentary
structures are rare within the massive sandstones except for fine
laminae (1 cm) with concentrations of biotite. No cross-bedding was
observed. Although no granulometric analysis was completed, the lower
member is obviously predominately coarser grained than the upper
member. No fossils were noted within the massive sandstone but
bioturbation was evident in several outcrops.
Upper Member (informal)
The upper member consists of very pale orange (10 YR 8/2) to gray
to greenish gray (5 GY 6/1) medium to thin bedded (1 m) arkosic to
lithic arkosic silty sandstone and mudstone. When weathered the
sandstone is moderate yellowish brown (10 YR 5/4) to grayish orange (10
22

23
122· 120· ~ 4~
~
\ 4e•
4 7°
.y
WA 46°
OR
<;)
nO 0 100 km 45•
0 100 mi
·E 44•
Figure 6. Generalized outcrop map of middle to late Eocene arkosic sandstone formations in northwestern Oregon and western Washington (modified after Winters, 1984, his Figure 19). SP = Spencer Formation, COW = Cowlitz Formation, SK = Skookumchuck Formation, S Spiketon Formation, NA = Naches Formation, RO = Roslyn Formation, CH = Chumstick Formation, RN = Renton Formation. Cities as reference pionts: B = Bellingham, E = Eugene, O = Olympia, P = Portland, S = Seattle, Y = Yakima.
11
1ll
ion
Y
••r•
b
efo
re p
reM
nt
)5
YA
MH
IU.
cou
n"Y
O
R.
~in•
ed
iaen
t•r
rock
•
CO
UJK
BL
\ so
c.rm
ru.
m:
CD
n"A
AU
A
Plt
.RC
E
»ID
U
NG
C
OU
NTY
W
lu.A
PA
H
ILL
S
MU
C
OU
NT
U:S
oa
. IG
. IO
..
IO..
Pit
t1b
u.r
9
Blu
ff
ron
r.ti
on
Lin
co
ln C
red
t F
on
wti
on
I <
low
r
Wea
te.r
n )
C.a
cad
e
Cro
up
/
( 0 h
.&"'"
peco
. h
'un
n ..
..
ron
wti
on
) ;a
r1n
e
1ed
. <
roc:u
llAC
K.::
:S
JU v
t R
RO
SL Y
ll A
AEA
U
V.
WA
. l<
A.
LEA
VD
M)R
n!
AJI
ZA
WA
.
40
)
' ?-..--'-~--I
~?
45
50
IU:F
!:.R
EN
CE
S :
t. • u u " .. • • z
Yu
.hil
l F
on
wti
on
?
~lil•t
.%
Riv
er
vo
lcan
ic•
(2,l
l (2
)
cl'a
lck
F
a •
I 'i
pik
eto
nl ~
I
Fa.
I.!
I li
en to
n
Fa.
I ~
I I ~I
5· rt
hcr&
tt ~ ~
I
~1~1
Kc
Into
&h
F
on
wti
on
Cre
scen
t F
on
wti
on
(~.10)
(2,6
, 7)
bo
Md
o' I
ra.
I
(2,3
,4,5
.9)
""ch
e1
ro
1u
tio
n
(8)
Ro
lly
n
roru
ti.o
n
Tu
n.&
.,.y
F
on
wti
on
s-u1
t F
oru
t.io
n
(8)
Fig
ure
7
. C
hro
no
stra
tig
rap
hic
co
rrela
tio
n c
hart
o
f m
idd
le
to
late
E
oce
ne
ark
osi
c
san
dst
on
e fo
rmat
ion
s in
w
este
rn O
reg
on
an
d W
ash
ing
ton
(m
od
ifie
d aft
er
Win
ters
, 1
98
4,
his
F
igu
re
33
).
Str
ati
gra
ph
ic
rela
tio
nsh
ips
of
the
ark
osi
c
san
dst
on
es
show
n in
th
e o
utc
rop
m
ap
(Fig
ure
6
) are
d
iscu
ssed
h
ere
. R
efer
ence
s fo
r lo
cal
colu
mn
s are
: l
= A
l-A
zzab
y,
19
80
; 2
= A
rmen
tro
ut
and
oth
ers
, 1
98
3;
3 =
Bu
cko
vic
, 19
74;
4 ~
Gar
d,
19
68
; 5
= M
ull
inea
ux
, 19
70;
6 =
Rau
, 1
98
1;
7 =
S
nav
ely
an
d o
thers
, 19
58;
8 =
Tab
or
and
oth
ers
, 1
98
4;
9 =
Vin
e,
19
69
; an
d 10
=
Wel
ls.
Cb
t.aati
ck
F
or.
at.
ion
T•&
M.-
y(?
)
?
(8)
N .,_

25
YR 7/4). Sedimentary structures include trough cross-bedding and
numerous micaceous laminations. In the Albany-Corvallis area abundant
pelecypods and gastropods were collected but were not identified. Trace
fossils in the form of burrows are commonly found. Overall, this
lithofacies is better cemented with clays and calcite. Carbonaceous
material (wood fragments) are also present. Schlicker (1962), Gandera
(1977) and Al-Azzaby (1980) make references to coal occurrences within
the upper part of the Spencer Formation. Thin (1-5 mm) hard bright coal
partings were noted in the upper part of the Spencer out of the study
area west of Eugene, Oregon. Concretions occur in the upper lithofacies
within the Corvallis and Monmouth study areas and to the north in the
vicinity of Henry Hagg Lake. The best exposure of concretions within
the study area occur along the north side of Henry Hagg Lake northwest
of the dam. Concretions at the Henry Hagg Lake locality commonly have a
diameter greater than one meter. Figure 8 shows the stratigraphic
relation between the upper and lower members (informal) of the Spencer
Formation within the thesis area.

., ... GI - GI ~
CO
RV
AL
LIS
H
AG
G L
AK
E
Ya
mh
ill
Fo
rma
tio
n
0
500~ rm~
~
L.w
-4
-V
I /1
/
v \0
(\
10
00
I
15
00
I
20
00
-t
25
00
. \.
~·
c--
F
I ~o~
11
-..
. •-•\
} Y
am
hill
~_r-----
I /.
/. ~
~
~~co
-
-T
iiia
mo
ok
' '.
/
Fig
ure
8
. G
en
era
lized
str
ati
gra
ph
ic
mod
el
of
the
rela
tio
nsh
ips
bet
wee
n
the
Sp
ence
r F
orm
atio
n
info
rmal
low
er
and
u
pp
er m
embe
rs
from
C
orv
all
is
to
Hen
ry H
agg
Lak
e,
Ore
go
n.
N a.

CHAPTER III
SEDIMENTARY PETROLOGY
Methods and Sample Preparation
A total of 35 grain mounts and epoxy-impregnated thin sections were
studied to analyze the petrologic nature of the Spencer Formation within
the study area. Medium-grained sandstone samples were consistently
utilized where possible to minimize the effects of grain-size variations
on framework mineral composition and to aid in identifying lithic
fragments.
Thin sections were impregnated with a blue epoxy to show pore space
relationships and stained for both potassium and plagioclase feldspars,
using the methods of Bailey and Stevens (1960). Thin sections were
ground in oil to alleviate any problems encountered with swelling clays.
The grain mounts are actually thin sections of reconstructed rock.
A split of disaggregated rock was incorporated into plastic epoxy resin,
allowed to harden, a billet was cut, and ground down to 30 microns
thickness. This process best shows the original consolidated friable
rock composition. The thin sections of reconstructed rock are also
stained for both plagioclase and potassium feldspars. A majority of the
samples studied in thin section were reconstructed grain mounts due to
the friable nature of most samples of sandstone.

Framework Mineral Grain Counting Techniques
Point counting techniques were utilized for the 12 thin sections
while the remaining 23 grain mounts were line counted. Detrital
framework mineral grain parameters outlined by Dickinson (1970) and
Dickinson and Suezk (1979) were utilized in this study. Table I shows
the general framework mineral grain categories utilized for both point
and line counting techniques and their representative symbols. A
minimum of five-hundred framework grains were counted for each sample.
Typically a grid pattern of ten evenly spaced rows of fifty or more
counts per row was used for each thin section and grain mount. This
spacing allowed for a large enough grid pattern, so that individual
framework grains were not counted more than once. Five very
fine-grained sandstones were also examined in thin section. A minimum
of one thousand framework grains were counted to allow for a grid
spacing pattern suitable for covering the largest portion of the thin
section. This spacing best illustrated sample composition.
Table II summarizes quartz, feldspar, and lithic framework
components in each Spencer Formation sample studied in thin section.
The number of counts and relative percentages for each framework grain
category are listed. Muscovite, biotite, accessory and authigenic
minerals, and unknowns are combined in the "other" category.
28

29
TABLE I
GENERAL FRAMEWORK GRAIN CATEGORIES
Category Symbol
Monocrystalline quartz Qm Polycrystalline quartz Qp Plagioclase feldspar P Potassium feldspar K Volcanic and Metavolcanic
rock fragments Lv Sedimentary and Metasedimentary
rock fragments Ls Metamorphic Aphanitic rock fragments Lm
Detrital Framework Mineral Grains
Quartz
Monocrystalline and polycrystalline quartz content within the
Spencer Formation averaged 27% and 6% in the lower member arkosic
lithofacies and 20% and 4% respectively in the upper member. Quartz
grains studied in thin section within both lithofacies consisted of
three types: 1) monocrystalline quartz, 2) equadimensional
polycrystalline quartz, and 3) foliated polycrystalline quartz. Both
monocrystalline and polycrystalline quartz are more abundant in the
lower member.
Monocrystalline Quartz
In thin section, under plane polarized light, monocrystalline
quartz was distinguished by clear colorless angular to sub-angular
grains which are often fractured. Under cross polarized light,
monocrystalline quartz exhibited low briefringence and undulose to

WU
II
nJrA
L ~
"JlUTAL
t1W
£WJa
< CR
AIN
l'O
INT
CU
M O
J.TA
SA
l1'U
. ID
TAL
Qn
Qr
t)
p K
f
Lv
u.
Lt.
L O
lHER
!W
t'
OO
JNrS
n
%
n %
n
l n
%
n %
n
• n
• n
%
n %
n
%
n %
U»
l! t
tllE
l ( I
Nm
lilL
)
SP--1
m
17
• 33
3l
h
'!QI
l9
11•
2• W
..ce
6e 1
\ala
J'n
Val
ra "J
J 19
4
10
2 0
0 29
6
97
Ill
SP--3
50
2 17
9 36
3)
7
111
42
ill
2~
52
10
175
35
21
4 14
3
I 0
36
7 79
16
SP
--5
jOJ
147
29
45
9 1'1
1 38
13
5 27
67
u
202
I,()
23
5
0 0
11
2 35
7
Ill
16
SP
-II
5(1!
lb
'l l3
42
8
211
41
155
31
311
7 19
3 38
21
4
14
3 0
0 35
7
69
" g>
--65
(:J)6
1)
7 23
44
7
181
30
148
24
56
9 20
lo )4
II
2
2 0
25
4 38
6
183
)()
gy,1
51
4 13
6 216
41
8
in
}4
149
29
23
4 17
2 l3
10
2
22
4 0
0 l2
6
l3l
216
-50
7 11
3 22
}4
7
147
29
149
29
48
9 19
7 )9
19
4
41
8 I
0 61
11
10
2 20
ltn
uJt
hl.
no
a
SP-1
1 50
2 15
8 31
'2Q
4
178
35
147
29
74
15
221
44
4 I
8 2
0 0
11
2 91
18
g
yjl
50
0 14
9 )(
) l3
7
182
36
l28
l3
41
8 16
9 )4
10
2
43
9 7
I 60
11
89
18
g
y!/
50
1 Il
l 22
18
4
129
216
Ill
16
55
II
U5
27
17
3 II
2
6 I
}4
7 20
3 41
gy
,o
1016
11
6 II
32
3
148
15
171
17
29 Al~ A
rea
2lll
2l
l 28
3
31
3 0
0 '.19
6
tnJ
60
SP-6
2 51
1 14
8 29
31
6
179
35
110
22
76
15
186
36
22
4 71
14
5
I 98
19
48
9
SP
-'JQ
j YJ
1 lJ
j 23
35
7
154
lO
141
28
Ill
22
252
50
7 l
35
7 4
I 46
9
55
ll
SP-3
5 50
0 10
8 21
u
3 Il
l 24
!I
ll
36 Si
>eroer
o'0-i1
on ~--""
32
6 4
I 1
0 37
7
ill
25
I.LIE
R A
vt:R
ta:
27
6 33
21
6 11
36
3
4 I
8 23
!ll!
Sla
ar 1
3-22
Wol
l S~l C
o,..
. <J
G-1
-231
9 5
U
152
)()
29
6 18
1 35
\I
,()
27
96
19
236
46
6 I
7 I
3 I
16
3 79
15
<J
G-1
-231
1 54
5 U
9 29
28
5
187
}4
157
29
Ill
15
237
43
13
2 9
2 0
0 22
4
99
18
<JG
-:'>-
2276
50
2 13
6 27
29
6
165
33
158
31
100
2ll
256
51
8 2
17
3 2
0 27
5
'.12
10
<Nr!
0-22
'.>9
5U
16
2 36
36
7
198
)9
U7
25
1a;
21
233
46
u 3
21
4 4
I l8
7
43
8
ll'l'E
ll -
(!N
mli
lL)
g>--
ll
523
107
2ll
11
2 11
9 23
72
14
Woate~~ln V
alto
s -. 20
6
1 3
1 I
0 10
2
289
55
SP-7
1 50
0 93
19
2l
l 4
IU
23
141
28
'3
9 18
4 37
21
4
50
10
1 0
72
14
131
216
SP-7
4 50
1 13
5 27
27
5
162
l2
115
25
43
9 16
8 }4
21
6 5
45
9 3
1 74
15
97
19
S
P-7
lt.
500
86
17
21
4 10
7 21
l2
8 21
6 68
14
19
6 )9
21
4
22
4 5
1 48
10
14
9 )(
)
ltn
uJth
Are
a
SP-1
4 50
3 99
2l
l 21
4
llQ
2•
13
0 216
n
15
207
41
66
u 0
0 0
0 66
u
uo
22
SP-7
9 5U
n
15
7 1
84
16
190
37
31
6 22
1-43
62
u
)()
6 2
0 94
18
lU
22
g
y!)
523
lJ2
2'.i
19
4 15
1 29
14
6 28
42
8
188·
36
19
4
l3
6 1
0 53
10
U
l 25
SP
-86
500
134
27
23
5 15
7 31
12
4 25
32
6
156
31
6 1
19
4 2
0 27
5
163
32
SP-'.
19
la;4
21
0 2l
l 46
4
256
24
389
37
29 A
l ""JY
Are
a 41
8 )9
20
2
41
4 0
0 61
6
l29
31
Co
rwl1
1•
Are
a SP
-55
1001
16
0 16
16
-
2 17
6 18
36
3 lb
93
9
456
46
9 I
3 0
0 0
12
I 35
7 36
SP
-57A
IC
Xll
I'll!
2l
l 46
5
244
24
330
l3
103
10
433
43
16
2 55
5
1 0
72
7 m
21
6 SP
-58
1005
14
4 14
37
4
181
18
413
41
I,()
4
453
45
14
1 31
3
0 0
45
4 l2
6 l2
SP
-81
500
84
17
29
6 IU
23
U
I 216
62
12
19
3 )9
17
3
24
5 2
0 43
9
151
)()
SP-3
2 50
0 10
8 22
22
4
130
216
190
38 S
j>er
oer4
8F°"
'iblo
n ~--
48
28
6 0
0 0
0 28
6
104
21
ll'l'E
ll A
vt:M
1:
2ll
4 24
lO
9
)9
4 4
0 9
29
<JG
-11-
2224
ll
t!S
huer
13-
22 W
oll S~l C
o,..
. 50
3 12
2 24
27
5
149
)()
88
17
47
9 13
5 27
24
5
18
4 I
0 43
9
176
35
<JG
-14-
2220
50
0 !C
l! 22
}4
7
142
28
119
24
95
19
214
43
17
3 24
5
3 I
44
9
100
2ll
<N
rl7-
2214
50
0 13
3 27
49
10
18
2 36
15
7 31
48
10
20
5 41
14
3
24
5 3
I 41
8
72
14
n '""
n..a
trr
of C
CU
ltti
ln
-.c
h a
ateg
o 1. O
t.rer
CatT
i1 lr
clu
des
: -.
...co
v1te
. 1o
t1t•
. ba
ilvy
ani
adlJ
.gen
ic m
iner
al&
, OSRnti~
9re.a
, .u
.rt.
x,
pore
..-
:es.
ard
~-
Sae
TA
BL
l
or
eq:>
Lar
atim
ot
gral
n c
atq
ory
pa.
rWE
teno
.
w
0
non-undulose extinction. Monocrystalline quartz derived from schists,
gneisses and granitic rocks commonly exhibits undulose extinction
(Williams and others, 1982).
Polycrystalline Quartz
Two different types of polycrystalline quartz, equadimensional
(30%) and foliated (70%), were predominant within the Spencer
31
Formation. Equadimensional polycrystalline quartz consisted of a
non-orientated aggregate of equant quartz crystals with both sutured and
straight crystal boundaries. Occasionally crystal aggregate size varied
and was non-uniform. Foliated polycrystalline quartz grains consisted
of elongated and orientated crystal aggregate which exhibited both
straight and sutured crystal boundaries. Chert grains were found in
many of the samples. It is recognized in thin section by its
microcrystalline or microgranular makeup of equant aggregate quartz
crystals. Typically equadimensional polycrystalline quartz grains are
characteristic of a igneous rock source while foliated polycrystalline
quartz grains are commonly derived from rocks of metamorphic origin
(Williams and others, 1982).
Feldspar
Total feldspar content is consistent throughout the Spencer
Formation sampling area and commonly equals or exceeds total quartz
content except in some samples collected from the lower member or more
quartzose arkosic rich lithofacies. Approximately 40 percent of the
framework grains in each sample consisted of plagioclase and potassium
feldspars combined. Although total feldspar content was uniform
throughout the samples, potassium feldspar content within the lower
member is commonly higher than in the upper member, where as in the
lower member plagioclase feldspar framework grains are more abundant
than potassium feldspar. Like quartz, feldspar detrital framework
grains are angular to sub-angular.
Plagioclase Feldspar
32
Plagioclase feldspar was stained by the method outlined by Bailey
and Stevens (1960) and is distinguishable in thin section by its
reddish-pink color when viewed in plane polarized light. Plagioclase is
commonly clear and unaltered, although, some framework grains show
noticeable alteration or replacement with sericite and clay minerals
around the periphery and less commonly along cleavage planes.
Plagioc~ase chemical composition was calculated, by the method discussed
in Shelley (1985, p. 258) and illustrated by Hammond (personal
communication, 1985). One-hundred plagioclase feldspar detrital grains
were counted for each selected sample to determine the plagioclase
composition percentages in Table III. According to Williams and others
(1982), determination of plagioclase chemical composition serves as one
of the best indicators of provenance.
Plagioclase feldspar composition ranges from albite (An=0-10%) to
labradorite (An=50-70%) with oligoclase being the most common analyzed
in thin section. Albite and oligoclase are more common within the lower
member lithofacies while andesine and labradorite are predominant within
the upper member. Table III illustrates individual plagioclase
compositional percentages for selected Spencer Formation samples.
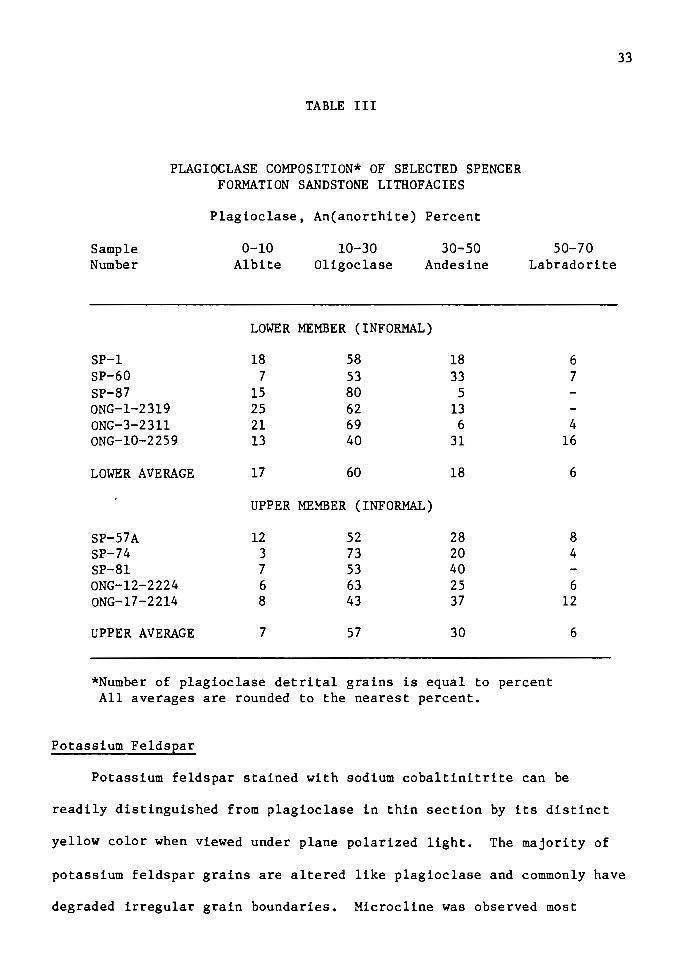
TABLE III
PLAGIOCLASE COMPOSITION* OF SELECTED SPENCER FORMATION SANDSTONE LITHOFACIES
Sample Number
SP-1 SP-60 SP-87 ONG-1-2319 ONG-3-2311 ONG-10-2259
LOWER AVERAGE
SP-57 A SP-74 SP-81 ONG-12-2224 ONG-17-2214
UPPER AVERAGE
Plagioclase, An(anorthite) Percent
0-10 Al bite
10-30 Oligoclase
30-50 Andesine
LOWER MEMBER (INFORMAL)
18 58 18 7 53 33
15 80 5 25 62 13 21 69 6 13 40 31
17 60 18
UPPER MEMBER (INFORMAL)
12 52 28 3 73 20 7 53 40 6 63 25 8 43 37
7 57 30
50-70 Labradorite
6 7
4 16
6
8 4
6 12
6
*Number of plagioclase detrital grains is equal to percent All averages are rounded to the nearest percent.
Potassium Feldspar
Potassium feldspar stained with sodium cobaltinitrite can be
readily distinguished from plagioclase in thin section by its distinct
yellow color when viewed under plane polarized light. The majority of
33
potassium feldspar grains are altered like plagioclase and commonly have
degraded irregular grain boundaries. Microcline was observed most
34
readily, being distinguished by its distinct cross-hatch twinning, while
orthoclase generally shows simple or no twinning. Sanidine shows
similar characteristics to orthoclase but can be determined by its small
optic angle (Williams and others, 1982). Sanidine was not readily
identified in thin section and is believed to be rare if not absent from
the samples analyzed. The occurrence of orthoclase and microcline was
only noted and their relative percentages were not determined.
Rock Fragments
Volcanic Rock Fragments
Three types of volcanic rock fragments were observed in thin
section, they include; 1) microgranitic, 2) microlithic, and 3) felsic.
Microgranitic rock fragments were distinguished by the presence of
granular quartz, potassium feldspar, and muscovite within the rock
fragment. They were differentiated from foliated metamorphic rock
fragments, which are often compositionally alike, by the lack of
schistose fabric or foliation.
Microlithic volcanic rock fragments are the most prevalent lithic
grains studied in thin section. They consisted of small lath-shaped
phenocrysts of plagioclase, commonly with no apparent textural
arrangement, incorporated within an aphanitic groundmass. According to
Williams and others (1982) microlithic rock fragment composition varies
from intermediate to mafic.
Felsic volcanic rock fragments are least common in thin section.

Metamorphic Rock Fragments
Quartzite and schistose rock fragments were the two types of
metamorphic rock fragments found in thin section. Quartz grains
consisting of larger irregular crystal aggregates showing stretched and
sutured grain boundaries were categorized as quartzite. Schistose-type
rock fragments consisted of foliated and elongated crystals of quartz
and mica, predominately muscovite.
Sedimentary Rock Fragments
35
Sedimentary rock fragments were noted in trace amounts in most
samples analyzed. Only aphanitic grains of siltstone or shale and chert
were identified.
Mica
Both muscovite and biotite are present in all samples analyzed.
Mica framework grains commonly account for five to ten percent of the
sample composition. Biotite is generally two to three times more
abundant than muscovite, but in some samples equal amounts were
observed. Mica flakes noted in thin section are commonly bent and often
pinched between more rigid mineral grains due to post depositional
compaction.
Glauconite
Glauconite was found only in trace amounts within some of the
Spencer Formation sandstone samples. Typically glauconite occurred as
small rounded greenish-brown pellets commonly squeezed between opposing

36
detrital grains. Al-Azzaby (1980, pp. 40-42) discussed glauconite and
its implications within the Spencer and Yamhill Formations studied in
Yamhill and Washington Counties, Oregon. He believes that the
glauconite may have formed within the Spencer Formation from the
degradation of igneous and metamorphic rock fragments. Because
glauconite is readily deformed, it may be more abundant in Spencer
Formation sandstone than determined by petrography. It is probable that
glauconite could have been misinterpreted as detrital clay minerals,
become incorporated into matrix material, or been destroyed during the
process of sandstone disaggregation.
Clays
Because of the fine-grained nature of clays, they are very
difficult to differentiate optically (Shelley, 1985, p. 237). In thin
section clays were noted but no attempt was made to identify clay
minerals present although the majority was probably characteristic of
the smectite group. Detailed determination of clay mineral assemblages
present in Spencer Formation sandstone lithofacies is discussed in
Chapter's IV and V, Scanning electron microscopy (SEM) and X-ray
diffraction of clay minerals, where both SEM-EDAX and X-ray diffraction
(XRD) techniques were utilized.
Heavy Minerals
Heavy minerals were separated by the technique described by Van
Atta (personal communication, 1985) utilizing the heavy liquid
tetrabromo ethane (specific gravity 2.96 at 25° C). These mineral
37
separates are widely utilized for studying the provenance of sedimentary
formations (Leupke, 1984). After determining weight percentages of
heavies in a two gram sample, covered grain mounts were made. A minimum
of two-hundred heavy mineral grains were counted for each sample (counts
were normalized to equal 100 percent). Opaque heavy minerals, which
predominately include magnetite and ilmenite, were eliminated from
counting procedures because they occur in dominately equal amounts in
all samples prepared and therefore would have little bearing on
determining heavy mineral petrographic trends.
The Spencer Formation upper member sandstone lithofacies contains
heavy mineral assemblages that constitute as much as 12 percent (weight
percent) of selected samples. Common heavy minerals found within the
Spencer Formation are epidote, hornblende, augite, zircon and apatite,
with minor amounts of garnet, sphene, tourmaline, rutile and kyanite.
Percentages of heavy minerals characteristic of selected Spencer
Formation samples are listed in Table IV.
Epidote
Epidote is the most common heavy mineral found within the Spencer
Formation sandstones except for hornblende in some samples within the
upper member. Epidote occurs typically as yellow to greenish-yellow
polycrystalline grains exhibiting a kaleidoscope appearance under
cross-polars when the microscope stage is rotated. Epidote is commonly
found as a heavy mineral in rocks of metamorphic origin characteristic
of greenschist facies or metamorphosed carbonate rocks (Shelley, 1985,
p. 177).

Hornblende
Hornblende is one of the most widely distributed rock-forming
minerals, occurring in both igneous and metamorphic rocks (Klein and
others, 1985). Within the Spencer Formation four different types of
hornblende were determined; green etched, brown, blue-green and
oxyhornblende or basaltic hornblende. Green hornblende and augite
commonly exhibit very pronounced spike-like terminal protrusions
characteristic of etching. Typically etched amphibole and pyroxene
grains are too delicate to be transported any distance without
degradation and are likely a product of epidiagenesis and may have
continued to form from post depositional percolating ground water
(Ehlers and Blatt, 1980, p. 400). Scanning electron microscopy
evaluation of selected upper member samples (Chaper IV) show etching
effects on hornblende and augite grains. Brown hornblende exhibits
similar optical properties as green hornblende but rarely exhibits
etching. Blue-green hornblende is typically associated with a
metamorphic source (Dana and Ford, 1949). Oxyhornblende (Basaltic
hornblende) which is recognized by its intense brown red-brown color
(Shelley, 1985, p. 216) only occurs in one sample, SP-60, collected in
the lower member northwest of Albany, Oregon. Basaltic hornblende
occurs in a variety of volcanic rocks ranging in composition from
basalts to trachytes (Deer and others, 1967, p. 176).
One grain of glaucophane was found within the Deshazer sidewall
core sample ONG-10-2259, which is characteristic of the middle part of
the Spencer Formation sandstone lithofacies. Shelley (1985, p. 218)
states that glaucophane is characteristic of regionally metamorphosed
38

rocks typical of greenschist to higher-pressure lawsonite-glauconite
facies.
Augite
39
Augite averages two percent in the lower lithofacies and seven
percent in the upper member with two samples of the upper member, SP-74
and SP-81, having elevated percentages of green etched augite. Augite
is commonly gray-green and is etched similar to green hornblende but can
be distinguished by the lack of pleochroism and a large extinction
angle. Typically augite comes from basalts and alkaline igneous rocks
such as syenites, trachytes, and phonolites (Shelley, 1985).
Zircon
Euhedral to subhedral prismatic colorless, brown and rose colored
zircon grains were most common. Minor angular to sub-angular and well
rounded grains are also present. Extreme relief, commonly exhibiting a
series of halos concentric to the grain boundary, and straight
extinction were utilized for distinguishing zircon. Detrital zircon
grains average twelve percent of the heavy minerals examined within
Spencer Formation sandstone lithofacies studied. According to Shelley
(1985, p.173) zircon is a common accessory mineral in volcanic rocks,
plutonic igneous rocks, predominately granites and syenites, and may
also occur as an accessory mineral in schists and gneisses.
Apatite
Apatite which averages nine percent, is the next most abundant
heavy mineral found in the Spencer Formation sandstone lithofacies.
Apatite in the samples is predominately colorless subhedral prisms and

TABL
E IV
HEAV
Y M
INER
AL
ASS
EMBL
AG
ES
FOUN
D IN
SE
LEC
TED
SP
ENC
ER
FORM
ATI
ON
SA
ND
STO
NE
OU
TCRO
P SA
MPL
ES
Sam
ples
Num
bers
Hea
vy
Min
eral
S
P-1
SP
-57A
S
P-6
0 S
P-7
4 S
P-8
1
Ep
ido
te
47
.5
23
.0
26
.5
19
.5
19
.0
Gre
en
Ho
rnb
len
de
8.5
3
1.0
1
0.5
2
8.0
2
4.5
B
row
n H
orn
ble
nd
e 5
.0
10
.0
5.0
1
.5
2.5
B
lue-
gre
en H
orn.
--
2.5
0
.5
2.0
1
.0
Ox
yh
orn
ble
nd
e --
--1
.5
Au
git
e 1
.5
10
.0
4.0
1
2.5
2
3.5
Z
irco
n
19
.0
7.0
1
4.0
1
7.0
1
2.0
A
pati
te
6.0
9
.5
12
.5
7.5
5
.0
Gar
net
2
.5
1.5
1
.5
3.0
6
.5
Sph
ene
3.5
2
.0
11
.5
4.0
3
.0
To
urm
alin
e 3
.5
1.5
5
.5
2.0
1
.0
Ru ti
le
2.0
1
.0
5.5
2
.0
1.5
K
yan
ite
1.0
1
.0
1.5
1
.0
0.5
W
eigh
t P
erce
nt*
3
.7
12
.4
11
.5
8.4
5
.5
SP
-87
26
.0
4.0
2
.0
2.0
1
7,0
1
2.0
1
9.0
1
1.0
4
.0
3.0
3.6
*Wei
ght
per
cen
t o
f he
avy
min
eral
s in
S
pen
cer
Fo
rmat
ion
sa
mp
les
are
calc
ula
ted
fr
om
a tw
o gr
am
sam
ple
. H
eavy
min
eral
s co
nst
itu
te
that
po
rtio
n
from
th
e 3
.75
to
4
.25
p
hi
inte
rval.
.,...
0

TABL
E IV
(C
ON
TIN
UED
)
HEAV
Y M
INER
AL
ASS
EMBL
AG
ES
FOUN
D IN
SE
LEC
TED
SP
ENC
ER
FORM
ATI
ON
SI
DEW
ALL
CO
RES
FROM
TH
E D
ESH
AZE
R 1
3-2
2 E
XPL
OR
ATI
ON
W
ELL
Sam
ples
Num
bers
Hea
vy M
iner
al
ON
G-1
O
NG
-3
ON
G-1
0 O
NG
-12
ON
G-1
7 O
NG
-23
2319
2
31
l 22
59
2224
22
14
2202
Ep
ido
te
36
.0
42
.5
32
.5
21
.0
13
.0
17
.0
Gre
en H
orn
ble
nd
e 1
2.0
1
2.0
5
.5
33
.0
41
.5
7.0
B
row
n H
orn
ble
nd
e 5
.0
2.5
2
.5
3.5
4
.5
2.0
B
lue-
gre
en H
orn.
2
.0
2.5
--
1.0
5
.5
Ox
yh
orn
ble
nd
e A
ug
ite
6.0
7
.0
5.0
4
.0
5.0
Z
irco
n
12
.0
6.0
8
.0
4.5
1
2.5
2
0.0
A
pati
te
ll.O
1
3.5
u
.o
10
.0
6.5
1
3.0
G
arn
et
5.0
4
.5
14
.5
15
.0
2.0
2
5.0
S
phen
e 4
.0
4.0
12
'.o
4.0
5
.5
7.0
T
ou
rmal
ine
4.0
2
.0
3.0
1
.0
1.5
6
.0
Ru ti
le
2.0
2
.0
4.5
2
.5
1.5
3
.0
Kya
ni te
1.0
1
.0
0.5
0
.5
1.0
A
nd
ulu
site
--
0.5
G
lauc
opha
ne
----
0.5
W
eigh
t P
erce
nt*
2
.3
3.5
1
1.9
1
.9
6.7
1
.2
*Hea
vy
min
eral
s co
nst
itu
te
that
po
rtio
n
from
th
e 3
.75
to
4
.25
p
hi
inte
rval.
So
me
Des
haz
er
13
-22
si
dew
all
co
re
sam
ple
s w
eig
hte
d
less
th
an
two
gram
s so
w
eig
ht
per
cen
tag
es
wer
e n
orm
aliz
ed
bas
ed
on in
itia
l w
eig
ht.
"" ......
sub-rounded to rounded grains. The abundance of rounded grains
indicates that much of the apatite came from pre-existing recycled
sedimentary rocks. Apatite is a common accessory mineral found in a
variety of igneous and metamorphic rocks (Shelley, 1985, p. 303).
Garnet
Garnet occurs as small broken subhedral to anhedral grains
(chips). Garnet grains average five percent of heavy minerals within
the Spencer Formation sandstone lithofacies studied. The majority of
garnet observed was reddish-pink or rose colored which is most
characteristic of iron-rich almandine (Shelley, 1985, p. 158). This
variety of garnet is typically associated with regionally metamorphosed
rocks, commonly schists.
Sphene
42
Sphene occurs as sugary-brown sub-hedral chips and less commonly as
cross hatched euhedral diamond-shaped grains. Sphene accounts for about
three percent of the heavy minerals found within the selected Spencer
Formation sandstone samples, except for SP-60, ONG-1-2319 and
ONG-10-2259, which are all from the lower member in the Monmouth area,
which all contain approximately 11 percent sphene. Sphene was
recognized by its distinctive brown color and high dispersion. Shelley
(1985, p. 171) states that sphene is a common accessory mineral found in
intermediate and acid plutonic igneous rocks but can occur in a wide
variety of metamorphic rocks.

43
Tourmaline
Tourmaline occurred as green and less commonly black and dark blue
euhedral to subhedral prismatic shaped grains. Tourmaline
characteristic of the Spencer Formation samples is presumed to be of the
iron-rich schorl variety because of the color distinctions and strong
pleochroism. The lower member sandstone lithofacies averages 3.5
percent tourmaline while the upper member averages 1.5 percent of the
heavy minerals examined. Granites, pegmatites, schists and gneisses
commonly contain schorl as an accessory mineral (Shelley, 1985, p. 186).
Rutile
Rutile occurs in trace amounts (4 to 6 grains) in the Spencer
Formation sandstones analyzed and are typically brown to deep-red
elongated prisms and broken subhedral grains. According to Deer and
others (1967, p. 417) and Shelly (1985, p. 280) rutile is a widely
distributed accessory mineral found in intermediate to acidic plutonic
rocks as well as iron-rich schists and gneisses. In sample SP-87, from
the lower member within the Monmouth area, contains one light brown
hornblende grain with numerous very small rutile needles.
Kyanite and Andalusite
Kyanite only occurs in trace amounts (1-3 grains) in the heavy
mineral fraction of the Spencer Formation analyzed. One grain of
andalusite was identified within the lower member, in the Deshazer well
sidewall core sample ONG-3-2311. Both kyanite and andalusite occur as
angular grains. Kyanite and andalusite typically form in regionally
metamorphosed pelitic rocks according to Shelley (1985, p. 161 & 162).

Sandstone Petrography
Spencer Formation sandstone framework mineral grains consist of
varying amounts of quartz, feldspar, lithic rock fragments (volcanic,
metamorphic and sedimentary), mica (predominately biotite with lesser
muscovite), and heavy mineral assembladges (epidote, amphibole, and
pyroxene with lesser amounts of zircon, apatite, garnet, sphene,
tourmaline and rutile). Table II, lists detrital framework mineral
grains. Additional information depicting plagioclase composition and
heavy mineral separates of selected samples are listed in Table's III
and IV. Descriptions of framework grains depicting both mineral and
rock components are listed from page 29 to 36. The majority of samples
collected lack cement and are friable, except for those samples
collected from the Corvallis and Albany area. Calcite, clays, silica
and iron oxides were the four types of cement noted in decending order.
Typically feldspar grains equal or outnumber quartz, lithic
fragments, and accessory minerals, except in a few samples (SP-1, SP-3,
SP-11, SP-67 and SP-81) collected from sandstones characteristic of the
lower member. These samples contain more monocrystalline quartz.
Plagioclase feldspar ranges from 14 to 41 percent and is more abundant
than potassium feldspar which varies from 3 to 21 percent (Table II).
All the samples analyzed contained varying amounts of fresh and altered
feldspar grains which are angular to subangular. Potassium feldspar
grains more commonly showed noticeable grain degradation due to
weathering along grain boundaries and cleavage planes.
44
Plagioclase composition ranges from albite to labradorite. Variety
in composition occurred in many of the samples, commonly having two or

three different types of plagioclase occurring within each sample.
Oligoclase was the most abundant plagioclase compositon observed. A
summary of plagioclase composition found in selected Spencer Formation
samples is given in Table III.
Potassium feldspar consisted predominantly of microcline with
lesser amounts of orthoclase. Sanidine was not readily observed and is
believed to be rare in these samples. Increased amounts of potassium
feldspar are characteristic in the lower member. Those samples which
have higher monocrystalline quartz content generally contain more
potassium feldspar (Table II).
45
Monocrystalline quartz grains, predominately clear and some with
small inclusions, occur as a major constituent of all the samples
ranking only second to plagioclase grains. Monocrystalline quartz
grains average 28 percent in the lower member sandstone lithofacies as
well as the lower portion of the Deshazer 13-22 well and 20 percent in
the upper member sandstone lithofacies. The ratio of monocrystalline to
polycrystalline quartz is commonly 3 to 1 in many of the samples.
Polycrystalline quartz averages seven and four percent for the lower and
upper member sandstone lithofacies, respectively.
Lithic fragments make up as much as 18 percent of Spencer Formation
sandstones. The most common rock fragments noted are of the microlithic
volcanic variety containing abundant plagioclase laths. These lithic
grains are most abundant in the upper member sandstone lithofacies.
Several samples from the upper member within the the Monmouth, Oregon
area, exhibit granophyric texture illustrating eutectic intergrowths of
quartz and alkali feldspar.

The next most abundant lithic rock fragments were schistose
metamorphics with foliated and elongated crystals of quartz and mica
(predominately biotite). These rock fragments, which make up between
one and nine percent of the sample, are more prevalent within the lower
member and in those samples stratigraphically lower in the Deshazer
13-22 well.
46
Sedimentary rock fragments consisting of siltstones and claystones
are rare. They make up less than one percent of the sandstone except
for two samples (SP-5 & SP-65). Chert grains are found in trace amounts
in many of the samples.
Heavy mineral assemblages noted in Spencer Formation sandstone
lithofacies were epidote, amphibole (hornblende and glaucophane),
pyroxene (augite), zircon, apatite, garnet, sphene, tourmaline, with
trace amounts of rutile, kyanite and andalusite. The relative
abundances of these heavy minerals in selected Spencer Formation samples
are shown in Table 4.
Epidote and hornblende are the two most abundant heavy minerals.
Epidote is most common within the lower member sandstone lithofacies
averaging 36 percent. Hornblende, predominately of the green variety
and commonly etched, is two to three times more abundant in the upper
member, averaging 32 percent.
Augite is the only other heavy mineral which shows any affinity in
Spencer Formation sandstone lithofacies. Augite averages two percent in
the lower member and stratigraphically lower within the Deshazer well,
nine percent in the upper member and five percent stratigraphically
higher in Spencer Formation sandstone samples within the DeShazer 13-22
well.

47
Zircon, apatite, garnet, sphene, tourmaline, rutile, kyanite,
andalusite and glaucophane occur in variable amounts with the Spencer
Formation lithofacies studied (Table IV). Although these heavy minerals
show little correlation with lithofacies variations they are of extreme
importance in determining provenance.
Sandstone Classification
Sandstone classified as "arkosic" contains 25 or more percent
feldspar, predominantly potassium feldspar according to Pettijohn and
others (1972), Folk (1974), and Williams and others (1982).
The data obtained from point counts is normalized and plotted on
ternary diagrams. Explanation of grain parameters utilized for
classification of sandstones is shown in Table V. Recalculated
normalized values utilized in ternary compositional diagrams are
outlined in Table VI.
Folk's (1974) sandstone classification (QFL ternary diagram),
modified with stability poles adapted from Hayes (1979) was utilized for
classifying Spencer Formation sandstone samples (Figure 9a). This
classification scheme was used because: 1) it best graphically depicts
sandstone categories, 2) it emphasizes provenance, climate and tectonic
factors, and overall mineralogic characteristics, 3) it serves as a
basis for more recent work done by Dickinson and Suczek (1979) relating
sandstone composition and plate tectonics, and 4) it allows for
comparison between other studies previously done.
The majority of late Narizian arkosic sandstones found in the
Pacific northwest, are typically enriched with plagioclase rather than

Ternary Diagram
QFL
QmFLt
QmPK
TABLE V
DEFINITION OF GRAIN POPULATIONS FOR TERNARY COMPOSITIONAL DIAGRAMS
Uppermost Pole
Q
Quartzose grains (= Qm + Qp)
Qm
Monocrystalline quartz grains
Qm
(same as above)
Lower Left Pole
F
Feldspar grains (= p + K)
F
(same as above)
p
Plagioclase Feldspar grains
Lower Right Pole
L
Unstable aphanitic lithic fragments (= Lv + Ls)
Lt
Total aphanitic 1i thic fragments (= L + Qp)
K
Potassium Feldspar grains
potassium feldspar (Byrnes, 1985). Winters (1984, p. 63, fig. 21) and
Byrnes (1985, p. 24, fig. 7) both illustrate ratios of ploycrystalline
quartz (Qp) versus total quartz (Qp + Qm), plagioclase (P) versus total
feldspar (F), and volcanic lithics (Lv) versus total unstable lithics
(Lv + Ls) content for eight middle to late Eocene arkosic sandstone
formations in western Oregon and Washington (Figure 10). Averages for
the Spencer Formation upper and lower members area also shown in Figure
10. All eight formations noted by Winters (1984) and Byrnes (1985)
48
showed plagioclase was more abundant. Gandera (1977), Al-Azzaby as well
as this present study (Table VI) illustrate that plagioclase content

CHfMtCA.U V IYA8lE MECMA.NtCA.ll V Ill A.Ill
a
1 Owat11ar•nHe 2 s..,o.,ko•• 3 Swltlt1ft.atenH•
' A1ll.oae
6 UtNc: A.1koae
e Fetti•o••Mc Lltft.atenft•
r u1,..,.,.,.
F l 1:1 1:1 t·3
CHEMtCALL Y UNST AelE WECHAHfCAll Y IT AelE
•• ••• ,.
Q
...
CHEMICA.ll'f IJHSTAeLE MECHA.NtCALLY UHITAeLf
* Delhe1e' Well 8e•piea
• Burlece •••,,lea
F L
Figure 9. a) Folk's (1974) classification scheme for sandstone compostion modified with stability poles (Hayes, 1979). The grain parameters for the QFL ternery diagram are: total quartz (Q), total feldspar (F), and total aphanitic lithic fragments (L). b) Spencer Formation samples plotted.
49

overall is more abundant than potassium feldspar within the Spencer
Formation sandstones.
so
Utilizing Folk's classification (Figure 9), two groupings of
samples, studied in this project, could be subdivided into informal
upper and lower Spencer Formation members such as Gandera (1977) and
Al-Azzaby (1980) did. Spencer Formation samples from both outcrop
locations and the Deshazer 13-22 well sidewall cores are plotted in
Figure 9b. A majority of the samples plot within the "arkose" category
with the remainder classified as "lithic arkoses". Lower member samples
average 4S percent quartz, 45 percent feldspar (potassium feldspar 11
percent, plagioclase 26 percent) and 10 percent lithic fragments. The
upper member samples averaged 30 to 35 percent quartz, SS percent
feldspar (potassium feldspar 9 percent, plagioclase 30 percent) and lS
percent lithic fragments.
Bruer and others (1984) place the more arkosic lithofacies (Clark
and Wilson equivalent) stratigraphically above a major unconformity
separating the Spencer Formation from the Yamhill Formation. This study
substantiated Bruer's criteria, finding that those sandstones collected
from both outcrops and the Deshazer 13-22 well, within the lower part of
the Spencer Formation closest to the Yamhill Formation contact, are more
arkosic. Sandstones found stratigraphically higher are more lithic.
Interpreting these two different sandstone lithofacies with respect
to their stratigraphic positon is very difficult because only scattered
outcrops occur and the complex nature of faulting patterns is obscured
at the surface. Only with sophisticated reliable seismic methods and
interpretation could fault locations and offsets be known, allowing

SPL SPU cow SK RN NA RO CH
.10
.10
.. 40 •. 3'
•. 21 •. 30 •. 31
t.20 • 11 • 11
•. 01
0
Qp/Q
1.0 I
•. 83 .... •. 13 •. 7 7 ~ .10
• 72 .... .... r-•o •.68
.40
.20
P/F
t.O
•. u
l.10 •. 73
•. 71 •. 71 •. 72 ....
.10 .... •. 38 .40
.20
0
Lv/L
Figure 10. Ratio of polycrystalline quartz (Qp) to total quartz (Q), plagioclase (P) to total feldspar (F), and volcanic lithic fragments to total lithic fragments (Lv/L) for Spencer Formation informal upper and lower members. The diagram also shows other middle to late Eocene arkosic sandstone units for comparison (modified after Byrnes, 1985, his Figure 7).
51

52
for the samples collected to be accurately positioned stratigraphically.
Distribution of quartz, feldspar and heavy minerals within the
Spencer Formation sandstones provided the best indicators of
provenance. Petrographic studies showed that the lower (member)
lithofacies has characteristically more monocrystalline quartz and
potassium feldspar which are diagnostic of a metamorphic plutonic
source. Epidote is also more prevalent within the lower lithofacies
reemphasizing a metamorphic origin.
An overabundance of plagioclase feldspars is characteristic of
Pacific northwest Narizian sandstone formations (Byrnes, 1985).
Predominance of plagioclase within these formations is attributed to
plagioclase-enriched Pacific-circium batholiths (Dickinson, 1970). In
this study elevated amounts of plagioclase occurred in the upper member
of the Spencer Formation sandstone lithofacies. Plagioclase composition
(oligoclase and andesine) from selected upper member sandstone samples
indicated that the elevated plagioclase content was characteristic of a
volcanic source.
Pittman (1970) believes that plagioclase feldspar composition is an
essential indicator of provenance in sedimentary rocks. According to
Dickinson (1970) "a majority of granitic rocks in the Circum-Pacific
batholiths are plagioclase-rich varieties" and are commonly classified
as granodiorites. Pettijohn and others (1972) also made reference to
"plagioclase arkoses" citing the Paleocene Swauk Formation in Washington
as an example, for which they believe the source was presumably a quartz
diorite.
High percentages of amphibole (hornblende) and pyroxene (augite)

are also characteristic of the upper sandstone lithofacies.
Within the next section of this chapter entitled "Detrital Modes"
Dickinson and Suzek, (1979) sandstone classificaiton schemes (QFL,
QmFLt, and QmPK ternary plots) emphasize provenance characteristics and
were applied to Spencer Formation sandstone lithofacies.
Detrital modes
53
Detrital framework mineral grain parameter categories (Table VI)
developed by Dickinson and Suczek (1979) are utilized in this study for
constructing additional ternary compositional diagrams (Figures 11 to
14) which are used to define provenance. According to Dickinson and
Suczek (1979) these ternary plots emphasize the following aspects of
sedimentary rocks: Q-F-L, shows mineral grain stability (weathering,
provenance and transport); Qm-F-Lt, shows mineral grain size of source
rock; and Qm-P-K, shows the dominant monocrystalline grain types.
Dickinson and Suczek (1979) believe that sandstone composition is
directly related or influenced by provenance and modes of transportation
which ultimately refelct on sandstone maturity. Based on samples
collected worldwide from a variety of basinal enviroments, Dickinson and
Suczek (1979) categorized three dominant provanence types: 1)
Continental Block, 2) Recycled Orogen, and 3) Magmatic Arc (Figures lla
and 12a).
The QFL ternary diagram (Figure 11) emphasizes grain stability with
relation to weathering, provenance relief, transportation mechinism and
source rock (Dickinson and Suczek, 1979). Unlike Folk's (1974)
classification, although the exact same framework grain components (only

TABL
E VI
SPEN
CER
FORM
ATIC
N l'lJ
RMA
LIZE
D P
OIN
T C
Xl.lN
l' Il\
TA
UIT
LIZE
D F
OO. ~ D
IAG
IWf>
SAM
P1E
NAfE
Q
F
L
Qn
F L
t Qn
Q
p L
Q
n
I.G
ER
f>EM
BER
(IN
FO
m1\
L)
SP-1
48
45
7
Wes
tern
Tua
lati
n V
alle
y A
rea
44
49
7 74
14
12
48
SP
-3
50
41
9 46
45
9
72
13
15
51
SP-5
45
47
8
38
53
9 65
20
15
42
SP
-11
48
44
8 43
49
9
69
17
14
47
SP-6
5 43
48
9
36
54
10
63
20
17
40
SP-6
7 46
45
8
40
51
9 65
20
15
44
SP
-69
36
49
15
30
53
16
54
16
29
36
1'tn
loou
th A
rea
SP-1
2 43
54
3
40
57
3 83
11
6
42
SP-8
1 44
41
15
39
45
16
62
14
25
47
SP
-87
43
45
ll
40
48
12
68
11
21
45
SP-6
0 36
49
14
A
lbin
y A
rea
31
53
16
56
15
29
37
SP-6
2 39
40
21
34
43
23
53
11
35
44
SP
-908
34
56
10
29
60
ll
60
18
23
32
SP-3
5 32
58
10
Sp
ence
r F
onm
tion
Typ
e A
rea
30
60
10
68
8 23
33
L<l.J
ER A
VER
/CE
42
47
11
37
51
12
65
15
20
42
DeS
haze
r ll
-22
Wel
l Si
dew
all
C.O
res
(N}-
1-23
19
42
55
4 38
58
4
77
15
8 39
(N
}-}-
2311
42
53
5
38
57
5 76
13
11
40
(N
}-5-
2276
37
57
6
32
61
6 71
15
14
35
(N
}-10
-225
9 42
50
8
37
54
9 69
15
16
41
p 34
35
39
43
43
48
48
39
40
33
54
33
38
55
42
36
40
40
32
K 19
15
19
10
16 7 15
20
13
22 9 23
30
12
17
25
20
25
27
Ul
.l:-

TABl
.E V
I ( a
Nl'I
NU
ED
)
SPEN
CER
FORM
ATI<
N tm
-tAL
IZE
D P
OIN
r C
UJN
l' )}
ITA
U
TILI
ZED
FOO
. TE
RNAR
Y DI
AGRA
M
SAM
PI.E
NA
IB
Q
F L
Q
n F
Lt
Qn
Qp
L
Qn
p K
UPPE
R M
EMBE
R (IN
FOO
MAL
) '
SP
-8
Sl
4S
4 W
este
rn T
uala
tin
Val
ley
Are
a 48
47
s
83
9 8
so
34
16
SP-7
1 31
so
20
27
S3
21
so
11
39
34
Sl
16
SP
-74
40
42
18
36
4S
20
S7
11
31
4S
41
14
SP-7
SA
30
56
14
26
S9
15
SS
14
31
30
4S
24
~thArea
SP-1
4 31
S3
17
27
56
18
S3
11
3S
32
42
2S
SP
-79
21
SS
24
20
56
24
43
4 S3
26
64
10
SP
-83
39
48
14
3S
so
14
6S
9 26
41
46
13
SP
-86
46
46
8 42
49
9
73
13
15
46
43
11
SP-S
9 3S
S7
8
Alb
any
Are
a 30
61
9
66
lS
19
33
62
s C
orva
llis
Are
a SP
-SS
27
71
2 25
73
2
8S
9 6
26
S9
lS
SP-5
7A
33
58
10
28
62
10
63
lS
23
31
S2
16
SP-5
8 27
67
7
22
71
7 64
16
20
24
69
7
SP-8
8 32
SS
12
26
60
13
54
19
28
30
47
22
SP-3
2 33
60
7
Spen
cer
Fonn
atio
n Ty
pe A
rea
29
64
7 68
14
18
31
5S
14
UPPE
R AV
ERAr
n 34
54
12
30
S7
12
63
12
25
34
Sl
15
DeS
haze
r 13
--22
Wel
l Si
dew
all
Cor
es
<ID
-12-
2224
46
41
13
41
45
14
64
14
22
47
34
18
<I
D-1
4-22
20
36
54
11
30
58
12
58
18
24
34
37
30
<ID
-17-
2214
43
48
10
35
54
11
60
22
18
39
46
14
See
TA
Bl.E
V f
or e
xpla
nati
oo o
f gr
ain
cate
gory
J:r
amet
ers.
NC
JIB:
Coo
:put
ed v
alue
s fo
r S
OO
E ca
tego
ries
may
ve
a 1
% er
ror
fact
or.
Vl
Vl
QFL diagram) were utilized, Dickinson and Suczek's, (1979)
classification is predominately used for recgonization of provenance.
56
Nearly all the Spencer Formation samples plotted within the
continental block provenance, with a few samples depicted between this
and within the plutonic enriched portion of the magmatic arc provenance.
Notably, total feldspar content (F) is increased in those samples
collected in the upper member.
The QmFLt ternary plot (Figure 12) emphasizes lithic content rather
than stressing quartzose-type grains illustrated in the QFL ternary
diagram (Figure 11). This ternary diagram (QmFLt) shows a shift of
increased total feldspar (F) and lithic (Lt) content than noted in the
QFL plot (Figure llb). Oregon Natural Gas Development Company's
DeShazer 13-22 well best illustrates this increased amount of lithic
components (QmFLt plot) grading upwards into the
Spencer Formation lithofacies typical of the upper member (Table VII).
Spencer Formation samples plotted in the QmFLt ternary diagram
(Figure 12) plot within the same general area as in Figure 11 (QFL Plot)
within the Continental Block provenance, in the plutonic rich portion of
the Magmatic Arc provenance field.
The QmPK ternary diagram (Figure 12) emphasizes dominant mono
crystalline framework mineral grain types; monocrystalline quartz (Qm),
plagioclase (P), and potassium feldspar (K). Dickinson and Suczek
(1979) utilize these grain parameters to illustrate increasing sandstone
maturity or stability (Figure 13a). An emphasis on chemical and
mechanical stability of sandstone samples (Hayes, 1979) was previously
denoted in the QFL plot (Figure 10). Figure 13 also stresses the
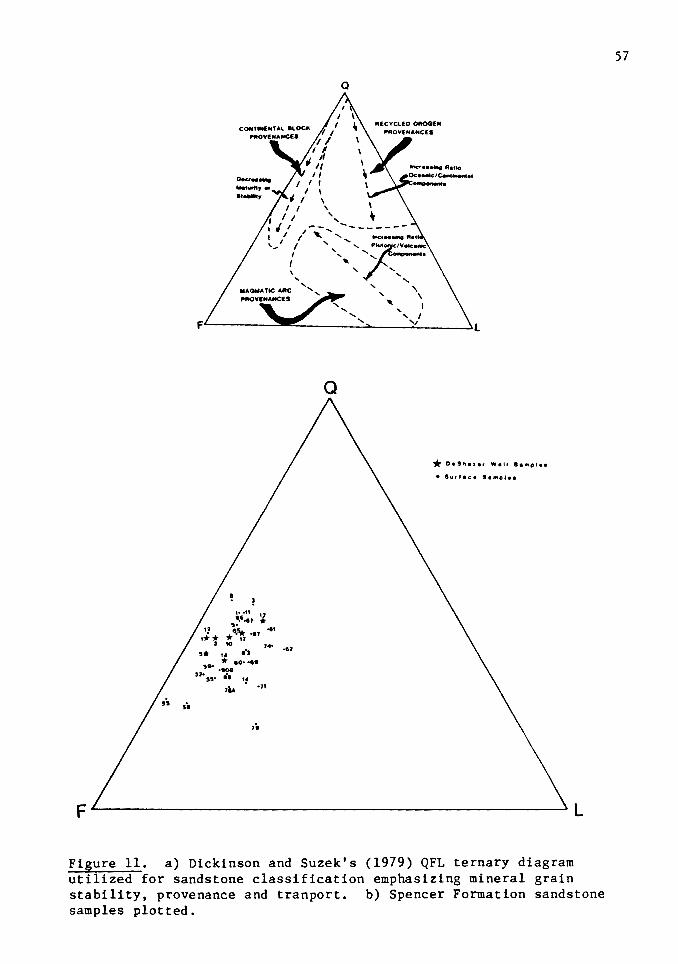
si
CONTtNENT Al •lOCtc. '°"0VENANCE8
\
' ' ....
a
-- --------' ............ Met ........ ,, ' .._ .._ r'ul IVotcetNic' ' ' .. '.. ..... ' .... ' ....
' '\
' ' .,__ I
', I F I ......... '=• •y \l
1••11 .:-• .. , ~ * ''* . ., ... 10 t1
s• ,. .~ , .. * eO• ... l2• •908
35• ,, 14
74• •12
, ... •n
,.
a
* OeSh•:r•r Well 8•MPI••
• 8urfaca SaMPI••
f--~~~~~~~~~~~~~~~~_. L
Figure 11. a) Dickinson and Suzek's (1979) QFL ternary diagram utilized for sandstone classification emphasizing mineral grain stability, provenance and tranport. b) Spencer Formation sandstone samples plotted.
57

COflfTIHENTAl 8'.0Cf(
"90VENAMCE8
I I
I I
am
llECYClED OROGEfrf PROVENANCE I
I I
I I ' \ i" a..tt to t /,-.... , '\ \ 0-.ru \ ~I ..... , '\
' ~PWt-- ..... ' \ ,-; ...... \\. .. ")I._, ... ~ ......... .... ' -- ~' ...... , \ -- .. ~... ..., \ .- ... c...... ' ', \ ..... , ...
MAGMA TIC AltC ', Yotc:.-C: I \ "'°'1£MMICE8 ' , ~ \
F ' ; Lt
••
.. • 3
••* • *
••• '.' t 2
1o a1• * *•:1· .;•1 .• , ••• .14 *'' ·•2
:115• ·51 eo• 32• •o• •u ·•• 17A·~. •14•71
76A ie
...
Om
* OeSh•i•r Well Sample•
• Surface S•""P'••
F Lt
Figure 12. a) Dickinson and Suzek's (1979) QmFLt ternary diagram utilized for sandstone classification emphasizing mineral grain stability. b) Spencer Formation sandstone samples plotted.
58

59
TABLE VII
LITHIC ROCK FRAGMENT CONTENT (QmFLt PLOT) DESHAZER 13-22 WELL SIDEWALL CORE SAMPLES
Sidewall Core Sample
ONG-1-2319 ONG-3-2311 ONG-5-2276 ONG-10-2259
ONG-12-2224 ONG-14-2220 ONG-17-2214
Lower Member
Upper Member
Lithic Components (percent)
10 11 12 16
21 20 21
importance between plutonic (continental block) and volcanic (magmatic
arc) sources.
The QmPK plot (Figure 13b) denotes Spencer Formation samples
predominately midway between the "Qm" and "P" poles. Those samples
closest to the "P" pole are characteristic of the informal upper member
which depict a decreasing ratio of plutonic/volcanic components.
Spencer Formation samples plotting closest to the "Qm" pole are
characteristic of increased maturity similar to "Clark and Wilson" type
sands found within the lower portion of the Cowlitz Formation according
to Bruer and others (1984) and Niem and others (1985).
The QmQpL ternary diagram (Figure 14) emphasizes those concepts
noted in the QFL, QmFLt, and QmPK plots (Figures 10 to 13). The two
most important concepts are: 1) Deshazer 13-22 side wall core samples
show an increased amount of lithic rock fragments, predominately

,,. ,,. ,,.
/
JI/ /
/
/ I
I
Om
I ~
/ /
/ _ ........ ~ _,,,,_ )II ~ ~·-*-ltcAl'c -
._. ................. ., eteiMMtr "eo..t-....ce1 ......
"'-·
p K
Om
H, 1.' '·' *'2
•.o
\1 e,, .,.
~~ 1
605
'Iii .•. J.s •71
•87 s • • •12 62
* * l * Kl
* s
I
••• l]S/A a, . ,4 ~. , ..
~9 s.s
* OeSh•••' W•ll S•mplee
• Surl1c• S•"'P'••
p K
60
Figure 13. a) Dickinson and Suzek's (1979) QmPK ternary diagram utilized for sandstone classification emphasizing the dominant monocrystalline grain types. b) Spencer Formation sandstone samples plotted.

61
volcanic, stratigraphically higher in the well, and 2) those samples
characteristic of the lower member and lower in the Deshazer well are
highest in monocrystalline quartz content and best correlate with "Clark
and Wilson" type sands found within the lower Cowlitz Formation
occurring stratigraphically above the Yamhill-Cowlitz unconformity
outlined by Bruer and others (1984) correlation section.
Qp
•*
Qm
*3 , . ••• 5* •3
... !', ~2 • ,,
5. 5.. •1
\5 - *'2 -el •51A
11* toe• •••
••* ~ •74
••• • •15" •• 62• .,.
71
* Oe8h•~•r Well •••••••
• Surface I••••••
19
Figure 14. Ternary QmQpL diagram of Spencer Formation samples emphasizing polycrystalline grains and lithic fragment content.
L

CHAPTER IV
SCANNING ELECTRON MICROSCOPY
Explanation of SEM Methods and Sample Preparation
The scanning electron microscope (SEM) and accompanying energy
dispersive spectrometer (EDS) were utilized for five main objectives.
Objectives were to: 1) utilize the SEM to complement petrography, 2)
examine textural and morphological aspects of mineral grains, 3)
determine elemental composition of selected mineral grains, 4)
determine, if possible, detrital and diagenetic clay minerals, and 5)
examine size, shape, and distribution of pore spaces.
Advantages the SEM has over conventional petrographic methods are;
three-dimensional analysis of mineral grains and pores, higher
magnification, ease of sample preparation, and greater depth of field
and resolution (Welton, 1984). A detailed explanation of SEM and EDS
systems and their functions are beyond the scope of this study.
Wischnitzer (1981) outlines in detail the various parts of the SEM and
their functions as well as the theory on how the SEM works. Welton
(1984) summarizes how the SEM operates, how a photomicrograph is
obtained and SEM analysis of elements. Whalley (1978) discusses how
scanning electron microscopy is utilized in the study of sediments.
Welton (1984) utilized the energy dispersive x-ray spectrometer (EDX),
now referred to as the EDS. Samples were prepared by the method
presented by Dash (personal communication, 1985). Sample
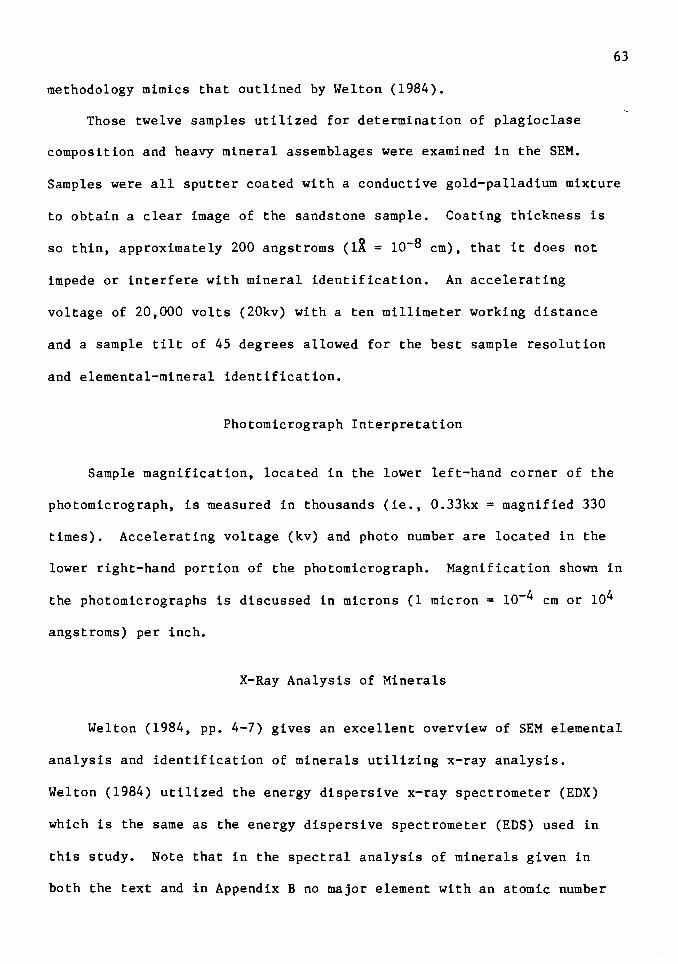
63
methodology mimics that outlined by Welton (1984).
Those twelve samples utilized for determination of plagioclase
composition and heavy mineral assemblages were examined in the SEM.
Samples were all sputter coated with a conductive gold-palladium mixture
to obtain a clear image of the sandstone sample. Coating thickness is
so thin, approximately 200 angstroms (li = lo-8 cm), that it does not
impede or interfere with mineral identification. An accelerating
voltage of 20,000 volts (20kv) with a ten millimeter working distance
and a sample tilt of 45 degrees allowed for the best sample resolution
and elemental-mineral identification.
Photomicrograph Interpretation
Sample magnification, located in the lower left-hand corner of the
photomicrograph, is measured in thousands (ie., 0.33kx =magnified 330
times). Accelerating voltage (kv) and photo number are located in the
lower right-hand portion of the photomicrograph. Magnification shown in
the photomicrographs is discussed in microns (1 micron = 10-4 cm or 104
angstroms) per inch.
X-Ray Analysis of Minerals
Welton (1984, pp. 4-7) gives an excellent overview of SEM elemental
analysis and identification of minerals utilizing x-ray analysis.
Welton (1984) utilized the energy dispersive x-ray spectrometer (EDX)
which is the same as the energy dispersive spectrometer (EDS) used in
this study. Note that in the spectral analysis of minerals given in
both the text and in Appendix B no major element with an atomic number
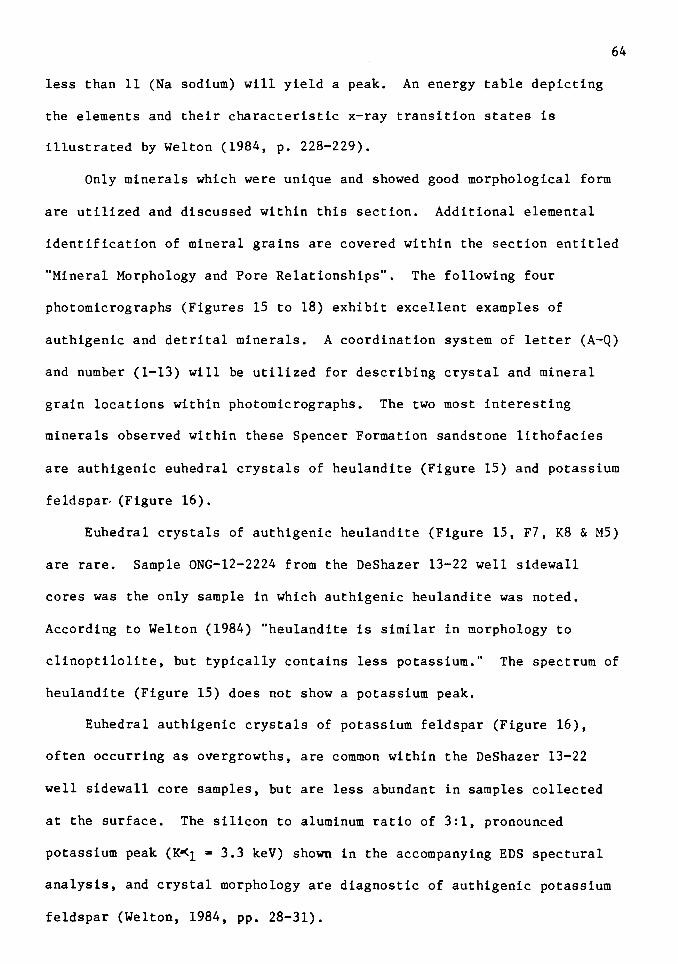
less than 11 (Na sodium) will yield a peak. An energy table depicting
the elements and their characteristic x-ray transition states is
illustrated by Welton (1984, p. 228-229).
64
Only minerals which were unique and showed good morphological form
are utilized and discussed within this section. Additional elemental
identification of mineral grains are covered within the section entitled
"Mineral Morphology and Pore Relationships". The following four
photomicrographs (Figures 15 to 18) exhibit excellent examples of
authigenic and detrital minerals. A coordination system of letter (A-Q)
and number (1-13) will be utilized for describing crystal and mineral
grain locations within photomicrographs. The two most interesting
minerals observed within these Spencer Formation sandstone lithofacies
are authigenic euhedral crystals of heulandite (Figure 15) and potassium
feldspa~ (Figure 16).
Euhedral crystals of authigenic heulandite (Figure 15, F7, K8 & M5)
are rare. Sample ONG-12-2224 from the DeShazer 13-22 well sidewall
cores was the only sample in which authigenic heulandite was noted.
According to Welton (1984) "heulandite is similar in morphology to
clinoptilolite, but typically contains less potassium." The spectrum of
heulandite (Figure 15) does not show a potassium peak.
Euhedral authigenic crystals of potassium feldspar (Figure 16),
often occurring as overgrowths, are common within the Deshazer 13-22
well sidewall core samples, but are less abundant in samples collected
at the surface. The silicon to aluminum ratio of 3:1, pronounced
potassium peak (K~1 = 3.3 keV) shown in the accompanying EDS spectural
analysis, and crystal morphology are diagnostic of authigenic potassium
feldspar (Welton, 1984, pp. 28-31).


Within the same photomicrograph (Figure 16), depicting sample
ONG-17-2214, a solitary round frambiod of pyrite (NS) occurs as an
aggregate of crystals. According to Welton (1984, p. 192) framboids of
pyrite can occur as an isolated crystal or in lenses and are easily
identified by their well-defined morphology in the SEM. Recognition of
the pyrite framboid was done solely by morphology.
Figure's 17 and 18 show examples of amphibole (hornblende) and
pyroxene (augite) after etching has occurred. It was difficult to
distinguish between augite and hornblende by EDS spectural analysis
because their chemical make up is very similar. Sodium and magnesium
were deficient within the detrital grain (Figure 17) but a slight
potassium peak (K~l = 3.3 keV) is ascertainable, thus this etched grain
is probably hornblende. The excellent spinose morphology is similar to
that studied by Edelman and Doeglas (1932, p. 482-491).
67
In Figure 18 the EDS spectural analysis is more indicative of
augite because of the absence of the K~l (3.3 keV) potassium peak and a
more pronounced (K~1 3.7 keV) calcium peak. A good magnesium peak (K~ =
1.3 keV) is also present. Etching in this sample SP-57A occurs as
slight degradation along grain boundaries and cleavage planes. Samples
SP-57A (Corvallis area) and SP-74 (Western Tualatin Valley area) both
from the upper member contain some of the highest percentages of etched
amphibole and pyroxene of those samples petrographically analyzed for
heavy mineral assemblages within the Spencer Formation sandstone
lithofacies. Etching of amphibole and pyroxene was rare within the
Deshazer 13-22 sidewall core samples.


Clay Mineral Relationships
The smectites are commonly refered to as the montmorillonite group
of minerals, which includes montmorillonite, biedellite, nontronite,
saponite and mixed-layer smectite-illite (Almon and Davies, 1981, p.
90). Smectite was the only clay-mineral observed with SEM-EDS
70
analysis. According to Welton (1984, p.72) individual crystals of
smectite can not be distinguished within the SEM. Smectite which has
been expanded is usually crenulated or flaky (Welton, 1984, pp. 76-77).
Figure 19 shows smectite clay from sample ONG-12-2224 coating a detrital
grain exhibiting this flaky nature. Major elements characteristic of
smectite, outlined by Welton (1984, pp. 72-83) are Si, Al, K, Ca, Mg and
Fe. Elemental analysis of the sample in Figure 19 had peaks
characteristic of all these elements except magnesium.
Smectite clays observed in the SEM and analytically x-rayed with
the EDS characteristically form a flaky coating on grains and line pore
cavities. The origin of the smectites depicted in this suite of Spencer
Formation sandstone lithofacies is difficult to determine, but is
believed to be predominately detrital.
In this study it was difficult to identify specific clay mineral
species utilizing SEM-EDS techniques because 1) clays are often
interlayered (mixed-layer) such as montmorillonite is commonly
interlayered with illite or chlorite, and 2) clays commonly form very
thin coatings and the x-ray beam of ten will pass through the clay
mineral giving a bias or contaminated elemental analysis of underlying
materials. Separating clays of the 2 micron fraction from these samples
and utilizing x-ray diffraction techniques gave better results

.. 72
to determine clay-type.
Chlorite is likely to be present within these samples because of
the elevated abundance of biotite within Spencer Formation sandstone
lithofacies. As biotite alters to chlorite, potassium ions (K+) are
most easily removed from the crystal lattice, they become mobile and are
lost (Carroll, 1981, p. 19). If chlorite is present in these samples
analyzed with the SEM-EDS its identification is masked by the pronounced
potassium peak (K~1 = 3.3keV) characteristic of biotite.
Mineral Morphology and Pore Relationships
Within the Spencer Formation sandstone lithofacies analyzed a
variety of mineral-pore relationships were observed. Factors likely to
influence pore space availability in the selected samples studied are 1)
minerals present - authigenic versus detrital, especially clays, 2)
extent of weathering, 3) compaction of sands and pore water composition
during lithification, 4) cementing and matrix materials, and 5) textural
makeup of the sandstone.
Four samples; SP-1 (lower member-western Tualatin Valley area),
SP-57A, (upper member-Corvallis area), SP-81 (upper member-Monmouth
area), and SP-87 (lower member-Monmouth area) from surface outcrops of
Spencer Formation sandstone lithofacies represent different types of
pore-mineral relation- ships. A series of four pairs of
photomicrographs (Figures 15 to 18) magnified both 65 and 650 times were
used to illustrate these parameters.
Sample SP-1 (Figure 20) is very friable in hand sample. The lack of
clay minerals, cement and matrix material coating mineral grains or in


pore spaces and the large spaces present between mineral grains seen in
the photomicrographs (Figures 20a & 20b) account for the sample being
friable. Magnification of the sample 650 times showed abundant
potassium feldspar (predominately overgrowths) with some smectite
coating mineral grains.
75
Detrital mineral grains are relatively easy to identify in sample
SP-81 (Figure 21) but inter-grain pore spaces are dominately filled with
a mixture of calcite cement and smectite. Between the grains and
cementing agents some pore space is still recognizable (Figure 2la).
Magnification (650x) of sample SP-81 (Figure 2lb) shows the existence of
abundant crenulated or flaky smectite. The needle or rod shaped
crystals (Figure 2lb, H2) exhibit the morphology of halloysite (Welton,
1984, p. 70).
Sample SP-57A (Figure 22) is a very fine-grained Spencer Formation
sandstone typical of the upper member sandstone lithofacies. A
combination of the fine-grained matrix material and calcite cement have
significantly reduced pore space availability and made detection of
mineral grains difficult (Figure 22a). Magnification of sample SP-57A
(Figure 22b) 650 times shows abundant clay minerals present, dominantly
smectite but illite (H9) and chlorite (N7) are also present. Abundant
clay minerals found within this fine-grained sandstone sample have
significantly reduced pore spaces.
No detrital mineral grains are readily visible in sample SP-87
(Figure 23) which is extensively cemented with crystalline calcite. In
outcrop this sandstone is very resistant to weathering. Virtually no
pore space is recognizable in the photomicrograph (Figure 23a) of sample


78
SP-87. Crystalline calcite cement commonly exhibits concoidal
fracturing (Figure 23a, D6). Magnification (650x) of the sample (SP-87)
showed biotite (GlO & 14) being bent around a plagioclase detrital grain
(Al-12 to D 1-12) with crystalline calcite cement (I7) protruding
between biotite (001) cleavage planes. Some limited pore space is
available between biotite cleavage planes but is likely filled with
calcite cement away from the surface of the sample. Note t~1at very
little clay minerals, especially smectite, are present in this samples
(SP-87, Figure 23b).

CHAPTER V
X-RAY DIFFRACTION ANALYSIS OF CLAY MINERALS
The twelve samples utilized previously for plagioclase composition,
heavy mineral separates and SEM-EDS mineralogic studies are also
utilized for determining clay mineral assemblages by x-ray diffraction.
The clay size fraction was separated into the two micron and less size
fractions and were mounted on ceramic tiles utilizing the methods
described by Van Atta (personal communication, 1985).
Diffraction patterns of well orientated kaolinite show a strong 7i
peak at 12.5° 20. According to Carroll (1970, p. 8), samples containing
unorientated or poorly crystalized kaolinite may show a series of peaks
from 3.37 to 2.55 angstroms. Heating kaolinite to 550° C (meta
kaolinite) should totally collaspe the 7X peak (Carroll, 1970). It is
possible that the furnace utilized to heat the samples may not have
reached 550° C allowing for only partial collaspe of the kaolinite.
Carroll (1970) shows diffractograms of well crystallized and poorly
crystallized kaolinite. Kaolinite from sample ONG-1-2319 shows the best
crystalline form, when compared to the other two sample containing
kaolinite, ONG-3-2311 and ONG-17-2214. The 7! peaks are less intense
and broad in the later two samples. Kaolinite, with good 7~
diffractogram peaks (001) is only present within subsurface Deshazer
13-22 sidewall core samples. According to Hower and others (1976) the
71 peak could be a combination of kaolinite and chlorite which commonly
80
form an intense 7A peak at approximately 12° 29. Kaolinite was believed
to be present because heating of the sample to 550° C showed a partial
reduction in 7A peak height and intensity.
The X-ray diffraction patterns of illite, muscovite, and biotite
are all very similar, making it difficult to distinguish these three
minerals in diffractograms. According to Carroll (1970) muscovite and
illite diffractogram patterns are extremely difficult to differentiate,
except for muscovite which may show a more intense lOA peak than
illite. The illite peak is commonly broad, covering an area from 6 to
9.so 20 with the lOX peak occurring at 8.5° 20. Illite interlayered
with smectite can be distinguished because peak position will shift as a
result of the smectite swelling the clay inter-layer d-spacings after
glycolation. Carroll (1970, p. 22) states that although biotite and
muscovite have similar diffractogram patterns (I.SO! for muscovite
versus 1.52! for biotite), the intensity of biotite peaks is reduced
with an increase in iron content.
Illite commonly occurs within those samples having mixed-layer
illite/smectite clays. Detection of illite was difficult because the
representative IO! peak of illite was often combined with and obscured
by second and third order illite/smectite peaks.
Chlorite is destinguished by a 14+1 peak, which upon glycolation
does not expand and after heating to 600° C for one hour the chlorite
structure is destroyed and the peak disappears (Carroll, 1970, p. 33).
Determination of chlorite in the diffractograms was hindered by the
large, broad illite/smectite 141 peak. Chlorite (14! peak) was most
abundant in Spencer Formation lower member sandstone lithofacies

81
samples. Chlorite plus kaolinite was observed within the three lower
samples (lower member) of the DeShazer 13-22 well. Reduction in 7X
(12020) peak size and intensity after heating to 550°C allowed for the
chlorite-kaolinite determination. Some mixed-layer illite/smectite clay
was present within the two lower member samples (ONG-1-2319 and
ONG-3-2311) of the DeShazer 13-22 well.
Carroll (1970, p. 27, Fig. 7) describes three observation which are
characteristic of smectite clay diffractograms: 1) untreated or air
dried smectite should have a first order (001) peak at approximately
15X, 2) glycolating or applying DMSO to the sample should shift the
dominant (001) 15i peak to 17K and show a smaller (002) second order
peak at 8+i, and 3) upon heating, the large 17X peak is reduced
significantly to a 9+X peak. Diffractograms representative of
ONG-23-2202 untreated, DMSO treated and heated (550° C) samples mimic
those observations given by Carroll.
Weaver (1956) showed that illite/smectite clay minerals are "from
the standpoint of diagenesis the most important mixed-layer clay
minerals". According to Hower (1981) the best determination of
mixed-layer illite/smectite clay diffractograms can be determined from
ethelene glycol treated samples. Samples from this study were treated
with dimethol sulfoxide (DMSO), an organic solvent much like ethelene
glycol. Dimethol sulfoxide works faster and often provides better
results than ethelene glycol. Srodon (1980) found that glycol-smectite
treatment was often variable.
According to Hower (1981) "it is possible to recognize
illite/smectite clay mineral interlayering schemes and estimate the

composition" by study and interpreting illite/smectite gylcolated
diffractograms.
Mixed-layer illite/smectite clays are most abundant and are
observed more often within surface samples collected from the upper
member. Untreated and dimethol sulfoxide (DMSO) treated samples SP-60,
ONG-12-2224, ONG-17-2214, and ONG-23-2202 from the Spencer Formation
upper member sandstone lithofacies show excellent illite/smectite
peaks. Samples ONG-17-2214 and ONG-23-2202 (upper member) probably
contain less than 20 percent illite, because the diffractogram patterns
show peaks which are more characteristic of smectite.
82
Clay minerals are most prevalent within the upper member of the
Spencer Formation sandstone. These sandstone are commonly finer-grained
than lower member sandstones and contain higer concentrations of
chemically unstable minerals (plagioclase, hornblende and augite) and
rock fragments (microlithic volcanics) which degrade into clay minerals
assemblages. Smectite, mixed-layer illite/smectite and chlorite are
most common within the upper member. Illite, biotite, and muscovite
concentrations are difficult to compile because diffractogram patterns
for these three minerals are virtually identical. The majority is
probably mica. Complications with the temperature guage on the kiln
utilized to heat samples may have caused only partial collaspe of
kaolinite, allowing for the 7i peak to persist.

CHAPTER VI
DIAGENESIS
Diagenesis includes those physical and chemical processes which
have influenced the mineralogical and textural aspects of Spencer
Fromation arkosic and lithic arkose sandstone lithofacies. Without the
complementary scanning electron microscopy study, petrography would have
only shown minimal diagenetic evidence. The SEM techniques proved
extremely viable for denoting authigenic minerals and their
relationships with pore spaces and detrital framework mineral grains.
The following diagenic observation were found through petrographic
analysis within this present study. Etching of hornblende and augite
was common within the upper member sandstone lithofacies. The only
cementing agent commonly detected in thin section was sparry calcite.
Mineral grains were commonly pushed apart by the growth of calcite
cement in pore spaces. Feldspar grains showed noticable alteration or
replacement with sericite and clay minerals around the perifery and less
commonly along cleavage planes. The presence of clay minerals was only
noted in thin section.
Clay minerals observed in the SEM are of two types 1) replacement
and 2) authigenic. Authigenic clay (smectite) by far is more abundant
and found coating both mineral grains and pore spaces.
Authigenic potassium feldspar is very abundant especially in
Deshazer 13-22 sidewall core samples. Single euhedral crystals, rhombs

and stacking of rhombs are characteristic forms of authigenic potassium
feldspar.
Authigenic heulandite was observed within the ONG-12-2224 sample.
Heulandite occurs as euhedral crystals lining pore spaces.
Calcite was the most abundant cement in Spencer Formation upper
member sandstone lithofacies. Scanning electron microscopy showed that
calcite occurs as coarse sparry crystals filling pore spaces.
According to Hayes (1979) four factors which influence the degree
of sandstone diagenesis are 1) preburial, 2) prediagenic tectonic
setting, 3) provenance, and 4) deposition environment. Within this
present study three important factors which most influenced diagenetic
processes within the Spencer Formation sandstone lithofacies are 1)
compaction, 2) pore and interstratified formational water composition,
and 3) t~mperature. Decomposition of detrital mineral grains and rock
fragments and formation of euhedral authigenic minerals and cementing
agents rely on these criteria for development.
Hayes (1979) subdivides porosity reducing processes into three
categories; 1) mechanical, 2) chemical, and 3) the combination of 1 &
84
2. Mechanical destruction involves compacting of the sandstone to
reduce original porosity. Compaction was evident in thin section by the
presence of muscovite and biotite flakes which have been bent or wrapped
around adjacent detrital mineral grains. Chemical reduction of
available pore space involves cementation, replacement and
recrystallization of minerals. Petrologic studies showed evidence of
four distinct diagenetic chemical processes within Spencer Foramtion
sandstone lithofacies; 1) chemical etching of amphibole and pyroxene, 2)

85
cementation by calcite, 3) degredation or replacement of plagioclase and
potassium feldspar, and 4) recrystallization of authigenic zeolites,
potassium feldspar and clay minerals. Authigenic mineral identification
would have been limited if not absent from this study without SEM-EDS
analysis.
Scanning electron microscope studies of selected samples showed two
very important diagenic processes; 1) dissolution of silicate grains and
2) solution or formation of authigenic minerals. Stability of detrital
minerals present will ultimately affect decomposition processes and
formation of authigenic minerals
The best example of combination (mechanical-chemical) reduction of
porosity within Spencer Formation sandstones is the degradation of
biotite. Hayes (1979) indicates that biotite is very unstable
chemically and may form hydrous clay minerals early in the sandstone
diagenesis. The clays (chlorite) may expand slightly or become
structurally weak allowing for further compaction and reduction of pore
space.
According to Walker and Waugh (1973) minerals which have low
stability, such as hornblende, augite and plagioclase in the Spencer
Formation, will show degradation and advanced alteration, while more
stable minerals, such as potassium feldspar or quartz, will exhibit
little alteration. The presence of chemically ecthed hornblende and
augite grains shows the effects of minerals which have low stability
caused by weathering and water percolation.
Porosity can also be enhanced "secondary porosity" during sandstone
diagenesis according to Schmidt and McDonald (1979) and Hayes (1979).

86 86
The dissolution of detrital grains and rock fragments as well as
authigenic minerals and cementing agents could introduce the
availability of secondary pore spaces. Table VIII is a modification
after Hayes (1979, Table 2, p. 130), showing detrital grains and
authigenic minerals within the Spence! Formation sandstones which may be
dissolved by aqueous solutions to produce solution pores.
*
TABLE VIII
CONSTITUENTS DISSOLVED TO PRODUCE SOLUTION PORES WITHIN SPENCER FORMATION SANDSTONES*
Detrital
Feldspar (mainly plagioclase) Biotite Amphibole (mainly hornblende) Pyroxene (mainly augite) Other heavy minerals Chert (small percentage) Fine-grained volcanic
rock fragments
After Hayes, 1979.
Authigenic
Void-filling cement Calcite Smectite Chlorite Zeolites
Replacement minerals Calcite Mixed-layer clays Chlorites Zeolites
Of the three critera previously mentioned, percolating and
interformational water composition, is probably the most important
diagenetic parameter which influences degradation of detrital mineral
grains and rock fragments and precipatation of authigenic minerals.
According to Hayes (1979) the majority of available water during
diagenesis is from the dewatering of shales and mudstones. Frank (1973,
1974, and 1976) and Gonthier (1983) discuss Spencer Formation water
composition. Analysis from some water wells which have penetrated

Spencer Formation sandstones show high concentrations of Ca, Mg, N, K,
HC03, C03, S04, Cl and F (Frank, 1976 and Gonthier 1983). The presence
of high concentrations of dissolved solids within the Spencer Fofmation
indicate that active replacement and recrystallization of autigenic
minerals may be occurring presently.
The paragentic sequence of authigenic mineralization may vary
greatly geographically and stratigraphically. The original sandstone
compositon and diagenetic processes within the Spencer Formation aided
most in the formation of authigenic mineralization.
87
Clay mineral development probably occurred during compaction and
within the early stages of diagenesis. Formation of chlorite is
probably associated with the breakdown of biotite. Smectite, illite and
mixed-layer illite/smectite may have formed from the degradation of
volcanic' rock fragments and recrystallization of detrital clay minerals.
Chemical breakdown of feldspars (mainly plagioclase), amphibole
(hornblende), pyroxene (augite), and other heavy minerals occurred
next. Dissolution of these mineral grains allowed free cations (mainly
ca++,!(+, Na+, and Fe++) to become incorporated with pore space aqueous
solutions. Dissolved solids accumulated to the point of saturation,
when authigenic potassium feldspar, zeolites and additional clay
minerals were precipitated. The presence of iron oxides and iron
hydroxides allowed for the formation of pyrite framboids. Emplacement
of calcite cement may have occurred during the latter stages of
diagenesis. Very few authigenic minerals have recrystallized on calcite
showing evidence that it was probably one of the last minerals to
crystallize.

Paragenetic diagenetic and mineralization sequences listed above
are much more noticeable within the upper member. Obviously these
sandstones contain more plagioclase feldspar, hornblende, augite and
other heavy mineral detrital grain constituents which are more
susceptible to chemical breakdown.
88

CHAPTER VII
GEOCHEMISTRY
Thirty-seven fine- to medium-grained Spencer Formation sandstone
samples, including nine sidewall core samples from the Oregon Natural
Gas Development Company's DeShazer 13-22 well, were analyzed for both
major oxide elements and rare earth elements. Peter H. Hooper of
Washington State University did the analysis utilizing two separate
methods. X-ray fluorescence spectrometry (XRF) was utilied for
determing major oxide element concentrations. Inductively coupled
plasma emission spectrometry (ICP) was utilized for the analysis of
Yttrium and a full suite of the lanthanide series elements, commonly
referred to as rare earth element (REE) series. Yttrium is commonly
included within the REE group because of geochemical similarities.
No previous geochemical data concerning major oxide and rare earth
element concentrations exists for the Spencer Formation.
Characterization of the Spencer Formation geochemistry is, therefore,
initially important. Secondly, geochemical trend data was complimented
with petrography work to help illustrate possible changes in provenance
area of the arkosic and lithic sandstone lithofacies within the Spencer
Formation. Kadri and others (1983) utilized instrumental neutron
activation analysis (INAA) techniques to analyze samples from the
Cowlitz, Keasey, Pittsburg Bluff and Astoria Formations as well as
samples from the Columbia River Basalt Group in northwestern Oregon to

90
characterize minor element composition and to identify their provenances.
Major oxide and rare earth elements analyzed for this sudy are
listed in Table IX.
TABLE IX
ELEMENTS ANALYZED FOR IN SPENCER FORMATION SAMPLES
Major Oxide Elements Rare Earth Elements (REE)
Silicon( Si) Aluminum( Al) Titanium(Ti) Iron(Fe) Mangenese(Mn)
Calcium( Ca) Magnesium(M) Potassium(K) Sodium(Na) Phosphorus(P)
Yttrium(Y)* Lanthanium(La) Cerium( Ce) Parseodymium(Pr) Neodymium( Nd) Samarium( Sm) Europium(Eu)
Gadolinium( Gd) Dysprosium(Dy) Holmium( Ho) Erbium( Er) Ytterbium(Yb) Lutetium(Lu)
*Yttrium is not a REE, but has similar geochemical properties.
X-ray Fluorecence (XRF) Analysis
Major Oxide Geochemistry
Major oxides represent the overall bulk chemical compostion of the
Spencer Formation sandstones. Table X shows major oxide element
concentrations for .the Spencer Formation samples analyzed. Samples
starting with "SP" are surface samples while those labled with prefix
"ONG" are sidewall core samples from the Deshazer 13-22 well.
Provenance and relief of the source area, physical sorting, type
and extent of weathering, transportation, and diagenesis are some of the
factors effecting chemical composition of sandstones (Pettijohn,1963;
Bhatia, 1978). Grain size also influences sandstone mineral
compostion. According to Pettijohn (1963), silica content generally

91
TAILE X
KUCR OO!E QJE}fiCAL NW.YSIS CF SPEN:ER ~CN SAff'lES
~ NAI£ Si02 Al203 Ti02 Fe203 FeO !til CaO ~ K20 Na20 P205
l.O.£R l'£MIER ( :rNFCEW..)
SP-1 79.51 12.12 Westem 'I'uaL3.tin Valley Area
0.31 0.83 0.95 0.02 1.51 0.26 2.45 1.97 0.091 SP-3 78.56 12.94 0.30 0.87 0.99 0.01 1.17 0.21 2.82 2.03 0.052 SP-5 78.48 14.92 0.29 0.68 0.78 0.00 0.60 0.00 2.90 1.33 0.026 SP-11 78.47 13.12 0.49 0.95 1.09 0.02 1.43 0.20 2.35 1.84 0.042 SP-65 70.29 16.89 0.87 2.04 2.33 0.04 1.18 1.14 3.43 1.75 0.038 SP-67 71.68 15.37 0.61 2.32 2.66 0.04 1.14 1.06 3.24 1. 79 0.078 SP-69 76.81 13.76 0.39 1.06 1.21 0.03 1.27 0.45 2.98 1.99 0.043
l'brmout h Area SP-12 76.95 15.15 0.61 0.58 0.66 0.00 1.21 0.10 2.72 1.99 0.032 S!"-81 76.67 14.76 0.63 1.36 1.56 0.02 0.82 0.31 2.40 1.41 0.059 S!"-87 59.65 11.06 0.36 1.04 1.19 0.24 18.59 2.59 2.(); 3.(); 0.151
SP-60 58.94 16.00 1.57 AIT&,Area.
5.28 6. 0.12 5.98 2.98 1.12 1.75 0.219 SP-62 79.4-0 14.99 0.45 0.51 0.59 0.00 0.63 0.00 2.30 1.11 0.037 ~ 79.(); 12.97 0.30 0.62 0.71 0.01 1.38 0.03 2.64 2.17 0.042
SP-35 69.65 15.28 Spencer Fonmtktt ~ Area
0.48 1.96 2.24 o. 3.14 1.93 2.43 2.76 0.090
LCloER A~ 73.87 14.24 0.55 1.44 1.64 0.04 2.86 0.81 2.56 1.93 0.071
De5haz2r 13-22 Well SidewU.l Qires 00-1-2319 73.25 14.27 0.53 1.85 2.12 0.04 1.59 0.97 3.26 2.05 0.032 00-3--2311 72.81+ 14.29 0.57 2.13 2.44 0.03 1.52 0.95 3.13 2.02 a.cm OO-S-2276 73.66 14.52 0.53 1.76 2.01 0.03 1.58 0.74 2.98 2.11 0.077 <W-8-2266 68.73 18.74 1.07 2.88 3.30 0.06 1.42 0.60 1.81 1.30 0.096 00-10-2259 n.75 -13.01 0.28 0.72 0.82 0.01 1.33 0.32 3.42 2.27 0.();2
UPPER l'£MIER (INF<lM\r.)
S!"-8 67.38 17.94 Western 'I'uaL3.t in Valley Area
0.94 3.31 3.00 0.09 0.96 1.57 2.66 1.26 0.036 SP-71 71.31 17 .27 0.99 2.49 2.85 0.02 0.89 0.56 2.46 1.09 0.077 SP-74 71.4-0 14.89 0.78 3.17 3.63 0.02 1.21 0.55 2.64 1.62 0.120 SP-7SA 70.27 15.02 0.70 4.37 5.00 0.03 0.76 0.54 2.01 1.17 0.122
K:xmnJth Area SP-14 70.94 21.20 2.16 1.85 2.12 0.04 0.11 0.00 1.50 0.07 0.019 SP-79 69.52 20.27 1.02 2.11 2.42 0.03 0.34 0.82 2.94 0.47 0.060 S!"-83 76.(IJ 13.89 0.61 1.60 1.84 0.04 0.64 0.46 2.84 1.4-0 0.072 SP-86 65.18 16.15 1.07 4.95 5.67 0.02 2.12 1.22 1.00 1.65 0.177
SP-59 65.82 14.74 1.10 Al~ Area
3.87 4. 3 0.09 4.22 2.23 1.48 1.86 0.150
Uirvallis Area SP-SS 69.65 15.90 0.76 2.42 2.77 0.05 2.61 1.12 2.62 2.25 0.163 SP-57A 63.54 14.31 1.25 4.79 5.48 0.10 3.86 2.88 1.82 1.00 0.166 SP-58 69.28 14.72 0.74 2.43 2.78 0.05 3.83 1.79 2.35 1.89 0.135 SP-88 69.79 15.63 0.68 2.53 2.90 0.06 2.39 1.37 2.30 2.14 0.213
SP-32 74.92 14.47 Spen:::er Formation ~ Area
0.54 2.04 2.34 o. 1.00 0.46 2.63 1.49 0.033
UPPER AVE:RAG: 69.69 16.17 0.95 3.00 3.43 0.05 1.78 1.11 2.29 1.44 0.117
DeShazer l.3-22 Well Sidewall Qires 00-12-2224 72.28 14.50 0.56 1.92 2.20 0.03 2.24 0.84 3.25 2.ll 0.035 CNr-14-2220 72.23 14.37 0.53 1.86 2.13 0.02 2.58 0.94 3.04 2.19 0.100 CN}-17-2214 71.49 14.47 0.61 2.24 2.57 0.03 2.34 1.20 2.83 2.13 0.004 CN}-2}-2aJ2 69.94 15.38 0.74 3.13 3.59 0.05 2.75 1.90 0.54 1.88 0.106
All values are in percent.

92
decreases as grain size diminishes, while alumina and K20 content
usually increases. Samples SP-8 and SP-79 are very fine-grained
sandstones, and noticeably have lower Si02 content and higher
concentrations of Al203 and KzO. Amount and type of cementing agents
will also alter sandstone bulk chemical composition. For example, SP-87
contains abundant calcite cement, Cao content exceeds 18 percent thus
affecting the overall silica content, even though the sandstone is
medium-grained and has a high quartz content. Middleton (1960) contends
that since the principal cementing agents are usually silica (Si02) and
carbonates (Ca and Mg) geochemical analysis values may be erroneous and
valueless. A majority of the samples selected for geochemical analysis
contain little if any cement. Therefore, erroneous chemical
compositional effects caused by interstitial cementing agents sould be
minimal.' It is very important when studying major oxide composition of
sandstone that the data is complemented with detailed petrographic
analysis.
Gandera (1977), Al-Azzaby (1980), as well as this study have
documented that Spencer Formation sandstone lithofacies are
predominately arkose and lithic arkose (Folk's classification, 1974).
Lithic fragments and plagioclase content become more prevalent to the
south and within the informally named Spencer Formation upper member
(Gandera; 1977, and this study). Generally Spencer Formation arkoses
contain 35 percent or more feldspars, of which plagioclase is dominant.
Geochemical analysis of the major oxide elements Si02, Al203 and K20 in
arkosic sandstones have average values of 70-85%, 7-14% and 3-6%
respectively (Pettijohn, 1963). The average values for silica (72%)

93
alumina (15%) and K20 (2.5%) for this study (Table X) vary slightly from
Pettijohn's criteria. Total iron content (FeO + Fez03) is commonly
lower for feldspar-rich sandstones. Sandstone samples analyzed in this
study average five percent total iron (both ferric and ferrous).
Escalated total iron content in the sandstone samples could be related
to the high biotite to muscovite ratio, approximately 3:1, and the
influx of mafic lithic rock fragments located stratigraphically in the
upper Spencer Formation sandstone lithofacies. Generally arkoses
contain little if any calcium and magnesium except for those sandstones
cemented with carbonates (SP-35, SP-55, SP-57A, SP-58, SP-59, SP-60,
SP-86 & SP-87). Calcium content averages about one percent except for
those samples cemented with calcite. Potassium (K20) usually exceeds
sodium (Na20) in arkoses (Pettijohn, 1963). Because of the dominance of
plagioclase feldspar (albite) over potassium feldspar (predominately
microcline and lesser amounts of orthoclase) in the Spencer Formation
sandstones analyzed, K20/Naz0 ratios are close to 1/1. Titanium (TiOz)
content usually increases as grain size decreases and is commonly found
in conjunction with alumina (Al203), Pettijohn (1963). Samples analyzed
in this study which had elevated Ti02 content have higher percentages of
Al203. Average Ti02 content in Spencer Formation sandstones was 0.7
percent. Manganese (MnO) and phosphorus (Pz05) are generally minor
constituents of sandstones. Average values of 0,04 and 0.09 percent,
respectively were obtained for the Spencer Formation sandstones analyzed.
Two plots (Figures 24 & 25) of silica Si02 versus aluminum (Al203)
and K20 versus Na20, were constructed to visually illustrate sample
variances. Samples are noted with a "+" symbol lower member and "x" for

94
upper member surface outcrop samples or with "*" for Deshazer 13-22 well
sidewall core samples.
Figure 24 shows two groupings, 1) those samples with higher
concentrations of silica (70+ percent) and aluminum deficient (less than
15 percent) and 2) samples deficient in silica (less than 70 percent)
and elevated amounts of aluminum (greater than 15 percent). The sample
grouping with higher concentrations of silica are characteristic of
lower member (informal) lithofacies and those sidewall cores from lower
in the Deshazer 13-22 well. Higher concentrations of alumina are
associated with very fine-grained sandstones including those with
elevated plagioclase and volcanic lithic content, which are
characteristic of the upper member (informal) and southern lithofacies.
Figure 25 illustrates K20 versus Na20 content. A majority of the
samples plot within two groupings. Samples plotting in the upper
right-hand quadrant of Figure 25 have elevated concentrations of both K
and Na. These samples are typically enriched with potassium feldspar
and are characteristic of the Spencer Formation lower member (informal)
lithofacies.
Attempts have been made to correlate the composition of sandstone
to provenance and related plate tectonic topics (Middleton, 1963;
Dickinson, 1970; Pettijohn, 1963; Schwab, 1975; Van de Kamp, 1976;
Dickinson and Suczek, 1979 and Bhatia, 1981). Recent work by Van de
Kamp (1976) and Bhatia (1981) emphasize sandstone composition utilizing
major oxide element geochemistry to determine plate tectonic settings.
----;

SP
EN
CE
R
FO
RM
AT
ION
S
AN
DS
TO
NE
S
ilic
a V
ers
us
A
lum
ina
C
on
ten
t
79
+
+
+
++
+
7
8
* 8
0 ~
77
+
x I·
+
7
6
75
x
74
*
73
!
-7
2
#
-"'
+
i 7
1
x x
x
~
70
x
+
Q>
-f¥
Xx
X
a.
69
x
-*
0 6
8
.~
67
I
x
Vi
66
J
x 6
5
x 6
4
63
I
x
62
6
1
60
f
~:
I I
I I
7 11
1
3
15
1
7
19
2
1
Alu
min
a
(pe
rce
nt)
Fig
ure
2
4.
Maj
or
ox
ide
cro
ss
plo
t d
iag
ram
o
f sil
ica
(Si0
2)
vers
us
alu
min
a (A
l20
3)
co
nte
nt
in
the
Sp
ence
r F
orm
atio
n
san
dst
on
es
an
aly
zed
. In
form
al
up
per
an
d
low
er
mem
ber
gro
up
ing
are
a
show
n.
'° V1
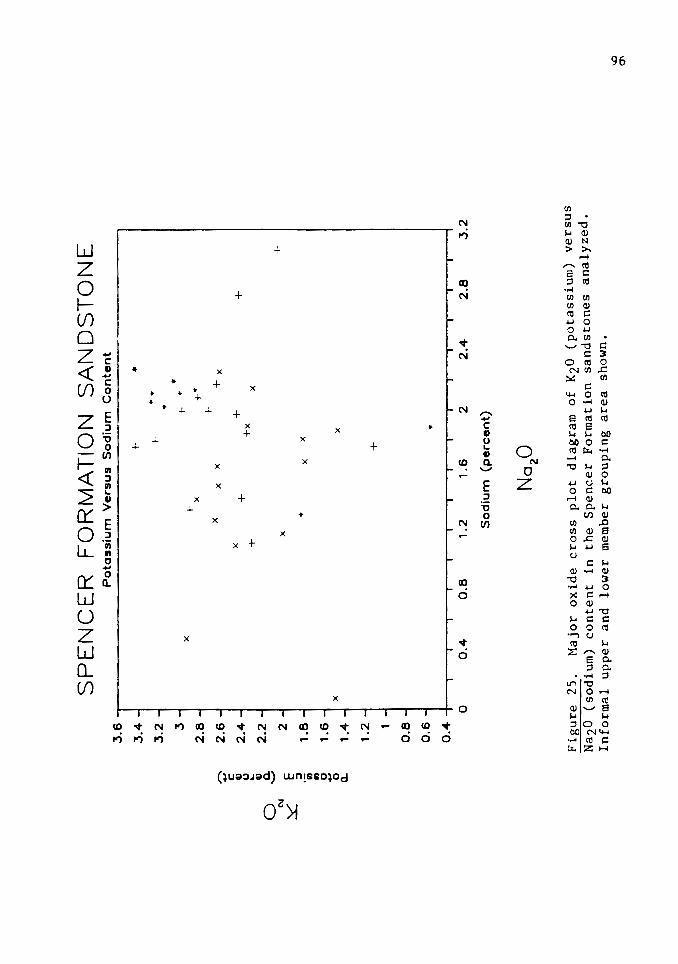
,..._ .... c Cl> u ~ Cl>
0 Q
. .....
.... C\
J
~
E
:::J
'iii 111
0 .... 0 a..
SP
EN
CE
R
FO
RM
AT
ION
S
AN
DS
TO
NE
P
ota
ssiu
m V
ers
us
So
diu
m C
on
ten
t 3
.6
3.4
l-
.. I·
....
3
.2
• 3
• t-
• x
j-
2.8
x
+•
-t-2
.6
x x
x +
x
x +
2
.4
+
+
+x
+
x 2
.2
1.:
j +
x
.. x
x
, .6
1.4
IX
x
1.2
, 1
+
0.8
0.6
I
+
0.4
1
I I
0 0
.4
0.8
1
.2
1.6
2
2.4
2
.8
3.2
So
diu
m
(pe
rce
nt)
Na
20
Fig
ure
2
5.
Maj
or
ox
ide
cro
ss
plo
t d
iag
ram
o
f K
20
(po
tass
ium
) v
ers
us
Na2
0 (s
od
ium
) co
nte
nt
in
the
Sp
ence
r F
orm
atio
n
san
dst
on
es
an
aly
zed
. In
form
al
up
per
an
d
low
er
mem
ber
gro
up
ing
are
a
show
n.
l.O
a-
Inductively Coupled Plasma (ICP) Analysis
Rare Earth Element Geochemistry
Rare earth element concentrations in Spencer Formation sandstone
lithofacies analyzed are listed in Table XI. All REE values are in
parts per million (ppm).
97
According to Balashov and others (1964) and Fleet (1984), most
REE's in sandstones are concentrated in the clay fraction and to a
lesser extent, heavy mineral assembledges. The fact that shales usually
have higher concentrations of REE's signifies that the clay size
fraction favors an enrichment of lanthanide type elements. Overall RE
concentrations in sediments and sedimentary rocks (shales and sandstone)
generally have similar REE patterns. Major contributions to the study of
rare earth elements in sediments and sedimentary rocks are credited to:
Haskin & Gehl, 1962; Balashov and others, 1964; Wilderman & Haskin,
1965; Haskin and others, 1966; and Ronov and others, 1967. Rare earth
element sources and concentrations in seawater and marine sediments is
discussed by Piper (1974). Fleet (1984) emphasizes weathering, contents
in sediments and sedimentary rocks, and diagentic effects on REE's.
Table XII shows average concentrations (ppm) of REE's in sediments,
principally sandstones, according to Balashov and others (1964), Haskin
and others (1966), Ronov and others (1967) and Kay (1972). Table XII
also includes REE concentrations found by Kadri (1982) within the
Cowlitz Formation and the average concentration of REE's within the
Spencer Formation sandstones analyzed in this present study.
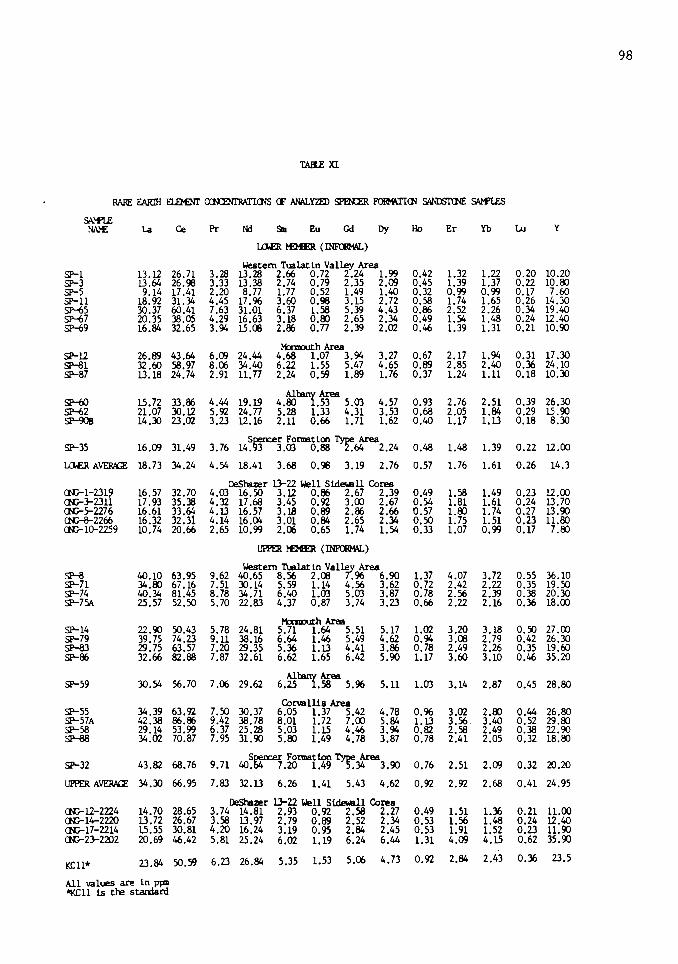
98
TAllE XI
RARE F.ARIH EI...EMNI' CXN»ITRATI<J<S CF ANALY7ED SPENll FQIM4J'I<J< SANOO'I\'.M SAl'l'lES
SAft'U: IW£ La c.e Pr Nd Sm Eu Gd Dy Ho Er Yb Lu y
I.DER l£HIER ( INFmW.)
Western Tualatin Valley Area 0,42 1.32 1.22 0.20 10.20 SP-1 13.12 26.71 3.28 13.28 2.66 0.72 2.24 1.99
SP-3 1..3.64 26.96 3,33 13.38 2.74 0.79 2.35 2.09 0.45 1.39 1.37 0.22 10.00 SP-5 9.14 17.41 2.20 8.77 l.77 0.52 1.49 1.40 0.32 0.99 0.99 0.17 7.60 SP-11 18. 92 31.34 4.45 17. 96 3.60 0.98 3.15 2.72 0.58 1.74 1.65 0.26 14.30 SP-6S 30.37 60.41 7 .63 31.01 6,37 1.58 S.39 4.43 0.86 2.52 2.26 0.34 19.40 SP-67 20.35 38.05 4.29 16.63 3.18 0.00 2.6S 2.34 0,49 1.54 1.48 0.24 12.40 SP-69 16.84 32.6S 3. 94 15.00 2.86 o.77 2.39 2.02 0.46 l.39 1.31 0.21 10.90
1't:nln.Jth Area SP-12 26.89 43.64 6.09 24.44 4.68 l.07 3.94 3.27 0.67 2.17 l.94 0.31 17.30 SP-81 32.60 58.97 8.()) 34.40 6.22 l.55 5.47 4.65 0.89 2.85 2.40 0.36 24.10 SP-87 13.18 24.74 2.91 11.77 2.24 0.59 1.89 1.76 0,37 1.24 1.11 0.18 10.30
SP-60 15.72 33.86 4.44 19.19 Al~Area
4.00 .53 5.03 4.S7 0.93 2.76 2.51 0.39 26.30 SP-62 21.07 30.12 S.92 24.77 S.28 l.33 4.31 3.S3 0.68 2.0S l.84 0.29 15.90 SP-908 14.30 23.02 3.23 12.16 2.11 0.66 1.71 l.62 0.40 1.17 1.13 0.18 8.30
SP-3S 16.09 31.49 S~r Fonmtion ~ Area
3.76 14. 3 3.03 0.88 .64 2.24 0.48 1.48 1.39 0.22 12.00
UloER AVEP.IG': 18. 73 34.24 4.54 18.41 3.68 0.98 3.19 2.76 O.S7 1.76 l.61 0.26 14.3
DeShaz.er U-22 Well Sidewill Cores ca;-1-2319 16.57 32.70 4.03 16.50 3.12 0.86 2.67 2.39 0.49 1.58 1.49 0.23 12.00 CW-3-2311 17.93 3S.38 4.32 17 .68 3.45 0.92 3.00 2.67 0.54 l.81 1.61 0.24 13.70 CW-S-2276 16.61 33.64 4.13 16.57 3.18 0.89 2.86 2.66 0.57 1.00 1.74 0.27 13. 90 cw-8-2266 16.32 32.31 4.14 16.04 3.01 0.84 2.65 2.34 0.50 l.75 l.51 0.23 11.80 CW-10-2259 10.74 20.66 2.65 10.99 2,()) 0.65 l.74 1.54 0.33 1.07 0.99 0.17 7.00
UPPER !£HIER (INFmW.)
SP-8 40.10 63.95 Western Tualatin Valle?. Area
9.62 40.65 8.56 2.00 .96 6.90 l.37 4.07 3.72 0.55 36.10 SP-71 34.00 67 .16 7 .51 30.14 5.59 1.14 4.56 3.62 0.72 Z.42 2.22 0.35 19.50 SP-74 40.34 81.45 8.78 34. 71 6.40 1.03 5.03 3.87 0.78 2.56 2.39 0.38 20.30 SP-75A 25.57 52.50 5.70 22.83 4.37 0.87 3.74 3.23 0.66 2.22 2.16 0.36 18.00
!i:Jnoouth Area SP-14 22.90 50.43 5.78 24.81 5.71 1.64 5.51 5.17 l.02 3.20 3.18 0.50 27.00 SP-79 39.75 74.23 9.U 38.16 6.64 1.46 5,49 4.62 0.94 3.00 2.79 0.42 26.30 SP-83 '19.7S 63.57 7 .20 '19 .3S S.36 1.13 4.41 3.86 0.78 2.49 2.26 0.35 19.60 SP-86 32.66 82.88 7.87 32.61 6.62 1.65 6.42 5.90 1.17 3.60 3.10 0.46 35.20
SP-S9 30.54 56.70 7.06 29.62 Al~Area 6.25 .58 S.96 5.11 l.03 3.14 2.87 0.4S 28.80
Corvallis Area SP-SS 34.39 63.92 7.50 30.37 6.05 1.37 5.42 4.78 0.96 3.02 2.00 0.44 26.80 SP-57A 42.38 86.86 9.42 38.78 8.01 1.72 7 .00 S.84 1.13 3.56 3.40 0.52 29.00 SP-58 29.14 S3.99 6.37 25.28 5.03 1.15 4.46 3. 94 0.82 2.58 2.49 0.38 22.90 SP-88 34.02 70.87 7. 95 31. 90 5.00 1.49 4.78 3.87 0.78 2.41 2.05 0.32 18.00
SP-32 43.82 68.76 SM Formation~ Area
9.71 40. 7.20 1.49 .34 3.90 0.76 2.Sl 2.09 0.32 20.20
UPPER AV'f:P.Ja 34.30 66.95 7.83 32.13 6.26 1.41 5.43 4.62 0,92 2.92 2.68 0.41 24.95
DeShlzer U-22 Well Sidewall Corea CID-12-2224 14.70 28.65 3.74 14.81 2.93 0.92 2.58 2.27 0.49 l.51 l.36 0.21 11.00 CW-14-2220 13.72 26.67 3.58 13.97 2.79 0.89 2.52 2.34 0.53 1.56 1.48 0.24 12.40 CID-17-2214 15.55 30.81 4.20 16.24 3.19 0.95 2.84 2.45 0.53 l.91 1.52 0.23 11.90 CW-23-2202 20.69 46.42 5.81 25.24 6.02 l.19 6.24 6.44 1.31 4.09 4.15 0.62 35.90
KCll* 23.84 50.59 6.23 26.84 5.35 1.53 5.()) 4.73 0.92 2.84 2.43 0.36 23.5
All values are in PJJll ~11 is tre stanlard

99
To determine if any of the Spencer Formation samples collected have
any patterns of enrichment or depletion in rare-earth element values,
graphs of chondrite-normalized values (Spencer Formation/chondrite)
versus element (atomic number) were plotted (Figures 26 to 28).
Recalculated chondrite-normalized values for the REE's are listed in
Table XIII. Chondrite normalized ratios are plotted on three cycle
logarithmic scale versus increasing atomic number. The atomic numbers
increase intermittently from 51 for La through 76 for Lu. The reason
chrondrite normalized REE concentrations are utilized is to standardize
the values to see if, 1) REE concentrations indicate whether or not the
samples analyzed have typical sedimentary REE contents and, 2) to
identify enrichments and/or depletions in a single REE or groups of
REE's (Fleet, 1984).
By analyzing the Spencer Formation/chondrite versus element graphs
(Figures 26 to 28) and finding fluctuations in the slope of the line,
between individual REE's and groups of REE's, offers the best evidence
for fluctuations in sample composition trends and groupings. The
principal purpose in looking for slope fluctuations is to isolate
rare-earth elements which may be utilized in cross-plots to show
relationships or variencies between individual Spencer Formation
samples. The greatest variety of slope occurred between europium (Eu)
and gadolinium (Gd). Two rare earth element patterns are observed in
the Spencer Formation/Chondrite graphs; those samples enriched in Eu,
while the others depleted in Eu. Samples depleted (negative slope) in
europium are commonly enriched in the other REE's.

TABL
E X
II
AVER
AGE
C<NC
ENI'R
ATIC
NS (
PPM
) OF
REE
'S I
N S
EDilf
llTS
AND
SAND
STCN
E
AIJ
IHO
R'S
NA
l>E
I.a
Ce
Pr
Nd
Sm
Eu
Gd
Dy
Ho
Er
Yb
Lu
y
Bal
asln
v,
et
al.
, 19
64 (
A)
36.0
0 69
.00
9.70
34
.00
7 .so
-
7.10
5.
20
-4.
00
3.70
-
45.0
0 H
aski
n, e
t al.
, 19
66 (
B)
2.50
-
0.56
2.
30
-0.
09
0,43
-
0.05
0.
20
0,28
0,
03
1.80
H
aski
n, et
al.
, 19
66 (
C)
9.50
14
.50
3.30
17
.00
2.00
0.
72
2.50
-
0.62
2.
00
1.10
-
13.0
0 H
aski
n, et
al.
, 19
66 (
D)
22.0
0 33
.00
6.20
-
4.00
-
4.60
-
0.89
-
--
20.0
0 H
aski
n, et
al.
, 19
66 (
E)
26.0
0 35
.00
6,20
24
.00
4.70
1.
00
4.70
-
0.54
1.
30
1.63
0.
24
13.0
0 H
aski
n, et
al.
, 19
66 (
F)
10.5
0 -
2.40
10
.60
1.60
0.
55
1.50
-
0.25
0.
77
0,64
-
9.60
H
aski
n, et
al.
, 19
66 (
G)
74.0
0 20
6.00
25
.00
71.0
0 17
.00
3.50
10
.20
-2.
20
4.70
-
-41
.00
Ron
ov,
et
al.
, 19
67 (
H)
17.0
0 33
.00
4.00
16
.50
3,70
0.
70
3.10
2.
60
-1.
60
1.20
-
15.0
0 K
ay,
1972
(I)
39
.00
75.0
0 10
.00
37.0
0 7 .
00
2.00
6.
10
6.00
1.
40
4.00
3.
40
0.60
K
adri
, 19
82 (
J)
42.0
0 -
--
8.75
-
--
--
1.23
0.
00
Th
is S
tuly
(K
) 23
.92
46,0
5 5.
67
23.1
3 4.
56
1.13
4.
00
3.47
0.
71
2.23
2.
05
0.32
18
.36
(A)
Ru
ssia
n p
latf
on
n s
and
sam
ples
(40
sam
ple
s).
(B)
St.
Pete
r S
amst
on
e, B
ell
ev
ille
, W
isco
nsin
(O
rdo
vic
ian
).
(C)
Po
rtla
nd
ian
, K
iml:
nll
Cre
ek,
Ore
gon
(Ju
rass
ic).
(D
) C
ape
Bla
nco
Sam
sto
ne,
Cap
e B
lanc
o, O
rego
n (J
ura
ssic
or
Cre
tace
ou
s).
(E)
Seh
lsti
on
San
:lst
one,
Cap
e S
ehls
tio
n,
Ore
gon
(Cre
tace
oo
s).
(F)
Ket
tlan
an H
ills
, C
alif
orn
ia (
Tert
iary
).
(G) Glaoconite-~ring
san
dst
on
e (o
rig
in u
nkno
wn)
. (H
) R
uss
ian
pla
tfo
nn
san
dst
on
e sa
mpl
es (
6,05
1 sa
mp
les)
. (I
) A
vera
ge p
µn i
n Sedi~nts,
iocl
ud
es s
hal
es,
san
dst
on
es &
carb
on
ates
. (J
) C
ow
litz
Fon
nati
on S
an:l
ston
e, N
W O
rego
n (E
ocen
e)
(5 s
amp
les)
. (K
) S
penc
er F
on
mti
cn S
amst
on
e, W
illa
met
te V
alle
y,
Ore
gon
(Eoc
ene)
(3
7 sa
mp
les)
.
f--'
0 0

101
TAlLE XIII
rn£MJU'IE t-mW.IZED RARE FAR1H EIDfM' caa:Nl'RATI<Mi CF ANALYl'ED ~ ~CN SA!f'lES
SAli'lE !WE La Ce Pr Nd 911 Eu Gd Dy Ho Er Yb Lu y
L(JER ~ (INF<BW..)
Western Tualatin Valle& Area SP-1 39.7 30.9 26.9 21.1 13.l 9.4 .2 5.8 5.6 5.9 5.5 5.8 SP--3 41.3 31.2 27 .3 21.2 13.5 10.2 8.6 6.1 5.9 6.2 6.2 6.6 SP-5 27 .7 20.l 18.0 13.9 8.7 6.7 5.4 4.1 4.2 4.4 4.5 4.9 SP--11 57 .3 36.2 36.5 28.5 17.7 12.7 ll.5 8.0 7.6 7.7 7.5 7.7 SP--65 92.0 69.8 62.6 49.2 31.4 20.6 19.6 13.0 11.3 ll.2 10.3 10.l SP--67 61.7 44.0 35.l 26.4 15.7 10.3 9.6 6.8 6.5 6.9 6.7 7.1 SP--69 51.0 37 .7 32.3 23.9 14.1 10.0 8.7 5.9 6.1 6.2 6.0 6.2
!i:l!mluth Are.a SP-12 81.5 50.5 49.9 38.8 23.0 13.9 14.3 9.6 8.9 9.6 8.8 9.1 Sl'-81 98.8 68.2 66.0 54.6 30.6 20.l 19.9 13.6 U.8 12.7 10.9 10.6 SP-87 39.9 28.6 23.8 18.7 ll.O 7.7 6.9 5.2 4.8 5.5 5.1 5.3
SP-{>() 47.6 39.1 36.4 30.5 Altiaiy Area
23.7 9.8 18.3 13.4 12.3 12.3 ll.4 11.5 SP--62 63.8 34.8 48.5 39.3 26.0 17 .3 15.7 10.3 8.9 9.1 8.4 8.4 SP-'Xl!! 43.3 26.6 26.5 19.3 10.4 8.6 6.2 4.7 5.2 5.2 5.1 5.4
SP--35 48.7 36.4 30.8 ~r Fol:lllltim ~ Area
23.7 14.9 11.5 9.6 6.6 6.3 6.6 6.3 6.5
l.a.ER AVF:Ya. 56.7 39.6 37 .2 29.2 18.l 12.8 ll.6 8.1 7.5 7.8 7.3 7.5
DeStmer 13-22 Well Sidewtl.l C.Ores CID-1-2319 50.2 37 .8 33.0 26.2 15.4 11.1 9.7 7.0 6.4 7.0 6.8 6.9 CID-3-2311 54.3 40.9 35.4 28.1 17.0 ll.9 10.9 7.8 7.1 8.0 7.3 7.1 CID-S-2276 50.3 38.9 33.9 26.3 15.7 ll.5 10.4 7 .. 8 7.5 8.0 7.9 8.0 <W-8-2266 49.4 37:4 33.9 25.5 14.8 10.9 9.7 6.8 6.6 7.8 6.9 6.8 CID-10-2259 32.5 23.9 21.7 17.4 10.l 8.5 6.3 4.5 4.3 4.3 4.5 4.9
UPl'ER ~ (INF<BW..)
SP-8 121.5 73.9 78.9 Western Tualatin VallezS Area 64.5 42.2 27 .o .9 20.2 18.l 18.1 16.9 16.l
SP--71 105.5 77 .6 61.5 47.8 27 .6 14.8 16.6 10.6 9.5 10.7 10.l 10.4 SP-74 122.2 94.2 71.9 55.l 31.5 13.4 18.3 ll.3 10.3 ll.4 10.8 11.2 SP--75A 77 .5 flJ. 7 46.7 36.2 21.5 ll.3 13.6 9.5 8.7 9.9 9.8 10.5
lbllD.Jth Area SP--14 69.4 58.3 47.4 39.4 28.l 21.3 20.0 15.l 13.4 14.2 14.5 14.6 SP-79 120.5 85.8 74.6 flJ.6 32.7 18.9 20.0 13.5 12.3 13.7 12.7 12.4 SP-83 90.2 73.5 59.0 46.6 26.4 14.7 16.0 ll.3 10.2 ll.l 10.3 10.3 S!'-86 99.0 95.8 64.5 51.8 32.6 21.4 23.3 17 .2 15.4 16.0 14.1 13.5
SP--59 92.6 65.6 57 .9 47.0 Al~ Area 30.8 0.5 21.7 14.9 13.5 14.0 13.1 13.2
Corwllis Area SP--55 104.2 73.9 61.5 48.2 29.8 17 .7 19.7 14.0 12.6 13.4 12.7 12.9 SP--57A 128.4 100.4 77.2 61.5 39.5 22.4 25.5 17.l 14.9 15.8 15.5 15.2 SP-58 88.3 62.4 52.2 40.1 24.8 15.0 16.2 ll.5 10.7 11.5 ll.3 ll.2 SP-88 103.l 81.9 65.2 50.6 28.6 19.4 17.4 ll.3 10.3 10.7 9.3 9.3
SP--32 132.8 79.5 79.6 ~r Formation ~ Area
64.5 35.5 19.4 9.4 ll.4 10.0 11.l 9.5 9.4
UPPER A~ 103. 9 77.4 64.2 51.0 30.8 18.4 19.8 13.5 12.1 13.0 12.2 12.2
DeShuer 13-22 Well Sidewall Cores CID-12-2224 44.5 33.1 30.7 23.5 14.4 12.0 9.4 6.6 6.5 6.7 6.2 6.2 (ll}-14-2220 41.6 30.8 29.3 22.2 13.7 ll.5 9.2 6.8 6.9 6.9 6.7 6.9 CID-17-2214 47.l 35.6 34.5 25.8 15.7 12.3 10.3 7 .2 6.9 8.5 6.9 6.8 CID-23-2202 62.7 53.7 47.6 40.l 29.7 1.5.5 22.7 18.8 17.3 18.2 18.9 18.2
I<Cll* 72.3 58.5 51.l 42.6 26.4 19.8 18.4 13.8 12.l 12.6 ll.O 10.5
All values are C:Ondrite Nol:llllli:r.ed "'l<Cll is the standard

102
Figure 26 illustrates those samples which have little fluctuation
in slope between europium and gadolinium. Typically these samples have
lower concentrations of rare earth elements, approximately one-third the
REE content as samples with pronounced europium deficiencies are plotted
in Figure 26. Despite the obvious depletion in Eu, all other REE's in
the upper member samples are predominately enriched (Figure 27).
Oregon Natural Gas and Development Company's Deshazer 13-22 well
side wall core samples are plotted in Figure 28. Samples ONG-23-2202,
which is stratigraphically the highest sample analyzed in the DeShazer
13-22 well, was the only side wall core sample depicting an europium
depletion. The standard utilized by Dr. Hooper, KC-11, is also plotted
with these samples in Figure 28.
Kadri (1982) and Kadri and others (1983) utilized cross-plots to
best characterize and group Tertiary Formations in northwestern Oregon.
Kadri (1982) found that principally five elements; potassium (K), sodium
(Na), scandium (Sc), lanthanum (La) and samarium (Sm) best illustrated
the Tertiary Formations and the Columbia River basalts. Because this
present study involved comparison of the REE geochemistry within one
formation, only subtle variations can be ascertained. Groupings of
samples, like that done by Kadri (1982), understandably are more
difficult to derive in this study.
Plots of Eu and Gd (Figure 29) or the ratio Eu/Gd or vice versa
against higher concentration elements which have a wide range of values,
such as La, best illustrated groupings within the Spencer Formation
samples. Europium/ gadolinium was plotted against lanthinum (Figure
30). This plot differen- tiates two sample groups; 1) those samples
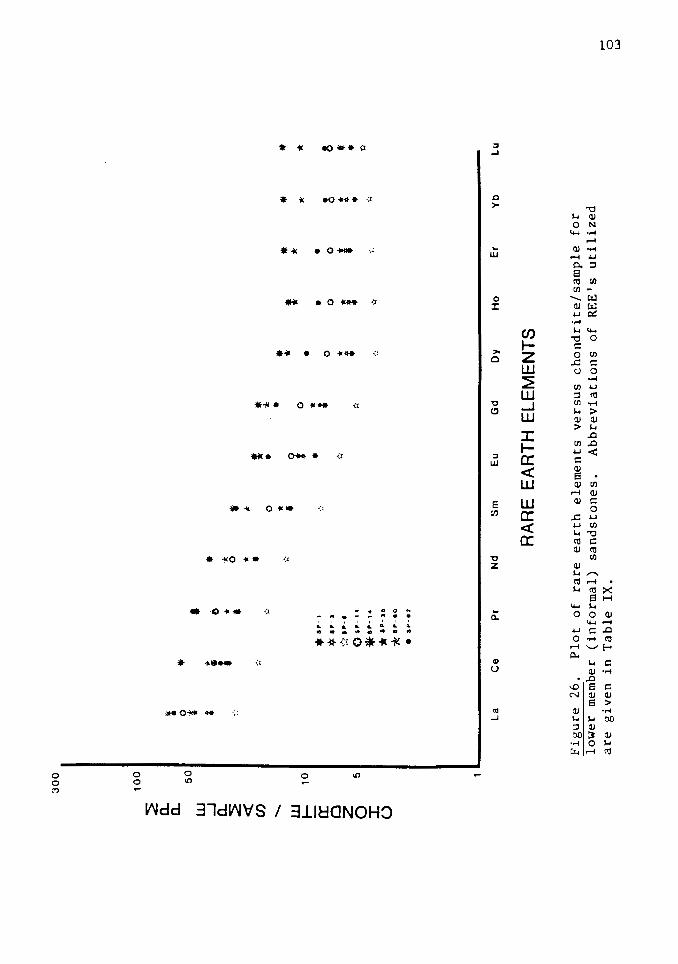
30
0
10
0
::?
a..
a..
50
w
_
J
a..
::?
<(
Cf) - w t-
10
a:
0 z 0 5
I 0
i 0 •
i •
; *
• 5
0
' *
"* •
0 t
* *
-:.:
• t
• ..,
0 •
* "'
* •
• •
t *
t •
• 0
* •
* * ·
·-· •
* * a
r-•
·~i
* •
• 0
0 •
0 0
)~(.,_.
"' *
* l
0 ··
-··
* *
i'.l
: • •
*•'-
14
ii
~'
"' ....
* ··-.
. * ·
·-··
e S
P-1
2
La
C
e P
r N
d
Sm
Eu
G
d
Dy
Ho
Er
Yb
RA
RE
EA
RT
H E
LE
ME
NT
S
Fig
ure
2
6.
Plo
t o
f ra
re
eart
h
ele
men
ts
vers
us
ch
on
dri
te/s
am
ple
fo
r lo
wer
m
embe
r (i
nfo
rmal)
sa
nd
sto
nes.
A
bb
rev
iati
on
s o
f R
EE
's
uti
lized
are
g
iven
in
Tab
le
IX.
• * ~ • • (!
Lu
I-'
0 w
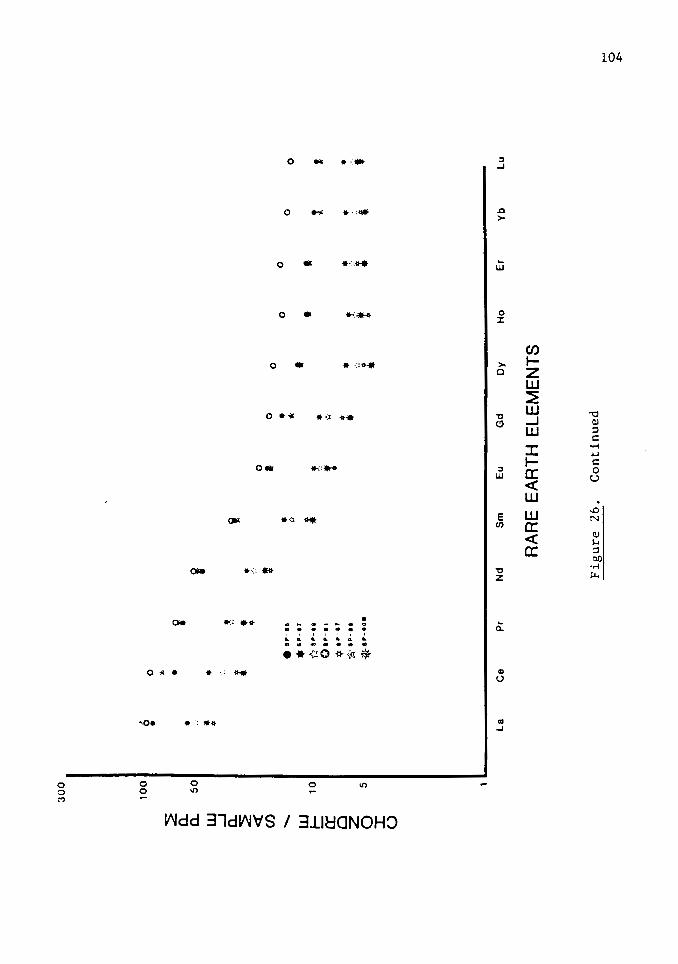
30
0
1 oo
I ,. 0 •
0 .. ~
• i
a.
• a.
5
0
w
* •
• ....
J !
a.
: ~
• <
( •
Cf)
.......
. ··-·· w
... -..
._ 1
0
'(:{
$P
-ll
a:
OIP
-11
0 * ••
-11
z ~-IP-II
0 5
*IP
-IO
I
I ()
La
Ce
Pr
i
i • .· f
0 • 0
0
• •
-:,
* •
• ' t
• -:, • • • "' •
Nd
S
m
Eu
Gd
D
y
RA
RE
EA
RT
H E
LE
ME
NT
S
Fig
ure
2
6.
Co
nti
nu
ed
0 0
• t
t •
f i
Ho
Er
0 % • • Y
b
0 f • t Lu
......
0 -1:--
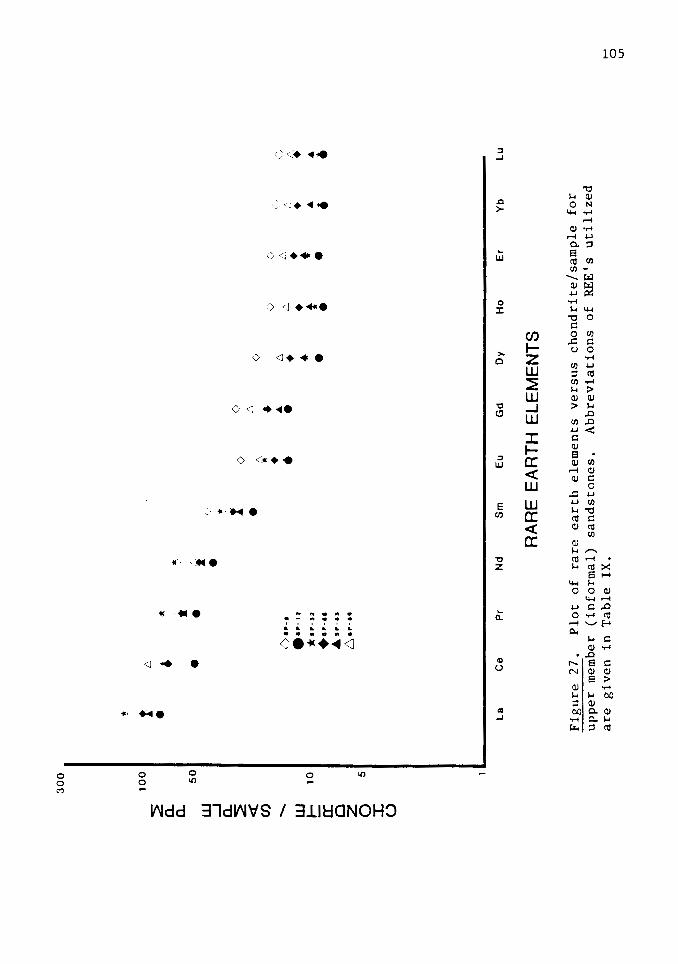
30
0
10
0
~
a..
a..
50
w
_
J
a.. ~
<(
Cl) ...... w
t-1
0
a:
Q z 0
5
I (.)
~ t
6
• '
jl;
·*·
• •
• f •
(· • t
0 0
• :\
A
() ··-·
··' •
0
• •··-
.. •
.. 6
0 (,
*••-
u •
• .'\
,_
:.
•··-..
• •
• t
t •
• •
• .. '
..... _ ..
6••
-at
La
Ce
P
r N
d
Sm
E
u
Gd
D
y H
o
Er
Yb
RA
RE
EA
RT
H E
LE
ME
NT
S
Fig
ure
2
7.
Plo
t o
f ra
re
eart
h ele
men
ts
vers
us
ch
on
dri
te/s
am
ple
fo
r u
pp
er
mem
ber
(in
form
al)
sa
nd
sto
nes.
A
bb
rev
iati
on
s o
f R
EE
's u
tili
zed
are
g
iven
in
Tab
le
IX.
<,)
• .. • Lu
......
0 V1

30
0
• 1
00
¢
+
:E
,•,
• •
• a..
;,
¢
• a..
i
~ ~
50
•
• w
;,
0
...J
• ;, a..
~
<(
Cf) .......
... -...
w
... -.. f-
10
tf
IP
-1
1
0::
-¢' I
P-7
1
0 * I
P-7
'
z *
IP
-7
1A
0 5
* IP
-7
1
:c
()
La
C
e
Pr
Nd
+ ~ ¢ •
+
;,
t ~
• • •
+
I :
;,
;,
! ;,
Sm
E
u G
d
Dy
RA
RE
EA
RT
H E
LE
ME
NT
S
Fig
ure
2
7.
Co
nti
nu
ed
+
~ +
•
~
! ~
f ;,
Ho
Er
Yb
+ 1 • Lu
......
0 "'

30
0
10
0
~
a..
a..
50
w
....J a.. ~
<(
CJ)
......
w ._
10
a:
0 z 0 5
::r:
()
A
! i
• •
I •
• !
• O
NO
-1
-21
11
.ON
O-S
-2
11
1
A
*O
NG
-1
-2
27
1
• !
0 O
NO
-t-
Utl
• t
8 !
*O
NG
-1
0-2
21
1
8 !
• •
• •
• •
La
Ce
Pr
Nd
Sm
Eu
Gd
Dy
Ho
E
r Y
b
RA
RE
EA
RT
H E
LE
ME
NT
S
Fig
ure
2
8.
Plo
t o
f ra
re
eart
h e
lem
ents
v
ersu
s ch
on
dri
te/s
amp
le
for
sid
ew
all
co
re
sam
ple
s ta
ken
fr
om
the
Des
haz
er
13
-22
n
atu
ral
gas
ex
plo
rati
on
well
. A
bb
rev
iati
on
s o
f R
EE
's
uti
lized
are
g
iven
in
T
able
IX
.
* ' • Lu
......
0 -..J

r-ID
() CD
~
z Q.
JJ '">j )> ..... JJ (/)
()Q m 3 c: .., m ro N
)> JJ m
CXl c: -i :r
("') m 0 C> ::i r rt m c.
..... ::i ~ c: m ro Q. z 0
-i '<
(J)
::r 0
m ~
-< C'
r-c:
801
CHONDRITE I SAMPLE PPM
0
i:rit~•· . 0 0 0 0 n z z z z
':' ':' Q Q .. -w ~ .... ' ' .... .. .. .. .. .. .. 0 -
.. .. .. .. 0 ..
.. ,. .. •
--~· ~
.... !)
• • !)
.... !)
- !)
-.. ~
.... I>it
!)
~ . •
•
•
•
•
....
UI 0
•
• !)
• !)
. ~-
!)
0 0
w 0 0

lower in both La and Eu, and 2) those samples higher in Eu and La.
Generally, samples analyzed from the lower member are depleted in rare
earth elements but have relatively higher europium contents.
109
The two most abundant REE's characteristic of Spencer Formation
arkosic and lithic arkose sandstone lithofacies are lanthanum (La) and
samarium (Sm). Concentrations of these two REE's are plotted in Figure
31. The lower lithofacies samples, which contain approximately
one-third to one-half the REE content of the southern and upper
lithofacies, are depicted in the lower left-hand portion of Figure 31.
The lower lithofacies samples, which contain approximately one-third to
one-half of the REE content of the informal upper member lithofacies are
depicted in the lower left-hand portion of Figure 20. Upper member
sandstones La and Sm concentrations plot in the center and upper right
hand portion of Figure 31.
Amount of fines in the sandstone may show some variance in major
oxide and RE element abundances. This evidence is most noticible for
major oxide concentrations, but showed little effect on REE abundances.
Increases in Al203, K20, MgO, and Na20 may reflect clays present.

"""" E
a.
a.
'-J' E
:> ·c: 0 "'O
0 (!)
SP
EN
CE
R
FO
RM
AT
ION
S
AN
DS
TO
NE
G
ad
oli
niu
m
Ve
rsu
s
Eu
rop
ium
C
on
ten
t 8 -.-~~~~~~~~~~~~~~~~~~~~~~~~~~~~~~~~--.
71 x
x *
6 x
x x
++
x
x
5 x
+
x
x>s<
+
4 +
x
3~
* +
*
* +
**-
t.., *
+ ++
2
-I +
'!t
-
+
1 I
I I
I 1
I I
I I
I I
I I
I I
I
0.5
0
.7
0.9
1
. 1
1.3
1
.5
1.7
1
.9
Eu
rop
ium
(p
pm
)
Fig
ure
2
9.
Rar
e eart
h
elem
ent
cro
ss
plo
t d
iag
ram
o
f g
ado
lin
ium
(G
d)
vers
us
euro
piu
m
(Eu
) co
nte
nt
in
the
Sp
ence
r F
orm
atio
n
san
dst
on
es
an
aly
zed
. In
form
al
up
per
an
d
low
er
mem
ber
gro
up
ing
are
a
sho
wn
.
2.1
.... .... 0

,........ E
a.
a.
........ E
::> c 0 .s::
. +
' c 0 ....I
SP
EN
CE
R
FO
RM
AT
ION
S
AN
DS
TO
NE
4
5 40 J
35
301
25
- 2oi
15
-I 1: 1 I
0.1
9
La
nth
an
lum
Vs
E
uro
piu
m/G
ad
oli
niu
m
. x
x x
x x
Xx
x x
+
x +
Xx
+
x
x
+
+ +
* ...
* +
-++
-+
*
+
* +
+
+
+
I I
I I
I I
I I
I I
I I
I I
I I
I I
0.2
1
0.2
3
0.2
5
0.2
7
0.2
9
0.3
1
0.3
3
0.3
5
0.3
7
Eu
rop
ium
/Ga
do
lin
ium
Fig
ure
3
0.
Rare
eart
h
ele
men
t cro
ss
plo
t d
iag
ram
o
f eu
rop
ium
/ g
ad
oli
niu
m
(Eu
/Gd
) v
ers
us
lan
thin
um
(L
a)
co
nte
nt
in
the
Sp
en
cer
Fo
rmati
on
sa
nd
sto
nes
an
aly
zed
. In
form
al
up
per
and
lo
wer
mem
ber
g
rou
pin
g are
a
sho
wn
.
+
0.3
9
f-'
f-'
f-'

- E a.
a.
........ E
.~ c: 0 .c
..... c: 0 ...
J
SP
EN
CE
R
FO
RM
AT
ION
S
AN
DS
TO
NE
L
an
tha
niu
m
Ve
rsu
s
Sa
ma
riu
m
Co
nte
nt
45
x
x
40
j x
x
.35
x x
x +
x
30
I x
+
x x
+
25
-x
20
~ x
+
+
• +
•
+1 ...
1
5 ~
-. +
*
+
+-fl'
+
* ,O
L 5
I ,-
--
-,--
-~-,-
------
, ----
r--
-, 1
3 5
7
Sa
ma
riu
m
(pp
m)
Fig
ure
3
1.
Rar
e eart
h
elem
ent
cro
ss
plo
t d
iag
ram
o
f la
nth
inu
m
(La)
v
ers
us
sam
ariu
m
(Sm
) co
nte
nt
in
the
Sp
ence
r F
orm
atio
n
san
dst
on
es
an
aly
zed
, In
form
al
up
per
an
d
low
er
mem
ber
gro
up
ing
are
a
sho
wn
.
x
9
I-'
I-'
N

CHAPTER VI II
SUMMARY AND CONCLUSIONS
Summary
Stratigraphic variances or trends studied within the Spencer
Formation upper and lower member sandstone lithofacies reflect
depositional environments such as sediment dispersal systems,
paleocurrent directions and water depth. Spencer Formation sandstone
can be subdivided stratigraphically into lithofacies based on
sedimentary structures and textures. The lower member consists of
massive, friable, unfossiliferous, fine- to medium-grained arkosic
sandstones void of sedimentary structures except for micaceous laminae
(1-2 cm). The upper member consists of small to medium beds (lm) of
interbedded mudstone and arkosic to lithic arkosic sandstones which are
poorly- to well-cemented with calcite and smectite, occasionally
exhibiting trough cross-bedding and numerous micaceous (biotite)
laminae. Some horizons contain abundant invertebrate fossils
(pelecypods and gastropods), while others are carbonaceous to coaly or
concretionary.
The stratigraphic observations though, can only be reguarded as
generalizations, because fluctuations in stratigraphy do occur within
the informal upper and lower Spencer Formation sandstones. There are
also geographic trends within the Spencer Formation sandstones. Below
is a list illustrating changes in Spencer Formation sandstone

lithofacies generally from north to south.
- overall finer-grained except the extreme southern portion of the study area where the upper member comes in contact with the Fisher Formation, where conglomerates consisting of large clasts (lcm - lm) occur
- becomes more tuffaceous to pumiceous - commonly more resistent and overall well cemented - contains more invertebrate fossils
Sedimentary petrology of selected Spencer Formation sandstone
samples shows that there are obvious differences in detrital framework
114
mineral grains, and lithic fragments between the lower and upper member
sandstone lithofacies. Distribution of quartz, feldspar and heavy
minerals within the Spencer Formation sandstones provided the best
indicators of stratigraphic and geographic trends.
Lower member arkosic lithofacies have higher concentrations of
monocrystalline quartz and potassium feldspar (predominately
microcline). Metamorphic rock fragments consisting of schist and
quartzite are most common. Study of heavy mineral separates shows that
epidote is commonly two to three times more abundant in the lower
member. The abundance of monocrystalline quartz, quartzite, potassium
feldspar, muscovite, epidote and schistose rock fragments suggest
derivation from a continental plutonic source such as the Idaho
batholith.
Upper member arkosic to lithic arkosic lithofacies contains an
abundance of plagioclase feldspar (oligoclase and andesine).
Microlithic volcanic rock fragments with lath-shaped phenocrysts of
plagioclase are most abundant. Hornblende and augite, commonly etched,
are three to four times more abundant than in the lower member sandstone

115
lithofacies. The abundance of amphibole, pyroxene and plagioclase
indicates an influx of a volcanic source. Influx of volcanic rock
fragments from pre-ancestrial Cascade-type volcanics, originating in
late Eocene within the area of the present day southern Cascade
Mountains could be a possible source for plagioclase contents within the
upper member.
Scanning electron microscopy proved most viable for complimenting
petrographic findings, elemental analysis of mineral grains and
authigenic minerals, and pore space-mineral grain relationships. Clay
mineral assemblages, although detected, are compositionally difficult to
differentiate with the SEM. A variety of mineral-pore relationships
were observed, ranging from friable, highly porous samples to samples
entirely cemented with calcite and smectite showing virtually no
porosity.
Kaolinite, chlorite, illite, smectite, and mixed-layer
illite/smectite are the clay minerals identified by X-ray diffraction.
Diagenesis within the Spencer Formation upper and lower member
sandstones is evident by bent and crushed detrital grains (mostly mica),
development of authigenic clay (smectite), potassium feldspar, and
zeolites (heulandite) minerals as well as the emplacement of calcite
cement. In thin section petrographic evidence of diagenetic processes
within Spencer Formation sandstones was limited to 1) compaction, 2)
chemical etching of amphibole and pyroxene, 3) calcite cement, 4)
degradation of plagioclase and 5) presence of clays. Scanning electron
microscopy studies complemented petrographic studied showing two
additional important diagenetic processes; 1) degradation of silicate

grains and 2) solution or formation of authigenic minerals (potassium
feldspar, smectite, zeolite and calcite). Development of authigenic
minerals is probably aided by the over abundance of~, Na+, ca+2, and
Mg+2 cations which are characteristic of either poorly recharged
aquifers or connate water.
116
Weathering effects within the Spencer Formation sandstones are
compounded by elevated amounts of rainfall and temperate climate
conditions in western Oregon as well as the effect of percolating ground
water. Chemical etching of pyroxene and amphibole detrital grains
within the upper member, degradation of both potassium and plagioclase
feldspars, and the break-down of volcanic rock fragments into clay
minerals may be excelerated by weathering within the Spencer Formation
sandstones. Etching of amphibole and pyroxene is rare in the Deshazer
13-22 w~ll sidewall core samples.
There is a definite correlation between sandstone petrography and
the major oxide and rare earth element geochemistry. Arkose and lithic
arkose sandstones of the upper member contain abundant plagioclase,
hornblende, augite and other heavy minerals. Hornblende especially, has
the ability to retain rare earth elements within its crystal lattice
structure. Higher concentrations of REE's may occur within the upper
member because it is commonly finer-grained than the lower member
allowing for concentration of REE's within the clay mineral fraction.
Both major oxide and rare earth element geochemistry proved viable
for categorizing Spencer Formation sandstone lithofacies. Major oxide
geochemical findings showed that the upper member is silica deficient
and has elevated amounts of alumina, iron and magnesium when compared to

the sandstone lithofacies of the lower member. Rare earth element
abundances were two to three times higher in upper member sandstone
lithofacies than found within the lower member.
117
Petrologic and geochemical evidence found in this study indicate
that there are two main sources from which Spencer Formation arkosic and
lithic arkose sandstone lithofacies have originated. Both distal
metamorphic and plutonic rocks and proximal volcanics are combined
within the Spencer Formation. Gandera (1977), Al-Azzaby (1980), Thoms
and others (1983) and Van Atta (1986) have also come to this conclusion
with regard to the provenance of the Spencer Formation. Petrographic
and accompanying geochemical findings of this study indicate four
possible source areas for these metamorphic/plutonic minerals and lithic
fragments. The areas are: 1) north-central Washington, 2) granitic
rocks once exposed but are now overlain by massive outporings of
Columbia River basalts in central and N.E. Washington, 3) Idaho
Batholith and, 4) Blue Mountains complex. Figure 32 shows this author's
representation of possible source areas where detrital minerals and rock
fragments originated. Volcanic rock fragments were consolidated into
predominately "arkosic" sands being derived from plutonic sources to the
east (Dott, 1966; Dott and Bird, 1979).
Influx of volcanics with increased amounts of heavy minerals (ie.
amphibole and pyroxene) and clay mineral assemblages, would account for
the elemental anomalies observed, reemphasizing the switch in provenance
to an influx of intermediate volcanics within upper and southern
sandstone lithofacies. These samples also have a distinctive europium
anomalies typical of intermediate (andesite to dacite) volcanics.

124°
0
0
123°
North-Central
Washington
-;::
\ r- , I
/ \ Tyalatln -.) ~
,,~)/ I
~ Columbia p. River Oownwarp
' • ..... l • ... " ..... .::..0
...... ..... ~ .... .... ,; -
25 km
/
....
C•
~ .. ' .
I ~
f
25 mi
£ .
$ • ,:
'4- Caacaoao
Development ....-
12 2°
Central & Northeastern
Washington
Idaho
Batholith
WA
Blue
Mountains
Idaho
Batholith
118
41°
45°
4 5 0
123° 12 2°
440_,,_-:-~1:::--~~~~~~~~~=---r-~~~~~~~~~~~~....-~~~~~_J_ 124° 44°
Figure 32. Authors interpretation of provenance or source area for Spencer Formation sands during late Eocene. Large arrows show regional direction for arkosic sand sources. Medium-sized arrows show localized flow of arkosic sands around volcanic highs and the introduction of volcanic (andesite to dacite) material from ancestrial Cascade development. Proximal sheding of volcanic lithic material is shown by small arrows. A = Albany, C = Corvallis, E = Eugene, G = Gaston, M = Mist, P = Perrydale, Pt = Portland.

119
Conclusions
Spencer Formation stratigraphy is probably better understood in the
northern portion of the study area (western Tualatin Valley area), with
the exception of the Corvallis area. Defining the stratigraphic
position of the Spencer Formation in the Corvallis area is complicated
not only by the Corvallis fault zone, a structurally complex series of
SW-NE trending dip-slip faults, but also by the numerous intrusive
volcanics (believed to be late Eocene to early Oligocene) which have
structurally disturbed and locally warped the Spencer Formation
sandstones. Additionally, in the Corvallis area, the upper part of the
Yamhill Formation is very similar to the lower part of the lower member
of the Spencer Formation elsewhere with respect to lithology,
paleontology and petrography. Bruer and others (1984) referred to this
upper part of the Yamhill Formation as the Miller sand member
(informal). Therefore, based on the stratigraphic relationships
observed in the field as well as the petrographic and geochemical
results obtained within this present study, only preliminary subdivision
of the Spencer Formation into upper and lower members can only be
inferred within the Corvallis area.
Locally, only subtle differences in sandstone petrology and
geochemistry within the Spencer Formation are apparent. Within the
northern four separate study areas definite differences in the
petrography and geochemistry occur. The upper member contains more
plagioclase, hornblende, augite, volcanic rock fragments_ (microlithic)
in comparison to the lower member. In contrast, the lower member
contains more potassium feldspar, monocrystalline quartz, epidote,
120
and metamorphic rock fragments (schist and quartzite). Overall the
lower member is deficient in major oxide concentrations (Si02 being the
exception) and in the suite of REE's studied when compared to the upper
member.
To further define the petrologic and geochemical trends developed
in this present study the following areas should have more detailed
work: 1) better stratigraphic control, 2) accompanying
micropaleontological studies, 3) delineate structural complications, and
4) study of additional samples to further define petrology, major oxide
and trace and REE geochemistry. Measurment of detailed composite
stratgraphic sections with accompanying microfossil (dominately
foraminifera) assemblage controls would certainly better define
stratigraphic positioning of the informal members, especially in the
Corvallis area. Also, utilization of ditch samples and additional
sidewall cores from other gas exploration wells within the Willamette
Valley would be important in further determining variations in petrology
and geochemistry both areally and stratigraphically within the informal
upper and lower members of the Spencer Formation.
REFERENCES
Al-Azzaby, F. A., 1980, Stratigraphy and sedimentation of the Spencer Formation in Yamhill and Washington Counties, Oregon: Portland State University, unpublished master's thesis, 104 p.
Allison, I. S., 1953, Geology of the Albany quadrangle, Oregon: Oregon Department of Geology and Mineral Industries Bulletin 37, 20 p., map.
Almon, W. R., and Davies, D. K., 1981, Formation damage and the crystal chemistry of clays in Longstaffe, F. J., ed., Short Coarse in Clays and the Resource Geologist: Mineralogical Association of Canada, Calgary, vol. 7, p. 81-103.
Armentrout, J. M., Hull, D. A., Beaulieu, J. D., and Rau, W. W., program coordinators, 1983, Correlation of Cenezoic stratigraphic units in western Oregon and Washington: Oregon Department of Geology and Mineral Industries Oil and Gas Investigation No. 7, 98 p., 1 chart.
Armentrout, J. M., and Suek, D. H., 1985, Hydrocarbon exploration in western Oregon and Washington: American Association of Petroleum Geologists Bulletin, vol. 69, no. 4, p. 627-643.
·Bailey, E. H., and Stevens, R. E., 1960, Selective staining of K-feldspar and plagioclase on rock slabs and thin sections: American Mineralogist, vol. 45, p. 1020-1025.
Balashov, Y. A., Ronov, A. B., Migdisov, A. A., and Turanskayu, N. V., 1964, The effect of climate and facies environment on the fractionation of the rare earths during sedimentation: Geochemistry International, vol. 10, p. 995-1014 (translation).
Baldwin, E. M., 1947, Geology of the Dallas and Valsetz quadrangles, Oregon: Oregon Department of Geology and Mineral Industries Bulletin 35, revised 1964.
-------- 1976, Geology of Oregon: Kendall/Hunt Publishing Company, 147 p.
Beaulieu, J. D., 1971, Geologic Formation of western Oregon, west of longitude 1210 30': Oregon Department of Geology and Mineral Industries Bulletin 70, p. 13.
Beeson, M. H., and Moran, M. R., 1979, Columbia River Basalt Group stratigraphy in western Oregon: Oregon Geology, vol. 41, no. 1, p. 11-14.

Bhatia, M. R., 1978, Plate tectonics and geochemical composition of sandstones: Journal of Geology, vol. 91, no. 6, p. 611-627.
Bhatia, M. R., and Taylor, S. R., 1981, Trace-element geochemistry and sedimentary provinces: a study from the Tasman Geosyncline, Australia: Chemical Geology, vol. 33, p. 115-125.
122
Bruer, W. G., 1980, Mist Gas Field, Columbia County, Oregon: Technical Program Preprints, Pacific Sections American Association of Petroleum Geologists and Society of Economic Geophysicists, Bakersfield, California, April 1980, 10 p., 15 figs.
Bruer, W. G., Alger, M. P., Deacon, R. J., Meyer, H.J., Portwood, B. B., and Seeling, A. F., 1984, Northwest Oregon, correlation section 24: Pacific Section, American Association of Petroleum Geologists, Cross Section Commette.
Byrnes, M. E., 1985, Provenance study of late Eocene arkosic sandstones in southwest and central Washington: Portland State University, unpublished master's thesis, 65 p.
Carroll, D., 1970, Clay Minerals: A guide to thier X-ray identification: U. S. Geological Survey Special Paper 126, 80 p.
Dana, E. S., and Ford, W. F., 1949, A textbook of mineraolgy: John Wiley & Sons, Inc., New York, 851 p.
Deer, W~ A., Howie, R. A., and Zussman, J., 1967, An introduction to the rock-forming minerals: Lonrman, Green and Co., London, 528 p.
Dickinson, W. R., 1970, Interpreting detrital modes of graywacke and arkose: Journal of Sedimentary Petrology, vol. 40, no. 2, p. 695-707.
-------- 1970, Relations of andesitic, granites, and derivative sandstones to arc-trench tectonics: Reviews of Geophysical and Space Physics, vol. 8, no. 4, p. 813-860.
Dickinson, W. R., and Suczek, C. A., 1979, Plate tectonics and sandstone compositions: American Association of Pertoleum Geologists Bulletin, vol. 63, no. 12, p. 2164-2182.
Diller, J. S., 1900, The Bohemia Mining Region of western Oregon: U. S. Geological Survey 20th Annual Report., part 3, p. 1-36.
Datt, R.H., Jr., 1966, Eocene deltaic sedimentation at Coos Bay, Oregon: Journal of Geology, vol. 74, p. 373-420.
Datt, R. H., Jr., and Bird, K., 1979, Sand transport through channels across an Eocene shelf and slope in southwestern Oregon, in Doyle, L. J., and Pilkey, O, H., eds., Geology of Continental Slopes: Society of Economic Paleontologists and Mineralogists, Special Publication No. 27, p. 327-342.

Drake, E. T., 1982, Tectonic evolution of the Oregon continental margin: Oregon Geology, vol. 44, no. 2, p. 15-21.
Edelman, C. H., and Doeglas, pyroxene and anphibole mineralsin sediments: p. 204-213.
D. J., 1932, Relikstruktaren detritischer in Luepke, g., ed., Stability of heavy New York, Van Nonstrand Reinhold Company,
123
Ehlers, E.G., and Blatt, H., 1980, Petrology: igneous, sedimentary, and metamorphic: W. H. Freeman and Campany, 732 p.
Enlows, H. E., and Oles, K. F., 1966, Authigenic silicates in marine Spencer Formation at Corvallis, Oregon: American Association of Petroleum Geologists, vol. 50, no. 9, p. 1918-1926, 7 figs., 2 tables.
Fleet, A. J., 1984, Aqueous and sedimentary geochemistry of the rare earth elements in Henderson, P., ed., Rare earth element geochemistry: New York, Elsevier, P. 343-373.
Folk, R. L., 1974, Petrology of sedimentary rocks: Hemphill Publishing Company, 182 p.
Frank, F. J., 1973, Ground water in the Eugene-Springfield area, southern Willamette Valley, Oregon: U. S. Geological Survey Water Supply Paper 2018, 65 p., 2 maps.
-------- 1974, Ground water in the Corvallis-Albany area, southern Willamette Valley, Oregon: U. S. Geological Survey Water Supply Paper 2033, 48 p., 2 maps.
-------- 1976, Ground water in the Harrisburg-Halsey area, southern Willamette Valley, Oregon: U. S. Geological Survey Water Supply Paper 2040, 45 p., 2 maps.
Gandera, W. E., 1977, Stratigraphy of the middle to late Eocene Formations of southwestern Willamette Valley: University of Oregon, unpublished masters thesis, 75 p.
Gonthier, J. B., 1983, Groundwater resources of the Dallas-Monmouth area, Polk, Benton, and Marion Counties, Oregon: U. S. Geological Survey Ground Water Report No. 28, 50 p., 2 maps.
Hart, D. H., and Newcomb, R. C., 1965, Geology and ground water of the Tualatin Valley, Oregon: U. S. Geological Survey Water-Supply Paper 1697, 172 p. (map scale 1:48,000).
Haskin, L. A., and Gehl, M. A., 1962, The rare-earth distribution in sediments: Journal of Geophysical Research, vol. 67, p. 2537-2541.
Haskin, L. A., Wilderman, T. R., Frey, F. A., Collins, K. A., Keedy, C. R., and Haskin, M.A., 1966, Rare earths in sediments: Journal of Geophysical Research, vol. 67, no. 24, p. 6091-6105.

Hayes, J. B., 1979, Sandstone diagenesis - The hole truth, in Scholle, P. A., and Schlager, P. R., eds., Aspects of diagenesis: Society of Economic Paleontologists and Minerlagists Special Publication 26, p. 127-139.
124
Heller, P. L., 1983, Sedimentary response to Eocene tectonic rotation in western Oregon: University of Arizona, unpublished doctoral dissertation, 321 p.
Heller, P. L. and Ryberg, P. T., 1983, Sedimentary record of subduction to forarc transition in the rotated Eocene basin of western Oregon: Geology, vol. 11, p. 380-383.
Hoover, L., 1963, Geology of the Anlauf and Drain quadrangles, Douglas and Lane Counties, Oregon: U. S. Geological Survey Bulletin 1122-D. Scale 1:62,500.
Hower, J., 1981, X-ray diffraction identification of mixed-layer clay minerals, in Longstaffe, F. J., ed., Clays and the resource geologist:"}.iineralogical Association of Canada, vol. 7, p. 39-59.
Hower, J., Eslinger, E. V., Hower, M. E. and Perry, E. A., 1976, Mechanism of burial metamorphism of argillaceous sediments: 1. Mineralogical and chemical evidence. Bulletin of Geological Society of America vol. 87, p. 725-737.
Kadri, M. M., 1982, Structure and influence of the Tillamook uplift on the stratigraphy of the Mist area, Oregon: Portland State University, unpublished master's thesis, 105 p.
Kadri, M. M., Beeson, M. H. and Van Atta, R. O., 1983, Geochemical evidence for changing provenance of Tertiary formations in northwestern Oregon: Oregon Geology, vol. 45, no. 2, p. 20-22.
Kay, R., 1972, Cerium: element and geochemistry in Fairbride, R. W., ed., The encyclopedia of geochemistry and environmental sciences: Van Nostrand Reinhold Company, New York, vol. IVA, p. 145-146.
-------- 1972, Dysprosium: element and geochemistry in Fairbride, R. W., ed., The encyclopedia of geochemistry and environmental sciences: Van Nostrand Reinhold Company, New York, vol. IVA, p. 240-242.
-------- 1972, Erbium: element and geochemistry in Fairbride, R. W., ed., The encyclopedia of geochemistry and environmental sciences: Van Nostrand Reinhold Company, New York, vol. IVA, p. 342-344.
-------- 1972, Europium: element and geochemistry in Fairbride, R. W., ed., The encyclopedia of geochemistry and environmental sciences: Van Nostrand Reinhold Company, New York, vol. IVA, p. 349-350.
-------- 1972, Gadolinium: element and geochemistry in Fairbride, R. W., ed., The encyclopedia of geochemistry and environmental sciences: Van Nostrand Reinhold Company, New York, vol. IVA, p. 384-385.

125
-------- 1972, Holmium: element and geochemistry in Fairbride, R. W., ed., The encyclopedia of geochemistry and environmental sciences: Van Nostrand Reinhold Company, New York, vol. IVA, p. 484-485.
-------- 1972, Lanthanides: in Fairbride, R. W., ed., The encyclopedia of geochemistry and envirOiiinental sciences: Van Nostrand Reinhold Company, New York, vol. IVA, p. 640-641.
-------- 1972, Lanthanum: element and geochemistry in Fairbride, R. W., ed., The encyclopedia of geochemistry and environmental sciences: Van Nostrand Reinhold Company, New York, vol. IVA, p. 641-642.
-------- 1972, Lutetium: element and geochemistry in Fairbride, R. W., ed., The encyclopedia of geochemistry and environmental sciences: Van Nostrand Reinhold Company, New York, vol. IVA, p. 664-665.
-------- 1972, Neodymium: element and geochemistry in Fairbride, R. W., ed., The encyclopedia of geochemistry and environmental sciences: Van Nostrand Reinhold Company, New York, vol. IVA, p. 777-778.
-------- 1972, Praseodymium: element and geochemistry in Fairbride, R. W.,ed., The encyclopedia of geochemistry and environmental sciences: Van Nostrand Reinhold Company, New York, vol. IVA, p. 976-977.
-------- 1972, Samarium: element and geochemistry in Fairbride, R. W., ed., The encyclopedia of geochemistry and environmental sciences: Van Nostrand Reinhold Company, New York, vol. IVA, p. 1060-1061.
-------- 1972, Ytterbium: element and geochemistry in Fairbride, R. W., ed., The encyclopedia of geochemistry and environmental sciences: Van Nostrand Reinhold Company, New York, vol. IVA, p. 1220-1221.
-------- 1972, Yttrium: element and geochemistry in Fairbride, R. W., ed., The encyclopedia of geochemistry and environmental sciences: Van Nostrand Reinhold Company, New York, vol. IVA, p. 1221-1222.
Klein, C., and Hurlbut, C. S., Jr., 1985, Manual of Mineralgy: John Wiley & Sons, New York, 596 p.
Leupke, G., (ed), 1984, Economic analysis of heavy minerals in sediments (Benchmark papers in geology; vol. 86), Van Nostrand Reinhold Company Inc., New York, 553 p.
Middleton, G. V., 1960, Chemical composition of sandstone: Geological Society of America Bulletin, vol. 71, p. 1011-1026.
Molenaar, C. M., 1985, Depostional relation of Umpqua and Tyee Formations (Eocene), southwestern Oregon: American Association of Petroleum Geologists Bulletin, vol. 69, no. 8, p. 1217-1229.

126
Mundorff, M. J., 1939, Geology of the Salem quadrangle, Oregon: Oregon State University, unpublished master's thesis 79 p.
Niem, A. R., Niem, W. A., Martin, M. W., Kadri, M. M., and McKeel, D. R., 1985, Correlation of exploration wells Astoria Basin, northwest Oregon: Oregon Department of Geology and Mineral Industries Oil and Gas Investigation 14, 8 p.
Pettijohn, F. J., 1963, Chemical composition of sandstones, excluding carbonate and volcanic sands in Fleischer, M., ed., Data of Geochemistry: U. S. Geologica~Survey Professional Paper 440-S, 19 p.
Pettijohn, F. J., Potter, P. E., and Siever, R., 1972, Sands and Sandstone: New York, Springer-Verlag, 618 p.
Piper, D. Z., 1974, Rare earth elements in the sedimentary cycle: Chemical Geology, vol. 14, p. 285-304.
Pittman, E. D., 1970, Plagioclase feldspar as an indicator of provenance in sedimentary rocks: Journal of Sedimentary Petrology, vol. 40, no. 2, p. 591-598.
Ronov, A. B., Balashov, Y. A., and Migdisov, A. A., and Veradakiy, V. I., 1967, Geochemistry of the rare earths in the sedimentary cycle: Geochemistry International, vol. 4, p. 1-17.
Sanborn, E. I., 1937, The Comstock flora of west-central Oregon, in Eocene flora of western America: Carnegie Inst. Washington publication 465, p. 1-28
Schlicker, H. G., 1962, The occurrence of Spencer sandstone in the Yamhill quadrangle, Oregon: The Ore Bin, vol. 24, no. 11, p. 173-184. Status: Photocopy
Schlicker, H. G., and Deacon, R. J., 1967, Engineering geology of the Tualatin Valley region, Oregon: Oregon Department of Geology and Mineral Industries Bulletin 60, 103 p., (map scale 1:48,000)
Schmidt, V. and McDonald, D. A., 1979, The rate of secondary porosity in the course of sandstone diagenesis: Society of Economic Paleontologists and Mineralogists Special Publication No. 26, p. 175-207.
Schwab, F. L., 1975, Framework mineralogy and chemical composition of continental margin-type sandstone: Geology, vol. 3, p. 487-490.
Shelley, D., 1985, Manual of opitical mineralogy: second ed., Elsevier, New York, 321 p.
Simpson, R. W., and Cox, A. V., 1977, Paleomagnetic evidence of tectonic rotation of the Oregon Coast Range: Geology, vol. 5, p. 585-589.
Snavely, P. D., Jr., and MacLeod, N.S., 1977, Evolution of the Eocene continental margin of western Oregon and Washington: Geological Society of America, Abstract Programs v. 9, no. 7, p. 1183.
127
Snavely, P. D., Jr., MacLeod, N.S., Wagner, H. C., and Lander, D. L., 1980, Geology of the west-central part of the Oregon Coast Range, in Oles, K. F., Johnson, J. G., Niem, A. R., and Niem, W. A., eds., Geologic field trips in western Oregon and southwestern Washington: Oregon Department of Geology and Mineral Industries Bulletin 101, p. 39-76.
Snavely, P. D., Jr., and Wagner, H. C., 1963, Tertiary geologic history of western Oregon and Washington: Washington Division of mines and Geology, Report of Investigations 22, 25 p.
Srodon, J., 1980, Precise identification of illite/smectite interstratifications by x-ray power diffraction: Clays and Clay Mineralogy, vol. 28, p. 401-411.
Thoms, R. E., Van Atta, R. 0., and Taylor, D. G., 1983, Stratigraphy and paleontology of selected sections in the Paleogene rock of the western Tualatin Valley borderlands, northwest Oregon: unpublished report, 83 p.
Turner. F. E., 1938, Stratigraphy and mollusca of the Eocene of western Oregon: Geologic Society of America Special Paper No. 10, 130 p.
Van Atta, R. O., 1986, Lithofacies of Spencer Formation, western Tualatin Valley, Oregon: American Association of Petroleum Geologists Bulletin, vol. 70, no. 4, p. 481.
Van de Camp, P. C., Leake, B. E., and Senior, A., 1976, The petrography and geochemistry of some Californian srkoses with applications to identifying gneisses of metasedimentary origin: Journal of Geology, vol. 84, p. 195-212.
Vokes, H. E., Myers, D. A., and Hoover, L., 1954, Geology of the west central border area of the Willamette Valley, Oregon: U. S. Geological Survey Oil and Gas Investigation Map OM-150.
Vokes, H. E., Snavely P. D., Jr., and Myers, D. A., 1951, Geology of the southern border area of the Willamette Valley, Oregon: U. S. Geological Survey Oil and Gas Investigation Map OM-110.
Walker, T.R., and Waugh, B., 1973, Intrastratal alteration of silicate minerals in Late Tertiary fluvial arkose, Baja California, Mexico: Geological Society of Amnerica, Abstracts with Programs, vol. S, p. 853-859.
Weaver, C. E., 1956, Distribution and identification of mixed-layer clays in sedimentary rocks: American Mineralogist, vol. 41, p. 202-221.

Welton, J. E., 1984, SEM Petrology Atlas: American Association of Petroleum Geologists, Methods in Exploration Series, 235 p.
128
Whalley, B. W., ed., 1978, Scanning electron microscopy in the study of sediments: Geo Abstracts, Norwich, England, 414 p.
Wildeman, T. R., and Haskin, L. A., 1965, Rare earth elements in ocean sediments: Journal of Geophysical Research, vol.70, no. 12, p. 2905-2910.
Williams, H., Turner, F. J., and Gilbert, G. M., 1982, Petrography: an introduction to the study of rock in thin section: W. H. Freeman and Campany, 626 p.
Winters, W. J., 1984, Stratigraphy and sedimentation of Paleogene askosic and volcaniclastic strata, Johnson Creek - Chambers Creek area, southern Cascade Range, Washington: Portland State University, unpublished master's thesis, 162 p.
Wischnitzer, S., 1981, Introduction to electron microscopy: Pergoman Press Inc., New York, P. 219-258.

APPENDIX A
SPENCER FORMATION SAMPLE LOCATIONS
SP-1 Latitude 45° 26' 15"; Longitude 1230 11' 45" Gaston Quad., Washington Co., Ore., TlS, R4W, NEl/4, SEl/4, Sec. 32, road cut along Patton Valley Road, east of Gaston, Oregon,
SP-3 Latitude 45° 24' 12"; Longitude 123° 10' 53" Gaston Quad., Yamhill Co., Ore., T2S, R4W, NWl/2, NEl/4, Sec. 16, road cut along Canyon View Road, east of Gaston, Oregon.
SP-5 Latitude 45° 24' 11"; Longitude 123° 10' 28" Gaston Quad., Yamhill Co., Ore., T2S, R4W, NWl/4, NWl/4, Sec, 15, road cut along Russell Creek Road, east of Gaston, Oregon.
SP-8 Latitude 45° 20' 37"; Longitude 123° 07' 10" Dundee Quad., Yamhill Co., Ore.,
SP-11
SP-12
SP-14
SP-32
T3S, R4W, SWl/4, NEl/4, Sec. 1, road cut along Woodland Loop Road.
Latitude 450 19' 45"; Longitude 123° 06' 45" Dundee Quad., Yamhill Co., Ore., T3S, R4W, NW 1/4, NW 1/4, Sec. 7, road cut along State Highway 240 east of Yamhill, Oregon.
Latitude 440 46' 02"; Longitude 123° 13' 32" Monmouth Quad., Polk Co., Ore., T9S, R4W, SEl/4, SWl/4, Sec. 30, in old clay pit off old State Highway 99W south of Monmouth, Oregon,
Latitude 440 48' 15"; Longitude 1230 14' 03" Monmouth Quad., Polk Co., Ore., T9S, R5W, SEl/4, NEl/4, Sec. 12, road cut along Brateny Road.
Latitude 440 00' 10"; Longitude 123° 17' 20" Elmira Quad., Lane Co., Ore., Tl8S, R5W, SEl/4, NEl/4, Sec. 16, outcrop along Petzold Road southeast of Veneta, Oregon.

SP-3S
SP-SS
SP-S7A
SP-S8
SP-S9
SP-60
SP-62
SP-6S
SP-67
SP-69
Latitude 430 S9' 4S"; Longitude 123° 14' 2S" Fox Hollow Quad., Lane Co., Ore., Tl8S, RSW, NEl/4, NWl/4, Sec. 24, outcrop along Pine Grove Road.
Latitude 440 31' OS"; Longitude 123° 23' 20" Wren Quad., Benton Co., Ore., Tl25, R6W, NWl/4, NWl/4, Sec. 23, outcrop along Evergreen Road south of Philomath, Oregon.
Latitude 44° 32' 15"; Longitude 123° 17' 3S" Corvallis Quad., Benton Co., Ore., Tl2S, RSW, SEl/4, SEl/4, Sec. 9 outcrop along Brooklane Nash Avenue south of Corvallis.
Latitude 440 3S' 5S"; Longitude 123° 12' SO" Corvallis Quad., Benton Co., Ore., TllS, RSW, NWl/4, SEl/4, Sec. 23 outcrop along Highland Way Road north of Corvallis.
Latitude 440 38' 2S"; Longitude 123° 12' SO" Lewisburg Quad., Benton Co., Ore., TllS, R4W, NEl/4, SEl/4, Sec. 6 outcrop along Pettibore Road northeast of Lewisburg.
Latitude 440 38' 40"; Longitude 1230 08' 2S" Lewisburg Quad., Benton Co., Ore., TllS, R4W, SEl/4, NWl/4, Sec. 2 outcrop along Scenic Drive west of North Albany.
Latitude 44° 40' 05"; Longitude 123° 08' 00" Lewisburg Quad., Benton Co., Ore., TlOS, R4W, SEl/4, SWl/4, Sec. 26 outcrop along Scenic Drive west of North Albany.
Latitude 4SO 29' 2S"; Longitude 123° 12' 25" Gaston Quad., Washington Co., Ore., TlS, R4W, NEl/4, NWl/4, Sec. 17 along Henry Hagg Lake Road.
Latitude 4SO 28' lS"; Longitude 1230 12' 10" Gaston Quad., Washington Co., Ore., TlS, R4W, SWl/4, NEl/4, Sec. 20 on the south side of Henry Hagg Lake Dam.
Latitude 4SO 2S' OS"; Longitude 123° 11' 3S" Gaston Quad., Yamhill Co., Ore., T2S, R4W, NWl/4, NWl/4, Sec. 9
130

SP-71
SP-74
SP-7SA
SP-79
SP-81
SP-83
SP-86
SP-87
SP-88
SP-90B
Deshazer Well
Latitude 4S0 21' 20"; Longitude 1230 07' SS" Carlton Quad., Yamhill Co., Ore., T2S, R4W, SWl/4, NWl/4, Sec. 36
Latitude 450 18' 10"; Longitude 123° 07' OS" Carlton Quad., Yamhill Co., Ore., T3S, R4W, NEl/4, NWl/4, Sec. 24. along Yamhill Road.
Latitude 4SO 16' SO"; Longitude 1230 06' 30" Dundee Quad., Yamhill Co., Ore., T3S, R3W, SEl/4, NWl/4, Sec. 30 outcrop along Oak Springs Farm Road.
Latitude 44° S4' 10"; Longitude 1230 18' 40" T8S, R4W, NEl/4, SWl/4, Sec. 4 road cut along Mistletoe Road south of Dallas.
Latitude 44° S2' SO"; Longitude 1230 17' 20" Airlie North Quad., Polk Co., Ore., T8S, RSW, SEl/4, SWl/4, Sec. lS west of Monmouth, Oregon.
Latitude 44° SO' 40"; Longitude 1230 18' 15" Airlie North Quad., Polk Co., Ore., TBS, RSW, NWl/4, SEl/4, Sec. 28 northwest of Monmouth, Oregon.
Latitude 44° 47' OS"; Longitude 1230 14' OS" Monmouth Quad., Polk Co., Ore., T9S, R4W, SWl/4, SWl/4, Sec. 18 road cut along Helmick Road (old 99W) south of Monmouth.
Latitude 440 47' 10"; Longitude 1230 13' 2S" Monmouth Quad., Polk Co., Ore., T9S, R4W, NEl/4, SWl/4, Sec. 18 road cut along Helmick Road (old 99W) south of Monmouth.
Latitude 44° 34' 50"; Longitude 1230 17' 3S" Corvallis Quad., Benton Co., Ore., TllS, RSW, SEl/4, SEl/4, Sec. 28 outcrop at corner of Sylvan Street and Witham Hill Drive, Corvallis.
Latitude 440 38' 4S"; Longitude 1230 11' 20" Lewisburg Quad., Benton Co., Ore., TllS, R4W, SWl/4, NWl/4, Sec. S outcrop along Pettibore Road northeast of Lewisburg.
Latitude 4SO 07' 12"; Longitude 1220 SS' 3S" Gervais Quad., Marion Co., Ore.,TSS, R2W, NEl/4,
SWl/4, Sec 22 2.S kilometers northeast of Gervais, Oregon.
131
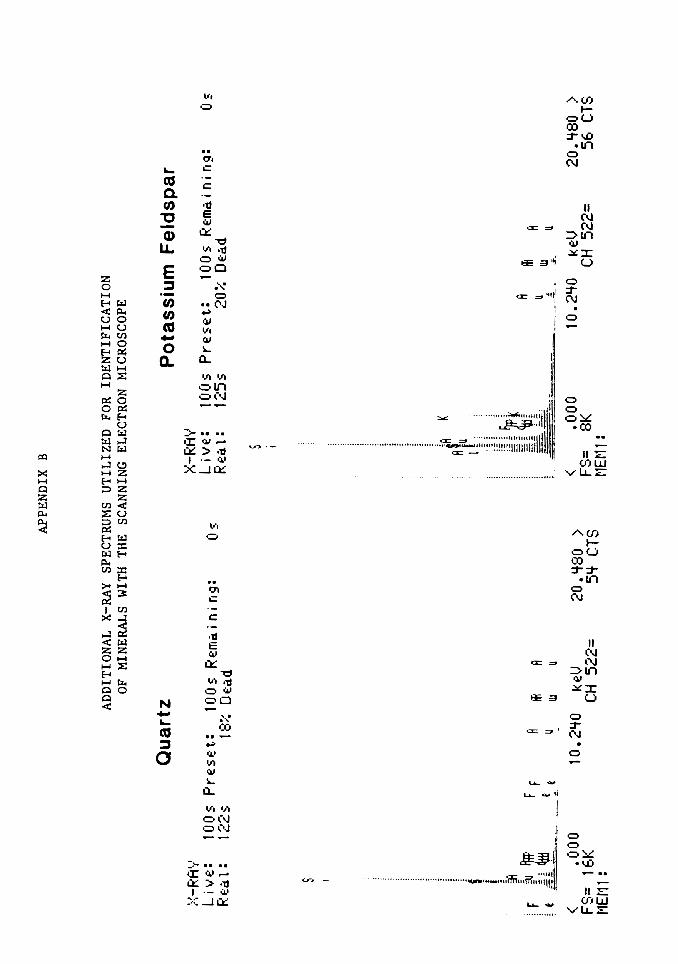
X-RA
Y
APP
END
IX
B
AD
DIT
ION
AL
X-R
AY
SP
ECTR
UM
S U
TIL
IZE
D
FOR
IDE
NT
IFIC
AT
ION
OF
M
INER
ALS
W
ITH
THE
SCA
NN
ING
EL
ECTR
ON
M
ICRO
SCO
PE
Qu
art
z P
ota
ssiu
m F
eld
sp
ar
X-RA
V L
ive
: 10
0s P
rese
t:
100s
Re
ma
inin
g:
(Is
L i v
e:
1 0 0
s P
rese
t:
1 0 0
s
Rem
a i n
i n
g:
Os
Re
a1
: 1
22
s 18
%
De
ad
F
t
s
F F
€_
t ~~--=·
<
• 00
0
FS=
16K
f'lE
M 1
:
A
lfi A
w
u
10. 2
't0
keU
CH
522
= 20
. 't8
0 >
S
't C
TS
Re
al:
12
5s
20%
De
ad
c •' RSfi
K
fu I
<
.000
FS
= 8K
M
EM
l:
-
A
ll1 fi
u w
.!
. ~
u
10.2
't0
keU
CH
522
= 20
. 't8
0 >
56
CTS
'.\

"'
Pla
gio
cla
se
Fe
lds
pa
r
>~-RAV
L i v
E::
1 0 0
s P
re s
e t:
1 0
0 s
Rem
a. i
n i n
g:
Os
RE:a
1:
120
s 17
%
Dea
d
N
i
s ' i
A I I SA Ju
<
.00
0
FS=
SK
MEM
1:
A
Ill A
u
UI
u .
-=
10.2
Lf0
kE:V
CH
5
22
=
20
. Lf8
0 >
60
C
TS
Bio
tite
X-R
AV
L
i v E
:: 1 0
0 s
Pre
se
t:
1 0 0
s R
em a
i n
i n g:
O
s R
E:a
\: 1
21
s 17~~
D
ead
S, i ~ I ! ~ ~
A I 1.1
F
iSA
[~ ,~
~ ir~
ii:~
l ~ A
~
u A
Ill
u --
.. -
<
.00
0
10
. 2Lf
0 ke
V
20
. Lf8
0 >
FS
= Lf K
CH
52
2=
Lf Lf
CTS
M
EM1:
......
w
w

Ca
lcit
e
X-RA
Y L
ive:
10
0s P
rese
t:
100s
Rem
aini
ng:
Os
Rea
l:
120s
17
%
Dea
d
R
c I
<
• 000
FS
= SK
M
EM1:
R
u -~
10.2
1.fO
!fl R
U1
u
~ Ke
lJ CH
52
2=
20. l
f80
>
58 C
TS
Sp
hen
e
X-RA
Y L
ive:
10
0s P
rese
t:
100s
R
emai
ning
: O
s R
ea1:
12
8s
22%
D
ead
i
s I I l I JR
fo S: Ii
~ -L
1 E
fm
Cc .
T
I'
', i
~- <
• 000
FS
= 8K
M
EM1:
R
u ~
R
~
~
u -·A
~
-
10. 2
lf0
I< e:V
CH
52
2=
20. l
f80
>
107
CTS
.......
w ~

Sm
ec
tite
>::-R
AV
L i v
e::
1 0 0
s P
r E: s
E: t:
1 0
0 s
F.: e:m
a. i n
i n g:
0:
F.:
e:a t
: 1 2
2 s
1 8%
D
e:a.d
s AS
I -
K
<
• 000
FS
= 8K
~lEM 1
:
A u
111 w
1o
.2lfO
~~
e:u A
u
CH 5
22=
20. l
f80
>
70
CTS
Gla
uc
on
ite
X-R
AY
L
ive:
: 10
0s P
rese
t:
100s
Re:
ma.
inin
g:
Os
Re:
at:
128s
22
%
Oe:a.
d
OF
~-'
A I s A
[U
pDv !Cc
T T
,aa
i i
<
• 000
FS
= 8K
M
EM
l:
F t
F
A
u 111
w
10. 2
lf0
ke:U
A u
CH 5
22=
20. l
f80
>
11 lf
CT
S
......
w
VI