strategies to reduce methane emissions from enteric and
TRANSCRIPT

1
STRATEGIES TO REDUCE METHANE EMISSIONS FROM ENTERIC AND LAGOON SOURCES
(Contract 17RD018)
Prepared for:
State of California Air Resources Board
Research Division
PO Box 2815
Sacramento CA 95812
Prepared by:
Ermias Kebreab and Xiaoyu Feng
University of California, Davis, One Shields Avenue
Davis, CA 90210 (530) 752 5907
January 8, 2021

2
DISCLAIMER
The statements and conclusions in this report are those of the contractor and not necessarily those of the California Air Resources Board. The mention of commercial products, their source, or their use in connection with material reported herein is not to be construed as actual or implied endorsement of such products.

3
ACKNOWLEDGEMENTS
This study was supported by the California Air Resources Board Project #17RD018. The authors want to thank the GLOBAL NETWORK project for providing access to their Treatment Means Methane Mitigation Database. The GLOBAL NETWORK project was coordinated by the Feed and Nutrition Network, which is part of the Livestock Research Group of the Global Research Alliance for Agricultural Greenhouse Gases (https://globalresearchalliance.org/research/livestock/collaborative-activities/global-research-project).
4
TABLE OF CONTENTS
Acknowledgments ..........................................................................................................................3 Table of Contents ...........................................................................................................................4
List of Abbreviations .....................................................................................................................6
Abstract ...........................................................................................................................................7
Executive Summary .......................................................................................................................9 Introduction ..................................................................................................................................12
Feed additives targeting enteric methane emissions .................................................................14 Feed additives with some potential for mitigation .....................................................................18
Secondary plant compounds ......................................................................................................... 18
Methanogenesis inhibitors ............................................................................................................ 19
Feed additives with highest potential for mitigation ..................................................................19 3-Nitrooxypropanol........................................................................................................................ 20
Nitrates .......................................................................................................................................... 24
Additives targeting manure methane emissions........................................................................38 Data collection and selection ......................................................................................................... 39
Statistical analysis .......................................................................................................................... 40
Effect sizes of manure additives .................................................................................................... 42
Effects of manure additives from random-effects models ............................................................ 47
Heterogeneity test ......................................................................................................................... 49
Analysis of manure type, additive type, and characteristic of treatment manure ....................... 50
Net reductions in greenhouse gases from feed additives in California ...................................54 Materials and methods .................................................................................................................. 54
Mitigation scenarios ...................................................................................................................... 55
Emission associated with production and use of additives ........................................................... 56
3-Nitrooxypropanol........................................................................................................................ 56
Nitrate ............................................................................................................................................ 60
Results and Discussion ................................................................................................................... 61
3-Nitrooxypropanol........................................................................................................................ 61
Nitrate ............................................................................................................................................ 63
5
Comparison of 3-nitrooxypropanol and nitrate additives ............................................................ 65
Summary .......................................................................................................................................67
References .....................................................................................................................................69
Appendix 1 ....................................................................................................................................87
Appendix 2 ....................................................................................................................................92

6
List of Abbreviations
3NOP 3-nitrooxypropanol
BW Body weight
CARB California Air Resources Board
CDFA California Department of Food and Agriculture
CP Crude protein (% dry matter)
DDGS Dry distillers grain with solubles
DMI Dry matter intake (kg/d)
ECM Energy corrected milk
GE Gross energy
GHG Greenhouse gases
IPCC Intergovernmental Panel for Climate Change
LCA Life cycle assessment
MD Mean difference
NDF Neutral detergent fiber (% dry matter)
OM Organic matter)
RMD Relative mean difference
RVE robust variance estimation
SMD Standardized mean difference
USDA United States Department of Agriculture
USDA NASS United States Department of Agriculture National Agricultural Statistics Service
USDA ERS United States Department of Agriculture Economic Research Service

7
ABSTRACT
The State of California launched the short-lived climate pollutant reduction strategy (SB 1383)
with the objective of decreasing methane (CH4) emissions from livestock by 40% by 2030 from
2013 levels. Considering about 50% of CH4 emissions in the State are attributed to enteric
fermentation and manure, achieving significant CH4 emission reduction from these sources will
be critical to meeting SB1383 goals. There are numerous mitigation options described in the
literature including feed and manure additives. The objective of the study was to provide
quantitative analysis, evaluate feasibility, and summarize and prioritize research gaps to guide
future research in the State. Specifically the current study conducted a literature review of
available mitigation strategies using additives to reduce enteric and manure methane emissions
including size effect and performance analyses and used life-cycle assessment tools to estimate
net greenhouse gas emissions from using potential feed additives in the dairy industry. Effect
size and meta-analyses were conducted to identify the additives with greatest potential for CH4
mitigation. For feed additives, 3-nitrooxypropanol (3NOP), bromochloromethane, chestnut,
coconut, distillers dried grains and solubles, eugenol, grape pomace, linseed, monensin, nitrate,
nitroethane, saifoin, fumaric acid, and tannins had significant impacts on enteric emissions. For
manure additives, acidification, biochar, microbial digestion, physical agents, straw, and other
chemicals significantly reduced CH4 emissions. However, there were other promising additives
that need further research, including Mootral, macroalgae and SOP lagoon additive (SOP). After
further analysis of variance, the most effective feed additives were 3NOP (41% in dairy and 22%
reduction in beef) and nitrate (14.4% reduction). Biochar as a manure additive can be effective
on compost manure (up to 82.4% reduction), but may have no impact on lagoon emissions. A
life cycle assessment tool was used to estimate the net reduction in enteric CH4 emissions by

8
using the feed additives 3NOP and nitrate. The overall average net reduction rate of
supplementing 3NOP and nitrate were 11.7% and 4.9%, respectively. Given the toxicity
concerns of nitrate, only 3NOP is recommended for use pending FDA approval. Considering
California milk production of 18 billion kg in 2017, using nitrate on California dairy cows would
reduce GHG emissions 1.09 billion kg CO2e and 3NOP 2.33 billion kg CO2e annually. Further
research in the additives of Mootral, macroalage, SOP, biochar and other emerging ones is
required before recommendation for use can be made.

9
EXECUTIVE SUMMARY
Background
About 50% of CH4 emissions in California are attributed to enteric fermentation and manure;
therefore, achieving significant methane (CH4) emission reduction from these sources will be
critical to meeting SB1383 goals. There are several strategies for reducing CH4 emissions from
enteric fermentation and manure management in the literature (e.g., Knapp et al. 2014), including
diet manipulation, feed additives, anaerobic digestion and liquid-solid separation. A number of
excellent reviews on enteric methane mitigation techniques have already been published.
Similarly, there are a number of reviews available that summarize mitigation options to reduce
CH4 emissions from manure management. However, none of the reviews quantitatively evaluate
impact of feed and manure additives in a meta-analytic and holistic manner. The overall objective
of this study was to review feed and manure additives used for CH4 emission reduction and identify
those with the potential to be applied in the California livestock industry. The feed and manure
additives were classified into three categories as follows. Category 1: Safe and effective for
methane use, recommended when all regulatory approvals are in place. Category 2: Research to
date shows this product may be effective and more research is required before it is recommended
for use. Category 3: Research to date has either provided insufficient evidence to conclude that the
product may be effective, or has shown that product is not effective, or has shown that the product
should not be used for other reasons.
Methods
Extensive literature survey on feed and manure additives was conducted and data collected in an
excel spreadsheet that includes information on methane emissions as well as dietary and other

10
factors. Effect size estimates of mean difference (MD; i.e., mean treatment minus mean control)
and standardized mean difference (SMD) were calculated using the open source statistical software
R (version 3.6.1, R Foundation for Statistical Computing, Vienna, Austria). For some feed and
manure additives, a meta-analysis was conducted using the robust variance estimation method to
deal with unknown correlations among non-independent effect sizes. For the most promising feed
additives, a life cycle assessment approach was taken in which crop production, additive
production, farm operation, enteric emissions, and manure emissions were taken into account to
estimate the net greenhouse gas emission in producing a kilogram of milk.
Results
A literature survey of feed additives with anti-methanogenic properties revealed over 90 potential
additives. However, after analyzing their impact on CH4 emissions only 3-nitrooxypropanol
(3NOP), bromochloromethane, chestnut, coconut, DDGS, eugenol, grape pomace or marc, linseed,
monensin, nitrate, nitroethane, saifoin, fumaric acid, and tannins had overall CH4 reduction
potential. Of these, only 3NOP and nitrate were considered to have the best potential outcome for
mitigation. Feed additives such as Mootral, macroalgae and Agolin have also shown promise but
there is limited in vivo work to allow full consideration. A total of 13 categories of manure
additives were included for their potential to reduce emissions. In a meta-analysis, acidification,
biochar, microbial digestion, physical agents, straw, and other chemicals significantly reduced CH4
emissions. The most effective manure additive was biochar, which significantly reduced CH4
emissions by up to 82.4%. However, further work is needed to develop a protocol on the type/dose
of biochar and its effectiveness based environmental conditions. Other manure additives were not
included in the analysis because only one or two experiments have been conducted (e.g. SOP;
Borgonovo et al., 2019). It has a potential but needs further study. The two promising feed
11
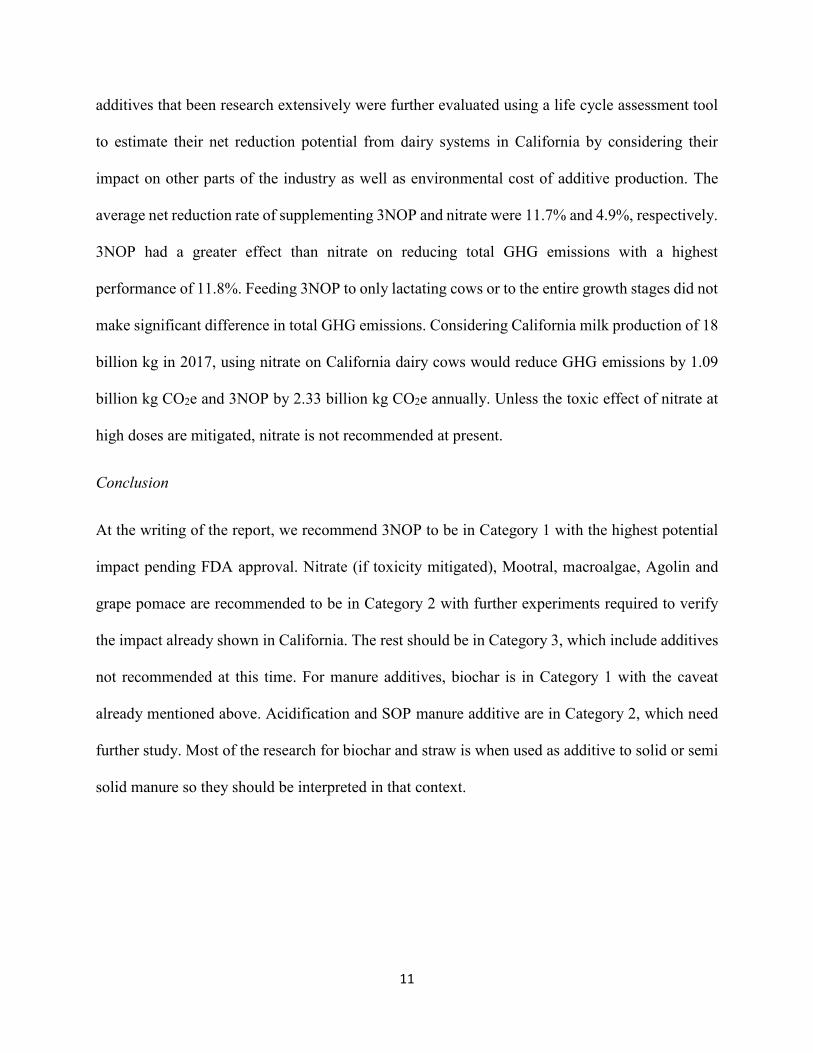
additives that been research extensively were further evaluated using a life cycle assessment tool
to estimate their net reduction potential from dairy systems in California by considering their
impact on other parts of the industry as well as environmental cost of additive production. The
average net reduction rate of supplementing 3NOP and nitrate were 11.7% and 4.9%, respectively.
3NOP had a greater effect than nitrate on reducing total GHG emissions with a highest
performance of 11.8%. Feeding 3NOP to only lactating cows or to the entire growth stages did not
make significant difference in total GHG emissions. Considering California milk production of 18
billion kg in 2017, using nitrate on California dairy cows would reduce GHG emissions by 1.09
billion kg CO2e and 3NOP by 2.33 billion kg CO2e annually. Unless the toxic effect of nitrate at
high doses are mitigated, nitrate is not recommended at present.
Conclusion
At the writing of the report, we recommend 3NOP to be in Category 1 with the highest potential
impact pending FDA approval. Nitrate (if toxicity mitigated), Mootral, macroalgae, Agolin and
grape pomace are recommended to be in Category 2 with further experiments required to verify
the impact already shown in California. The rest should be in Category 3, which include additives
not recommended at this time. For manure additives, biochar is in Category 1 with the caveat
already mentioned above. Acidification and SOP manure additive are in Category 2, which need
further study. Most of the research for biochar and straw is when used as additive to solid or semi
solid manure so they should be interpreted in that context.

12
INTRODUCTION
Global emissions of greenhouse gases (GHG) have risen to unprecedented levels despite a growing
number of policies to reduce climate change (IPCC, 2014). Anthropogenic sources account for
58% of global GHG emissions (EPA, 2011), 18% (5.0 – 5.8 Gt CO2eq /yr) of which was generated
by agriculture-related activities during 2000–2010 period (Smith et al., 2014). Methane (CH4) from
enteric fermentation and manure was the largest contributor (40%) to the agricultural GHG
emissions (Tubiello et al., 2013). The largest source of anthropogenic CH4 in the US is from
livestock, particularly ruminants (EPA, 2017).
The State of California launched the short-lived climate pollutant reduction strategy (SB
1383; CARB 2017) with the objective of decreasing CH4 emissions from livestock by 40% by
2030 from 2013 levels. About 50% of CH4 emissions in the State are attributed to enteric
fermentation and manure (CARB, 2020); therefore, achieving significant CH4 emission reduction
from these sources will be critical to meeting SB1383 goals. There are several strategies for
reducing CH4 emissions from enteric fermentation and manure management in the literature (e.g.,
Knapp et al. 2014), including diet manipulation, feed additives, anaerobic digestion and liquid-
solid separation. This proposal is focused on additives that reduce methane emissions from enteric
and lagoon sources.
A number of excellent reviews on enteric methane mitigation techniques have already been
published (e.g., Boadi et al., 2004; Beauchemin et al., 2009; Cottle et al., 2011; Hristov et al.,
2013). Similarly, there are a number of reviews available that summarize mitigation options to
reduce CH4 emissions from manure management (e.g., Kebreab et al., 2006; Jayasundara et al.,
2016). Recently, an international group of scientists (including the PI) conducted a comprehensive
analysis of mitigation options for reducing enteric (Hristov et al., 2013a) and manure (Montes et

13
al., 2013) emissions. The intention of this proposed study is not to reproduce them but to evaluate
statistically the effectiveness of various mitigation techniques. Studies on novel feed additives
have been published recently and continue to be reported in the literature, which may have not
been included in the previously mentioned reviews. There is a need for a comprehensive review
and analysis of additives that have the potential to be successful in California in mitigating
emissions. The review will take a holistic approach and extend to include a life-cycle analysis
(LCA) of the impact of additives. This will allow a fuller environmental impact assessment, which
is associated with implementing some of the additives that have already been developed and some
that are currently being tested.
The overall objective of this study is to review feed and manure additives used for methane
emission reduction and identify/categorize those with the potential to be applied in the California
livestock industry. The strategies will be analyzed not only for their potential to reduce emissions
but also their impact, if any, on product quality and animal welfare. Analysis of additives for
methane mitigation potential will take a life-cycle approach, which will be required in case
production and implementation of additives will have upstream and downstream consequences
that may change the net benefit. The additives will be placed into the following three categories:
Category 1: Safe and effective for methane use, recommended when all regulatory approvals are
in place. Category 2: Research to date shows this product may be effective and more research is
required before it is recommended for use. Category 3: Research to date has either provided
insufficient evidence to conclude that the product may be effective, or has shown that product is
not effective, or has shown that the product should not be used for other reasons. The ultimate
objective is to provide quantitative analysis, summarize and prioritize research gaps to guide future
research in the State. The following specific objectives will be addressed in the current study:

14
1. Literature review of available mitigation strategies using additives to reduce enteric and
manure methane emissions including size effect and performance analyses.
2. Prioritize research gaps and use life-cycle analysis to assess potential unintended impacts
such as greater emission in sourcing the product or product development.
FEED ADDITIVES TARGETING ENTERIC METHANE EMISSIONS
A literature survey of feed additives used targeting enteric methane emissions was conducted.
There were a total of 90 different feed additives collected from the literature. The counts of
treatment, averages, standard deviations, minimums and maximums of Mean Difference (i.e.,
mean treatment minus mean control) of CH4 production for control/treatment groups based on feed
additive type is summarized in Appendix 1. Methane production and methane production per dry
matter intake (DMI) were expressed in g/day and g/kg, respectively. Effect size estimates of mean
difference (MD) and standardized mean difference (SMD) were calculated using the open source
statistical software R (version 3.6.1, R Foundation for Statistical Computing, Vienna, Austria).
Any feed additive related studies without CH4 production information listed in the database were
excluded in the further analysis. Furthermore, feed additives with only one record were excluded
in further tests because lack of replications prevents the calculation of standard deviation, and P-
values.
After the data was filtered and selected based on the criteria mentioned above, a sample t-
test (treatment-control) was conducted based for each feed additive. Table 1 gives the P-values
from significant t-test (α=0.05). As a result, feed additives including 3-nitrooxypropanol (3NOP),
bromochloromethane, chestnut, coconut inclusion, DDGS concentrate, eugenol, grape pomace,

15
linseed, monensin, nitrate, nitroethane, saifoin, fumaric acid, hydrolysable tannins, and Sericea
lespedeza tannins significantly impacted the MD of CH4 production. Similarly, a box and forest
plots were constructed to assess the impact of feed additives on methane production (Fig. 1, 2).
Table 1. Impact of feed additives on CH4 reductions (g/d) based on t-test.
Feed additive* P-value Feed additive P-value 3NOP 0.002 Legume 0.403 Acacia mearnsii 0.057 Linseed inclusion 0.007
Acetate inclusion 0.084 Lotus tannins 0.989 Microbial culture 0.051 Lovastatin 0.130 Bromochloromethane <0.001 Lupine seed 0.449 Calcium soap inclusion 0.248 Malic acid 0.184 Canola inclusion 0.291 Methylbutyrate inclusion 0.109 Carboxylic acid 0.636 Mimosa 0.310 Cerium chloride 0.078 Monensin <0.001 Chestnut 0.044 Myristic acid 0.561 Chitosan 0.841 Nisin 0.205 Coconut inclusion 0.005 Nitrate <0.001 Corn 0.183 Nitroethane 0.045 Cumin 0.069 Oregano 0.077 Cysteine 0.587 Polyethylene glycol 0.256 DDGS concentrate 0.012 Quebracho 0.109 DHA inclusion 0.372 Saifoin 0.027 Essential oil blend 0.172 Saponaria 0.177 Eugenol 0.008 Sericea lespedeza tannins 0.008 Fatty acid blend inclusion 0.101 Sorghum tannins 0.150 Fibrolytic enzyme 0.223 Soybean oil inclusion 0.749 Flaxseed inclusion 0.454 Stearic acid 0.719 Garlic 0.848 Sunflower inclusion 0.079 Glycerin 0.793 Tea saponin 0.096 Grape pomace 0.050 Triiodothyronine 0.695 Grass 0.676 Valonea 0.883 Hydrolysable tannins 0.018 Vitacogen 0.587 Iso-valerate inclusion 0.093 Yucca 0.172 Lasolocid 0.946 Lauric 0.427
Some data from Global Network project are included.

16
Figure 1. Boxplot of mean difference of CH4 production. The horizontal line was the reference line of 0 g/d reduction. Some data from
Global Network project are included.

17
Figures 2. Forest plot including the summary of valid treatment counts, lower and upper boundaries of mean difference for different
feed additives with 95% credible interval. Some data from Global Network project are included.

18
Once the potential feed additives were identified, a secondary assessment was conducted to
investigate their appropriateness for California livestock industry including cost, unintended
negative consequences, availability and persistence in reducing emissions. The use of chestnut,
coconut inclusion, DDGS concentrate, eugenol saifoin, fumaric acid and linseed appear to increase
the cost of production as well as reduce productivity or pollutions swapping. For example
increased use of DDGS may reduce methane but increases nitrogen loading, which may contribute
to increased N2O emissions. Therefore, these mitigation options were not considered further. The
study by Appuhamy et al. (2013) showed that although monensin reduced methane production by
about 6% in beef and 12% in dairy cattle, the effect was transient. After about 6 weeks of monensin
supplementation the rumen microbes adapt to it and any benefit in reduction of methane emissions
is lost. Therefore, monensin was not considered further.
Feed additives with some potential for mitigation
Secondary plant compounds
Tannins have shown promise for methane mitigation but not much work has been done in
California conditions. There is a need for further investigation of the use of tannins, in particular
grape pomace (or grape marc), in California, as the raw materials are easily available. UC Davis
plans to conduct a trial on grape pomace. There are also feed additives that were not considered
fully because of lack of studies. A feed additive based on citrus and garlic extracts, Mootral, has
been studied in California. Roque et al. (2019a) showed that after 12 weeks of supplementation,
Mootral reduced methane emissions by 23%. The trial was relatively short and involved 20
animals. A bigger trial with 45 beef cattle and longer period has been planned for summer 2020 at
UC Davis. Following that, another trial with Mootral using dairy cattle is planned for fall 2020.
19
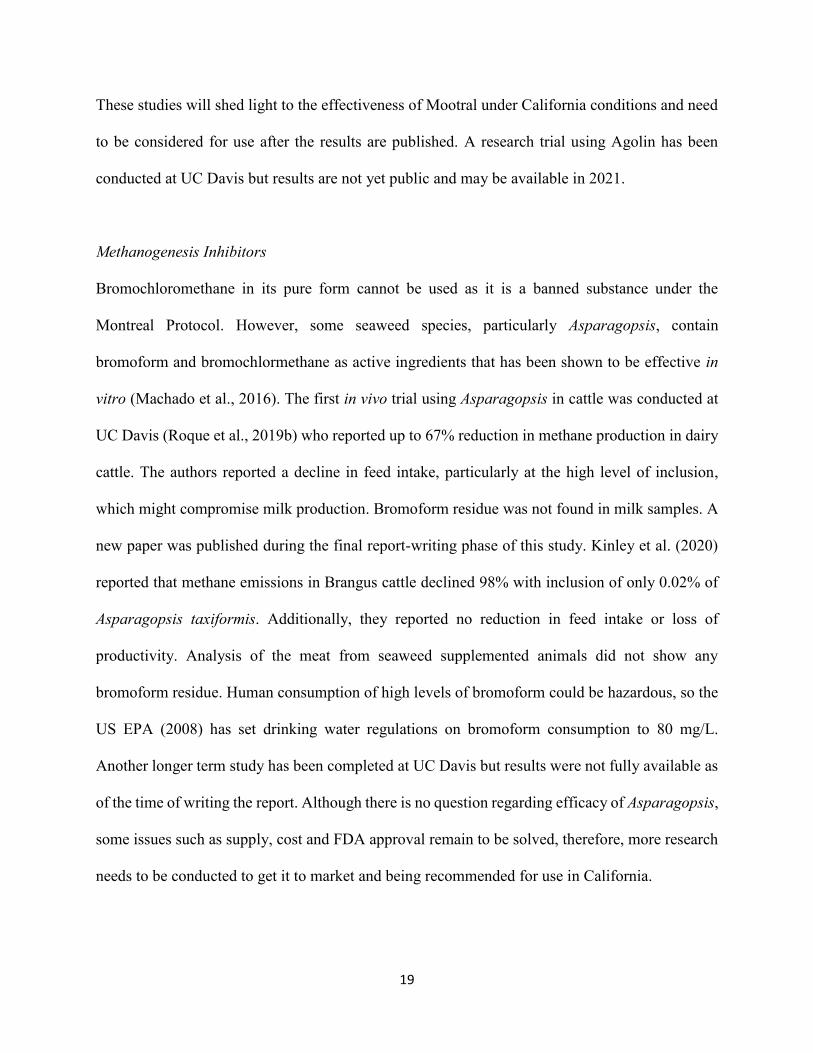
These studies will shed light to the effectiveness of Mootral under California conditions and need
to be considered for use after the results are published. A research trial using Agolin has been
conducted at UC Davis but results are not yet public and may be available in 2021.
Methanogenesis Inhibitors
Bromochloromethane in its pure form cannot be used as it is a banned substance under the
Montreal Protocol. However, some seaweed species, particularly Asparagopsis, contain
bromoform and bromochlormethane as active ingredients that has been shown to be effective in
vitro (Machado et al., 2016). The first in vivo trial using Asparagopsis in cattle was conducted at
UC Davis (Roque et al., 2019b) who reported up to 67% reduction in methane production in dairy
cattle. The authors reported a decline in feed intake, particularly at the high level of inclusion,
which might compromise milk production. Bromoform residue was not found in milk samples. A
new paper was published during the final report-writing phase of this study. Kinley et al. (2020)
reported that methane emissions in Brangus cattle declined 98% with inclusion of only 0.02% of
Asparagopsis taxiformis. Additionally, they reported no reduction in feed intake or loss of
productivity. Analysis of the meat from seaweed supplemented animals did not show any
bromoform residue. Human consumption of high levels of bromoform could be hazardous, so the
US EPA (2008) has set drinking water regulations on bromoform consumption to 80 mg/L.
Another longer term study has been completed at UC Davis but results were not fully available as
of the time of writing the report. Although there is no question regarding efficacy of Asparagopsis,
some issues such as supply, cost and FDA approval remain to be solved, therefore, more research
needs to be conducted to get it to market and being recommended for use in California.

20
Feed Additives with highest potential for mitigation
We found two feed additives that have been extensively studied (over 10 trials each). These are 3-
nitrooxypropanol (3NOP), and nitrate. The rest of the section on feed additives will focus on these
two. We updated a meta-analysis conducted for 3NOP and built a new meta-analysis for use of
nitrate in beef and dairy cattle. We then proceeded to use a life-cycle assessment developed for
California conditions (Naranjo et al. 2020) and assessed the net reduction expected if either 3NOP
or nitrate were to be used. The life-cycle assessment was from cradle to farm gate so included
emissions from feed production, the barn (i.e., animals, manure, electricity) and farm operations.
There is a challenge of supplementing with nitrate currently due to toxicity risk. However, research
is being conducted to add microbes that can help in detoxification (Latham et al., 2019) and a full
analysis of nitrate use is provided below.
3-Nitrooxypropanol (3NOP)
A meta-analysis was conducted by Dijkstra et al. (2018) on effects of 3NOP. However, 4 additional
papers were published that were not included in the meta-analysis. Therefore, we updated the
previous meta-analysis by adding data from Martinez-Fernandez et al. (2018) (beef; 1 study), Vyas
et al. (2018b) (beef; 2 studies), Kim et al. (2019) (beef; 4 studies), and Van et al. (2019) (dairy; 2
studies). The updated forest plots for Standardized Mean Difference of CH4 production and yield
are shown in Figures 3 and 4.

21
Figure 3. Forest plot showing 3-nitrooxypropanol (3NOP) dose (mg/kg of DM) and standardized
mean difference (mean difference is calculated as NOP treatment mean − control treatment mean)
in CH4 production (g/d) for beef and dairy cattle studies.
-20.0 -10.0 0.0 10.0
Standardized Mean Difference
Martinez-Fernandez et al. (2018)Van et al. (2019)Van et al. (2019)Kim et al. (2019)Kim et al. (2019)Kim et al. (2019)Kim et al. (2019)Vyas et al. (2018b) (FIN)Vyas et al. (2018b)Vyas et al. (2018a) (FIN)Vyas et al. (2018a) (FIN)Vyas et al. (2018a) (FIN)Vyas et al. (2018a) (FIN)Vyas et al. (2018a) (FIN)Vyas et al. (2018a) (BG)Vyas et al. (2018a) (BG)Vyas et al. (2018a) (BG)Vyas et al. (2018a) (BG)Vyas et al. (2018a) (BG)Haisan et al. (2017)Haisan et al. (2017)Vyas et al. (2016) (FIN)Vyas et al. (2016) (FIN)Vyas et al. (2016) (BG)Vyas et al. (2016) (BG)Lopes et al. (2016)Romero-Perez et al. (2015)Hristov et al. (2015)Hristov et al. (2015)Hristov et al. (2015)Romero-Perez et al. (2014)Romero-Perez et al. (2014)Romero-Perez et al. (2014)Reynolds et al. (2014)Reynolds et al. (2014)Haisan et al. (2014)
BeefDairyDairyBeefBeefBeefBeefBeefBeefBeefBeefBeefBeefBeefBeefBeefBeefBeefBeefDairyDairyBeefBeefBeefBeefDairyBeefDairyDairyDairyBeefBeefBeefDairyDairyDairy
3251001001001001001001252002001501007550200150100755013268200100200100602808060403451615313527130
-28.3 [-42.3, -14.4] -9.5 [-12.6, -6.3]
-11.3 [-15.0, -7.6] -1.2 [ -2.2, -0.2] -0.7 [ -1.6, 0.3] -1.6 [ -2.7, -0.6] -3.2 [ -4.7, -1.8] -4.0 [ -5.7, -2.3]
-9.4 [-12.7, -6.0] -3.2 [ -5.1, -1.4] -3.1 [ -4.9, -1.2] -1.9 [ -3.4, -0.4] -0.7 [ -2.0, 0.5] 0.2 [ -1.1, 1.4] -3.4 [ -5.4, -1.5] -1.9 [ -3.4, -0.4] -1.0 [ -2.3, 0.3] -0.4 [ -1.7, 0.8] 0.7 [ -0.5, 2.0] -5.4 [ -7.0, -3.7] -3.7 [ -5.0, -2.5]
-8.3 [-12.1, -4.4] -1.2 [ -2.6, 0.1]
-7.4 [-10.9, -3.9] -3.3 [ -5.1, -1.4] -3.5 [ -5.3, -1.7]
-11.9 [-17.9, -5.9] -9.8 [-12.7, -6.9] -9.0 [-11.7, -6.3] -7.2 [ -9.3, -5.0] -3.2 [ -4.7, -1.7] -1.1 [ -2.1, -0.0] -0.3 [ -1.3, 0.7] -3.4 [ -5.2, -1.7] -2.3 [ -3.7, -0.8]
-9.9 [-13.2, -6.6]
Type 3NOP dose (mg/kg)Authors and Year Mean Difference [95% CI]
-20.0 -10.0 0.0 10.0
Standardized Mean Difference
Martinez-Fernandez et al. (2018)Van et al. (2019)Van et al. (2019)Kim et al. (2019)Kim et al. (2019)Kim et al. (2019)Kim et al. (2019)Vyas et al. (2018b) (FIN)Vyas et al. (2018b)Vyas et al. (2018a) (FIN)Vyas et al. (2018a) (FIN)Vyas et al. (2018a) (FIN)Vyas et al. (2018a) (FIN)Vyas et al. (2018a) (FIN)Vyas et al. (2018a) (BG)Vyas et al. (2018a) (BG)Vyas et al. (2018a) (BG)Vyas et al. (2018a) (BG)Vyas et al. (2018a) (BG)Haisan et al. (2017)Haisan et al. (2017)Vyas et al. (2016) (FIN)Vyas et al. (2016) (FIN)Vyas et al. (2016) (BG)Vyas et al. (2016) (BG)Lopes et al. (2016)Romero-Perez et al. (2015)Hristov et al. (2015)Hristov et al. (2015)Hristov et al. (2015)Romero-Perez et al. (2014)Romero-Perez et al. (2014)Romero-Perez et al. (2014)Reynolds et al. (2014)Reynolds et al. (2014)Haisan et al. (2014)
BeefDairyDairyBeefBeefBeefBeefBeefBeefBeefBeefBeefBeefBeefBeefBeefBeefBeefBeefDairyDairyBeefBeefBeefBeefDairyBeefDairyDairyDairyBeefBeefBeefDairyDairyDairy
3251001001001001001001252002001501007550200150100755013268200100200100602808060403451615313527130
-7.6 [-11.5, -3.6] -6.0 [ -8.1, -3.9] -6.6 [ -8.9, -4.3] -0.9 [ -1.8, 0.1] -0.2 [ -1.2, 0.7] -0.7 [ -1.6, 0.3] -2.0 [ -3.2, -0.9] -3.5 [ -5.1, -2.0] -6.3 [ -8.7, -3.9] -2.6 [ -4.3, -0.9] -1.9 [ -3.4, -0.4] -1.5 [ -2.9, -0.1] 0.4 [ -0.9, 1.6] 1.3 [ -0.1, 2.7] -3.0 [ -4.7, -1.2] -2.7 [ -4.5, -1.0] -2.1 [ -3.6, -0.5] -0.4 [ -1.7, 0.8] 1.0 [ -0.3, 2.3] -4.4 [ -5.8, -2.9] -2.7 [ -3.8, -1.7] -5.6 [ -8.3, -2.8] -0.6 [ -1.9, 0.7] -5.3 [ -8.0, -2.7] -1.2 [ -2.6, 0.1] -4.7 [ -6.9, -2.5]
-13.1 [-19.7, -6.5] -8.0 [-10.5, -5.6] -8.7 [-11.3, -6.1] -7.6 [ -9.8, -5.3] -4.3 [ -6.0, -2.5] -1.2 [ -2.3, -0.1] -0.6 [ -1.6, 0.4] -1.5 [ -2.8, -0.2] -1.0 [ -2.2, 0.2]
-10.7 [-14.2, -7.1]
Type 3NOP dose (mg/kg)Authors and Year Mean Difference [95% CI]

22
Figure 4. Forest plot showing 3-nitrooxypropanol (3NOP) dose (mg/kg of DM) and standardized
mean difference (mean difference is calculated as NOP treatment mean − control treatment mean)
in CH4 yield (g/kg of DMI) for beef and dairy cattle studies.
The data was checked if it fits a normal distribution function and for outliers. A quantile-quantile
plot (Q-Q plot), showed that the data was normally distributed (Figure 5), therefore, no outliers
were removed before conducting the meta-analysis.
Figure 5. A quantile-quantile plot (Q-Q plot) of the data.

23
The results of the mixed-effect models for CH4 production and yield was similar to the previous
study which indicated effectiveness of 3NOP at mitigating CH4 emissions (Table 2). As expected,
the effect was positively associated with dose, and negatively associated with dietary fiber content.
Moreover, NOP had stronger anti-methanogenic effects in dairy cattle than in beef cattle. The
mean value of NOP dose was 127 mg/kg of DM which slightly increased comparing to the 123
mg/kg of DM in previous analysis. The overall mitigating effect of 3NOP was 32% at 127 mg/kg
inclusion level. In dairy cattle specifically the impact was 41% reduction while in beef cattle it was
22.4% (Table 2).

24
Table 2. Estimates of overall 3-nitrooxypropanol (3NOP) effect size and of explanatory variables from random- and mixed-effect models
for relative mean difference (MD, %) in CH4 production (g/d) and yield (g/kg of DMI)
Variable and model
CH4 production CH4 yield Mean SE P-value τ2 Mean SE P-value τ2
Random-effect model
Overall NOP effect size -32.0 4.46 <0.001 210 -29.6 4.58 <0.001 397 Mixed-effect model, 1 explanatory variable
Overall NOP effect size -30.4 4.16 <0.001 331 -27.8 4.19 <0.001 305 NOP dose (mg/kg of DM) -0.114 0.0563 0.0996 -0.128 0.0464 0.0401
Final mixed-effect model-I
Dairy cattle -41.5 4.82 <0.001 128 -39.8 5.17 <0.001 162 Beef cattle -22.8 3.68 <0.001 -19.3 3.78 0.0020 NOP dose (mg/kg of DM) -0.260 0.0538 0.0031 -0.265 0.0618 0.0054
NDF content (g/kg of DM) 0.129 0.0282 0.0040 0.109 0.0310 0.0131
If removed the 2 studies in Kim et al. (2019), final model selection did not change Random-effect model
Overall NOP effect size -32.0 4.45 <0.001 210 -29.6 4.58 <0.001 397 Mixed-effect model, 1 explanatory variable
Overall NOP effect size -30.6 4.17 <0.001 331 -28.0 4.19 <0.001 305 NOP dose (mg/kg of DM) -0.114 0.0563 0.0998
-0.128 0.0464 0.0401 Final mixed-effect model-I
Dairy cattle -41.0 4.83 <0.001 129 -39.5 5.20 <0.001 163 Beef cattle -22.4 3.53 <0.001
-19.1 3.66 0.0018 NOP dose (mg/kg of DM) -0.258 0.0534 0.0031
-0.262 0.0613 0.0055
NDF content (g/kg of DM) 0.127 0.0294 0.0053 0.106 0.0324 0.0178

25
Nitrates
Nitrate (NO3-) is a strong inorganic anion and acts as an alternative hydrogen sink in rumen
to potentially compete with methanogens for hydrogen utilization. Dietary nitrate is firstly reduced
to nitrite (NO2-; NO3
- + H2 NO2- + H2O) and then to ammonia (NH4
+; NO2- + 3H2 + 2H+
NH4+ + 2H2O) which is energetically more favorable than the reduction of CO2 to CH4 (CO2 +
4H2 CH4 + 2H2O) due to a higher Gibbs energy change (Villar et al., 2020). Thus, nitrate
reduction is highly competitive compared with methanogenesis that leads a redirection of H flow
away from CO2 reduction, and thereby reduces enteric CH4 production (Olijhoek et al., 2016).
Several in vivo studies have investigated the effects of nitrate as a CH4 mitigation strategy
in different types of ruminants such as beef steers (Hulshof et al., 2012; Troy et al., 2015; Alemu
et al., 2019), dairy cows (Veneman et al., 2015; Klop et al., 2016; Meller et al., 2019) , sheep (Sar
et al., 2004; van Zijderveld et al., 2010,), and goats (Zhang et al., 2019). However, the results of
the trials on effectiveness of nitrate mitigation on CH4 emissions for ruminants have been
inconsistent with large variability. The studies were conducted under various dietary regimen and
nitrate doses so some of the differences may be explained by dietary or other variables. For
example, Guyader et al. (2015a) reported that CH4 yield in nitrate treatment group was reduced
22% in nonlactating Holstein cows and Lee et al. (2015) showed that CH4-mitigating effect of
nitrate for beef heifers were associated with nitrate dose, and the reduction rates varied from 3.3
to 20.8%. However, van Wyngaard et al. (2019) did not find a significant effect on mitigating CH4
emissions when dietary nitrate was fed to dairy cows grazing perennial ryegrass.
The objective of this study was to collate data on nitrate supplementation for CH4
mitigation and quantitatively evaluate the effects of dietary nitrate for enteric CH4 production and

26
yield. Nitrate dose, nutrient composition of diet, dry matter intake, and cattle type may potentially
explain a large proportion of the between-study variability in CH4 mitigation effect of nitrate (Lee
and Beauchemin, 2014; Dijkstra et al., 2018). Therefore, this study quantitatively analyzes
explanatory variables to account for the heterogeneity observed in emission reduction due to nitrate
in diet using a meta-analysis approach.
Materials and methods
Literature search was conducted using several sources including the Web of Science (Thomson
Reuters Science, New York, NY), Elsevier (Elsevier, Amsterdam, the Netherlands) and Google
Scholar online databases with all possible combinations of the keywords “feed additives”,
“nitrate”, “methane” (including all variants of “CH4” and “greenhouse gas”), “cattle” (including
all variants of “dairy”, “beef”, “steer”, “cows” and “ruminants”). The period of the study covered
from 1970 to 2019. The search resulted in 45 references related to the effects of nitrate on enteric
CH4 production in cattle. All the references were scrutinized by reading the abstracts, experimental
design, and results of each reference carefully. To be included in the database, the studies were
required to meet the following criteria: (i) a control group treatment group that did not receive
nitrate; (ii) to be conducted in vivo using cattle; (iii) reported CH4 production with standard
deviation, standard error or other relative data that can be used to calculate the standard error (e.g.
least significant difference); (iv) described other required variables (e.g. nutritional composition)
or provided enough information to estimate the variables. Of the 45 references, two were general
summary papers and three articles had only abstracts available so these were excluded from the
dataset. Three papers were removed because they investigated the mitigation effect on CH4 of a
mixture of nitrate and other feed additives. Five papers did not report CH4 emissions and another
five did not provide diets or dietary information useful in calculating them, therefore were not

27
included in the database. Data from 27 articles met the criteria, however, another three articles
were rejected because data were duplicates of references already included in the database. The
remaining 24 articles containing 57 treatment means were selected for the final database. Of those
36 treatments were related to beef cattle (Hulshof et al., 2012; Newbold et al., 2014; Lee et al.,
2015; Troy et al., 2015; Lee et al., 2017a, b; Capelari, 2018; Duthie et al., 2018; Henry et al., 2018;
Tomkins et al., 2018; Alemu et al., 2019; Granja-Salcedo et al., 2019; Rebelo et al., 2019) and 21
treatments to dairy cattle (van Zijderveld et al., 2011; Guyader et al., 2015a, b; Veneman et al.,
2015; Klop et al., 2016; van Wyngaard et al., 2018; Meller et al., 2019; van Wyngaard et al., 2019).
The primary response variables included the means of CH4 production and yield in control
and nitrate treatment groups. Factors having a potential to explain the variability in nitrate effect
on CH4 emissions were selected and considered in the meta-analysis. Methane production was
generally reported in grams per day and CH4 yield in grams per kilogram of DMI. If the values
were reported in liters or moles per day, they were converted to grams per day assuming a volume
of 22.4 L and molar weight of 16.0 g. If only one of the CH4 production and CH4 yield was given,
the other variable was calculated as CH4 yield = CH4 production/DMI.
General meta-regression methods require the independency of effect sizes (i.e., the
quantitative measure of the difference in magnitude in methane emission between control and
treatment). However, multiple nitrate treatment groups may share a same control treatment group
in some of the studies used in our database. To deal with the unknown correlations among these
non-independent effect sizes, a robust variance estimation (RVE) method (Tipton, 2015) was used
to conduct the meta-analysis. Studies selected in the meta-analysis were not identical in the
methods and sample characteristics which may introduce variance of the true effect sizes,
therefore, RVE random-effects and RVE mixed-effects models were fitted to estimate between-
28
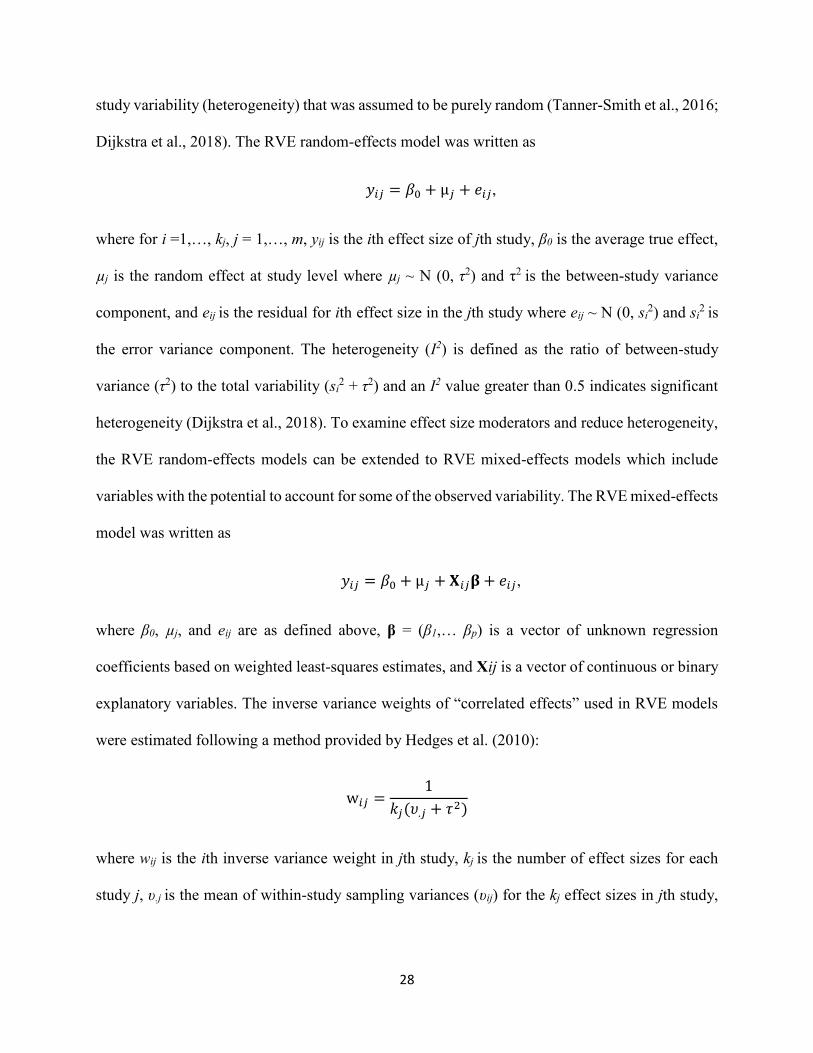
study variability (heterogeneity) that was assumed to be purely random (Tanner-Smith et al., 2016;
Dijkstra et al., 2018). The RVE random-effects model was written as
𝑦𝑖𝑗 = 𝛽0 + µ𝑗 + 𝑒𝑖𝑗,
where for i =1,…, kj, j = 1,…, m, yij is the ith effect size of jth study, β0 is the average true effect,
µj is the random effect at study level where µj ~ N (0, τ2) and τ2 is the between-study variance
component, and eij is the residual for ith effect size in the jth study where eij ~ N (0, si2) and si
2 is
the error variance component. The heterogeneity (I2) is defined as the ratio of between-study
variance (τ2) to the total variability (si2 + τ2) and an I2 value greater than 0.5 indicates significant
heterogeneity (Dijkstra et al., 2018). To examine effect size moderators and reduce heterogeneity,
the RVE random-effects models can be extended to RVE mixed-effects models which include
variables with the potential to account for some of the observed variability. The RVE mixed-effects
model was written as
𝑦𝑖𝑗 = 𝛽0 + µ𝑗 + 𝐗𝑖𝑗𝛃 + 𝑒𝑖𝑗,
where β0, µj, and eij are as defined above, β = (β1,… βp) is a vector of unknown regression
coefficients based on weighted least-squares estimates, and Xij is a vector of continuous or binary
explanatory variables. The inverse variance weights of “correlated effects” used in RVE models
were estimated following a method provided by Hedges et al. (2010):
w𝑖𝑗 =1
𝑘𝑗(𝜐.𝑗 + 𝜏2)
where wij is the ith inverse variance weight in jth study, kj is the number of effect sizes for each
study j, υ.j is the mean of within-study sampling variances (υij) for the kj effect sizes in jth study,

29
and τ2 is the between-study variance component as defined previously which describes the residual
of heterogeneity that is not explained by the involved variables.
The dry matter intake (DMI), body weight (BW), roughage proportion in the diet, dietary
crude protein (CP), and neutral detergent fiber (NDF), and nitrate dose were selected as potential
continuous explanatory variables. Types of cattle (dairy or beef) were used as category variables.
Therefore, the vector β can be explained as the differences in true effect sizes according to each
unit changing in the continuous variables or between the two cattle types. The RVE model was
first fitted with each individual variable, and two or more variables were included following a
stepwise method until all explanatory variables were involved to conduct full mixed-effect models
(Dijkstra et al., 2018). Only the variables showing significant effects (P < 0.10) were retained until
the final model was selected. Multi-collinearity was investigated to examine the correlations
among variables and highly correlated variables (|r|> 0.50) were not analyzed in the same model
such as DMI and CP (|r| = 0.59), and CP and NDF (|r| = 0.51). All explanatory variables (except
for cattle types) were first centered on their means. Potential variables such as gross energy (GE)
content, ash content, fat content, and organic matter (OM) digestibility were also considered in
data collection, however, due to the lack of information in most of the publications, they were not
included in this analysis.
To prepare for the meta-analysis, effect size estimates of mean difference (MD) and
standardized mean difference (SMD) were used to measure the continuous response variables of
CH4 production and yield. The MD was calculated as nitrate treatment mean minus control
treatment mean and each study was weighted by its corresponding sample variation (Viechtbauer,
2010). The SMD was expressed as dividing MD by the pooled standard deviation of the two group
(SMD = MD/pooled standard deviation of the 2 groups) and used to construct forest plots of
30
response variables. The relative mean difference (RMD; RMD = MD/control treatment mean ×
100%), which was a dimensionless variable, was calculated for further analyses to eliminate the
large variations and different measuring scales of DMI and CH4 production from study to study.
All statistical analyses were carried out using various packages in R (version 3.6.1, R
Foundation for Statistical Computing, Vienna, Austria). The “cor” function in R (version 3.6.1)
was used to test the correlation between explanatory variables. The “escalc” and “robu” functions
provided by “metafor” (version 2.1-0) and “robumeta” (version 2.1) packages in R were used to
calculate effect sizes (MD and SMD) and conduct RVE models, respectively.
Results and Discussion
Meta-analysis is a statistical methodology that combines quantitative findings from various studies
for the main purpose of synthesizing the evidence based on the available sources (Schwarzer et al.,
2015). The meta-analysis conducted in this paper aimed to evaluate the effects of nitrate as a feed
additive to reduce CH4 production and yield in dairy and beef cattle. A summary statistic of feed
intake, nutrient compositions of the experimental diet, nitrate supplement, and CH4 production is
given in Table 3. The daily DMI and CH4 production of dairy cows (16.2 ± 2.86 kg/d; 286 ± 52.1
kg/d, respectively) were greater than beef steers (9.5 ± 4.20 kg/d; 137 ± 47.2 kg/d), while the
averages of supplemented nitrate dose were not significantly different between dairy (18 g/kg of
DM) and beef cattle (17 g/kg of DM). On average, the effects of nitrate resulted in greater RMD
in CH4 production and yield for dairy cows (-16.7 ± 7.64%; -15.4 ± 7.66%) than those for beef
steers (-12.3 ± 10.22%; 9.0 ± 11.15%). Forest plots generated with SMD for CH4 production
(Figure 6) and CH4 yield (Figure 7) showed consistent anti-methanogenic effects in most of the
studies included in this analysis. However, effect sizes were variable across studies.

31
At an average nitrate dose of 18 g/kg of DM, the overall CH4 production (P < 0.001) and
CH4 yield (P < 0.001) were reduced by 14.4 ± 1.21% in dairy and 11.4 ± 1.40%, in beef cattle
according to the random-effect RVE models (Table 4). Several other feed additives have also
shown to reduce methane emissions but mostly at a lower effectiveness. For example, Appuhamy
et al. (2013) reported monensin reduced CH4 production by 5.6% for dairy cows and 4.6% for beef
steers. Eugène et al. (2008) investigated lipid supplementation and reported it reduced CH4
production by 9.0% in lactating dairy cows. Van Zijderveld et al. (2011) observed a 10% decrease
in CH4 emissions by supplementing mixed additives of lauric acid, myristic acid, and linseed oil
in dairy cattle. However, 3NOP showed stronger antimethanogenic effects with 39% and 22%
reduction level of CH4 production in dairy and beef cattle, respectively (Dijkstra et al., 2018).
Similarly, Roque et al. (2019a) reported Mootral reduced CH4 production 23% after 12 weeks of
supplementation in beef cattle.

32
Table 3. Summary statistics of dietary composition, feed intake, animal characteristic, and methane emission of the database.
Item Dairy Beef Mean Median SD3 Min Max Mean Median SD3 Min Max
DMI (kg/d) 16.2 17.6 2.86 10.2 19.7 9.5 8.3 4.20 6.1 22.9 Roughage proportion (% of diet DM) 61 60 10.6 50 78 62 65 21.6 10 100 NDF (g/kg of DM) 356 352 67.2 100 426 372 362 120.3 227 680 CP (g/kg of DM) 149 156 21.3 88 175 129 134 22.3 49 150 BW (kg) 466 533 187.7 117 658 430 337 147.2 283 698 Nitrate dose (g/kg DM) 18 21 4.7 5 23 17 19 5.4 5 27 CH4 production (g/d) 286 300 52.1 175 405 137 140 47.2 71 243 MD1 of CH4 production (g/d) -57 -59 26.9 -100 5 -19 -18 15.1 -43 31 RMD2 of CH4 production (% of control) -16.7 -17.0 7.64 -29.8 1.3 -12.3 -11.4 10.22 -32.0 22.0 CH4 yield (g/kg of DMI) 17.9 17.4 2.17 14.5 24.3 17.2 17.9 4.87 8.8 27.6 MD of CH4 yield (g/kg of DMI) -3.3 -3.3 1.86 -6.8 1.1 -1.7 -1.7 1.97 -5.7 3.3 RMD of CH4 yield (% of control) -15.4 -14.9 7.66 -27.6 4.7 -9.0 -9.5 11.15 -29.4 19.3 1MD (Mean difference) = treatment mean - control mean. 2RMD (Relative mean difference) = (MD/control mean) × 100%. 3SD = standard deviation of mean

33
Table 4. Estimates of overall nitrate effect from random-effect model, and of explanatory variables from mix-effect models for relative mean difference (RMD) in CH4 production (g/d) and yield (g/kg of DMI).
Variable1 and model CH4 production CH4 yield Mean SE P-value τ2 Mean SE P-value τ2
Random-effect model Overall effect size -14.4 1.21 <0.001 53.0 -11.4 1.40 <0.001 53.6
Mixed-effect model, 1 explanatory variable2 Model I: Overall effect size -14.2 1.05 <0.001 29.4 -11.5 1.30 <0.001 46.2 Nitrate dose (g/kg of DM) -0.932 0.195 <0.001 -0.776 0.235 0.004 Model II: Dairy cattle -15.4 1.71 <0.001 52.6 Beef cattle -9.03 1.90 <0.001
Mixed-effect model, 2 explanatory variables3 Model I: Dairy cattle -14.14 1.79 <0.001 29.0 -14.94 1.36 <0.001 47.7 Beef cattle -14.2 1.32 <0.001 -9.40 1.88 <0.001 Nitrate dose (g/kg of DM) -0.933 0.203 <0.001 -0.720 0.246 0.009 Model II: Dairy cattle -15.74 1.50 <0.001 54.5 Beef cattle -9.16 1.86 <0.001 NDF content (g/kg of DM) -0.0321 0.0164 0.083 Model III: Nitrate dose (g/kg of DM) -0.936 0.429 0.040 199 NDF content (g/kg of DM) -0.0366 0.0161 0.042
Final mixed-effect model Model I: Dairy cattle -14.34 1.49 <0.001 27.2 -15.24 1.05 <0.001 30.7 Beef cattle -14.0 1.35 <0.001 -9.82 1.66 <0.001 Nitrate dose (g/kg of DM) -1.01 0.232 <0.001 -0.967 0.229 <0.001 NDF content (g/kg of DM) -0.0214 0.0135 0.144 -0.0471 0.0129 0.004
1The explanatory variables centered on their means (except cattle type variable): BW = 443 kg; CP content = 137 g/kg of DM; NDF content = 366 g/kg of DM; roughage proportion = 61%; DMI = 12.0 kg/d; nitrate dose = 18 g/kg of DM. 2 Mixed-effect models with 1 explanatory variable had no significant effect on CH4 production or CH4 yield were not listed. Variables included: BW (P = 0.905), NDF (P = 0.500), CP (P = 0.407), roughage proportion (P = 0.802), DMI (P = 0.994), and cattle type (P = 0.432) for CH4 production; BW (P = 0.765), NDF (P = 0.112), CP (P = 0.537), roughage proportion (P = 0.342), and DMI (P = 0.417) for CH4 yield. 3 Mixed-effect models with 2 and more explanatory variables that had no significant effect on CH4 production or CH4 yield were not retained. 4 Cattle type effects for CH4 production were not significant (P > 0.50); for CH4 yield were significant (P < 0.05).

34
Figure 6. Forest plot showing nitrate dose (g/kg of DM) and standardized mean difference in CH4 production (g/d) and its 95% confidence interval (CI) for beef and dairy cattle from selected studies. The dotted line represents a reference of 0 standardized mean difference. The black squares represent the power of its corresponding studies (Note: A larger box indicates a greater sample size and a smaller CI).

35
Figure 7. Forest plot showing nitrate dose (g/kg of DM) and standardized mean difference in CH4 yield (g/kg of DMI) and its 95% confidence interval (CI) for beef and dairy cattle from selected studies. The dotted line represents a reference of 0 standardized mean difference. The black squares represent the power of its corresponding studies (Note: A larger box indicates a greater sample size and a smaller CI).

36
The RVE random-effect models showed that a large proportion of the total variability of
nitrate effects on CH4 production (I2 = 69.9%) and CH4 yield (I2 = 99.7%) were attributed to
heterogeneity. Potential explanatory variables were individually included to conduct mixed-effect
RVE models to further understanding and improve the random-effect models (Table 4). The size
of CH4 production reduction was positively associated with nitrate dose (P < 0.001). A 10 g/kg of
DM increase in nitrate dose from its mean (18 g/kg of DM), enhanced the nitrate anti-
methanogenic effect of CH4 production by 9.32 ± 1.95%. However, for RMD in CH4 production,
the categorical variable cattle type (P = 0.432), and continuous variables BW (P = 0.905), NDF
content (P = 0.500), CP content (P = 0.407), roughage proportion of diet (P = 0.802), and DMI (P
= 0.994) were not significant. For RMD in CH4 yield, BW (P = 0.765), NDF content (P = 0.112),
CP content (P = 0.537), roughage proportion of diet (P = 0.342), and DMI (P = 0.417) were not
significant. But, the categorical variable cattle type (P = 0.017) and nitrate dose (P = 0.004) were
significant. A 10 g/kg of DM increase in nitrate dose from its mean (18 g/kg of DM) resulted in
7.76 ± 2.35% decline in CH4 yield (Table 4, Model I). A 10 g/kg of DM increasing in nitrate dose
from its mean (18 g/kg of DM) resulted in 7.76 ± 2.35% decline of CH4 yield (Model I). The results
agree with Lee and Beauchemin (2014) in which they reported a linear reduction in CH4 yield with
increasing levels of nitrate dose. Nitrate mitigation effect on CH4 yield in dairy and beef cattle
were -15.4 ± 1.71% and -9.03 ± 1.90%, respectively, that were significantly different from each
other according to Model II (Table 4). This indicates that nitrate shows a stronger impact on
mitigating CH4 yield for dairy cattle, and a higher nitrate dose is required for beef cattle to obtain
the same effectiveness at reducing CH4 yield compared that for dairy cattle. The heterogeneity was
reduced by including the individual explanatory variable for both CH4 production (τ2 = 53.0 vs.
29.4) and CH4 yield (τ2 = 53.6 vs. 46.2 for Model I or 52.6 for Model II).
37
Adjusting the RVE mixed-effect model to use two explanatory variables, cattle type (P <
0.001) and nitrate dose (P < 0.001; P = 0.009) were significantly associated with nitrate effect on
CH4 production and yield (Model I). A 10 g/kg of DM increase in nitrate dose enhanced the nitrate
effect on CH4 production by 9.33 ± 2.03% from the average of 14.1 ± 1.79% for dairy cows, and
14.2 ± 1.32% for beef steers. Similar increase in nitrate dose enhanced the nitrate effect on CH4
yield by 7.20 ± 2.46% from the average of 14.9 ± 1.36% for dairy cows, and 9.40 ± 1.88% for beef
steers. The mixed-effect model conducted with cattle type and nitrate dose slightly reduced the
heterogeneity for CH4 production (τ2 = 29.4 vs. 29.0), however, the heterogeneity for CH4 yield
was not improved by the model (τ2 = 46.2 vs. 47.7). When the model was adjusted for NDF content
instead of nitrate dose (Model II), CH4 yield tended to decline (P = 0.083) by 0.321 ± 0.164% for
every 10 g/kg of DM increase in NDF content from the average in dairy (-15.7 ± 1.50%) and beef
(-9.16 ± 1.86%) cattle. Although, nitrate dose (P = 0.040) and NDF content (P = 0.041) were
significantly related to nitrate effect on CH4 yield in Model III, the heterogeneity jumped from
47.7 (Model I) or 54.5 (Model II) to 199 (Model III) indicating the importance of including cattle
type in the model.
The final mixed-effect models for RMD in CH4 emissions (Table 4) included cattle type,
nitrate dose and dietary NDF content. The τ2 decreased from the random-effect model to a mixed-
effect model with 1 and 2 explanatory variables, and further decreased to the final mixed-effect
model with 3 explanatory variables (CH4 production: τ2 = 27.2 vs. 53.0; CH4 yield: τ2 = 30.7 vs.
53.6) but not with 2 explanatory variables for CH4 yield (Table 4). When adjusted for the effects
of nitrate dose and dietary NDF content, the anti-methanogenic effect of nitrate was similar in beef
cattle (-14.0 ± 1.35%; P <0.001) compared to dairy cattle (−14.3 ± 1.49%; P <0.001) for CH4
production. However, for CH4 yield, with nitrate dose centered on its mean (18 g/kg of DM), and

38
the mean NDF content of 366 g/kg of DM, the anti-methanogenic effect of nitrate was stronger in
dairy cows (-15.2 ± 1.50%; P <0.001) compared to beef cattle (-9.82 ± 1.66%; P <0.001). The
greater efficacy in dairy cattle may be related to the differences in the levels of feed intake (dairy:
16.2 kg/d, beef: 9.5 kg/d; Table 3. A similar difference in cattle type on efficacy of 3NOP was
reported (Djikstra et al., 2018). The authors suggested that higher feed intake levels increase rumen
concentrations of fermentation products, including volatile fatty acids and hydrogen and sinks of
hydrogen in the rumen may be affected by hydrogen partial pressure. This will likely result in
greater alternative hydrogen sinks for rumen methanogenesis. The efficacy of nitrate-N utilization
may be improved, and the potential of nitrate inhibitory effect is enhanced through more completed
nitrate reductions. After adjusting for cattle type and dietary NDF content in final mixed-effect
models, the nitrate-induced CH4 mitigation was 10.1 ± 2.32% (CH4 production, P < 0.001) and
9.67 ± 2.29% (CH4 yield, P < 0.001) per 10 g/kg of DM increase in nitrate dose from its mean (18
g/kg of DM; Table 4), which is slightly higher than the effect of nitrate dose observed in the
individual and two explanatory variables mixed-effect models. In our analysis, an increase in
dietary NDF content did not significantly affect the efficacy of nitrate in reducing CH4 production
(P = 0.144) but slightly increased (P = 0.004) the nitrate effect on CH4 yield (Table 4). A 10 g/kg
of DM increase in dietary NDF content from its mean (366 g/kg of DM) increased the nitrate effect
on CH4 yield by only 0.471 ± 0.129%.

39
ADDITIVES TARGETING MANURE METHANE EMISSIONS
Direct emissions of CH4 and N2O from livestock manure vary by manure treatment and storage
methods. Both CH4 and N2O emissions can be mitigated either by reducing them during manure
storage or maximizing CH4 production and capturing the gas to produce biogas energy (USEPA,
2017). The greenhouse gas and odor emitted from manure and slurry could be directly or indirectly
reduced through different technologies such as solids separation (Martinez et al., 2003; Owusu-
Twum et al., 2017), dietary management strategies (Hristov et al., 2013; Lund et al., 2014; Troy
et al., 2015), anaerobic digestion (Clemens et al., 2006), manure coverage (Misselbrook et al.,
2016), and use of manure additives (Chen et al., 2018; Mao et al., 2018; Owusu-Twum et al., 2017;
Wheeler et al., 2010; Yamulki, 2006).
Manure additives or amendments can be defined as substances that can be used to alleviate
gaseous emissions associated with livestock manure handling and management. The application
of manure additives is regarded as a practical and economical treatment method compared to
alternative technology such as solids separation and biogas production (McCrory and Hobbs,
2001). Various types of additives have been applied on-farm and are reported in the literature over
the last few decades, however, the effectiveness and performance for mitigating gas emissions of
specific additives are not consistent, especially for the effects on CH4 emissions. For example, Liu
et al. (2017) and Vandecasteele et al. (2016) investigated the use of biochar and reported that it
enhanced the organic matter degradation and reduced CH4 emissions, however, Sanchez-Garcia et
al. (2015) reported that there was no significant evidence showing the relevant impact of biochar
on CH4 emissions. A meta-analysis synthesizes the evidence from many available sources and
combines and compares the treatment effects of individual studies by statistical methods (Dijkstra
et al., 2018). The objective of this review was to investigate and quantitatively evaluate the effects

40
of different types of manure additives on mitigating CH4 emissions in livestock based on published
literature data.
Data collection and selection
The main purposes for adding manure additives include directly reducing gas emission during
storage and composting, and enhancing the gas emission to generate biogas. Literature searches of
the Web of Science (Thomson Reuters Science, New York, NY) and Google Scholar online
databases were conducted using the combination of search terms “manure additives”, “methane”
or “CH4”, “greenhouse gas”, “reduce” or “reduction”, “mitigate” or “mitigation”, “amend” or
“amendment”. The covered period was from 2000 to 2019. A total of 42 papers were collected
after the initial searching. All the references were carefully scrutinized by reading the abstracts,
experimental design, and results. For inclusion in the database, the studies were required to
include: (i) a control group, (ii) the CH4 emissions reported with mean, standard deviation or
standard error, and sample size and (iii) at least one type of additive was added directly into the
manure for CH4 emission reduction purposes. Studies related to increasing biogas generation by
adding manure additives were not included because the objective of the manure additives was not
to reduce emissions. There were 27 references remaining in the database after filtering by the
criteria mentioned above. The manure additives were firstly categorized into general groups based
on their function which were “acidification”, “adsorbent”, “biochar”, “biological material”, “C/N
content”, “disinfection”, “essential oils”, “humate”, “microbial digestion”, “oxidizing agent”,
“physical material”, “straw”, and for those that did not fit the above categories were put into “other
chemicals” (Agyarko-Mintah et al., 2017; Berg et al., 2006; Chen et al., 2018; Chen et al., 2017;
Chowdhury et al., 2014a; Chowdhury et al., 2014b; Hao et al., 2005; He et al., 2019; Jia et al.,
2016; Liu et al., 2017; Luo et al., 2013; Mao et al., 2018; Martinez et al., 2003; Misselbrook et al.,

41
2016; Owusu-Twum et al., 2017; Petersen et al., 2012; Regueiro et al., 2016; Samer et al., 2014;
Shah & Kolar, 2012; Sommer & Moller, 2000; Sonoki et al., 2011; Vandecasteele et al., 2016;
Wang et al., 2014; Wang et al., 2018; Wheeler et al., 2010; Yamulki, 2006; Zhang et al., 2017). A
full list of studies investigated is given in Appendix 2. Statistical analysis and meta-analysis were
both conducted based on the first level of classification due to the insufficient database for each
type of second classified level. The manure came from various species of animals and were not
sorted by species to obtain enough sample sizes for different manure additives.
Statistical analysis
All statistical analyses were conducted using R statistical software (version 3.1.1, R Foundation
for Statistical Computing, Vienna, Austria). A statistical summary of the whole dataset was
conducted based on the calculated CH4 reduction rate using the dplyr package in R. Each of the
manure additive groups were subjected to significance test (α = 0.05) to determine if they were
effective in reducing manure CH4 emissions. The manure additives that significantly reduce
emissions were then included in further meta-analysis.
The response variable was the mean CH4 production. However, different papers reported
the CH4 production in various units and different scales, such as, “g/m2 per d”, “g/m3”, “g/d”,
“g/kg total solid”, and “g/t fresh weight”. The CH4 emissions were recorded either as daily average
or in cumulative total through the experimental period. To make the emission data comparable and
eliminate bias caused by different units, CH4 emission reduction rate or relative mean difference
(Eq. 1) was calculated. The relative mean difference (MD) was calculated as follows:
Relative MD=(Treatment mean-Control mean)/(Control mean)% (1)

42
The meta-analytical metric included the data of study information, and sample sizes, means
of CH4 emission, standard deviations of treatment group and control group. Due to differences in
units of measurements, the standardized mean difference, which is a dimensionless effect measure
was calculated (Eq. 2) using the meta package in R statistical software. The default version of
standardized mean difference in meta package is Hedges’s (g) mean difference which is based on
the pooled sample variance and a correction factor for bias (Schwarzer et al., 2015).
𝑆𝑀𝐷 = (1 −3
4𝑛−9)
𝑀𝐷
𝑆𝐷𝑝𝑜𝑜𝑙 (2)
where MD is the mean difference, SDpool is the pooled standard deviation, and n is the total
sample size of treatment and control on which SDpool is based.
Model fitting
Each group of manure additives described above may contain several different chemicals
with similar function (Appendix 2). Therefore, a random-effect model that allows the variance of
true effect sizes within each subgroup was used. The random-effect model was fitted to estimate
the variance of the distribution of true effect sizes—between-study variance (τ2) and heterogeneity
(I2) using the following equation:
𝑌𝑖 = µ + 𝜁𝑖 + 𝜀𝑖 (3)
where Yi is observed effect, µ is true effect size, ζi is true variation in effect sizes, and εi is sampling
error. The between-study random effect term ζi has the expression of between-study variance Var
(ζi) = τ2 and the sampling error term εi has the expression of sample variance Var (εi) = si2. The
heterogeneity (I2) is determined as τ2 divided by the sum of sample variance and between-study

43
variance (si2 + τ2) and the I2 greater than 0.5 indicates significant heterogeneity in general (Dijkstra
et al., 2018).
The between-study variability can be modeled either using separate estimates of τ2 for
different subgroups, or a pooled estimate of τ2 for all subgroups. If the true value of τ2 varies from
one subgroup to another, which is the most likely situation in this analysis, a random-effect model
with separate estimates of τ2 of subgroups should be selected (Borenstein et al., 2011). However,
since there was only a few effective studies within some of the subgroups, the separate estimates
of τ2 may be imprecise and the pooled τ2 is preferable under this situation (Borenstein et al., 2011).
Effect sizes of manure additives
Meta-analyses aim to synthesize evidence from many possible sources, by comparing and
combining findings from several studies using statistical methods (Madden and Paul, 2011). The
meta-analysis in this review summarizes the effects of manure additives and their potential to
reduce CH4 production in relative terms. Using manure additives to mitigate CH4 emissions during
manure storage has not been as widely applied compared to feed additives, therefore, the number
of publications that report on manure additives to control CH4 emission is much smaller. To
increase the sample size for meta-analysis, the manure additives had to be classified into several
categories based on their function as mentioned above.
The relative MD of CH4 emission (%) for each manure additive treatment and the means
and standard deviation of CH4 reduction rates for each type of manure additives were analyzed.
The significance test based on grouped manure additives and corresponding P-values are listed in
Table 5. A summarized box-plot of CH4 reduction rate for different manure additives is given in
Figure 8.

44
The number of treatments varied considerably for different types of manure additives.
Some of the groups such as humate, physical agent, straw and other chemicals contained less than
5 studies each, while acidification and biochar contained over 20 treatments each. Acidification of
livestock slurry is considered when the manure additive contains acidic materials that are added to
the manure during the storage to lower the pH and inhibit gaseous emissions, including CH4. It
contained different types of acidic component such as aluminum sulfate, sulfuric acid, food
industrial waste, phosphogypsum, wood vinegar, etc. The effect of acidification on mitigating NH3
emission has been widely investigated, and several of the recent observations indicated that CH4
emissions were also reduced by manure acidification (e.g., Misselbrook et al., 2016; Petersen et
al., 2012; Wang et al., 2014). Acidification was the most frequently studied manure additive in our
database. Biochar is produced from the thermal decomposition of biomass and it has been applied
as manure additive to livestock manure for CH4 mitigation (Godlewska et al., 2017). Biochar is a
cost-effective material with many benefits on manure composting such as enhancing the
composting process, improving transformation of nutrient, and reducing the GHG and NH3
emissions (Mao et al., 2018). In recent years, several types of biochar (cornstalk, bamboo, woody,
layer manure, charcoal, holm oak, poultry litter, rice hull, coir and greenwaste biochars) and their
effect on gas emissions have been investigated (Agyarko-Mintah et al., 2017; Chen et al., 2017;
Chowdhury et al., 2014b; He et al., 2019; Jia et al., 2016; Sanchez-Garcia et al., 2015). A total of
24 valid studies of biochar manure additives were involved in the analysis of CH4 reduction rate.
Not all manure additives had positive effects on mitigating CH4 emissions (Figure 8). The
relative MD for C/N content, disinfection, masking agent, and oxidizing agent were all greater
than zero which indicated the CH4 emissions of those manure additives treatment groups had
increased compared to their control groups even though the increases were not statistically

45
significant (P > 0.05) (Table 5). Moreover, the standard deviations of their means were relatively
high indicating large variations in mitigation potential of the manure additives. These groups of
manure additives were excluded in further analysis.
All other manure additives showed mitigating effects with negative means of CH4
reduction rate (relative MD). Particularly, the reduction rates of biological mixer, physical agent,
straw, and other chemicals for all included studies were less than zero (Max ≤ 0). However, the
database contained small sample sizes compared with other categories (N = 3, 3, 4, 2, respectively)
(Table 5). The manure additive categories of acidification, biochar, microbial digestion, physical
agent, straw, and other chemicals significantly lowered CH4 reduction rates (P < 0.05) and only
these manure additives were selected and investigated in the meta-analysis in the next step. There
were 6 references containing a total of 18 studies for the 3 manure additives (acidification, biochar
and straw) to evaluate the CH4 emission effect. The studies involved various animal species
including swine, poultry, and cattle. The CH4 emissions reported were either in cumulative or
average values during the experimental period with different units. Since the data for each species
and manure additives was limited, the species were not evaluated as an effect factor in meta-
analysis.

46
Table 5. Summary statistics of CH4 reduction rate for different types of manure additives.
Type of Manure Additives Na Meanb SD Min Max Pc
Acidification 37 -58.9% 30.8% -98.1% 12.5% <0.001 Adsorbent 8 -8.8% 15.8% -34.4% 14.3% 0.160 Biochar 24 -41.3% 51.6% -85.0% 169.8% <0.001 Biological mixer 3 -21.5% 37.3% -64.6% 0.0% 0.423 C/N content 7 32.6% 149.6% -50.2% 370.0% 0.585 Disinfection 6 124.0% 135.6% -5.3% 328.6% 0.075 Masking agent 12 221.2% 405.7% -12.9% 1360.0% 0.086 Humate 3 -8.4% 26.1% -34.0% 18.2% 0.635 Microbial digestive 12 -33.3% 36.5% -100.0% 10.5% 0.009 Oxidizing agent 14 60.8% 150.0% -33.3% 542.9% 0.153 Physical agent 3 -35.6% 9.8% -46.3% -27.0% 0.024 Straw 4 -60.1% 26.7% -100.0% -45.0% 0.020 Other chemicals 2 -50.0% 5.4% -53.8% -46.2% 0.049 aN is number of treatments used for the analyses bMean is the mean reduction rate of CH4 c P-value with α = 0.05

47
Figure 8. Box-plot of CH4 reduction rate for different types of manure additives.

48
Effects of manure additives from random-effects models
The assumption of random-effects model for meta-analyses is that the true effects among all the
population of studies are normally distributed and the null hypothesis is that the mean of all
relevant true effects is zero (Borenstein et al., 2011). The CH4 emissions from the 18 studies were
significantly reduced by 66.3% on average (Table 6) which were consistent with the SMD from
random-effects meta-analysis (P = 0.028). This overall effect indicated that the CH4 emissions
from manure storage could be mitigated by biochar, acidification, and straw. Moreover, the effect
of each subgroup manure additives on mitigating CH4 emissions was also significant with the
average reduction rates of 82.4%, 78.1%, and 47.7%, respectively (P < 0.05). The most effective
manure additive was biochar followed by acidification and straw according to relative MD
analysis. Biochar as a manure additive also showed the greatest effect (SMD = -2.72), followed
by straw (SMD = -1.86) and acidification (SMD = -1.31) based on the SMD of random-effects
model. The SMD estimates with 95% CI according to each subgroup effects is presented using
forest plot (Figure 9). The total observations of acidification subgroup were much larger compared
to the other additives. The 95% CI of manure additives effects in acidification subgroup were all
positive, however, the SMDs of studies from Regueiro et al. (2016) and Samer et al. (2014) varied
considerably between -0.6 and -37.0. The total weights of acidification subgroup accounted for
over 60% among all manure additives in the overall effect estimates, while the biochar and straw
subgroups accounted for 28% and 11.9%, respectively (Table 5). This unbalanced distribution of
studies’ weight in the overall effect size might generate bias among different manure additives.
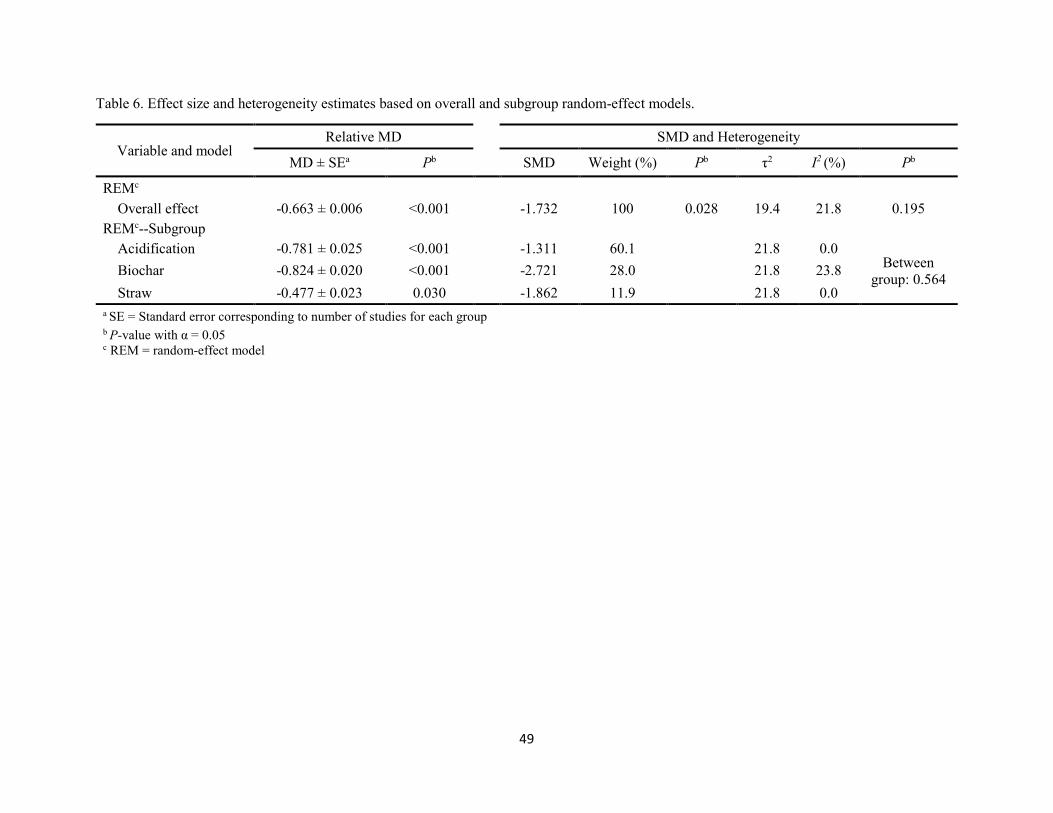
49
Table 6. Effect size and heterogeneity estimates based on overall and subgroup random-effect models.
Variable and model Relative MD SMD and Heterogeneity
MD ± SEa Pb SMD Weight (%) Pb τ2 I2 (%) Pb
REMc
Overall effect -0.663 ± 0.006 <0.001 -1.732 100 0.028 19.4 21.8 0.195 REMc--Subgroup
Acidification -0.781 ± 0.025 <0.001 -1.311 60.1 21.8 0.0 Between
group: 0.564 Biochar -0.824 ± 0.020 <0.001 -2.721 28.0 21.8 23.8 Straw -0.477 ± 0.023 0.030 -1.862 11.9 21.8 0.0
a SE = Standard error corresponding to number of studies for each group b P-value with α = 0.05 c REM = random-effect model

50
Figure 9. Forest plot showing standardized mean difference, and 95% confidence interval for three selected manure additives.
Heterogeneity test
The heterogeneity of the overall random-effects model was quantified using τ2 and I2. The effects
of manure additives were associated with non-significant heterogeneity across all the three manure
additives with only 21.8% of the total variability of the effect of manure additives in mitigating
CH4 was due to heterogeneity. As mentioned in model fitting section, a pooled τ2 is a more precise
method to conduct the random-effects model because the sample size of useful studies for manure

51
additives was small. Therefore, the three subgroups shared the same τ2 (21.8; Table 6). The
between-study variability was not significant among the three manure additives (P = 0.564) and
for the subgroups test, the heterogeneity of acidification and straw subgroups were both zero,
which suggested little heterogeneity. The effects of biochar were associated with 23.8% of
heterogeneity, however, this variability due to the heterogeneity was not significant (P = 0.26;
Figure 9). Therefore, the heterogeneity test indicated the random-effects model was appropriate to
use to quantify effect of manure additives CH4 reduction. Mitigating CH4 emissions by applying
certain manure additives was an effective method but depends on the type of additives.
Analysis of manure type, additive type, and characteristic of treatment manure
The composting manure from livestock were categorized into manure type (cattle, poultry, swine,
mixture of different manure types) and manure additives described in Table 7 and their
characteristics of composting manure including pH, C/N ratio, and moisture content were
generally analyzed. The initial means of pH (7.2-7.9), C/N ratio (11-18), and moisture content
(58.0-75.5) for different manure types not varied in large ranges, however, the differences of means
between additive types were visible. Most of the raw manure were weakly alkaline, but the
averaged pH for manure composting with acidic additives (6.2 ± 1.33) was lower than other types
due to the reaction of acidification. The mean of C/N ratio for biochar was relatively greater (23.6
± 9.17) because most of the biochar contained and was made by high carbon materials such as
bamboo biochar, charcoal, and cornstalk (Chowdhury et al., 2013; Chen et al., 2017; Liu et al.,
2017). The highest mean C/N ratio was observed in cattle manure, and the lowest was in poultry
manure, with the moderate one in swine manure which associated with the N content in the raw
material. These findings showed consistency with Cao et al. (2019). Moisture content usually
associated with the porosity of the material and Richard et al. (2002) indicated that moisture

52
content for an optimum performance of composting process may vary widely between 50 to over
70% based on different raw material and composted times. All of the averaged moisture contents
for different manure types and additive types were within the range of 50-75%, except for the
adsorbent and biological.
A general linear regression analysis for CH4 mitigating rate [(CH4 emission in treatment
group – control group)/control group] response to pH, C/N ratio, moisture content, manure type
(cattle, poultry, and swine), and additive type (acidification, biochar, biological, physical, and C/N
content) were conducted (Table 8) with a partial data from Appendix 2 which included 11 articles
with 37 studies that contained completing information of all variables and CH4 emissions (Hao et
al., 2005; Yamulki, 2006; Chowdhury et al., 2013; Luo et al., 2013; Samer et al., 2014;
Vandecasteele et al., 2016; Agyarko-Mintah et al., 2017; Chen et al., 2017; Liu et al., 2017;
Owusu-Twum et al., 2017; Zhang et al., 2017). Moisture content significantly related to the CH4
mitigation rate, and higher moisture content enhanced the overall reduction of CH4 emissions (P
= 0.01), however, the CH4 reduction rate was not significant affected by pH (P = 0.731) and C/N
(P = 0.218) in a linear manner (need to find a reasonable explanation). Manure types (P > 0.531)
did not make significant impacts on CH4 mitigation from composting process, however, some
additives types showed significant differences from others, such as acidification vs. biological (P
= 0.001), acidification vs. physical (P = 0.017), and biochar vs. biological (P = 0.013).
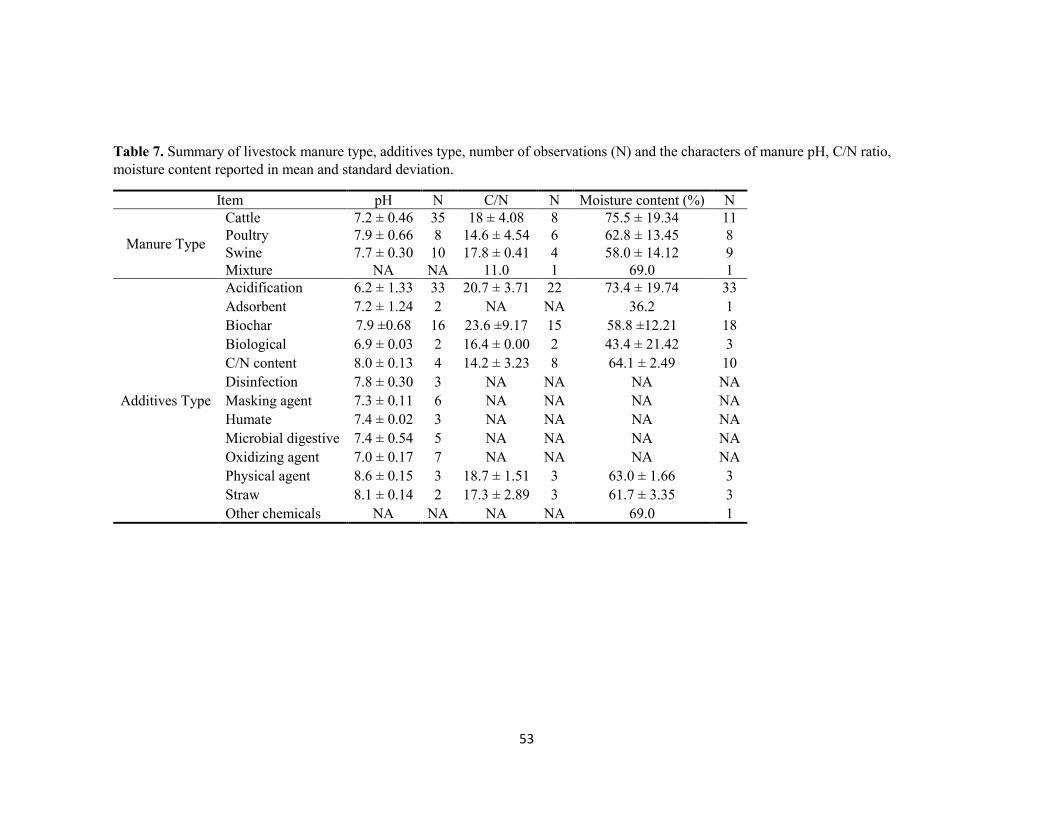
53
Table 7. Summary of livestock manure type, additives type, number of observations (N) and the characters of manure pH, C/N ratio, moisture content reported in mean and standard deviation.
Item pH N C/N N Moisture content (%) N
Manure Type
Cattle 7.2 ± 0.46 35 18 ± 4.08 8 75.5 ± 19.34 11 Poultry 7.9 ± 0.66 8 14.6 ± 4.54 6 62.8 ± 13.45 8 Swine 7.7 ± 0.30 10 17.8 ± 0.41 4 58.0 ± 14.12 9 Mixture NA NA 11.0 1 69.0 1
Additives Type
Acidification 6.2 ± 1.33 33 20.7 ± 3.71 22 73.4 ± 19.74 33 Adsorbent 7.2 ± 1.24 2 NA NA 36.2 1 Biochar 7.9 ±0.68 16 23.6 ±9.17 15 58.8 ±12.21 18 Biological 6.9 ± 0.03 2 16.4 ± 0.00 2 43.4 ± 21.42 3 C/N content 8.0 ± 0.13 4 14.2 ± 3.23 8 64.1 ± 2.49 10 Disinfection 7.8 ± 0.30 3 NA NA NA NA Masking agent 7.3 ± 0.11 6 NA NA NA NA Humate 7.4 ± 0.02 3 NA NA NA NA Microbial digestive 7.4 ± 0.54 5 NA NA NA NA Oxidizing agent 7.0 ± 0.17 7 NA NA NA NA Physical agent 8.6 ± 0.15 3 18.7 ± 1.51 3 63.0 ± 1.66 3 Straw 8.1 ± 0.14 2 17.3 ± 2.89 3 61.7 ± 3.35 3 Other chemicals NA NA NA NA 69.0 1

54
Table 8. Linear regression analysis of response CH4 mitigation rate vs. pH, C/N content, and moisture content.
Factor1 Mean2 SE3 P-value
CH4 mitigation rate (%) -32.2 46.77 0.496 pH 1.46 4.201 0.731 C/N 0.945 0.7516 0.218 Moisture content (%) -0.802 0.2916 0.010 1Manure type: P > 0.531; Additive type: acidification vs. biochar P = 0.055, acidification vs. biological P = 0.001, acidification vs. physical P = 0.017; biochar vs. biological P = 0.013; biological vs. C/N content P = 0.064; all others P > 0.100. 2Mean of n = 37. 3SE = standard error.
Conclusions
Studies investigating manure additives for reducing CH4 emission during storage and composting
are scarce. Manure additives that include acidification, biochar, microbial digestion, physical
agent, straw, and other chemicals significantly reduced CH4 emissions from manure. In general,
higher moisture contents in raw composting manure could enhance the CH4 mitigation rates,
however, the pH, and C/N content were not linearly related to CH4 mitigation. Adding biochar,
acids, and straw to manure could mitigate CH4 emissions by 82.4%, 78.1%, and 47.7%,
respectively. However, the data for straw is quite small so it should not be taken out of context as
it may introduce a source of carbon into lagoons. The meta-analysis conducted with selected
additives indicated manure additives were an effective method to reduce CH4 emission, with
biochar being the most effective. However, further studies of manure additives on CH4 mitigation
are required to support a more accurate quantitative analysis and potential impacts to water quality
and crop yield after land application. Most of the research for biochar and straw is when used as
additive to solid or semi solid manure so they should be interpreted in that context.
55
NET REDUCTIONS IN GREENHOUSE GASES FROM FEED ADDITIVES IN
CALIFORNIA
A review of feed additives that can potentially be used in California revealed that 3NOP and nitrate
may have the potential to be used as there is enough evidence of their effectiveness. Several other
additives including Mootral, macroalgae and Agolin also have the potential but further studies are
required to determine levels of effectiveness, safety and adequate sourcing. There was only one
publication dealing with Mootral in California. Therefore, this section aims to estimate the net
GHG emissions in California dairy system based on supplementation of 3NOP and nitrate to the
basal diet. The following narrative will be submitted for publication to California Agriculture.
Materials and methods
The study was based on a life cycle assessment (LCA) conducted for the dairy industry in
California (Naranjo et al., 2020). The feed ingredients used by Naranjo et al. (2020) were adjusted
and recalculated using NRC (2001). The impact of producing the feed additives 3NOP and nitrate
was integrated in the LCA model. Energy corrected milk (ECM) was used as the functional unit
and all emissions were calculated and standardized to 1 kg of ECM.
The milk production supply chain in California from cradle to farm gate was considered
the system boundary of the LCA including production of the feed additives. Specifically, these
include: crop production, feed additives production, farm management, enteric methane, and
manure storage. The system boundary considered emissions associated with on-farm activities,
pre-farm production, and transportation of major productions up to the animal farm gate.
Emissions for further activities after the products left the farm gate were not accounted in the
system because they were considered to be treated in the same way for all scenarios.

56
Mitigation scenarios
Data sources collected from USDA National Agricultural Statistical Service (USDA-NASS) and
Economic Research Service (USDA-ERS), California Department of Food and Agriculture
(CDFA), peer-reviewed literature and other published resources, and databases generated from
GaBi 6 software were summarized and used based on the priority of data accuracy (Naranjo et al.,
2020). The GHG emissions from each process in the LCA were estimated based on the average
conditions (Model 2) for dairy cattle in California as described by Naranjo et al. (2020).
The control scenario used representative diets for the California dairy cows collected from
the reports by CDFA. Averaged data from 2013 to 2015 represented the diets for year 2014 in the
current analysis. Within each reference year, the diets for dairy cows at different growth stages
including calf up to 1 year, heifer, pregnant heifer, close-up heifer, high lactating cow, and dry
cow were weighted based on a whole production cycle. We assume 4 lactations to be the average
life span of a California dairy cow. The crop production for control scenario included the activities
related to producing feed, and use of land, water, fertilizers, pesticides and herbicides.
Additionally, energy used for machine operation, irrigation, and transportation was included. Data
from USDA-NASS Quick Stats (USDA–NASS, 2017), USDA farm and ranch irrigation reports
(USDA 2013), California specific agricultural reports (Burt et al., 2003; Johnson and Cody, 2015),
USDA-ERS reports (USDA–ERS, 2011), University of California crop cost and return studies
(UC Agricultural Issues Center, 2016), and values published in literatures (Liedke and Deimling,
2015) were used to estimate the emissions during the crop production. Enteric CH4 emissions,
farm management, energy and water used for producing crop, feeding cattle, cooling livestock
facilities, animals, and milk, sanitation, cleaning, and dealing with onsite waste were according to

57
Naranjo et al. (2020). Similarly, manure methane and nitrous oxide (N2O) emissions were based
on methodology described by Naranjo et al. (2020).
Two scenarios were developed to estimate net mitigation effect of supplementing 3NOP to
typical dairy diet in California. In scenario 1, all dairy cows were simulated to consume a diet that
contains 3NOP only during lactation. In scenario 2, 3NOP was supplemented to the diet at all
growing stages within a life cycle. The basal diets were same as in the control scenario and 3NOP
was supplemented at a rate of 127 mg/kg DM in both scenarios.
Nitrate as a non-protein nitrogen source for cattle is usually used to replace other non-
protein N sources such as urea (Velazco et al., 2014; Rebelo et al., 2019). Urea is not typically
used as a nitrogen source in California representative diets, so nitrate was simulated to partially
replace dietary true protein in diets to keep similar N supply for all nitrate scenarios. In nitrate
scenario 1, all dairy cows were simulated to consume a diet that contained nitrate only during
lactation. Nitrate was supplemented to dairy cows at all stages in nitrate scenarios 2 and 3. In
nitrate scenario 2, high protein meal (e.g. corn gluten, soybean meal, and DDGS) was replaced by
dietary nitrate on an equivalent N basis with no adjustment for DMI. In nitrate scenario 3, DMI
was adjusted using low protein meal (e.g. corn grain, and wheat silage) to the control levels after
replacing high protein meal with nitrate additives. Nitrate was supplemented to dairy cattle at a
rate of 17.7 g/kg of DM for all the 3 nitrate treatment scenarios.
Emission associated with production and use of additives
3-Nitrooxypropanol
The carbon footprint of emissions associated with 3NOP production were assumed to be 52 kg
CO2e/kg 3NOP produced (DSM Nutritional Products, Ltd., pers. comm.). Moreover, with the

58
improvement of process optimization, the carbon footprint of 3NOP could drop to 35 kg CO2e/kg
3NOP (DSM Nutritional Products, Ltd., pers. comm.). The total GHG emissions from 3NOP
production were estimated using both of the factors and the results were reported as mean with
standard error to evaluate the effect of 3NOP emissions factors on total emissions. The
transportation of 3NOP was calculated based on shipping from the producer (DSM Nutritional
Products, Ltd., registered in Ontario, CA) to dairy farms in California by truck. The average
distance used to estimate the emissions related to 3NOP transportation was weighted according to
the milk production amount in California counties in 2014 (CDFA, 2014).
The magnitude of enteric CH4 emission reduction as a result of supplementing 3NOP was
calculated based on an updated version of a meta-analysis conducted by Dijkstra et al. (2018) on
the anti-methanogenic effects of 3NOP. Four more recent references related to 3NOP effect on
CH4 emissions were added to the previous analysis to extend the accuracy and robustness of the
meta-analytical model. The updated database included treatment means from Martinez-Fernandez
et al. (2018) (beef; 1 treatment), Vyas et al. (2018) (beef; 2 treatments), Kim et al. (2019) (beef; 4
treatments), and van Wesemael et al. (2019) (dairy; 2 treatments). The final mixed-effect models
for CH4 production in the updated meta-analysis indicated effectiveness of 3NOP at mitigating
CH4 production was positively associated with 3NOP dose, and negatively associated with NDF
content. Similar to the previous study, supplementation of 3NOP had stronger anti-methanogenic
effects in dairy cows compared to beef cattle, at a slightly greater magnitude of mitigation. The
following equations were used to calculate the mitigation effect of 3NOP that includes dose, NDF
content and either dairy (Equation 1) or beef (Equation 2):
Enteric methane reduction rate (%) = − 41.5 – (0.260 × 3NOP dose) + (0.129 × NDF content)
Equation 1

59
Enteric methane reduction rate (%) = − 22.8 – (0.260 × 3NOP dose) + (0.129 × NDF content)
Equation 2
The equations were centered on the mean values of 127 mg 3NOP /kg DM and 326 g NDF /kg
DM. Therefore, the methane reduction rates were adjusted for each cattle type when the NDF
content in the 3NOP supplemented scenarios varies from the default centered value. The NDF
contents for different growing stages of dairy cows in California used in this study were calculated
using NRC (2001) based on ingredients supplied (Table 9). In 3NOP scenario 1, enteric CH4
emitted from lactating cows was reduced by 38.8%, which includes adjustment for NDF content
(Table 9). In scenario 2, if the cows were not lactating, the emission reduction rate was assumed
to be similar to beef cattle so Equation 2 was applied. The enteric CH4 reduction rates for heifer,
pregnant heifer, close up heifer, high lactating cow, and dry cow were 11.1%, 1.1%, 10.3%, 38.8%,
and 4.0%, respectively (Table 9).
The GHG emissions from the farm management and manure management processes in the
LCA for 3NOP scenarios were same as for the control scenario because we assumed no residues
and by-products from the 3NOP production process. Nkemka et al. (2019) confirmed that there
was no residual effect on anaerobic digestion of the manure from beef cattle fed diets supplemented
with 3NOP.

60
Table 9. Enteric methane reduction rates and total emissions per life cycle at different dairy growing stages for control and treatment
scenarios.
Cattle
Stage
Control 3NOP 1a 3NOP 2a Nitrate 1 Nitrate 2 Nitrate 3
Reduct
ion (%)
CH4
(kg/lifetime)
Reduct
ion (%)
CH4
(kg/lifetime)
Reduct
ion (%)
CH4
emission
(kg/lifetime)
Reduct
ion (%)
CH4
(kg/lifetime)
Reduct
ion (%)
CH4
(kg/lifetime)
Reduct
ion (%)
CH4
(kg/lifetime)
Calf NA NA NA NA NA NA NA NA NA NA NA NA
Heifer 0 10.6 0 10.6 -11.1 9.4 0 10.6 -15.4 9.1 -15.4 9.6
Pregnant 0 73.8 0 73.8 -1.1 72.9 0 73.8 -15.4 62.3 -15.4 66.0
Close up 0 9.2 0 9.2 -10.3 8.2 0 9.2 -15.4 7.6 -15.4 7.8
lactating 0 575.8 -38.8 352.4 -38.8 352.4 -15.4 481.7 -15.4 481.7 -15.4 488.5
Dry cow 0 60.9 0 60.9 -4.0 58.5 0 60.9 -15.4 50.0 -15.4 52.0
aNDF content (g/kg DM) in diets for 3NOP scenarios: 250 (Calf up to 1 year), 419 (Heifer), 496 (Pregnant heifer), 425 (Close up heifer),
349 (High lactating cow), and 474 (Dry cow).

61
Nitrate
Nitrate was assumed to be supplemented to dairy diets as Calcium nitrate (Ca(NO₃)₂). Brentrup et
al. (2016) reported carbon footprint associated with Ca(NO₃)₂ production were estimated to be
1.76 kg CO2e/kg Ca(NO₃)₂ in USA and 0.67 kg CO2e/kg Ca(NO₃)₂ produced in Europe. Total
emissions associated with Ca(NO₃)₂ production were calculated using both carbon footprint values
for USA and Europe, and the emissions from nitrate production process are reported as the mean
with standard deviation. Emissions related to transportation of Ca(NO₃)₂ was calculated based on
the shipping distance between supplier and dairy farms in California. Several chemical companies
supply Ca(NO₃)₂ within California and the plant with the minimum travel distance (by truck) to
each county was assumed as its Ca(NO₃)₂ supplier. The overall average distance was weighted
based on the milk production in California counties in 2014 (CDFA, 2014) and used for emission
calculations related to chemical transportations. Feed production for different nitrate treatment
scenarios were recalculated based on the replacement of high protein meals by dietary nitrate to
provide equivalent N as compared to the diets for control scenario at each growing stage using
NRC (2001) software.
The anti-methanogenic effects of nitrate were calculated based on equations developed by
Feng et al. (2020 unpublished). Meta-analytical results indicated nitrate effect on enteric CH4
production to be significantly affected by nitrate dose. However, there was no difference in
effectiveness in dairy and beef cattle. The reduction rate for enteric CH4 emissions is estimated by
the meta-analytical model as given in Equation 3.
Enteric methane reduction rate (%) = − 14.6 – (0.808 × nitrate dose) Equation 3

62
The equation is centered on mean nitrate dose of the database, which was 17.7 g/kg of DM. We
kept the average as the dose of nitrate supplementation in the scenarios evaluated in this study.
We assumed there were no residues and by-products from nitrate production and the total
GHG emissions from farm management process for nitrate treatment scenarios including on-farm
energy and water usage were not affected by nitrate additives. Methane emissions from manure
storage were calculated as a function of VS (Nielsen et al., 2013) which was associated with NDF
content, CP content and DMI (Appuhamy et al., 2016). As the dietary ingredients and DMI for
nitrate scenarios varied with the adjustment of nitrate additives, the total GHG emissions from
manure management were recalculated based on the different nitrate feeding scenarios.
Results and discussion
3-Nitrooxypropanol
The GHG emissions from crop production, farm management, enteric CH4 and manure storage for
control scenario were 0.174, 0.0608, 0.432, and 0.457 kg CO2e per kg of ECM produced in
California, respectively (Figure 10). Total GHG emissions from crop production, farm
management, and manure storage were not affected by feeding 3NOP to dairy cows. The mean
GHG emissions related to production of 3NOP in scenario 1 was 3.23 g CO2e/kg ECM which was
lower than 3.92 g CO2e/kg ECM in scenario 2 because 3NOP was only fed to lactating cows in
scenario 1. Enteric CH4 emissions were 0.298 and 0.295 kg CO2e/kg ECM for 3NOP scenarios 1
and 2, respectively, which were reduced by 31.0% and 31.7% compared to the control scenario,
respectively, due to the inhibition effect of 3NOP on CH4 production. Accounting for 3NOP
production, the net enteric methane emission reduction was 30.3% in scenario 1 and 30.8% in
scenario 2.

63
The total GHG emissions for control and 3NOP treatment scenarios 1 and 2 were 1.12,
0.993 and 0.991 kg CO2e/kg ECM, respectively (Figure 10). Feeding 3NOP to dairy cows resulted
in a net reduction of total GHG emission of 11.3% in 3NOP scenario 1 and 11.5% in 3NOP
scenario 2 compared to the control scenario. Using 3NOP for dairy cows at all growing stages only
further reduced 0.2 percentage points more compared to limiting 3NOP supplementation during
lactation.
Figure 10. Comparison of global warming potential (GWP) by emission source for control and
3NOP scenarios 1 and 2 in California dairy cows.
The GHG emissions associated with 3NOP production for scenarios 1 and 2 were 3.86 and
4.69 g CO2e/kg ECM, respectively, assuming 3NOP carbon footprint of 52 kg CO2e/kg and 2.60
64
and 3.16 g CO2e/kg ECM, respectively, using manufacturer reported values of 35 kg CO2e/kg
3NOP. This indicates that with the improvement of manufacturing process, the GHG emissions
from 3NOP production can be reduced by 32.6%, improving net impact of 3NOP in reducing
enteric emissions.
Nitrate
The total GHG emissions and estimates of the various components in dairy cattle supplemented
with nitrate is given in Figure 11. In nitrate scenario 1, the mean GHG emissions associated with
nitrate production was 0.0182 kg CO2e/kg ECM and 0.0219 kg CO2e/kg ECM in nitrate scenarios
2 and 3 due to differences in the phases of dairy production that nitrate was included. The error
bars for nitrate production in Figure 11 showed the deviations of GHG emissions estimated with
different carbon footprint of Ca(NO₃)₂ production in USA and Europe. According to Brentrup et
al. (2016) the difference was mainly due to a catalyst technology developed in Europe. The GHG
emissions calculated with carbon footprint value for Ca(NO₃)₂ in USA were 0.0255 kg CO2e/kg
ECM for nitrate scenario 1, and 0.0307 kg CO2e/kg ECM for nitrate scenarios 2 and 3. Using the
European carbon footprint (0.67 kg CO2e/kg Ca(NO₃)₂ produced), the GHG emissions from nitrate
production was 0.0109 kg CO2e/kg ECM for nitrate scenario 1, and 0.0131 kg CO2e/kg ECM for
nitrate scenarios 2 and 3. The GHG emissions from nitrate production decreased 57.3% based on
European values compared to those in USA.
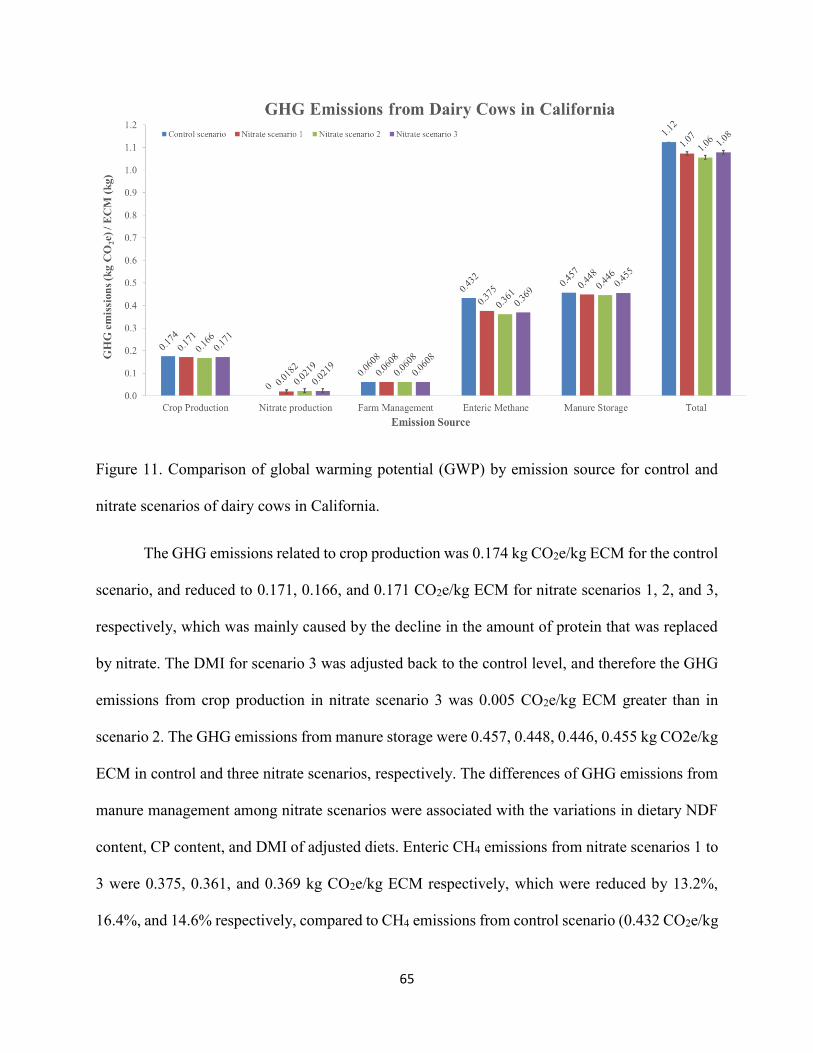
65
Figure 11. Comparison of global warming potential (GWP) by emission source for control and
nitrate scenarios of dairy cows in California.
The GHG emissions related to crop production was 0.174 kg CO2e/kg ECM for the control
scenario, and reduced to 0.171, 0.166, and 0.171 CO2e/kg ECM for nitrate scenarios 1, 2, and 3,
respectively, which was mainly caused by the decline in the amount of protein that was replaced
by nitrate. The DMI for scenario 3 was adjusted back to the control level, and therefore the GHG
emissions from crop production in nitrate scenario 3 was 0.005 CO2e/kg ECM greater than in
scenario 2. The GHG emissions from manure storage were 0.457, 0.448, 0.446, 0.455 kg CO2e/kg
ECM in control and three nitrate scenarios, respectively. The differences of GHG emissions from
manure management among nitrate scenarios were associated with the variations in dietary NDF
content, CP content, and DMI of adjusted diets. Enteric CH4 emissions from nitrate scenarios 1 to
3 were 0.375, 0.361, and 0.369 kg CO2e/kg ECM respectively, which were reduced by 13.2%,
16.4%, and 14.6% respectively, compared to CH4 emissions from control scenario (0.432 CO2e/kg
66
ECM) based on values calculated for CH4-mitigating effect of dietary nitrate (Table 9). The net
reduction enteric methane emission (including nitrate production) is calculated to be 8.98, 11.35
and 9.51% for nitrate scenarios 1 to 3, respectively. The GHG emissions from farm management
were the same for control and all nitrate scenarios which was 0.0608 kg CO2e/kg ECM (Figure
11).
The total GHG emissions for control scenario was 1.12 kg CO2e/kg ECM, while with
supplementing dietary nitrate to dairy cows in California, the total GHG emissions were 1.07, 1.06,
and 1.08 kg CO2e/kg ECM respectively in nitrate scenarios 1, 2, and 3. Therefore, the total GHG
emissions for three nitrate scenarios were reduced by 4.5%, 5.4%, and 3.6% from the control
scenario. The net reductions of total GHG emissions for nitrate scenarios 1, 2, and 3 were 0.05,
0.06, 0.04 kg CO2e/kg ECM, respectively (Figure 11). Nitrate scenario 2 showed the greatest net
reduction of total GHG emissions which reduced 0.9% and 1.8% more of total GHG emissions
compared to scenarios 1 and 3, respectively.
Comparison of 3-nitrooxypropanol and nitrate additives
Total GHG emissions from control scenario were lower than values published in several previous
studies. For example, Gerber et al. (2011) reported the GHG emissions in North America to be
1.20 kg CO2e/kg ECM and Thoma et al. (2013) reported 1.23 kg CO2e/kg ECM. In Canada,
Alvarez-Hess et al. (2019) reported 1.21 kg CO2e/kg ECM, but in two Australian dairy farms, the
authors reported 1.09 and 0.97 kg CO2e/kg ECM, respectively, which were slightly lower than the
value estimated in the present study. Emissions from manure storage accounted for 40.6% to
46.1% of the total GHG emissions, which contributed the largest amount to total GHG emissions
in all scenarios. Enteric CH4 emissions from control scenario accounted for 38.4% of the total
GHG emissions but the proportions of enteric CH4 emissions dropped and varied between 29.8%
67
(3NOP, scenario 2) to 35.0% (nitrate scenario 1). Crop production emitted 15.5% to 17.6% of total
GHG emissions and the significant decrease in enteric CH4 emissions resulted in a proportional
increase of GHG emissions of crop production in 3NOP scenarios. Only 0.3% to 2.1% of emissions
were attributed to feed additives production in supplemental scenarios. The GHG emissions
associated with farm management were same for all scenarios.
Although both 3NOP and nitrate additives decreased the total GHG emissions, the
mitigating effect of 3NOP was greater than nitrate reaching a highest reduction rate of 11.8%
(3NOP scenario 2). The average net reduction rate of GHG emissions for 3NOP was 11.7% and
supplementing 3NOP to dairy cows only during lactations or to the entire growing herds had a
minor difference in the total GHG emissions. The mean net reduction rate of GHG emissions in
dairy cows feeding nitrate was 4.9%. The greatest net GHG emissions achieved with nitrate was
6.1% with supplementation of nitrate to dairy cows in all growing stages. These results partially
agreed with Alvarez-Hess et al. (2019) who reported that the GHG emissions went down from
1.13 kg CO2e/kg ECM to 1.10 kg CO2e/kg ECM (a reduction of 2.65%) when nitrate was fed to
lactating cows only at a rate of 21 g/kg DM. The GHG emissions from groups supplemented with
3NOP at 86 mg/kg DM were between 0.83 and 1.03 kg CO2e/kg ECM in dairy farms in Australia
and Canada (Alvarez-Hess et al., 2019).
The carbon footprint of nitrate is greater than that of 3NOP and it is fed at a rate of an
average 17.7 g/kg DM compared to an average of 127 mg/kg DM for 3NOP. Therefore, much
higher quantities for nitrate are required for methane mitigation resulting in about 5.6 times GHG
emission from production of the additive. Moreover, nitrate toxicity caused by the high
methemoglobin levels in ruminants fed in greater quantities is a concern and currently not

68
recommended as methane mitigating feed additives to cattle (Bruning-Fann and Kaneene, 1993;
Lee and Beauchemin, 2014).
The impact of manure additives can be added to the effect of feed additives. When biochar,
acids, and straw are used alongside 3NOP the potential combined effect would be 20 to 34% from
the whole dairy production system in CA.
Conclusions
This LCA was conducted based on dairy cows in California and evaluated the mitigation effect of
two promising feed additives—3NOP and nitrate, on total GHG emissions. The average net
reduction rate of supplementing 3NOP and nitrate were 11.7% and 4.9%, respectively. 3NOP had
a greater effect than nitrate on reducing total GHG emissions with a highest performance of 11.8%.
Feeding 3NOP to only lactating cows or to the entire growth stages did not make significant
difference in total GHG emissions. Considering California milk production of 18 billion kg in
2017, using nitrate on California dairy cows would reduce GHG emissions 1.09 billion kg CO2e
and 3NOP 2.33 billion kg CO2e annually.
SUMMARY
This study evaluated strategies to reduce methane emission from enteric and lagoon sources with
emphasis on California conditions. A considerable amount of literature is available on feed
additives but studies on manure additives are much more scarce. Through a literature review, a
large amount of feed additives were considered, but only about 17% of those evaluated through
effect size analysis had a statistically significant mitigating impact on methane emissions. The
majority of those were found to either increase cost, reduce productivity or increase an alternative

69
pollutant at the expense of methane mitigation. Therefore, only 3NOP and nitrate were identified
as those with the highest potential. An updated meta-analysis for effectiveness of 3NOP showed
41% reduction in dairy cattle and 22.4% in beef cattle. A new meta-analysis for nitrate showed
14.4% reduction in mitigating methane with no differences between dairy and beef cattle. In both
cases dosage of feed additives was related to further reduction in emissions.
Manure additives that include acidification, biochar, microbial digestion, physical agent, straw,
and other chemicals significantly reduced CH4 emissions from manure. In general, higher moisture
contents in raw composting manure could enhance the CH4 mitigation rates, however, the pH, and
C/N content were not linearly related to CH4 mitigation. Adding biochar, acids, and straw to
manure could mitigate CH4 emissions by 82.4%, 78.1%, and 47.7%, respectively. The meta-
analysis conducted with selected additives indicated manure additives were an effective method
to reduce CH4 emission, with biochar being the most effective. However, further studies of manure
additives on CH4 mitigation are required to support a more accurate quantitative analysis. A life
cycle assessment was conducted based on dairy cows in California and evaluated the mitigation
effect of 3NOP and nitrate on total GHG emissions.
The average net reduction rate of supplementing 3NOP and nitrate were 11.7% and 4.9%,
respectively. 3NOP had a greater effect than nitrate on reducing total GHG emissions with a
highest performance of 11.8%. Feeding 3NOP to only lactating cows or to the entire growth stages
did not make significant difference in total GHG emissions. Given the toxicity concerns of nitrate,
only 3NOP is recommended for use pending FDA approval. However, further research is highly
recommended for Mootral, macroalage and grape pomace to establish efficacy and solve related
issues as there were only one or two studies conducted relevant to California conditions.

70
REFERENCES
Agyarko-Mintah, E., Cowie, A., Singh, B.P., Joseph, S., Van Zwieten, L., Cowie, A., Harden, S.,
Smillie, R. 2017. Biochar increases nitrogen retention and lowers greenhouse gas emissions
when added to composting poultry litter. Waste Management, 61, 138-149.
Alemu, A. W., A. Romero-Perez, R. C. Araujo, and K. A. Beauchemin. 2019. Effect of
encapsulated nitrate and microencapsulated blend of essential oils on growth performance
and methane emissions from beef steers fed backgrounding diets. Animals 9:1-19. doi:
10.3390/ani9010021.
Alvarez-Hess, P. S., S. M. Little, P. J. Moate, J. L. Jacobs, K. A. Beauchemin, and R. J. Eckard.
2019. A partial life cycle assessment of the greenhouse gas mitigation potential of feeding
3-nitrooxypropanol and nitrate to cattle. Agric. Syst. 169:14-23.
Appuhamy, J. A. D. R. N., A. B. Strathe, S. Jayasundara, C. Wagner-Riddle, J. Dijkstra, J.
France, and E. Kebreab. 2013. Anti-methanogenic effects of monensin in dairy and beef
cattle: A meta-analysis. J. Dairy Sci. 96:5161-5173. doi: 10.3168/jds.2012-5923.
Appuhamy, J. A. D. R. N., L. E. Moraes, C. Wagner-Riddle, D. P. Casper, and E. Kebreab. 2016.
Predicting manure volatile solid output of lactating dairy cows. J. Anim. Sci. 94(Suppl.
5):567–568. Doi: https://doi.org/10.2527/jam2016 -1182.
Beauchemin, K.A., T. A. McAllister, and S. M. McGinn. 2009. Dietary mitigation of enteric
methane from cattle. CAB Reviews: perspectives in agriculture, veterinary science. Nutr.
Nat. Res. 4:1–18.

71
Berg, W., Türk, M., Hellebrand, H. 2006. Effects of acidifying liquid cattle manure with nitric or
lactic acid on gaseous emissions. Proceedings Workshop on Agricultural Air Quality: State
of the Science. pp. 492-498.
Boadi, D., C. Benchaar, J. Chiquette, and D. Massé. 2004. Mitigation strategies to reduce enteric
methane emissions from dairy cows: Update review. Can. J. Anim. Sci. 84: 319–335.
Borenstein, M., Hedges, L.V., Higgins, J.P., Rothstein, H.R. 2011. Introduction to meta-analysis.
John Wiley & Sons.
Borgonovo F, C. Conti, D. Lovarelli, V. Ferrante, and M. Guarino. Improving the sustainability
of dairy slurry by a commercial additive treatment. Sustainability 11(18), 4998. DOI:
https://doi.org/10.3390/su11184998
Brentrup, F., A. Hoxha, and B. Christensen. 2016. Carbon footprint analysis of mineral fertilizer
production in europe and other world regions. Proc. of 10th International Conference on
Life Cycle Assessment of Food 2016, Dublin UCD.
Bruning-Fann, C. S., and J. B. Kaneene. 1993. The effects of nitrate, nitrite and N-nitroso
compounds on human health: a review. Vet Hum Toxicol 35(6):521-538.
Burt, C., D. Howes, and G. Wilson. 2003. California agricultural water electrical energy
requirements. Final Report, California Polytechnic State University. Accessed May. 15,
2019. www.itrc.org.
Cao, Y.B., Wang, X., Bai, Z.H., Chadwick, D., Misselbrook, T., Sommer, S.G., Qin, W., Ma, L.
2019. Mitigation of ammonia, nitrous oxide and methane emissions during solid waste
composting with different additives: A meta-analysis. Journal of Cleaner Production, 235,
626-635.

72
Capelari, M. G. M. 2018. Investigating the potential of supplementary nitrate and monensin as
dietary additives for enteric methane mitigation in ruminants. Dissertation. Department of
Animal Science, Michigan State Univ., East Lansing.
CARB (California Air Resources Board). 2017. Short-Lived Climate Pollutant Reduction
Strategy. Accessed June 22, 2020. https://ww2.arb.ca.gov/sites/default/files/2020-
05/cc.shortlived.meetings.03142017.final_slcp_report_0.pdf
CARB (California Air Resources Board). 2020. Methane (CH4). Accessed June 22, 2020.
https://ww3.arb.ca.gov/cc/inventory/background/ch4.htm
CDFA (California Department of Food and Agriculture). 2019. 2019 State Agriculture
Overview—California. Accessed Apr. 7, 2020.
https://www.nass.usda.gov/Quick_Stats/Ag_Overview/stateOverview.php?state=CALIFO
RNIA
Chen, H., Awasthi, M.K., Liu, T., Zhao, J., Ren, X., Wang, M., Duan, Y., Awasthi, S.K., Zhang,
Z. 2018. Influence of clay as additive on greenhouse gases emission and maturity
evaluation during chicken manure composting. Bioresource Technology, 266, 82-88.
Chen, W., Liao, X., Wu, Y., Liang, J.B., Mi, J., Huang, J., Zhang, H., Wu, Y., Qiao, Z., Li, X.,
Wang, Y. 2017. Effects of different types of biochar on methane and ammonia mitigation
during layer manure composting. Waste Management, 61, 506-515.
Chowdhury, M.A., de Neergaard, A., Jensen, L.S. 2014a. Composting of solids separated from
anaerobically digested animal manure: Effect of different bulking agents and mixing ratios
on emissions of greenhouse gases and ammonia. Biosystems Engineering, 124, 63-77.
73
Chowdhury, M.A., de Neergaard, A., Jensen, L.S. 2014b. Potential of aeration flow rate and bio-
char addition to reduce greenhouse gas and ammonia emissions during manure
composting. Chemosphere, 97, 16-25.
Clemens, J., Trimborn, M., Weiland, P., Amon, B. 2006. Mitigation of greenhouse gas emissions
by anaerobic digestion of cattle slurry. Agriculture, ecosystems & environment, 112(2-3),
171-177.
Cottle, D. J., J. N. Nolan, and S. G. Wiedemann. 2011. Ruminant enteric methane mitigation: a
review. Anim. Prod. Sci. 51: 491–514.
Dijkstra, J., A. Bannink, J. France, E. Kebreab, and S. van Gastelen. 2018. Short communication:
Antimethanogenic effects of 3-nitrooxypropanol depend on supplementation dose, dietary
fiber content, and cattle type. J. Dairy Sci. 101:9041-9047.
Duin, E.C., T. Wagner, S. Shima, D. Prakash, B. Cronin, D.R. Yáñez-Ruiz, S. Duval, R.
Rümbeli, R.T. Stemmler, R.K. Thauer, and M. Kindermann. 2016. Mode of action
uncovered for the specific reduction of methane emissions from ruminants by the small
molecule 3-nitrooxypropanol. Proc. Natl. Acad. Sci. USA 113:6172-6177. Doi:
https://doi.org/10.1073/pnas.1600298113
Duthie, C. A., S. M. Troy, J. J. Hyslop, D. W. Ross, R. Roehe, and J. A. Rooke. 2018. The effect
of dietary addition of nitrate or increase in lipid concentrations, alone or in combination, on
performance and methane emissions of beef cattle. Animal 12:280-287. doi:
10.1017/S175173111700146X.
EPA (2011) Global Anthropogenic Non-CO2 Greenhouse Gas Emissions: 1990–2030.
Publication 430-D-11-003. EPA, Washington, DC.

74
EPA (2017). Inventory of U.S. Greenhouse Gas Emissions and Sinks. Accessed from
https://www.epa.gov/ghgemissions/inventory-us-greenhouse-gas-emissions-and-sinks
Eugène, M., D. Masse, J. Chiquette, and C. Benchaar. 2008. Meta-analysis on the effects of lipid
supplementation on methane production in lactating dairy cows. Can. J. Anim. Sci. 88:331-
334. doi: 10.4141/cjas07112.
Feng, X.Y., J. Dijkstra, A. Bannink, S. van Gastelen, J. France, and E. Kebreab. 2020. Anti-
methanogenic effects of nitrate supplementation in ruminants: A meta-analysis. J. Dairy
Sci.
Gerber, P. J., H. Steinfeld, B. Henderson, A. Mottet, C. Opio, J. Dijk-man, A. Falcucci, and G.
Tempio. 2013. Tackling Climate Change through Livestock: A Global Assessment of
Emissions and Mitigation Opportunities. Food and Agriculture Organization of the United
Nations (FAO), Rome, Italy.
Gerber, P., T. Vellinga, C. Opio, and H. Steinfeld. 2011. Productivity gains and greenhouse gas
emissions intensity in dairy systems. Livest. Sci. 139:100–108.
https://doi.org/10.1016/j.livsci.2011.03.012.
Godlewska, P., Schmidt, H.P., Ok, Y.S., Oleszczuk, P. 2017. Biochar for composting
improvement and contaminants reduction. A review. Bioresource Technology, 246, 193-
202.
Granja-Salcedo, Y. T., R. M. Fernandes, R. C. D. Araujo, L. T. Kishi, T. T. Berchielli, F. D. D.
Resende, A. Berndt, and G. R. Siqueira. 2019. Long-term encapsulated nitrate
supplementation modulates rumen microbial diversity and rumen fermentation to reduce
methane emission in grazing steers. Front Microbiol 10:614. doi:
10.3389/fmicb.2019.00614.
75
Guyader, J., M. Eugène, B. Meunier, M. Doreau, D. P. Morgavi, M. Silberberg, Y. Rochette, C.
Gerard, C. Loncke, and C. Martin. 2015b. Additive methane-mitigating effect between
linseed oil and nitrate fed to cattle. J. Anim. Sci. 93:3564-3577. doi: 10.2527/jas.2014-
8196.
Guyader, J., M. Eugène, M. Doreau, D. P. Morgavi, C. Gérard, C. Loncke, and C. Martin. 2015a.
Nitrate but not tea saponin feed additives decreased enteric methane emissions in
nonlactating cows. J. Anim. Sci. 93:5367-5377. doi: 10.2527/jas.2015-9367
Hao, X.Y., Larney, F.J., Chang, C., Travis, G.R., Nichol, C.K., Bremer, E. 2005. The effect of
phosphogypsum on greenhouse gas emissions during cattle manure composting. Journal of
Environmental Quality, 34(3), 774-781.
He, X., Yin, H., Han, L., Cui, R., Fang, C., Huang, G. 2019. Effects of biochar size and type on
gaseous emissions during pig manure/wheat straw aerobic composting: Insights into
multivariate-microscale characterization and microbial mechanism. Bioresource
Technology, 271, 375-382.
Hedges, L. V., E. Tipton, and M. C. Johnson. 2010. Robust variance estimation in meta‐
regression with dependent effect size estimates. Res Synth Methods 1:39-65.
Henry, D., F. Ciriaco, R. Araujo, P. Fontes, N. Oosthuizen, M. Garcia-Ascolani, C. Sanford, T.
Schulmeister, R. Martin, J. Dubeux, Jr., L. Rostoll-Cangiano, G. Lamb, and N. DiLorenzo.
2018. Effects of bismuth subsalicylate and encapsulated calcium-ammonium nitrate on
enteric methane production and apparent total-tract nutrient digestibility of beef cattle. J.
Anim. Sci. 96:398-399.
Hristov, A.N., J. Oh, J. L. Firkins, J. Dijkstra, E. Kebreab, G. Waghorn, H. P. S. Makkar, A. T.
Adesogan, W. Yang, C. Lee, P. J. Gerber, B. Henderson, and J. M. Tricarico. 2013a.

76
Mitigation of methane and nitrous oxide emissions from animal operations: I. A review of
enteric methane mitigation options. J. Anim. Sci. 91, 5045–5069.
Hristov, A.N., J. Oh, J. L. Firkins, J. Dijkstra, E. Kebreab, G. Waghorn, H. P. S. Makkar, A. T.
Adesogan, W. Yang, C. Lee, P. J. Gerber, B. Henderson and J. M. Tricarico. 2013.
Mitigation of methane and nitrous oxide emissions from animal operations: I. A review of
enteric methane mitigation options. J. Anim. Sci. 91:5045–5069. Doi: 10.2527/jas.2013-
6583.
Hulshof, R. B. A., A. Berndt, W. J. J. Gerrits, J. Dijkstra, S. M. van Zijderveld, J. R. Newbold,
and H. B. Perdok. 2012. Dietary nitrate supplementation reduces methane emission in beef
cattle fed sugarcane-based diets. J. Anim. Sci. 90:2317-2323. doi: 10.2527/jas.2011-4209.
IPCC, 2014: Climate Change 2014: Synthesis Report. Contribution of Working Groups I, II and
III to the Fifth Assessment Report of the Intergovernmental Panel on Climate Change.
2014. IPCC Geneva, Switzerland: IPCC.
Jayasundara, S., J. A. D. R. N. Appuhamy, E. Kebreab and C. Wagner-Riddle. 2016. Methane
and nitrous oxide emissions from Canadian dairy farms and mitigation options: An updated
review. Can. J. Anim. Sci., 96: 306–331.
Jia, X., Wang, M., Yuan, W., Ju, X., Yang, B. 2016. The Influence of Biochar Addition on
Chicken Manure Composting and Associated Methane and Carbon Dioxide Emissions.
Bioresources, 11(2), 5255-5264.
Johnson, R., and B. A. Cody. 2015. CRS Report: California agricultural production and irrigated
water use. Congressional Research Service. Accessed May. 15, 2019.
https://fas.org/sgp/crs/misc/R44093.pdf

77
Kim, S. H., C. Lee, H. A. Pechtl, J. M. Hettick, M. R. Campler, M. D. Pairis-Garcia, K. A.
Beauchemin, P. Celi, and S. M. Duval. 2019. Effects of 3-nitrooxypropanol on enteric
methane production, rumen fermentation, and feeding behavior in beef cattle fed a high-
forage or high-grain diet. J Anim Sci. 97:2687–2699. Doi: 10.1093/jas/skz140.
Kinley, R.D., Martinez-Fernandez, G., Matthews, M.K., de Nys, R., Magnusson, M. and
Tomkins, N.W. (2020). Mitigating the carbon footprint and improving productivity of
ruminant livestock agriculture using a red seaweed. Journal of Cleaner Production, 59,
120836. https://doi.org/10.1016/j.jclepro.2020.120836
Klop, G., B. Hatew, A. Bannink, and J. Dijkstra. 2016. Feeding nitrate and docosahexaenoic acid
affects enteric methane production and milk fatty acid composition in lactating dairy cows.
J. Dairy Sci. 99:1161-1172. doi: 10.3168/jds.2015-10214.
Knapp, J. R., G. L. Laur, P. A. Vadas, W. P. Weiss, and J. M. Tricarico. 2014. Invited review:
Enteric methane in dairy cattle production: Quantifying the opportunities and impact of
reducing emissions. J. Dairy Sci. 97 :3231–3261.
Latham, E. A., W. E. Pinchak, J. Trachsel, H. K. Allen, T. R. Callaway, D. J. Nisbet, and R. C.
Anderson. 2019. Paenibacillus 79R4, a potential rumen probiotic to enhance nitrite
detoxification and methane mitigation in nitrate-treated ruminants. Sci. Total Environ.
671:324-328. Doi: https://doi.org/10.1016/j.scitotenv.2019.03.390
Lee, C., and K. A. Beauchemin. 2014. A review of feeding supplementary nitrate to ruminant
animals: nitrate toxicity, methane emissions, and production performance. Can. J. Anim.
Sci. 94:557-570. doi: 10.4141/cjas-2014-069.

78
Lee, C., R. C. Araujo, K. M. Koenig, and K. A. Beauchemin. 2015. Effects of encapsulated
nitrate on enteric methane production and nitrogen and energy utilization in beef heifers. J.
Anim. Sci. 93:2391-2404. doi: 10.2527/jas.2014-8845.
Lee, C., R. C. Araujo, K. M. Koenig, and K. A. Beauchemin. 2017a. Effects of encapsulated
nitrate on growth performance, nitrate toxicity, and enteric methane emissions in beef
steers: Backgrounding phase. J. Anim. Sci. 95:3700-3711. doi: 10.2527/jas2017.1460.
Lee, C., R. C. Araujo, K. M. Koenig, and K. A. Beauchemin. 2017b. Effects of encapsulated
nitrate on growth performance, carcass characteristics, nitrate residues in tissues, and
enteric methane emissions in beef steers: Finishing phase. J. Anim. Sci. 95:3712-3726. doi:
10.2527/jas2017.1461.
Liedke, A., and S. Deimling. 2015. Role of specialty feed ingredients on livestock production’s
environmental sustainability. Final Report. PE International AG, Leinfelden-Echterdingen,
Germany.
Liu, N., Zhou, J., Han, L., Ma, S., Sun, X., Huang, G. 2017. Role and multi-scale
characterization of bamboo biochar during poultry manure aerobic composting.
Bioresource Technology, 241, 190-199.
Lund, P., Dahl, R., Yang, H.J., Hellwing, A.L.F., Cao, B.B., Weisbjerg, M.R. 2014. The acute
effect of addition of nitrate on in vitro and in vivo methane emission in dairy cows. Animal
Production Science, 54(9), 1432-1435.
Luo, Y., Li, G., Luo, W., Schuchardt, F., Jiang, T., Xu, D. 2013. Effect of phosphogypsum and
dicyandiamide as additives on NH3, N2O and CH4 emissions during composting. Journal
of Environmental Sciences, 25(7), 1338-1345.

79
Mao, H., Lv, Z., Sun, H., Li, R., Zhai, B., Wang, Z., Awasthi, M.K., Wang, Q., Zhou, L. 2018.
Improvement of biochar and bacterial powder addition on gaseous emission and bacterial
community in pig manure compost. Bioresource Technology, 258, 195-202.
Martinez, J., Guiziou, F., Peu, P., Gueutier, V. 2003. Influence of treatment techniques for pig
slurry on methane emissions during subsequent storage. Biosystems Engineering, 85(3),
347-354.
Martinez-Fernandez, G., S. Duval, M. Kindermann, H. J. Schirra, S. E. Denman, and C. S.
McSweeney. 2018. 3-NOP vs. halogenated compound: Methane production, ruminal
fermentation and microbial community response in forage fed cattle. Front. Microbiol.
9:1582. Doi: https://doi.org/10.3389/fmicb.2018.01582.
McCrory, D., Hobbs, P. 2001. Additives to reduce ammonia and odor emissions from livestock
wastes. Journal of environmental quality, 30(2), 345-355.
Meller, R. A., B. A. Wenner, J. Ashworth, A. M. Gehman, J. Lakritz, and J. L. Firkins. 2019.
Potential roles of nitrate and live yeast culture in suppressing methane emission and
influencing ruminal fermentation, digestibility, and milk production in lactating Jersey
cows. J. Dairy Sci. 102:6144-6156. doi: 10.3168/jds.2018-16008.
Misselbrook, T., Hunt, J., Perazzolo, F., Provolo, G. 2016. Greenhouse gas and ammonia
emissions from slurry storage: Impacts of temperature and potential mitigation through
covering (pig slurry) or acidification (cattle slurry). Journal of environmental quality,
45(5), 1520-1530.
Montes, F., R. Meinen, C. Dell, A. Rotz, A. N. Hristov, J. Oh, G. Waghorn, P. J. Gerber, B.
Henderson, H. P. S. Makkar and J. Dijkstra. Mitigation of methane and nitrous oxide

80
emissions from animal operations:II. A review of manure management mitigation options.
J. Anim. Sci., 91:5070-5094
Naranjo, A., A. Johnson, H. Rossow, and E. Kebreab. 2020. Greenhouse gas, water, and land
footprint per unit of production of the California dairy industry over 50 years. J. Dairy Sci.
103:3760-3773. Doi: https://doi.org/10.3168/jds.2019-16576.
Newbold, J. R., S. M. van Zijderveld, R. B. A. Hulshof, W. B. Fokkink, R. A. Leng, P. Terencio,
W. J. Powers, P. S. J. van Adrichem, N. D. Paton, and H. B. Perdok. 2014. The effect of
incremental levels of dietary nitrate on methane emissions in Holstein steers and
performance in Nelore bulls. J. Anim. Sci. 92:5032-5040. doi: 10.2527/jas.2014-7677.
Nielsen, N. I., H. Volden, M. Akerlind, M. Brask, A. L. F. Hellwing, T. Storlien, and J.
Bertilsson. 2013. A prediction equation for enteric methane emission from dairy cows for
use in NorFor. Acta Agric. Scand. A 63:126–130. Doi:
https://doi.org/10.1080/09064702.2013.851275.
Nkemka, V. N., K. A. Beauchemin, and X. Hao. 2019. Treatment of feces from beef cattle fed
the enteric methane inhibitor 3-nitrooxypropanol. Water Sci. Technol. 80:437-447. Doi:
https://doi.org/10.2166/wst.2019.302.
Olijhoek, D. W., A. L. F. Hellwing, M. Brask, M. R. Weisbjerg, O. Hojberg, M. K. Larsen, J.
Dijkstra, E. J. Erlandsen, and P. Lund. 2016. Effect of dietary nitrate level on enteric
methane production, hydrogen emission, rumen fermentation, and nutrient digestibility in
dairy cows. J. Dairy Sci. 99:6191-6205. doi: 10.3168/jds.2015-10691.
Owusu-Twum, M.Y., Polastre, A., Subedi, R., Santos, A.S., Mendes Ferreira, L.M., Coutinho, J.,
Trindade, H. 2017. Gaseous emissions and modification of slurry composition during

81
storage and after field application: Effect of slurry additives and mechanical separation.
Journal of Environmental Management, 200, 416-422.
Pachauri, R.K., Allen, M.R., Barros, V.R., Broome, J., Cramer, W., Christ, R., Church, J.A.,
Clarke, L., Dahe, Q., Dasgupta, P. 2014. Climate change 2014: synthesis report.
Contribution of Working Groups I, II and III to the fifth assessment report of the
Intergovernmental Panel on Climate Change. Ipcc.
Petersen, S.O., Andersen, A.J., Eriksen, J. 2012. Effects of cattle slurry acidification on ammonia
and methane evolution during storage. Journal of environmental quality, 41(1), 88-94.
Peterson, C.B., H. M. El Mashad, Y. Zhao,Y. Pan and F. M. Mitloehner. 2020. Effects of SOP
lagoon additive on gaseous emissions from stored liquid dairy manure. Sustainability, 12,
1393; https://doi.org/10.3390/su12041393.
Rebelo, L. R., I. C. Luna, J. D. Messana, R. C. Araujo, T. A. Simioni, Y. T. Granja-Salcedo, E.
S. Vito, C. Lee, I. A. Teixeira, and J. A Rooke. 2019. Effect of replacing soybean meal
with urea or encapsulated nitrate with or without elemental sulfur on nitrogen digestion and
methane emissions in feedlot cattle. Anim. Feed Sci. Technol. 257:114293. doi:
10.1016/j.anifeedsci.2019.114293
Regueiro, I., Coutinho, J., Gioelli, F., Balsari, P., Dinuccio, E., Fangueiro, D. 2016. Acidification
of raw and co-digested pig slurries with alum before mechanical separation reduces
gaseous emission during storage of solid and liquid fractions. Agriculture Ecosystems &
Environment, 227, 42-51.
Richard, T.L., (Bert) Hamelers, H.V.M., Veeken, A., Silva, T. 2002. Moisture relationships in
composting processes. Compost Science and Utilization, 10, 286-302.

82
Roque, B. M., H. J. van Lingen, H. Vrancken, and E. Kebreab. 2019a. Effect of Mootral-a garlic-
and citrus-extract-based feed additive-on enteric methane emissions in feedlot cattle.
Transl Anim Sci 3:1383-1388. doi: 10.1093/tas/txz133.
Roque, B.M., J.K. Salwen, R. Kinley and E. Kebreab. 2019b. Inclusion of Asparagopsis armata
in lactating dairy cows’ diet reduces enteric methane emission by over 50 percent. J.
Cleaner Prod. 234:132-138. https://doi.org/10.1016/j.jclepro.2019.06.193
Samer, M., Mostafa, E., Hassan, A. 2014. Slurry treatment with food industry wastes for
reducing methane, nitrous oxide and ammonia emissions. Misr Journal of Agricultural
Engineering, 31(4), 1523-1548.
Sanchez-Garcia, M., Alburquerque, J.A., Sanchez-Monedero, M.A., Roig, A., Cayuela, M.L.
2015. Biochar accelerates organic matter degradation and enhances N mineralisation
during composting of poultry manure without a relevant impact on gas emissions.
Bioresource Technology, 192, 272-279.
Sar, C., B. Santoso, Y. Gamo, T. Kobayashi, S. Shiozaki, K. Kimura, H. Mizukoshi, I. Arai, and
J. Takahashi. 2004. Effects of combination of nitrate with beta 1-4 galacto-
oligosaccharides and yeast (Candida kefyr) on methane emission from sheep. Asian-
australas. J. Anim. Sci. 17:73-79. doi: 10.5713/ajas.2004.73.
Schwarzer, G., J. R. Carpenter, and G. Rücker. 2015. Meta-analysis with R. Springer
International Publishing Switzerland. Springer Cham Heidelberg, New York. doi:
10.1007/978-3-319-21416-0
Shah, S.B., Kolar, P. 2012. Evaluation of additive for reducing gaseous emissions from swine
waste. Agricultural Engineering International: CIGR Journal, 14(2), 10-20.

83
Smith P, Bustamante M, Ahammad H et al. (2014) Agriculture, Forestry and Other Land Use
(AFOLU). In: Climate Change 2014: Mitigation of Climate Change. Contribution of
Working Group III to the Fifth Assessment Report of the Intergovernmental Panel on
Climate Change [Edenhofer, O., R. Pichs-Madruga, Y. Sokona, E. Farahani, S. Kadner, K.
Seyboth, A. Adler, I. Baum, S. Brunner, P. Eickemeier, B. Kriemann, J. Savolainen, S.
Schlömer, C. von Stechow, T. Zwickel and J.C. Minx (eds.)]. Cambridge University Press,
Cambridge, United Kingdom and New York, NY, USA.
Sommer, S.G., Moller, H.B. 2000. Emission of greenhouse gases during composting of deep
litter from pig production - effect of straw content. Journal of Agricultural Science, 134,
327-335.
Sonoki, T., Furukawa, T., Mizumoto, H., Jindo, K., Aoyama, M., Sanchez-Monedero, M. 2011.
Impacts of biochar addition on methane and carbon dioxide emissions during composting
of cattle manure. Asia Pacific Biochar Conference Kyoto. pp. 15-18.
Tanner-Smith, E. E., E. T., and J. R. Polanin. 2016. Handling complex meta-analytic data
structures using robust variance estimates: a tutorial in R. J Dev Life Course Criminol
2:85-112. doi: 10.1007/s40865-016-0026-5.
Thoma, G., J. Popp, D. Shonnard, D. Nutter, M. Matlock, R. Ulrich, W. Kellogg, D. S. Kim, Z.
Neiderman, N. Kemper, F. Adom, and C. East. 2013. Regional analysis of greenhouse gas
emissions from USA dairy farms: A cradle to farm-gate assessment of the American dairy
industry circa 2008. Int. Dairy J. 31:S29–S40. Doi:
https://doi.org/10.1016/j.idairyj.2012.09.010.
Tipton, E. 2015. Small sample adjustments for robust variance estimation with meta-regression.
Psychol Methods 20:375.

84
Tomkins, N., A. J. Parker, G. Hepworth, and M. J. Callaghan. 2018. Nitrate supplementation has
marginal effects on enteric methane production from Bos indicus steers fed Flinders grass
(Iseilema spp.) hay, but elevates blood methaemoglobin concentrations. Anim Prod Sci
58:262-270. doi: 10.1071/an16002.
Troy, S. M., C. A. Duthie, J. J. Hyslop, R. Roehe, D. W. Ross, R. J. Wallace, A. Waterhouse,
and J. A. Rooke. 2015. Effectiveness of nitrate addition and increased oil content as
methane mitigation strategies for beef cattle fed two contrasting basal diets. J. Anim. Sci.
93:1815-1823. doi: 10.2527/jas.2014-8688.
Tubiello FN, Salvatore M, Rossi S, Ferreira A, Fitton N, P S (2013) The FAOSTAT database of
greenhouse gas emissions from agriculture. Environ. Res. Lett, 8, 015009.
UC Agricultural Issues Center. 2016. Current cost and return studies. Accessed Nov. 9, 2019.
https://coststudies.ucdavis.edu/en/.
US EPA, United States Environmental Protection Agency, 2008. Edition of the Drinking Water
Standards and Health Advisories Table 822-F-18-001.
https://www.epa.gov/sites/production/files/2018-03/documents/dwtable2018.pdf.
USDA. 2013. 2013 Farm and ranch irrigation survey. Accessed Dec. 25, 2018.
https://www.agcensus.usda .gov/ Publications/ 2012/Online_Resources/Farm and Ranch
Irrigation Survey/.
USDA-ERS (Economic Research Service). 2011. Data sets: Fertilizer use and price. Accessed
May. 15, 2019. https://www.ers.usda.gov/data-products/fertilizer-use-and-price.aspx.
USDA-NASS (National Agricultural Statistics Service), 2019. Charts and Maps: Milk
Production and Milk Cows. Accessed Apr. 7, 2020.

85
https://www.nass.usda.gov/Charts_and_Maps/Milk_Production_and_Milk_Cows/milkprod
.php
USDA-NASS (National Agricultural Statistics Service). 2017. Quick Stats. Accessed Jan. 12,
2019. https://quickstats.nass.usda.gov.
USEPA. 2017. Greenhouse Gas Emissions. in: Sources of Greenhouse Gas Emissions, USEPA.
USEPA. 2019. Inventory of U.S. greenhouse gas emissions and sinks: 1990–2017. U.S. EPA,
Washington, DC.
van Gastelen, S., J. Dijkstra, and A. Bannink. 2019. Are dietary strategies to mitigate enteric
methane emission equally effective across dairy cattle, beef cattle, and sheep? J. Dairy Sci.
102:6109-6130.
van Wesemael, D., L. Vandaele, B. Ampe, H. Cattrysse, S. Duval, M. Kindermann, V. Fievez, S.
De Campeneere, and N. Peiren. 2019. Reducing enteric methane emissions from dairy
cattle: two ways to supplement 3-nitrooxypropanol. J Dairy Sci. 102:1780–1787. Doi:
10.3168/jds.2018-14534.
van Wyngaard, J. D. V., R. Meeske, and L. J. Erasmus. 2018. Effect of dietary nitrate on enteric
methane emissions, production performance and rumen fermentation of dairy cows grazing
kikuyu-dominant pasture during summer. Anim. Feed Sci. Technol. 244:76-87. doi:
10.1016/j.anifeedsci.2018.08.005.
van Wyngaard, J. D. V., R. Meeske, and L. J. Erasmus. 2019. Effect of dietary nitrate on enteric
methane emissions, production performance and rumen fermentation of dairy cows grazing
ryegrass pasture during spring. Anim. Feed Sci. Technol. 252:64-73. doi:
10.1016/j.anifeedsci.2019.04.006.

86
van Zijderveld, S. M., B. Fonken, J. Dijkstra, W. J. J. Gerrits, H. B. Perdok, W. Fokkink, and J.
R. Newbold. 2011. Effects of a combination of feed additives on methane production, diet
digestibility, and animal performance in lactating dairy cows. J. Dairy Sci. 94:1445-1454.
doi: 10.3168/jds.2010-3635.
van Zijderveld, S. M., W. J. J. Gerrits, J. A. Apajalahti, J. R. Newbold, J. Dijkstra, R. A. Leng,
and H. B. Perdok. 2010. Nitrate and sulfate: Effective alternative hydrogen sinks for
mitigation of ruminal methane production in sheep. J. Dairy Sci. 93:5856-5866. doi:
10.3168/jds.2010-3281.
van Zijderveld, S. M., W. J. J. Gerrits, J. Dijkstra, J. R. Newbold, R. B. A. Hulshof, and H. B.
Perdok. 2011. Persistency of methane mitigation by dietary nitrate supplementation in
dairy cows. J. Dairy Sci. 94:4028-4038. doi: 10.3168/jds.2011-4236.
Vandecasteele, B., Sinicco, T., D'Hose, T., Nest, T.V., Mondini, C. 2016. Biochar amendment
before or after composting affects compost quality and N losses, but not P plant uptake.
Journal of Environmental Management, 168, 200-209.
Velazco, J. I., D.J. Cottle, and R.S. Hegarty. 2014. Methane emissions and feeding behaviour of
feedlot cattle supplemented with nitrate or urea. Anim. Prod. Sci. 54:1737-1740. Doi:
https://doi.org/10.1071/AN14345.
Veneman, J. B., S. Muetzel, K. J. Hart, C. L. Faulkner, J. M. Moorby, H. B. Perdok, and C. J.
Newbold. 2015. Does dietary mitigation of enteric methane production affect rumen
function and animal productivity in dairy cows? PloS ONE 10:e0140282.
doi:10.1371/journal.pone.0140282.
Viechtbauer, W. 2010. Conducting meta-analyses in R with the metafor package. J Stat Softw
36:1-48.

87
Villar, M. L., R. S. Hegarty, J. V. Nolan, I. R. Godwin, and M. McPhee. 2020. The effect of
dietary nitrate and canola oil alone or in combination on fermentation, digesta kinetics and
methane emissions from cattle. Anim. Feed Sci. Technol. 259:114294.
Vyas, D., A. W. Alemu, S. M. McGinn, S. M. Duval, M. Kindermann, and K. A. Beauchemin.
2018. The combined effects of supplementing monensin and 3-nitrooxypropanol on
methane emissions, growth rate, and feed conversion efficiency in beef cattle fed high-
forage and high-grain diets. J Anim Sci. 96:2923–2938. Doi: 10.1093/jas/sky174.
Wang, K., Huang, D., Ying, H., Luo, H. 2014. Effects of acidification during storage on
emissions of methane, ammonia, and hydrogen sulfide from digested pig slurry.
Biosystems Engineering, 122, 23-30.
Wang, Q., Awasthi, M.K., Ren, X., Zhao, J., Li, R., Wang, Z., Wang, M., Chen, H., Zhang, Z.
2018. Combining biochar, zeolite and wood vinegar for composting of pig manure: the
effect on greenhouse gas emission and nitrogen conservation. Waste management, 74, 221-
230.
Wang, R., M. Wang, E. M. Ungerfeld, X. M. Zhang, D. L. Long, H. X. Mao, J. P. Deng, A.
Bannink, and Z. L. Tan. 2018. Nitrate improves ammonia incorporation into rumen
microbial protein in lactating dairy cows fed a low-protein diet. J. Dairy Sci. 101:9789-
9799. doi: 10.3168/jds.2018-14904.
Wheeler, E.F., Adviento-Borbe, M.A.A., Brandt, R.C., Topper, P.A., Topper, D.A., Elliott, H.A.,
Graves, R.E., Hristov, A.N., Ishler, V.A., Bruns, M.A.V. 2010. Amendments for mitigation
of dairy manure ammonia and greenhouse gas emissions: preliminary screening. 2010
Pittsburgh, Pennsylvania, June 20-June 23, 2010. American Society of Agricultural and
Biological Engineers. pp. 1.

88
Yamulki, S. 2006. Effect of straw addition on nitrous oxide and methane emissions from stored
farmyard manures. Agriculture Ecosystems & Environment, 112(2-3), 140-145.
Zhang, D., Luo, W., Yuan, J., Li, G., Luo, Y. 2017. Effects of woody peat and superphosphate
on compost maturity and gaseous emissions during pig manure composting. Waste
Management, 68, 56-63.
Zhang, X. M., R. F. Medrano, M. Wang, K. A. Beauchemin, Z. Y. Ma, R. Wang, J. N. Wen, L.
A. Bernard, and Z. L. Tan. 2019. Effects of urea plus nitrate pretreated rice straw and corn
oil supplementation on fiber digestibility, nitrogen balance, rumen fermentation,
microbiota and methane emissions in goats. J Anim Sci Biotechnol 10:6. doi:
10.1186/s40104-019-0312-2.
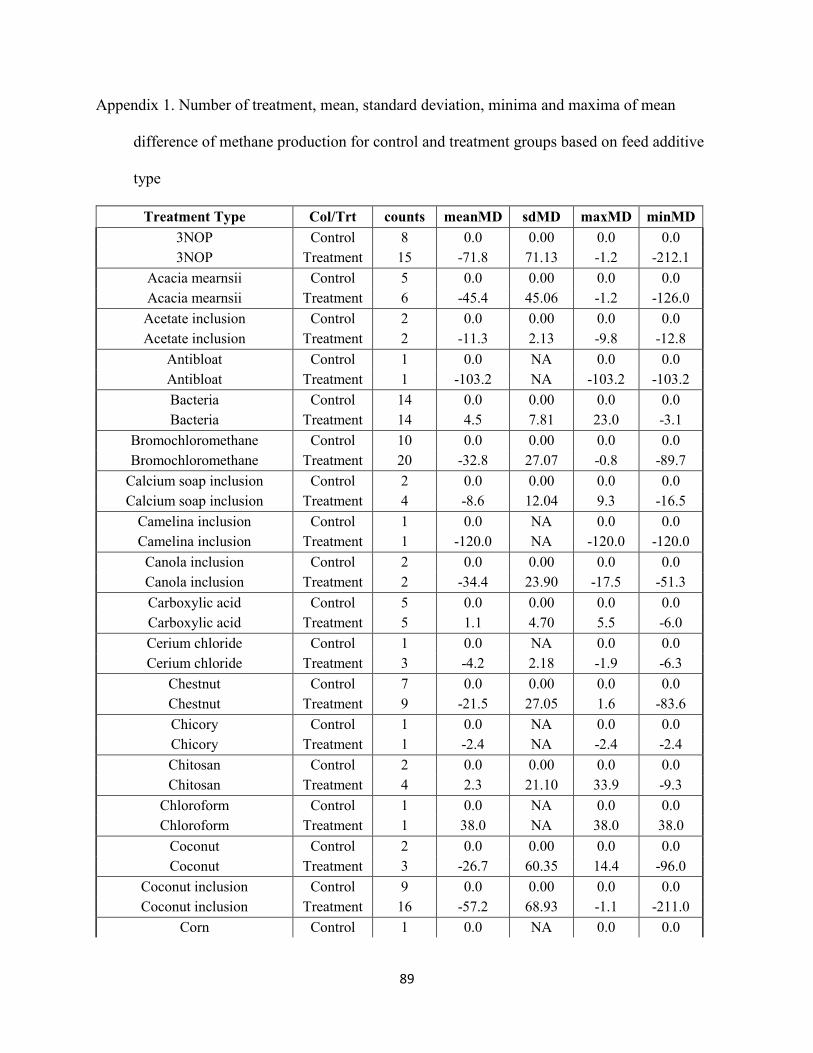
89
Appendix 1. Number of treatment, mean, standard deviation, minima and maxima of mean
difference of methane production for control and treatment groups based on feed additive
type
Treatment Type Col/Trt counts meanMD sdMD maxMD minMD 3NOP Control 8 0.0 0.00 0.0 0.0 3NOP Treatment 15 -71.8 71.13 -1.2 -212.1
Acacia mearnsii Control 5 0.0 0.00 0.0 0.0 Acacia mearnsii Treatment 6 -45.4 45.06 -1.2 -126.0
Acetate inclusion Control 2 0.0 0.00 0.0 0.0 Acetate inclusion Treatment 2 -11.3 2.13 -9.8 -12.8
Antibloat Control 1 0.0 NA 0.0 0.0 Antibloat Treatment 1 -103.2 NA -103.2 -103.2 Bacteria Control 14 0.0 0.00 0.0 0.0 Bacteria Treatment 14 4.5 7.81 23.0 -3.1
Bromochloromethane Control 10 0.0 0.00 0.0 0.0 Bromochloromethane Treatment 20 -32.8 27.07 -0.8 -89.7
Calcium soap inclusion Control 2 0.0 0.00 0.0 0.0 Calcium soap inclusion Treatment 4 -8.6 12.04 9.3 -16.5
Camelina inclusion Control 1 0.0 NA 0.0 0.0 Camelina inclusion Treatment 1 -120.0 NA -120.0 -120.0 Canola inclusion Control 2 0.0 0.00 0.0 0.0 Canola inclusion Treatment 2 -34.4 23.90 -17.5 -51.3 Carboxylic acid Control 5 0.0 0.00 0.0 0.0 Carboxylic acid Treatment 5 1.1 4.70 5.5 -6.0 Cerium chloride Control 1 0.0 NA 0.0 0.0 Cerium chloride Treatment 3 -4.2 2.18 -1.9 -6.3
Chestnut Control 7 0.0 0.00 0.0 0.0 Chestnut Treatment 9 -21.5 27.05 1.6 -83.6 Chicory Control 1 0.0 NA 0.0 0.0 Chicory Treatment 1 -2.4 NA -2.4 -2.4 Chitosan Control 2 0.0 0.00 0.0 0.0 Chitosan Treatment 4 2.3 21.10 33.9 -9.3
Chloroform Control 1 0.0 NA 0.0 0.0 Chloroform Treatment 1 38.0 NA 38.0 38.0
Coconut Control 2 0.0 0.00 0.0 0.0 Coconut Treatment 3 -26.7 60.35 14.4 -96.0
Coconut inclusion Control 9 0.0 0.00 0.0 0.0 Coconut inclusion Treatment 16 -57.2 68.93 -1.1 -211.0
Corn Control 1 0.0 NA 0.0 0.0

90
Corn Treatment 3 26.3 22.74 45.0 1.0 Cumin Control 1 0.0 NA 0.0 0.0 Cumin Treatment 2 -1.8 0.27 -1.6 -1.9
Cysteine Control 4 0.0 0.00 0.0 0.0 Cysteine Treatment 4 -3.5 11.67 8.6 -19.5
DDGS concentrate Control 1 0.0 NA 0.0 0.0 DDGS concentrate Treatment 3 -45.0 8.54 -37.0 -54.0
Defaunation Control 2 0.0 0.00 0.0 0.0 Defaunation Treatment 2 -1.3 0.51 -0.9 -1.6
DHA inclusion Control 3 0.0 0.00 0.0 0.0 DHA inclusion Treatment 5 9.6 21.38 35.0 -23.0
Essential oil blend Control 4 0.0 0.00 0.0 0.0 Essential oil blend Treatment 4 -14.8 16.58 3.8 -36.5
Eucalyptus Control 1 0.0 NA 0.0 0.0 Eucalyptus Treatment 1 -7.2 NA -7.2 -7.2
Eugenol Control 1 0.0 NA 0.0 0.0 Eugenol Treatment 3 -15.7 2.52 -13.0 -18.0
Fatty acid blend inclusion Control 4 0.0 0.00 0.0 0.0 Fatty acid blend inclusion Treatment 9 -23.7 38.30 17.0 -84.0
Fibrolytic enzyme Control 3 0.0 0.00 0.0 0.0 Fibrolytic enzyme Treatment 4 27.0 35.22 74.0 -0.1
Flavomycin Control 1 0.0 NA 0.0 0.0 Flavomycin Treatment 1 -1.9 NA -1.9 -1.9 Flavonoids Control 1 0.0 NA 0.0 0.0 Flavonoids Treatment 1 -2.2 NA -2.2 -2.2
Flaxseed inclusion Control 5 0.0 0.00 0.0 0.0 Flaxseed inclusion Treatment 5 -11.6 31.31 24.0 -58.1
Fumaric acid Control 13 0.0 0.00 0.0 0.0 Fumaric acid Treatment 19 -5.7 9.46 11.3 -27.2
Garlic Control 13 0.0 0.00 0.0 0.0 Garlic Treatment 16 0.3 5.31 15.0 -7.7
Glycerin Control 2 0.0 0.00 0.0 0.0 Glycerin Treatment 6 0.6 5.00 9.9 -4.1
GOS Control 12 0.0 0.00 0.0 0.0 GOS Treatment 12 1.6 6.99 17.2 -8.3
Grape marc Control 1 0.0 NA 0.0 0.0 Grape marc Treatment 2 -88.0 9.90 -81.0 -95.0
Grass Control 3 0.0 0.00 0.0 0.0 Grass Treatment 3 0.5 1.79 2.5 -0.9
Hydrolysable tannins Control 2 0.0 0.00 0.0 0.0 Hydrolysable tannins Treatment 4 3.7 1.55 5.6 1.8 Isobutyrat inclusion Control 1 0.0 NA 0.0 0.0
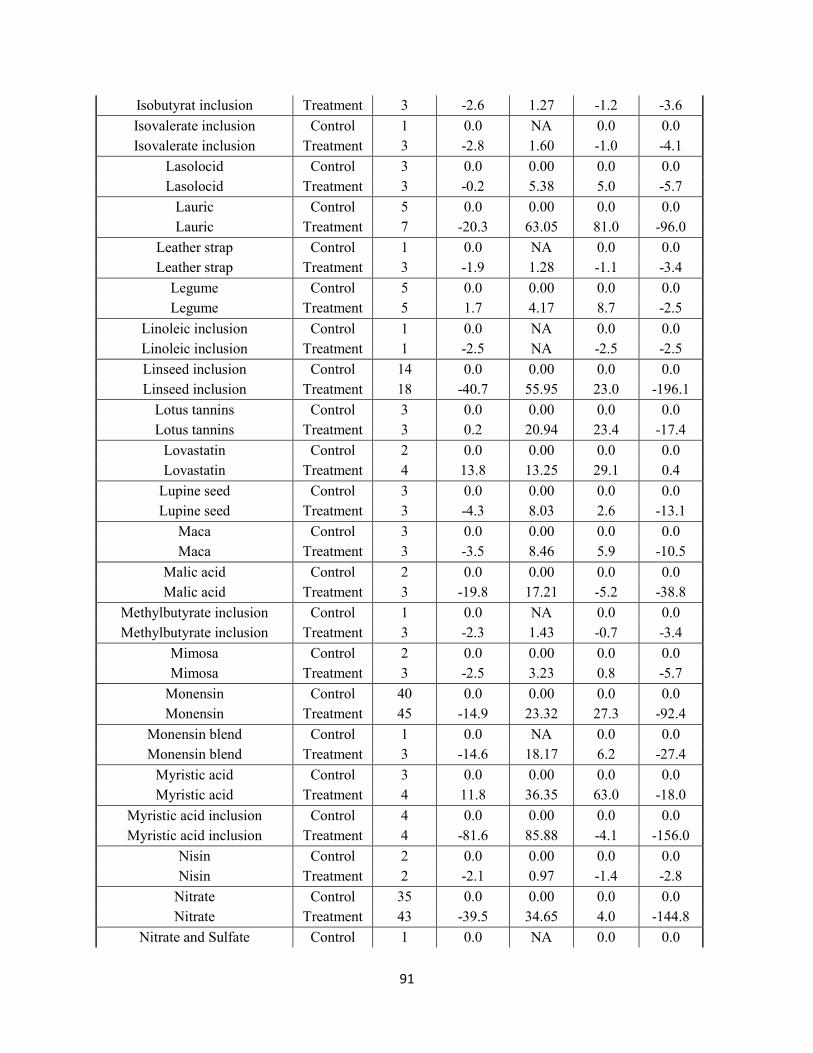
91
Isobutyrat inclusion Treatment 3 -2.6 1.27 -1.2 -3.6 Isovalerate inclusion Control 1 0.0 NA 0.0 0.0 Isovalerate inclusion Treatment 3 -2.8 1.60 -1.0 -4.1
Lasolocid Control 3 0.0 0.00 0.0 0.0 Lasolocid Treatment 3 -0.2 5.38 5.0 -5.7
Lauric Control 5 0.0 0.00 0.0 0.0 Lauric Treatment 7 -20.3 63.05 81.0 -96.0
Leather strap Control 1 0.0 NA 0.0 0.0 Leather strap Treatment 3 -1.9 1.28 -1.1 -3.4
Legume Control 5 0.0 0.00 0.0 0.0 Legume Treatment 5 1.7 4.17 8.7 -2.5
Linoleic inclusion Control 1 0.0 NA 0.0 0.0 Linoleic inclusion Treatment 1 -2.5 NA -2.5 -2.5 Linseed inclusion Control 14 0.0 0.00 0.0 0.0 Linseed inclusion Treatment 18 -40.7 55.95 23.0 -196.1
Lotus tannins Control 3 0.0 0.00 0.0 0.0 Lotus tannins Treatment 3 0.2 20.94 23.4 -17.4
Lovastatin Control 2 0.0 0.00 0.0 0.0 Lovastatin Treatment 4 13.8 13.25 29.1 0.4
Lupine seed Control 3 0.0 0.00 0.0 0.0 Lupine seed Treatment 3 -4.3 8.03 2.6 -13.1
Maca Control 3 0.0 0.00 0.0 0.0 Maca Treatment 3 -3.5 8.46 5.9 -10.5
Malic acid Control 2 0.0 0.00 0.0 0.0 Malic acid Treatment 3 -19.8 17.21 -5.2 -38.8
Methylbutyrate inclusion Control 1 0.0 NA 0.0 0.0 Methylbutyrate inclusion Treatment 3 -2.3 1.43 -0.7 -3.4
Mimosa Control 2 0.0 0.00 0.0 0.0 Mimosa Treatment 3 -2.5 3.23 0.8 -5.7
Monensin Control 40 0.0 0.00 0.0 0.0 Monensin Treatment 45 -14.9 23.32 27.3 -92.4
Monensin blend Control 1 0.0 NA 0.0 0.0 Monensin blend Treatment 3 -14.6 18.17 6.2 -27.4
Myristic acid Control 3 0.0 0.00 0.0 0.0 Myristic acid Treatment 4 11.8 36.35 63.0 -18.0
Myristic acid inclusion Control 4 0.0 0.00 0.0 0.0 Myristic acid inclusion Treatment 4 -81.6 85.88 -4.1 -156.0
Nisin Control 2 0.0 0.00 0.0 0.0 Nisin Treatment 2 -2.1 0.97 -1.4 -2.8
Nitrate Control 35 0.0 0.00 0.0 0.0 Nitrate Treatment 43 -39.5 34.65 4.0 -144.8
Nitrate and Sulfate Control 1 0.0 NA 0.0 0.0

92
Nitrate and Sulfate Treatment 1 -7.8 NA -7.8 -7.8 Nitroethane Control 2 0.0 0.00 0.0 0.0 Nitroethane Treatment 5 -53.8 41.67 -28.6 -127.9
Oregano Control 3 0.0 0.00 0.0 0.0 Oregano Treatment 5 -127.7 120.56 -2.4 -298.0
Peppermint Control 1 0.0 NA 0.0 0.0 Peppermint Treatment 1 -27.5 NA -27.5 -27.5
Polyethylene glycol Control 4 0.0 0.00 0.0 0.0 Polyethylene glycol Treatment 4 15.5 22.08 48.4 2.7
Propanediol Control 1 0.0 NA 0.0 0.0 Propanediol Treatment 1 -1.7 NA -1.7 -1.7
Proteolytic enzyme Control 1 0.0 NA 0.0 0.0 Proteolytic enzyme Treatment 1 -9.3 NA -9.3 -9.3
Quebracho Control 2 0.0 0.00 0.0 0.0 Quebracho Treatment 6 -15.7 19.68 3.0 -41.1
Rumen protected FA inclusion Control 1 0.0 NA 0.0 0.0 Rumen protected FA inclusion Treatment 1 -33.7 NA -33.7 -33.7
Rumen protected fat Control 1 0.0 NA 0.0 0.0 Rumen protected fat Treatment 1 -1.4 NA -1.4 -1.4
Saifoin maturity Control 2 0.0 0.00 0.0 0.0 Saifoin maturity Treatment 2 24.0 1.41 25.0 23.0 Saifoin tannins Control 1 0.0 NA 0.0 0.0 Saifoin tannins Treatment 5 -5.6 13.97 7.0 -23.0
Saponaria Control 3 0.0 0.00 0.0 0.0 Saponaria Treatment 3 -16.6 13.99 -4.5 -31.9
Sericea lespedeza tannins Control 4 0.0 0.00 0.0 0.0 Sericea lespedeza tannins Treatment 4 -3.2 1.01 -2.0 -4.1
Sodium bicarbonate Control 1 0.0 NA 0.0 0.0 Sodium bicarbonate Treatment 1 -3.3 NA -3.3 -3.3
Sorghum tannins Control 6 0.0 0.00 0.0 0.0 Sorghum tannins Treatment 6 1.5 2.15 4.1 -0.9
Soybean oil inclusion Control 2 0.0 0.00 0.0 0.0 Soybean oil inclusion Treatment 2 -0.5 1.79 0.7 -1.8
Stearic Control 5 0.0 0.00 0.0 0.0 Stearic Treatment 7 -8.8 61.32 81.0 -96.0
Styzolobium tannins Control 1 0.0 NA 0.0 0.0 Styzolobium tannins Treatment 1 -0.1 NA -0.1 -0.1
Sucrose Control 1 0.0 NA 0.0 0.0 Sucrose Treatment 1 0.0 NA 0.0 0.0 Sulfate Control 1 0.0 NA 0.0 0.0 Sulfate Treatment 1 -5.4 NA -5.4 -5.4
Sulla tannins Control 4 0.0 0.00 0.0 0.0

93
Sulla tannins Treatment 4 -0.3 4.99 5.1 -6.1 Sunflower inclusion Control 3 0.0 0.00 0.0 0.0 Sunflower inclusion Treatment 4 -34.3 26.25 -1.7 -57.8
Sunphenon Control 1 0.0 NA 0.0 0.0 Sunphenon Treatment 3 -4.1 2.91 -1.8 -7.4
Tallow inclusion Control 1 0.0 NA 0.0 0.0 Tallow inclusion Treatment 1 -24.0 NA -24.0 -24.0
Tea saponin Control 6 0.0 0.00 0.0 0.0 Tea saponin Treatment 6 -6.3 7.50 -0.7 -18.3
Triiodothyronine Control 2 0.0 0.00 0.0 0.0 Triiodothyronine Treatment 2 -0.7 1.94 0.7 -2.1
Valonea Control 2 0.0 0.00 0.0 0.0 Valonea Treatment 2 0.2 1.37 1.1 -0.8
Vitacogen Control 2 0.0 0.00 0.0 0.0 Vitacogen Treatment 2 5.2 9.63 12.0 -1.6
Yeast Control 9 0.0 0.00 0.0 0.0 Yeast Treatment 9 -9.9 16.77 7.2 -42.0 Yucca Control 9 0.0 0.00 0.0 0.0 Yucca Treatment 12 -2.0 4.81 6.7 -12.2

94
Appendix 2. Summary of manure additives investigated in this study.
Additives Type Ingredient Reference Year Species
Meta-analysis inclusion
Acidification
aluminum sulfate Regueiro et al. 2016 pig Yes calcium superphosphate Zhang, et al. 2017 pig No food industrial waste Samer, et al. 2014 dairy Yes hydrochloric acid Petersen, et al. 2012 cattle No lactic acid Berg, et al. 2006 cattle No methionine Petersen, et al. 2012 cattle No nitric acid Berg, et al. 2006 cattle No
phosphogypsum Hao, et al. 2005 cattle No Luo, et al. 2013 pig No
sulfate Petersen, et al. 2012 cattle No
sulfuric acid Misselbrook, et al. 2016 cattle No Owusu-Twum, et al 2017 cattle No Wang, et al. 2014 pig No
wood vinegar Wang, et al. 2018 pig No
Adsorbent zeolite
Wheeler, et al. 2010 dairy No Wang, et al. 2018 pig No
clay Chen, et al. 2018 chicken No
Biochar
bamboo Chen, et al. 2017 hen No Liu, et al. 2017 hen No He, et al. 2019 pig No
charcoal Chowdhury, et al. 2014 hen Yes coir Chen, et al. 2017 hen No cornstalk Chen, et al. 2017 hen No greenwaste Agyarko-Mintah, et al. 2017 poultry Yes layer manure Chen, et al. 2017 hen No poultry litter Agyarko-Mintah, et al. 2017 poultry Yes rice hull Jia, et al. 2016 chicken No rice straw He, et al. 2019 pig No woody Chen, et al. 2017 hen No N/A Vandecasteele 2016 chicken Yes N/A Sonoki, et al 2011 cattle No N/A Mao, et al. 2018 pig No N/A Wang, et al. 2018 pig No N/A Chowdhury, et al. 2014 animal No
Biological materials
EU200 Owusu-Twum, et al 2017 cattle No Biobuster Owusu-Twum, et al 2017 cattle No Biosuper Martinez, et al. 2003 pig No
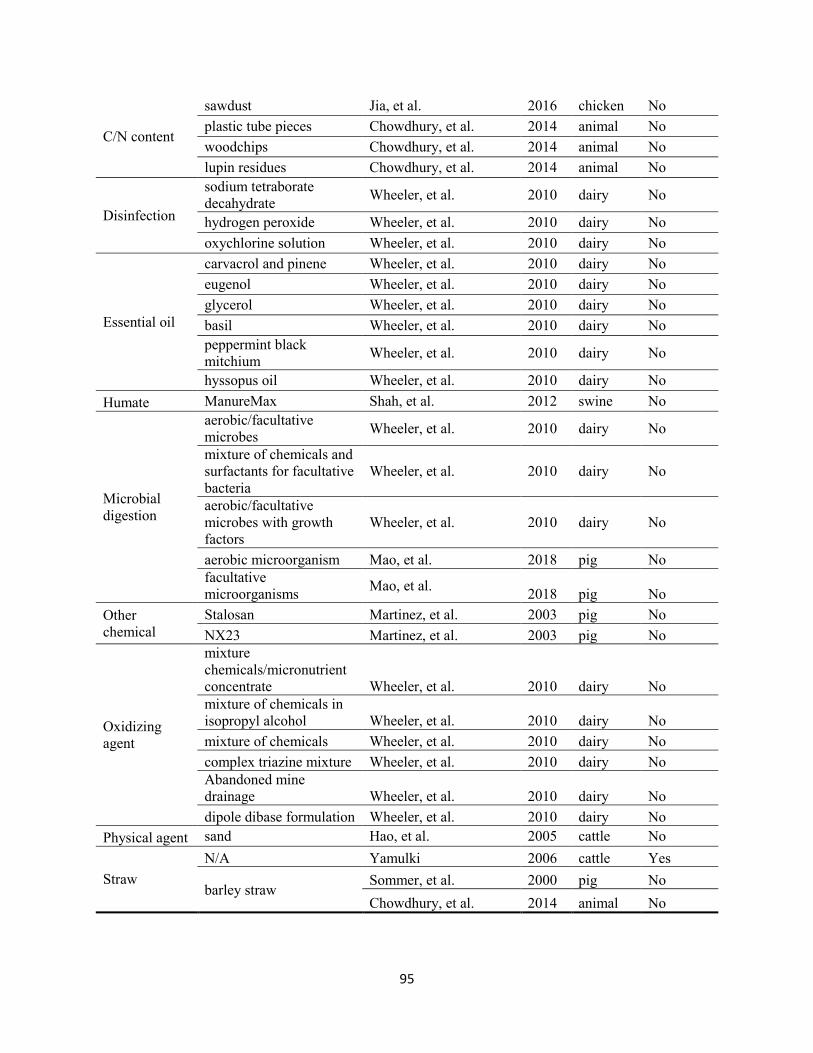
95
C/N content
sawdust Jia, et al. 2016 chicken No plastic tube pieces Chowdhury, et al. 2014 animal No woodchips Chowdhury, et al. 2014 animal No lupin residues Chowdhury, et al. 2014 animal No
Disinfection
sodium tetraborate decahydrate Wheeler, et al. 2010 dairy No
hydrogen peroxide Wheeler, et al. 2010 dairy No oxychlorine solution Wheeler, et al. 2010 dairy No
Essential oil
carvacrol and pinene Wheeler, et al. 2010 dairy No eugenol Wheeler, et al. 2010 dairy No glycerol Wheeler, et al. 2010 dairy No basil Wheeler, et al. 2010 dairy No peppermint black mitchium Wheeler, et al. 2010 dairy No
hyssopus oil Wheeler, et al. 2010 dairy No Humate ManureMax Shah, et al. 2012 swine No
Microbial digestion
aerobic/facultative microbes Wheeler, et al. 2010 dairy No
mixture of chemicals and surfactants for facultative bacteria
Wheeler, et al. 2010 dairy No
aerobic/facultative microbes with growth factors
Wheeler, et al. 2010 dairy No
aerobic microorganism Mao, et al. 2018 pig No facultative microorganisms Mao, et al. 2018 pig No
Other chemical
Stalosan Martinez, et al. 2003 pig No NX23 Martinez, et al. 2003 pig No
Oxidizing agent
mixture chemicals/micronutrient concentrate Wheeler, et al. 2010 dairy No mixture of chemicals in isopropyl alcohol Wheeler, et al. 2010 dairy No mixture of chemicals Wheeler, et al. 2010 dairy No complex triazine mixture Wheeler, et al. 2010 dairy No Abandoned mine drainage Wheeler, et al. 2010 dairy No dipole dibase formulation Wheeler, et al. 2010 dairy No
Physical agent sand Hao, et al. 2005 cattle No
Straw N/A Yamulki 2006 cattle Yes
barley straw Sommer, et al. 2000 pig No Chowdhury, et al. 2014 animal No

96