strategies to ensure quality of client services within a finite budget
DESCRIPTION
Statewide Managers’ Meeting November 5-6, 2014 Sandy Williams Barbara Burkett. Strategies To Ensure Quality of Client Services Within A Finite Budget. Objectives of This Session. I. Overview of Critical Issues A. SFY15 Budget-Williams 1 . SFY15 Basic VR Budget - PowerPoint PPT PresentationTRANSCRIPT

Strategies To Ensure Quality of Client Services Within A Finite Budget
Statewide Managers’ Meeting November 5-6, 2014
Sandy WilliamsBarbara Burkett

Objectives of This Session
I. Overview of Critical IssuesA. SFY15 Budget-Williams
1. SFY15 Basic VR Budget 2. Carry Over SFY14 Budget 3. Monthly Distribution
4. Spending Goals Versus Actual Spending SFY15 Year to Date 5. SFY15 Predictions
B. Supported Employment Expenditures-Burkett
1. Supported Employment SFY15 Expenditures Year to Date2. Subcategories of Supported Employment Expenditures3. Situational Assessment4. Job Development5. Placement and Training
C. Over Authorizations-Burkett
II. Strategies to Implement to Control Expenditures and Provide Quality Services -Discussion
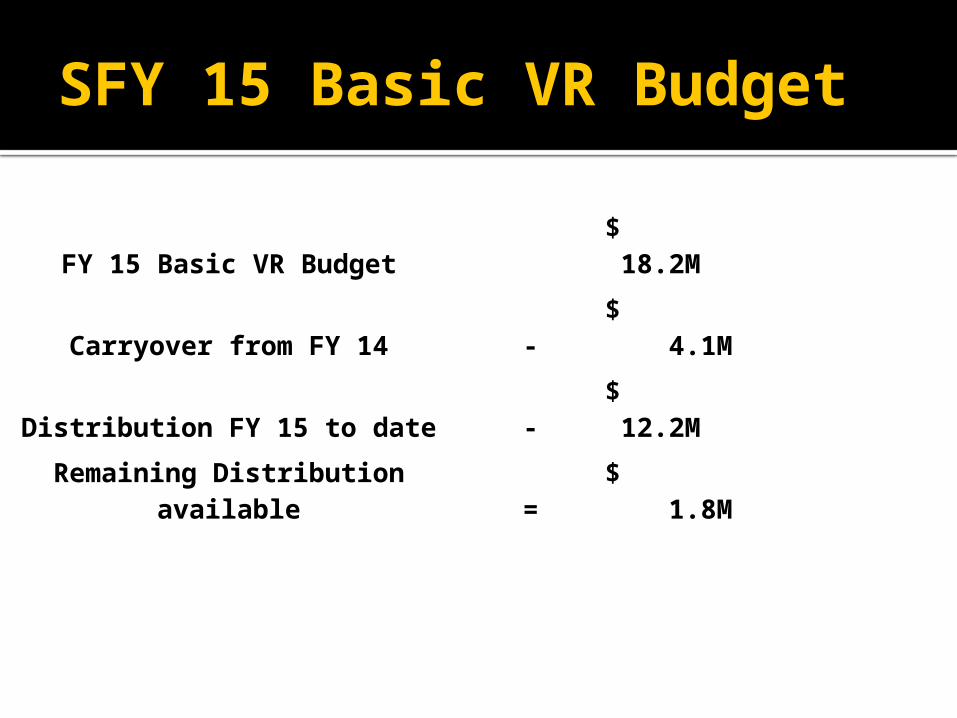
SFY 15 Basic VR Budget
FY 15 Basic VR Budget $ 18.2M
Carryover from FY 14 - $ 4.1M
Distribution FY 15 to date - $ 12.2M
Remaining Distribution available = $ 1.8M

Carryover from SFY 14FY 15 Basic VR Budget $ 18.2MCarryover from FY 14 - $ 4.1M
Distribution FY 15 to date - $ 12.2MRemaining Distribution available = $ 1.8M
Highest since 2008 (between 1.1M – 1.85)

Breakout of Monthly Distributions
FY 15 Basic VR Budget $ 18.2MCarryover from FY 14 - $ 4.1M
Distribution FY 15 to date - $ 12.2MRemaining Distribution available = $ 1.8M
Jul-14 Aug-14 Sep-14 Oct-14 Nov-14Statewide Distribution 3.4 M 3.1 M 2.3 M 1.9 M 1.3 M
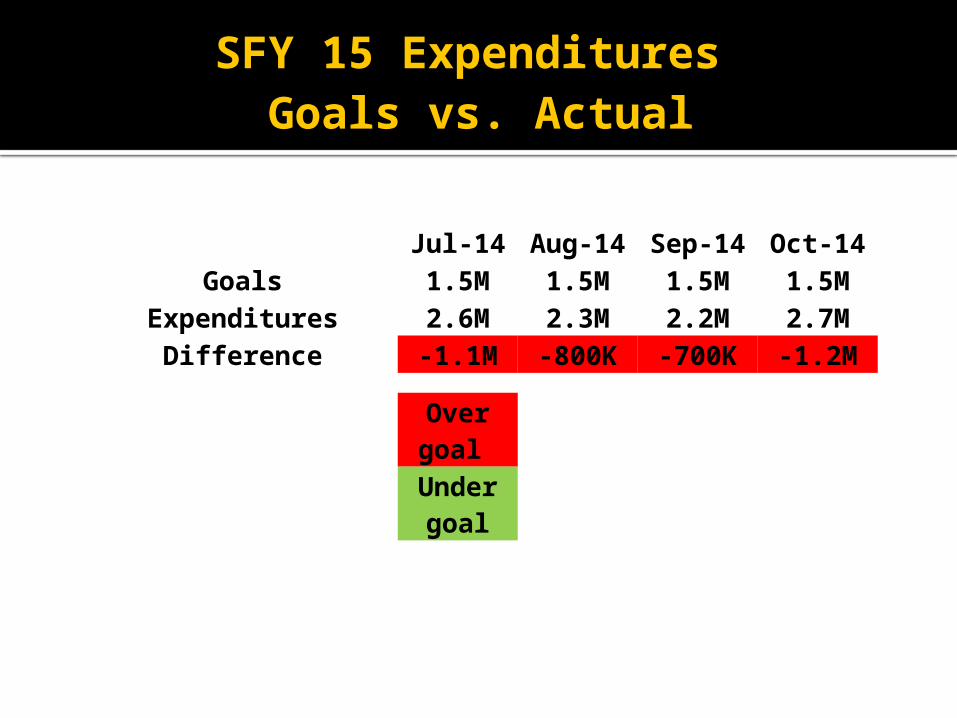
SFY 15 Expenditures Goals vs. Actual
Jul-14 Aug-14 Sep-14 Oct-14Goals 1.5M 1.5M 1.5M 1.5M
Expenditures 2.6M 2.3M 2.2M 2.7MDifference -1.1M -800K -700K -1.2M
Over goal Under goal

SFY15 Budget Predictions
The budget for case services for SFY15 is 18.2M
If we continue to spend at the rate we have for the 1st quarter, we predict we would need 30M for SFY15

Clients Currently Open As of November 3, 2014 = 19,983Compares to 18,331 Clients November 2013
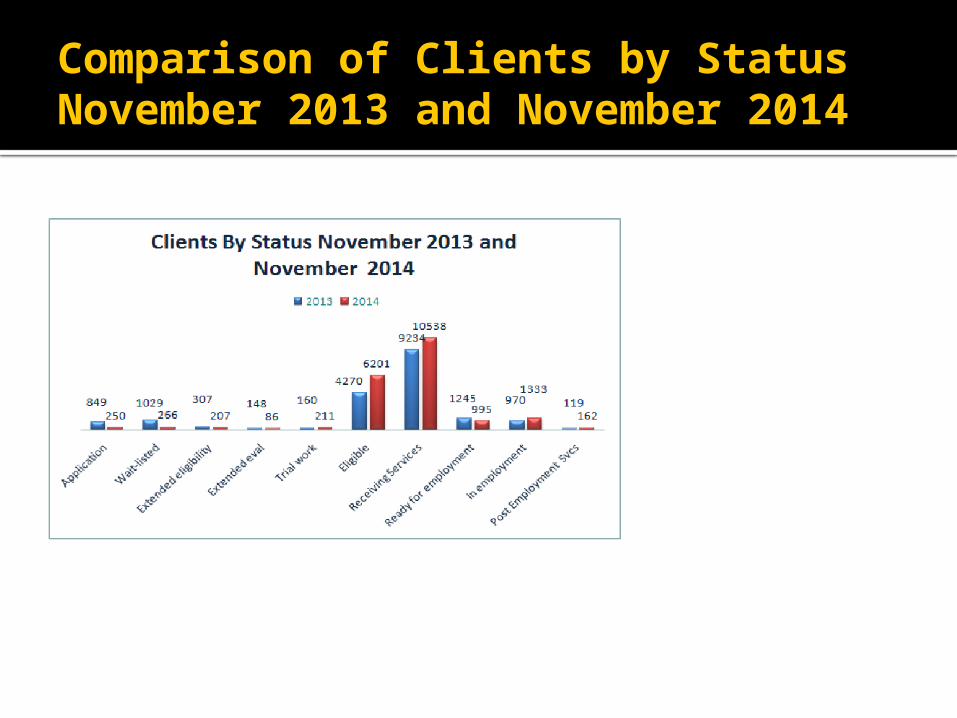
Comparison of Clients by Status November 2013 and November 2014

Average Cost Per Client In FFY14 and Estimated Cost if System Were to Remain Static as of November 2014
Status Average Cost per client in 2014
Median Cost per Client in 2014
Clients As of November 2014
Estimated Cost for FFY15 With System Static
In employment $2,072.14 $1,131.21 1333 $2,762,162.62
Receiving Services $1,855.94 $ 990.97 10538 $19,557,895.72
Ready for employment $1,768.45 $1,149.48 995 $1,759,607.75
Post Employment Svcs $1,371.91 $ 750.00 162 $222,249.42
Extended eligibility $1,144.99 $ 901.25 207 $237,012.93
Trial work $1,076.55 $ 777.62 211 $227,152.05
Extended eval $879.13 $ 425.50 86 $75,605.18
Eligible $500.51 $ 168.00 6201 $3,103,662.51
Application $180.87 $ 29.00 250 $45,217.50
Wait-listed $109.61 $ 20.00 207 $22,689.27
Predicted Expenditures if System remains Static $28,013,254.95

Supported Employment and Job Coach Training Account for 65.3% of All Expenditures Statewide With 4.5
Million Spent SFY15
Expenditures SFY 2015 July 1 - Oct. 21, 2014
Northern Central Eastern Southwest Total
Supported Employment and Job Coach Training Expenditures SFY15 ytd
$1,759,401.0871.8%
$1,082,254.1565.4%
$1,290,692.3670.8%
$411,737.1440.0%
$4,544,084.73
65.3%
Total Expenditures SFY15 ytd $2,451,167.80 $1,655,621.08 $1,823,968.40 $1,030,200.79 $6,960,958.07
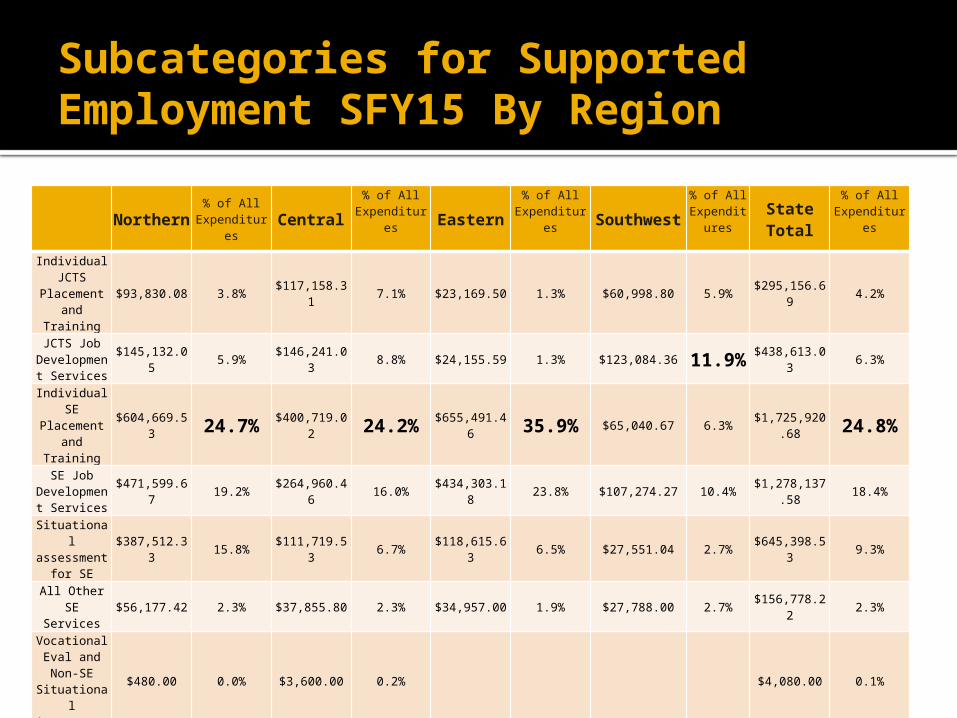
Subcategories for Supported Employment SFY15 By Region
Northern % of All Expenditures Central
% of All Expenditures Eastern
% of All Expenditures Southwest
% of All Expenditur
esState Total
% of All Expenditures
Individual JCTS
Placement and Training
$93,830.08 3.8% $117,158.31 7.1% $23,169.50 1.3% $60,998.80 5.9% $295,156.69 4.2%
JCTS Job Development
Services$145,132.05 5.9% $146,241.03 8.8% $24,155.59 1.3% $123,084.36 11.9% $438,613.03 6.3%
Individual SE Placement
and Training$604,669.53 24.7% $400,719.02 24.2% $655,491.46 35.9% $65,040.67 6.3% $1,725,920.68 24.8%
SE Job Development
Services$471,599.67 19.2% $264,960.46 16.0% $434,303.18 23.8% $107,274.27 10.4% $1,278,137.58 18.4%
Situational assessment
for SE$387,512.33 15.8% $111,719.53 6.7% $118,615.63 6.5% $27,551.04 2.7% $645,398.53 9.3%
All Other SE Services
$56,177.42 2.3% $37,855.80 2.3% $34,957.00 1.9% $27,788.00 2.7% $156,778.22 2.3%
Vocational Eval and Non-SE Situational Assessment
$480.00 0.0% $3,600.00 0.2% $4,080.00 0.1%
Total $1,759,401.08 71.8% $1,082,254.15 65.4% $1,290,692.36 70.8% $411,737.14 40.0% $4,544,084.73 65.3%

Currently there are 197 clients who have been in situational assessment 40 or more days at a cost of $811,867.59
Case Master ID Counselor Office
Days in Situational
Assessment
Amount spent on Situational Assessment
Most Recent Situational
Assessment Current Status
432527 104 Danville 66 $4,064.58 07/18/2014Receiving Services
421599 104 Danville 67 $4,042.28 10/11/2011Receiving Services
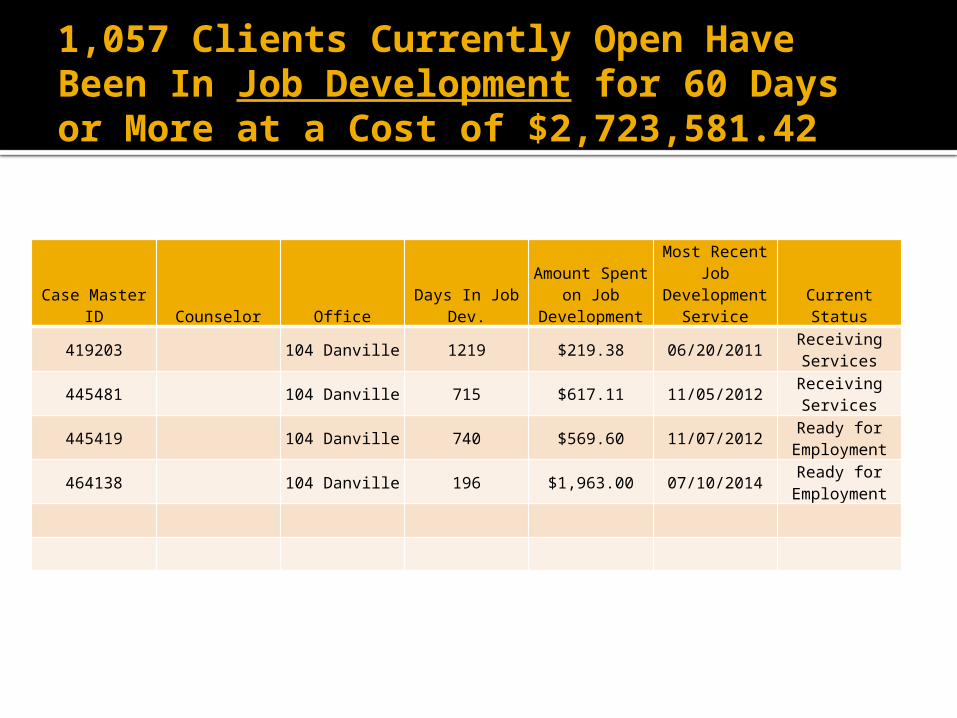
1,057 Clients Currently Open Have Been In Job Development for 60 Days or More at a Cost of $2,723,581.42
Case Master ID Counselor Office Days In Job Dev.
Amount Spent on Job
Development
Most Recent Job Development
Service Current Status
419203 104 Danville 1219 $219.38 06/20/2011Receiving Services
445481 104 Danville 715 $617.11 11/05/2012Receiving Services
445419 104 Danville 740 $569.60 11/07/2012Ready for
Employment
464138 104 Danville 196 $1,963.00 07/10/2014Ready for
Employment
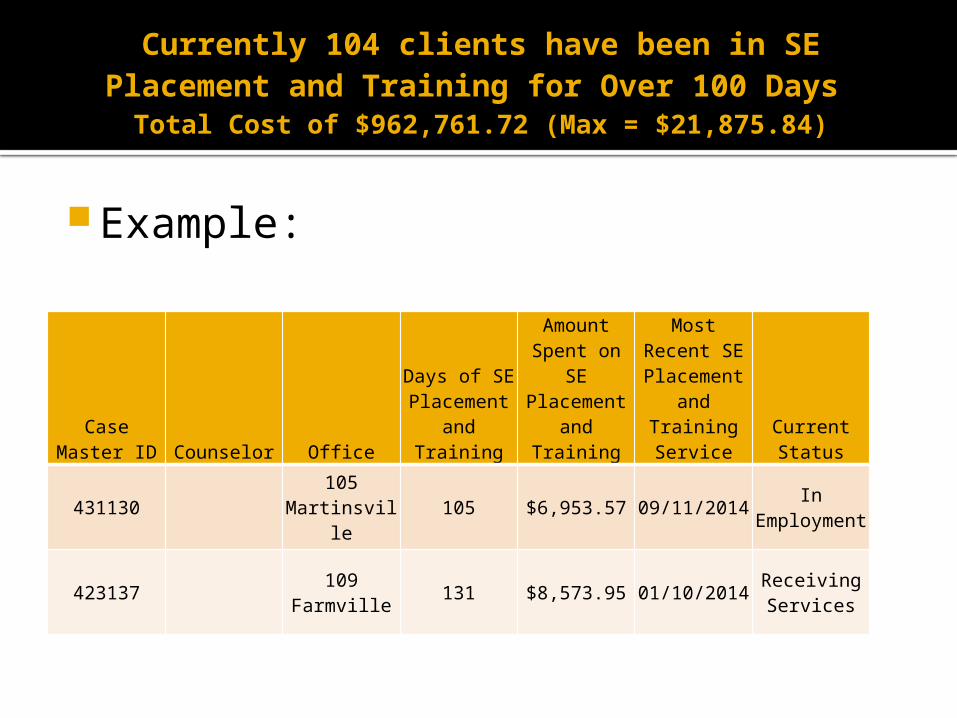
Currently 104 clients have been in SE Placement and Training for Over 100 Days
Total Cost of $962,761.72 (Max = $21,875.84)
Example:
Case Master ID Counselor Office
Days of SE Placement
and Training
Amount Spent on SE Placement
and Training
Most Recent SE
Placement and Training
ServiceCurrent Status
431130105
Martinsville105 $6,953.57 09/11/2014
In Employment
423137 109 Farmville 131 $8,573.95 01/10/2014Receiving Services

Tools to Assist You In Decision Making
Vendor score card shows you average cost and time to successful closure for each vendor along with type of jobs clients receive.
75% of our successful clients move from a supported employment service to “in employment status” within 4 months.
Strategies To Keep In Mind
Should there be a maximum number of hours before case is flagged for some type of action?
If so when?
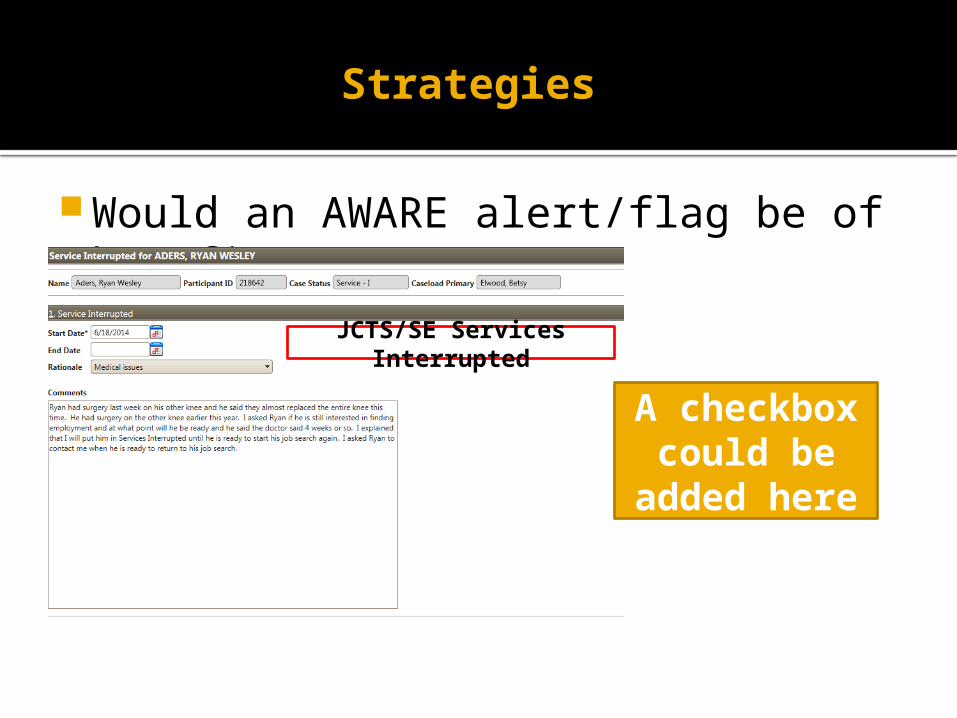
Strategies
Would an AWARE alert/flag be of benefit?
A checkbox could be added
here
JCTS/SE Services Interrupted
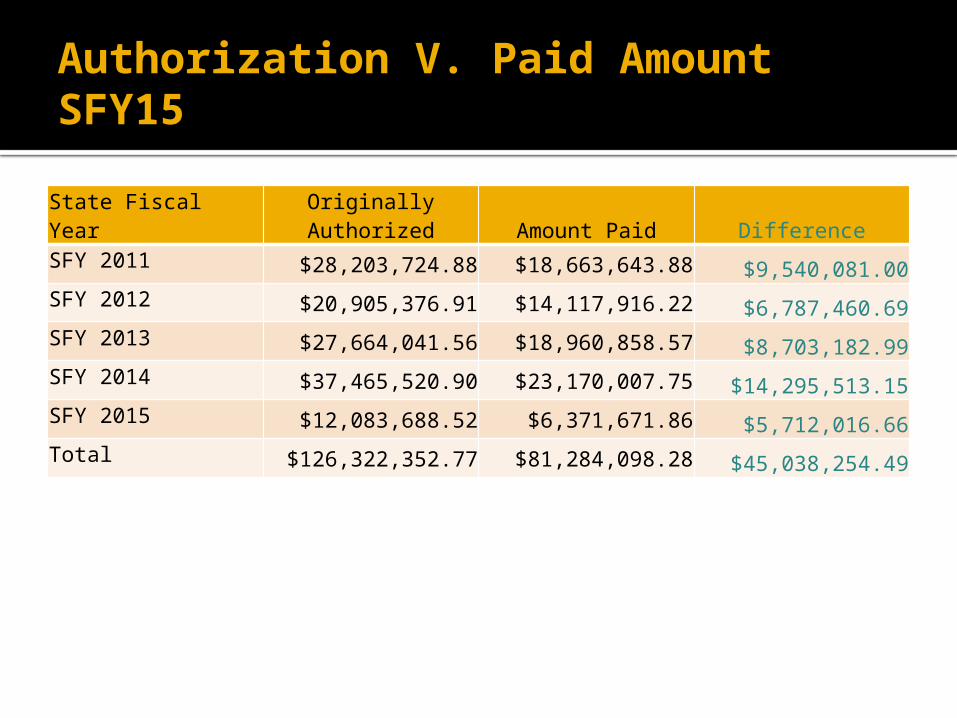
Authorization V. Paid Amount SFY15
State Fiscal Year Originally Authorized Amount Paid DifferenceSFY 2011 $28,203,724.88 $18,663,643.88 $9,540,081.00SFY 2012 $20,905,376.91 $14,117,916.22 $6,787,460.69SFY 2013 $27,664,041.56 $18,960,858.57 $8,703,182.99SFY 2014 $37,465,520.90 $23,170,007.75 $14,295,513.15SFY 2015 $12,083,688.52 $6,371,671.86 $5,712,016.66Total $126,322,352.77 $81,284,098.28 $45,038,254.49

Over-authorizing in Group Auth
July 2014$801K

Over-authorizing in Individual Auths
July 2014$170K
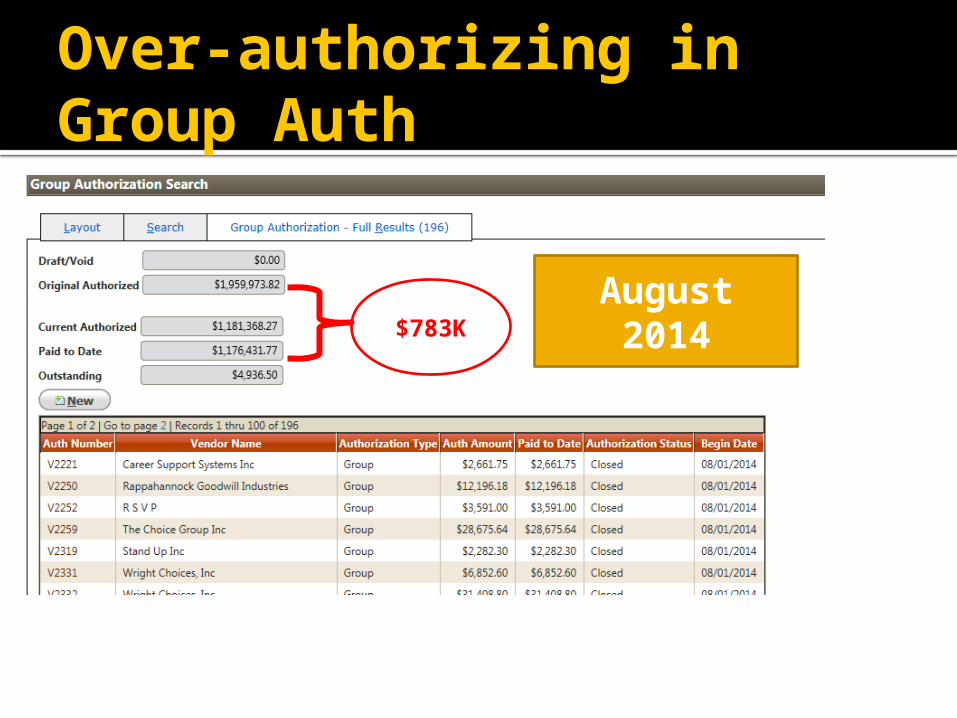
Over-authorizing in Group Auth
August 2014$783K

Over-authorizing in Individual
August 2014$154K
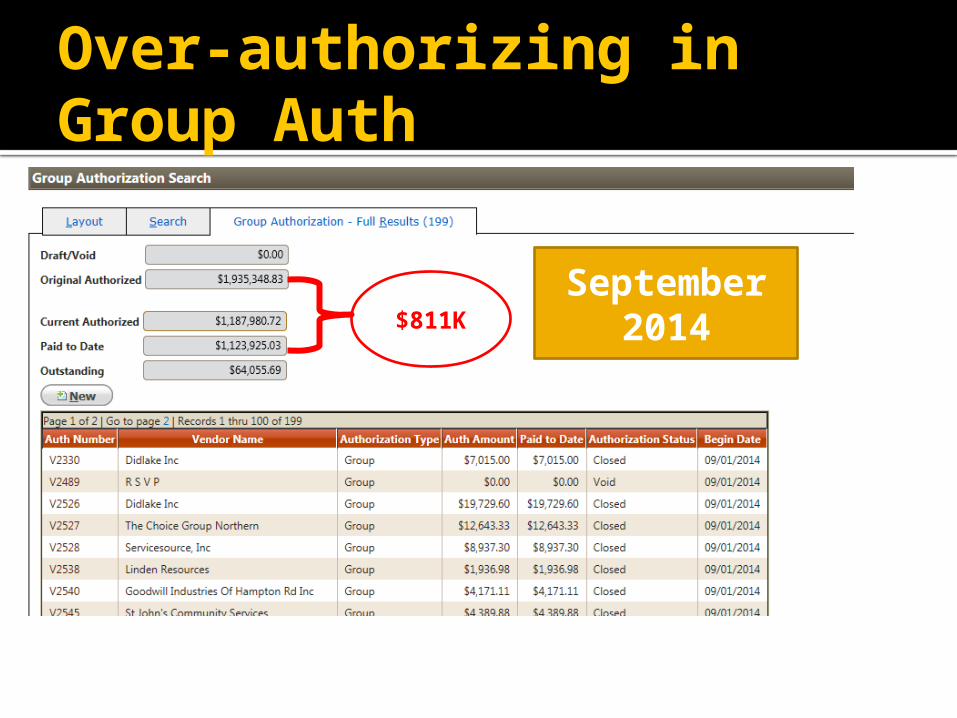
Over-authorizing in Group Auth
September 2014$811K

Over-authorizing in Individual
September 2014
$195K

1st Quarter Over Authorizing
Jul-14 Aug-14 Sep-14Group 801K 783K 811K
Individual 170K 154K 195KTOTAL 971K 937K 1.006M

Exercise
What are some strategies to reduce spending for supported employment?
What are some strategies to reduce over authorizations?
Other thoughts?