strategies for high end high rise residential property
TRANSCRIPT

International Journal of Property Science Vol 8 Issue 1 2018
27
e-issn:
2229-8568
2229-
8568
e-issn: 2229-8568
Strategies for High End High Rise Residential Property Using
Marketing Mix during a Soft Market in Kuala Lumpur
Anuar Alias, Zafirah Al Sadat Zyed, Chong Sze Ning
Department of Estate Management, Faculty of Built Environment, University of Malaya
*Corresponding author: [email protected]
Abstract
Developers face challenges and issues to sell properties when soft market happens. Thus, effective
strategies must be identified to reach out to potential buyers. According to the information obtained
from National Property Information Centre (NAPIC), the percentage of overhang and unsold high end
high rise residential properties in Kuala Lumpur experienced drastic increase in recent years. The aim
of this study is to identify developer’s strategies within the marketing mix for high end high rise
residential property in soft property market. This study is designed to investigate feedback of house
buyers in Kuala Lumpur towards developer’s strategies implemented in soft property market.
Questionnaire survey was adopted in this study. The questionnaire is designed in accordance to
buyers’ perspective on developer’s strategies based on the “Marketing Mix” which consists of price,
product, place and promotion. The respondents’ feedback is important for the analysis of developer’s
strategies. The findings show that when soft market happens, the features of the product are the most
important factor in house purchase. Therefore, the elements under product should be focused to
complement other segments of marketing mix especially price strategy.
Keywords: soft market, high end high rise residential properties, effective strategies, marketing mix
1.0 INTRODUCTION The Chartered Institute of Marketing (CIM), UK (2016) defined marketing as “the
management process responsible for identifying, anticipating and satisfying customer requirements
profitably”. Scott (2016) stated that marketing requires understanding towards your buyers and solve
their problems by creating valuable products, services, and information for them. Developers are
aware of the importance of marketing and its influence of mass exposure to the public. Proper market
study must be done to create effective marketing strategies. The function of marketing strategies is to
concentrate on target customers to maximize profit in shortest time span.
Effective strategies certainly play a vital role in attracting purchasers especially in soft market
where the market has more sellers than buyers. The house buyers hold negotiation power in property
transaction. Thus, the attractiveness of marketing strategies will indirectly affect the developers to
uphold soft high end residential property market. The aim of this study is to identify developer’s
strategies within the marketing mix for high end high rise residential property in soft property market.
Residential property has always been preferred investment in real estate. The residential property
performance is getting sluggish but the market demand for residential property is going strong.
Therefore, the developers should compete smartly to survive in the buyer’s market. This research will
contribute to the study of developer’s strategies in soft market to improve poor residential sales
performance.

International Journal of Property Science Vol 8 Issue 1 2018
28
e-issn:
2229-8568
2229-
8568
e-issn: 2229-8568
2.0 LITERATURE REVIEW
High end high rise residential property refers to condominiums which are more than 10 floors
located in prime area of the city. Condominiums are built in with facilities, amenities and safety
features (Seo and Omar, 2010). According to CAGAMAS (2013), high end residential property is
range at RM500,000 to 1 million. Reduction of price occurs due to excessive supply when the demand
is limited. Marketing strategies are the effective marketing activities to obtain desire outcome from the
target market. Thus, marketing mix comprising of price, place, promotion and product is very
important in a sale driven real estate environment.
2.1 Property Market in General
The performance of economy will affect the property market. The real estate market fluctuates up and
down according to the theory of “multi-layered real estate cake” (Lundquist, 2007) The analogy stated
that the value of real estate is impacted by the factors of macro-economy and micro-economy by
creating ripple effect throughout the real estate market.
According to Ishak (2013), there are three phases in the formation of property bubble:
Phase 1 – Property value increase rapidly. (During year 2010 to year 2014)
Phase 2 – Property value is beyond affordable at above 3 times of median annual income. Malaysia is
about 5.5 times of median annual income which indicates “severely unaffordable”.
Phase 3 - Property value declines and bubble burst.
2.2 Residential Market Performance in Kuala Lumpur
According to Overview of the Property Market Report First Half 2016 for Kuala Lumpur by
NAPIC (2016), the sign of soft residential market is distinctive with poor transaction performance
these few years. For instance, Figure 1 illustrates the residential sales performance in Kuala Lumpur is
weakening by -14.5% of poor transacted sales. As for Figure 2, it shows that overhang and unsold
properties increase throughout the years and achieve the peak at 2016. Therefore, developers have
been using marketing strategies to sell off overhang and unsold properties.
Figure 1: Residential market performance in Kuala Lumpur
Source: NAPIC, 2016

International Journal of Property Science Vol 8 Issue 1 2018
29
e-issn:
2229-8568
2229-
8568
e-issn: 2229-8568
Figure 2: Residential unsold status in Kuala Lumpur
Source: NAPIC, 2016
Table 1 shows the performance of high rise residential properties performance in Kuala
Lumpur. The overall performance is relatively bad, indicated by the declining trend in terms of
transaction activity, price and occupancy rate.
Table 1: Performance of high rise residential properties in Kuala Lumpur
Source: CH Williams Talhar & Wong Property Market 2016
New constructions are reducing and generate at a slower pace. Productions are decreasing as
the current stocks are still holding in the market. This shows that unsold units are increasing and
sluggish market is happening. Property prices decreased gradually but most of the properties still
maintain at their selling price. (MIER's Residential Property Survey Report 4Q 2015, 2016).
2.3 Soft Market in Kuala Lumpur
According to DBS group research on Kuala Lumpur property market, the analysis showed few
property trends and performances such as strong demand for affordable landed properties and
developers boost sales in poor sentiment using marketing strategies (Quah, 2016).
This study is supported by Knight Frank research in 2015 (Knight Frank Real Estate
Highlights (2015) that showed the construction of high end condominiums in Kuala Lumpur will be
deferred due to the weak market sentiment and massive incoming supply. The competitions for
existing and upcoming supply have caused the selling prices and rental to be stagnant. Therefore, the
developers are using innovative products and promotion strategies with creative financial deals such as
offering leaseback arrangements, pool management program and guaranteed rental returns in this
challenging market to attract house buyers. Figure 3 illustrates the formation of soft market in Kuala
Lumpur:

International Journal of Property Science Vol 8 Issue 1 2018
30
e-issn:
2229-8568
2229-
8568
e-issn: 2229-8568
Figure 3: Formation of soft market in Kuala Lumpur
2.4 Characteristics of Soft Market
According to Kiplinger (2014), real estate is related to the force of supply and demand. Wide
variety of properties for buyers’ selection will lead to lower property prices. Soft market happened
from the outlook of macroeconomic due to:
2.4.1 Weak Economy
Gross Domestic Product (GDP) is the economy health indicator through the analysis of
income approach or expenditure approach. GDP is used to indicate the economy performance of
previous quarter or year. Therefore, strong economy performance will indicate higher percentage
(Investopedia, 2016). The GDP of Malaysia declines starting from July 2014 by 6.5 to 4 in July 2016
which indicates the weak economy (Trading Economics, 2016).
2.4.2 Loan Approval Failure Increase
Loan approval is important for house buyers financing. The rejection of loan application and
approval increases especially for new units. The capital invested by developers in housing sector stay
stagnant due to increment in construction cost. The uncertainties of economic condition in Malaysia
have caused the house buyers to be extra caution which lead to weak buying sentiment. The analysis
of loans applied and approved for residential purchase is stated in Table 2 (MIER's Residential
Property Survey Report 4Q 2015, 2016).
Table 2: Loans Applied and Approved for Residential Properties Purchase by Year
2012 2013 2014 2015
Loans applied (RM mil) 193,743.4 245,903.8 223,850.3 206,031.8 Loans approved (RM mil) 92,834.0 121,000.6 121,091.5 103,412.1 Percentage approved 47.92 49.21 54.09 50.19
Source: Bank Negara Malaysia (BNM), 2016

International Journal of Property Science Vol 8 Issue 1 2018
31
e-issn:
2229-8568
2229-
8568
e-issn: 2229-8568
2.4.3 Increase in Mortgage Rate
Base Lending Rate (BLR) is set by Bank Negara Malaysia (BNM) and determined by
Overnight Policy Rate (OPR). OPR is the interest rate charged to a bank which lends from another
bank (CIMB, 2016). OPR is set by Bank Negara Malaysia (BNM) and the latest rate is at 3% from 13
July 2016 (PTLM, 2016). The OPR will create a ripple effect in loan finance. The higher OPR is, the
higher the loan interest rate will be and vice versa. Base Rate (BR) introduced by BNM in 2015 is
based on the bank’s financing cost and Statutory Reserve Requirement (SRR) and is determined by
respective banks in which BNM will not interfere (Ho, 2016). The general base lending rate/base rate
record in Malaysia showed the increment of 5.55% in 2010 to 6.95% in 2016 (www.blr.my).
2.4.4 Stagnant Wages
The median monthly salaries and wages received in 2015 for male and female households are
RM1,600 whereas for the mean received is RM2,312. The male and female received RM2,345 and
RM2,254 respectively. The median monthly salaries & wages received in 2015 increased by 6.5 per
cent which accumulated to RM1,600 as compared to RM1,500 in 2014. Meanwhile, the mean monthly
salaries & wages increased to RM2,312 compared to RM2,193 in the previous year with an annual
growth rate of 5.3 per cent. Although there is small margin of salary increment, the wages have been
stagnant for years taking into the consideration of inflation (Department of Statistics, Malaysia, 2016).
Loan repayment and housing affordability is restricted to lower and middle income group due
to current financial terms such as high interest rates and short loan periods. Therefore, joint ownership
is necessary in Kuala Lumpur for home ownership. Middle income group are neglected in ownership
of affordable housing since higher income group have the ability for loan repayment while lower
income group are supported by government housing schemes such as My First Home Scheme.
2.4.5 Increase in Unemployment Rate
Unemployed is defined as the person has the intention to work but does not have job available.
The statistics increased by 38,600 or 8.3% year-on-year (YOY), from 463,200 in June 2015 to 501,800
in June 2016 (Krinstitute, 2016).
2.4.6 Property Supply Increase
Property supply in the market consists of overhang property, unsold properties under
construction and unsold properties not constructed. Data was obtained from NAPIC for high rise
residential in Malaysia and narrow down into Kuala Lumpur (NAPIC, 2016).
Overhang Property
According to NAPIC, overhang is defined as properties that are completed and issued with
Certificates of Fitness for Occupation (CFO) or Temporary Certificates of Fitness for Occupation
(TCFO) but remain unsold despite having been put on the market for at least nine months.
a) Overhang Property in Malaysia
The major properties overhang occurred in states such as Kuala Lumpur, Selangor, Johor,
Penang, Perak and Malacca. From year 2014 to year 2016, the data showed an upward trend.
However, in Q3 2015, the total number of overhang property slightly declined. It increased by 1,160
or 9.5% quarter-on-quarter (QOQ), from 12,268 in Q1 2016 to 13,428 in Q2 2016. As for Kuala
Lumpur, the total number increased from Q4 2014 to Q2 2015 and depreciated until Q1 2016. It
showed an increase by 214 or 34.4% quarter-on-quarter (QOQ) from Q1 2016 to Q2 2016.

International Journal of Property Science Vol 8 Issue 1 2018
32
e-issn:
2229-8568
2229-
8568
e-issn: 2229-8568
b) Overhang Property in Kuala Lumpur
The overhang property in Kuala Lumpur mainly comprised of high rise residential. The
overall percentage of Q4 2014 to Q2 2015 is at the range of 60% to 70%. For Q3 2015 to Q4 2015, the
percentage has decreased to 31.77% and 26.42% respectively. The total percentage drastically shot up
to 91.8% and the overhang high rise residential increased 398 units in Q1 2016. The overhang high
rise properties in Q1 2016 from 571 units increased to 735 units with approximately 90% of the total
percentage indicating the risks of soft market.
Unsold Properties under Construction in Malaysia
NAPIC stated that unsold properties under construction are those developments with building
plan approvals and under construction remain unsold after launched for more than nine months.
a) Unsold Properties under Construction in Malaysia
The major unsold properties under construction happened in the states of Kuala Lumpur,
Selangor, Johor, Penang, and Perak. The trend is stable with the massive total numbers stated at the
range of 50,000 units to 70,000 units. The total number from Q4 2014 to Q2 2016 fluctuates. Q4 2015
has the highest total number which is 68,780 units. It increased by 5,330 or 10.5% quarter-on-quarter
(QOQ), from 50,840 in Q1 2016 to 56,170 in Q2 2016. As for Kuala Lumpur, the trend is unstable. Q2
2015 achieved the highest number of 10,742 units and it dramatically dropped to the lowest number of
3,658 units at Q3 2015. It showed an increase by 328 or 8.3% quarter-on-quarter (QOQ) from Q1
2016 to Q2 2016.
b) Unsold Properties under Construction in Kuala Lumpur
The unsold properties under construction in Kuala Lumpur mainly consist of high rise
residential. The overall percentage is rather low from Q4 2014 to Q4 2015. Q4 2015 which is the
lowest point has drastically increased to Q1 2016 at 64.8%. Year 2016 is the peak at 3,887 units
(97.81%) at Q1 and 4,253 units (98.96%) at Q2. The sudden shot up signifies the signs of soft market.
Unsold Properties Not Constructed
According to NAPIC, unsold properties not constructed are those with building plan approvals
but are not yet constructed remain unsold after launched for more than nine months.
a) Unsold Properties Not Constructed in Malaysia
The major unsold properties not constructed in Malaysia are Kuala Lumpur, Selangor, Johor
and Kedah. The trend fluctuates and the peak is at Q2 2016 which is 14,039 units whereas the lowest
point is at Q1 2016 which is 8,815. Year 2016 experienced the drastic increase of 5,224 units or 59.3%
quarter-on-quarter (QOQ) basis. As for Kuala Lumpur in general, the data showed steady increase but
Q1 2016 to Q2 2016 increased by 3039 units or 98.1%.
b) Unsold Properties Not Constructed in Kuala Lumpur
The majority unsold properties not constructed in Kuala Lumpur consist of high rise
residential. The overall percentage and numbers increase steadily. However, for year 2016, Q1 and Q2
both achieved 100% with 3,097 units and 6,136 units unsold not constructed.
2.4.7 Signs of Soft Market in Microeconomic
Lundquist (2007) proposed that the declining of real estate market or beginning of slow
market is the indication of soft market. The signs of soft market from view of microeconomic are:
International Journal of Property Science Vol 8 Issue 1 2018
33
e-issn:
2229-8568
2229-
8568
e-issn: 2229-8568
Less offers
Less traffic for listings
More credit offered to buyers
More price reductions
Listings priced lower than sales
Increase of housing inventory
Days on market increasing
2.4.8 Sign of Seller’s Behaviour in Soft Market
Denomme (2009) specified the seller’s behaviors during a soft market to be as follows:
Offer buyer incentives
Setting slightly lower price to competitors
Employ real estate agent
Always prepared for viewing
Improve property first impression
2.5 The Marketing Mix 4Ps
The marketing mix is a tool which uses to justify the buyers’ needs for marketing strategies
decision making. Iman (2002) stated that marketing mix 4Ps (price, product, promotion and place) is
the most common framework in the marketing model. He explained developers used marketing mix
4Ps to achieve their business objectives as shown in Table 4:
Table 4: Explanation of Real Estate Marketing Mix 4Ps in Malaysia Context
4Ps Application in real estate
Products Real estate products offered by the developers to the buyers in tangible and intangible elements might influence the buyers’ decision.
Price This element indicates the total amount of money buyers needed to purchase a property. This is the first consideration of buyer’s decision according to the factors of initial evaluation stage.
Place Location and concept of the property which provide marketing information to the buyers.
Promotion Activities that channel down the unique selling point of the property to the potential buyers.
Source: Iman (2002)
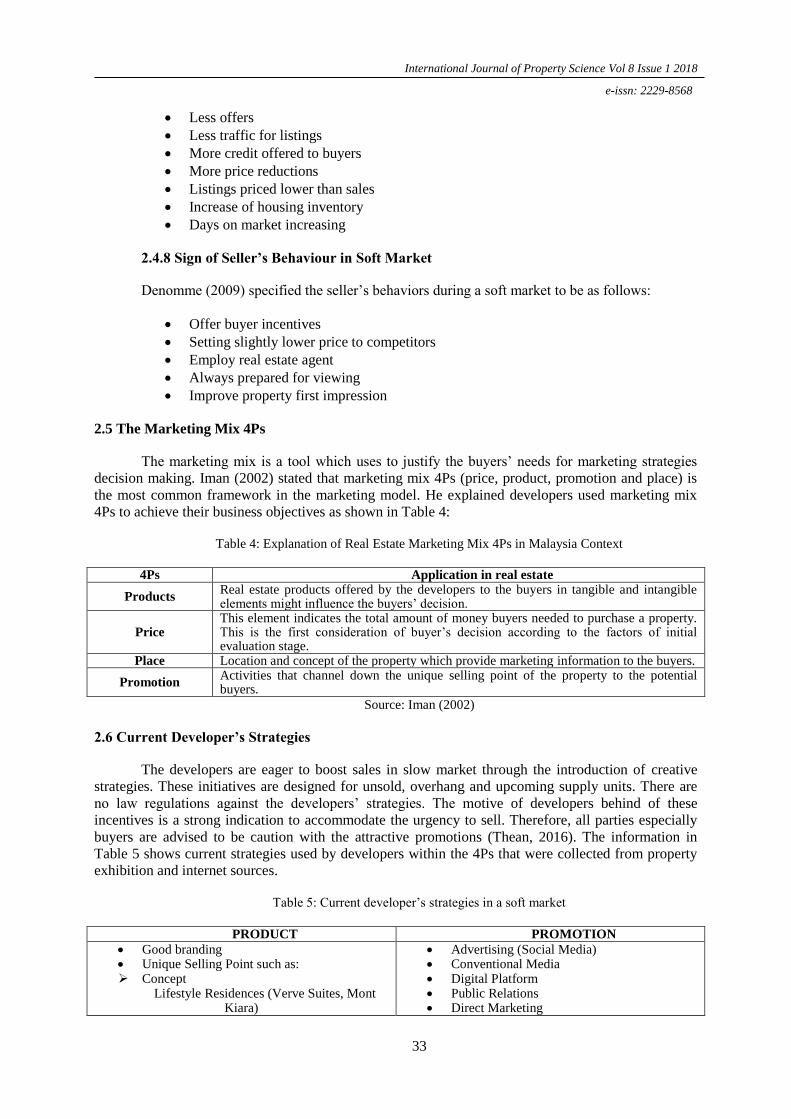
2.6 Current Developer’s Strategies
The developers are eager to boost sales in slow market through the introduction of creative
strategies. These initiatives are designed for unsold, overhang and upcoming supply units. There are
no law regulations against the developers’ strategies. The motive of developers behind of these
incentives is a strong indication to accommodate the urgency to sell. Therefore, all parties especially
buyers are advised to be caution with the attractive promotions (Thean, 2016). The information in
Table 5 shows current strategies used by developers within the 4Ps that were collected from property
exhibition and internet sources.
Table 5: Current developer’s strategies in a soft market
PRODUCT PROMOTION
Good branding Unique Selling Point such as: Concept
Lifestyle Residences (Verve Suites, Mont Kiara)
Advertising (Social Media) Conventional Media Digital Platform Public Relations Direct Marketing

International Journal of Property Science Vol 8 Issue 1 2018
34
e-issn:
2229-8568
2229-
8568
e-issn: 2229-8568
Integrated development (Sunway Velocity) App-Linked Development (Novum Bangsar
South) Luxury (Four Seasons Place Kuala Lumpur)
Theme Green (Inwood Residences, Pantai Sentul
Park) Modern (The Fennel, Sentul)
Lakeside (Lakeville, Jalan Kuching) Nature (Lakepark Residence)
Branding and reputation Signature names of developer (Eco Sky)
Architect Foreign (The Fennel, Sentul)
Art-Piece Building (Arte Series) Infrastructure
Transit - Oriented Development (EkoCheras & Sunway Velocity)
Free Stay Campaign Carnival, Celebration & Concert Tour Lucky draw & Sponsorship as reward or
award Free Legal Fees Free furniture Early bird rebates
PRICE PLACE
Reside-and-purchase scheme ‘Safety net’ loans 10:90 scheme Buy now pay later Guarantee Rental Return (GRR)
Property exhibition Launch events such as exclusive preview and
official launch Purpose Built Sales Gallery Show Units
Source: Author, 2016
3.0 METHODOLOGY
This study is designed to investigate feedback of house buyers in Kuala Lumpur towards
developer’s strategies implemented in soft property market. Questionnaire survey was adopted in this
study. The questionnaire is designed in accordance to buyers’ perspective on developer’s strategies
based on the “Marketing Mix 4Ps” which consists of price, product, place and promotion. The
questionnaire consists of 51 questions in two sections. 12 questions are provided in Section A. This
section is necessary to obtain the respondent’s profile. As for section B which comprised of 39
questions are derived from the dependent and independent variables of the theoretical framework. In
section B, the questions are derived from the developer’s strategies within the Marketing Mix. This
section is important as the outcome of the study is based on the analysis of buyer’s perspective
towards these strategies. The elements of “Marketing Mix 4Ps” which are the price, promotion, place
and product were arranged in Likert-Scale format of the following scale: 1 = strongly disagree, 2 =
disagree, 3 = neutral, 4 = agree and 5 = strongly agree. Summary of questionnaire is listed in Table 6:
Table 6 Summary of Questionnaire Design
VARIABLE NO OF ELEMENTS ELEMENT
Section A: Profile
Gender 1 Section A, No. 1
Age 1 Section A, No. 2
Occupation 1 Section A, No. 3
Marital Status 1 Section A, No. 4
Household Members 1 Section A, No. 5
Type of property selection 1 Section A, No. 6
Monthly household income 1 Section A, No. 7
Purpose of house purchase 1 Section A, No. 8
Houses owned 1 Section A, No. 9
Next house in planning 1 Section A, No. 10
Preference to purchase 1 Section A, No. 11

International Journal of Property Science Vol 8 Issue 1 2018
35
e-issn:
2229-8568
2229-
8568
e-issn: 2229-8568
Preferred house range price 1 Section A, No. 12
Section B: Developer’s strategies
Product 6 Section B, No. 1-6
Price 10 Section B, No. 10-19
Promotion 9 Section B, No. 20-28
Place 7 Section B, No. 29-35
Soft Market 6 Section B, No. 7-9,36-38
Ranking 1 Section B, No. 39
The questionnaires which were distributed in the Kuala Lumpur via email to those who work
or live in Kuala Lumpur. The targeted feedbacks were 150 sets, 139 sets were collected back and only
120 sets were valid. Missing data and answers were detected in the remaining 19 questionnaires. The
response rate is 92.67%. Cross tabulation analysis, relative important index and descriptive statistics
are conducted in this research in which data analysis was conducted using Statistical Package for
Social Science (SPSS). The developer’s strategies were analysed based on buyer’s perspective.
4.0 RESULTS AND DISCUSSION
The developers are finding difficulties to dispose the available and upcoming properties during
the soft property market in Kuala Lumpur. Thus, the strategies within the current marketing mix 4Ps
created by the developers is being studied from buyer’s perspective in this study to provide
recommendations to improve residential market sales performance. Table 7 and Table 8 illustrate the
overall mean score ranking and relative important index ranking respectively. These rankings are
derived from analysis of the questionnaire according to buyer’s perspective. Based on the ranking
shown in both tables, product is the most important factor in developers’ marketing mix 4Ps from the
buyer’s perspective. Product is positioned at the highest ranking in overall mean score from
descriptive statistics and relative important index.
From the responses shown in table 7 and table 8, house buyer’s purchase consideration has
shifted from price to product in a soft market. Therefore, the results of the analysis highlighted the
importance of product. The developers tend to focus on the concept and theme of the project as unique
selling point of the development to mark up the selling price. However, the buyers would face
difficulties to receive loans in soft market which leads to the inability to purchase by the house buyers.
Thus, the realignment of developer’s product and buyer’s expectation needs to be made. Since product
is the most important factor in a soft market, the developers shall ensure that there shall be proper
product strategies in current market situation.
The house buyers’ lack of awareness about the pricing strategies promoted by the developers
is reflected in the overall mean score of 2.84 showing the lack of understanding of respondents
towards developer’s strategies. Reside and Purchase Scheme is ranked first and “Safety Net” Loan is
ranked at last, which is the fifth place.
As for promotion and place strategies, the components under these strategies are commonly
applied in the industry. Both strategies are irrelevant in purchasing considerations but they trigger the
buyer’s intention to purchase.
Table 7: Overall mean score ranking
Table 8: Relative Important Index ranking
Ranking Marketing Mix 4Ps Overall Mean Score 1 Product 4.02 2 Price 3.71 3 Promotion 3.45 4 Place 3.20

International Journal of Property Science Vol 8 Issue 1 2018
36
e-issn:
2229-8568
2229-
8568
e-issn: 2229-8568
5.0 CONCLUSION
Price will always be the most important concern in property purchase. However, when soft
market happens, the features of the product have become the most important factor in house purchase.
Therefore, the elements under product should be the center focus to complement other segments of
marketing mix 4Ps especially price strategies. However, price strategies will only be effective if the
incentives and schemes are beneficial to house buyers. Apart from that, promotion is perceived to be
supplementary to price marketing strategy. If the promotion benefits the buyers especially in monetary
value, it will become an attraction to the buyers. Developers may consider reducing social media
promotion and channel the budget in monetary form.
Lastly, the developers can reduce cost in place strategy by being customer centric for the
targeted market. This study justified the need and demand of house buyers by using marketing mix
4Ps. Hence, the developers should improvise their strategies within the marketing mix to improve
residential sales performance in the soft market.
6.0 REFERENCES
1. Malaysia Base Lending Rate (2016). Retrieved August 20,2016 from http://www.blr.my/
2. The Chartered Institute of Marketing (CIM) (2016). Retrieved April 19,2016, from
http://www.cim.co.uk/more/getin2marketing/what-is-marketing/
3. BNM. (2016). Base Rate, Base Lending/Financing Rates and Indicative Effective Lending
Rates (1st ed). Retrieved May 5, 2016 from Bank Negara Malaysia Web site:
http://www.bnm.gov.my/documents/2016/base_rates/BR%20&%20ELR_160818.pdf
4. CAGAMAS. (2013). Housing The Nation - Policies, Issues and Prospects. Kuala Lumpur:
Cagamas Holdings.
5. CIMB. (2016). All You Need to Know About Overnight Policy Rate (Opr), Base Lending
Rate (Blr) And Base Financing Rate (BFR) (1st ed.). Retrieved May 10, 2016 from CIMB
Web site: http://www.cimbbank.com.my/content/dam/cimb-consumer/personal/Important-
Notices/OPR_BLR_BFR_Info.pdf
6. Denomme, S. (2009). Real Estate Word -- The Hard Reality of a Soft Market. Retrieved May
29, 2016, from Realestateword.com Web site:
http://www.realestateword.com/newsletter/archive.php?sid=1&nid=147&aid=297
7. Department of Statistics, Malaysia. (2016). Salaries & Wages Survey Report, Malaysia, 2015.
Retrieved April 18, 2016, from
https://www.statistics.gov.my/index.php?r=column/pdfPrev&id=czRyNkJIbDFyYXJFbU5YT
VJ1V1BHZz09
Ranking Marketing Mix 4Ps Relative Important Index 1 Product 0.787 2 Price 0.737 3 Promotion 0.690
4 Place 0.640

International Journal of Property Science Vol 8 Issue 1 2018
37
e-issn:
2229-8568
2229-
8568
e-issn: 2229-8568
8. Ho, F. (2016). Base Rate vs BLR in Malaysia: How Does BR Work? | iMoney. iMoney
Malaysia. Retrieved May 7, 2016, from https://www.imoney.my/articles/all-about-that-base-
how-does-base-rate-work
9. Iman, A. (2002). An introduction to property marketing (1st ed.). Johor: Penerbit Universiti
Teknologi Malaysia (UTM).
10. Investopedia. (2016). Gross Domestic Product - GDP. Investopedia. Retrieved May 12,2016,
from
http://www.investopedia.com/terms/g/gdp.asp?ad=dirN&qo=investopediaSiteSearch&qsrc=0
&o=40186
11. Ishak, A. (2013). Strategic Property Investor (1st ed.). Ibac Services.
12. Kiplinger, J. (2014). Playing a Soft Housing Market. Retrieved May 21,2016, from
www.kiplinger.com Web site: http://www.kiplinger.com/article/investing/T052-C016-S002-
playing-a-soft-housing-market.html#
13. Knight Frank Research. (2015). Real Estate Highlights 2nd Half 2015. Kuala Lumpur: Knight
Franks.
14. Krinstitute. (2016). Unemployment. Retrieved April 16, 2016, from Krinstitute.org Web site:
http://www.krinstitute.org/[email protected]
15. Lundquist, R. (2007). How do you know when a real estate market is getting soft?. Retrieved
August 8, 2016, from Sacramento Appraisal Blog | Real Estate Appraiser Web site:
http://sacramentoappraisalblog.com/2014/05/20/how-do-you-know-when-real-estate-is-
getting-soft/
16. MIER's Residential Property Survey Report 4Q 2015. (2016). Retrieved May 15, 2016 from
http://rehda.com/wp-content/uploads/2016/05/REHDA-Bulletin-03-March-2016.8.pdf
17. National Property Information Center. (2015). Property Overhang Table Q1 2015 (pp. 13-30).
Kuala Lumpur: National Property Information Center.
18. National Property Information Center. (2015). Property Overhang Table Q2 2015 (pp. 13-30).
Kuala Lumpur: National Property Information Center.
19. National Property Information Center. (2015). Property Overhang Table Q3 2015 (pp. 13-30).
Kuala Lumpur: National Property Information Center.
20. National Property Information Center. (2015). Property Overhang Table Q1 2015 (pp. 13-30).
Kuala Lumpur: National Property Information Center.
21. National Property Information Center. (2015). Unsold Not Constructed Property Table Q1
2015 (pp. 13-22). Kuala Lumpur: National Property Information Center.
22. National Property Information Center. (2015). Unsold Not Constructed Property Table Q2
2015 (pp. 13-22). Kuala Lumpur: National Property Information Center.
23. National Property Information Center. (2015). Unsold Not Constructed Property Table Q3
2015 (pp. 13-22). Kuala Lumpur: National Property Information Center.

International Journal of Property Science Vol 8 Issue 1 2018
38
e-issn:
2229-8568
2229-
8568
e-issn: 2229-8568
24. National Property Information Center. (2015). Unsold Not Constructed Property Table Q4
2015 (pp. 13-22). Kuala Lumpur: National Property Information Center.
25. National Property Information Center. (2015). Unsold Under Construction Property Table Q1
2015 (pp. 13-22). Kuala Lumpur: National Property Information Center.
26. National Property Information Center. (2015). Unsold Under Construction Property Table Q2
2015 (pp. 13-22). Kuala Lumpur: National Property Information Center.
27. National Property Information Center. (2015). Unsold Under Construction Property Table Q3
2015 (pp. 13-22). Kuala Lumpur: National Property Information Center.
28. National Property Information Center. (2015). Unsold Under Construction Property Table Q4
2015 (pp. 13-22). Kuala Lumpur: National Property Information Center.
29. National Property Information Center. (2016). Overview of the property market report first
half 2016. [online] National Property Information Center. Retrieved December 10, 2016 from
http://file:///C:/Users/user/Downloads/1480384539889OverviewH12016%20(1).pdf
30. National Property Information Center. (2016). Property Overhang Table Q1 2016 (pp. 11-20).
Kuala Lumpur: National Property Information Center.
31. National Property Information Center. (2016). Property Overhang Table Q2 2016 (pp. 11-20).
Kuala Lumpur: National Property Information Center.
32. National Property Information Center. (2016). Unsold Not Constructed Property Table Q1
2016 (pp. 11-16). Kuala Lumpur: National Property Information Center.
33. National Property Information Center. (2016). Unsold Not Constructed Property Table Q2
2016 (pp. 11-16). Kuala Lumpur: National Property Information Center.
34. National Property Information Center. (2016). Unsold Under Construction Property Table Q1
2016 (pp. 11-16). Kuala Lumpur: National Property Information Center.
35. National Property Information Center. (2016). Unsold Under Construction Property Table Q2
2016 (pp. 11-16). Kuala Lumpur: National Property Information Center.
36. PTLM. (2016). What you need to know about Home Loans. Retrieved June 15, 2016, from
Ptlm.com.my Web site: http://www.ptlm.com.my/index.php/component/k2/32-finance-
loans/what-you-need-to-know-about-home-loans
37. Quah, H. (2016). Industry Focus Malaysia Property. Kuala Lumpur: DBS Vickers Securities.
38. Scott, D. (2016). 72 Marketing Definitions - Heidi Cohen. Retrieved August 18, 2016, from
Heidi Cohen Web site: http://heidicohen.com/marketing-definition/
39. Seo, R. and Omar, S. (2010). A Typology of Modern Housing in Malaysia. International
Journal of Human Ecology 11, [online] p.118. Available at:
http://www.archresearch.org/_data_store_1/JK_board/4/2013
1/10.atypologyofmodernhousinginmalaysia_44.pdf [Accessed 9 Dec. 2016].
40. Thean, L. (2016). Creative marketing by developers. Retrieved August 29, 2016, from
Business News | The Star Online. Thestar.com.my Web site:

International Journal of Property Science Vol 8 Issue 1 2018
39
e-issn:
2229-8568
2229-
8568
e-issn: 2229-8568
http://www.thestar.com.my/business/business-news/2016/05/21/creative-marketing-by-
developers/
41. Trading Economics. (2016). Malaysia GDP Annual Growth Rate 2000-2018. Retrieved
August 29, 2016, from https://tradingeconomics.com/malaysia/gdp-growth-annual