strategies for achieving the sustainable development goals … · 2017-07-04 · life of dignity...
TRANSCRIPT
Strategies for Achieving the Sustainable Development Goals (SDGs) in South Asia:
Lessons from Policy Simulations
Nagesh Kumar, Matthew Hammill, Selim Raihanand Swayamsiddha Panda
August 2016
DEVELO
PMEN
T PAPERS 1601
ESCAP
SOUTH AND SOUTH-WEST ASIA
OFFICE

South and South-West Asia Development Papers 1601
August 2016
2
Disclaimer: The views expressed in this Development Paper are those of the author(s) and should
not necessarily be considered as reflecting the views or carrying the endorsement of the United
Nations. Development Papers describe research in progress by the author(s) and are published to
elicit comments and to further debate. This publication has been issued without formal editing.
For any further details, please contact:
Dr. Nagesh Kumar, Head
South and South-West Asia Office (SSWA)
United Nations Economic and Social Commission for Asia and the Pacific (UNESCAP)
C-2 Qutab Institutional Area, New Delhi-110016, India
Email: [email protected]

Strategies for Achieving Sustainable Development Goals (SDGs) in South Asia
August 2016
3
Contents
Foreword .......................................................................................................................................... 5
Abstract ............................................................................................................................................ 6
1. Introduction .................................................................................................................................. 7
2. South Asian Countries and the SDGs ......................................................................................... 7
3. Key issues for achieving the SDGs in the South Asian context .............................................. 11
a. Eliminating extreme poverty and reducing inequalities ................................................... 11
b. Eradicating hunger and achieving food security ............................................................... 14
c. Quality access to education and health for all ................................................................... 14
d. Gender equality and women’s empowerment ................................................................... 15
e. Providing essential infrastructural services to all ............................................................. 18
f. Sustainable industrialization, economic growth and decent jobs .................................... 20
g. Exploiting the potential of renewable energy ................................................................... 24
4. Modelling the Impacts of an SDG-based policy strategy for South Asia .............................. 24
a. Modelling framework and methodology ............................................................................ 25
b. Impact of selected SDG policy strategies ........................................................................... 26
5. Concluding remarks ................................................................................................................... 29
References ............................................................................................................................ 31
South and South-West Asia Development Papers 1601
August 2016
4
List of Tables
Table 1: Change in poverty, inequality and growth in South Asia, 1990-2015 ......................................................... 12
Table 2: South Asian countries’ rankings and scores on gender-related indices ....................................................... 16
List of Figures
Figure 1: Size of the South Asian Economies and Income Levels ..................................................................................... 8
Figure 2: Sustainable Development Goals ........................................................................................................................ 10
Figure 3: Relationship between financial inclusion and social protection, human development and poverty ................. 13
Figure 4: Correlation between education and health outcomes ........................................................................................ 15
Figure 5: South Asian countries performance in the Global Gender Gap sub-indices, 2014 ........................................... 17
Figure 6: Gender parity scores and incremental GDP potential ....................................................................................... 17
Figure 7: Scores and rankings of selected Asia-Pacific countries in the Global .............................................................. 18
Figure 8: Interrelationships between infrastructure and other Goals ................................................................................ 19
Figure 9: Annual GDP growth rates, selected subregions, 2000-2016 ............................................................................. 21
Figure 10: Employment growth in South Asia, 1992-2012 (average annual percentage change) .................................... 21
Figure 11: Employment and GDP growth in South Asia, 1992-2012 (average annual percentage change) .................... 21
Figure 12: South Asia employment: GDP growth trends, 1994-2010 .............................................................................. 22
Figure 13: Rates of informal employment, South Asia (percentage)................................................................................ 22
Figure 14: Self employment (own account) in share of employment and GDP per capita, circa 2010 ............................ 22
Figure 15: Share of manufacturing and industry in GDP of selected countries in Asia, 1990-2014 ................................ 23
Figure 16: Relationship between manufacturing value added and poverty ...................................................................... 24
Figure 17: Selected impacts of an SDG-based productivity and industrialization policy strategy in South Asia ............ 27
Figure 18: Spillover effects: Share of sector policy impact that boosts production in non-target sectors ........................ 27
Figure 19: National impacts on GDP from an SDG-based productivity .......................................................................... 28
Figure 20: National impacts of policy strategy on poverty and employment in South Asia ............................................ 28
Figure 21: National impacts of policy strategy on exports, GDP, and household income in South Asia ......................... 29

Strategies for Achieving Sustainable Development Goals (SDGs) in South Asia
August 2016
5
Foreword
The Development Papers Series of the ESCAP South and South-West Asia Office (ESCAP-SSWA)
promotes and disseminates policy-relevant research on the development challenges facing South and
South-West Asia. It features policy research conducted at ESCAP-SSWA as well as by outside experts
from within the region and beyond. The objective is to foster an informed debate on development policy
challenges facing the subregion and to share development experiences and best practices.
This paper was prepared as a background document for the forthcoming UNESCAP Report titled
Achieving the Sustainable Development Goals in South Asia: Key Policy Priorities and Implementation
Challenges. It examines the areas of progress and major challenges for sustainable development in
South Asia. The paper identifies seven key strategic policy priorities for the achievement of the
Sustainable Development Goals (SDGs) in South Asia by analyzing interrelationships between the
SDGs and positive spillovers between the three dimensions of development. The paper further
undertakes policy simulations within a computable general equilibrium framework to examine the
macroeconomic policy implications of select development priorities on key dimensions, including
economic growth, poverty reduction and employment. It brings forward a possible policy agenda for
pursuing inclusive and sustainable transformation of South Asia for the achievement of the SDGs. Given
South Asia’s weight in the world population and poverty, the subregion will occupy a pivotal place in
the global achievement of the SDGs.
The SDGs offer a unique transformative opportunity to close development gaps and provide a life of
dignity and sustainable prosperity to nearly a quarter of the global population that lives in South Asia.
We hope that insights and policy lessons drawn in this paper will be useful for designing a strategy to
implement the 2030 Agenda for Sustainable Development in South Asia. Implementing this policy
agenda could assist South Asia in realizing its potential as a powerful engine of the world economy.
Nagesh Kumar
Head, ESCAP South and South-West Asia Office

South and South-West Asia Development Papers 1601
August 2016
6
Strategies for Achieving Sustainable Development Goals (SDGs) in
South Asia:
Lessons from policy simulations
Nagesh Kumar, Matthew Hammill, Selim Raihan and Swayamsiddha Panda*
Abstract
This paper analyzes the major challenges to achieving sustainable development in South Asia as a basis for
articulating development strategies for the achievement of the Sustainable Development Goals (SDGs) in the
subregion. It identifies key combinations of dimensions of the 2030 Agenda and SDGs that could form core
development priorities and maximize interactions for the achievement of the SDGs. The paper further analyzes
the policy impacts from select development priorities within a computable general equilibrium framework on
economic growth, poverty reduction and employment, among other parameters of development. The results
suggest that an industry-oriented structural transformation, enhancing agricultural productivity through
sustainable agriculture and overall efficiency improvements through innovations have the potential to lift an
additional 71 million people out of poverty, create 56 million additional jobs in South Asia and boost GDP by 15-
30 per cent by 2030 over and above the business-as-usual scenario.
JEL Code(s): C68, O1, O2, O5
Key words: South Asia, Sustainable Development Goals (SDGs), Industrialization, Agricultural productivity,
Economic growth, Computable General Equilibrium Models
* Nagesh Kumar, Matthew Hammill and Swayamsiddha Panda are staff members of the South and South-West Asia Office of
the United Nations Economic and Social Commission for Asia and the Pacific (UNESCAP SSWA).Selim Raihan is
Professor of Economics at the University of Dhaka and Executive Director of the South Asian Network on Economic
Modeling (SANEM). The views presented in the paper are those of the authors and should not be attributed to the United
Nations or its Member States.

Strategies for Achieving Sustainable Development Goals (SDGs) in South Asia
August 2016
7
1. Introduction
The 17 Sustainable Development Goals (SDGs) enshrined in the 2030 Agenda for
Sustainable Development adopted at the United Nations by the 193 Member States represent a
new global development compact. Encompassing three core dimensions of economic, social and
environmental development, the Agenda has become the centre of a renewed development
framework for countries of the world, including South Asia, to meet the changing development
priorities and development gaps that previous strategies have been unable to close.1 South Asia
has achieved a number of Millennium Development Goals (MDGs) including the poverty-
reduction goal. But the progress has been uneven across goals, and across and within countries.2
Despite these achievements, South Asia represents the largest concentration of poverty and
hunger in the world. Hence, the SDGs provide to the region a transformative opportunity for a
life of dignity and sustainable prosperity to all. Given South Asia’s weight in global population
and poverty, the subregion occupies a critical place in the achievement of the SDGs. Global
MDGs achievement was driven by China. South Asia will be the key region that will determine
the global achievement of the SDGs.
Against that backdrop, the paper analyzes the key challenges to achieving sustainable
development in South Asia to guide the countries’ formulation and implementation of
development strategies towards SDG achievement. It examines the mutually reinforcing nature
of key SDG strategies through an exploratory attempt at policy simulations to assess the policy
impacts of two selected development priorities -- within a computable general equilibrium
framework -- and draws policy lessons.
The paper is structured as follows: Section 2 describes the SDGs. Section 3 analyzes the
challenges for South Asia’s sustainable development by linking key development trends to
particular SDGs. This is undertaken based on combinations that correspond with prominent
perspectives on development in the subregion to identify select SDG policy strategies that link
SDGs and can be applied across South Asia countries taking into account their national contexts.
Section 4 describes the empirical analysis and results of applying selected priorities in South
Asia within a computable general equilibrium framework to assess their policy impacts in terms
of growth, structural transformation and poverty. Section 5 concludes.
2. South Asian Countries and the SDGs
The South Asia countries are quite distinct in population, economic structure and
development challenges although they are all developing countries. Five of those countries have
special needs, including Maldives as a Small Island Developing State (SIDS), Bangladesh, as a
1 General Assembly resolution 70/1.
2 See UNESCAP, ADB and UNDP (2015) for a detailed assessment.

South and South-West Asia Development Papers 1601
August 2016
8
least developed country and Afghanistan, Bhutan and Nepal being also landlocked least
developed countries. Considering just three common relevant dimensions used to rank countries,
that is, population size, GDP and GDP per capita, South Asia can be grouped into various
clusters of countries (see figure 1).
Figure 1: Size of the South Asian Economies and Income Levels
Source: UNESCAP based on World Development Indicators, World Bank (accessed on 17 July 2016).
Notes: LLDCs = Landlocked Developing Countries, LMICs = Lower-middle income countries, SIDS= Small
Island Developing States.
By GNI per capita classifications, South Asia is a collection of low-income and lower-
middle income countries, except for Maldives. Average per capita incomes using most recent
values are $1533 for South Asia in 2015, varying between $6670 for the Maldives to only $630
for Afghanistan.3
Overall, South Asian countries face fundamental sustainable development challenges in
basic needs and service delivery. The SDGs build upon and extend the MDG agenda. The goals
provide to South Asia a timely opportunity to make its development process more inclusive and
sustainable and to close the development gaps.
The structure of the SDGs
The 2030 Agenda represents a culmination of an unprecedented extensive process of
consultations at national, subregional, regional and global levels involving governments,
business and industry, civil society among other stake holders including in an Open Working
3 Using GNI per capita and the World Bank income classification methodology. See
https://datahelpdesk.worldbank.org/knowledgebase/articles/378834-how-does-the-world-bank-classify-countries.
Afghanistan
Bhutan
Nepal
Sri Lanka
Bangladesh India
Pakistan
Maldives
0
2000
4000
6000
8000
10000
12000
14000
16000
18000
20000
1 4 16 64 256 1024 4096 16384
GD
P p
er
cap
ita, cu
rren
t P
PP
do
llars
, 2015
GDP at current PPP billion dollars, 2015
SIDS
LLDCs Subregional giant
LMICs

Strategies for Achieving Sustainable Development Goals (SDGs) in South Asia
August 2016
9
Group of the General Assembly and expert panels, conducted over the past three years following
the Rio+20 conference on sustainable development.4 Within the Economic and Social Council, a
High-level Political Forum was created.5 At the regional level, ESCAP established Asia-Pacific
Forums on Sustainable Development in 2014 and 2015.6 The 2030 Agenda is complemented by
the other significant high-level intergovernmental meetings. One was the third International
Conference on Financing for Development held in Addis Ababa in July 2015 resulting in the
Addis Ababa Action Agenda (AAAA) that identified a shared vision of pathways to secure the
resources to fulfill the sustainable development goals and accelerate development in developing
countries.7 A second significant global accord within the SDG context was the Paris Agreement
on Climate Change that was the result of the Conference of Parties (COP) 21 for the United
Nations Framework Convention on Climate Change.8
The 2030 Agenda for Sustainable Development comprising the 17 SDGs and 169 targets
encompassing three core dimensions of economic, social and environmental development was
adopted by the world leaders on 25 September 2015. 9
The list of 17 SDGs and 169 targets
included in the 2030 Agenda actually covers four broad sets of issues that seek not only to carry
forward the unfinished MDG agenda but also to factor in the important lessons learned from the
experiences in implementing the MDGs (see figure 2).
Achieving the first seven SDGs (SDGs 1-7) requires completing the task of providing
basic human development needs and services that began with the MDGs. The subregion today
represents the largest concentration of poverty, hunger and other deprivations in the world.
Unlike the MDGs that targeted reduction in deprivations, the SDGs seek to leave ‘no one behind’
and provide a life of dignity to all.
The 2030 Agenda incorporates the common drivers and cross-cutting issues that are
essential to advance sustainable development across all of the dimensions (SDGs 8-10). South
Asia’s investment in growth, infrastructure, inclusion and urbanization will act as the engine that
drives sustainable development. The subregion faces significant gaps in these areas, but there is
currently an enormous momentum and political will for leveraging strategies to generate
concrete actions.
4 See General Assembly resolution 66/288; United Nations (2013); United Nations Development Group (2013);
United Nations Resident Coordinator’s Office (2013); UNESCAP and Thailand, Ministry of Foreign Affairs (2013);
A/68/970; and General Assembly resolution 69/313. For the Nagarkot Statement, see UNESCAP and others (2014). 5 General Assembly resolution 67/290.
6 UNESCAP (2015b).
7 General Assembly resolution 69/313, annex.
8 See http://unfccc.int/resource/docs/2015/cop21/eng/l09r01.pdf.
9 See General Assembly resolution 70/1.

South and South-West Asia Development Papers 1601
August 2016
10
Figure 2: Sustainable Development Goals
Goals carrying forward the unfinished agenda of the Millennium Development Goals
End poverty in all its forms
everywhere
End hunger, achieve food
security and improved nutrition
and promote sustainable
agriculture
Ensure healthy lives and
promote well-being for all at
all ages
Ensure inclusive and equitable
quality education and promote
lifelong learning opportunities
for all
Achieve gender equality and empower all
women and girls
Ensure availability and sustainable
management of water and sanitation for all
Ensure access to affordable, reliable,
sustainable and modern energy for all
Goals enhancing development drivers and cross-cutting issues
Promote sustained, inclusive and sustainable
economic growth, full and productive
employment and decent work for all
Build resilient infrastructure, promote
inclusive and sustainable
industrialization and foster innovation
Reduce inequality within and among
countries
Goals enhancing aspects of environmental sustainability
Make cities and human settlements inclusive,
safe, resilient and sustainable
Ensure sustainable consumption and
production patterns
Take urgent action to combat climate
change and its impacts
Conserve and sustainably use the oceans, seas and marine resources
for sustainable development
Protect, restore and promote sustainable use of terrestrial
ecosystems, sustainably manage forests, combat desertification,
and halt and reverse land degradation and halt biodiversity loss
Goals harnessing the global partnership for development
Promote peaceful and inclusive societies for sustainable
development, provide access to justice for all and build effective,
accountable and inclusive institutions at all levels
Strengthen the means of implementation and revitalize the global
partnership for sustainable development
Source: Authors’ construction based on General Assembly resolution 70/1 Notes: For icons, see www.globalgoals.org.

Strategies for Achieving Sustainable Development Goals (SDGs) in South Asia
August 2016
11
Promoting peaceful and inclusive societies and providing adequate means of
implementation for sustainable development in South Asia is critical for long-term sustainability
and intergenerational equity (SDGs 16-17). Investing in solid policies, institutions, coordination
and monitoring will lock-in gains and increase resilience in the face of shocks and create a
stimulating environment for cooperation and support in providing the means of implementation
to achieve the SDGs and transform the subregion in a generation.
3. Key issues for achieving the SDGs in the South Asia context
This section considers a series of first-round interlinkages between particular challenges
and opportunities for South Asia in terms of the SDGs. Interlinked goals are described in order
of the first relevant goal for groups of goals identified in the previous section. By assessing key
development factors within each group for the South Asian context, common cross-group
strategic priorities can be identified.
a. Eliminating extreme poverty and reducing inequalities
The performance of South Asia in terms of the MDG goal of poverty reduction has been
driven by the bursts of acceleration in poverty reduction that took place immediately before the
global financial crisis and in recent years. As a whole, the subregion has reduced extreme
poverty by 54.7% since 1990, while the MDG reduction target was 50% (see table 1). South Asia
therefore needs to improve in sharing the fruits of its growth. The UNESCAP index of
inclusiveness found growth in countries in South Asia to be less socially inclusive than in other
countries in Asia and the Pacific.10
Table 1 shows that inequalities (as measured by the Gini
coefficient) rose in Bangladesh, India and Sri Lanka. Consumption-based measures, used in most
of South Asia tend to be less effective at identifying inequality than income measures11
and the
mixed results for the Gini coefficient mask the stark inequality levels that remain across the
subregion.12
Other inequality indicators reinforce the trend of uneven and unequal growth in
South Asia. In India, the net worth of the billionaire community has multiplied 12-fold in the last
10 See UNESCAP (2015a).
11 UNESCAP analysis previously considered the potential for simple inequality measures, such as the Gini
coefficient, to mask significant income inequality across countries in the subregion. In the case of India the
consumption-based Gini coefficient was 0.39, while inequality based on income in the same survey showed the
value for the Gini coefficient at 0.52, which is similar to the levels of Brazil and higher than inequality in China at
around the same period. See UNESCAP SSWA (2012), box 2.5. 12
The Gini measure itself tends to favour the middle of the income distribution rather than the tails, and is subject to
variation. Alternative measures, including the Theil coefficient, have been considered as more appropriate to place
greater emphasis on the segment of the distribution living in poverty. Recent work (Sustainable Development
Solutions Network, 2015) suggests that inequality measures such as the Palma ratio, defined as the ratio of the
richest 10% of the population’s share of gross national income divided by the poorest 40% of the population’s share,
seek to overcome some of the limitations of the Gini coefficient.
South and South-West Asia Development Papers 1601
August 2016
12
15 years.13
The International Monetary Fund (IMF) estimates that the wealth earned by
billionaires in India is twice the amount required to eliminate extreme poverty in the country.14
Recent research also suggests that rural and urban inequality has increased as a result of financial
development, economic growth and consumer price dynamics of which urban populations are
better able to take advantage and from which they are better able to benefit.15
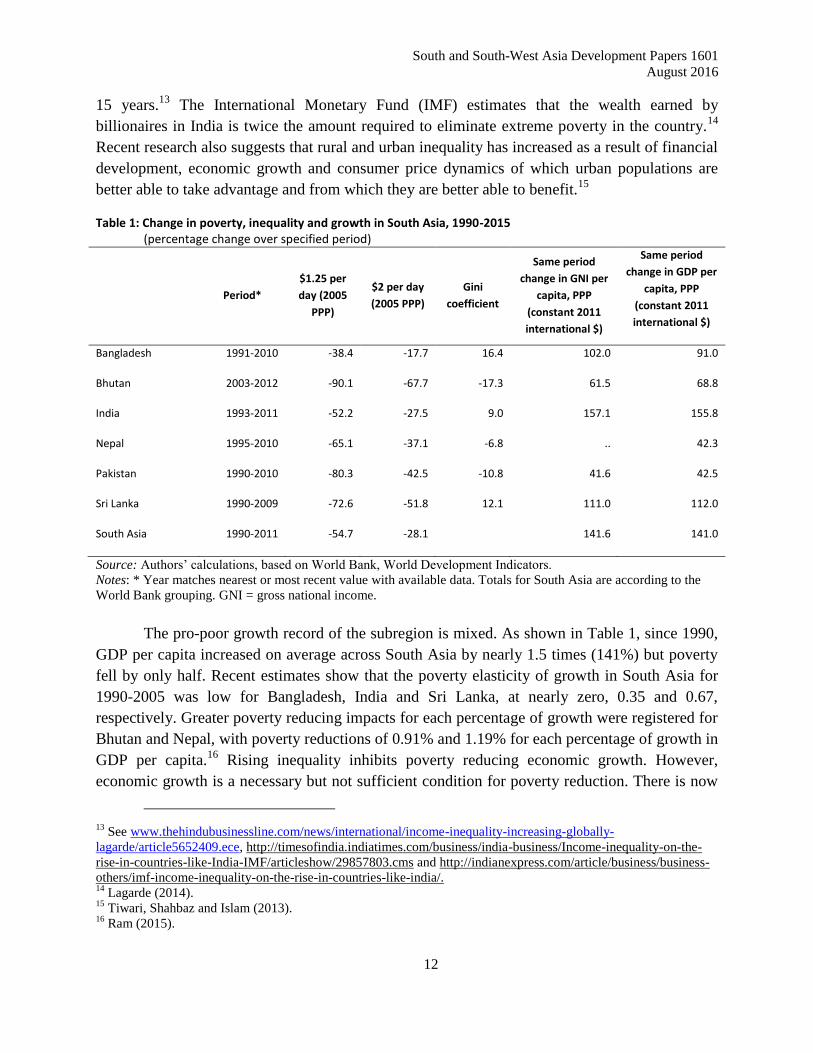
Table 1: Change in poverty, inequality and growth in South Asia, 1990-2015 (percentage change over specified period)
Period*
$1.25 per
day (2005
PPP)
$2 per day
(2005 PPP)
Gini
coefficient
Same period
change in GNI per
capita, PPP
(constant 2011
international $)
Same period
change in GDP per
capita, PPP
(constant 2011
international $)
Bangladesh 1991-2010 -38.4 -17.7 16.4 102.0 91.0
Bhutan 2003-2012 -90.1 -67.7 -17.3 61.5 68.8
India 1993-2011 -52.2 -27.5 9.0 157.1 155.8
Nepal 1995-2010 -65.1 -37.1 -6.8 .. 42.3
Pakistan 1990-2010 -80.3 -42.5 -10.8 41.6 42.5
Sri Lanka 1990-2009 -72.6 -51.8 12.1 111.0 112.0
South Asia 1990-2011 -54.7 -28.1 141.6 141.0
Source: Authors’ calculations, based on World Bank, World Development Indicators.
Notes: * Year matches nearest or most recent value with available data. Totals for South Asia are according to the
World Bank grouping. GNI = gross national income.
The pro-poor growth record of the subregion is mixed. As shown in Table 1, since 1990,
GDP per capita increased on average across South Asia by nearly 1.5 times (141%) but poverty
fell by only half. Recent estimates show that the poverty elasticity of growth in South Asia for
1990-2005 was low for Bangladesh, India and Sri Lanka, at nearly zero, 0.35 and 0.67,
respectively. Greater poverty reducing impacts for each percentage of growth were registered for
Bhutan and Nepal, with poverty reductions of 0.91% and 1.19% for each percentage of growth in
GDP per capita.16
Rising inequality inhibits poverty reducing economic growth. However,
economic growth is a necessary but not sufficient condition for poverty reduction. There is now
13 See www.thehindubusinessline.com/news/international/income-inequality-increasing-globally-
lagarde/article5652409.ece, http://timesofindia.indiatimes.com/business/india-business/Income-inequality-on-the-
rise-in-countries-like-India-IMF/articleshow/29857803.cms and http://indianexpress.com/article/business/business-
others/imf-income-inequality-on-the-rise-in-countries-like-india/. 14
Lagarde (2014). 15
Tiwari, Shahbaz and Islam (2013). 16
Ram (2015).

Strategies for Achieving Sustainable Development Goals (SDGs) in South Asia
August 2016
13
an emerging consensus that social protection strategies and financial inclusion are important for
accelerating poverty reduction and human development by increasing the resilience of
populations vulnerable to poverty, especially to adverse income shocks.17
Figure 3A corroborates
the inverse relationship between financial institution account ownership and poverty headcount
ratio. Figure 3B shows the positive relationship between social protection index and human
development index across countries. Therefore, enhancing social protection strategies and
financial inclusion will be two important strategies for reduction in poverty and inequalities.
Social protection has been included in SDG-1.3 as an independent target by itself besides decent
work, the provision of basic services for all that are part of social protection.
Figure 3: Relationship between financial inclusion and social protection, human development and poverty
Figure 3.A: Relationship between financial inclusion and poverty
Source: Authors’ calculations, based on World Bank, Global
Findex and World Development Indicators (accessed October
2015).
Figure 3.B: Relationship between social protection and human development index score
Source: Authors’ calculations, based on ADB, Social
Protection Index (available from
http://spi.adb.org/spidmz/index.jsp); and United Nations
Development Programme, 2015 Human Development
Statistical Tables (available from
http://hdr.undp.org/en/data).
In South Asia, given that the vast majority of the workforce is engaged in informal
employment, enhancing the coverage of social protection would be very critical and should be
seen as a smart investment in sustainable development. Applying evidence-based policy to the
design of such programmes ensures they reach target groups and crowd-in other economic, social
and environmental benefits. Applications of evidence-based policy, including the increasingly
common use of randomized controlled trials (RCTs) in the evaluation of delivery of anti-poverty
programmes, such as those carried out by the Abdul Latif Jameel Poverty Action Lab (J-PAL),
17 Park and Mercado (2015).
BGD
BTN
IND
NPL
PAK LKA
y = -0.52x + 40.01 R² = 0.34
0
10
20
30
40
50
60
70
80
90
0 20 40 60 80 100
Po
vert
y h
ead
cou
nt
rati
o a
t $
1.9
0 a
day
(2
01
1 P
PP
)
Account at a financial institution (% age 15+)
AFG
BGD BTN
IND MDV
NPL PAK
LKA
y = 0.68x + 0.60 R² = 0.36
0.0
0.1
0.2
0.3
0.4
0.5
0.6
0.7
0.8
0.9
1.0
0 0.1 0.2 0.3 0.4 0.5
Hu
man
dev
elo
pm
ent
ind
ex, 2
01
4
Social protection index, 2010

South and South-West Asia Development Papers 1601
August 2016
14
have also generated a rich collection of information on good practices and lessons learned to
refine programme delivery as it is replicated and scaled up.18
For example, one RCT in Pakistan
adapted from a Bangladeshi model, assessed an intervention package to village households living
in most extreme poverty by providing a productive asset, business training and cash transfers.
The programme had positive lasting impacts in household incomes, self-employment and
political involvement. The high up-front cost per person was offset by the 179% return on this
investment by the end of the programme.19
b. Eradicating hunger and achieving food security
South Asia continues to be one of the largest hunger hotspots in the world, with one in
five people in the subregion being undernourished. A sustainable solution to address food
insecurity and hunger in South Asia requires a focus on agricultural productivity to enhance
availability of food as well as to accelerate poverty reduction and improve food distributional
aspects. It also requires focusing on nutritional aspects to address the high levels of anemia and
vitamin A deficiency that exist in the subregion. Given the fact that agriculture supports nearly
half of the populations in South Asia, any improvement in agricultural productivity would also
lead to poverty reduction. In this context a new green revolution based on sustainable agriculture
seeking to double agricultural productivity, as targeted by SDGs, would have wide-ranging
effects, not only for hunger but also for poverty reduction, job creation and inequality reduction.
c. Quality access to education and health for all
South Asia has been successful in meeting its MDG targets on universal primary
enrolment and primary completion. However, at 59%, the subregion’s net secondary enrolment
rate lags behind the global average of 65% by 6 percentage points.20
Girls, especially in Pakistan
and Afghanistan, and children from lower socio-economic strata and lagging regions continue to
have lower access to primary education. South Asia hasn’t experienced commensurate
improvements in learning levels, and the quality of education provided especially in rural areas is
often poor. Student achievement levels have been low in most countries in South Asia. The
outcomes are partly explained by low public expenditure on education as a percentage of GDP,
ranging in most countries in the subregion from 2.0% in Bangladesh, 3.8% in India, 2.5% in
Pakistan and 1.6% in Sri Lanka, well below the recommended threshold of 6%.21
Similarly, South Asia has made notable progress in achieving the health-related MDGs
by reducing maternal mortality, registering a 67% decrease in the maternal mortality ratio
18 For more details, see https://www.povertyactionlab.org/.
19 http://www.poverty-action.org/study/graduating-ultra-poor-pakistan.
20 See data from the UNESCO Institute for Statistics(UIS). Available from http://data.uis.unesco.org/ (accessed
August 2016). 21
See the Oslo Declaration. Available from www.unesco.org/education/Oslo_Declaration_final_17dec08.pdf.
Strategies for Achieving Sustainable Development Goals (SDGs) in South Asia
August 2016
15
between 1990 and 2015; however, this figure is still below the MDG target of a 75% reduction.
Just over half (52%) of birth deliveries were attended by skilled health personnel in South Asia
in 2014, while East Asia has attained universal skilled birth attendance. South Asia also
continues to have both a high rate of under-five mortality, at 53 deaths per 1,000 live births in
2015. Public health expenditure levels in South Asia remain very low, at 1.4% of GDP in 2014,
compared with the world average of 6% and about 8% in the high-income Organization for
Economic Cooperation and Development (OECD) countries. Public expenditure on health in
India (1.4% of GDP in 2014) is less than half of that in China (3.1% of GDP in 2014).22
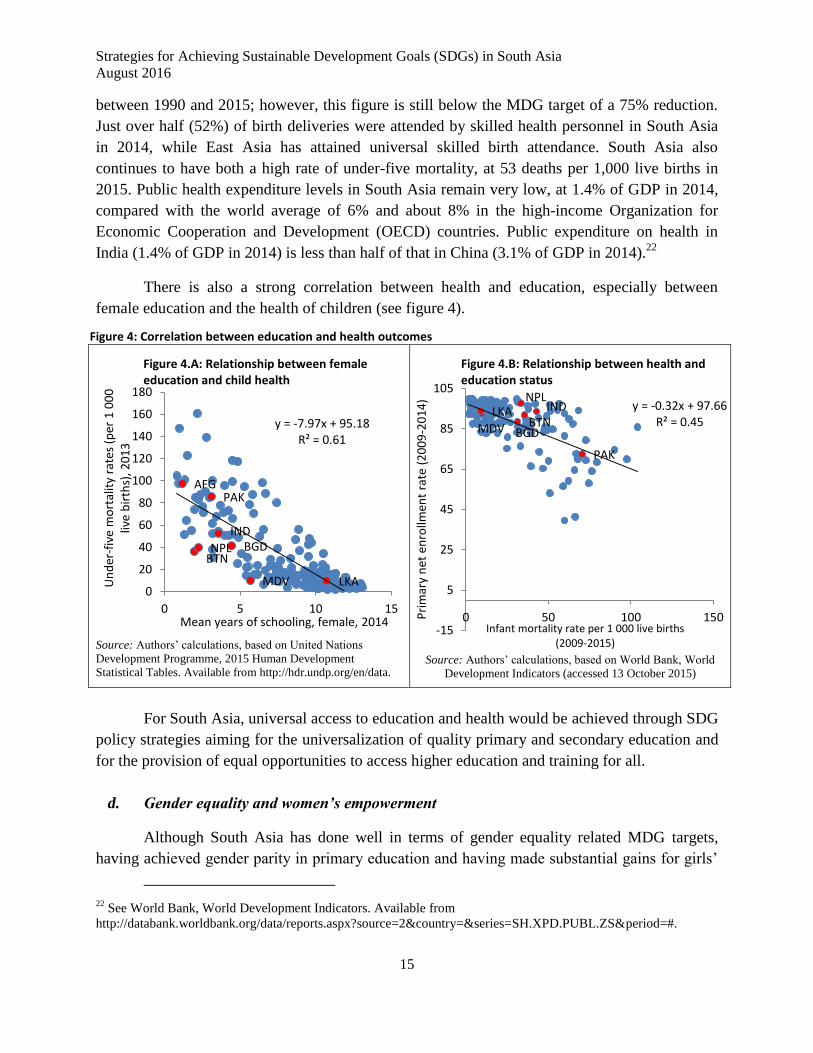
There is also a strong correlation between health and education, especially between
female education and the health of children (see figure 4).
Figure 4: Correlation between education and health outcomes
Source: Authors’ calculations, based on United Nations
Development Programme, 2015 Human Development
Statistical Tables. Available from http://hdr.undp.org/en/data. Source: Authors’ calculations, based on World Bank, World
Development Indicators (accessed 13 October 2015)
For South Asia, universal access to education and health would be achieved through SDG
policy strategies aiming for the universalization of quality primary and secondary education and
for the provision of equal opportunities to access higher education and training for all.
d. Gender equality and women’s empowerment
Although South Asia has done well in terms of gender equality related MDG targets,
having achieved gender parity in primary education and having made substantial gains for girls’
22 See World Bank, World Development Indicators. Available from
http://databank.worldbank.org/data/reports.aspx?source=2&country=&series=SH.XPD.PUBL.ZS&period=#.
LKA MDV
IND
BTN BGD NPL
PAK AFG
y = -7.97x + 95.18 R² = 0.61
0
20
40
60
80
100
120
140
160
180
0 5 10 15
Un
der
-fiv
e m
ort
alit
y ra
tes
(per
1 0
00
liv
e b
irth
s), 2
01
3
Mean years of schooling, female, 2014
Figure 4.A: Relationship between female education and child health
BGD BTN
IND
MDV
NPL
PAK
LKA y = -0.32x + 97.66 R² = 0.45
-15
5
25
45
65
85
105
0 50 100 150Pri
mar
y n
et e
nro
llmen
t ra
te (
20
09
-20
14
)
Infant mortality rate per 1 000 live births (2009-2015)
Figure 4.B: Relationship between health and education status

South and South-West Asia Development Papers 1601
August 2016
16
enrolment in secondary education,23
the subregion continues to underperform across a range of
gender equality indicators. Table 2 shows the very poor ranks of South Asian countries in terms
of three global indices measuring gender equality. The first of these is the Global Gender Gap
produced by the World Economic Forum,24
the second measuring Gender Development Index
and the third Gender Inequality both produced as part of the Human Development Reports
published by the United Nations Development Programme (UNDP). Generally, Afghanistan and
Pakistan find themselves at the bottom of these indices, while Sri Lanka has generally the best
rankings among the South Asian countries overall.
Table 2: South Asian countries’ rankings and scores on gender-related indices
South Asia
Global Gender Gap (2014)
i
(on 142 countries)
Gender Development Index (GDI) (2013)
ii
(on 187 countries)
Gender Inequality Index (GII) (2013)
iii
(on 187 countries)
Rank Score Rank Score Rank Score
Afghanistan
n.a. n.a. 148 0.330 149 0.705
Bangladesh 68 0.697
107 0.528 115 0.529
Bhutan
120 0.636 n.a. n.a. 102 0.495
India
114 0.645 132 0.519 127 0.563
Maldives 105 0.656
90 0.673 49 0.283
Nepal 112 0.646
102 0.514 98 0.479
Pakistan
141 0.552 145 0.447 127 0.563
Sri Lanka 79 0.690
66 0.720 75 0.383
Sources: i. World Economic Forum (2014). ii. UNDP (2014),Table 5. iii. UNDP (2014), Table 4.
The Global Gender Gap Report also provides gender inequality score on countries’
performance against four sub-indices, namely education, health, political empowerment and
economic participation (see figure 5). The figure shows that the variation across countries in
terms of gender inequality in health has come down, there is considerable variation in terms the
other three dimensions, with inequality in political empowerment being widest. In terms of
educational attainment, for instance, Sri Lanka and Maldives have the least gender inequality,
Pakistan has the highest. The gender inequality in terms of economic participation mirrors that
in educational inequality with Sri Lanka and Maldives having the least inequality and Pakistan,
the highest. However, the gender inequality in terms of political empowerment is greatest in
Bhutan and Maldives and least in Bangladesh and India.
23 See for more details, UNESCAP, ADB and UNDP (2015).
24 World Economic Forum (2014).

Strategies for Achieving Sustainable Development Goals (SDGs) in South Asia
August 2016
17
Figure 5: South Asian countries performance in the Global Gender Gap sub-indices, 2014
Source: Based on the World Economic Forum (2014).
Gender inequality costs the subregion dearly in terms of opportunities and incomes lost.
A recent study by the McKinsey Global Institute (summarized in figure 6) based on an analysis
of gender indicators conducted in 95 countries found that India and other South Asian countries
have rather low gender parity scores; the score for India is 0.48 while the average for the rest of
South Asia is 0.44.25
India and other countries in South Asia could gain an additional annual
2025 GDP of $700 billion and $100 billion (representing increases of 16% and 11%),
respectively, through a “best-in-region” scenario in which countries match the rate of
improvement of the fastest-improving country in their region. In a “full potential” scenario in
which women play an identical role in labour markets to that of men, the gain could be as much
as $2.9 trillion in India and $400 billion in other countries in South Asia in annual GDP by 2025.
Figure 6: Gender parity scores and incremental GDP potential
Source: Authors’ construction, based on McKinsey Global Institute (2015). Note: Gender parity scores (parity = 1.00) are represented as
percentages in this figure.
25 McKinsey Global Institute (2015) calculates a gender parity score based on 15 indicators, with equal weighting of
all indicators, to arrive at an aggregate score at the country level to measure how far each country is from full gender
parity.
0
0.2
0.4
0.6
0.8
1
1.2
Bangladesh Bhutan India Maldives Nepal Pakistan Sri Lanka
Su
b-i
nd
ex s
co
re (
0.0
0-1
.00
)
economic participation and opportunity educational attainmenthealth and survival political empowerment
64 62 61 57
48 48 44
0
1
2
3
4
5
0
10
20
30
40
50
60
70
Latin America East andSouth-EastAsia (excl.
China)
China Sub-SaharanAfrica
Middle Eastand North
Africa
India South Asia(excl. India)
Trilli
ons o
f U
S d
olla
rs
Perc
enta
ge
Incremental 2025 GDP (in percentage): full potential scenarioIncremental 2025 GDP (in percentage): best-in-region scenarioGender parity (in percentage)Incremental 2025 GDP (2014 $ trillion): best-in- region scenario
South and South-West Asia Development Papers 1601
August 2016
18
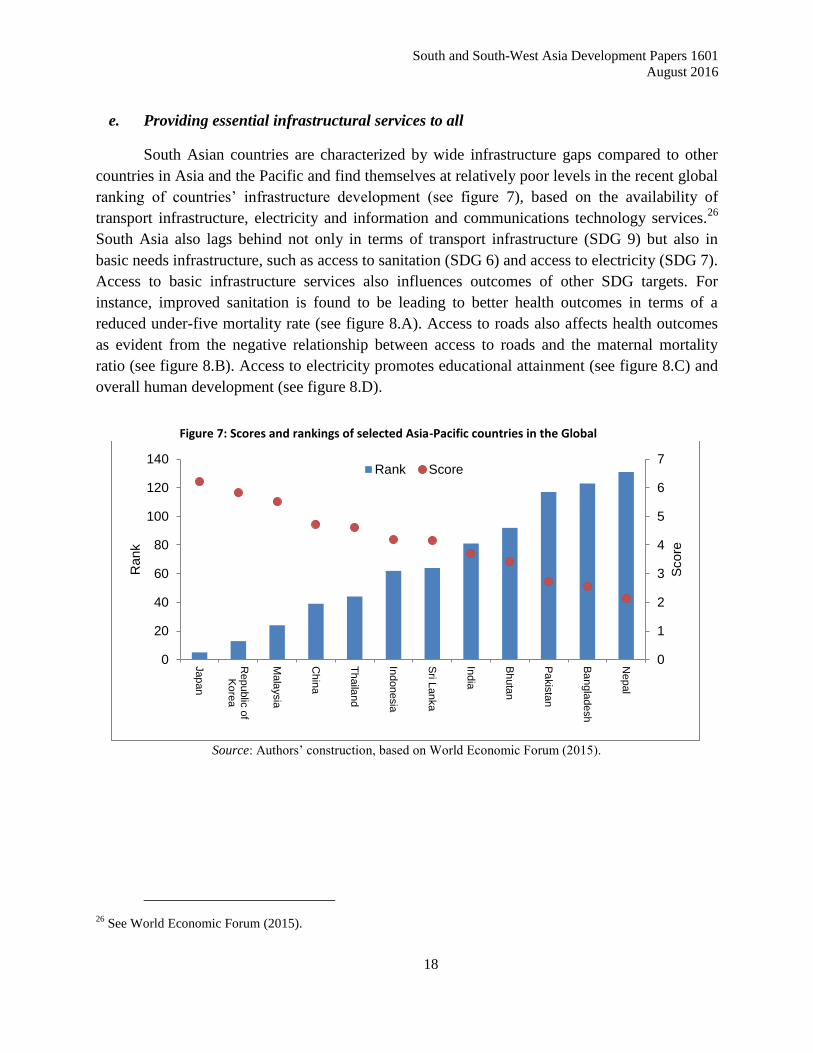
e. Providing essential infrastructural services to all
South Asian countries are characterized by wide infrastructure gaps compared to other
countries in Asia and the Pacific and find themselves at relatively poor levels in the recent global
ranking of countries’ infrastructure development (see figure 7), based on the availability of
transport infrastructure, electricity and information and communications technology services.26
South Asia also lags behind not only in terms of transport infrastructure (SDG 9) but also in
basic needs infrastructure, such as access to sanitation (SDG 6) and access to electricity (SDG 7).
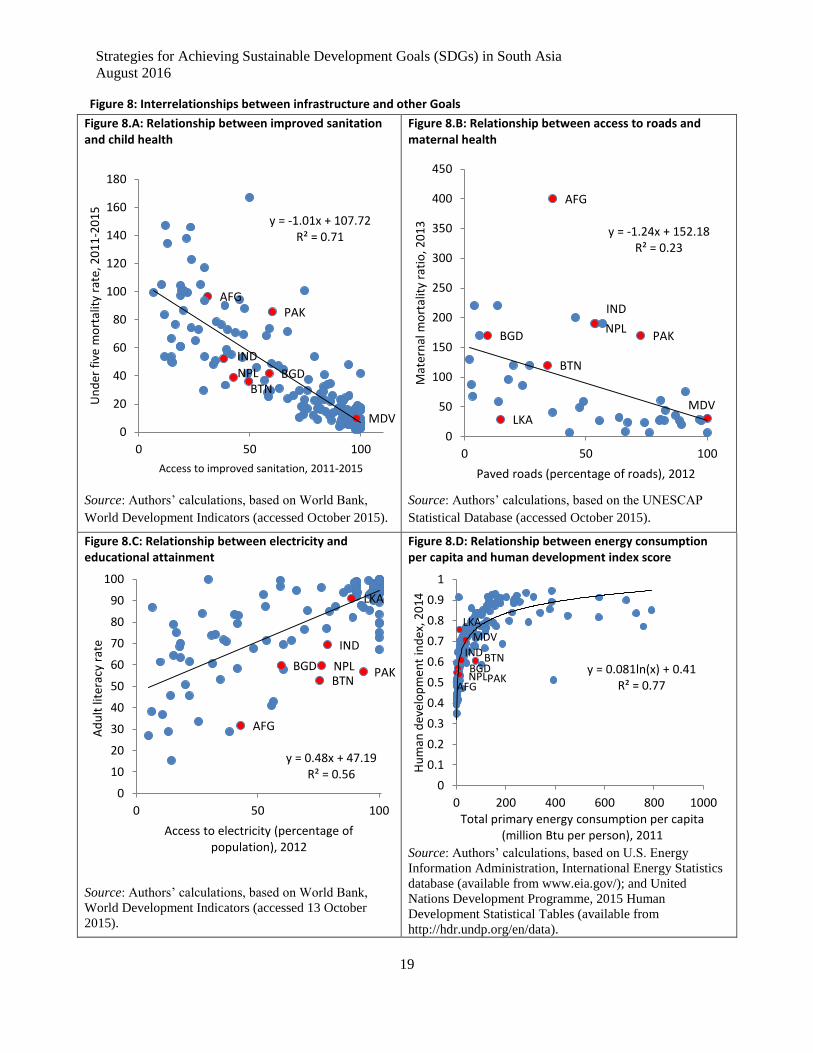
Access to basic infrastructure services also influences outcomes of other SDG targets. For
instance, improved sanitation is found to be leading to better health outcomes in terms of a
reduced under-five mortality rate (see figure 8.A). Access to roads also affects health outcomes
as evident from the negative relationship between access to roads and the maternal mortality
ratio (see figure 8.B). Access to electricity promotes educational attainment (see figure 8.C) and
overall human development (see figure 8.D).
Figure 7: Scores and rankings of selected Asia-Pacific countries in the Global
Source: Authors’ construction, based on World Economic Forum (2015).
26 See World Economic Forum (2015).
0
1
2
3
4
5
6
7
0
20
40
60
80
100
120
140
Jap
an
Republic
of
Ko
rea
Ma
laysia
Chin
a
Th
aila
nd
Indonesia
Sri L
anka
India
Bh
uta
n
Pa
kis
tan
Ba
ngla
desh
Nepal
Score
Rank
Rank Score
Strategies for Achieving Sustainable Development Goals (SDGs) in South Asia
August 2016
19
Figure 8: Interrelationships between infrastructure and other Goals
Figure 8.A: Relationship between improved sanitation and child health
Source: Authors’ calculations, based on World Bank,
World Development Indicators (accessed October 2015).
Figure 8.B: Relationship between access to roads and maternal health
Source: Authors’ calculations, based on the UNESCAP
Statistical Database (accessed October 2015).
Figure 8.C: Relationship between electricity and educational attainment
Source: Authors’ calculations, based on World Bank,
World Development Indicators (accessed 13 October
2015).
Figure 8.D: Relationship between energy consumption per capita and human development index score
Source: Authors’ calculations, based on U.S. Energy
Information Administration, International Energy Statistics
database (available from www.eia.gov/); and United
Nations Development Programme, 2015 Human
Development Statistical Tables (available from
http://hdr.undp.org/en/data).
AFG
BGD BTN
IND
MDV
NPL
PAK
y = -1.01x + 107.72 R² = 0.71
0
20
40
60
80
100
120
140
160
180
0 50 100
Un
der
fiv
e m
ort
alit
y ra
te, 2
01
1-2
01
5
Access to improved sanitation, 2011-2015
AFG
BGD
BTN
IND
MDV
NPL PAK
LKA
y = -1.24x + 152.18 R² = 0.23
0
50
100
150
200
250
300
350
400
450
0 50 100
Mat
ern
al m
ort
alit
y ra
tio
, 20
13
Paved roads (percentage of roads), 2012
AFG
BGD BTN
IND
NPL PAK
LKA
y = 0.48x + 47.19 R² = 0.56
0
10
20
30
40
50
60
70
80
90
100
0 50 100
Ad
ult
lite
racy
rat
e
Access to electricity (percentage of population), 2012
AFG
BGD BTN IND
MDV
NPL PAK
LKA
y = 0.081ln(x) + 0.41 R² = 0.77
0
0.1
0.2
0.3
0.4
0.5
0.6
0.7
0.8
0.9
1
0 200 400 600 800 1000
Hu
man
dev
elo
pm
ent
ind
ex, 2
01
4
Total primary energy consumption per capita (million Btu per person), 2011

South and South-West Asia Development Papers 1601
August 2016
20
Recent research suggests that GDP in Bangladesh could increase by 8% and household
incomes by 6% to 8% if investment in utilities, transport and social services infrastructure
increased by 20%.27
In Pakistan, infrastructure investment of 4% could increase long-run GDP
by 1.0% to 1.3% and household income by 0.9% to 1.2%, also decreasing poverty by up to 0.4%
and reducing inequality.28
To close their infrastructure gaps, countries in South Asia require large-scale resources,
estimated at about $2.5 trillion, by 202029
and $4 trillion to $5 trillion by 2030.30
India alone is
investing $1 trillion in infrastructure, which is being done under the Twelfth Five Year Plan
(2012-2017).
f. Sustainable industrialization, economic growth and decent jobs
The centrality of sustained economic growth has been recognized in the 2030 Agenda in
Goal 8, while Goal 9 on industrialization and Goal 1 on poverty reduction are also related to
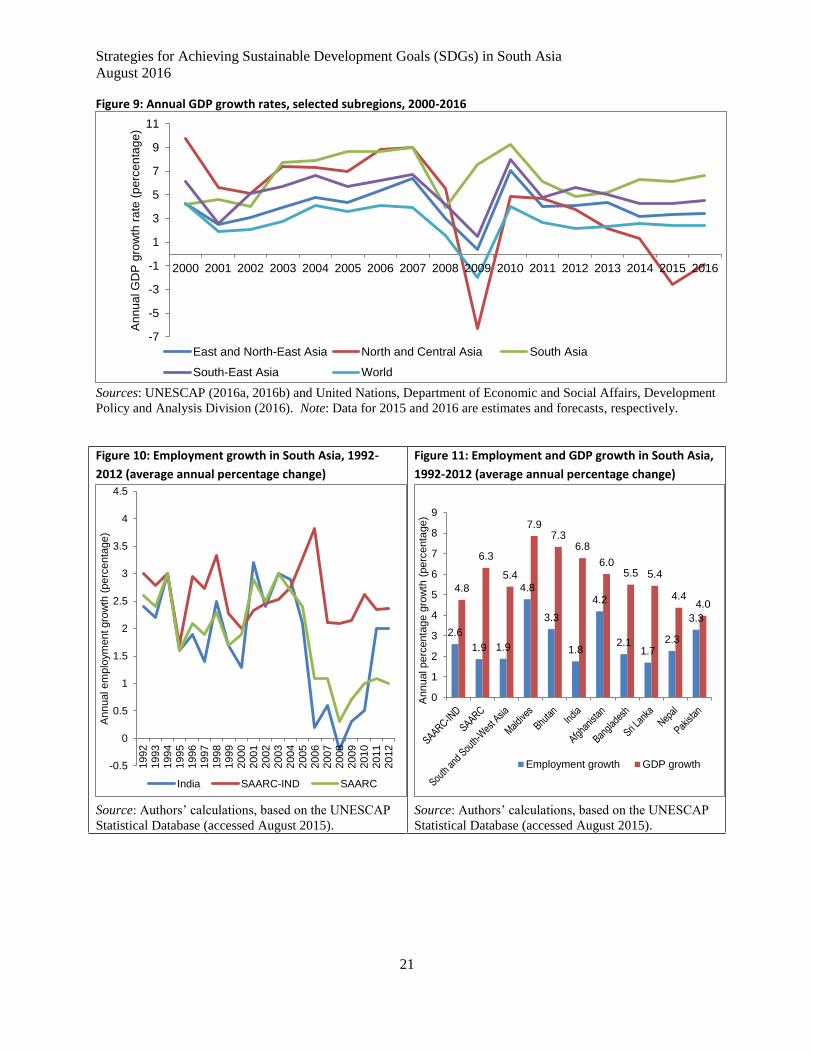
sustained economic growth. South Asia has emerged as the fastest growing subregion in Asia
and the Pacific economically, even though it is yet to reach the high economic growth phase
witnessed before the onset of the global financial crisis (see figure 9). However, the growth rate
of employment creation in South Asia has been declining. Employment growth averaged 1.8%
annually in India and 2.6% annually in the rest of South Asia between 1992 and 2012 (see figure
10). GDP growth over the same period was three times faster than employment growth in India
(6.8% annually) and 1.8 times faster than employment growth in the rest of South Asia (see
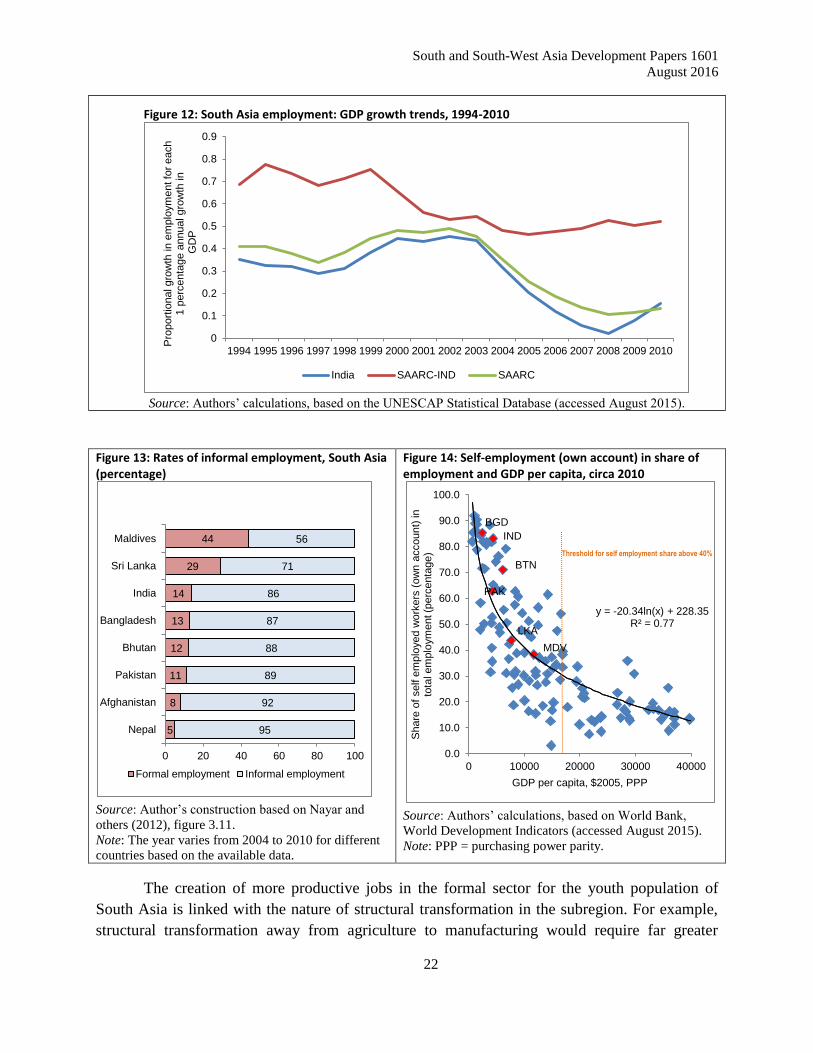
figure 11). The employment impact of growth has slowed in the subregion (see figure 12). The
employment elasticity of growth – the percentage change in employment for a 1% increase in
growth – began declining in the subregion after 2000. In India, the employment elasticity of
growth rose briefly at the turn of the millennium, but declined steadily after 2003, with growth
generating only half the employment it did before 2003. In the rest of the subregion, employment
elasticity declined from above 0.75 in 1999 to about 0.5 in 2005, where it has remained since.
Furthermore, over 80% of workers in the subregion work informally, with little or no
protection or rights (see figure 13). Such work is also low in value added and fails to stimulate
investments in human capital that can create virtuous cycles of more efficient, inclusive and
sustainable growth. A high proportion of informal sector jobs has perpetuated extreme poverty
and inequality. South Asia cannot accelerate sustainable development without investing in
greater value added through a greater concentration of formal jobs across all economic sectors
(see figure 14).
27 ADB (2012).
28 Ahmed, Abbas and Ahmed (2013).
29 Andrés, L., D. Biller, and M.H. Dappe (2013).
30 Ernst & Young (2015).
Strategies for Achieving Sustainable Development Goals (SDGs) in South Asia
August 2016
21
Figure 9: Annual GDP growth rates, selected subregions, 2000-2016
Sources: UNESCAP (2016a, 2016b) and United Nations, Department of Economic and Social Affairs, Development
Policy and Analysis Division (2016). Note: Data for 2015 and 2016 are estimates and forecasts, respectively.
Figure 10: Employment growth in South Asia, 1992-
2012 (average annual percentage change)
Source: Authors’ calculations, based on the UNESCAP
Statistical Database (accessed August 2015).
Figure 11: Employment and GDP growth in South Asia,
1992-2012 (average annual percentage change)
Source: Authors’ calculations, based on the UNESCAP
Statistical Database (accessed August 2015).
-7
-5
-3
-1
1
3
5
7
9
11
2000 2001 2002 2003 2004 2005 2006 2007 2008 2009 2010 2011 2012 2013 2014 2015 2016
An
nu
al G
DP
gro
wth
ra
te (
pe
rce
nta
ge
)
East and North-East Asia North and Central Asia South Asia
South-East Asia World
-0.5
0
0.5
1
1.5
2
2.5
3
3.5
4
4.5
1992
1993
1994
1995
1996
1997
1998
1999
2000
2001
2002
2003
2004
2005
2006
2007
2008
2009
2010
2011
2012
Annual em
plo
ym
ent gro
wth
(perc
enta
ge)
India SAARC-IND SAARC
2.6
1.9 1.9
4.8
3.3
1.8
4.2
2.1 1.7
2.3
3.3
4.8
6.3
5.4
7.9 7.3
6.8
6.0 5.5 5.4
4.4 4.0
0
1
2
3
4
5
6
7
8
9
Annual perc
enta
ge g
row
th (
perc
enta
ge)
Employment growth GDP growth
South and South-West Asia Development Papers 1601
August 2016
22
Figure 12: South Asia employment: GDP growth trends, 1994-2010
Source: Authors’ calculations, based on the UNESCAP Statistical Database (accessed August 2015).
Figure 13: Rates of informal employment, South Asia (percentage)
Source: Author’s construction based on Nayar and
others (2012), figure 3.11.
Note: The year varies from 2004 to 2010 for different
countries based on the available data.
Figure 14: Self-employment (own account) in share of employment and GDP per capita, circa 2010
Source: Authors’ calculations, based on World Bank,
World Development Indicators (accessed August 2015).
Note: PPP = purchasing power parity.
The creation of more productive jobs in the formal sector for the youth population of
South Asia is linked with the nature of structural transformation in the subregion. For example,
structural transformation away from agriculture to manufacturing would require far greater
0
0.1
0.2
0.3
0.4
0.5
0.6
0.7
0.8
0.9
1994 1995 1996 1997 1998 1999 2000 2001 2002 2003 2004 2005 2006 2007 2008 2009 2010
Pro
port
ional gro
wth
in
em
plo
ym
ent fo
r each
1 p
erc
enta
ge a
nnual gro
wth
in
G
DP
India SAARC-IND SAARC
5
8
11
12
13
14
29
44
95
92
89
88
87
86
71
56
0 20 40 60 80 100
Nepal
Afghanistan
Pakistan
Bhutan
Bangladesh
India
Sri Lanka
Maldives
Formal employment Informal employment
BGD
BTN
IND
MDV
PAK
LKA
y = -20.34ln(x) + 228.35 R² = 0.77
0.0
10.0
20.0
30.0
40.0
50.0
60.0
70.0
80.0
90.0
100.0
0 10000 20000 30000 40000
Share
of
self e
mplo
yed w
ork
ers
(ow
n a
ccount)
in
to
tal em
plo
ym
ent (p
erc
enta
ge)
GDP per capita, $2005, PPP
Threshold for self employment share above 40%

Strategies for Achieving Sustainable Development Goals (SDGs) in South Asia
August 2016
23
formal and productive work. A Lewisian structural shift in employment from rural agricultural
underemployment to greater value added urban manufacturing as countries develop would boost
inclusive growth, absorbing the excess and low productivity rural labour supply and driving up
work and wages in urban industry.31
The structural transformation in South Asia has moved from
agriculture towards services, bypassing industry, which has seen its share in GDP remaining at
virtually the same level since 1991. In fact, the share of industry and manufacturing in value
added in countries in South Asia is among the lowest in the Asian and Pacific region (see figure
15). This has implications for the employment elasticity of economic growth, as industry,
especially manufacturing, generates jobs directly in addition to a substantial proportion of jobs
created indirectly in other sectors through extensive backward and forward linkages.
Figure 15: Share of manufacturing and industry in GDP of selected countries in Asia, 1990-2014
Source: Authors’ calculations, based on World Bank, World Development Indicators (accessed 28 October 2015).
Fostering manufacturing can lead to faster poverty reduction through job creation and
other externalities than through growth generated in other productive sectors. Figure 16 shows
the negative relationship observed between the poverty headcount ratio and the share of
manufacturing value added in GDP.
31 See Lewis (1954).
0 20 40
Pakistan
India
Bangladesh
Sri Lanka
Indonesia
Malaysia
Republic of Korea
China
Thailand
Manufacturing value added (percentage of GDP)
2014 2000 1990
0 20 40 60
Pakistan
Bangladesh
India
Sri Lanka
Republic of Korea
Malaysia
Thailand
China
Indonesia
Industry value added (percentage of GDP)
2014 2000 1990

South and South-West Asia Development Papers 1601
August 2016
24
Figure 16: Relationship between manufacturing value added and poverty
Source: Authors’ calculations, based on World Bank, World Development Indicators (accessed
16 October 2015).
Therefore, the SDG target of increasing the share of industry in GDP and doubling it for
LDCs is particularly relevant for South Asia for its potential to create decent productive jobs and
foster economic growth. However, industrialization should be fostered in a more sustainable
manner than in the past with a focus on efficient use of energy and raw materials and emphasis
on recycling.
g. Exploiting the potential of renewable energy
With greater reliance on renewable energy resources South Asian countries can not only
address the energy scarcities but also save valuable foreign exchange that is currently spent on
imports of hydrocarbons. Nepal is an important example of a country suffering from a high
degree of power scarcity, with up to 14 hours of power cuts each day in the city of Kathmandu,
despite the country being endowed with some of the greatest hydroelectric generation potential
in per capita terms in the world. By contrast, Bhutan is harnessing its hydropower potential to
generate sustainable growth. South Asia can tap its vast solar and wind energy potential. South
Asian countries can also switch over to cleaner fuels such as natural gas and clean coal
technologies in coal-based power generation. They can benefit from developing a unified energy
market, linked by energy grids and pipelines, and forums for sharing good practices across the
subregion in enhancing energy conservation and energy efficiency.
4. Modelling the Impacts of an SDG-based policy strategy for South Asia
The key policy strategies identified in the previous section map the 2030 Agenda for
South Asia’s situation and context. In this section we analyze the impacts of adopting these
policy strategies in terms of economic and social gains. The available data sets and modelling
AFG BGD
BTN
IND NPL
PAK
LKA
y = -1.38x + 46.81 R² = 0.26
0
10
20
30
40
50
60
70
80
0 5 10 15 20 25 30 35 40
Po
vert
y h
ead
cou
nt
rati
o a
t n
atio
nal
po
vert
y lin
es
(per
cen
tage
of
po
pu
lati
on
)
Manufacturing average value added (percentage of GDP), 2010-2014
Strategies for Achieving Sustainable Development Goals (SDGs) in South Asia
August 2016
25
tools allow examination of impacts of three key policies aligned with SDGs 2, 8 and 9, namely
an industry-oriented structural transformation (target 8.2), sustainable agriculture productivity
boosts (target 2.3), and increased efficiency in the economy by removing supply bottlenecks and
fostering innovation (target 9.2).
a. Modelling framework and methodology
The issue of the data and monitoring of the SDGs is a critical ongoing process of
intergovernmental negotiation, spearheaded by the United Nations Statistical Commission and
the associated Interagency Expert Group on SDG Indicators (IAEG-SDG) and the outcomes of
the process will help guide the data priorities for analysis, projection and simulation of the
impacts of development trends and policies for achieving the SDGs and financing the required
policies.32
Different methodologies exist for analyzing the empirical impacts of the variety of
different economic, social and environmental development dimensions that the SDGs
encompass. For example, Schmidt-Traub (2015) identifies five different types of empirical
methodologies for estimating SDG needs assessments, one of which is computable general
equilibrium modelling (CGE).33
In the context of South Asia, this paper presents the results of an application of a CGE to
consider the differentiated impacts of selected policies for five South Asia countries in achieving
the SDGs. The UNESCAP-SANEM South Asia Model combines country models for the five
countries of South Asia; Bangladesh, India, Nepal, Pakistan and Sri Lanka, which combined
make up 98.2 per cent of the population in the subregion.34
The model relies upon updated social
accounting matrices for each country that map key sectors’ transformation of resources based on
national data for 2011-2012.35
The UNESCAP-SANEM South Asia Model was applied here to consider the impacts of a
policy strategy that integrates three key policies aligned with SDGs 2, 8 and 9, namely an
industry-oriented structural transformation (target 8.2), sustainable agriculture productivity
boosts (target 2.3), and increased efficiency in the economy by removing supply bottlenecks and
fostering innovation (target 9.2).
Within the 2030 Agenda, SDG-2 on ending hunger, achieving food security and
improved nutrition and promoting sustainable agriculture includes target 2.3 to, by 2030, double
32 See United Nations Statistical Commission’s Inter-agency and Expert Group on Sustainable Development Goal
Indicators (IEAG-SDGs), http://unstats.un.org/sdgsmeetings/iaeg-sdgs-meetings-03.html 33
Schmidt-Traub (2015). 34
The UNESCAP-SANEM South Asia Model, has been developed under the direction of Prof. Selim Raihan of the
South Asia Network on Economic Modelling at Dhaka University, Bangladesh in collaboration with UNESCAP. 35
A description of the computable equilibrium model structure and social accounting matrices used in the
UNESCAP-SANEM Model is given in Raihan (2015).
South and South-West Asia Development Papers 1601
August 2016
26
the agricultural productivity and incomes of small-scale food producers, in particular women,
indigenous peoples, family farmers, pastoralists and fishers, including through secure and equal
access to land, other productive resources and inputs, knowledge, financial services, markets and
opportunities for value addition and non-farm employment. SDG 8 on sustainable growth
includes target 8.2 to achieve higher levels of economic productivity through diversification,
technological upgrading and innovation, including through a focus on high-value added and
labour-intensive sectors. This would provide positive impacts on total factor productivity. SDG 9
on resilient infrastructure, inclusive and sustainable industrialization and fostering innovation
includes target 9.2 to promote inclusive and sustainable industrialization and, by 2030,
significantly raise industry’s share of employment and gross domestic product, in line with
national circumstances, and double its share in least developed countries.
The model simulates the impact of policies under SDG targets 2.3, 8.2 and 9.2 by
considering the combined impact policies would have in three specific scenarios. Firstly, for the
case of policies that would result in shocks that double agricultural productivity in grains in all
the countries, relative to their baseline productivity. Secondly, the result of policies to stimulate
industrialization that would double the ratio of industry as a share of total output for least
developed countries of Bangladesh and Nepal, and increase the share of industry in total output
by 1.5 times for India, Pakistan and Sri Lanka. Finally, the model also includes the result of
policies that increase total factor productivity by 5% above the baseline for all five countries
included in the simulation.
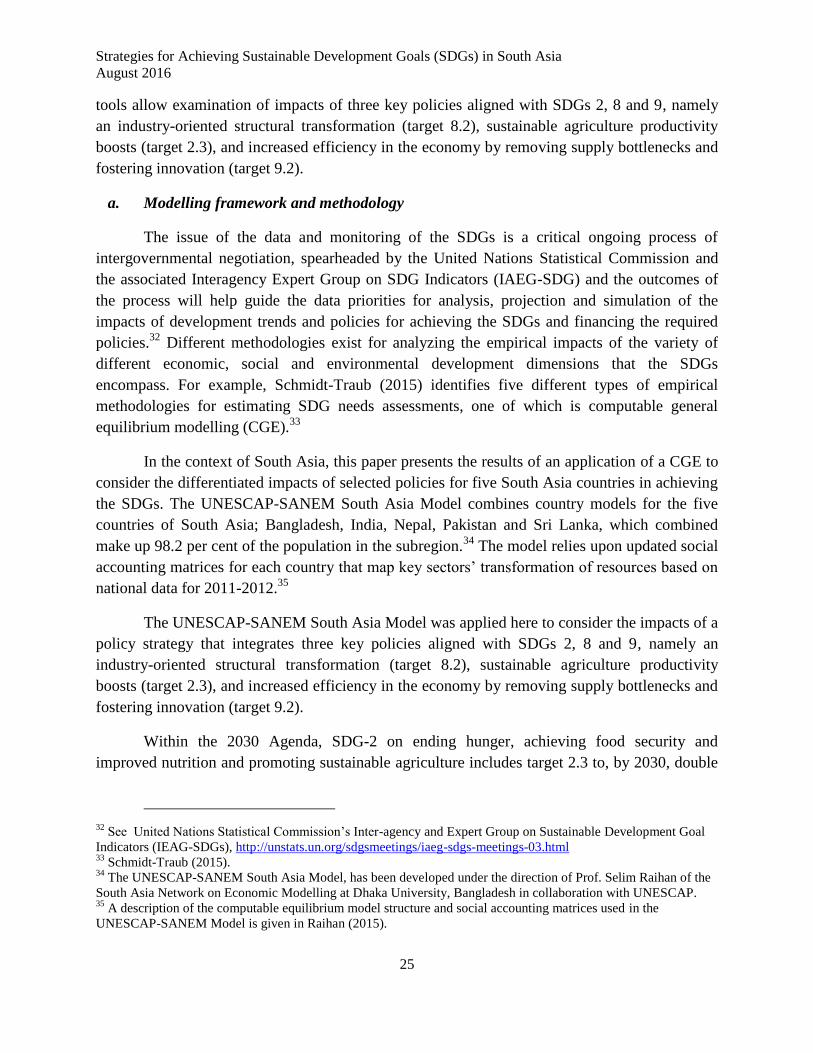
b. Impact of selected SDG policy strategies
The results of the application of the UNESCAP-SANEM Model to the selected SDG
policy strategies show that a successful policy strategy for just these three associated SDG
targets would increase GDP by between 15% and 30% across the five countries of South Asia on
top of the business-as-usual scenario. In addition, if countries can improve their pro-poor and
job-creating growth by 25% above the best historical performance over the period 1990-2015,
additional 71 million people would be lifted out of extreme poverty and an additional 56 million
jobs would be created by 2030 in these five countries (see figure 17).
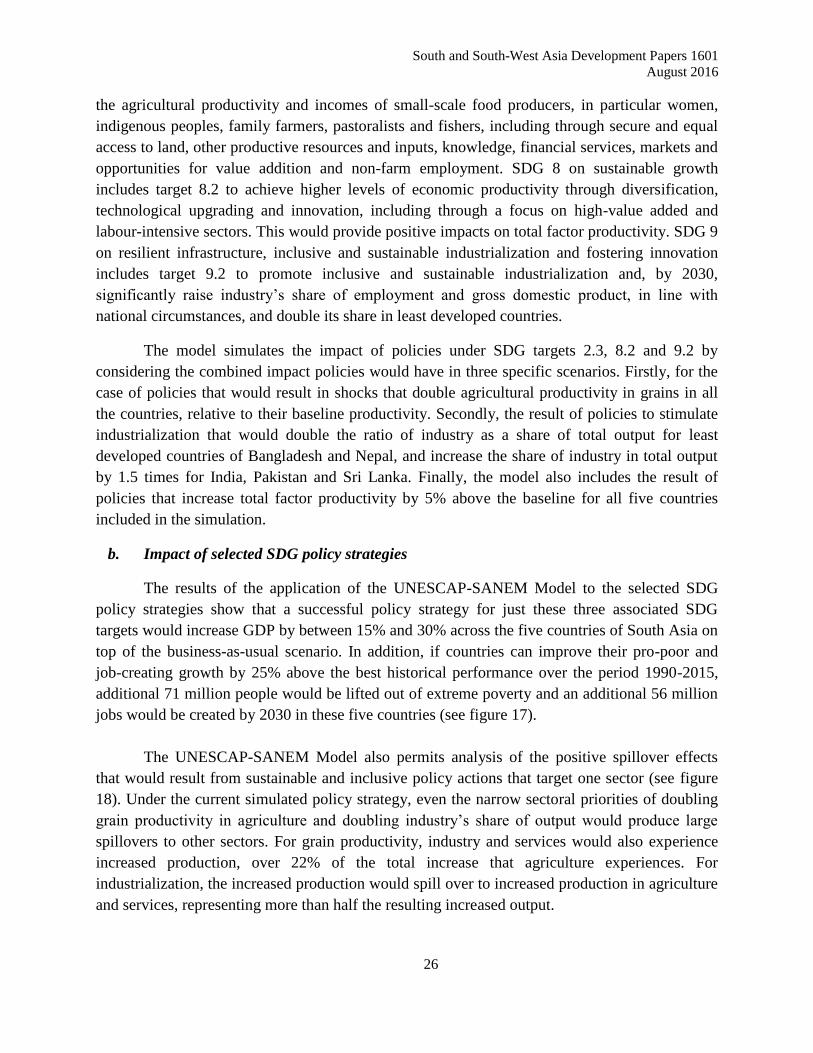
The UNESCAP-SANEM Model also permits analysis of the positive spillover effects
that would result from sustainable and inclusive policy actions that target one sector (see figure
18). Under the current simulated policy strategy, even the narrow sectoral priorities of doubling
grain productivity in agriculture and doubling industry’s share of output would produce large
spillovers to other sectors. For grain productivity, industry and services would also experience
increased production, over 22% of the total increase that agriculture experiences. For
industrialization, the increased production would spill over to increased production in agriculture
and services, representing more than half the resulting increased output.
Strategies for Achieving Sustainable Development Goals (SDGs) in South Asia
August 2016
27
Figure 17: Selected impacts of an SDG-based productivity and industrialization policy strategy in South Asia
Source: Based on the UNESCAP-SANEM South Asia Model.
Figure 18: Spillover effects: Share of sector policy impact that boosts production in non-target sectors
Source: Based on the UNESCAP-SANEM South Asia Model.
At the national level, all countries in South Asia would experience significant gains from
implementing the three policy strategies. Of the five countries contained in the model, Sri Lanka
and Nepal would experience the biggest impacts, with GDP boosted around 30% beyond its
baseline (See figure 19). Bangladesh and India would increase their GDP by more than 20%
while Pakistan would experience a GDP increase of nearly 16%.
0% 20% 40% 60% 80% 100%
Household income
GDP
Employment
Poverty reduction
Industry-oriented growth Sustainable agriculture (grains) Total Factor Productivity boost
71.5million peopleout of poverty
56.1million
more jobs
21.9%GDP boost
17.1%boost in
householdincome
9%
13%
78%
Grain productivity impact on ServicesGrain productivity impact on IndustryGrain productivity impact on Agriculture
23%
35%
42%
Industry-oriented growth impact on AgricultureIndustry-oriented growth impact on ServicesIndustry-oriented growth impact on Industry

South and South-West Asia Development Papers 1601
August 2016
28
Figure 19: National impacts on GDP from an SDG-based productivity
Source: Based on the UNESCAP-SANEM South Asia Model.
National impacts of the policy strategy on poverty and employment are naturally greater
in larger countries (see figure 20). In India alone over 35 million people would be lifted out of
poverty and more than 25 million jobs would be created. In Sri Lanka, with its much smaller
population, over 370,000 people would be lifted out of poverty and nearly 740,000 jobs would be
created. Another notable effect is the equal contribution of each policy to this overall result.
Figure 20: National impacts of policy strategy on poverty and employment in South Asia
Source: Based on the UNESCAP-SANEM South Asia Model.
The policy strategy would also have positive impacts at the national level, across the
board, not only on GDP but also on exports and household income (see figure 21). Across the
countries, household incomes would increase by at least 15% and as high as 25% in Sri Lanka.
0 5 10 15 20 25 30 35
Pakistan
India
Bangladesh
Nepal
Sri Lanka
Industry-oriented growth Sustainable agriculture (grains) Total Factor Productivity boost
30.8
29.7
24.1
22.0
15.7
0.0
1.0
2.0
3.0
4.0
5.0
6.0
7.0
8.0
9.0
10.0
Po
ve
rty R
ed
uction
Em
plo
ym
en
t
Po
ve
rty R
ed
uction
Em
plo
ym
en
t
Po
ve
rty R
ed
uction
Em
plo
ym
en
t
Po
ve
rty R
ed
uction
Em
plo
ym
en
t
Sri Lanka Nepal Bangladesh Pakistan
Millio
ns
Total factor productivity Grain productivity Industry-oriented growth
0.0
5.0
10.0
15.0
20.0
25.0
30.0
35.0
40.0
Po
ve
rty R
ed
uction
Em
plo
ym
en
t
India
Millio
ns

Strategies for Achieving Sustainable Development Goals (SDGs) in South Asia
August 2016
29
Sri Lanka would also experience the largest relative export gains from the strategy, but exports
would increase over 25% - 30% for Bangladesh, Nepal and Sri Lanka.
Figure 21: National impacts of policy strategy on exports, GDP, and household income in South Asia
Source: Based on the UNESCAP-SANEM South Asia Model.
The benefits from implementing just a few of the SDG policy strategies are significant.
Implementing concrete policy actions that adopt all seven SDG policy strategies would
maximize the spillovers between priorities with significant multiplier benefits for populations
and countries of the subregion towards achieving the SDGs.
5. Concluding remarks
For a subregion home to nearly 40% of the world’s poor, the 2030 Agenda presents a
unique opportunity for South Asia to eradicate poverty and other deprivations and provide a life
of dignity to all within a generation. This paper discussed key SDG policy strategies that build
upon the interrelationships between the Goals and targets that would help the subregion achieve
the SDGs. This paper then applies a new computable general equilibrium framework, called the
UNESCAP-SANEM Model, developed for SDG analysis in South Asia to estimate the impact of
three strategic policy priorities of sustained, broad-based and job-creating rapid economic growth
through industry-oriented structural transformation; and addressing food security and hunger
with agricultural productivity improvements through sustainable agriculture. These priorities
reflect specific SDG targets for SDG 2 on doubling the agricultural productivity and incomes of
small-scale food producers; SDG 8 on higher levels of economic productivity through
diversification, through a focus on high-value added and labour-intensive sectors; and SDG 9
targets related to resilient infrastructure, inclusive and sustainable industrialization. The results
of the simulations show that a successful policy strategy for just these three SDG targets would
0.0
5.0
10.0
15.0
20.0
25.0
30.0
35.0
Ho
useho
ld I
nco
me
GD
P
Expo
rts
Ho
useho
ld I
nco
me
GD
P
Expo
rts
Ho
useho
ld I
nco
me
GD
P
Expo
rts
Ho
useho
ld I
nco
me
GD
P
Expo
rts
Ho
useho
ld I
nco
me
GD
P
Expo
rts
Nepal Pakistan Bangladesh India Sri Lanka
Total factor productivity Grain productivity Industry-oriented growth
South and South-West Asia Development Papers 1601
August 2016
30
increase GDP by between 15% and 30% across the five countries of South Asia on top of a
business-as-usual strategy and has the potential for an additional 71 million people to be lifted
out of extreme poverty and an additional 56 million jobs to be created by 2030 in these five
countries.
While further research and the ongoing specification and definition of final indicators for
assessing SDG progress continues, applications of models such as the UNESCAP-SANEM
Model can be useful in highlighting significant practical and immediate policy options that can
be applied by countries in South Asia to accelerate SDG progress.

Strategies for Achieving Sustainable Development Goals (SDGs) in South Asia
August 2016
31
References
Ahmed, V., A. Abbas and S. Ahmed (2013). Public infrastructure and economic growth in
Pakistan: a dynamic CGE microsimulation analysis. In Infrastructure and Economic
Growth in Asia, J.M. Cockburn and others, eds. Springer.
Andrés, L., D. Biller and M.H. Dappe (2013). Reducing Poverty by Closing South Asia’s
Infrastructure Gap. Washington, D.C.: World Bank.
Asian Development Bank (ADB) (2012). Infrastructure for Supporting Inclusive Growth and
Poverty Reduction in Asia. Manila.
Ernst & Young (2015). PPP trends and initiatives in South Asian countries. Presentation at the
UNESCAP Policy Dialogue on Public-Private Partnerships for Infrastructure
Development in South Asia. Kathmandu, 22 and 23 September. Available from
www.unescap.org/sites/default/files/Day%201%20-%20Session%202.1%20-
%20South%20Asia%20-%20EY.pdf.
Lagarde, C. (2014). A new multilateralism for the 21st century: the Richard Dimbleby lecture.
London, 3 February. Available from
www.imf.org/external/np/speeches/2014/020314.htm.
Lewis, W.A. (1954). Economic development with unlimited supplies of labor. Manchester
School, vol. 22, No. 2 (May), pp. 139-191.
McKinsey Global Institute (2015). The Power of Parity: How Advancing Women’s Equality Can
Add $12 Trillion to Global Growth. McKinsey and Company. Available from
www.mckinsey.com/insights/growth/how_advancing_womens_equality_can_add_12_tril
lion_to_global_growth.
Nayar, R., and others (2012). South Asia Development Matters: More and Better Jobs in South
Asia. Washington, D.C.: World Bank.
Park, C.Y., and R.V. Mercado, Jr. (2015). Financial inclusion, poverty, and income inequality in
developing Asia. ADB Economics Working Paper Series, No. 426. Manila: Asian
Development Bank.
Raihan, S. (2015). Effects of unilateral trade liberalization in South Asian Countries,
Applications of CGE Models of Bangladesh, India, Nepal, Pakistan and Sri Lanka.
UNESCAP-SSWA Development Paper 1501, UNESCAP South and South-West Asia
Office. New Delhi. Available from http://www.unescap.org/sites/default/files/SSWA-
Development-Papers-1501-Selim- Raihan_0.pdf.

South and South-West Asia Development Papers 1601
August 2016
32
Ram, R. (2015). Income elasticity of poverty: estimates for South Asian countries. The
Economics and Finance Letters, vol. 2, No. 1, pp.1-7. Available from
www.pakinsight.com/pdf-files/EFL-2015-2(1)-1-7.pdf.
Schmidt-Traub, G. (2015). Investment needs to achieve the Sustainable Development Goals:
Understanding the billions and trillions. Sustainable Development Solutions Network
(SDSN) Working Paper, Version 2, 12 November, New York. Available from
http://unsdsn.org/wp-content/uploads/2015/09/151112-SDG-Financing-Needs.pdf
Sustainable Development Solutions Network (2015). Indicators and a monitoring framework for
the Sustainable Development Goals: launching a data revolution for the SDGs. Available
from http://unsdsn.org/wp-content/uploads/2015/05/FINAL-SDSN-Indicator-Report-
WEB.pdf.
Tiwari, A.K., M. Shahbaz and F. Islam (2013). Does financial development increase rural-urban
income inequality? Cointegration analysis in the case of Indian economy. International
Journal of Social Economics, vol. 40, No. 2, pp. 151-168.
United Nations (2013). A New Global Partnership: Eradicate Poverty and Transform Economies
through Sustainable Development – The Report of the High-Level Panel of Eminent
Persons on the Post-2015 Development Agenda. Available from
www.un.org/sg/management/pdf/HLP_P2015_Report.pdf.
United Nations, Department of Economic and Social Affairs, Development Policy and Analysis
Division (2016). World Economic Situation and Prospects 2016: Update as of mid-2016.
New York. Available from
http://www.un.org/en/development/desa/policy/wesp/wesp_current/2016wesp_update.pdf
.
United Nations Development Group (2013). A Million Voices: The World We Want – A
Sustainable Future with Dignity for All. Available from
www.worldwewant2015.org/bitcache/9158d79561a9de6b34f95568ce8b389989412f16?vi
d=422422&disposition=inline&op=view.
United Nations Development Programme (UNDP) (2014). Human Development Report
2014.Sustaining Human Progress: Reducing Vulnerabilities and Building Resilience.
New York: UNDP.
United Nations, Economic and Social Commission for Asia and the Pacific (UNESCAP)
(2015a). Economic and Social Survey of Asia and the Pacific 2015 – Part I: Making
Growth More Inclusive for Sustainable Development. Sales No. E.15.II.F.7.

Strategies for Achieving Sustainable Development Goals (SDGs) in South Asia
August 2016
33
___________ (2015b). Report of the Asia-Pacific Forum on Sustainable Development on Its
Second Session. 22 May.
___________ (2016a). Economic and Social Survey of Asia and the Pacific 2015: Year-End
Update. ST/ESCAP/2743.
___________ (2016b). Economic and Social Survey of Asia and the Pacific 2016: Nurturing
productivity for inclusive growth and sustainable development. Sales No. E.16.II.F.10.
United Nations, Economic and Social Commission for Asia and the Pacific (UNESCAP) and
others (2014). Nagarkot Statement. South Asia Consultation on the Post-2015
Development Agenda: Sustainable Development Goals and the Means of
Implementation. Nagarkot, Nepal, 26-28 August. Available from
www.unescap.org/sites/default/files/SA%20consultation_Post-
2015_Nepal_Outcome%20document_0.pdf.
United Nations, Economic and Social Commission for Asia and the Pacific (UNESCAP) and
Thailand, Ministry of Foreign Affairs (2013). Bangkok Declaration of the Asia-Pacific
region on the United Nations Development Agenda beyond 2015. DEV/APMD/2013/2.
Available from http://apmd2013.unescap.org/documents/APMD2013_Declaration.pdf.
United Nations, Economic and Social Commission for Asia and the Pacific (UNESCAP), Asian
Development Bank (ADB), and United Nations Development Programme (UNDP)
(2015). Making It Happen: Technology, Finance and Statistics for Sustainable
Development in Asia and the Pacific – Asia-Pacific Regional MDG Report 2014/15.
Available from www.asia-pacific.undp.org/content/rbap/en/home/library/mdg/asia-
pacific-mdg-2014-2015.html.
United Nations, Economic and Social Commission for Asia and the Pacific, South and South-
West Asia Office (UNESCAP SSWA) (2012). Regional Cooperation for Inclusive and
Sustainable Development: South and South-West Asia Development Report 2012-13.
New Delhi: Routledge. ST/ESCAP/2644.
United Nations Resident Coordinator’s Office (2013). National Consultation Report: Post-2015
Development Framework – India. New Delhi. Available from
www.in.undp.org/content/dam/india/docs/poverty/national-consultation-report--post-
2015-development-agenda.pdf.
World Economic Forum (2014). The Global Gender Gap Report. Geneva.
__________ (2015). The Global Competitiveness Report 2015-2016. Geneva.