strategic trading and trade reporting by corporate - econstor
TRANSCRIPT

SCHUMPETER DISCUSSION PAPERS
Strategic Trading and Trade Reporting by Corporate Insiders
André Betzer Jasmin Gider
Daniel Metzger Erik Theissen
SDP 2011-015 ISSN 1867-5352
© by the author

Strategic Trading and Trade Reporting by Corporate Insiders*
André Betzer, Jasmin Gider, Daniel Metzger, and Erik Theissen 1F
**
November 2011
Abstract
Regulations in the pre-Sarbanes–Oxley era allowed corporate insiders considerable flexibility in strategically timing their trades and SEC filings, e.g., by executing several trades and reporting them jointly after the last trade. We document that even these lax reporting requirements were frequently violated and that strategic timing of trades and reports was common. Event study abnormal returns are larger after reports of strategic trades than after reports of otherwise similar nonstrategic trades. Our results imply that delayed reporting impedes the adjustment of prices to the information revealed by insider trades. They lend strong support to the more stringent reporting requirements established by the Sarbanes–Oxley Act.
Keywords: Insider trading, directors' dealings, corporate governance, market efficiency
JEL classification: G14, G30, G32
* We thank Wolfgang Bessler, Hans Degryse, Joost Driessen, Peter de Goeij, Frank de Jong, Alexander Kempf, Vincent
van Kervel, Torsten Luedecke, Mieszko Mazur, Martin Ruckes, Chester Spatt, Monika Trapp, and seminar participants at
ESSEC, Schulich School of Business, at the universities of Bonn, Cologne, Hannover, Karlsruhe, Mannheim, and
Tilburg, at the 2008 FMA European Conference in Prague, the 2008 Annual Meeting of the EFMA in Athens, the 5th
Conference of the Portuguese Finance Network in Coimbra, the 7th International Conference on Corporate Governance at
the University of Birmingham, the 2010 EFA annual meeting in Frankfurt, the 2010 FMA annual meeting in New York,
and the 2010 CRSP Forum in Chicago for valuable comments. ** André Betzer, University of Wuppertal, e-mail: [email protected], +49 202 439 2905; Jasmin Gider, Bonn
Graduate School of Economics, e-mail: [email protected], +1 416 571 4911; Daniel Metzger, Stockholm School of
Economics, e-mail: [email protected], +46 8 736 9141; Erik Theissen, University of Mannheim, Centre for
Financial Research (Cologne) and Center for Financial Studies (Frankfurt), e-mail: [email protected], +49 621
181 1517.
SCHUMPETER DISCUSSION PAPERS 2011-015

2
Strategic Trading and Trade Reporting by Corporate Insiders
November 2011
Abstract
Regulations in the pre-Sarbanes–Oxley era allowed corporate insiders considerable flexibility in strategically timing their trades and SEC filings, e.g., by executing several trades and reporting them jointly after the last trade. We document that even these lax reporting requirements were frequently violated and that strategic timing of trades and reports was common. Event study abnormal returns are larger after reports of strategic trades than after reports of otherwise similar nonstrategic trades. Our results imply that delayed reporting impedes the adjustment of prices to the information revealed by insider trades. They lend strong support to the more stringent reporting requirements established by the Sarbanes–Oxley Act.
Keywords: insider trading, directors' dealings, corporate governance, market efficiency
JEL classification: G14, G30, G32
SCHUMPETER DISCUSSION PAPERS 2011-015

1
1. Introduction
Corporate insiders arguably know more about the prospects of their firms than other market
participants. This hypothesis is supported by a host of papers documenting that insider trades, and
purchases in particular, convey information to the market (e.g., Seyhun (1986) and Chang and
Suk (1998) for the US; Fidrmuc et al. (2006) and Friederich et al. (2002) for the UK). The US
and many other countries have adopted regulations that require corporate insiders to report their
trades.1 The model of Huddart et al. (2001) provides a theoretical justification for these
regulations. The authors show that information is reflected more rapidly in prices when insiders
have to disclose their trades. Several empirical papers (e.g., Chang and Suk (1998), Betzer and
Theissen (2009)) have shown that share price reactions occur on both the trading and reporting
dates. Thus, without this reporting, the market is unable to infer the full information content of
the trade, which implies that market prices are distorted in the period between the trading and
reporting dates. Delayed reporting, then, may impede the price adjustment to information
revealed by the insider trade.
In the era prior to the Sarbanes–Oxley Act (SOX), Section 16 of the Securities Exchange Act
required corporate insiders in the US to report their trades by the 10th of the month following the
trade. Thus, the maximum time allowed between the trade and the report was 40 days, allowing
1 Some countries (e.g., the UK) even prohibit trading by corporate insiders in certain circumstances. Similarly,
many listed firms in the US have adopted policies restricting trading by insiders (Bettis et al. (2000)).
SCHUMPETER DISCUSSION PAPERS 2011-015
2
corporate insiders considerable flexibility to time their trades and reports. This flexibility could
be used strategically. An insider wishing to trade a large quantity could split up the order into
several smaller chunks. Splitting up a large order reduces the order’s price impact and thus results
in reduced execution costs (e.g., Kyle (1985), Chordia and Subrahmanyam (2004)). However, if
the insider reported each individual trade immediately, the share price reaction on the reporting
date would move the price against the insider, and subsequent trades would occur at less
favorable prices. Consequently, the insider has an incentive to delay the reporting of a series of
trades until after the last transaction. By doing so, insiders can benefit from the reduced price
impacts of split-up trades while avoiding the adverse price reaction that immediate reports would
trigger. The present paper analyzes incidences of strategically timed U.S. Securities and
Exchange Commission (SEC) filings. We identify a trade as strategic whenever it is either
followed by another trade by the same insider before it is reported or executed after another trade
by the same insider that has not yet been reported.
Note that the incentive to strategically time trades and reports does not depend on the assumption
that the insider trades on private information. The only assumption necessary for our argument is
that other market participants believe that insiders possess private information with a positive
probability. The stylized fact that prices react to the publication of insider trades supports this
assumption.
This paper asks four related questions. First, how long are reporting delays during the pre-SOX
era? Second, do insiders strategically use their flexibility in choosing the timing and reporting of
SCHUMPETER DISCUSSION PAPERS 2011-015

3
their trades, and, if so, is this strategic behavior systematically related to the characteristics of the
insider or the firm? Third, what are the implications of delayed reporting on the informativeness
of prices? Fourth, how does the market react to the strategic timing of trades and reports?
The first question is important because, as argued above, delayed reporting can impede the
adjustment of prices to the information revealed by the insider trades. The relevance of the
second question derives from the observation that strategic timing benefits the insider at the
expense of other market participants. If each trade were reported immediately, the second and
subsequent trades of a series of insider trades would be executed at prices less favorable to the
insider but more favorable to the insider’s counterparties. The answer to the third question allows
us to assess the relevance of the issues addressed in this paper. The fourth question is important
because its answer enables us to draw inferences on the trading motives of insiders engaging in
strategic timing. On reporting dates, market participants learn whether the strategic delay of
reports has occurred. If market participants believe that insiders possessing private information
are more likely to time their trades and reports, one should observe a larger price reaction than
that for an otherwise similar but nonstrategic trade.
Our results can be summarized as follows. First, reporting delays were substantial in the pre-SOX
period. The mean reporting delay was 35 days and the median was 24 days, with 13.2% of all
trades in our sample reported later than on the 10th of the month following the trade. The very
large number of violations of the trade reporting requirement implies that the requirement was
apparently not well-enforced. We further find clear evidence of strategic trading. Only 32.1% of
SCHUMPETER DISCUSSION PAPERS 2011-015

4
the trades in our sample were nonstrategic trades (i.e., these trades were reported before the same
insider traded again, and they were not preceded by a trade by the same insider that had not yet
been reported).
Logit models reveal that the occurrence of both late filings and strategic trades is systematically
related to firm, trade, and trader characteristics. In particular, the results are consistent with the
notion that insiders who are more closely monitored (and who therefore may be facing higher
litigation risks) are less likely to file their trades late.
Consistent with previous findings, our event study results show that share prices react to the
reporting of insider trades. The cumulative abnormal returns (CARs) over 10- and 20-day
windows are larger after purchases than after sales. In cross-sectional regressions we find that the
magnitude of the price reaction decreases only slowly in the reporting delay (after insider sales),
or not at all (after purchases). Thus, our results support the notion that market prices are distorted
in the period between a trade and its report. Finally, event study CARs are larger after reports of
strategic insider trades than after reports of otherwise similar nonstrategic trades. Thus, market
participants apparently believe that insiders acting strategically are more likely to possess private
information.
Our results clearly support the more stringent trade reporting requirements established by SOX.
They also suggest that countries that currently allow longer reporting delays should consider
revising and/or enforcing their regulations. Recent evidence reported in Fidrmuc et al. (2008)
suggests that some countries do not yet mandate and enforce timely trade reporting. Using recent
SCHUMPETER DISCUSSION PAPERS 2011-015
5
samples (ending May 2007), the authors find median reporting delays of five days for Italy, seven
days for Belgium, and 14 days for France.
Our paper is related to recent papers by Cheng et al. (2007), Betzer and Theissen (2010), Brochet
(2010), Carter et al. (2003) and Lebedeva et al. (2009). Cheng et al. (2007) exploit the feature
that corporate insiders in the US could, in certain circumstances, delay the reporting of non-open
market trades until the end of the fiscal year of the firm (SEC Form 5 trades). The authors find
that insider sales by top executives in Standard & Poor’s 500 firms disclosed in such a delayed
manner predict negative future returns and lower operating profitability relative to analyst
forecasts. Insider purchases, on the other hand, are hardly predictive of future returns. Cheng et
al. (2007) conclude that “managers in large firms may have used late-disclosure Form 5 sales for
information-based trading” (p. 1861). Betzer and Theissen (2010) use data from Germany to
show that substantial reporting delays are common, that the delays are systematically related to
firm characteristics, and that abnormal returns after the reporting dates of insider trades are
independent of reporting delays. The latter finding implies that prices are distorted in the period
between the trading and reporting dates. Carter et al. (2003) analyze a sample of insider buy
transactions between 1991 and 1994 and find evidence of substantial reporting delays. They
further report that CARs in the period between the trading and the reporting date are positively
related to the length of the reporting delay. Brochet (2010) focuses on differences in the
information content of insider trades before and after SOX. The author regresses event study
CARs on a set of explanatory variables, including the reporting delay, and finds that price
reactions after purchases are weaker when trades are reported with longer lags, but that the
SCHUMPETER DISCUSSION PAPERS 2011-015

6
reverse is true for insider sales. Lebedeva et al. (2009) find strong evidence that corporate
insiders in the US break up larger trades into series of smaller trades. The authors refer to this as
stealth trading. They also find that liquidity-based explanations for this behavior have more
explanatory power than information-based explanations.
Our paper differs from these papers in that it is the first to systematically document strategic trade
reporting and to analyze the determinants and implications of this phenomenon. It further differs
from Cheng et al. (2007) in that we do not analyze the relatively small sample of non-open
market trades eligible for late reporting but, rather, the much larger sample of all insider trades
that were required to be filed on SEC Form 4.2 Betzer and Theissen (2010) analyze reporting
delays in Germany but have a much smaller sample (1,977 observations as compared to 314,696
in the present paper), and, more importantly, the regulatory regime in Germany is distinctly
different from that in the US. Brochet (2010) includes a reporting delay variable in his analysis
but interprets it as a control variable measuring information leakage between trading and
reporting dates. This leakage is also the focus of the study of Carter et al. (2003). Lebedeva et al.
(2009) focus on the motives for stealth trading, but do not analyze late filings or how reporting
delays affect CARs on the reporting dates.
The remainder of the paper is organized as follows. Section I describes the data set and presents
descriptive statistics. Section II presents evidence on delayed trade reporting. Section III
2 The number of Form 5 sales (purchases) for S&P 500 stocks during 1998–2001 amounts to 438 (419). The
corresponding figures for Form 4 trades are 10,166 and 7,217, respectively (Cheng et al. (2007), Table 1D).
SCHUMPETER DISCUSSION PAPERS 2011-015

7
determines whether incidences of strategic trading and trade reporting took place and also
analyzes whether so-called strategic trades are systematically different from nonstrategic trades.
Section IV uses event study methodology to compare market responses to strategic and
nonstrategic trades. Section V presents our conclusions.
2. Data
Our analysis requires data on insider trades, firm characteristics, and stock prices. The data
selection process follows that of Lakonishok and Lee (2001) and Marin and Olivier (2008) and
merges data from four different sources, namely, the TFN Insider Filing Data Files, the Center
for Research in Security Prices (CRSP) database, the Compustat database, and the I/B/E/S
database. The initial sample consists of insider trades reported on SEC Form 4 in companies
listed on the New York Stock Exchange, the American Stock Exchange, or the NASDAQ during
1992–2001. It covers the last 10 calendar years before the implementation of SOX, which marked
a change in regime, since it requires insiders to report a trade within two working days.
We begin sample construction with the TFN database. We include all open market or private
purchases (transaction code P) and all open market or private sales (transaction code S) of non-
derivative securities whose records were not amended (amendment indicator “blank”) between
January 1, 1992 and December 31, 2001. Of these transactions, we retain only those filings
whose data can be verified by TFN with a high level of confidence (cleanse indicators R and H).
The TFN Insider Filing Data Files contain the following information:
Company name and CUSIP
SCHUMPETER DISCUSSION PAPERS 2011-015

8
Transaction date and reporting date (SEC receipt date)
Transaction code (purchase or sale), number of shares exchanged in the transaction, and
transaction price
Insider’s position within the firm, which we classify into four groups:
CEO (also possibly the chairman of the board)
Chairman (only if not also the CEO)
Executive directors, excluding the CEO
Other non-executive officers, affiliates, beneficial owners, or other persons required to
report their trades
We exclude all filings that have no entry for transaction price, number of shares, reporting date to
the SEC, position of insider, or sector fields, leaving 741,653 records remaining. We also exclude
insider transactions whenever the reported transaction price was not within a 20% interval around
the CRSP closing price on the insider trading day. We further exclude trades when the number of
shares traded exceeded 20% of total shares outstanding. We do not attempt to single out
Rule 10b5-1 trades, because very few of these pre-planned trades took place during the pre-SOX
era. Brochet (2010), using a sample covering the period 1997–2002, reports that Rule 10b5-1
trades accounted for only 0.55% of the trades in his sample.
We complement the data on insider transactions with supplementary data from various sources.
We obtain financial data from the Compustat database. All data items are taken from firm
SCHUMPETER DISCUSSION PAPERS 2011-015

9
financial statements at the end of the fiscal year preceding the reporting of the insider trades. We
measure book leverage (the variable Leverage) as the ratio of long-term debt (data item 9) plus
debt in current liabilities (item 34) to long-term debt plus debt in current liabilities plus
stockholder equity (item 216). Firm size (Size) is defined as the natural logarithm of the market
value of equity. Tobin’s Q (Q) is calculated as the ratio of the market value of assets to the book
value of total assets (item 6). Following Malmendier and Tate (2007), we define the market value
of assets as total assets plus market equity (item 25 times item 199) minus book equity. We
calculate book equity as the sum of stockholder equity and balance-sheet deferred taxes and
investment tax credits (item 35), where available, minus the preferred stock liquidating value
(item 10) and minus post-retirement assets (item 336), where available.3
Further, we obtain data on analyst forecasts and announcement dates of quarterly or annual
earnings reports from the I/B/E/S and Compustat databases. We define variable Numest as the
total number of analysts covering a company in the last available yearly earnings forecast before
the transaction date of the insider trade. We further obtain the dates of all quarterly earnings
announcements.
3 When stockholder equity was not available as data item 216, we calculated stockholder equity alternatively as
common equity (item 60) plus the preferred stock par value (item 130) or total assets minus total liabilities
(item 181). If the preferred stock liquidating value was not available as data item 10, we calculated the preferred
stock liquidating value alternatively as redemption value (item 56) or par value (item 130). Return on equity (the
variable RoE) is net income (item 172) divided by book equity.
SCHUMPETER DISCUSSION PAPERS 2011-015

10
For an observation to be included in our analysis, all the necessary data items in the CRSP,
Compustat, and I/B/E/S databases must be available. This requirement reduces the sample to
314,696 observations.
In our empirical analysis, we use the following additional variables. The variable delay is the
difference in days between the reporting and transaction dates. We calculate the variable
TradeVolume as the number of shares exchanged in a transaction times the transaction price,
divided by the market value of equity. We define NumInsider as the total number of insiders who
traded shares in the same company on the same day. Table 1 summarizes the definitions of these
variables.
Insert Table 1 about here
Our analysis uses two different data sets: a “transaction sample” and an “event study sample.”
For the transaction sample, we aggregate all transactions by the same insider that are a) executed
on the same day, and b) jointly reported on the same day. We present an aggregated transaction
as one trade with the net amount traded. The (net) transaction volume is positive (negative) if the
sum of all the individual trades by this particular insider on the same trading day is positive
(negative).4 Following these calculations, we classify each aggregated transaction as a purchase
or a sale. Our final transaction sample consists of 98,933 purchases and 215,763 sales (314,696
4 Arguably, a report that includes both purchases and sales made by the same insider provides a weaker signal than
a report that reports only unidirectional trades. However, only 0.51% of the reports in our sample contain both
purchases and sales. This low number is likely to be due to the "short swing rule," which requires insiders to
return to the firm all profits from roundtrip trades completed within six months.
SCHUMPETER DISCUSSION PAPERS 2011-015

11
observations in total). These observations relate to 6,808 different firms and 25,836 distinct
firm-years. Note that in the transaction sample, two trades by different insiders are treated as two
distinct observations, even if they are executed and/or reported on the same day.
The announcement date in our event study analysis is the day on which an insider trade was filed
with the SEC. Therefore, we aggregate all insider trades in the shares of a given firm that were
reported on the same day, irrespective of whether the trades were reported by the same insider.
We refer to this sample as our event study sample. Again, aggregated transactions are treated as
one trade, and the net trade direction and net volume are as defined above. The final data set for
the event study consists of 34,648 purchases and 65,319 sales (99,967 trades in total).
Table 2 presents descriptive statistics for the firms in our sample. Average firm size, as measured
by the market value of equity, is $4,544.39 million. Firm size distribution is heavily skewed. The
average Tobin's Q of sample firms is 3.52, average return on equity is 8.90%, and mean book
leverage is 31.43%. Mean trade size, expressed as a percentage of the market value of equity, is
0.121%. In 62.10% of cases, only one insider traded on a given day. In the remaining cases, more
than one insider traded on the same day. The average number of insiders trading on a given day is
2.04, with a maximum of 32. The average insider trade was executed 57 calendar days before the
firm reported its next annual or quarterly earnings report.
Insert Table 2 about here
Figure 1 shows the distribution of trading dates. Although it appears to follow a weak U-shaped
pattern, the general impression from Figure 1 is that trades are more or less evenly distributed
SCHUMPETER DISCUSSION PAPERS 2011-015

12
over the month. The distribution of reporting dates shown in Figure 2 is dramatically different.
The daily frequency start low (only 0.81% of trades are reported on the first day of the month),
then increases strongly until the 10th of the month; almost 32% of all trades are reported on this
day alone. When we weight the trades by their volume, this number increases further to 42.7%.
After the 10th, the frequency declines sharply. In the second half of the month, there is no single
day on which more than 0.75% of trades are reported.
Insert Figure 1 about here
Insert Figure 2 about here
There are two not mutually exclusive (and observationally equivalent) explanations for the strong
pattern we document. First, many corporate insiders may routinely report all trades made during
the previous month on the 10th. This practice may delay the adjustment of prices to the
information revealed by the insider trades, and it may be to the disadvantage of other traders
(although not intentionally). Whenever share prices react to the reporting of an insider trade,
reporting delays imply distorted prices in the period between the trading and filing dates. If an
insider executes several trades on different days but reports them jointly, the later trades are
executed at prices that are more favorable than they would have been in the case in which each
trade had been reported immediately. This practice is beneficial for the insider but obviously to
the disadvantage of the counterparties to the insider’s trades. Second, some insiders may
intentionally delay the reporting of their trades to avoid the price impact triggered by the report.
By considering only the trading and filing dates, the two cases mentioned cannot be distinguished
SCHUMPETER DISCUSSION PAPERS 2011-015

13
from each other. However, the share price reaction on the filing date can be expected to reflect
the market’s beliefs about the insiders’ motives. Therefore, analyzing the price reaction will
allow us to draw inferences about these motives and the economic significance of strategic trade
reporting.
3. Reporting Delays
This section presents evidence concerning the magnitude of reporting delays and the
determinants of late filings. The frequency distributions of trading and reporting dates shown in
Figure 1 and Figure 2 demonstrate that trades are approximately evenly distributed over the
month, whereas reports cluster around the 10th. If insider trades were indeed equally distributed
over the days of the month and if each trade were reported on the 10th of the month after the
trade (i.e., on the last permissible day), we would expect an average reporting delay of
approximately 25 days. Table 3 shows the actual reporting delays. The median delay (24 days for
purchases and sales) corresponds roughly to the benchmark value derived above. The mean delay
is much longer, at 35.0 days.5 Purchases are reported with longer delays than sales (40.4 days,
compared to 32.5 days, respectively). This difference may be indicative of strategic delaying,
because previous papers (e.g., Seyhun (1986) and Brochet (2010) for the US, and Fidrmuc et al.
(2006) for the UK) document that insider purchases are more informative, as evidenced by larger
5 This figure is greater than that given in Table 1 of Brochet (2010). The author uses a shorter sample period
(starting in 1997) and confines his analysis to trades initiated by the CEO, CFO, COO, board chairs, and
presidents.
SCHUMPETER DISCUSSION PAPERS 2011-015

14
abnormal returns. This finding, in turn, implies that insiders who purchase shares are more likely
to possess private information and therefore have greater incentives to conceal their trading
activity.
Insert Table 3 about here
The discrepancy between the mean and median reporting delays implies that the distribution of
reporting delays is heavily skewed. The magnitude of the average delay further implies that a
significant fraction of trades, particularly the purchases, are reported too late (i.e., later than the
10th of the month following the trade). In fact, Table 3 reveals that 13.2% of the trades in our
sample were reported too late.6 We use the term late filings for these cases. Late filings are more
common for purchases than for sales (17.5%, compared to 11.3%, respectively).
The high percentage of late filings is stunning and implies that in the pre-SOX era, reporting
requirements were not enforced.7 This observation is surprising because violations of the
reporting requirement are easily detectable: SEC filings include trading and reporting dates,
together with a unique person identification number that allows for easy identification of the
insider.
6 These figures take into account the fact that when the 10th of a month is a Saturday or a Sunday, the trade needs
only be reported on the 12th or the 11th of that month, respectively. 7 The Securities Enforcement Remedies and Penny Stock Reform Act of 1990 allows penalties against delinquent
filings, and we are aware of several cases in which the SEC filed a complaint in District Court.
SCHUMPETER DISCUSSION PAPERS 2011-015

15
The percentage of late filings is too large to be explained by accidental omission. Rather, a
substantial fraction of insiders exists who do not care about the reporting requirements or who
deliberately (and possibly strategically) file their reports late. To shed light on this issue, we
estimate a logit model in which the dependent variable is zero if a trade was reported on time
(i.e., by the 10th of the month following the trade), and 1 if the trade was reported late. The
independent variables include firm and trade characteristics. We use the number of following as a
proxy for investor attention.8 Trade characteristics include trade volume relative to firm market
capitalization and the number of different insiders trading on the same day. We include three
further control variables:, namely, Tobin's Q as a proxy for valuation of the firm, return on equity
as a measure of operating profitability, and book leverage. We do not have a clear prediction
regarding the sign and significance of the coefficients.
Many firms restrict insider trading by defining a blackout period during which trading is
prohibited. Typically, the blackout period is in effect just prior to an earnings announcement. A
common arrangement is to allow trading only within a short period after an earnings
announcement (Bettis et al. (2000), Roulstone (2003)). We include the dummy variable "pre-
8 To avoid multicollinearity (correlation between firm size and number of analysts following is 0.79 in the
transaction sample), we do not include firm size. We obtain very similar results, however, when we replace the
number of analysts by firm size.
SCHUMPETER DISCUSSION PAPERS 2011-015

16
announcement" in our model, which is set to 1 if a trade was not executed within a 30-calendar-
day window after an earnings announcement, and zero otherwise.9
We further define three dummy variables that describe the insider’s position in the firm. The first
dummy is set to 1 when the CEO is among the traders trading on a given day, and zero
otherwise.10 The second dummy identifies trades by the chairman of the board (unless the
chairman is simultaneously the CEO), and the third dummy identifies trades by other executive
directors of the firm. Trades by outside directors, beneficial owners, and others thus constitute the
base group.
We estimate a pooled model that includes both purchases and sales and two separate models
including only purchases and sales, respectively. The pooled model includes a dummy variable
9 Two comments are in place. First, Bettis et al. (2000) survey 663 firms and report that the most common
restriction is to allow insiders to trade only within a short window (e.g., days 3 to 12) after an earnings
announcement. Roulstone (2003) analyzes a large sample of insider trades. From the observed trading pattern, he
deduces whether a firm has a restriction in place. Specifically, he assumes that a firm has a restriction in place
when more than 75% of the insider trades occur in the 20 trading days (approximately one month) after earnings
announcements are made. Since our sample is closer to Roulstone's than to the sample of firms surveyed by
Bettis et al. (2000), we adopt a one-month period. Second, data on earnings announcement dates are missing in
some cases. We address this by excluding all observations where the time between the insider trade and the date
of the publication of the next quarterly earnings announcement is more than 91 days. We obtain similar results
when we include all observations. In the latter case, we misclassify insider trades that were executed within a 30-
day window after the publication date of an earnings announcement not included in our data set. 10 As a robustness check, we re-estimated the logit model including only trades made by the CEO. The results are
similar to those presented below. The main difference is that for the CEO-only sample, we do not find that
purchases are more likely to be filed late than sales.
SCHUMPETER DISCUSSION PAPERS 2011-015
17
that captures differences in the probability of late reporting between purchases and sales. All
models include sector dummies (where we adopt the classification used in the TFN insider
filings) and year dummies. Standard errors are clustered at the firm level. Table 4 reports
marginal effects (the change in probability of late filing for a unit change in the explanatory
variable, evaluated at the mean values of the explanatory variables) and the respective z-statistics.
The probability of late filings is generally higher for purchases than for sales. This result is
consistent with the earlier finding that average reporting delays are longer for purchases than for
sales. Trades by insiders in firms followed by more analysts are less likely to be filed late. This
finding is intuitive, given that these firms tend to be larger and are under closer scrutiny by
analysts and investors in general. We further find that sales by insiders in more highly leveraged
firms are more likely to be reported late. No such relation is found for insider purchases.
Insert Table 4 about here
Considering trade-specific variables, we find that trades executed during the period prior to
earnings announcements are significantly more likely to be reported late. There are two not
mutually exclusive explanations for this finding. First, insiders are more likely to possess relevant
private information prior to an earnings announcement and therefore have an incentive to
strategically delay the reporting of their trades. Second, as noted above, many firms have adopted
policies that allow insider trades only in a window open for a specified period after the quarterly
earnings announcement (Bettis et al. (2000)). Insiders in these firms are more likely to trade
SCHUMPETER DISCUSSION PAPERS 2011-015

18
shortly after an earnings announcement and, at the same time, are more likely to be scrutinized
and may therefore tend to file their reports on time.
The other two trade-specific variables, trade size and the number of insiders trading on a given
day, do not yield significant results. With respect to the position of the insider within the firm, we
find that CEOs, chairmen of the board, and executive directors are significantly less likely to file
late than other corporate insiders (such as, e.g., non-executive directors and beneficial owners).
This finding is again consistent with the notion that insiders who are under closer scrutiny are
more reluctant to file their reports late.
In summary, our results are consistent with the notion that the occurrence of late filings is not
random. In particular, it appears that insiders who are more closely monitored (and who therefore
may be facing higher litigation risk) are less likely to file their trades late.
4. Incidences of Strategic Trading and Strategic Trade Reporting
Thus far, we have documented that considerable reporting delays exist and that the reporting
requirement is violated in more than 13% of cases. Delayed reporting per se may delay the
adjustment of prices, but it does not necessarily benefit the insider. An insider who wants only to
execute a single trade has no incentive (beyond convenience) to delay the filing. This incentive is
different, however, when the insider intends to trade more than once. In this case, delaying the
reporting of earlier trades avoids the price reaction the report would trigger. Thus, later trades are
executed at prices that are more favorable than those that would have prevailed had each trade
been reported immediately. Note that this is true irrespective of whether the insider trades on
SCHUMPETER DISCUSSION PAPERS 2011-015

19
private information. It is sufficient that other market participants believe the insider to be
informed with positive probability.
In this section, we search for evidence of strategic trade reporting. We classify a trade as
nonstrategic if it is a) not preceded by another trade that has not been reported until the trading
date, and b) is not followed by another trade before it is reported.11 All other trades are classified
as strategic because they are part of a series of trades in which some trades were executed while
other trades were not yet reported. Figure 3 demonstrates two cases. Trades 1 and 2 in panel A of
Figure 3 are executed on different days but reported jointly. According to the definition above,
both trades are classified as strategic. Because they are reported jointly, market participants may
infer that the trades are strategic. Panel B of Figure 3 shows a different situation, in which trades
1 and 2 are executed on different days, as well as reported on different days. Because trade 1 is
reported after trade 2 is executed, both trades are strategic according to our definition. However,
on the date on which trade 1 is reported, market participants cannot infer that trade 1 is strategic.
Upon trade 2 being reported, however, it becomes apparent that both trades are strategic. When
we analyze the market response to strategic trades in the next section, we adjust our definition of
strategic trades accordingly. A trade is considered strategic only when market participants can
infer that it was a strategic trade. Consequently, trade 1 in Panel B of Figure 3 is classified as
11 We use an alternative definition as a robustness check. We consider only trades in the same direction (i.e., only
purchases or only sales) and consider a series to be terminated when no further trades took place for at least 40
days (the maximum reporting delay). This definition, which is similar to that used in Lebedeva et al. (2009) to
identify stealth trading, yields the same conclusions.
SCHUMPETER DISCUSSION PAPERS 2011-015

20
nonstrategic when we analyze the abnormal returns after the filing of insider trades in Section IV.
In the current section, however, we stick with our original definition because we take the point of
view of the insider.
Insert Figure 3 about here
We acknowledge that our classification is conservative. The group of strategic trades does not
contain only trades that were deliberately reported late. As noted previously, it is likely that some
corporate insiders routinely report their trades on the 10th of the following month. If an insider
adhering to this reporting practice trades several times in a month, our classification scheme will
treat these trades as strategic.12 There are two reasons why we stick to our classification. First, we
cannot distinguish why we observe a specific pattern of trades and reports. Second, even if an
insider does not intentionally delay the reporting of the earlier trades of a series, the delayed
report still puts the counterparties to the later trades at a disadvantage, since they would have
traded at more favorable prices had the insider reported all trades immediately.
12 Our results are also conservative in a second sense. We classify a trade as strategic only when the same insider
trades several times before reporting the trade. Besides such cases, there are a large number of cases in which
insiders trade while the SEC filing of another insider is still pending. This sequence also puts the counterparties
to the later insider trades at a disadvantage, because they would have traded at more favorable prices had the
insider who traded first reported the trades immediately.
SCHUMPETER DISCUSSION PAPERS 2011-015

21
The results of a descriptive analysis are reported in Table 5. Only 32.1% of the trades in our
sample are categorized as nonstrategic.13 This percentage is larger for purchases than for sales
(38.0% versus 29.4%, respectively). This finding is surprising at first, since purchases are known
to have larger price impacts (which should increase the incentive to strategically delay the
reporting of a trade). Further, we documented earlier that average reporting delays are larger for
purchases. A potential explanation for the result is the difference in trade size. Table 5 reveals
that insider sales are, on average, much larger than insider purchases. The large sizes of sell
orders provide an incentive to split up trades and report individual trades only after all the trades
of a sequence have been executed.
A total of 67.9% of trades in our sample are classified as strategic. Each strategic trade is part of a
sequence of trades. The end of a sequence is reached when there are no more unreported trades.
Table 5 reveals that 15.0% of trades are classified as the first trade of a sequence, while 52.9%
are classified as second or subsequent trades of a sequence. These numbers imply that a
sequence, on average, consists of 4.5 trades. This number is higher for purchases than for sales
(4.9, compared to 4.4, respectively).
Insert Table 5 about here
Table 5 documents that strategic trade reporting is widely practiced. We therefore now analyze
whether strategic trades are systematically different from nonstrategic trades. To this end, we
13 As one might expect, the percentage of non-strategic trades is lower in the subsample of trades that are filed late.
Only 22% of these trades are classified as non-strategic.
SCHUMPETER DISCUSSION PAPERS 2011-015
22
estimate logit models in which the dependent variable indicates whether a trade is classified as
strategic or nonstrategic. The independent variables are the trade, firm, and trader characteristics
introduced in the previous section. We add a dummy variable that identifies trades that were filed
late.14 We estimate a pooled model as well as separate models for purchases and sales. Standard
errors are clustered at the firm level.
The results (marginal effects and z-statistics) are reported in Table 6. Purchases are less likely
than sales to be classified as strategic, which is consistent with the descriptive results presented
above, and may be related to the fact that insider purchases on average are much smaller than
insider sales. The likelihood of observing strategic trades is lower in firms followed by more
analysts. This finding is intuitive because insiders in these firms are more closely monitored. We
further find the likelihood for strategic trades to be increased in firms with lower returns on
equity. Insider sales in firms with higher Q and in less leveraged firms are more likely to be
classified as strategic, whereas no such relation is found for insider purchases.
Insert Table 6 about here
Turning to the trade-specific variables next, we find that larger trades are less likely to be
classified as strategic trades. This finding is consistent with the conjecture that strategic trades are
the result of large orders that have been split up into smaller chunks. We also find that trades that
14 We obtain similar results when we replace the "late reporting" dummy by the reporting delay measured in days.
We prefer the specification that includes the dummy because it is more robust in the presence of outliers (i.e.,
trades reported with extremely long delays). As an additional robustness check, we re-estimated the logit models
after excluding all late filings from the data set. The results are similar to those presented in the text.
SCHUMPETER DISCUSSION PAPERS 2011-015

23
are filed late are more likely to be classified as strategic. The dummy variable identifying trades
executed in the period prior to publication of an earnings announcement is positive and
significant for insider purchases, but insignificant for sales. Interestingly, the chairman of the
board is more likely to engage in strategic trading, whereas executive directors (excluding the
CEO) are less likely to engage in strategic trading than members of the base group (non-
executive directors, beneficial owners, and others). The results for the CEO are somewhat less
clear, with an (insignificant) negative coefficient for purchases and a (significant) positive
coefficient for sales.15
Our results lend support to the hypothesis that insiders strategically time their trades and made
strategic use of pre-SOX reporting rules. The next section addresses whether market reactions to
the reporting of insider trades take this into account.
5. Market Response to Strategic Trades
This section analyzes share price reactions after the reporting of insider trades using standard
event study methodology. This analysis serves a dual purpose. First, we want to test our
conjecture that delayed reporting impedes the adjustment of prices to the information contained
15 We re-estimated the logit models including only trades made by the CEO. The conclusions are similar to those
described in the text. The main differences are that a) the probability that a CEO reports a strategic trade
decreases in the number of insiders reporting trades on the same day, and b) the dummy variable identifying
trades executed in the period prior to the publication of an earnings announcement is insignificant.
SCHUMPETER DISCUSSION PAPERS 2011-015

24
in the insider trades. To this end, we analyze whether reporting day CARs decrease with the
length of the reporting delay and, if so, how quickly. The potential finding that CARs decrease
quickly with the length of the delay would provide evidence that the market is able to learn the
information contained in the insider trade from other sources and thus does not have to rely on
the report. If, on the other hand, we find that the CAR decreases slowly, or not at all, with the
length of the delay, this finding could be interpreted as evidence that market prices are indeed
distorted in the period between the trading and reporting dates. Second, we wish to analyze
whether the CARs are larger after the reporting of strategic trades. The result will allow us to
draw conclusions about the market’s belief about insider trading motives. If the market reaction
after strategic trades is stronger than after otherwise similar nonstrategic trades, this would
constitute evidence that the market attributes higher information content to these trades.
As noted above, we use standard event study methodology. The event date is defined to be the
day on which an insider trade is filed with the SEC. The analysis is based on the event study
sample introduced in Section I. This sample is obtained by aggregating all insider trades in shares
of the same firm that were reported on the same day. We must aggregate reports filed by different
insiders because otherwise we would double-count observations. We estimate the market model
over a 255-day estimation window ending 46 days16 prior to the announcement date. We use the
16 We choose a longer delay between the end of the estimation window and the event window because we do not
want the estimation window to be contaminated by the execution of the insider trade. Note that 46 days is slightly
more than the maximum admissible delay for reporting in the pre-SOX era.
SCHUMPETER DISCUSSION PAPERS 2011-015

25
CRSP value-weighted index as our market proxy, and t-statistics are based on the standardized
cross-sectional test proposed by Boehmer et al. (1991).
The event study results are reported in Table 7. We report CARs over four event windows,
namely, (0; 1), (0; 2), (0; 10), and (0; 20), and we report separate results for insider purchases and
insider sales. Consistent with previous research, we find that CARs over a short event window
are small. The CARs over the two-day window (0; 1) amount to 0.29% for purchases and -0.21%
for sales. The CARs increase significantly when the lengths of the event window are increased.
The CARs over the event window (0; 10) are 1.99% for purchases and -0.87% for sales; the
corresponding values for the 21-day event window (0; 20) are 2.97% and -2.05%, respectively.
These results confirm previous findings that the share price reaction is stronger after insider
purchases than after insider sales.
Insert Table 7 about here
We next compare the CARs after strategic and nonstrategic trades. As noted previously, we
categorize a trade as strategic only when, on the filing date, market participants can infer that the
trade was strategic. The results provide clear evidence that market participants attribute higher
information content to strategic trades. The share price reaction after these trades is stronger than
that after nonstrategic trades, irrespective of whether we consider purchases or sales or the length
of the event window. Consider the CAR over the 20-day window (0; 20) as an example: It is
3.75% after strategic purchases but only 2.45% after nonstrategic purchases. The corresponding
figures for strategic and nonstrategic sales are -2.55% and -1.49%, respectively. The difference
SCHUMPETER DISCUSSION PAPERS 2011-015

26
between the price reactions after both strategic and nonstrategic trades is (based on a t-test for
equality of means) statistically significant in all cases.
Table 7 also reports the results of further cross-tabulations. As already noted, many firms restrict
insider trading by defining a blackout period during which trading is prohibited. Typically, the
blackout period is the period just prior to an earnings announcement (often two months; see
Bettis et al. (2000) and Roulstone (2003)). Such a restriction is based on the assumption that the
informational asymmetry between corporate insiders and other market participants is larger prior
to earnings announcements. If this assumption is true, we should observe larger CARs after
trades that non-restricted insiders execute prior to earnings announcements. To test this
hypothesis, we define the dummy variable "pre-announcement" as set to 1 if at least one of the
trades reported on a given day was executed within a 60-day window prior to an earnings
announcement. We find that purchases made during the pre-announcement period result in
significantly larger share price reactions. This finding is consistent with the notion that earnings
announcements reduce informational asymmetries. For insider sales, there are no significant
differences between trades executed during the pre-announcement period and other trades.
We next consider the timing of trades relative to earnings announcement dates. We look at trades
that were executed in the period before an earnings announcement but reported after the
announcement. To this end, we define the dummy variable timed, which is set to 1 if all trades
reported on a given day were executed before and reported after the earnings announcement
SCHUMPETER DISCUSSION PAPERS 2011-015

27
date.17 We find that timed trades convey significantly less information to the market. Considering
again the (0; 20) event window as an example, we find a CAR of 3.22% for non-timed purchases
and a CAR of only 1.87% for timed purchases. The corresponding figures for sales are -2.19%
and -1.21%, respectively. These results are again consistent with the notion that earnings
announcements reduce the informational asymmetry between insiders and the market.
Next we compare trades that were reported on time with trades that were filed late. We define a
dummy variable late filing that is set to 1 if all of the trades reported on a given day were filed
late. The results are inconsistent. Over longer event windows (10 or 20 days), trades reported on
time trigger stronger share price reactions (3.02% versus 2.69% for purchases and -2.06% versus
-2.04% for sales). The difference is significant only for insider purchases, however.
Trades that are filed late are, by definition, reported with longer delays. Thus, finding that insider
purchases that are filed late trigger smaller share price reactions is consistent with the notion that
the market learns some of the information contained in the report from other sources. To shed
more light on this important issue, we next sort the insider trades in our sample into 10 groups
with respect to their weighted average reporting delays (delay 0–5 days, 5–10 days, and so on,
with trades in the 10th group having a weighted average delay of more than 45 days). We find
that the CARs are significantly different from zero irrespective of the trading delay. They tend to
17 We used an alternative definition as a robustness check. Specifically, we only considered trades as "timed" if they
were executed prior to but reported after the earnings announcement, but prior to the next announcement. This
excludes trades that were reported with very long delays. The results of the cross-tabulations and the results of
the cross-sectional regressions presented below are very similar when we use this alternative specification.
SCHUMPETER DISCUSSION PAPERS 2011-015

28
slightly decrease with the length of the delay for purchases, but not for sales.18 These results
imply that prices are distorted in the period between the execution and filing of an insider trade.
The results in Table 7 suggest that timed trades, that is, trades executed before but reported after
an earnings announcement, and trades executed within a 30-day window after an earnings
announcement trigger smaller share price reactions. The results also suggest that CAR decreases
with the length of the reporting delay for insider purchases but not for sales. However, up to now,
we did not control for other firm and trade characteristics. Including such controls is important
because we showed previously that trades that are filed late are systematically different from
trades that are filed on time. Similarly, we showed that strategic trades are different from
nonstrategic trades. In addition, reporting strategic trades typically involves reporting several
trades on the same day,19 and therefore the total reported volume is larger. It may be the larger
volume rather than the strategic nature of the trade per se that causes the larger CARs.
We therefore estimate cross-sectional regressions that control for the total reported volume and
other potentially relevant variables. The dependent variable is CAR. We report results for CARs
measured over the event window (0; 20). Using the shorter event window (0; 10) yields results
that are qualitatively similar.
18 Brochet (2010) reports a similar result. 19 The typical case is illustrated in Panel A of Figure 3. Several trades are executed on different days but reported
jointly. The case illustrated in Panel B of Figure 3, where strategic trades are reported individually, is much less
common.
SCHUMPETER DISCUSSION PAPERS 2011-015
29
The independent variables include measures of firm characteristics (Tobin's Q, return on equity,
book leverage, and number of analysts following20) and trade characteristics (transaction volume
relative to the firm’s market capitalization and aggregated over all trades that were reported
jointly, number of different insiders trading on the same day,21 and weighted average reporting
delay22). We further include dummy variables identifying strategic trades, trades executed in the
period prior to an earnings announcement, and timed trades (i.e., those executed in the period
prior to an earnings announcement and reported after the announcement, but prior to the next
earnings announcement). We also include the interaction between the timed dummy and the
strategic dummy. Three additional dummy variables control for the position of the insider in the
20 To avoid multicollinearity (correlation between firm size and number of analysts following is 0.80 in our event
study sample), we do not include firm size. When we replace number of analysts with firm size, we obtain very
similar results. We also estimated versions of our models that include additional firm characteristics (a measure
of asset tangibility as defined in Almeida and Campello 2007 and the standard deviations of returns in the 60
days prior to the event date). Tangibility turned out to be insignificant, return volatility was positive and
significant for purchases but not for sales. 21 It may make a difference whether the other insiders traded in the same direction or in the opposite direction.
Therefore, we re-estimated our model including a continuous variable measuring aggregate trade direction. It is
defined as (number of buys - number of sells) / (number of buys + number of sells). The coefficient on this
variable has the expected sign and is significant. The other results are similar to those presented in Table VIII. 22 One potential problem with the delay variable lies in the fact that there are obvious outliers in the sample, as is
evidenced by a maximum reporting delay in excess of 10 years. We address this issue by estimating three
alternative versions of the model. We use a) a delay variable that is winsorized at 42 (the maximum delay
allowed in the pre-SOX era), b) the log of 1 plus the delay, and c) a dummy variable that identifies trades that
were filed late. These alternative specifications yield similar results. We therefore report results only for the base
model.
SCHUMPETER DISCUSSION PAPERS 2011-015

30
firm (CEO, chairman of the board, other executive directors23). Finally, we include year and
industry dummies.
We estimate separate models for purchases and sales. Note that we expect different signs for the
coefficients in the two regressions, because the CARs after purchases are predominantly positive
while those after sales are predominantly negative. We include firm fixed effects. Standard errors
are clustered at the reporting day level. The results are shown in Table 8. The CARs after insider
purchases are smaller for firms with higher values of Tobin’s Q and for firms with more analysts
following. The other firm characteristics are insignificant. Share price reaction after a purchase
does not depend on transaction volume. It is larger when more than one insider reports trades on
the same day. Consistent with our earlier results, we find that purchases executed during the
period prior to an earnings announcement trigger significantly larger price reactions. Timed
purchases—those that are executed before but reported after an earnings announcement—trigger
significantly smaller share price reactions than other purchases. These results are consistent with
the notion that earnings announcements convey information to the market and reduce
informational asymmetries. Purchases by the CEO, the chairman of the board, and other
executive directors result in higher CARs than purchases by members of the base group (non-
executive directors, affiliates, beneficial owners, and others). This result in general and the
relative sizes of the coefficients in particular are consistent with the informational hierarchy
23 If several insiders report their trades on the same day, we choose the highest insider position; that is, we set the
dummy to 1 if at least one of the insiders is the CEO, the chairman of the board, or an executive director, and
zero otherwise.
SCHUMPETER DISCUSSION PAPERS 2011-015

31
hypothesis, which posits that trades by insiders with more privileged access to information
convey more information to the market.
Insert Table 8 about here
The most important results are those with respect to the strategic trading dummy and the
reporting delay. Strategic purchases trigger a significantly larger share price reaction, even after
controlling for other relevant variables. Note that, on the reporting day (our event day), market
participants observe whether a report contains strategic trades. Our results thus imply that market
participants believe that strategic purchases are more likely to be motivated by private
information than otherwise similar nonstrategic trades.24 The additional abnormal return is 0.9%,
which is also economically significant. The coefficient on the reporting delay is insignificant,
indicating that CARs do not decrease when a trade is reported with a longer delay. Thus, once we
control for trade and firm characteristics, the negative relation reported in Table 7 disappears.
This result supports our conjecture that delayed reporting causes delays in the adjustment of
prices.
24 As noted earlier, many insiders routinely file their reports on the 10th of the month following the trades. It is
conceivable that these routine reports are less informative than reports filed on other days. Therefore, we re-
estimated the regression with two additional dummy variables. The first identifies reports filed on the 10th of a
month, the second interacts this dummy with the dummy identifying strategic trades. We find that, indeed,
reports filed on the 10th of a month trigger smaller CARs. However, the coefficient on the interaction term is
positive and significant. Thus, the result that strategic trades trigger larger abnormal returns also holds for those
reports filed on the 10th of a month.
SCHUMPETER DISCUSSION PAPERS 2011-015

32
The results for insider sales differ from those for purchases in several respects. Trades by insiders
in more highly valued firms (larger Q) trigger stronger (more negative) price reactions, as do
trades by insiders in firms followed by more analysts. Price reactions after insider sales filings are
stronger when more than one insider reports a trade on the same day. Trade size, on the other
hand, does not have a systematic impact. Trades by CEOs and other executive directors cause
stronger price reactions. The insignificant coefficients on the pre-announcement and timing
dummies indicate that the timing of the trade itself and of the report relative to earnings
announcements do not significantly affect the abnormal returns.
The coefficient for the reporting delay is significantly positive, though small in magnitude.25
Thus, CARs following insider sales tend to decrease when a trade is reported with a longer delay.
The decrease is very slow, however. The coefficient of 0.003 implies that increasing the reporting
delay by one day decreases the reporting day CAR by 0.003%. It would thus take a reporting
delay of 683 days until the average reporting day CAR of -2.05% is reduced to zero. Therefore,
the conclusion that delayed reporting impedes the adjustment of prices is still valid.
25 As an additional robustness check, we re-estimated both regressions (purchases and sales) including only trades
that were reported within the legal boundaries. The coefficient on the "delay" variable in the sales regression is
insignificant. All other results are unchanged. Additionally, we re-estimated the regressions with all observations
but included a dummy that identifies late filings. Again, our conclusions are unchanged. As a final robustness
check, we included a dummy variable that identifies trades made during the first five days of a month and
reported between the 9th and the 13th of the following month. The timing of execution and reporting of these
trades is such that the reporting delay is maximized within the legal bounds. These results are again similar to
those reported in the text.
SCHUMPETER DISCUSSION PAPERS 2011-015
33
Strategic sales apparently convey more information to the market than nonstrategic trades, as is
evidenced by the significantly negative coefficient on the strategic trade dummy.26 We note,
though, that the absolute magnitude of the coefficient is smaller than that of the corresponding
coefficient in the regression for insider purchases. This result, combined with our findings that
CARs after insider sales are generally smaller and that the timing of the trade and of the report
does not affect the magnitude of the price reaction, is consistent with the view that insider sales
are generally less likely to be motivated by private information than insider purchases.
6. Summary and Conclusions
In the pre-SOX era, corporate insiders in the US were required to report their trades by the 10th
of the month following the trade. Thus, the maximum time allowed between the trade and the
report was 40 days, giving corporate insiders considerable flexibility to time their trades and
reports. This flexibility may be used strategically. An insider wishing to trade a large quantity
may split up an order into several smaller chunks. Splitting up a large order reduces its price
impact and thus results in reduced execution costs. By delaying the reporting of the trades of a
series until after the last transaction, an insider can avoid the price impact caused by the reports.
This paper asks four related questions. First, how long are the reporting delays in the pre-SOX
era? Second, do insiders strategically use their flexibility in choosing the timing of their trades
26 When we re-estimate the regression including a dummy that identifies trades reported on the 10th of a month and
an interaction between this dummy and the "strategic" dummy, none of the coefficient estimates is significant.
SCHUMPETER DISCUSSION PAPERS 2011-015

34
and reports? If so, is strategic behavior systematically related to the characteristics of the insider
or the firm? Third, what are the implications of delayed reporting on the informativeness of
prices? Fourth, how does the market react to the strategic timing of trades and reports?
Our results demonstrate that substantial reporting delays exist. The mean reporting delay was 35
days. More than 13% of the trades in our sample were filed late (i.e., later than on the 10th of the
month following the trade). The very large number of violations of the trade reporting
requirement implies that the requirement was not enforced in the pre-SOX era. Corporate insiders
apparently used their discretion to time their reports. More than two-thirds of the trades in our
sample are part of a sequence of trades in which some trades were executed while earlier trades
were not yet reported. Strategic trade reporting benefits the insider but is disadvantageous to the
counterparties to the insider’s trades. If each trade were reported immediately, the second and
subsequent trades of a series of insider trades would be executed at prices less favorable to the
insider but more favorable to the counterparties.
We find that both the occurrence of late filings and the occurrence of strategic trades are
systematically related to the characteristics of the firm, the trade, and the trader. In particular, our
results are consistent with the notion that insiders who are more closely monitored (and who
therefore may be facing higher litigation risk) are less likely to file their trades late. The
probability of observing a strategic trade is larger in firms followed by fewer analysts as well as
for larger trades.
SCHUMPETER DISCUSSION PAPERS 2011-015

35
Our event study results reveal that share prices react to the reporting of insider trades. In cross-
sectional regressions, we find that the magnitude of the price reaction does not decrease with the
reporting delay after purchases, and decreases slowly after sales. Thus, our results support the
notion that market prices are distorted in the period between the trade and the report.
Consequently, delayed reporting of insider trades impedes the adjustment of prices. Finally, event
study CARs are larger after reports of strategic insider trades compared to the aftermath of
otherwise similar nonstrategic trades for both purchases and sales. Thus, market participants
apparently believe that insiders acting strategically are more likely to possess private information.
Our results support the more stringent trade reporting requirements established by SOX. They
also suggest that strict enforcement of existing regulations is beneficial. Further, our results lead
to the conclusion that countries that currently allow for long reporting delays (or do not require
corporate insiders to report trades in the shares of their firm) should consider tightening their
regulations.
SCHUMPETER DISCUSSION PAPERS 2011-015
36
References
Almeida, H., Campello, M., 2007. Financial constraints, asset tangibility, and corporate
investment. Review of Financial Studies 30, 1429-1460.
Bettis, J. C., Coles, J. L., Lemmon, M. L., 2000. Corporate policies restricting trading by insiders.
Journal of Financial Economics 57, 191-220.
Betzer, A., Theissen, E, 2009. Insider trading and corporate governance – the case of Germany.
European Financial Management 15, 402-429.
Betzer, A., Theissen, E., 2010. Sooner or later – delays in trade reporting by corporate insiders.
Journal of Business Finance and Accounting 37, 130-147.
Boehmer, E., Musumeci, J., Poulsen, A. B, 1991. Event study methodology under conditions of
event-induced variance. Journal of Financial Economics 30, 253-272.
Brochet, F., 2010. Information content of insider trades before and after the Sarbanes–Oxley Act.
Accounting Review 85, 419-446.
Carter, M. L., Sattar, A. M., Reeb, D. M., 2003. Evidence on quasi-private information and
insider trading. Financial Analysts Journal 59, 60-67.
Chang, S., Suk, D. Y., 1998. Stock prices and the secondary dissemination of information: the
Wall Street Journal's ‘Insider Trading Spotlight’ column. Financial Review 33, 115-128.
Cheng, S., Nagar, V., Rajan, M. V., 2007. Insider trades and private information: the case of
delayed-disclosure trades. Review of Financial Studies 20, 1833-1864.
SCHUMPETER DISCUSSION PAPERS 2011-015

37
Chordia, T., Subrahmanyam, A., 2004. Order imbalance and individual stock returns: theory and
evidence. Journal of Financial Economics 72, 485-518.
Fidrmuc, J. P., Goergen, M., Renneboog, L., 2006. Insider trading, news releases and ownership
concentration. Journal of Finance 61, 2931-2973.
Fidrmuc, J. P., Korczak, A., Korczak, P., 2009. Insider trading and corporate governance:
international evidence. Unpublished working paper. Warwick Business School and University of
Bristol.
Friederich, Gregory, S. A., Matatko, J., Tonks, I., 2002. Short-run returns around the trades of
corporate insiders on the London stock exchange. European Financial Management 8, 7-30.
Huddart, S., Hughes, J. S., Levine, C. B., 2001. Public disclosure and dissimulation of insider
trades. Econometrica 69, 665-681.
Kyle, A. S. Continuous auctions and insider trading. Econometrica 53, 1315-1335.
Lakonishok, J., Lee, I., 2001. Are insider trades informative? Review of Financial Studies 14, 79-
111.
Lebedeva, O., Maug, E., Schneider, C., 2009. Stealth trading by corporate insiders. Unpublished
working paper. University of Mannheim.
Malmendier, U., Tate, G., 2007. Who makes acquisitions? CEO overconfidence and the market's
reaction. Journal of Financial Economics 89, 20-43.
SCHUMPETER DISCUSSION PAPERS 2011-015
38
Marin, J. M., Olivier, J. P., 2008. The dog that did not bark: insider trading and crashes. Journal
of Finance 63, 2429-2476.
Roulstone, D. T., 2003. The relation between insider trading restrictions and executive
compensation. Journal of Accounting Research 41, 525-551.
Seyhun, H. N., 1986. Insiders' profits, costs of trading, and market efficiency. Journal of
Financial Economics 16, 189-212.
SCHUMPETER DISCUSSION PAPERS 2011-015

39
Table 1: Description of variables
Variable Definition
Pre-ann. A trade that occurs during the 60-day period preceding the next earnings announcement.
CAR Cumulative abnormal return, calculated using the market model over a 255-day estimation window ending 46 days prior to the announcement date. The market proxy is the CRSP value-weighted index.
D_pre-ann. Pre-announcement dummy: Dummy variable that takes the value 1 if the trade occurs during the 60-day period preceding the next earnings announcement, and zero otherwise.
For the cross-sectional regression of CARs, if several trades are reported on the same day, the dummy takes the value 1 if at least one trade occurs during the 60-day period preceding the next earnings announcement, and zero otherwise.
D_CEO Dummy variable that takes the value 1 if the trader is a CEO, and zero otherwise.
For the cross-sectional regression of CARs, if there are several trades in the same stock on the same day, the highest insider position is selected according to rank, i.e., CEO, chairman, executive, and other.
D_chairman Dummy variable that takes the value 1 if the trader is the chairman but not the CEO, and zero otherwise.
For the cross-sectional regression of CARs, if there are several trades in the same stock on the same day, the highest insider position is selected according to rank, i.e., CEO, chairman, executive, and other.
D_executive Dummy variable that takes the value 1 if the trader is an executive director but not the CEO, and zero otherwise.
For the cross-sectional regression of CARs, if there are several trades in the same stock on the same day, the highest insider position is selected according to rank, i.e., CEO, chairman, executive, and other.
SCHUMPETER DISCUSSION PAPERS 2011-015

40
D_late Dummy variable that takes the value 1 if it was reported later than the 10th of the month following the trade, and zero otherwise. If the 10th of the month falls on a weekend, the trade is classified as illegal if it was reported later than the following Monday.
D_other Dummy variable that takes the value 1 if the trader is a non-executive officer, affiliate, beneficial owner, or other person required to report trades, and zero otherwise.
For the cross-sectional regression of CARs, if there are several trades in the same stock on the same day, the highest insider position is selected according to rank, i.e., CEO, chairman, executive, and other.
D_purchase Dummy variable that takes the value 1 if the (net) transaction volume of the insider trade is positive, and zero otherwise.
D_strategic For the cross-sectional regression of CARs, the dummy variable takes the value 1 if a) the trade is followed by at least one additional trade by the same insider before it is reported or it follows a trade by the same insider that has not yet been reported, and b) the market can infer on the reporting date that the trade was strategic (see Figure 3 for an illustration). All other trades are classified as nonstrategic and the dummy variable is zero for these cases. With respect to strategic trades that are reported in an overlapping way, only serial transactions and not just the first transaction can be identified as strategic.
D_timing Dummy variable that takes the value 1 if the trade is executed within 60 days prior to the next earnings announcement and is reported after the announcement (but before the following announcement), and zero otherwise.
D_timing * D_stra Interaction term of the variables D_timing and D_strategic.
Days to next report Number of days from the transaction to the next quarterly earnings announcement.
Delay Lag in days between trading and reporting the transaction.
For descriptive statistics and the cross-sectional regression of CARs, Delay is the trading-volume–weighted average delay of all insider trades of a firm reported on the same day.
Filed in time Refers to a trade reported before the 10th of the month following the trade or by the next Monday if the 10th falls on a weekend.
Filed late Refers to a trade reported after the 10th of the month following the trade. If the 10th of the month falls on a weekend, the trade is classified as illegal if it is reported later than the following Monday.
First of series A trade that is the first in a series of trades in which at least one trade is followed by at least one additional trade by the same insider before being reported.
Leverage Ratio of long-term debt plus debt in current liabilities, divided by long-term debt plus debt in current liabilities plus stockholder equity.
Market value of equity ($ millions)
Share price multiplied by the number of shares outstanding.
SCHUMPETER DISCUSSION PAPERS 2011-015

41
Non pre-ann. Refers to a trade that does not occur during the 60-day period preceding the next earnings announcement.
Nonstrategic Refers to a trade that is not followed by at least one additional trade by the same insider before being reported or that does not follow a trade by the same insider that has not yet been reported.
Non-timed Refers to a trade that is either (a) not executed within the 60 day period preceding the next earnings announcement, (b) reported by the next earnings announcement, or (c) reported after the earnings announcement that follows the next earnings announcement.
Numest Total number of analysts covering a company in the month preceding the reporting date of the insider trade.
NumInsider Total number of insiders who traded shares in the same company on the same day. For the cross-sectional regression of CARs, this refers to the total number of insiders who reported trades in shares of the same company on the same day.
RoE Return on equity, defined as net income divided by book equity.
Serial trade A not-yet-reported trade that follows another trade by the same insider.
Strategic Refers to a trade that is followed by at least one additional trade by the same insider before being reported, or that follows a not-yet-reported trade by the same insider.
For descriptive statistics of CARs, a) the trade is followed by at least one additional trade by the same insider before it is reported or it follows a not-yet-reported trade by the same insider, and b) the market can infer on the reporting date that the trade was strategic (see Figure 3 for an illustration). All other trades are classified as nonstrategic. With respect to strategic trades that are reported in an overlapping way, only serial transactions, and not just the first trade, can be identified as strategic.
Timed Refers to a trade that is executed within 60 days prior to the next earnings announcement and reported after the announcement (but before the following announcement).
Tobin’s Q Ratio of the market value of assets to the book value of total assets.
TradeVolume The number of shares exchanged in a transaction times the transaction price, divided by the market equity of the company whose stocks were bought or sold in the insider trade.
For the cross-sectional regression of CARs, if several trades were reported on the same day, we sum the total volume of those trades.
SCHUMPETER DISCUSSION PAPERS 2011-015

42
Table 2: Descriptive statistics
This table reports summary statistics for the transaction sample. Tobin’s Q is calculated as the ratio of the market value of assets to the book value of total assets. The variable RoE is net income divided by book equity. We measure leverage as the ratio of long-term debt plus debt in current liabilities to long-term debt plus debt in current liabilities plus stockholder equity. We define the variable Numest as the total number of analysts covering a company in the month preceding the reporting date of an insider trade. We calculate the variable TradeVolume as the ratio of the number of shares exchanged in a transaction times the transaction price to the market equity of the company whose stocks were bought or sold in the insider trade. We define NumInsider as the total number of insiders who traded their shares in the same company on the same day. Days to next report denotes the number of days from a transaction to the next quarterly earnings announcement. Delay indicates the lag in days between the trading and reporting of a transaction.
Variables Observations Mean St. dev. Min Median Max Market value of equity
($ millions) 314,696 4544.39 21599.05 0.83 463.779 508329.5
Tobin’s Q 314,696 3.518829 6.176608 .2060 1.809387 105.0904 RoE 314,696 .0890093 .2683587 -.80291 .0970181 9.886905
Leverage 314,696 .3142774 .5807833 0 .2453287 69.17618 TradeVolume 314,696 .00121 .0059537 0 .000221 .5794915 NumInsider 314,696 2.037859 2.120972 0 1 32
Days to next report 314,696 57.00452 23.36936 0 62 91 Numest 314,696 7.568774 7.434395 1 5 51
Delay (days) 314,696 34.99665 95.14544 0 24 3,815
SCHUMPETER DISCUSSION PAPERS 2011-015

43
Table 3: Distribution of delays
This table reports summary statistics for the distribution of reporting delays.
All Purchases Sales Observations 314,696 98,933 215,763 Mean 35.00 40.42 32.51 St. dev. 95.15 114.54 84.66 0.25 quantile 15 14 16 Median 24 24 24 0.75 quantile 33 34 33 Percentage of late filings 13.21% 17.48% 11.25%
SCHUMPETER DISCUSSION PAPERS 2011-015
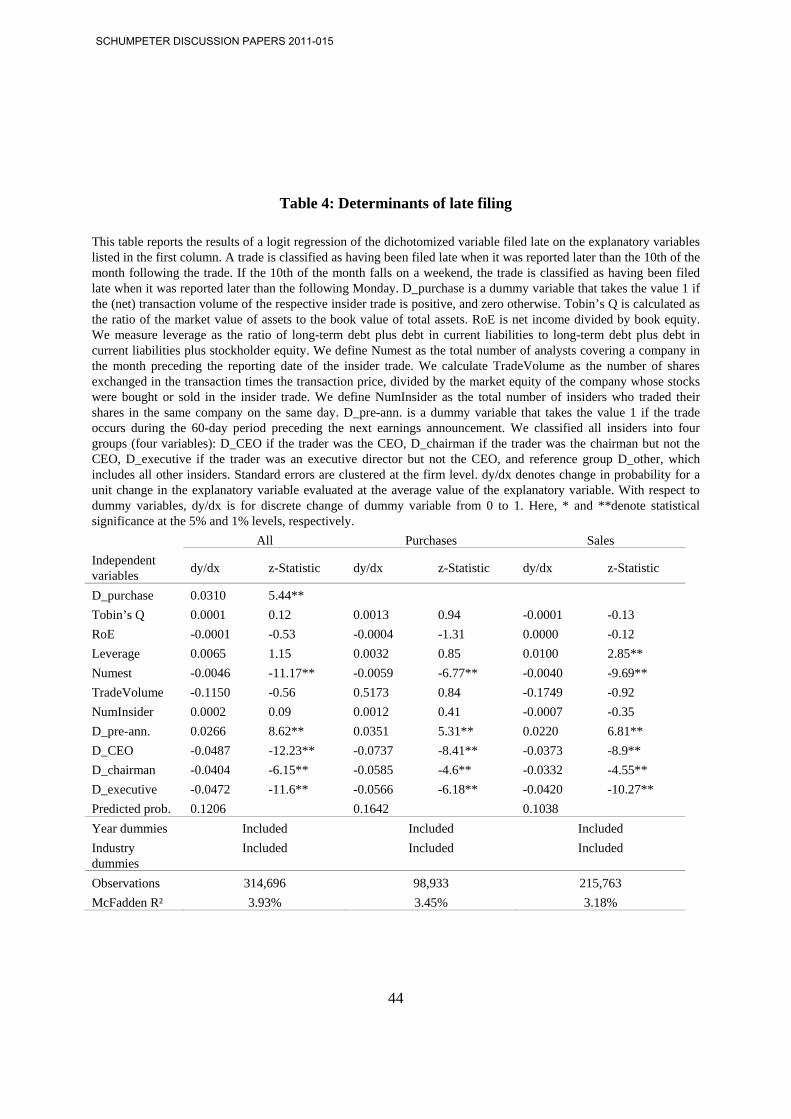
44
Table 4: Determinants of late filing
This table reports the results of a logit regression of the dichotomized variable filed late on the explanatory variables listed in the first column. A trade is classified as having been filed late when it was reported later than the 10th of the month following the trade. If the 10th of the month falls on a weekend, the trade is classified as having been filed late when it was reported later than the following Monday. D_purchase is a dummy variable that takes the value 1 if the (net) transaction volume of the respective insider trade is positive, and zero otherwise. Tobin’s Q is calculated as the ratio of the market value of assets to the book value of total assets. RoE is net income divided by book equity. We measure leverage as the ratio of long-term debt plus debt in current liabilities to long-term debt plus debt in current liabilities plus stockholder equity. We define Numest as the total number of analysts covering a company in the month preceding the reporting date of the insider trade. We calculate TradeVolume as the number of shares exchanged in the transaction times the transaction price, divided by the market equity of the company whose stocks were bought or sold in the insider trade. We define NumInsider as the total number of insiders who traded their shares in the same company on the same day. D_pre-ann. is a dummy variable that takes the value 1 if the trade occurs during the 60-day period preceding the next earnings announcement. We classified all insiders into four groups (four variables): D_CEO if the trader was the CEO, D_chairman if the trader was the chairman but not the CEO, D_executive if the trader was an executive director but not the CEO, and reference group D_other, which includes all other insiders. Standard errors are clustered at the firm level. dy/dx denotes change in probability for a unit change in the explanatory variable evaluated at the average value of the explanatory variable. With respect to dummy variables, dy/dx is for discrete change of dummy variable from 0 to 1. Here, * and **denote statistical significance at the 5% and 1% levels, respectively. All Purchases Sales Independent variables dy/dx z-Statistic dy/dx z-Statistic dy/dx z-Statistic
D_purchase 0.0310 5.44** Tobin’s Q 0.0001 0.12 0.0013 0.94 -0.0001 -0.13 RoE -0.0001 -0.53 -0.0004 -1.31 0.0000 -0.12 Leverage 0.0065 1.15 0.0032 0.85 0.0100 2.85** Numest -0.0046 -11.17** -0.0059 -6.77** -0.0040 -9.69** TradeVolume -0.1150 -0.56 0.5173 0.84 -0.1749 -0.92 NumInsider 0.0002 0.09 0.0012 0.41 -0.0007 -0.35 D_pre-ann. 0.0266 8.62** 0.0351 5.31** 0.0220 6.81** D_CEO -0.0487 -12.23** -0.0737 -8.41** -0.0373 -8.9** D_chairman -0.0404 -6.15** -0.0585 -4.6** -0.0332 -4.55** D_executive -0.0472 -11.6** -0.0566 -6.18** -0.0420 -10.27** Predicted prob. 0.1206 0.1642 0.1038 Year dummies Included Included Included Industry dummies
Included Included Included
Observations 314,696 98,933 215,763 McFadden R² 3.93% 3.45% 3.18%
SCHUMPETER DISCUSSION PAPERS 2011-015

45
Table 5: Descriptive statistics of strategic trades
This table presents descriptive statistics for the transactions in our sample sorted by classifying trades into nonstrategic and strategic categories. A trade is classified as strategic when it is followed by at least one additional trade by the same insider before it is reported, or if it follows a trade by the same insider that has not yet been reported, and nonstrategic otherwise. The strategic category is split into first of series and serial trades. A trade is classified as first of series if the trade is the first trade in a series of trades in which at least one trade is followed by at least one additional trade by the same insider before it is reported. A trade is classified as a serial trade if it follows a trade by the same insider that has not yet been reported. Percentages indicate fractions with respect to all transactions, all purchases, or all sales, respectively. Average volume denotes the average volume of the trade, that is, the number of shares bought or sold multiplied by the transaction price. All Purchases Sales Observations 314,696 140,734 215,763 Percentage Average volume $ Percentage Average volume $ Percentage Average volume $ Nonstrategic 32.12% 1,291,563 37.97% 197,628 29.44% 1,938,516 Strategic 67.88% 1,015,069 62.03% 284,504 70.56% 1,309,553 First of series 14.98% 1,389,175 12.59% 213,350 16.08% 1,811,510 Serial trades 52.90% 909,106 49.44% 302,631 54.48% 1,161,429
SCHUMPETER DISCUSSION PAPERS 2011-015

46
Table 6: Determinants of strategic trades
This table reports the results of a logit regression of the dichotomized variable strategic on the explanatory variables listed in the first column. A trade is classified as strategic when it is followed by at least one additional trade by the same insider before it is reported, or if it follows a trade by the same insider that has not yet been reported, and nonstrategic otherwise. D_purchase is a dummy variable that takes the value 1 if the transaction is a purchase, and zero if the transaction is a sale. Tobin’s Q is calculated as the ratio of the market value of assets to the book value of total assets. RoE is net income divided by book equity. We measure leverage as the ratio of long-term debt plus debt in current liabilities to long-term debt plus debt in current liabilities plus stockholder equity. We define Numest as the total number of analysts covering a company in the month preceding the reporting date of the insider trade. TradeVolume is the number of shares exchanged in the transaction times the transaction price, divided by the market equity of the company whose stocks were bought or sold in the insider trade. We define NumInsider as the total number of insiders who traded their shares in the same company on the same day. D_pre-ann. is a dummy variable that takes the value 1 if the trade occurs within 60 days prior to the next quarterly earnings announcement. D_late is a dummy that takes the value 1 if the trade is reported later than the 10th of the month following the trade. If the 10th of the month falls on a weekend, the trade is classified as illegal if it was reported later than the following Monday. We classified all insiders into four groups (four variables): D_CEO if the trader was the CEO, D_chairman if the trader was the chairman but not the CEO, D_executive if the trader was an executive director but not the CEO, and the reference group D_other, which includes all other insider groups. Standard errors are clustered at the firm level. dy/dx denotes the change in probability for a unit change in the explanatory variable evaluated at the average value of the explanatory variable. With respect to dummy variables, dy/dx is for a discrete change of dummy variable from 0 to 1. Here, * and ** denote statistical significance at the 5% and 1% levels, respectively. All Purchases Sales Independent variables dy/dx z-Statistic dy/dx z-Statistic dy/dx z-Statistic
D_purchase -0.1381 -17.68** Tobin’s Q 0.0066 7.37** -0.0018 -0.7 0.0066 7.39** RoE -0.0009 -2.68** -0.0013 -1.69 -0.0007 -2.86** Leverage 0.0023 0.8 0.0258 1.11 -0.0063 -1.73* Numest -0.0075 -14.5** -0.0128 -12.06** -0.0064 -11.95** TradeVolume -4.5124 -8.91** -1.3043 -1.33 -4.5983 -8.92** NumInsider 0.0030 1.05 0.0027 0.53 0.0017 0.58 D_pre-ann. 0.0081 2.21* 0.0256 3.92** -0.0009 -0.21 D_late 0.1064 18.7** 0.1401 13.9** 0.0843 15.3** D_CEO 0.0184 2.19* -0.0193 -1.34 0.0393 4.18** D_chairman 0.0778 5.81** 0.0415 1.67* 0.0886 5.8** D_executive -0.1852 -27.76** -0.2460 -22.53** -0.1561 -19.94** PredictedProb. 0.6980 0.6316 0.7269 Year dummies Included Included Included Industry dummies
Included Included Included
Observations 314,696 98,933 215,763 McFadden R² 8.05% 8.45% 7.96%
SCHUMPETER DISCUSSION PAPERS 2011-015

47
Table 7: Event study results
This table shows the CARs over various event windows and various subsamples. Here, * and ** denote statistical significance at the 5% and 1% levels, respectively. The significance levels for the CARs are based on the standardized cross-sectional test of Boehmer et al. (1991), and those for the differences are based on a t-test for equality of means.
Purchases Sales # (0; 1) (0; 2) (0; 10) (0; 20) # (0; 1) (0; 2) (0; 10) (0; 20)
All 34,648 0.29** 0.59** 1.99** 2.97** 65,319 -0.21** -0.29** -0.87** -2.05** Strategic 13,782 0.36** 0.76** 2.54** 3.75** 34,735 -0.25** -0.38** -1.05** -2.55** Nonstrategic 20,866 0.25** 0.49** 1.64** 2.45** 30,584 -0.17** -0.21** -0.66** -1.49** Difference 0.11* 0.27** 0.90** 1.30** -0.07 -0.17** -0.39** -1.06** Pre-ann. 20,643 0.34** 0.64** 2.16** 3.18** 37,849 -0.19** -0.24** -0.91** -1.99** Non pre-ann. 14,005 0.22** 0.52** 1.76** 2.66** 27,470 -0.23** -0.35** -0.81** -2.14** Difference 0.12* 0.12* 0.40** 0.52** 0.04 0.11* -0.10 0.14 Timed 6,472 0.26** 0.40** 1.28** 1.87** 8,793 0.05 0.03 -0.50** -1.21** Non-timed 28,176 0.30** 0.64** 2.16** 3.22** 56,526 -0.24** -0.33** -0.92** -2.19** Difference -0.05 -0.23** -0.88** -1.34** 0.30** 0.36** 0.43** 0.98** Filed late 8,105 0.31** 0.52** 1.65** 2.69** 14,897 -0.22** -0.30** -0.79** -2.04** Filed in time 25,430 0.27** 0.58** 2.06** 3.02** 47,816 -0.21** -0.29** -0.88** -2.06** Difference 0.04 -0.06 -0.41** -0.32* 0.00 -0.01 0.09 0.02 Delay 0–5 1,160 0.92** 1.32** 3.81** 4.52** 780 0.38** 0.35** -0.01 -1.07** Delay 6–10 3,602 0.31** 0.83** 2.31** 3.35** 4,216 -0.26** -0.36** -0.65** -1.71** Delay 11–5 5,402 0.21** 0.51** 2.07** 2.93** 9,068 -0.13** -0.19** -0.86** -2.01** Delay 16–20 4,833 0.40** 0.69** 2.02** 3.35** 9,760 -0.11** -0.20** -0.91** -2.11** Delay 21–25 5,082 0.39** 0.72** 2.23** 3.36** 11,356 -0.22** -0.30** -0.81** -2.04** Delay 26–30 4,781 0.28** 0.54** 1.57** 2.47** 11,135 -0.31** -0.46** -1.05** -2.32** Delay 31–35 3,943 0.08 0.38** 1.95** 3.12** 8,448 -0.24** -0.36** -0.99** -2.29** Delay 36–40 3,788 -0.03 0.22** 1.67** 2.52** 4,570 -0.32** -0.44** -0.80** -2.45** Delay 41–45 669 0.33** 0.75** 1.15** 1.99** 1,068 -0.23** -0.15** -0.69** -1.52** Delay > 45 3,202 0.38** 0.55** 1.49** 2.40** 4,918 -0.15** -0.16** -0.71** -1.61**
SCHUMPETER DISCUSSION PAPERS 2011-015

48
Table 8: Determinants of CARs (0; 20)
This table reports the results of a regression with firm fixed effects of the reporting day CARs (0, 20) on the explanatory variables listed in the first column. If several transactions in the same stock were reported on the same day, the transactions count as a single observation. A report is classified as a purchase if the net transaction volume reported is positive. Tobin’s Q is calculated as the ratio of the market value of assets to the book value of total assets. RoE is net income divided by book equity. Leverage is the ratio of long-term debt plus debt in current liabilities to long-term debt plus debt in current liabilities plus stockholder equity. We define Numest as the total number of analysts covering the company in the month preceding the reporting date of the insider trade. We calculate TradeVolume as the number of shares exchanged in the transaction times the transaction price, divided by the market equity of the company whose stocks were bought or sold in the insider trade. If several trades were reported on the same day, we sum the total volume of these trades. We define NumInsider as the total number of insiders who reported their trades in the same company on the same day. D_pre-ann. is a dummy variable that takes the value 1 if the trade (or at least one trade, if several trades are reported on the same day) occurs during the 60-day period preceding the next earnings announcement; D_timing is a dummy variable that takes the value 1 if the trade is executed within 60 days prior to the next earnings announcement and is reported after the announcement (but before the following announcement); and D_strategic is set to 1 when a) the trade is followed by at least one additional trade by the same insider before it is reported or if it follows a not-yet-reported trade by the same insider, and when b) the market can infer on the reporting date that the trade was strategic (see Figure 3 for an illustration). All other trades are classified as nonstrategic. With respect to strategic trades reported in an overlapping way, only serial transactions and not the first transaction can be identified as strategic. D_timing * D_stra. is an interaction term of the variables D_timing and D_strategic. Delay is the trading-volume–weighted average delay of all insider trades of a firm reported on the same day. We classified all insiders into four groups (four variables): D_CEO if the trader is the CEO, D_chairman if the trader is the chairman but not the CEO, D_executive if the trader is an executive director but not the CEO, and the reference group D_other, which includes all other insider groups. If there were several trades in the same stock on the same day, the highest insider position is selected according to rank, i.e., CEO, chairman, executive, and other. Standard errors are clustered at the reporting day level. Here, * and ** denote statistical significance at the 5% and 1% levels, respectively. Purchases Sales Independent variables Coef. t-Statistic Coef. t-Statistic Tobin’s Q -1.2663 -6.79** -0.6351 -7.05** RoE 0.0201 0.45 -0.0157 -0.56 Leverage 0.4168 1.62 -0.0305 -0.17 Numest -0.3112 -4.2** -0.2987 -5.49** TradeVolume -7.6341 -0.63 -11.0827 -1.47 NumInsider 0.3561 3.59** -0.3868 -4.18** D_pre-ann. 0.9130 3.62** 0.2334 1.04 D_timing -0.9636 -2.39* 0.5219 1.42 D_strategic 0.9047 3.05** -0.6151 -3.35** D_timing * D_stra. -0.1863 -0.38 0.0387 0.09 Delay -0.0019 -1.55 0.0031 2.09* D_CEO 2.3162 6.77** -0.8353 -2.4* D_chairman 1.9570 2.96** -0.6719 -1.73 D_executive 1.0402 3.72** -0.6146 -2.84** Constant 2.5661 0.96 -1.5233 -0.55 Year dummies Included Included Industry dummies Included Included Observations 34,648 65,319 Adjusted R² 11.12% 7.99%
SCHUMPETER DISCUSSION PAPERS 2011-015

49
Figure 1: Distribution of trading dates by day of the month
SCHUMPETER DISCUSSION PAPERS 2011-015

50
Figure 2: Distribution of reporting dates by day of the month
SCHUMPETER DISCUSSION PAPERS 2011-015

51
Figure 3: Definition of strategic trading
This figure illustrates our definition of strategic trade reporting. Panel A illustrates the more common case in which two trades (labeled trade 1 and 2) are executed and then reported jointly. Trade 3 is non-strategic because a) there is no unreported trade by the same insider on the trading day and b) trade 3 is reported before the insider makes another trade. Panel B illustrates the case of overlapping reports. Trades 1 and 2 are strategic because trade 1 has not yet been reported on the day on which trade 2 is executed. However, the trades are not reported jointly. Therefore, on the reporting day of trade 1, market participants cannot infer that trade 1 is strategic.
SCHUMPETER DISCUSSION PAPERS 2011-015