strategic planning break-out june 15, 2010. 2 agenda review strategic planning and context (15 min)...
TRANSCRIPT

Strategic planning break-outJune 15, 2010

2
Agenda
• Review strategic planning and context (15 min)
• Round-table discussion (10 min)
• Share proposed articulation of vision for the future (15 min)
• Round-table discussion (25 min)
• Debrief and close (10 min)

3
Strategic planning process will move BBBS further towards ‘What we achieve’ and ‘Why it matters’
Pre-2007: ‘What we do’
Post-2007:‘What we achieve’
2010 and beyond:‘Why it matters’
• Focus on increasing the number of "Littles" served by a mentor
• Focus on mentoring program excellence leading to a long, strong 1:1 relationship with a caring adult
• Focus on impact for "Littles," “Bigs,” the Community
4
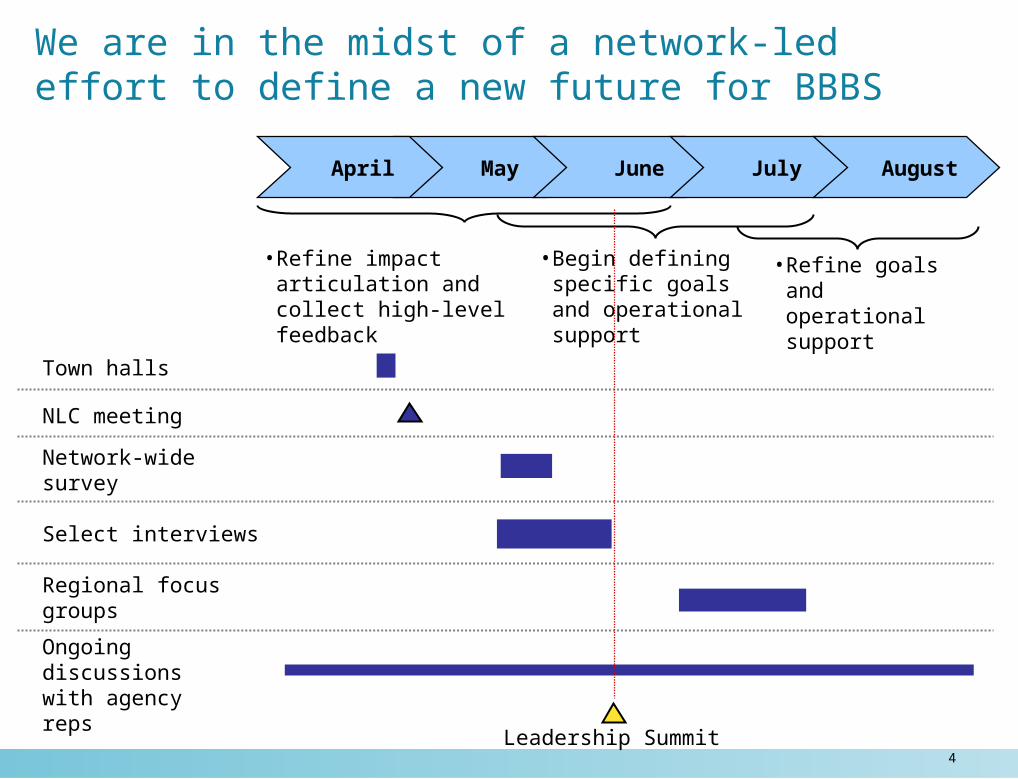
We are in the midst of a network-led effort to define a new future for BBBS
•Refine impact articulation and collect high-level feedback
•Begin defining specific goals and operational support
•Refine goals and operational support
Network-wide survey
Regional focus groups
Select interviews
Ongoing discussions with agency reps
Leadership Summit
May June July AugustApril
Town halls
NLC meeting

5
Since 2007, BBBS focused on achieving match quality with longer, stronger relationships
2004-2007: Focus on increasing participants and
capacity
2007-2010:Focus on match quality
• Growth of SBM and targeted programs (Amachi, Hispanic mentoring)
• Capacity building focus on leadership, fund development and volunteer recruitment
• Service delivery technology (AIM)
• Emphasize length and retention of matches
• Grow AIM to track quality for more agencies
• Evolve match quality metrics further through SoR and YOS
• Clarify goals around participant intentionality
“What we do” “What we achieve”

6
Network has made significant progress against match quality goals
• Match quality (length and retention of matches) improved across the BBBS network and particularly in places where targeted investments were made
–SBM match length increased from 10 months in 2007 to 12 months in 2009, close to goal of 13 months
–Six-month match retention increased for CBM and SBM, with SBM growing from 72% in 2006 to 76% in 2009, close to 2010 goal of 80%
–Six-month retention rates for enhanced SBM were 89%
Progress against 2007 goals: Match quality and
metrics • Increasing number of agencies have AIM capabilities–Number of AIM agencies grew from ~100 in 2006/2007 to ~170 in 2009, covering >70% of youth served
• Agencies adopting new tools (YOS) to measure improvements in education and risk avoidance behaviours

7
Agency breakdown shows many agencies have exceeded 2010 goals for match quality
0
20
40
60
80
100%
SBM
At/below 2007levels
Between 2007level and 2010
goal
At/above 2010goal
156
% of AIM agencies meetingSBM match length goals (2009)
0
20
40
60
80
100%
CBM
At/above2010 goal
Between2007 leveland 2010
goal
At/below2007levels
156
SBM
155
% of AIM agencies meeting6-mon retention goals (2009)
~70% of agencies have longer SBM matches than in 2007
~80% of agencies improved SBM and CBM six month retention
Source: 2007-2010 Business Plan; BBBSA internal data
8
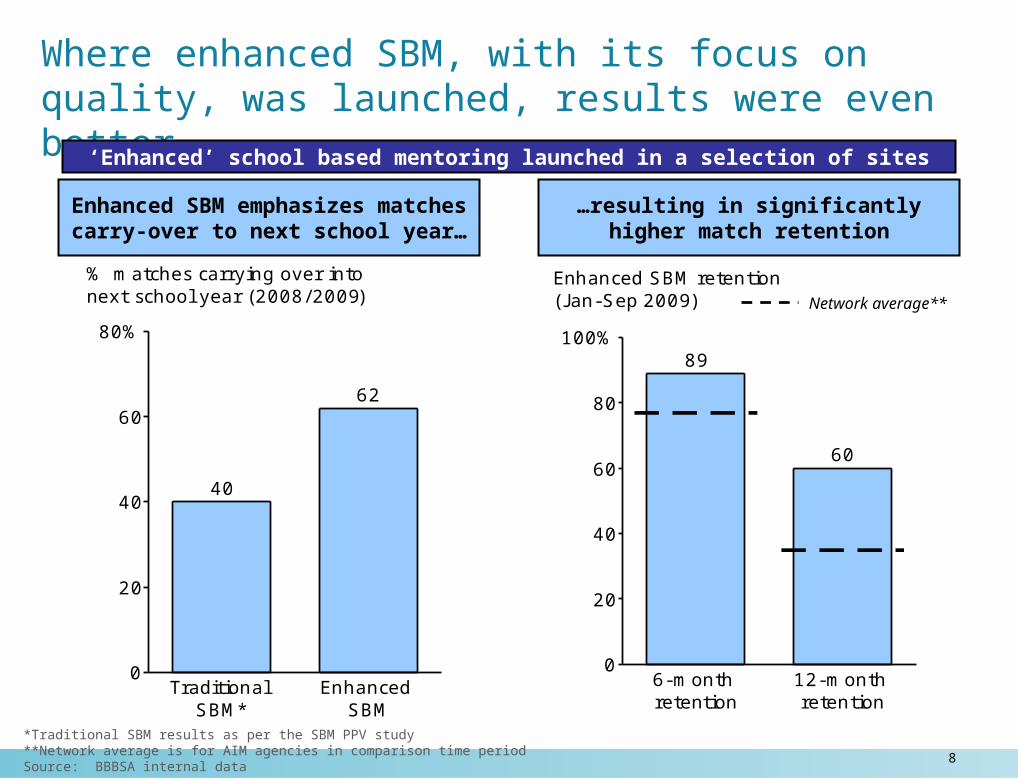
*Traditional SBM results as per the SBM PPV study**Network average is for AIM agencies in comparison time periodSource: BBBSA internal data
0
20
40
60
80%
TraditionalSBM*
40
EnhancedSBM
62
% matches carrying over intonext school year (2008/2009)
Where enhanced SBM, with its focus on quality, was launched, results were even better
0
20
40
60
80
100%
6-monthretention
89
12-monthretention
60
Enhanced SBM retention(J an-Sep 2009) Network average**
Enhanced SBM emphasizes matches carry-over to next school
year…
…resulting in significantly higher match retention
‘Enhanced’ school based mentoring launched in a selection of sites

9
However, recent economic conditions have made targeted network growth difficult
Progress against 2007
goals: Targeted
growth and sustainability
• Due to economic downturn, BBBS network revenue decreased ~10% in 2009, resulting in net ~1% decline from 2006-2009

10
The number of youth served grew prior to a large dip in 2009
0
100
200
300
400K
2003A
SBM
CBM
215
2004A
220
2005A
228
2006A
242
2007A
246
2008A
255
2009A
244
2010 goal
304
3% 4% 6% 2% 4% -4%YoY growthin youth
274 275 294 265Network revenues ($M)
No. youth served by program (K)
3%
-2%
(06-09)
0%
CAGR
Source: 2007-2010 Business Plan; BBBSA internal data
)

11
However, recent economic conditions have made targeted network growth difficult
Progress against 2007
goals: Targeted
growth and sustainability
• Due to economic downturn, BBBS network revenue decreased ~10% in 2009, resulting in net ~1% decline from 2006-2009
• As a result, BBBS network work was adversely impacted along dimensions of youth served and intentionality
–2009 youth served remains similar to 2006 levels, with large ~10% decline in SBM youth in 2009
–Percent of Hispanic and male Littles as well as African-American, Hispanic and male Bigs stayed relatively constant
–Percent of Hispanic Littles increased ~8% from 2008-2009 after 45 Hispanic Leadership agencies targeted increased levels of Hispanic youth and volunteers
12
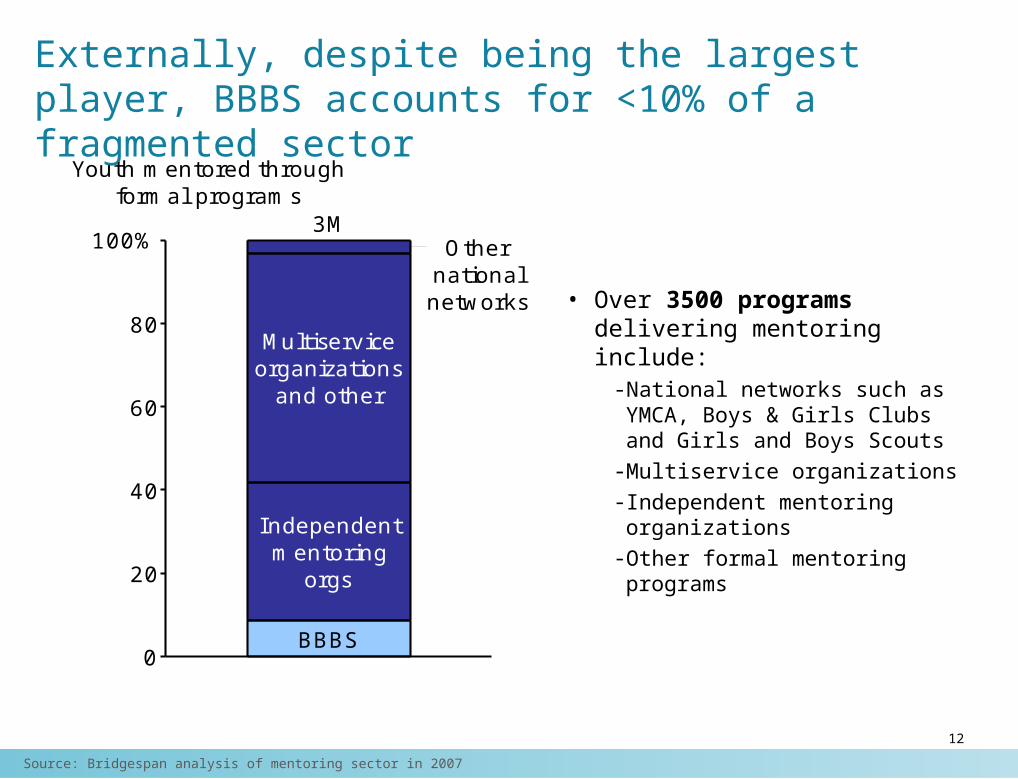
Externally, despite being the largest player, BBBS accounts for <10% of a fragmented sector
0
20
40
60
80
100%
Independentmentoring
orgs
BBBS
Multiserviceorganizations
and other
3M
Youth mentored throughformal programs
Othernationalnetworks • Over 3500 programs
delivering mentoring include:- National networks such as YMCA, Boys & Girls Clubs and Girls and Boys Scouts
- Multiservice organizations - Independent mentoring organizations
- Other formal mentoring programs
Source: Bridgespan analysis of mentoring sector in 2007

13
The economic downturn has reduced levels of public and private giving
*All percentages from Fall 2009Source: Organization websites; Center on Budget and Policy Priorities; Foundation Center; Chronicle of Philanthropy;
Managing Through Tough Times, The Bridgespan Group; Bridgespan analysis
• In 2009, foundation assets and grants decreased significantly
–Median assets of some of the largest US foundations fell from $1.2B in 2007 to $836M
–Median grants of largest US foundations fell from $43M in 2008 to $40M
• State budget gaps of $375 billion are projected in 2010 and 2011
Funders have less resources… …and nonprofits experienced
the consequences
• 80% of non-profit leaders reported cuts in funding
• 67% of non-profit leaders reported hearing of future cuts in funding
• 93% of non-profit leaders reported experiencing the effects of the economic downturn*

14
There are signs that donors are beginning to prefer organizations with evidence-based results
Source: Chronicle of Philanthropy; Bridgespan analysis
Charity Navigator, the non-profit watchdog, is changing the way it rates and evaluates organizations to incorporate a range of outcomes in addition to low overhead costs
New organizations have emerged (e.g. GiveWell, Great Nonprofits, Philanthropedia) responding to desire among individual donors for more information on non-profit effectiveness
A majority of high net worth individuals polled by Bank of America and the Center on Philanthropy at Indiana University said they would give more if they knew their dollars were having an impact
15
Summary
• BBBS agencies progressed towards match quality goals since the last strategic plan
• Network growth and intentionality goals limited by external conditions
• Funding sources are under pressure and shifting towards evidence - based programs

16
Round-table discussion I (10 minutes)
What experiences have we had that reflect this context?
Network growth and intentionality goals limited by external conditions
and/or
Funding sources are under pressure and shifting towards evidence - based programs
Please capture experiences on Round Table Discussion I sheet
(1-2 minutes for each group member)

17
Agenda
• Review strategic planning and context (15 min)
• Round-table discussion (10 min)
• Share proposed articulation of vision for the future (15 min)
• Round-table discussion (25 min)
• Debrief and close (10 min)

18
Most agencies surveyed agreed with need to move to ‘Why it Matters?’
Source: Network-wide input survey, May 26, 2010, N=97; Bridgespan analysis
0
20
40
60
80
100%No
Yes
% of respondents (N=97)
0
20
40
60%
Specificyouth
outcomes
53
Long-termlife
outcomes
23
Lifeskills
16
Other
8
% of respondents (N=97)
Q: A number of agencies have expressed a desire to evolve BBBS’
articulation of impact around “why it matters”…do you agree?
Q: To better articulate BBBS' impact, which category of outcomes do you
think will be most important to track?

19
Agencies shared fairly consistent aspirations for BBBS outcomes
• Consistency: ~80% of agencies surveyed felt consistency of outcomes articulation across the network was neutral or below
Source: Network-wide input survey, May 26, 2010, N=97; Bridgespan analysis
• Education: Agencies rated school attendance, grades, and HS graduation rates as top three outcomes aspired to for the network
• Life skills: Agencies suggested social engagement/relationships as an important impact to be measured**
• Risk avoidance: Agencies believed avoidance of the juvenile justice system and criminal or drug-related behaviours were also key outcomes*

20
BBBS mentoring is a vital link in helping youth envision and achieve positive life trajectories
All youth in our nation who need a mentor, with particular focus on disadvantaged youth
Who do we serve?
What do we achieve and why does it
matter?
What do we do?
PRELIMINARY
Influence others to adopt practices and policies to improve sector outcomes
Demonstrate mentoring best
practices
Create a long, strong 1:1 relationship with a caring adult who serves as a role model for the youth
Pair youth with mentors and provide training and
ongoing relationship support
Work with teachers, parents, and others to
support outcomes
Community impact
Individual impact Risk avoidanceEducation
Life skills
Positive life trajectories
Better educated and safer communities
21
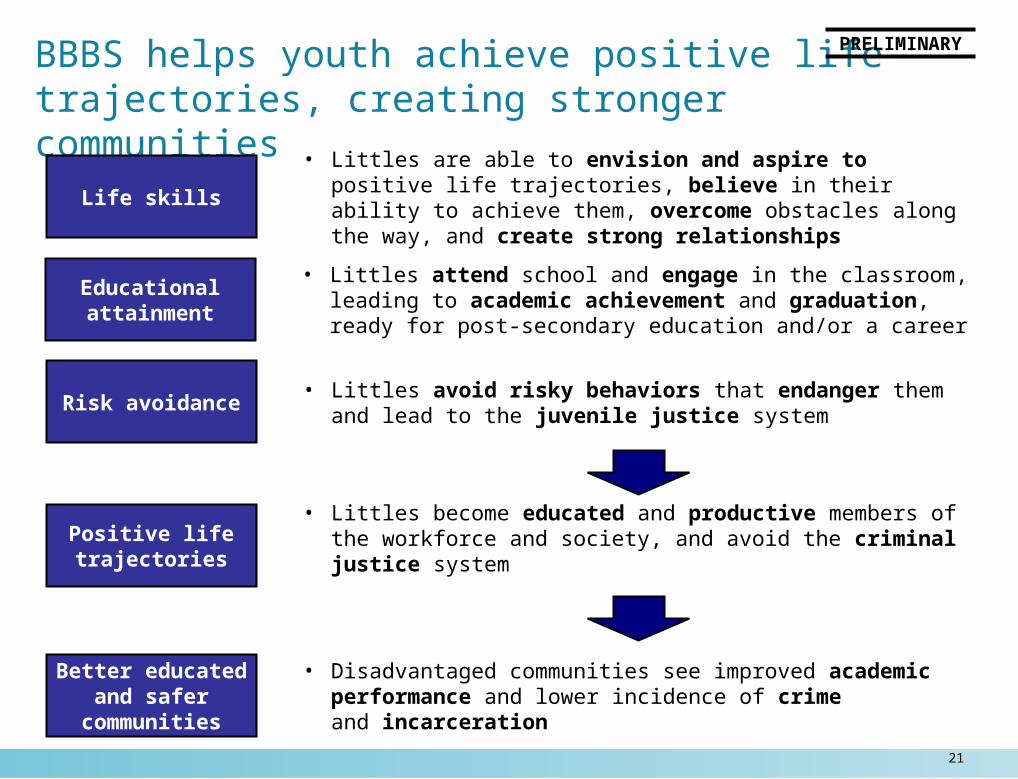
BBBS helps youth achieve positive life trajectories, creating stronger communities
Educational attainment
Risk avoidance
Life skills
• Littles are able to envision and aspire to positive life trajectories, believe in their ability to achieve them, overcome obstacles along the way, and create strong relationships
• Littles attend school and engage in the classroom, leading to academic achievement and graduation, ready for post-secondary education and/or a career
• Littles avoid risky behaviors that endanger them and lead to the juvenile justice system
Positive life trajectories
• Littles become educated and productive members of the workforce and society, and avoid the criminal justice system
Better educated and safer
communities
• Disadvantaged communities see improved academic performance and lower incidence of crime and incarceration
PRELIMINARY

22
Round-table discussion II (25 minutes)
What is different about this new vision?
What do we need to do to make this vision a reality?
Please capture experiences on Round Table Discussion II sheet

23
Agenda
• Review strategic planning and context (15 min)
• Round-table discussion (10 min)
• Share proposed articulation of vision for the future (15 min)
• Round-table discussion (25 min)
• Debrief and close (10 min)

24
Selected next steps
• Revise and share back vision based on feedback received today
• Begin to outline the ‘How’–Collaborate with researchers and select agency representatives to define outcomes and metrics
–Develop tools to support with outcomes measurement Data collection and analysis Relationship building Cost modeling
–Draft suggested implementation plan
Continue to get input and feedback from you

25
Thank you

26
Appendix
27
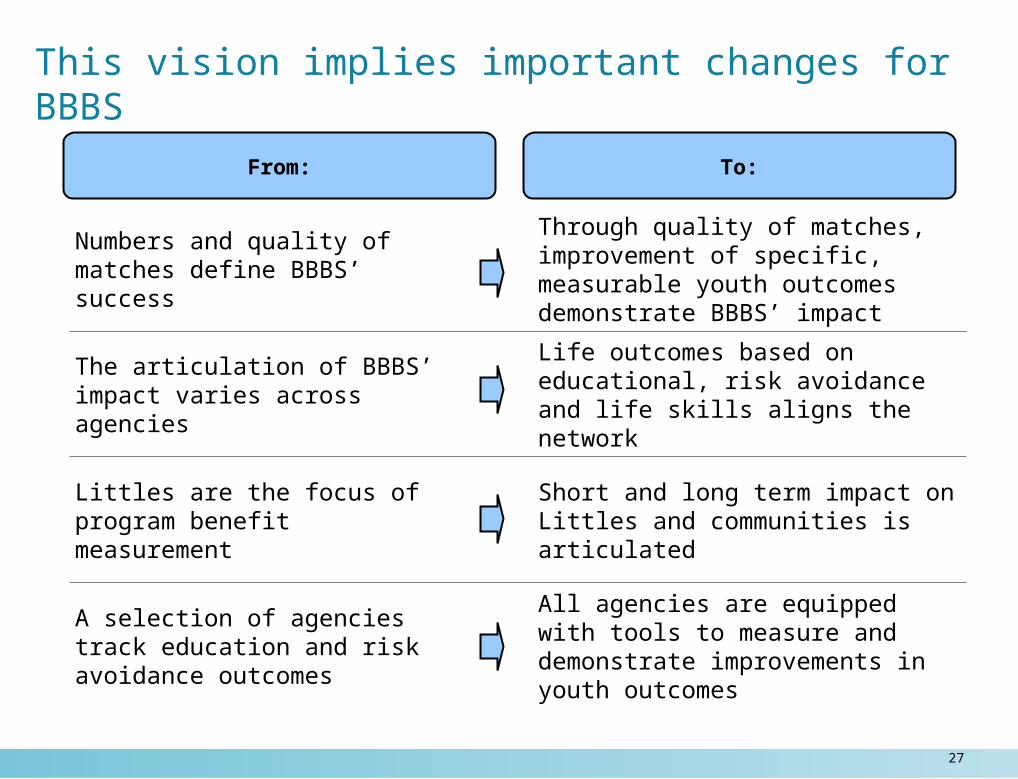
This vision implies important changes for BBBS
Numbers and quality of matches define BBBS’ success
Through quality of matches, improvement of specific, measurable youth outcomes demonstrate BBBS’ impact
The articulation of BBBS’ impact varies across agencies
Life outcomes based on educational, risk avoidance and life skills aligns the network
Littles are the focus of program benefit measurement
Short and long term impact on Littles and communities is articulated
A selection of agencies track education and risk avoidance outcomes
All agencies are equipped with tools to measure and demonstrate improvements in youth outcomes
From: To:

28
Tracking outcomes requires capacity, but the network is getting there with ongoing support
Emerging
Outcomes tracking
High
Emerging
High
• SoR and YOS
• Some external data driven outcomes
• Numerous target outcomes through external data
Agency capacity

29
Agencies will be provided with tools to support the outcomes gathering process
Data collection
Data analysis
Data framing
• Best practices to developing data collection partnerships
• Definitions of data that we will collect as a network and methods to effectively access the data
• Technology/tools for effective and efficient data entry and consolidation
• Guidelines for mapping data to specific outcomes measures
• Staff training on baseline and comparative analysis
• Sharing of comparative data across agencies
• Examples for framing data with respect to BBBS articulation of impact
• Guidelines for connecting external data-based outcomes with foundational measures like SoR and YOS
• Sample case for support for approaching various funders

30
In the long run, BBBS can show its powerful social ROI by linking mentoring to life outcomes
0
10
20
$30K
Cost per person
Average annual costof a Little mentored
by BBBS
1.2
Average difference inannual income betweena high-school graduate
and a high-school dropout
10.0
Average annualcost of an adult
in state orfederal prison
22.7
Note: Incarceration based on cost/inmate at state and federal prisons; Drop-out cost based on earnings difference between high-school graduates and dropouts; High-school graduate income does not include students who dropped out and later returned to graduate
Source: BBBS internal data; US Department of Justice Bureau of Justice Statistics; Rotermund, “Educational and Economic Consequences for Students Who Drop Out of High School”; Bridgespan analysis
BBBS has a positive ROI if it prevents 1 in 8
Littles from dropping out
BBBS has a positive ROI if it prevents 1 in 18 Littles from going
to prison

31
Some agencies already leveraging external data successfully to show evidence-based outcomes
*SelectedSource: Interviews with agency CEOs and program directors
Example of data measured:
• School attendance and truancy
• Grades in reading, math and science
• Number of school disciplinary actions
• Teacher and case manager behavioural assessments
• School attendance and tardiness
• Grades in reading and math
• Number of school discipline referrals
Results: • 90%+ of participants (annually) improving in:
– Subject letter grades and graduation to next grade level
– School attendance and homework completion
– School behavior and attitude
• 2007-2008 student group showed:– ~60% decreases absences and
tardies– ~50%-60% improved in grades– ~40% decreased discipline
referrals
BBBS of Broward County BBBS of Eastern Missouri