strategic planning, based on environmental spatial
TRANSCRIPT

Pollution, 5(3): 569-583, Summer 2019
DOI: 10.22059/poll.2018.260564.464
Print ISSN: 2383-451X Online ISSN: 2383-4501
Web Page: https://jpoll.ut.ac.ir, Email: [email protected]
569
Strategic Planning, Based on Environmental Spatial Assessment,
Using SWOT and GIS to Locate Sustainable Industrial Areas
(Case Study: Tehran Province)
Hoveidi, H.,* Nasehi, S., Imanpour Namin, A. and Nohegar, A.
School of Environment, college of Engineering, University of Tehran, P. O. Box
14155-6135, Tehran, Iran
Received: 26.12.2018 Accepted: 17.2.2019
ABSTRACT: Unbalanced distribution of population in a country like Iran as well as accelerating urbanization and environmental degradation, both arising from incorrect location of industrial areas, are two problems that require appropriate industrial development policies to get resolved. Considering the expansion of industrial areas along with their role in contamination of the environment, it is necessary to develop strategies to improve environmental performance. The purpose of this study is to provide strategies for establishment of industrial areas, based on environmental spatial assessment, using SWOT technique and GIS. In this method, once the spatial data are mapped and analyzed with GIS software, leading to determination of effective factors for location of industrial areas and their, the maps of such effective factors can be prepared. After weighing effective layers on location, based on the AHP model, the GIS software capabilities have been used to merge and overlap the maps and the industrial areas location map are prepared. The map has been classified in five classes (very poor, poor, moderate, good, and very good) and finally, based on the final map and SWOT analysis, optimal strategies have been developed to reduce environmental degradations. The location analysis with integrated GIS and SWOT method is effective for providing optimal strategies. More accurate results of this study show that the study area is located in "defensive" position and the authorized areas to locate the industrial areas in the "very good" class are over 240,191.9 hectares large, being mostly in the south and southwest of Tehran.
Keywords: Site selection, Industrial area, Fuzzy, Strategic planning, MCDM.
INTRODUCTION
Urban growth and expansion have occurred
hand in hand with development of industrial
activities, a combination that has created
employment opportunities and economic
powers for the citizens, on one hand, while
exposing these very citizens to various
kinds of pollution, e.g. water, air, soil, noise,
and visual pollution as well as chemical
contamination, on the other. Therefore, it is
quite important to find the optimal limit in
* Corresponding Author Email: [email protected]
which, along with job creation and
production growth, the environment and
human health will not be damaged, or
damage and destruction will be reduced to
conventional level (Naseri, 2012).
Due to the concentration of
environmental problems in small industrial
companies, they pose environmental
hazards (Fernández & Ruiz, 2009). For
industrial development, one should move
towards an efficient, clean, and eco-
friendly development (Li et al., 2016).
Nasehi, S., et al.
570
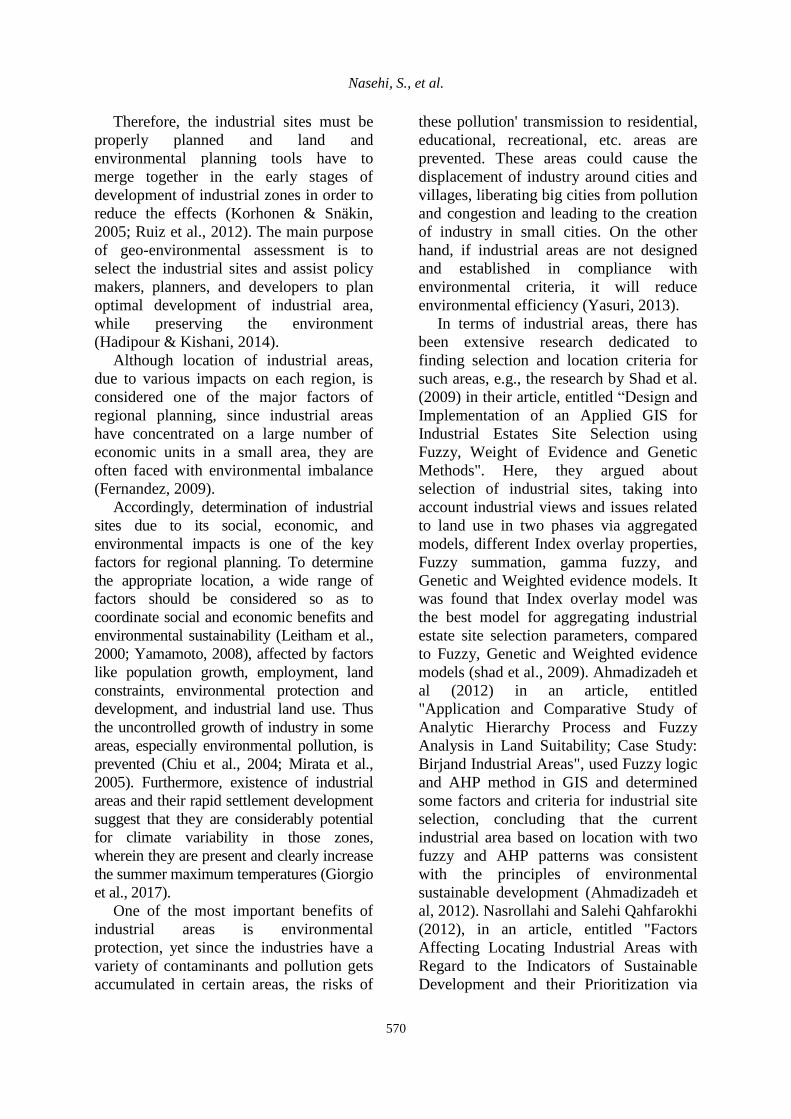
Therefore, the industrial sites must be
properly planned and land and
environmental planning tools have to
merge together in the early stages of
development of industrial zones in order to
reduce the effects (Korhonen & Snäkin,
2005; Ruiz et al., 2012). The main purpose
of geo-environmental assessment is to
select the industrial sites and assist policy
makers, planners, and developers to plan
optimal development of industrial area,
while preserving the environment
(Hadipour & Kishani, 2014).
Although location of industrial areas,
due to various impacts on each region, is
considered one of the major factors of
regional planning, since industrial areas
have concentrated on a large number of
economic units in a small area, they are
often faced with environmental imbalance
(Fernandez, 2009).
Accordingly, determination of industrial
sites due to its social, economic, and
environmental impacts is one of the key
factors for regional planning. To determine
the appropriate location, a wide range of
factors should be considered so as to
coordinate social and economic benefits and
environmental sustainability (Leitham et al.,
2000; Yamamoto, 2008), affected by factors
like population growth, employment, land
constraints, environmental protection and
development, and industrial land use. Thus
the uncontrolled growth of industry in some
areas, especially environmental pollution, is
prevented (Chiu et al., 2004; Mirata et al.,
2005). Furthermore, existence of industrial
areas and their rapid settlement development
suggest that they are considerably potential
for climate variability in those zones,
wherein they are present and clearly increase
the summer maximum temperatures (Giorgio
et al., 2017).
One of the most important benefits of
industrial areas is environmental
protection, yet since the industries have a
variety of contaminants and pollution gets
accumulated in certain areas, the risks of
these pollution' transmission to residential,
educational, recreational, etc. areas are
prevented. These areas could cause the
displacement of industry around cities and
villages, liberating big cities from pollution
and congestion and leading to the creation
of industry in small cities. On the other
hand, if industrial areas are not designed
and established in compliance with
environmental criteria, it will reduce
environmental efficiency (Yasuri, 2013).
In terms of industrial areas, there has
been extensive research dedicated to
finding selection and location criteria for
such areas, e.g., the research by Shad et al.
(2009) in their article, entitled ―Design and
Implementation of an Applied GIS for
Industrial Estates Site Selection using
Fuzzy, Weight of Evidence and Genetic
Methods". Here, they argued about
selection of industrial sites, taking into
account industrial views and issues related
to land use in two phases via aggregated
models, different Index overlay properties,
Fuzzy summation, gamma fuzzy, and
Genetic and Weighted evidence models. It
was found that Index overlay model was
the best model for aggregating industrial
estate site selection parameters, compared
to Fuzzy, Genetic and Weighted evidence
models (shad et al., 2009). Ahmadizadeh et
al (2012) in an article, entitled
"Application and Comparative Study of
Analytic Hierarchy Process and Fuzzy
Analysis in Land Suitability; Case Study:
Birjand Industrial Areas", used Fuzzy logic
and AHP method in GIS and determined
some factors and criteria for industrial site
selection, concluding that the current
industrial area based on location with two
fuzzy and AHP patterns was consistent
with the principles of environmental
sustainable development (Ahmadizadeh et
al, 2012). Nasrollahi and Salehi Qahfarokhi
(2012), in an article, entitled "Factors
Affecting Locating Industrial Areas with
Regard to the Indicators of Sustainable
Development and their Prioritization via

Pollution, 5(3): 569-583, Summer 2019
571
Triangular Fuzzy Numbers", found that
social and economic criteria were among
the most important factors for locating
industrial areas (Nasrollahi & Salehi
Qahfarokhi, 2012). Rachdawong and
Apawootichai in 2003, in an article titled
"Development of Criterion Weights for
Preliminary Site Selection: A pilot Project
of Supanburi Industrial Estate" used the
WLC method in GIS, considering 8 criteria
for locating an industrial area. They
concluded that analysis through GIS could
speed up the process of suitable site
selection (Rachdawong & Apawootichai,
2003). In 2012 Ziaei et al., in an article,
entitled "Fuzzy and GIS Combined
Modeling and Multi-Criteria Decision
Making; Case Study: Birjand", employed a
combined model of GIS and MCDA to
come to this conclusion that the method
assisted industrial site selection and urban
and regional planning (Ziaei et al, 2012).
The rapid growth of Tehran in recent
decades has caused many gardens and
agricultural area to become industrialized
ones, irrespective of environmental and
climate properties of this urban and its
surrounding cities, leading to several
environmental problems like air pollution,
water pollution, and –in general—the
reduction of refining capacity and pollutant
absorption in these areas. Due to the wide
range of industries along with their
effective role in Tehran's environmental
pollution, it is necessary to develop a
strategic plan to improve environmental
performance. For this reason, this paper
attempts to use the combination of GIS and
SWOT methods to improve the results.
Therefore, after identifying the current
status of industries and favorable locations
for the expansion of industries, the
problems and potentials of the region are
also perceived and strategies for reducing
environmental impacts are presented.
MATERIAL AND METHODS Tehran Province is about 12981 square
kilometers large, located between 34 to
36.5 degrees north latitude and 50 to 53
degrees east longitude. It is in the southeast
and center of the Alborz Mountain chain.
In general, areas like Tehran, located on
the central plateau and one of the largest
subsidence of the northern plateau, have
features such as high altitude, lack of
rainfall, lack of suitable vegetation, slopes,
and dryness (Yavari et al, 2007).
Table 1 presents the characteristics of
Tehran's industrial areas.
Fig. 1. Location of Tehran Province and its industrial areas
Nasehi, S., et al.
572
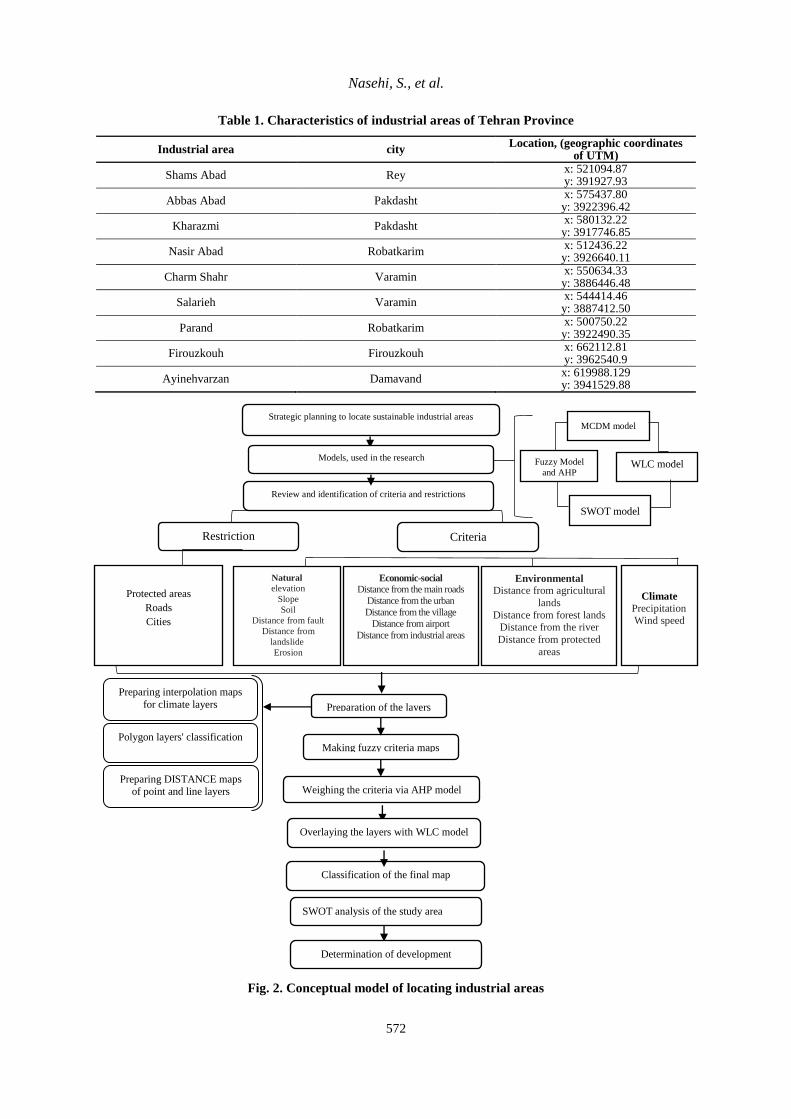
Table 1. Characteristics of industrial areas of Tehran Province
Industrial area city Location, (geographic coordinates
of UTM)
Shams Abad Rey x: 521094.87 y: 391927.93
Abbas Abad Pakdasht x: 575437.80 y: 3922396.42
Kharazmi Pakdasht x: 580132.22 y: 3917746.85
Nasir Abad Robatkarim x: 512436.22 y: 3926640.11
Charm Shahr Varamin x: 550634.33 y: 3886446.48
Salarieh Varamin x: 544414.46 y: 3887412.50
Parand Robatkarim x: 500750.22 y: 3922490.35
Firouzkouh Firouzkouh x: 662112.81 y: 3962540.9
Ayinehvarzan Damavand x: 619988.129 y: 3941529.88
Fig. 2. Conceptual model of locating industrial areas
Review and identification of criteria and restrictions
Restriction Criteria
Preparation of the layers
Making fuzzy criteria maps
Classification of the final map
SWOT analysis of the study area
Determination of development
strategies
Strategic planning to locate sustainable industrial areas
Weighing the criteria via AHP model
Climate
Precipitation
Wind speed
Environmental Distance from agricultural
lands
Distance from forest lands Distance from the river
Distance from protected
areas
Economic-social Distance from the main roads
Distance from the urban
Distance from the village
Distance from airport
Distance from industrial areas
Natural
elevation
Slope
Soil
Distance from fault
Distance from
landslide
Erosion
Protected areas
Roads
Cities
Models, used in the research
SWOT model
WLC model
Fuzzy Model
and AHP
model
MCDM model
Polygon layers' classification
Preparing DISTANCE maps
of point and line layers
Preparing interpolation maps
for climate layers
Overlaying the layers with WLC model

Pollution, 5(3): 569-583, Summer 2019
573
There are five main steps for the current
research: The first one selects the criteria
and prepares and evaluates the layers,
using the fuzzy method, while the second
one weighs the layers via Analytical
Hierarchy Process (AHP). In the third step,
the layers are weighted by linear
combination (WLC) and as for the fourth
one, the restriction layers are extracted
from the final map with the final step
concerning analysis of the case study by
means of the SWOT method, not to
mention the presentation of strategies for
the establishment of industrial areas.
Figure 2 summarizes the location analysis
of industrial areas in Tehran Province.
First Step - Review and Selection of
Criteria and Making Fuzzy Criteria
Maps: Table 3 gives the appropriate
criteria for locating. Selection of criteria is
based on library resources, Internet
resources, and characteristics of the studied
area, presented below:
A. Climatic parameters 1. Precipitation: The amount of rainfall in
the area is one of the factors affecting the
construction of an industrial areas that will
have an impact on construction and
facilities. In this way, the greater the
regional rainfall, the more the points
awarded to the region (Hashemian et al.,
2013).
2. Wind speed: Wind speed in the area
is one of the factors affecting the location
of industrial areas, since the wind can
transmit pollutants from industrial areas to
other places, posing some dangers to
residents of the surrounding area.
B. Environmental parameters 1. Distance from the river: Rivers are
natural factors on earth that form special
residences and recreation areas. Wind
turbines, located along the coast and
adjacent to the rivers, will bring
undesirable effects on the appearance of
these areas, which are also ecologically the
habitat of many birds. Hence, it is always
important to take care of them.
2. Land use: The status of different uses
in terms of construction of industries and
environmental impacts can be considered.
Forest and agricultural lands should not be
allocated to industrial use and development
must be carried out in land units that
minimize the damage to vegetation.
(Fataei, 2013).
3. Distance from Protected Areas:
Wildlife in an area is considered one of its
ecological needs. Their protection means
protecting the region's ecosystem;
therefore, the noise and all kinds of
pollution from industries as well as
transportation in the region, causing the
destruction of wildlife or triggering their
migration from the region, are included
(Rachdawong & Apawootichai, 2003).
C. Economic and social parameters 1. Access to the communication network:
The availability of communication
channels is very important for quick and
easy access to the provincial capital and
other parts of the country, specifically,
concerning exchange points from ports and
customs for determination of industrial
areas' location (Rachdawong &
Apawootichai, 2003).
2. Distance from cities and village:
Cities and settlements with large
populations may be affected by industrial
areas in terms of safety, noise, landscape,
and pollution, so they should be protected
from the appropriate distance.
D. Natural parameters 1. Erosion: Land erosion is a major factor
for construction. The areas at high altitudes
can have characteristics like high slopes
and igneous rocks that indicate low soil
depth and high erosion in them.
2. Faults and Seismicity: Fault lines as
seismic lines are important for planning
and development. Fractures, resulting from
faults, can have many impacts on

Nasehi, S., et al.
574
sediments and rocks of the area in different
directions (Sobhan Ardakani et al., 2013).
3. Slope: Flat areas have lower slopes
and less preparation costs. Therefore, slope
is one of the most influential parameters
for selection of industrial site.
4. Elevation: Elevation should be in a
way not making construction and transfer
of equipment difficult.
Fuzzy modeling approach: Initially,
Professor Askar Lotfi Zadeh developed
Fuzzy logic under uncertain conditions.
The fuzzy theory can formulate many
unambiguous and incorrect variables,
systems, and concepts, providing control
and decision making with uncertainty. The
ability of GIS systems in Raster Map
Analysis makes it possible to execute
different approaches such as Fuzzy, since
the negative and positive threshold data (0
to 1, not in a binary format) would
determine the degree of membership of the
variables. The fuzzy logic approach creates
more flexible compositions of weighted
maps and can be easily executed, using
GIS modeling language (Lee et al., 2012).
In this model, the membership of an
element in the collection would be defined
in a range of 1 (full membership) to zero
(non-membership) (Bonham-Carter, 1991).
So the Membership Fuzzy operating
instruction is used. Actually, the definition
of the Fuzzy membership (or standardizing
the criteria) is one of the main steps of
Multiple Criteria Decision Making
(MCDM). Fuzzy membership functions are
categorized from two aspects: Type and
Shape. The former are themselves
categorized into S-shaped (Sigmoidal), J-
shaped (J shaped), and linear varieties,
while the latter includes monotonic
increase, monotonic decrease, and
symmetric shape (Eastman et al., 1993).
(Table 2). Table 3 presents the weights and
control point of criteria, based on expert
opinions and reviews of scientific articles
and technical reports. Fig. 3 shows digital
layers of Fuzzy membership.
Table 2. Categorization of Fuzzy Membership Functions
Fuzzy membership function shape Monotonic
increase Monotonic decrease Symmetric
Fu
zzy m
emb
ership
fun
ction
typ
e
Sigmoidal
J-shaped
Linear
Second Step: Weighing the Criteria
Using the AHP Method: The study used
multi-criteria evaluation techniques to
determine the importance of the criteria,
themselves. These techniques are based on
ideal point analysis, with AHP being one
of the most common MCDM as well as a
flexible decision-making tool for multi-
criteria problems, incorporated into GIS-
based sitting procedures (Mosadeghi et al.,
2015). First developed by Satty in 1980 to
help decision makers, AHP arrives at the
best decision in a case of multiple
conflicting objectives (criteria), organizing
and evaluating the relative importance of
selected objectives as well as relative
importance of alternative solutions. In
other words, this method is a common

Pollution, 5(3): 569-583, Summer 2019
575
decision-making technique, which can be
used to analyze and support decisions with
multiple objectives. For so doing, a
complex problem is divided into a number
of simpler problems within the hierarchy
(Wang et al., 2009). By using the AHP
method, the criteria (factors) are compared
both pair-wise and reciprocally in each
level and the numerical priority is
allocated.
Third Step: Overlaying the Layers
with WLC Model: WLC is the
commonest technique for analysis of multi-
scale evaluation. It is based on the average
weight content, combining the layers,
obtained from the calculated weights, with
the analyzer or decision-maker being based
on relative importance, weighted directly
to the scales. Afterwards, by multiplying
relative weight in feature value, a final
measure can be obtained for each option.
Once this final value has been specified for
each option, alternatives with higher values
will be the most proper ones for the desired
purpose, which can be considered as
determination of earth proportion for a
specific operation or evaluation of a
particular occurrence potentiality. In this
method, decision making principle
calculates the value of each Ai options
through the following equation:
n
i j ijj 1A W X
(1)
where j is the jth
criterion weight, a value
for accepting the position in relation to
criterion j that can indicate the appropriate
degree of location I in relation to criterion
j. N represents the total number of criteria
and Ai is a value, which will attach to
location I. In this method, the total weight
should be equal to 1; otherwise, in the last
stage, Ai should be divided by the sum of
all weights, hence confining it between 0
and 1. Higher or lower amounts of this
value could be due to an appropriate or
inappropriate alternative, and weight
normalization can be omitted. In the end,
the ideal option will be the one with higher
amount of Ai (Malczewski, 2006).
Fourth Step: Extracting the
Restrictive Layers: At this stage, in order
to identify the appropriate areas for
industrial areas, the protected areas, cities,
and roads will get omitted from the final
composition map.
Fifth Step: Analysis of the Study Area
with the SWOT Model: SWOT Analysis
is a commonly used tool to analyze
external and internal environments
simultaneously in order to acquire a
systematic approach as well as support for
a situation in need of decision (Kurttila et
al., 2000; Kangas et al., 2003; Yuksel &
Dagdeviren 2007). The most considerable
internal and external factors for the
industrial area's future are referred to as
strategic factors. In SWOT these factors
are grouped into four parts called SWOT
groups, namely the strengths, weaknesses,
opportunities, and threats. By applying
SWOT in strategic decisions, the purpose
is to select or constitute and implement a
strategy, resulting in a good fit between the
internal and external factors (Kangas et al.,
2001). Moreover, the chosen strategy also
has to be in line with current and future
purposes of the decision makers (Kajanusa
et al., 2004). This analysis involves
systematic thinking and comprehensive
diagnosis of factors relating to a new
product, technology, management, or
planning (Kahraman et al., 2008).
RESULTS AND DISCUSSION The results, obtained by evaluating
standardized criteria in accordance with
fuzzy membership function in industrial
area location, revealed that the criteria and
sub-criteria had been categorized into four
types, viz. climatic, environmental,
economic-social, and natural as well as 18
sub-criteria, the values and the type of
membership function of which can be seen
in the following table:

Nasehi, S., et al.
576
Table 3. Standardized criteria and sub-criteria with fuzzy membership functions
Function Type Weight Fuzzy Numbers
Sub-Criteria Criteria a b c d
0.154 - - 4.5 2.5 wind speed
clim
atic
0.028 40℅ - - 25℅ precipitation
0.051 - - 5000 500 distance from
agricultural lands
0.048 - - 5000 500
distance from
gardens and forest
lands
env
iro
nm
enta
l
0.042 - - 1500 500 distance from river
0.062 - - 5000 3000 distance from
protected areas
0.039
6000 1000 distance from flood
line areas
0.043 - - 10000 1000 distance from urban
eco
no
mic
-so
cial
0.036 - - 5000 1000 distance from
village
0.032 - - 5000 1000 distance from airport
0.1 - - 4000 2000 distance from
industrial areas
0.130 2000
1500
1000
500
elevation
nat
ura
l
0.077 100 20 10 3 slope
0.029 - - 9 1 soil
0.032 - - 10000 1000 distance from fault
0.031 - - 7000 1000 distance from
landslide
0.034 - - 8 1 erosion

Pollution, 5(3): 569-583, Summer 2019
577
Fig. 3. (a) distance from agricultural lands, (b) distance from the airport, (c) distance from gardens and
forest lands, (d) distance from urban areas, (e) elevation, (f) erosion, (g) distance from flood line, (h)
wind speed, (i) distance from landslide, (j) distance from protected areas, (k) distance from main
roads, (l) distance from villages, (m) slope, (n) distance from river, (o) precipitation, (p) distance from
the fault, (q) soil, and (r) distance from industrial areas
Table 4. Restrictions on locating industrial areas
Buffer Restrictions Layers 250 meters buffer zone from the main road 500 meters buffer zone from the urban 1000meters buffer zone from protected areas
Restriction maps are constructed, using
the Boolean Method. They happen to be
zero and zero, so that zero values are
inappropriate for industrial areas. Figure 4
illustrates these maps.
Various fuzzy combinations were used
to combine standardized sub-criteria with
fuzzy membership functions, after applying
the weight.

Nasehi, S., et al.
578
Fig. 4. (a) protected areas, (b) transportation network, (c) urban areas, and (d) final restrictions map
Fig. 5. Final land suitability map for establishment of industrial areas
Fig. 6. Characteristics of locating the Map of Tehran Province Industries in GIS

Pollution, 5(3): 569-583, Summer 2019
579
Table 5. Characteristics of locating map of the industrial areas in Tehran Province
Percent (of the province) Area (ha) Class 25 467059,1958 Very poor 6.3 115395,5416 Poor 25 459991,3968 Moderate 30 548565,3184 Good 13 240191,9295 Very good
Table 6 and 7 list the most important
internal and external factors, respectively.
The former considers the internal factors for
environmental management of industrial
areas of Tehran Province. The strengths and
weaknesses are graded as follows: 4= strong
strength, 3= weak strength, 2= low
weakness, and 1= severe weakness.
According to the table, in terms of strengths,
the highest weight was 0.123 and the lowest,
0.041. As for the weaknesses, the highest one
was 0.068 and the lowest, 0.035. Having
multiplied the weight by the degrees, one
could see that it was equal to the weighted
score, while the sum of weighted scores was
equal to the total score of internal factors.
The average of these scores was 2.5 and the
maximum, 4. If this number is above 2.5, the
environmental pollution will be in a
favorable condition in terms of internal
factors. According to the table, the sum of
these values was 1.123.
Table 7 presents the external factors'
evaluation matrix for the most important
opportunities and threats in Tehran
province in terms of the environmental
pollution of industrial areas. The
opportunities and threats are graded as
follows: great opportunity is equal to 1 and
2, while weak opportunity is 3. Also,
severe threat is 1 and weak threat, 4. These
factors have been expressed quantitatively
in order to avoid any misunderstandings
and intuitive judgments. Finally, the total
weight was written, which in case of being
higher than average (2.5), means that the
advantages of external opportunities are
properly used and the threats faced by the
organization are avoided. The maximum
weight for total factors was 4. As it can be
seen, the highest and lowest weight in
opportunities and probabilities was 0.116
and 0.046, and the sum of these values was
2.13.
Table 6. Internal Factors Evaluation Matrix (IFE)
Weighed Score Score Weigh Strengths
0.128 2 0.064 Appropriate distance between industrial areas and cities S1
0.492 4 0.123 Proper slope in the southern parts of the province S2
0.041 1 0.041 Proper location of the province in Iran S3
0.282 3 0.094 Proper elevation for construction in the central and southern parts of the
province S4
0.098 2 0.049 Low concentration of industries in the north of the province S5
0.249 3 0.083 Security of southern parts of the province in terms of distance from slide
centers S6
0.135 3 0.045 Very low soil erosion in the southern parts of the province S7
Weaknesses
0.11 2 0.055 Proximity of some industrial areas with agricultural land in the south of the
province W1
0.098 2 0.049 Proximity of some industrial areas with gardens in the north of the province W2
0.114 3 0.038 Existence of landslide centers in the northern part of the province. W3
0.136 2 0.068 Presence of traffic in industrialized areas W4
0.041 1 0.041 Lack of green corridor in the vicinity of the industrial areas W5
0.035 1 0.035 Environmental turbulence in the vicinity of industrial areas W6
0.252 4 0.063 High wind speed in the north of the province W7
0.135 3 0.045 Soil erosion in the northern parts W8
0.076 2 0.038 Proximity of some industrial areas to faults W9
0.126 2 0.063 Proximity of some industrial areas to protected areas W10
1.123 1 Total internal factors

Nasehi, S., et al.
580
Table 7. External Factors Evaluation Matrix (IFE)
Weighed
Score Score Weigh Opportunities
0.246 3 0.082 Expansion of clean industries around cities O1
0.092 2 0.089 Existence of environmental laws, prohibiting the construction
of an industrial area on natural lands O2
0.178 2 0.046 Government incentive projects to reduce industrial pollution O3
0.1 2 0.050 Government support for non-proliferation of industries O4
0.055 1 0.055 Studies on plants' resistance to pollution O5
0.073 1 0.073 Application of construction rules to build industrial estates in
safe areas O6
Threats
0.652 4 0.163 Noise and visual pollution in the vicinity of industrial areas T1
0.291 3 0.097 Lack of water resources and water crisis in central Iran T2
0.464 4 0.116 Destruction of natural landscapes and undesirable ecological
effects T3
0.177 3 0.059 Physical expansion of Tehran due to inland and outland
regional migration T4
0.13 2 0.065 Low construction safety in earthquake-prone areas T5
0.42 4 0.105 Exacerbation of environmental pollution due to industrial
concentration T6
2.13 1 Total external factors
In order to determine the strategic
position of the study area, it is needed to
determine the scores, derived from both
Internal Factors Evaluation Matrix (IFE)
and External Factors Evaluation Matrix
(IFE) in their vertical and horizontal
dimensions so that the location of the area
can be determined and appropriate
strategies can be defined for it. This matrix,
which matches the SWOT matrix and
specifies the strategies for the region, is
presented in Fig 7.
Fig. 7. The strategic position of the study area
Pollution, 5(3): 569-583, Summer 2019
581
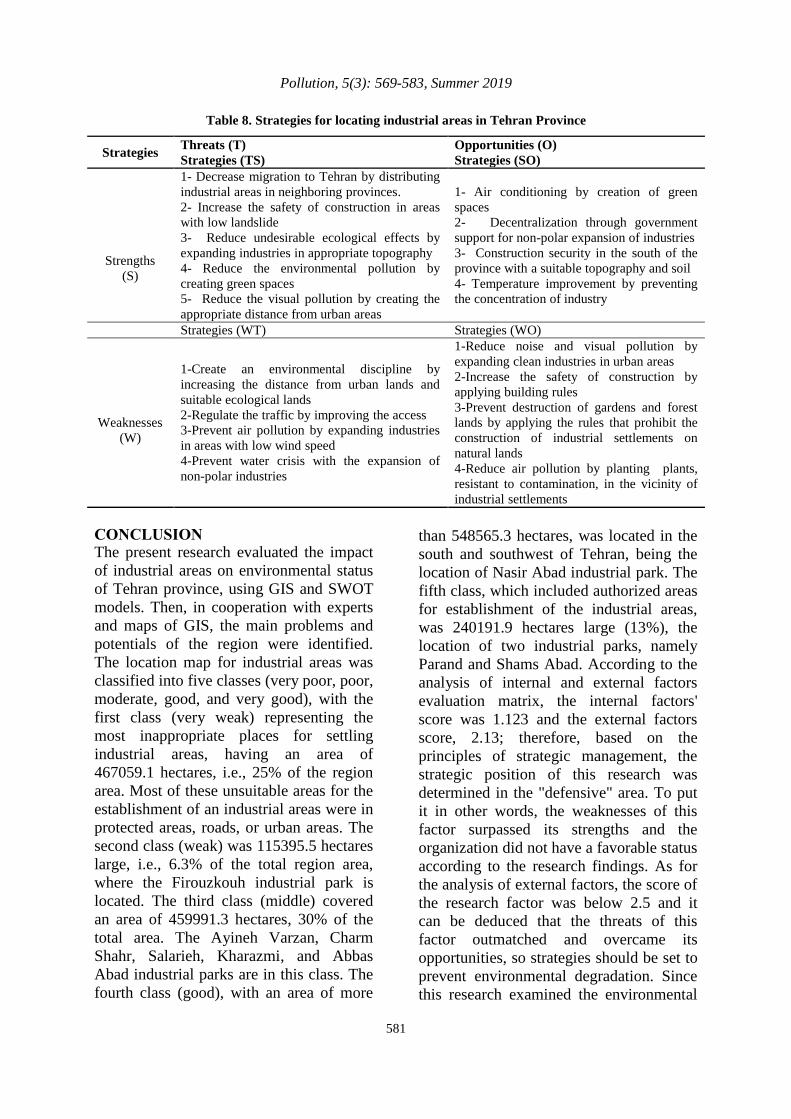
Table 8. Strategies for locating industrial areas in Tehran Province
Opportunities (O) Threats (T) Strategies
Strategies (SO) Strategies (TS)
1- Air conditioning by creation of green
spaces 2- Decentralization through government
support for non-polar expansion of industries
3- Construction security in the south of the
province with a suitable topography and soil 4- Temperature improvement by preventing
the concentration of industry
1- Decrease migration to Tehran by distributing
industrial areas in neighboring provinces. 2- Increase the safety of construction in areas
with low landslide
3- Reduce undesirable ecological effects by
expanding industries in appropriate topography
4- Reduce the environmental pollution by
creating green spaces
5- Reduce the visual pollution by creating the
appropriate distance from urban areas
Strengths
(S)
Strategies (WO) Strategies (WT)
1-Reduce noise and visual pollution by
expanding clean industries in urban areas
2-Increase the safety of construction by
applying building rules 3-Prevent destruction of gardens and forest
lands by applying the rules that prohibit the
construction of industrial settlements on
natural lands
4-Reduce air pollution by planting plants,
resistant to contamination, in the vicinity of
industrial settlements
1-Create an environmental discipline by
increasing the distance from urban lands and
suitable ecological lands 2-Regulate the traffic by improving the access 3-Prevent air pollution by expanding industries
in areas with low wind speed 4-Prevent water crisis with the expansion of
non-polar industries
Weaknesses
(W)
CONCLUSION The present research evaluated the impact
of industrial areas on environmental status
of Tehran province, using GIS and SWOT
models. Then, in cooperation with experts
and maps of GIS, the main problems and
potentials of the region were identified.
The location map for industrial areas was
classified into five classes (very poor, poor,
moderate, good, and very good), with the
first class (very weak) representing the
most inappropriate places for settling
industrial areas, having an area of
467059.1 hectares, i.e., 25% of the region
area. Most of these unsuitable areas for the
establishment of an industrial areas were in
protected areas, roads, or urban areas. The
second class (weak) was 115395.5 hectares
large, i.e., 6.3% of the total region area,
where the Firouzkouh industrial park is
located. The third class (middle) covered
an area of 459991.3 hectares, 30% of the
total area. The Ayineh Varzan, Charm
Shahr, Salarieh, Kharazmi, and Abbas
Abad industrial parks are in this class. The
fourth class (good), with an area of more
than 548565.3 hectares, was located in the
south and southwest of Tehran, being the
location of Nasir Abad industrial park. The
fifth class, which included authorized areas
for establishment of the industrial areas,
was 240191.9 hectares large (13%), the
location of two industrial parks, namely
Parand and Shams Abad. According to the
analysis of internal and external factors
evaluation matrix, the internal factors'
score was 1.123 and the external factors
score, 2.13; therefore, based on the
principles of strategic management, the
strategic position of this research was
determined in the "defensive" area. To put
it in other words, the weaknesses of this
factor surpassed its strengths and the
organization did not have a favorable status
according to the research findings. As for
the analysis of external factors, the score of
the research factor was below 2.5 and it
can be deduced that the threats of this
factor outmatched and overcame its
opportunities, so strategies should be set to
prevent environmental degradation. Since
this research examined the environmental

Nasehi, S., et al.
582
and ecological status, its results can give
authorities of the region and the province a
good view of environmental issues. It is
also possible to plan in future, taking into
account the issues, problems, and
potentials of the region. Finally, given the
identified limitations and advantages,
strategies can be set for achievement of a
sustainable environment in the province.
REFERENCE Ahmadizadeh, S.S.R., Hajizadeh, F. and Ziaei, M.
(2012). Application and Comparative Study of
analytic hierarchy process and Fuzzy Analysis in
Land Suitability; Case Study: Birjand Industrial
areas, J. Geogr. Reg. Develop, 10 (18).
Bonham-Carter, G. (1991). Geographic Information
Systems for Geoscientists: Modelling with GIS.
(Pergamon Ontario)
Chiu, A. S. F. and Yong, G. (2004). On the
industrial ecology potential in Asian Developing
Countries. J. Clean. Prod, 12(8-10); 1037-1045.
Eastman, J. R., Jin, W., Kyem, P. A. K. and
Toledano, J. (1993). GIS and Decision Making
(book). Geneva, UNITAR exploration in
geographic information system technology, Vol 4.
Clark University.
Fataei, E. (2013). Feasibility study of border
industrial estates using AHP and TOPSIS (case
study: Ardabil province). J. Geogr. Develop,
12(37); 181-193.
Fernández, I. and Ruiz, M. C. (2009). Descriptive
model and evaluation system to locate sustainable
industrial areas. J. Clean. Prod, 17(1); 87-100.
Giorgio, G. A., Ragosta, M., and Telesca, V.
(2017). Climate variability and industrial-suburban
heat environment in a Mediterranean area.
Sustainability, 9(5); 775.
Hadipour, M. and Kishani, M. (2014).
Environmental Location Planning of Industrial
Zones Using AHP and GIS in Arak City. Global
illuminators, 1; 109-114.
Hashemian, F., Samadi khadem, S., Hamidi, A. and
Amadi masoud, N. (2013). Evaluation of Ecological
Capacity of Ardebil City for Industrial
Development by Spatial Multi Criteria Evaluation
Method, 1th International conferences of landscape
ecology, Isfahan, Isfahan university of technology.
Kahraman, C., Demirel, N. C., Demirel, T. and
Ates, N. Y. (2008). SWOT-AHP application using
fuzzy concept: E-Government in Turkey, Fuzzy
Multi-Criteria Decision Making Book-Edited by
Cengiz Kahraman, Springer, Boston, MA ;85-117.
Kangas, J., Kurttila, M., Kajanus, M. and Kangas,
A. (2003). Evaluating the management strategies of
a forestland estate-the SO-S approach, J. Environ.
Manage, 69(4); 349-358.
Kangas, J., Pesonen, M., Kurttila, M. and Kajanus,
M. (2001). A'WOT: Integrating the AHP with
SWOT Analysis, 6th ISAHP 2001 Proceedings,
Berne, Switzerland; 189-198.
Kajanus, M., Kangas, J. and Kurttila, M. (2004).
The use of value focused thinking and the A WOT
hybrid method in tourism management. J. Tourism.
Manage, 25(4); 499-506
Kurttila, M., Pesonen, J., Kangas, M. and Kajanus,
M. (2000). Utilizing the analytic hierarchy process
(AHP) in SWOT analysis, A hybrid method and its
application to a forest-certification case, J. Forest.
Policy. Econ, 1(1); 41-52.
Korhonen, J. and Snäkin, J. P. (2005). Analysing
the evolution of industrial ecosystems: concepts and
application. J. Ecol. Econ, 52(2); 169-186.
Lee, A. H., Lin, C. Y., Kang, H. Y. and Lee, W. H.
(2012). An integrated performance evaluation
model for the photo voltaics industry. J. Energies,
5(4); 1271-1291.
Leitham, S., McQuaid, R. W. and Nelson, J. D.
(2000). The influence of transport on industrial
location choice: a stated preference experiment.
Transportation Research Part A: Policy and
Practice, 34(7); 515-535.
Li, H. B., Li, Q. J. Zhang, J. Huang, S. G. Yu, Y.,
Zheng., Cheng, J. C. and Wang, C. C. (2016).
Internal and external relaxations in ZnNb2O6
ceramics. J. Eur. Ceram. Soc, 36(10); 2513-2518.
Malczewski, J. (2006). Ordered weighted averaging
with fuzzy quantifiers: GIS-based multi criteria
evaluation for land-use suitability analysis. Int. J.
Appl. Earth. Obs. Geoinf 8; 270-277.
Mirata, M. and Emtairah, T. (2005). Industrial
symbiosis networks and the contribution to
environmental innovation: the case of the
Landskrona industrial symbiosis programme. J.
Clean. Prod, 13(10-11); 993-1002.
Mosadeghi, R., Warnken, J., Tomlinson, R. and
Mirfenderesk, H. (2015). Comparison of Fuzzy
AHP and AHP in a spatial multi-criteria decision
making model for urban land-use planning. J.
Comput. Environ. Urban. Syst, 49; 54-65.
Naseri, F. (2012). Locating Industrial area in
Marivan City Using Geographic Information
Pollution, 5(3): 569-583, Summer 2019
Pollution is licensed under a "Creative Commons Attribution 4.0 International (CC-BY 4.0)"
583
System (GIS). Faculty of Geographical Sciences,
Kharazmi University.
Nasrollahi, Z., and Ghahfarokhi salehi, F. (2012).
Criteria of Eco-Industrial Park Location and their
Prioritization with Using Fuzzy AHP and
Triangular Fuzzy Number. Quarterly J. Res. Econ.
Growth. Develop, 2(7); 66-51.
Rachdawong, P., and Apawootichai, S. (2003).
Development of criterion weights for preliminary
site selection: A pilot project of Supanburi
industrial estate. Development, 25(6); 774.
Ruiz, M. C., Romero, E., Pérez, M. A. &
Fernández, I. (2012). Development and application
of a multi-criteria spatial decision support system
for planning sustainable industrial areas in Northern
Spain. J. Automat. Constr, 22; 320-333.
Shad, R., Ebadi, H., Mesgari, M. and Vafaeinezhad,
A. (2009). Design and implementation of an applied
GIS for industrial estates site selection using Fuzzy,
weight of evidence and genetic methods. J. college
of engineering, university of Tehran, 43(4); 417-
429.
Sobhan ardakani, S., Mohaghegh, S. S. and
Monavari, S. M. (2013). Environmental Valuation
of Industrial Estates Location (Case Study:
Kohgilouyeh & Boyerahmad Province). Int. J.
Agric. Crop. Sci, 5(18); 2147.
Yamamoto, K. (2008). Location of industry, market
size and imperfect international capital mobility. J.
Reg. Sci. Urban Econ, 38(5); 518-532.
Yasouri, M. (2013). The Survey of the Status of
Industries location and Industrial Estates in the
Mashhad County. Town and Country Planning,
5(2); 288-261.
Yuksel, I. and Dagdeviren, M. (2007). using the
analytic network process (ANP) in a SWOT
analysis A case study for a textile firm. J. Inform.
Sci, 177; 3364-3382.
Yavari, A., Sotoudeh, A and Parivar, P. (2007).
Urban environmental quality and landscape
structure in arid mountain environment, Int. J.
Environ. Res., 1(4); 325-340.
Wang, G., Qin, L., Li, G. and Chen, L. (2009)
Landfill site selection using spatial information
technologies and AHP: a case study in Beijing,
China. J. Environ. Manage, 90(8); 2414-2421.
Ziaei, M., Hajizadeh, F., Ahmadizadeh, S. S. R.,
and Jahanifar, K. (2012). A Combined Model of
GIS and Fuzzy Multi Criteria Decision Analysis
(FMCDA) for Suitable Evaluation/Selection of
Industrial Areas, (Birjand, Iran). in Recent
Researches in Environmental Science and
Landscaping; 174–180.