strategic marketing final presentation (re-submission)
TRANSCRIPT

Team 5
Mahjuba Azizpour
Kyle Sander
John Canaban
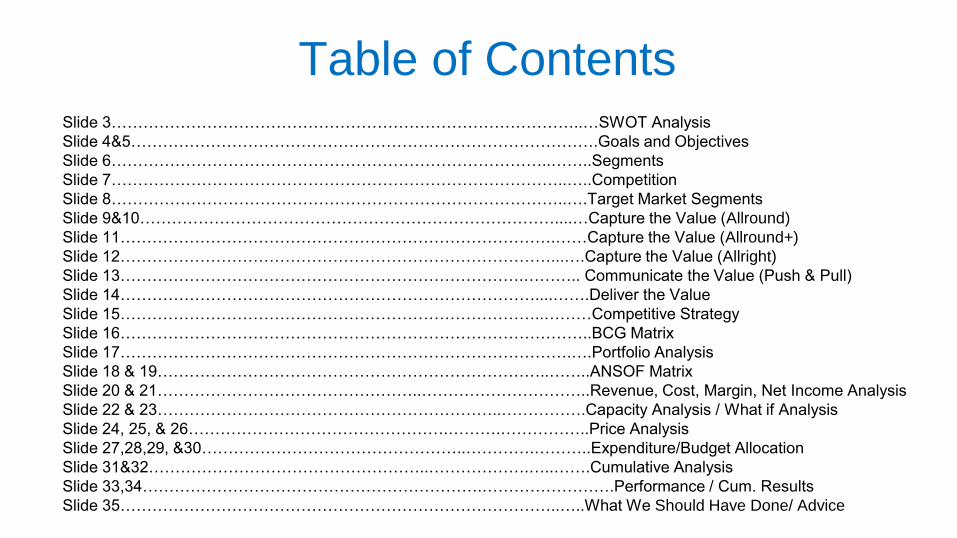
Table of ContentsSlide 3……………………………………………………………………………..…SWOT Analysis
Slide 4&5…………………………………………………………………………….Goals and Objectives
Slide 6………………………………………………………………………..……..Segments
Slide 7…………………………………………………………………………..…..Competition
Slide 8…………………………………………………………………………..….Target Market Segments
Slide 9&10……………………………………………………………………....…Capture the Value (Allround)
Slide 11……………………………………………………………………….……Capture the Value (Allround+)
Slide 12………………………………………………………………………...….Capture the Value (Allright)
Slide 13………………………………………………………………….……….. Communicate the Value (Push & Pull)
Slide 14……………………………………………………………………....…….Deliver the Value
Slide 15……………………………………………………………………..………Competitive Strategy
Slide 16……………………………………………………………………………..BCG Matrix
Slide 17………………………………………………………………………….….Portfolio Analysis
Slide 18 & 19………………………………………………………………..……..ANSOF Matrix
Slide 20 & 21…………………………………………..…………………………..Revenue, Cost, Margin, Net Income Analysis
Slide 22 & 23………………………………………………………..…………….Capacity Analysis / What if Analysis
Slide 24, 25, & 26………………………………………….……….……………..Price Analysis
Slide 27,28,29, &30…………………………………………..………….………..Expenditure/Budget Allocation
Slide 31&32……………………………………………..……………….…..…….Cumulative Analysis
Slide 33,34……………………………………………………….…………………….Performance / Cum. Results
Slide 35………………………………………………………………………..…..What We Should Have Done/ Advice

S.W.O.T Analysis STRENGTHS:
- Market Leader
- Well established brand
- Highest satisfaction among customers
- Most frequently purchased product in market
- High Brand Awareness
- Highest Trial Level
- Strong R&D Team
WEAKNESSES- High Cost of Goods Sold compared to
competitors
- Brand Formulation includes Alcohol – Not
Suitable for Families with Young Children
- Limited Product Line – Specifically Allergy
- Small Starting Sales Force in Comparison to
Competition.
OPPORTUNITIES- Create a Social Media Website to Answer
Customer Questions and Concerns
- Reformulate Allround by Removing Alcohol
Creating Ability to Target Families with
Children
- Introduce a 12hr. Capsule to Appeal to New
Market Segments Desiring Longer Relief
- Introduce Allergy Medication
- Highest % of Brand Share and Marketing
Among Young Families
- Retention Ratio is Lower than Other Brands
THREATS- Besthelp Recommended More than
Allround
- Introduction of New Competing Products by
Competitors
- Believe and Defogg is Competition for
Allright

Goals & Objective
Metric Goal Reality Reasoning
Average Retail Price Keep a steadily
increasing retail price.
In the practice
round we tend to
drop the price when
the simulation told
us price was too
high, rather than
allowing inflation to
catch up.
Sales Force Increase Sales force in
beginning above
competition
Keep sales force above
competition
Being a market
leader it occurred
to us that we
started off with a
low sales force in
comparison with
our competitors.

Goals & Objectives
Metric Goal Reality Reasoning
Return On Marketing Overall increase our
Return on Marketing
We drastically
decreased in our
marketing return
throughout the practice
rounds
Stock Price Have a stock price that
rises every round
Does not have to rise
in any particular
increments
Had stock price drop
several times during
practice rounds and
wanted to improve on
this.

Market Segments

Competition
Company Name Sales (millions) Brands on the Market
B&B Healthcare 355 Believe: 4-hr multi-symptom
cold liquid
Curall Pharmaceuticals 199 Coughcure: 4-hr cough
liquid
Driscol Corporation 255 Defogg: 4-hr allergy capsule
Dripstop: nasal cold spary
Dryup: 4-hr multi-symptom
cold capsule
Ethik Incorporated 396 Effective: nasal cold spary
End: 4-hr cough liquid
Extra: 12-hr cold capsuel

Target Market SegmentNote: After Introduction of Final Product Allright
Market Segment Cold Cough Allergy
Young Singles Allround
Allround+
Allround Allround
Allright
Allround+
Young Families Allround Allround Allround
Mature Families Allround Allround Allround
Allright
Empty Nesters Allround
Allround+
Allround Allround
Allright
Allround+
Retired Allround
Allround+
Allround Allround
Allround+

Capture the Value - Allround
Allround original formula
● Removed Alcohol
✓ Removed drowsiness
✓ Target Consumers with Children
Analg. Antihist. Decon. Cough
Supp.
Expect. Alcoh. Description
Allroud 1000 4 60 30 0 20 4hr. Multi Liquid
Analg. Antihist. Decon. Cough
Supp.
Expect. Alcoh. Description
Allround 1000 4 60 30 0 0 4hr. Multi Liquid

● Added Expectorant
✓ Added Benefit of treating Chest Congestion
✓ Increased Doctor Recommendations
Allround Tradeoff & Symptom Relief
● Pricing as slightly higher than perceived effects
proved to be successful.
Analg. Antihist. Decon. Cough
Supp.
Expect. Alcoh. Description
Allround 1000 4 60 30 100 0 4hr. multi liquid
Brand MSRP Perceived Price Perceived Effect Purchased
Allround $8.29 Very High High 22.5%
Besthelp $6.79 Low Low 16.7%

Capture the Value - Allround+● Line Extension to Allround as a 12 hour multi-capsule for customers looking for prolonged relief
● Allround+ proved to increase sales and market share
Tradeoffs & Symptom Relief
● Pricing proved to be unsuccessful as our price ended
too high in comparison to major competitors
Analg. Antihist. Decon. Cough Supp. Expect. Alcoh Description
Allround+ 1300 8 100 0 0 0 12hr. multi capsule
Brand MSRP Perceived
Price
Perceived Effect Purchased
Allround+ $8.09 Very High Averge 7.1%
Besthelp $6.79 Low Average 23.2%
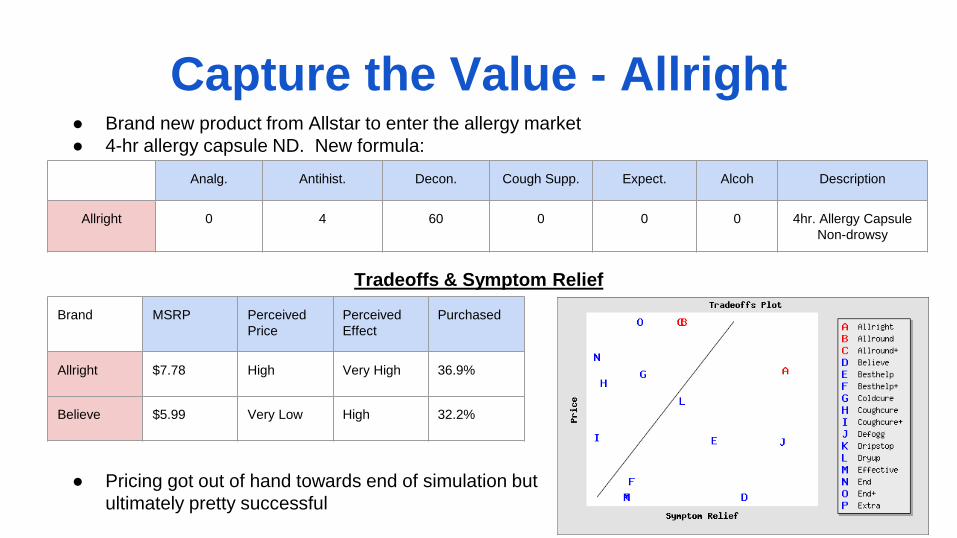
Capture the Value - Allright● Brand new product from Allstar to enter the allergy market
● 4-hr allergy capsule ND. New formula:
Tradeoffs & Symptom Relief
● Pricing got out of hand towards end of simulation but
ultimately pretty successful
Analg. Antihist. Decon. Cough Supp. Expect. Alcoh Description
Allright 0 4 60 0 0 0 4hr. Allergy Capsule
Non-drowsy
Brand MSRP Perceived
Price
Perceived
Effect
Purchased
Allright $7.78 High Very High 36.9%
Believe $5.99 Very Low High 32.2%
Communicate the Value Push
● In the very first period we drastically increased our sales force so that it was
greater than our major competitor in all categories. Then we increased it in
accordance to the growth shown in each channel, making sure we remained
higher than our main competitor.
● Along with our sales force we strived to keep our trade allowance as higher
than our competition.
Pull
● Allround - Used BMW rounds 0-8, then dropped to S&R as we felt this would
help our net income and stock price. With allround we stressed benefits and
comparison in our advertising.
● Allround+ - Used BMW throughout inception of reformulation to the end of the
simulation and stressed benefits.
● Allright - Used BMW throughout inception of the product until the end of the
simulation and stressed comparison.
● We felt promotion to be very important and consistently tried to stay ahead of
our competitors and based our decisions on this criteria.
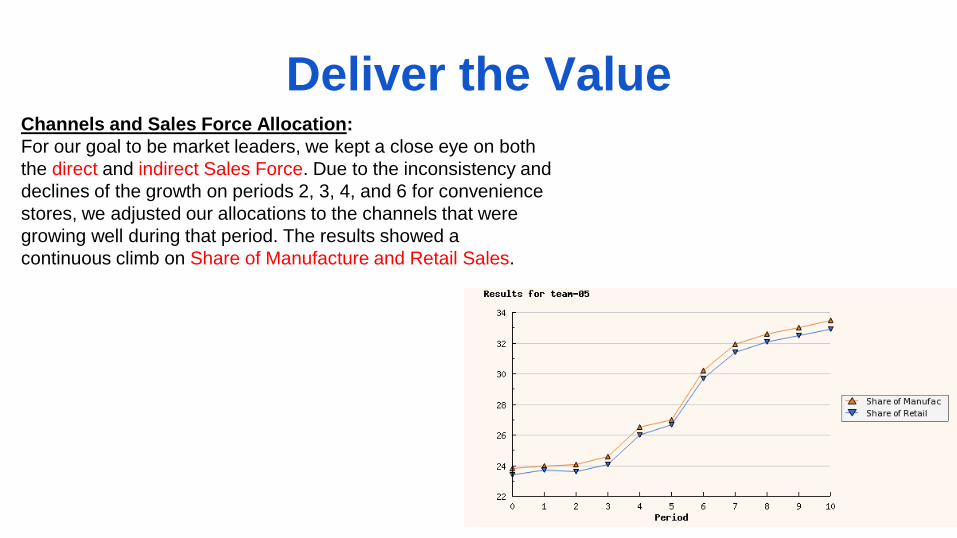
Deliver the ValueChannels and Sales Force Allocation:
For our goal to be market leaders, we kept a close eye on both
the direct and indirect Sales Force. Due to the inconsistency and
declines of the growth on periods 2, 3, 4, and 6 for convenience
stores, we adjusted our allocations to the channels that were
growing well during that period. The results showed a
continuous climb on Share of Manufacture and Retail Sales.

Competitive Strategy
Leadership:
Our goal was to remain the market leader. Because our product was well known and
perceived highly, we kept the MSRP higher than the competition. To counter with our high MSRP, we
allocated discounts, trail size, and coupons to all our brands throughout the periods.
Differentiation:
To differentiate us from competitors, we kept our brand formulation to an all purpose multi
liquid for Allround and multi capsule for Allround+. With Allround, we were the only liquid that targeted
all 15 segments. Allround+ served as a line extension for prolonged relief.
Focus:
Our focus was with the industry growth. We allocated our expenditures according to
growth or decline of individual channels to fulfill the demand. This also helped Allround’s perception of
having high trade off value.

BCG Matrix - Growth/Share PortfolioProduct Market Share Market share
of largest
competitor
Relative
market share
Market Growth Revenue
(millions)
Allround 22.1% 14.7% 1.5 10.1% $981.34
Allround+ 5.7% 14.7% .39 10.1% $252.7
Allright 5.1% 3.9% 1.3 10.1% $225
As compared to the Standard Portfolio Graph shown on following page

Portfolio Analysis
● We were never able to move Allround into the cash cow sector of the portfolio graph
and use this money to better our other, newer products. Allround suffered
cannibalization by allright.
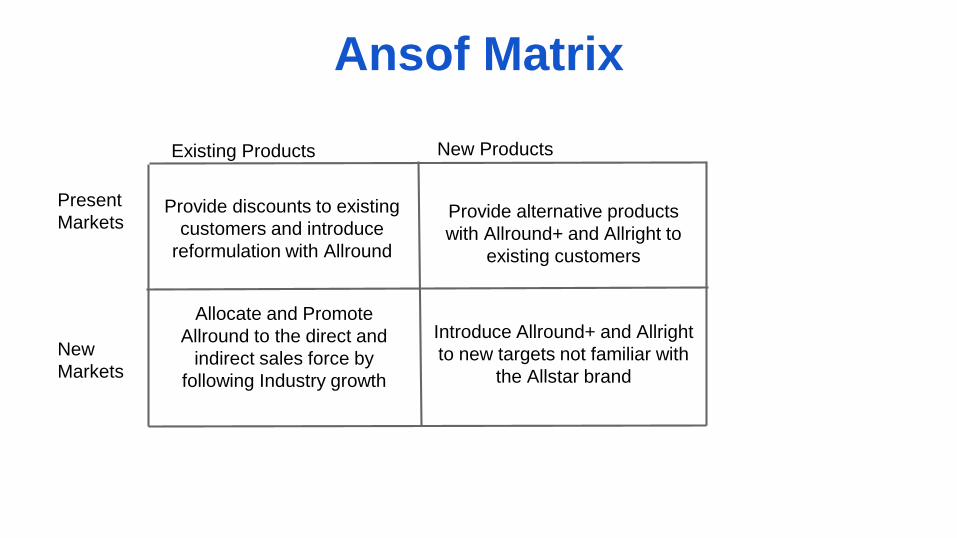
Ansof Matrix
Present
Markets
New
Markets
Provide discounts to existing
customers and introduce
reformulation with Allround
Provide alternative products
with Allround+ and Allright to
existing customers
Allocate and Promote
Allround to the direct and
indirect sales force by
following Industry growth
Introduce Allround+ and Allright
to new targets not familiar with
the Allstar brand
Existing Products New Products


Revenue, Cost, Margin, Net Income Analysis
● Overall gross margin rose
through the ten periods and as a
result net income rose.
● As our our cost of goods sold
rose, our gross margin fell and
net income responded
accordingly as shown by the
graphs.

Revenue, Cost, Margin, Net Income Analysis
● As our gross
margin remained
relatively stable,
our budget
expenditures
rose and this
really hurt our
marketing
efficiency.

Capacity Analysis/ What if Analysis
● We utilized full
capacity throughout
all ten periods. This
shows we were able
to continue to drive
sales.
● This drove COGS to
rise along with Net
Income
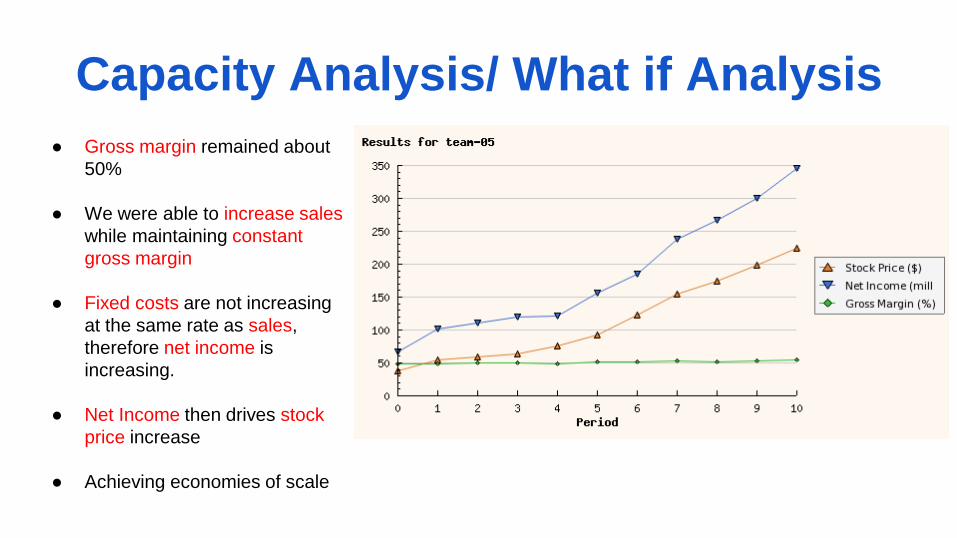
Capacity Analysis/ What if Analysis
● Gross margin remained about
50%
● We were able to increase sales
while maintaining constant
gross margin
● Fixed costs are not increasing
at the same rate as sales,
therefore net income is
increasing.
● Net Income then drives stock
price increase
● Achieving economies of scale

Price Analysis: Allround
Allround had a purchase rate of 20% with and a very high perceived price and high perceived
effect
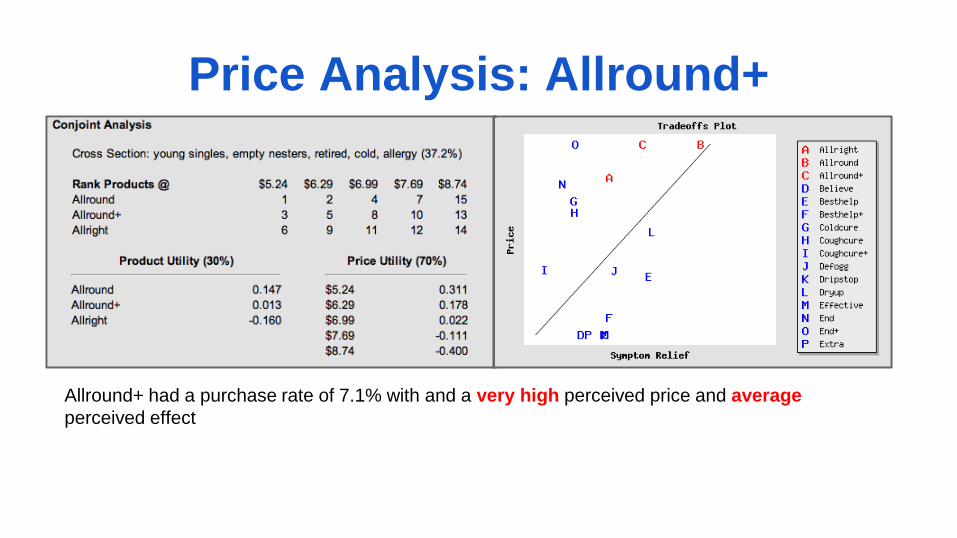
Price Analysis: Allround+
Allround+ had a purchase rate of 7.1% with and a very high perceived price and average
perceived effect

Price Analysis: Allright
Allright had a purchase rate of 36.9% with and a high perceived price and very high
perceived effect

Expenditure/Budget Allocation ● Return on marketing mostly
coincides with return on sales.
The common factor being return.
● Periods 4 and 6 we had to spend
money due to product
reformulation and then product
launch and then saw the impact to
sales in following periods.
● The last two periods we see
marketing inefficiency as return on
sales continue to increase and
return on marketing
decreases.Management could of
better fine tuned this during these
last two periods.

Expenditure/Budget Allocation
● A sharp increase in sales
force expenditures between
periods 5 and 6 corresponds
with a sharp increase in
manufacturer sales during the
same period. This is a trend
we should have pursued
further instead of decreasing
sales force as we did
between periods 6 and 7.
● Missed opportunity

Expenditure/Budget Allocation
● Our promotions did not
show the same steady
increase as our share
of retail sales and shelf
space.
● A pull back in
promotions between
periods 7 and 8 caused
share of retail sales to
lose some momentum.
● Between periods 7 and
8 we should have
increased promotion
but at a smaller rate.

Expenditure/Budget Allocation
● Too drastic in
advertising
allocation
changes.
● Should have
maintained a
more steady
path of increase.

Cumulative Analysis:
Budget Expenditure, Net Income, Stock Price
● Net income rose steadily overall
along with with stock price which
was one of our goals.

Cumulative Analysis:
Shelf Space, Unit Sales, & Cumulative Budget
● Shelf space increased overall with
major jumps from periods 3 and 4, and
periods 5 and 6. This coincides with
major jumps in unit sales during those
same periods which reinforces the
importance of shelf space.
● You see the pull back in advertising in
period 4 and pull back in promotion in
period 7.

Performance
Share of Promotion Expenditures: Amount spent on
promotion by a company.
Outcome: The sharp rise from periods 3 to 4 and then from
periods 5 to 6 coincides with the reformulation of Allround
and the creation of Allround+ plus in period 3 and then the
launch of Allright in period 5.
Shelf Space Allocation: The amount of space allocated to a
product for display on retail store shelves. Shelf space
often depends on the sales and profit potential of the
product, as well as special arrangements between the store
and manufacturer. Promotional Allowance is another large
factor in this decision by retailers.
Outcome: Shelf space saw a sharp increase as the
promotional spending went up with the introduction of the
new formula with Allround+ and then the launch of Allright.
Share of Retail Sales: % of retail sales
Outcome: Saw impact to sales in periods following the
launching of Allround+ and Allright.

Performance / Cum. Results• Periods 0-1: The Weighted Score rose as Stock Price
and Return on Marketing increased as a result of
Promotion and Advertising increases.
• Periods 1-3: Stock Price continued to rise, however
Return on Marketing slightly decreased as Promotion and
Advertising continued to rise. This caused our Weighted
Score to drop slightly.
• Periods 3-6: Return on Marketing dropped from periods
3-4 (then recovered due to lag effect from period 4-5) and
then periods 5-6 due to the launch of new products,
however because Stock Price continued to rise driven by
quickly increasing Net Income, Weighted Score remained
fairly steady.
• Periods 6-8: Due to the lag effect of launching a new
product in period 5, Return on Marketing increased. Stock
Price increased at a slowing rate as did Net Income, as a
result of slowing increases in Promotion and this drove
our high Weighted Score down slightly.
• Periods 8-10: Stock Price increased which was driven by
increasing Net Income. Return on Marketing dropped,
while Promotions and Advertising continued to rise. This
leads to a decrease in Marketing Efficiency, and this
caused our Weighted Score to drop to its lowest point.

What should we have done differently…● Towards the end of the situation we should have increased discounts to wholesalers and those buying in bulk.
● We should have worried about increasing our price more with our competitors and according to the trade off
survey and not put so much emphasis on inflation rate in the market update.
● Try to increase demand for new products by increasing primary message in advertising.
● Keep capacity under control to keep down cost of goods sold.
● Use the What if… feature
● Use monetary resources to full potential and not worry as much on being cautious on staying in the same
spending range as competitors. As market leaders we could of invested more heavily than competitors.
● When we are growing we should not of pulled back so much in advertising and promotion.
● Better product placement for non-cannibalization
Advice to incoming management…● Do not spend your entire budget if it is not necessary, but use enough to
● As price starts to rise make sure you are giving appropriate discounts to wholesalers and those buying in bulk.
● Making pricing decisions based on inflation as well as customer feedback and satisfaction information.
● As market leaders allocate your budget accordingly and follow your own strategy rather than getting too caught
up on your competitors. Do not try to stay just one step ahead.
● Use all available tools
● Use allround as a cash cow and use this money to promote other products