strategic & investment plan to strengthen meat industry in rwanda final...
TRANSCRIPT

REPUBLIC OF RWANDA
Ministry of Agriculture and Animal Resources
(MINAGRI)
STRATEGIC &
INVESTMENT PLAN TO STRENGTHEN MEAT INDUSTRY IN RWANDA
FINAL REPORT
JULY, 2012
CONTENTS
LIST OF ILLUSTRATIONS ___________________________________________________________ i
List of Tables _________________________________________________________________________ i
List of graphs _________________________________________________________________________ i
List of pictures ________________________________________________________________________ i
ACRONYMS __________________________________________________________________________ ii
EXECUTIVE SUMMARY ___________________________________________________________ iii
INTRODUCTION __________________________________________________________________ 1
1 CONTEXT AND OBJECTIVES OF THE STUDY _________________________________________ 2
1.1 Physical context ________________________________________________________________ 2
1.2 Macroeconomic context __________________________________________________________ 2
1.3 Objectives of the study ___________________________________________________________ 3
1.4 Comprehension of the terms of references ___________________________________________ 3
2 METHODOLOGICAL APPROACH _________________________________________________ 4
3 GLOBAL TRENDS OF MEAT INDUSTRY ____________________________________________ 5
3.1 World meat production __________________________________________________________ 5
3.2 World meat market _____________________________________________________________ 6 3.2.1 The international trade __________________________________________________________________ 6 3.2.2 Meat prices ___________________________________________________________________________ 7 3.2.3 Meat consumption _____________________________________________________________________ 8
3.3 Production prospects in the medium term ___________________________________________ 8
3.4 Current situation of livestock populations in Africa ___________________________________ 10 3.4.1 Livestock populations and distribution ____________________________________________________ 10 3.4.2 Livestock by-products: hides and skins ____________________________________________________ 12
4 DIAGNOSIS OF MEAT INDUSTRY IN RWANDA _____________________________________ 15
4.1 Current situation _______________________________________________________________ 15 4.1.1 Livestock populations __________________________________________________________________ 15 4.1.2 Livestock population’s growth trends _____________________________________________________ 15 4.1.3 Comparison of Rwandan livestock populations with bordering countries _________________________ 16 4.1.4 Value chain of the meat industry _________________________________________________________ 17 4.1.5 Meat consumption in Rwanda ___________________________________________________________ 20
4.2 Strategic diagnosis: the SWOT of the meat industry___________________________________ 21 4.2.1 Strengths of the meat industry___________________________________________________________ 21 4.2.2 Weaknesses and constraints of the meat industry ___________________________________________ 22 4.2.3 Opportunities and threats of the meat industry _____________________________________________ 28
5 CHALLENGES AND STRATEGIC OPTIONS FOR MEAT INDUSTRY ________________________ 29
5.1 Vision by 2017 _________________________________________________________________ 29 5.1.1 An industry pushing domestic consumption of quality meat ___________________________________ 29 5.1.2 A diversified meat industry ______________________________________________________________ 29

5.1.3 An industry taking advantage of business opportunities on value markets in East and Central Africa. __ 30
5.2 Strategic options _______________________________________________________________ 30
6 OPERATIONAL AND INVESTMENT PLAN __________________________________________ 32
6.1 Overall approach ______________________________________________________________ 32
6.2 Transversal actions _____________________________________________________________ 33 6.2.1 Management of the Approach & Harmonization of the Action Plans ____________________________ 33 6.2.2 Guarantee fund & Fund for financial support _______________________________________________ 33
6.3 Strategic axis 1: Increasing meat supply ____________________________________________ 34 6.3.1 Component 1: Animal health ____________________________________________________________ 34 6.3.2 Component 2: Increasing meat production _________________________________________________ 38
6.4 Strategic axis 2: Modernization and development of the industry infrastructure ___________ 43 6.4.1 Component 1: Modernization of the supply chain ___________________________________________ 43 6.4.2 Component 2: Development of cutting and processing industry ________________________________ 46
6.5 Strategic axis n°3: Improving access to domestic and foreign markets ____________________ 49 6.5.1 Component 1: Control of sanitary quality __________________________________________________ 49 6.5.2 Component 2: Modernization of distribution channels _______________________________________ 51 6.5.3 Component 3: Promotion of the products __________________________________________________ 54
7 LOGICAL FRAMEWORK _______________________________________________________ 60
8 INVESTMENT IN LIVESTOCK; A WISE CHOICE FOR AFRICAN COUNTRIES ________________ 67
8.1 Relationships between Livestock development and economic growth ____________________ 67
8.2 Findings and policy implications __________________________________________________ 69
8.3 Appendix _____________________________________________________________________ 70
9 BIBLIOGRAPHY ______________________________________________________________ 71
ANNEX ________________________________________________________________________ 74

Page i / 82
LIST OF ILLUSTRATIONS
List of Tables
Table 1 : Trends of livestock populations ........................................................................................................................... 30 Table 2 : Trends of meat production (in tons) .................................................................................................................... 30 Table 3 : Budget of investment plan for meat industry strategy in Rwanda ..................................................................... 32 Table 4 : Contribution of key actors ................................................................................................................................... 32 Table 5: Operational and Investment plan for Animal Health ........................................................................................... 37 Table 6: Example of a simple financial record and calculation of profit (in Ethiopia) ....................................................... 39 Table 7: Operational and Investment plan for Increasing Meat production...................................................................... 41 Table 8: Operational and Investment plan for Modernization of the supply chain ........................................................... 45 Table 9: Operational and Investment plan for Development of cutting and processing industry ..................................... 48 Table 10: Operational and Investment plan for Control of sanitary quality ...................................................................... 50 Table 11: Operational and Investment plan for Modernization of distribution channels .................................................. 53 Table 12: Operational and Investment plan for Promotion of the products ...................................................................... 55 Table 13: Operational and Investment plan- Short term ................................................................................................... 56 Table 14: Operational and Investment plan- Medium term .............................................................................................. 57 Table 15: Operational and Investment plan- Long term .................................................................................................... 58 Table 16: The logical framework ........................................................................................................................................ 60 Table 17: Countries exhibiting causality between growth of livestock productivity (VA) and growth in per capita GDP .. 68 Table 18: Meetings with stakeholders ............................................................................................................................... 74 Table 19 : Work schedule ...................................................................................................... Error! Bookmark not defined.
List of graphs
Graph 1 : World meat production, Source: FAO, 2010 _____________________________________________________ 5 Graph 2 : Meat imports in Africa, Source: FAO, 2011 _____________________________________________________ 6 Graph 3 : Meat exports from Africa, Source: FAO, 2011 ___________________________________________________ 7 Graph 4: FAO international meat price indices (2002-2004=100), Source: FAO, 2011 ____________________________ 7 Graph 5 : International meat prices, Source: FAO, 2010 ___________________________________________________ 8 Graph 6 : Meat production forecasts by 2020, Source: FAO, 2010 ___________________________________________ 9 Graph 7 : Net meat trade in developing countries (000 tonnes), Source: FAO, 2010 _____________________________ 9 Graph 8 : Net meat trade in industrial countries (000 tonnes), Source: FAO, 2010 ______________________________ 9 Graph 9 : Total meat production by developing regions, Source: FAO, 2010 __________________________________ 10 Graph. 10 : Cattle populations of Africa, Source: FAO, 2011 _______________________________________________ 11 Graph. 11 : Distribution of livestock in Africa, Source: FAO, 2011 ___________________________________________ 12 Graph. 12 : Production of cattle hides, Source: Nation Master 2010 ________________________________________ 12 Graph 13: Production of cattle hides by regions, Source: Nation Master 2010 ________________________________ 13 Graph 14: Worldwide production of sheep skins, Source: Nation Master 2010 ________________________________ 14 Graph 15: livestock populations in Rwanda, Source: MINAGRI, 2011 ________________________________________ 16 Graph. 16 : Goats and pigs populations in Rwanda and bordering countries, Source: FAO, 2011 __________________ 16 Graph. 17 : Sheep and poultry populations in Rwanda and bordering countries, Source: FAO, 2011 _______________ 17 Graph. 18 : Trends of per capita meat consumption in Africa, Source: FAO, 2010 ______________________________ 20 Graph. 19 : trends of per capita meat consumption in Rwanda, Source: National Institute of Statistics of Rwanda, Statistical yearbook 2011 edition ____________________________________________________________________ 20 Graph. 20 : livestock populations in Rwanda: trends 2005-2010, Source: MINAGRI, 2011 _______________________ 22 Graph 21 : Average parameters compared to industry benchmark, Source: Bister, 2010; Singh, 2006, Seck, 1992 ____ 23 Graph 22 : Local breed performance compared to industry benchmark, Source: Bister, 2010; Singh, 2006, Seck, 1992 23 Graph 23 : some weaknesses in the poultry meat industry, Source: Dr Papa Ndary NIANG, 2012 _________________ 27 Graph 24: Model of modern distribution channel _______________________________________________________ 51
List of pictures
Picture 1 : Some weaknesses in the meat industry, Source: Dr Papa Ndary NIANG, 2012 ________________________ 26
Page ii / 82
ACRONYMS
APEL Programme d’Appui au Petit Elevage
ARMV Association Rwandaise des Médecins Vétérinaires
DRC Democratic Republic of Congo
EAC East African Community
EDPRS Economic Development and Poverty Reduction Strategy
FAO Food and Agriculture Organization of the United Nations
HACCP Hazard Analysis Control of Critical Points
IMF International Monetary Fund
ISAE Higher Institute of Agriculture and Animal Husbandry
ISAR Institut des Sciences Agronomiques du Rwanda
MDG Millennium Development Goal
MINAGRI Ministry of Agriculture and Animal Resources
MINECOFIN Ministry of Finance and Economic Planning
NAEB National Agricultural Export Development Board
NGO Non-Governmental Organisation
PSTA Plan Stratégique pour la Transformation de l’Agriculture/Strategic Plan for the Transformation of Agriculture
PPP Public-Private Partnership
RAB Rwanda Agriculture Board
RBS Rwanda Bureau of Standards
RDB Rwanda Development Board
RTV Rwanda Television
RWF Rwandan Francs
SME Small and Medium Enterprises
SWOT Strengths, Weaknesses, Opportunities and Threats
UN United Nations
Page iii / 82
EXECUTIVE SUMMARY
Livestock currently contributes between 25 and 30% of the Agricultural GDP of developing
countries and that is expected to rise to close to 50% over the next 20 years. 70% of the world’s
rural poor depend on livestock (mainly sheep, goats, pigs and poultry) as an important component
of their livelihoods.
Livestock make a disproportionally higher contribution to income and welfare of the poorest
smallholders, and particularly of women, and through them, children in such households.
While meat consumption per capita in developed countries is around 80 kg per year, it hardly
exceeds 32 Kg in Africa.
This deficit in animal protein consumption is still high in Rwanda where meat consumption exceeds
more than 7.5 kilograms per year for all species. Nevertheless Rwanda is an African country with
climatic advantages which make an ideal framework for agriculture, the major sector of its
economy.
Despite government efforts, the livestock sector is still at a primary stage and supply of meat in
quantity and quality remains a crucial problem.
Two main objectives are attempted through this study:
• Developing a plan to improve the quality and availability of meat and meat products in
Rwanda
• Developing a sovereign meat market in Rwanda and profitable outside Rwanda
The main observations revealed through this strategic diagnosis are:
• The institutional framework is favorable to the development of animal husbandry in Rwanda
• The main limits are:
- the poor animal nutrition,
- the low control of disease situation,
- the small size of the national herd,
- the lack of slaughter facilities to meet food quality standards,
- the lack of value-adding step (cutting and processing),
- the low control of the quality Hygiene of meat marketed.
The development of the meat industry should allow the public authorities to meet five major
challenges:
- Insuring meat security in Rwanda,
- Becoming a major asset in malnutrition and poverty fighting,
- Promoting the development of true and responsible meat industry processing,
- Developing Rwandan competitiveness in Livestock in Eastern Africa,
- Developing foreign exchange.
Page iv / 82
The vision for Rwandan meat industry for 2017 is:
«An industry pushing domestic consumption of quality meat, diversified, and taking
advantage of business opportunities on value markets in East and Central Africa».
Three strategic priorities will achieve the vision which will increase the meat industry from the
primary step to a real industry serving the social and economic development of Rwanda:
• Increasing of meat supply,
• Modernization and development of the industry infrastructure,
• Improvement of the access to domestic and foreign markets.
The operational plan over the period 2012 -2017 is based on seven components:
• Animal Health,
• Increasing meat production,
• Modernization of the supply chain,
• Development of cutting and processing industry,
• Control of sanitary quality,
• Modernization of the distribution channels,
• Promotion of meat and meat products.
A Monitoring Team will agree a framework for reporting and measuring progress, including the
measurement of the following with regard to the Rwandan meat industry.
The overall budget to lift the meat industry of Rwanda to the rank of a performing meat
industry, from 7.5 kg per capita to 15. 07 kg in 2017 should be around 8 539 000 000 RWF
(16 644 251 US $).
Page 1 / 82
INTRODUCTION
Livestock currently contributes between 25 and 30% of the Agricultural GDP of developing
countries and that is expected to rise to close to 50% over the next 20 years.
While the livestock industry is growing seven times faster than smallholder livestock systems in
emerging economies like Brazil and China, African livestock is still largely in the hand of
smallholders.
70% of the world’s rural poor depend on livestock (mainly sheep, goats, pigs and poultry) as an
important component of their livelihoods. Livestock make a disproportionally higher contribution to
income and welfare of the poorest smallholders, and particularly of women, and through them,
children in such households.
While meat consumption per capita in developed countries is around 80 kg per year, it hardly
exceeds 32 Kg in Africa.
The advent of a meat industry would be an initial response to the fight against malnutrition and
poverty in Africa. Finally, it would be one more step towards the food sovereignty of African
countries.
Page 2 / 82
1 CONTEXT AND OBJECTIVES OF THE STUDY
The implementation under the aegis of the UN and the IMF of Poverty reduction strategies (PRS) in
1999 intended to provide essential links between the actions of national authorities, the assistance
of donors and the results required to achieve the Millennium Development Goals (MDGs) of the
United Nations to halve poverty between 1990 and 2015. Rwanda, as many other African
countries, included livestock development as key pillars of its PRS.
Any policy or strategy for Livestock development strategy should be inserted within the framework
defined by the major orientations of the Rwandan Government: Vision 2020 and PSTA II.
1.1 Physical context
Rwanda is a landlocked country of 26 338 km2. The population growth of Rwanda is estimated
at 2.9% per year. The population of Rwanda is 8,162,715 inhabitants and it would increase to 15
million in 2020 and 20 million in 2030. Rwanda is characterized by the highest population density in
Africa, about 310 inhabitants per km2. Some areas reached a density greater
than 1000 inhabitants/ km2. The total cultivated land covering about 46% of the area of the
country divided into small farms. Marshes occupy an estimated area of 165 000 ha including 112
000 ha of small wetlands (less than 200 ha) and 53 000 ha of large marshes.
The total harvest area is approximately 94 000 ha or 57% of the area of the marshes of Country
and represents about 8% of the acreage.
The climate is tropical and temperate with an average temperature of 19 ° C and rainfall
annually ranges between 900 and 1600 mm. The country has a small rainy season from
September to November and a rainy season from February to May. The short dry season is
between December and January and the long dry season from June to mid-September. Some
parts of countries may suffer from prolonged drought affecting agricultural production
and weakening the food security of populations that inhabit them.
1.2 Macroeconomic context
Despite this climatic advantage, Rwanda is one of the poorest countries in the world.
• The annual per capita income is 540 U.S. dollars.
• Over 60% of the population lived below the poverty line.
• Agriculture is a major source of foreign currency and livelihoods of people
• Still in its infancy, the secondary sector consists essentially in manufacturing and building
and contributes 15% of GDP.
• The area tertiary sector is 47 % of GDP.
• GDP is approximately 3 277 RWF billions.
Today, Rwanda is at a crossroads in its evolution. The country has an overall planning
framework to face the challenges of national Development and poverty reduction towards the year
2020. The vision 2020 which the government of Rwanda has undertaken identified key pillars:
• Good governance and a capable state;
Page 3 / 82
• Infrastructure development;
• Human Resource Development and a knowledge-based economy;
• Private sector-led development;
• Regional and International integration;
• Productive high value and market oriented agriculture.
1.3 Objectives of the study
There are two kinds of objectives:
• The major objective are :
- Developing a plan to improve the quality and availability of meat and meat products
in Rwanda;
- Developing a sovereign meat market in Rwanda and profitable outside Rwanda.
• The specific objectives are:
- Improvement and availability of the meat producing animal species and types in all
agro-ecological zones;
- Exploring the needed infrastructure including the scientific methods for intensifying
the proposed programmes aiming to increase the availability of meat and adapting
them to suit Rwandan market’ needs;
- Promote adaptive research and extension recommendations in improved meat
industry production systems for all categories of livestock, and the use of feeds/meat
dedicated breeds/appropriate methods as ingredients’ for improving the sub sector;
- Propose the animal types and species in the short term for improving and increasing
the availability in quality and quantity of meat in Rwanda.
1.4 Comprehension of the terms of references
Three axes determine the comprehension of the terms of references.
• Assessment of the meat sector maturity and its potentialities;
• Design conditions of meat industry emergence;
• Elaborate a strategic and investment plan to enforce domestic meat consumption and
increase added value meat products export.
Page 4 / 82
2 METHODOLOGICAL APPROACH
The proposed approach includes 3 steps:
• Strategic diagnosis: This step includes literature and field surveys (data collection phase of
the sector at the national level with all stakeholders). Following the scanning of the sector,
the strategic diagnosis will establish the SWOT of the meat industry in Rwanda.
• Elaboration of the seven-year recovery plan: The development of the seven-year recovery
plan to revive the meat industry sector for the period 2012-2017 will start by defining the
strategic vision. This is the consolidation of the action plans for areas as presented in the
sections following the identification of areas. It will decline the axes according to these
themes:
- Activities and tasks to be undertaken;
- Expected results;
- Monitoring and Evaluation Indicators;
- Resources Required;
- Institution and / or lead agency to implement;
- Actors involved direct and indirect;
- Timeframe.
• Workshop and validation of the report. This step includes:
- Writing and submission of the interim report;
- Organizing a workshop about the interim report to collect relevant amendments and
improve the document;
- Providing the final report.
Page 5 / 82
3 GLOBAL TRENDS OF MEAT INDUSTRY
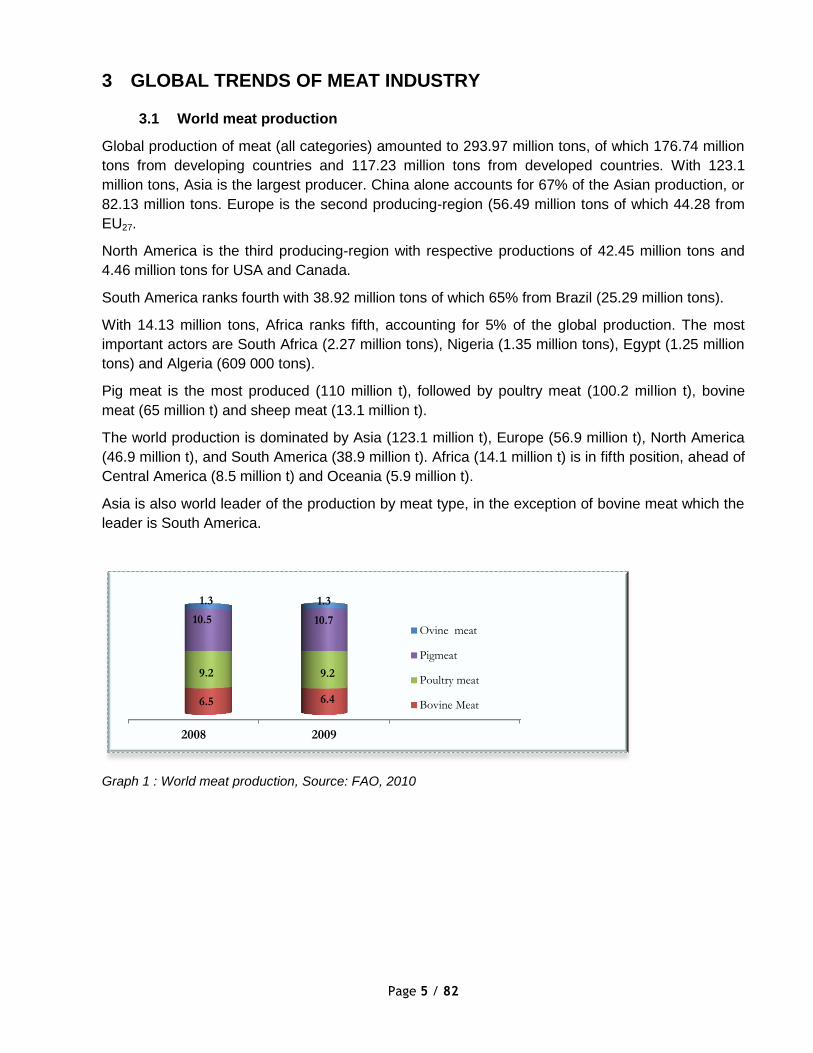
3.1 World meat production
Global production of meat (all categories) amounted to 293.97 million tons, of which 176.74 million
tons from developing countries and 117.23 million tons from developed countries. With 123.1
million tons, Asia is the largest producer. China alone accounts for 67% of the Asian production, or
82.13 million tons. Europe is the second producing-region (56.49 million tons of which 44.28 from
EU27.
North America is the third producing-region with respective productions of 42.45 million tons and
4.46 million tons for USA and Canada.
South America ranks fourth with 38.92 million tons of which 65% from Brazil (25.29 million tons).
With 14.13 million tons, Africa ranks fifth, accounting for 5% of the global production. The most
important actors are South Africa (2.27 million tons), Nigeria (1.35 million tons), Egypt (1.25 million
tons) and Algeria (609 000 tons).
Pig meat is the most produced (110 million t), followed by poultry meat (100.2 million t), bovine
meat (65 million t) and sheep meat (13.1 million t).
The world production is dominated by Asia (123.1 million t), Europe (56.9 million t), North America
(46.9 million t), and South America (38.9 million t). Africa (14.1 million t) is in fifth position, ahead of
Central America (8.5 million t) and Oceania (5.9 million t).
Asia is also world leader of the production by meat type, in the exception of bovine meat which the
leader is South America.
Graph 1 : World meat production, Source: FAO, 2010
2008 2009
6.5 6.4
9.2 9.2
10.5 10.7
1.3 1.3
Ovine meat
Pigmeat
Poultry meat
Bovine Meat

Page 6 / 82
3.2 World meat market
3.2.1 The international trade
3.2.1.1 Meat Importations
World meat imports were estimated at 25.813 million tons in 2011. Half of the imports were from
Asia. The world’s largest importers are China (3.3 million tons), Japan (2.99 million tons), Russia
(2.09), EU 1.67 million tons) and USA (1.56 million tons).
The most imported meats are respectively poultry (11.288 million tons), beef (7.214 million tons)
and swine (6.213 million tons).
The imports from Africa are estimated to 2.1 million t whereas the main African meat importers are
Angola (364 000 t), Egypt (363 000 t) and South Africa (330 000 t).
Graph 2 : Meat imports in Africa, Source: FAO, 2011
3.2.1.2 Meat Exports
The exports leaders of total meat are United States (6.8 million t), Brazil (6.2 million t) and the
European Union (3.4 million t). Concerning the meat categories, the greatest exporters are:
• Bovine meat: Brazil (1 511 000 t), Australia (1 249 000 t), USA (1 162 000 t) and India
(795 000 t). Within 5 years, Brazil exports are expected to reach 4 000 000 tons, widening
the gap with the USA, but also with Australia, Argentina and Canada whose beef exports
are expected to stagnate in the same period.
• Ovine meat: New Zealand (350 000 t), Australia (285 000 t) and India (65 000 t).
• Pork : USA (1 562 000 t), Canada (1 067 000 t), EU27 (1 750 000 t) and Brazil (636000t).
• Poultry : Brazil (4 098 000 t), USA (3 661 000 t), China (1 143 000 t) and EU27 (986 000 t).
The exports from Africa are estimated to 168 000 t, which one third from South Africa (50 000 t).
Other important players are Egypt and Sudan, exporting sheep meat towards the Middle –East.
27%
2%
10% 61%
Bovine
Ovine
Pork
Poultry

Page 7 / 82
Graph 3 : Meat exports from Africa, Source: FAO, 2011
3.2.2 Meat prices
The general context is market by the growing trends of meat over the years, in the exception of the
end of 2008 and during 2009, as a consequence of the global economic crisis.
Graph 4: FAO international meat price indices (2002-2004=100), Source: FAO, 2011
Since the beginning of 2011, tight meat supplies push up prices to new record levels. In May 2011,
the FAO meat price index hit a new high of 183 points. International prices of all meats have firmed
since January, with particularly large gains recorded by pig meat. The price strength mainly reflects
supply-driven factors, including adverse weather conditions in late 2010, herd rebuilding, animal
diseases and rising input costs, which have virtually stalled global output growth.
Limited export availability in traditional supply countries combined with buoyant import demand are
expected to maintain the upward trend of world meat prices in the short term. Meanwhile, high
grain prices continue to constrain sector profitability.
Beef meat and pig meat are the most expensive on the international market.
54%
14%
6%
26% Bovine meat
Ovine meat
Pork
Poultry

Page 8 / 82
Graph 5 : International meat prices, Source: FAO, 2010
3.2.3 Meat consumption
Meat consumption worldwide has increased rapidly in recent years, with the demand for livestock
products expected to double in sub-Saharan Africa and South Asia. However the increase comes
with harmful effects on the environment, public health and economy.
Meat production across the world has tripled over the last four decades and increased 20 per cent
in just the last 10 years. Pork is the most widely consumed meat in the world, followed by poultry,
beef, and mutton. The poultry production is the fastest growing meat sector. Industrial countries are
consuming growing amounts of meat, nearly double the quantity than in developing countries.
World per capita meat consumption is 42 kg. This average however conceals disparities between
the averages of developed countries and developing counties, 78 kg and 32 kg respectively.
3.3 Production prospects in the medium term
Pork is the most currently produced meat worldwide (38% of total production). However due to
environmental damage increasingly linked to large pig farming and the relative decline of
production expected in Europe and North America, this trend will be reversed in favor of poultry
meat which will account for 40% of total production by 2020.
1381 1256 1449
1989 1879
3493 3576 3734
4338
3780
3041 2830 2884 3407 3367
2005 2006 2007 2008 2009
Poultrymeat
BovineMeat
Pigmeat

Page 9 / 82
Graph 6 : Meat production forecasts by 2020, Source: FAO, 2010
Meat consumption in developing countries remains heavily depending on imports and should be
accelerated in 2030.
Graph 7 : Net meat trade in developing countries (000 tonnes), Source: FAO, 2010
During the same period, industrial countries will strengthen their food security and will
further establish their dominance on the meat world market.
Graph 8 : Net meat trade in industrial countries (000 tonnes), Source: FAO, 2010
Global productions of meat will double its 2008 level to reach about 500 million tons in 2050, while
the forecasts for 2020 are 350 million tons. Another major change is accentuating the gap between
the relative contributions of developed and developing countries in global production of meat.
Currently 40% of global production of meat comes from industrialized countries (Europe, North
America, Australia and New Zealand) and 60% of developing countries (DCs). These proportions
should be 70: 30 and in 2020 and 80: 20 in 2050.
24%
5%
40%
31% Bovine
Ovine
Poultry
Pork
859706
13-114 -310 -650-33
-200
-430
-693 -2340 -3250
-100%
-80%
-60%
-40%
-20%
0%
20%
40%
60%
80%
100%
Net meat trade in developing countries (000 tonnes)
poultry meat
pig meat
ovine and caprine
bovine
-100%
-50%
0%
50%
100%
Net meat trade in industrial countries (000 tonnes)
poultry meat
pig meat
ovine and caprine
bovine

Page 10 / 82
The increasing of meat production in developing countries will be driven mainly by China and
Brazil. In Africa, production of meat will remain shy from 2015 to 2030.
Graph 9 : Total meat production by developing regions, Source: FAO, 2010
Sub-Saharan Africa will triple its production to reach 30 million tons by 2050, but its relative
production in the overall meat production will still remain marginal compared to Asia and Latin
America.
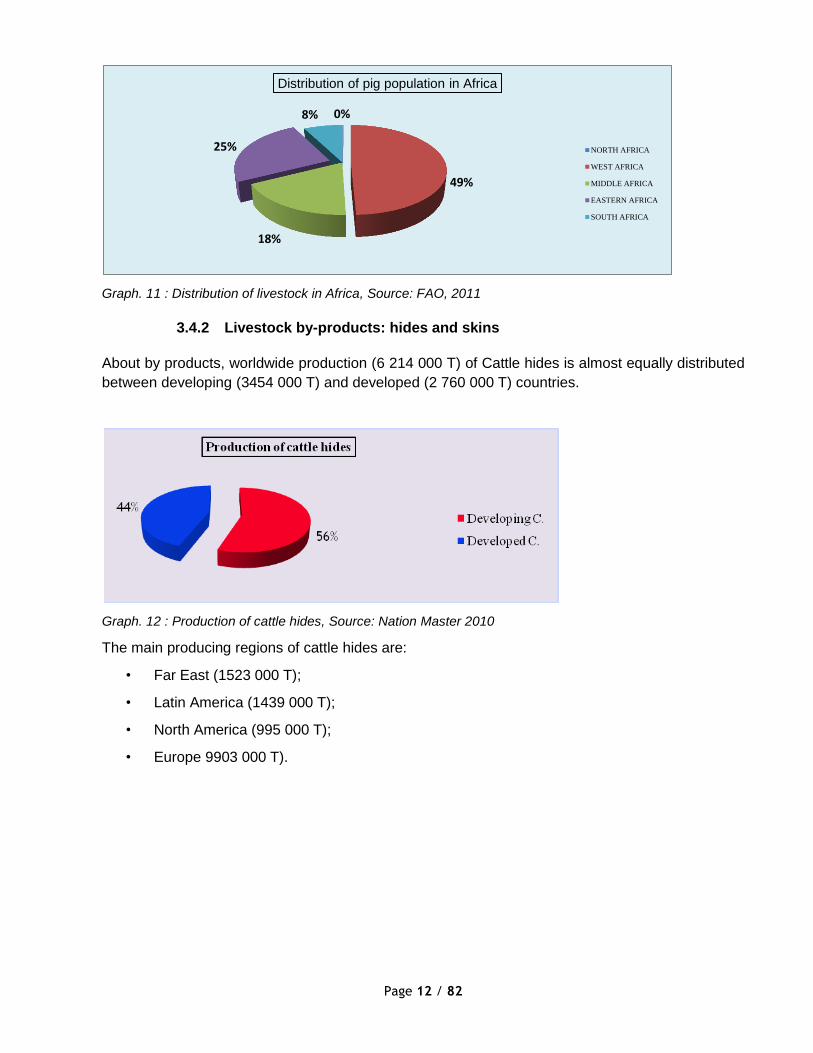
3.4 Current situation of livestock populations in Africa
3.4.1 Livestock populations and distribution
The total population of cattle in Africa is about 240 millions heads. The East African region is the
first African supplier, accounting for 40% of the global population (104 millions heads). The cattle
populations of the other regions are:
• North Africa (47 993 000 heads);
• West Africa (47 524 000);
• South Africa (21 117 800);
• Central Africa (21 025 000).
66% of cattle population of the East African region are from 3 countries: Ethiopia (38 500 000
heads), Tanzania (17 800 000), Kenya (12 000 000).
-80%
-60%
-40%
-20%
0%
20%
40%
60%
80%
100%
1964/66 1974/76 1984/86 1997/99 2015 2030
Total meat production by developing region
East Asia
South Asia
Latin American and the Caribbean
Near East/North Africa
Subsaharan Africa

Page 11 / 82
Graph. 10 : Cattle populations of Africa, Source: FAO, 2011
The East African region is also relatively well endowed with pigs (5 806 420 heads) and goats
(66 724 000), ranking second for both in Africa, whereas the rank for sheep population (49 702
300) is third. The major weakness of the East African region is about poultry population (27 066
700), as evidenced by its last place in the African ranking.
20%
19%
9%
43%
9%
North Africa
West Africa
Middle Africa
East Africa
South Africa
46%
33%
7% 2%
12%
Distribution of poultry populations in Africa
NORTH AFRICA
WEST AFRICA
MIDDLE AFRICA
EASTERN AFRICA
SOUTH AFRICA
40%
26%
3%
20%
11%
Distribution of sheep population in Africa
NORTH AFRICA
WEST AFRICA
MIDDLE AFRICA
EASTERN AFRICA
SOUTH AFRICA
25%
33% 8%
29%
5%
Distribution of goat populations in Africa
NORTH AFRICA
WEST AFRICA
MIDDLE AFRICA
EASTERN AFRICA
SOUTH AFRICA
Page 12 / 82
Graph. 11 : Distribution of livestock in Africa, Source: FAO, 2011
3.4.2 Livestock by-products: hides and skins
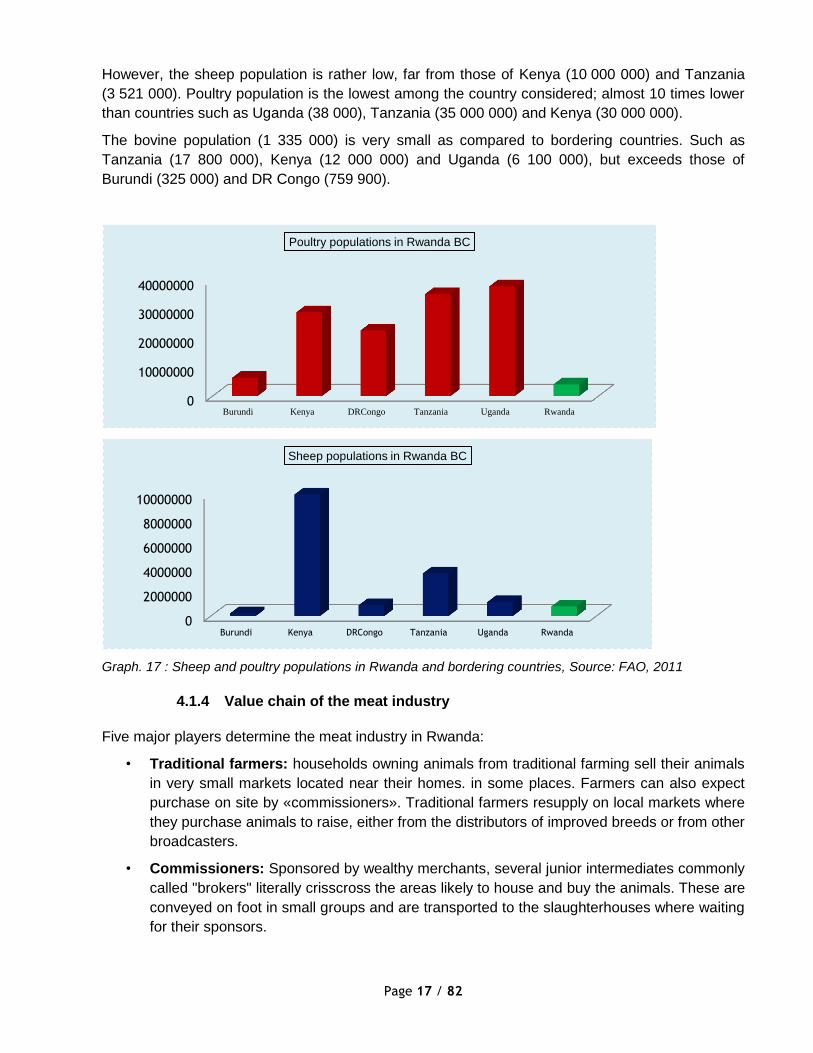
About by products, worldwide production (6 214 000 T) of Cattle hides is almost equally distributed
between developing (3454 000 T) and developed (2 760 000 T) countries.
Graph. 12 : Production of cattle hides, Source: Nation Master 2010
The main producing regions of cattle hides are:
• Far East (1523 000 T);
• Latin America (1439 000 T);
• North America (995 000 T);
• Europe 9903 000 T).
0%
49%
18%
25%
8%
Distribution of pig population in Africa
NORTH AFRICA
WEST AFRICA
MIDDLE AFRICA
EASTERN AFRICA
SOUTH AFRICA

Page 13 / 82
Graph 13: Production of cattle hides by regions, Source: Nation Master 2010
The production per country is led by:
• China (792 000 T);
• USA (750 000 T);
• Brazil (664 000 T);
• India (492 000 T).
The major producers in Africa are South Africa, Tanzania and Sudan.
Worldwide exports of cattle hides (3655 million $) are largely dominated by the developed countries
which share 96% of the global market.
The production by regions is as follows:
• North America (1742.6 millions);
• European Union (1190 millions);
• Oceania (250.3 millions);
• ex USSR (207.9 millions);
• Asia (159.1 millions);
• Africa (61.8 millions);
• Latin America (43.3 millions).
The major African leaders on the export market are:
• South Africa (23.8 millions);
• Ethiopia (11 millions);
• Somalia (6.5 millions);
• Tanzania (5.6 millions).
Production of sheep skins (410 000 T) is equally distributed between developed (177600 T) and
developing countries (232600 T). The situation is completely different regarding goat skins, since
95% of the world production (257100 T) is from developing countries.
The main producers of sheep skins are:
42%
20%
15%
11%
9% 3%
Asia
South America
Africa
North & Central America
Europe
Oceania

Page 14 / 82
• China (94000 T);
• EU (66700 T);
• Australia (32000 T);
• New Zealand (29100 T);
• Iran (13700 T);
• India (12000 T).
Graph 14: Worldwide production of sheep skins, Source: Nation Master 2010
The main producers of goat skins are:
• China (103600 T);
• India (48600 T);
• Pakistan (15900 T);
• Bangladesh (14200 T);
• Sudan (10900 T);
• Iran (5900 T).
Developing
countries
57%
Developped
countries
43%

Page 15 / 82
4 DIAGNOSIS OF MEAT INDUSTRY IN RWANDA
4.1 Current situation
4.1.1 Livestock populations
The recovery of the animal stock following the drastic drop of the mid 90s is a great achievement.
The current populations of animals are:
• Cattle (1 335 000 heads);
• Poultry (4 081 000);
• Goats (2 971 000);
• Rabbits (844 700);
• Pigs (706 000);
• Sheep (799 000).
4.1.2 Livestock population’s growth trends
Livestock population, which contributes 12% of the Rwandan GDP and 30% of the Agricultural
GDP (Rwanda statistical yearbook, 2011), is in an increasing trend and the growth rates within the
period 2005-2010 are:
• Cattle : 23.9%;
• Sheep : 15.8%;
• Goats : 78.5%;
• Pigs : 35.4%;
• Poultry : 93%;
• Rabbits: 97.8%.

Page 16 / 82
Graph 15: livestock populations in Rwanda, Source: MINAGRI, 2011
4.1.3 Comparison of Rwandan livestock populations with bordering countries
The absolute values of small animals populations indicate that Rwanda, as compared to bordering
countries is relatively well supplied with pigs (3rd supplier after Uganda, 1300000 and DR Congo,
959 080) and goats (although 5th supplier after Tanzania, 12550000; Kenya, 12000000; Uganda,
7700000; DR Congo, 4021000, the goat population, 2971000, confers to Rwanda an enviable
position considering the size of the country).
Graph. 16 : Goats and pigs populations in Rwanda and bordering countries, Source: FAO, 2011
1.077 1.335
0.69 0.799
1.664
2.971
0.706
2.109
4.081
0.427
0.8447
2005 2006 2007 2008 2009 2010
Cattle
Sheep
Goat
Pigs
Poultry
Rabbit
0
5000000
10000000
15000000
Burundi Kenya DRCongo Tanzania Uganda Rwanda
Goat populations in Rwanda BC
0
500000
1000000
1500000
Burundi Kenya DRCongo Tanzania Uganda Rwanda
Pig populations in Rwanda BC
Page 17 / 82
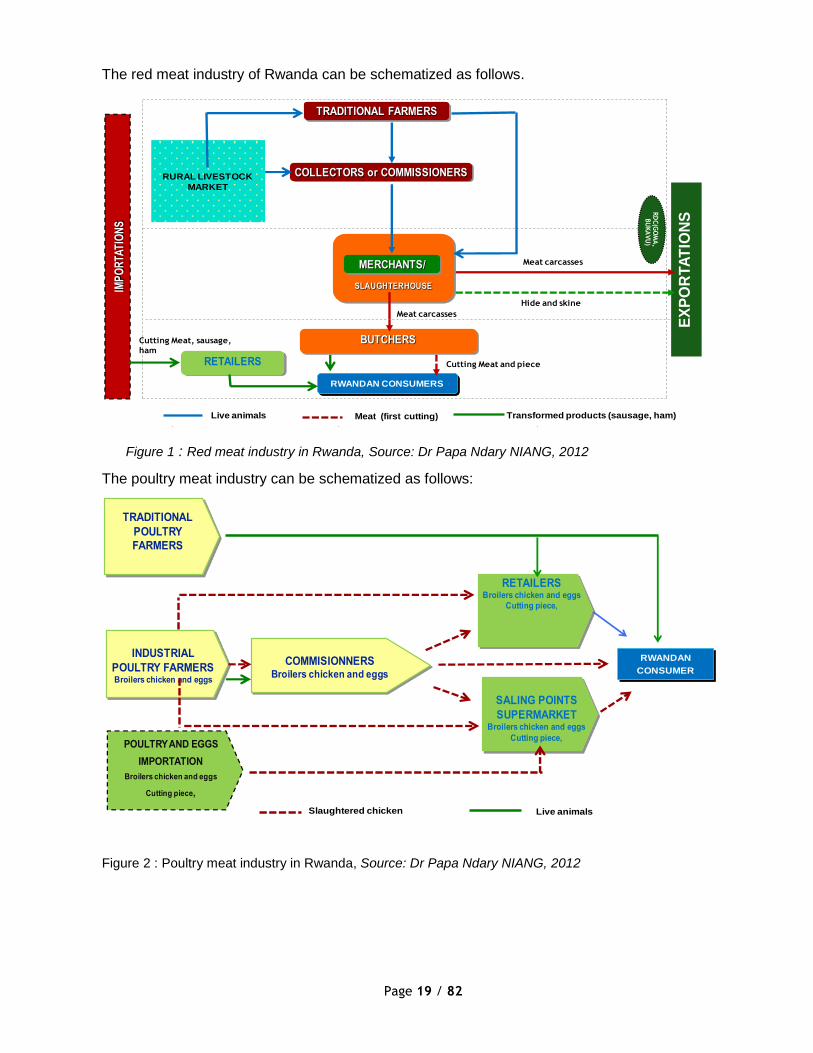
However, the sheep population is rather low, far from those of Kenya (10 000 000) and Tanzania
(3 521 000). Poultry population is the lowest among the country considered; almost 10 times lower
than countries such as Uganda (38 000), Tanzania (35 000 000) and Kenya (30 000 000).
The bovine population (1 335 000) is very small as compared to bordering countries. Such as
Tanzania (17 800 000), Kenya (12 000 000) and Uganda (6 100 000), but exceeds those of
Burundi (325 000) and DR Congo (759 900).
Graph. 17 : Sheep and poultry populations in Rwanda and bordering countries, Source: FAO, 2011
4.1.4 Value chain of the meat industry
Five major players determine the meat industry in Rwanda:
• Traditional farmers: households owning animals from traditional farming sell their animals
in very small markets located near their homes. in some places. Farmers can also expect
purchase on site by «commissioners». Traditional farmers resupply on local markets where
they purchase animals to raise, either from the distributors of improved breeds or from other
broadcasters.
• Commissioners: Sponsored by wealthy merchants, several junior intermediates commonly
called "brokers" literally crisscross the areas likely to house and buy the animals. These are
conveyed on foot in small groups and are transported to the slaughterhouses where waiting
for their sponsors.
0
10000000
20000000
30000000
40000000
Burundi Kenya DRCongo Tanzania Uganda Rwanda
Poultry populations in Rwanda BC
0
2000000
4000000
6000000
8000000
10000000
Burundi Kenya DRCongo Tanzania Uganda Rwanda
Sheep populations in Rwanda BC

Page 18 / 82
• Merchants: Intermediate leading in this marketing chain, traders gather at the scene of
slaughter animals brought by their agents. It goes without saying that the successful
organization of this system requires strong cash advances made by commission merchants
in charge of collecting animals. It should be noted that traders, last links in the chain of sale
of live animals, take the stage on the basis of an order or contract with the main buyers of
meat that are restaurateurs and butchers.
• Butcher: There are four modern butcheries localized in the city of Kigali: La Boucherie
Charcuterie de Kigali ; La Galette; La Côte à l’Os ; Alimentation Chez Venant. They are
usually the only ones with trucks vans equipped with refrigerators for the transport of
animals carcasses.
• Consumers: Final consumers are rural people and urban households who buy fresh meat
(roast or chop) or meat products in supermarkets. The pattern of consumption of fresh meat
from the roast is generally toasted, mostly in restaurants. It should be emphasized that a
considerable amount of pig, sheep meat or live animals was previously sent to the cities of
Goma and Bukavu in Eastern Democratic Republic of Congo.
Page 19 / 82
The red meat industry of Rwanda can be schematized as follows.
Figure 1 : Red meat industry in Rwanda, Source: Dr Papa Ndary NIANG, 2012
The poultry meat industry can be schematized as follows:
Figure 2 : Poultry meat industry in Rwanda, Source: Dr Papa Ndary NIANG, 2012
TRADITIONAL FARMERS
COLLECTORS or COMMISSIONERS
IMP
OR
TAT
ION
S
EX
PO
RT
AT
ION
S
BUTCHERS
Transformed products (sausage, ham)Live animals
RURAL LIVESTOCK
MARKET
RWANDAN CONSUMERS
SLAUGHTERHOUSE
MERCHANTS/
Meat (first cutting)
RD
C(G
OM
A,
BU
KA
VU
)
Hide and skine
Meat carcasses
Meat carcasses
Cutting Meat and pieceRETAILERS
Cutting Meat, sausage,
ham
INDUSTRIAL
POULTRY FARMERSBroilers chicken and eggs
COMMISIONNERSBroilers chicken and eggs
RETAILERSBroilers chicken and eggs
Cutting piece,
RWANDAN
CONSUMER
SALING POINTS
SUPERMARKETBroilers chicken and eggs
Cutting piece,
TRADITIONAL
POULTRY
FARMERS
POULTRY AND EGGS
IMPORTATION
Broilers chicken and eggs
Cutting piece,
Live animalsSlaughtered chicken

Page 20 / 82
4.1.5 Meat consumption in Rwanda
The meat per capita consumption for Rwandans is very low as compared to African average. In
reality, there is a low propensity to meat consumption by the population. The reasons could be
due to the purchasing power of the people; the eating habits e.g. food taboos related to
consumptions of mutton and rabbit meat; the access to quality meat, particularly for rural people.
Per capita consumption is in an increasing trend since 2004 but is still below 10 kg per year while
the FAO rate for African countries is 32 Kg per year and will reach 35.4 kg in 2020.
Graph. 18 : Trends of per capita meat consumption in Africa, Source: FAO, 2010
Graph. 19 : trends of per capita meat consumption in Rwanda, Source: National Institute of Statistics of
Rwanda, Statistical yearbook 2011 edition
32.8 32.8 32.9 33.1 33.3
33.6 33.8
34.2 34.5 34.8 35 35.4
2009 2010 2011 2012 2013 2014 2015 2016 2017 2018 2019 2020
Per capita consumption in Africa
5,68 5,80
5,93
7,08
6,51
7,59
5,00
5,50
6,00
6,50
7,00
7,50
8,00
2005 2006 2007 2008 2009 2010
Rwandan meat per capita consumption
Page 21 / 82
4.2 Strategic diagnosis: the SWOT of the meat industry
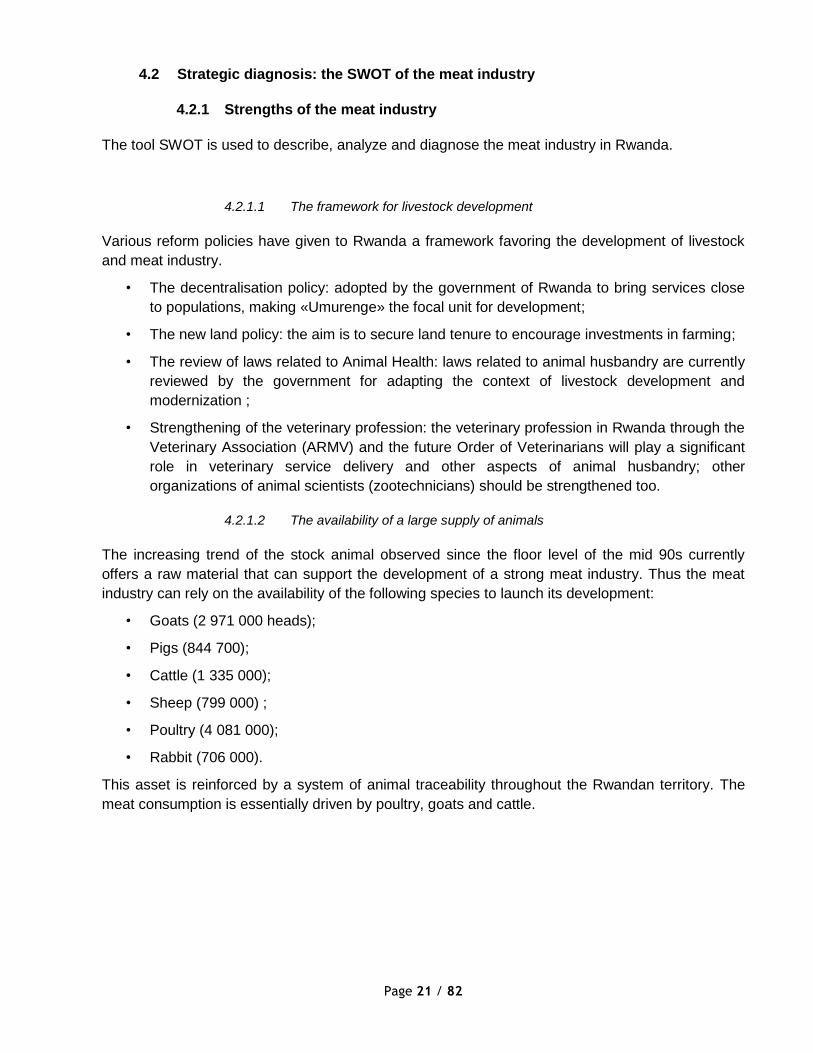
4.2.1 Strengths of the meat industry
The tool SWOT is used to describe, analyze and diagnose the meat industry in Rwanda.
4.2.1.1 The framework for livestock development
Various reform policies have given to Rwanda a framework favoring the development of livestock
and meat industry.
• The decentralisation policy: adopted by the government of Rwanda to bring services close
to populations, making «Umurenge» the focal unit for development;
• The new land policy: the aim is to secure land tenure to encourage investments in farming;
• The review of laws related to Animal Health: laws related to animal husbandry are currently
reviewed by the government for adapting the context of livestock development and
modernization ;
• Strengthening of the veterinary profession: the veterinary profession in Rwanda through the
Veterinary Association (ARMV) and the future Order of Veterinarians will play a significant
role in veterinary service delivery and other aspects of animal husbandry; other
organizations of animal scientists (zootechnicians) should be strengthened too.
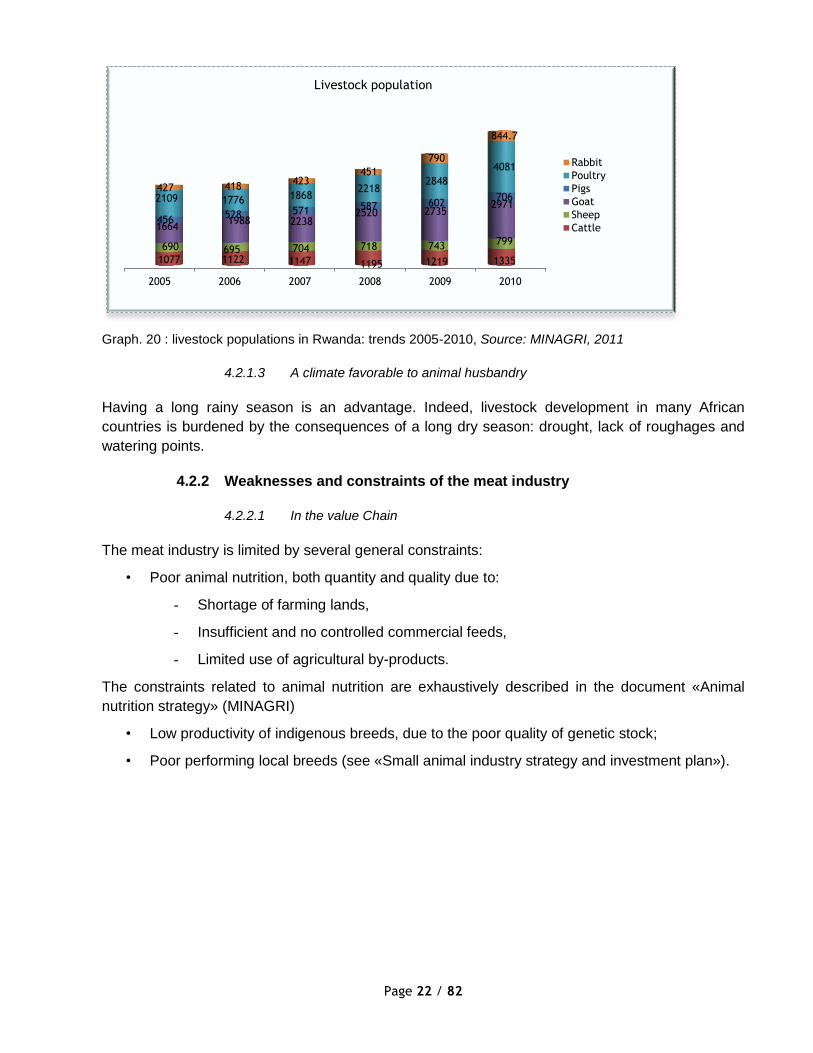
4.2.1.2 The availability of a large supply of animals
The increasing trend of the stock animal observed since the floor level of the mid 90s currently
offers a raw material that can support the development of a strong meat industry. Thus the meat
industry can rely on the availability of the following species to launch its development:
• Goats (2 971 000 heads);
• Pigs (844 700);
• Cattle (1 335 000);
• Sheep (799 000) ;
• Poultry (4 081 000);
• Rabbit (706 000).
This asset is reinforced by a system of animal traceability throughout the Rwandan territory. The
meat consumption is essentially driven by poultry, goats and cattle.
Page 22 / 82
Graph. 20 : livestock populations in Rwanda: trends 2005-2010, Source: MINAGRI, 2011
4.2.1.3 A climate favorable to animal husbandry
Having a long rainy season is an advantage. Indeed, livestock development in many African
countries is burdened by the consequences of a long dry season: drought, lack of roughages and
watering points.
4.2.2 Weaknesses and constraints of the meat industry
4.2.2.1 In the value Chain
The meat industry is limited by several general constraints:
• Poor animal nutrition, both quantity and quality due to:
- Shortage of farming lands,
- Insufficient and no controlled commercial feeds,
- Limited use of agricultural by-products.
The constraints related to animal nutrition are exhaustively described in the document «Animal
nutrition strategy» (MINAGRI)
• Low productivity of indigenous breeds, due to the poor quality of genetic stock;
• Poor performing local breeds (see «Small animal industry strategy and investment plan»).
2005 2006 2007 2008 2009 2010
1077 1122 1147 1195 1219 1335
690 695 704 718 743 799
1664 1988 2238
2520 2735 2971
456 528 571 587 602
706 2109 1776 1868 2218
2848
4081
427 418 423
451
790
844.7
Livestock population
Rabbit
Poultry
Pigs
Goat
Sheep
Cattle

Page 23 / 82
Graph 21 : Average parameters compared to industry benchmark, Source: Bister, 2010; Singh, 2006, Seck,
1992
Graph 22 : Local breed performance compared to industry benchmark, Source: Bister, 2010; Singh, 2006,
Seck, 1992
• Lack of productivity data regarding the local breeds. Most cases records are not kept by
farmers on the parameters measuring productivity;
• Nutritional constraints. The nutritional constraints Rwandan livestock are well described in
the document « Strategic Plan for Animal Nutrition Improvement Programme for Rwanda.
MINAGRI, 2009»;
• Housing constraints: Housing problems are mainly related to the high price of the
equipment for small ruminants and the inadequacy to good husbandry practices (rabbits).
• Environmental constraints: constraints related to land access and tenure, soil fertility and
forage quality, are exhaustively described in the PSTA II Document. In summary, the
relative abundant average rainfall as compared to many African countries conceals large
regional disparities. Thus, the western part of the country receives the heaviest rainfall while
the eastern part is more subject to droughts, due to spatiotemporal irregular rainfall.
Moreover most of the soils are highly weathered, and combined effects of soil acidity, low
cation exchange capacity and aluminum toxicity led to a relatively poor fertility in many
areas.
Page 24 / 82
• Socioeconomic constraints are:
• Access to new markets: although export markets already exist (Congo, DRC,
Kenya, U.S and Asia), the growing of livestock exports are dependent on
quantitative and qualitative improvements;
• Lack of skilled farmers
• Lack of entrepreneurship: livestock husbandry is still largely considered as
subsistence activity;
• Food taboos: sheep and rabbit meats.
• Inaccessibility of credit to small scale farmers
• Weak farmers’ organizations.
- Small farmers associations in the rural areas ;
- Low organizational capacity.
• Animal diseases, including zoonosis. The presence of certain zoonosis could seriously
compromise the achievement of meat industry in Rwanda.
• Poor investment in livestock industry: Livestock farming especially is usually done with
minimum inputs.
• Lack of coordination within the Institutional framework involving all stakeholders
• Low level of meat processing. The value chain is still characterized by the low level of meat
processing. The industry doesn’t take advantage of the added value offered by modern
distribution channels and VIP customers.
Livestock activity is focused inclusively on farming; the slaughtering process only delivers the
following outputs: whole or semi and quarter carcasses:
• Cutting and transformation (ham, sausage, etc…) does not really exist.
• Chicken are sold live or “Ready to Cook”.
• Preparation of poultry, pigs and sheep is usually done in the “backyard slaughterhouses” .
These general constraints are in addition to specific constraints to hinder the development of
the Meat Industry:
• Predominance of “backyard slaughterhouses”.
• Semi modern slaughterhouses exist in cities
• Rules of their implementation are not respected:
- Slaughterhouses are near residential areas;
- Hygienic conditions are precarious;
- No ante mortem inspection;
- Slaughter processes are outdated;
- There is no system of re wiping after slaughtering;

Page 25 / 82
- Pollution of the environment by cutting waste and waste water is not taken into
account;
- Management of seizures slaughter doesn’t guarantee the preservation of Public
Health (no incineration system, no safety insurance risk of soil-borne diseases with
the current method by chlorination);
- Slaughter of pigs is rather a domestic activity like poultry;
- Low value of slaughtering by-products ;
- No training strategy of the abattoir industry.
• Control of illegal animals slaughtering is not demonstrated
• Transportation conditions and retailers conditions are very inadequate
• Sanitary inspection of butcheries and retailers
In fact, the optimum conditions for the establishment of a true meat industry in Rwanda are still
very low. A focus on the value chain gives a synoptic view of the major weaknesses of the Meat
Industry.
• At the farming/production stage
- Poor animal nutrition;
- Poor performing local breeds;
- Weak veterinary services delivery;
- Endemic diseases;
- Many fragmented small producers without real support from the government;
- Profitability not demonstrated (ignorance of the pricing structure of meats).
• At the slaughter stage
- Most of them are just “backyard slaughterhouses”;
- Semi modern slaughterhouses exist in cities;
- Rules of their implementation are not respected;
- No ante mortem Inspection;
- Control of illegal animals slaughtering is not demonstrated;
- Preparation of poultry, sheep and pigs is usually done in the “backyard
slaughterhouses;
- Profitability not demonstrated (ignorance of the pricing structure).
• At the cutting/processing stage:
- Inexistence or a small number of processors (Cutting and packaging);
- Profitability not demonstrated (ignorance of the pricing structure).

Page 26 / 82
• At the retailing stage:
- A small number of mass market retailers;
- Low Sanitary inspection of retailers;
- Profitability not demonstrated;
- Competition of imported products (ignorance of the pricing structure).
Picture 1 : Some weaknesses in the meat industry, Source: Dr Papa Ndary NIANG, 2012
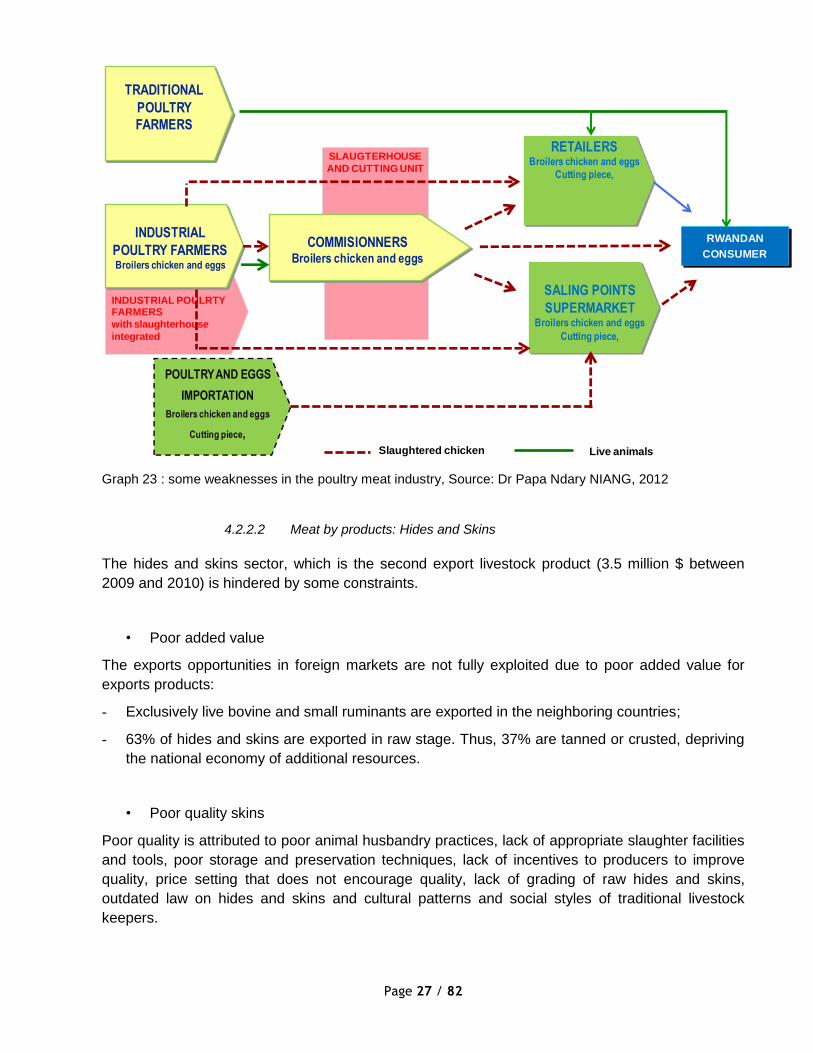
Regarding the particular case of chicken, one of the weaknesses of the sector is due to the lack of
infrastructure for cutting and processing.
Transportation conditionsSanitary inspection of butcheries and retailersWaste water disposal
Body conditions not conform No ante mortem Inspection: affected bovine? no system of re wiping after slaughtering
Page 27 / 82
Graph 23 : some weaknesses in the poultry meat industry, Source: Dr Papa Ndary NIANG, 2012
4.2.2.2 Meat by products: Hides and Skins
The hides and skins sector, which is the second export livestock product (3.5 million $ between
2009 and 2010) is hindered by some constraints.
• Poor added value
The exports opportunities in foreign markets are not fully exploited due to poor added value for
exports products:
- Exclusively live bovine and small ruminants are exported in the neighboring countries;
- 63% of hides and skins are exported in raw stage. Thus, 37% are tanned or crusted, depriving
the national economy of additional resources.
• Poor quality skins
Poor quality is attributed to poor animal husbandry practices, lack of appropriate slaughter facilities
and tools, poor storage and preservation techniques, lack of incentives to producers to improve
quality, price setting that does not encourage quality, lack of grading of raw hides and skins,
outdated law on hides and skins and cultural patterns and social styles of traditional livestock
keepers.
INDUSTRIAL POULRTY FARMERS
with slaughterhouse
integrated
SLAUGTERHOUSE
AND CUTTING UNIT
INDUSTRIAL
POULTRY FARMERSBroilers chicken and eggs
COMMISIONNERSBroilers chicken and eggs
RETAILERSBroilers chicken and eggs
Cutting piece,
RWANDAN
CONSUMER
SALING POINTS
SUPERMARKETBroilers chicken and eggs
Cutting piece,
TRADITIONAL
POULTRY
FARMERS
POULTRY AND EGGS
IMPORTATION
Broilers chicken and eggs
Cutting piece,
Live animalsSlaughtered chicken
Page 28 / 82
• Low recovery of skins
This is attributed to poor quality leading to rejection, low awareness especially among primary
producers on the economic value, low prices of hides and skins.
• Capacity utilization of tanneries and investments
Although 37% of hides and skins are semi-processed, capacity utilization of tanneries remain low,
due to worn out machinery and equipment and outdated technology, as well as a low investment
capacity.
• Effluent treatment problems and adherent to sound environmental management standards
Most of the tanneries in Rwanda lack proper effluent treatment plants; as a result they contribute to
environmental pollution.
• Poor and deteriorating physical infrastructure
The infrastructure which includes abattoirs, slaughter slabs are in most cases in poor condition and
rehabilitation costs are usually relatively high.
4.2.3 Opportunities and threats of the meat industry
Despite the constraints aforementioned, Rwanda has opportunities to launch a strong meat
industry if the threats that hinder its development are removed.
4.2.3.1 Opportunities
The main opportunities are:
• Livestock in growing trends;
• Decrease of meat imports national invoice;
• Getting currencies in value markets;
• Increase valorization of hides and skins.
4.2.3.2 Threats
The main threats are the competition of imported products from bordering countries (Uganda,
Tanzania, Kenya, European Union, etc.).

Page 29 / 82
5 CHALLENGES AND STRATEGIC OPTIONS FOR MEAT INDUSTRY
5.1 Vision by 2017
The challenge can be divided into five major objectives:
• Insure meat security for Rwandans.
• Becoming a major asset in malnutrition and poverty fighting.
• Developing Rwandan livestock competitiveness in Africa.
• Promoting the development of a strong and sustainable meat industry.
• Developing foreign exchanges.
These targets will be structured around the vision for the industry by 2017. The vision for Rwandan
meat industry on 2017 should integrate the needs of Rwandans in meat consumption and give a
great framework to encourage Rwandans and foreigners to invest in meat sector. This vision can
be summarized as follows:
«An industry pushing domestic consumption of quality meat, diversified, and taking
advantage of business opportunities on value markets in East and Central Africa. »
Therefore, the meat industry will contribute significantly in achieving MDG and EDPRS targets at
the end of the 6-years recovery plan in 2017.
5.1.1 An industry pushing domestic consumption of quality meat
In 2017, the meat industry in Rwanda will be boosted by the existence of an important herd of meat
breeds, healthy, well-fed, and able to meet the growing consumer demand in Rwanda.
Meats sold in the domestic market will mostly be homemade and will be good organoleptic and
nutritional quality, health safety and enviable position resulting of the coaching of veterinary and
zootechnicians. Labels of Meat Quality will then spread to ensure the quality of meat for Rwandan’s
consumers. Modern SMEs and efficient farms will replace the traditional farms and promote the
emergence of a new class of businessmen farmers participating in the socio-economic
development of their provinces.
5.1.2 A diversified meat industry
In 2017 the consumer should have a choice of various meat products with the Rwandan label. The
consumer should have the choice of meat species: cattle, sheep, goat, pig, rabbit, and poultry.
The consumer should make a selection of product categories: first, second or third choice
depending on his purchasing power. The consumer should have the choice of product lines: entire
or cut products, sausage, ham, and canned. By-products will also be valued due to the existence of
modern recycling units respecting the environment.
Page 30 / 82
5.1.3 An industry taking advantage of business opportunities on value markets
in East and Central Africa.
In 2017 the dynamism of the meat industry will give to the Rwandan economy foreign currencies by
selling branded and labelled meat in two value markets: Democratic Republic of Congo and Congo
Brazzaville. The level of recovery of hides and skins will be more accentuated for selling secondary
processed products in the international market.
5.2 Strategic options
Three strategic priorities will achieve the vision which will increase the meat industry from the
primary step to a sustainable industry serving the social and economic development of Rwanda.
• Increasing meat supply;
• Modernization and development of the industry infrastructure;
• Improving access to domestic and foreign markets.
The objective of consumption per capita is to pass from 7.5 kg to the rate 15.07 kg in 2017 taking
into consideration the purchasing power of Rwandan consumers.
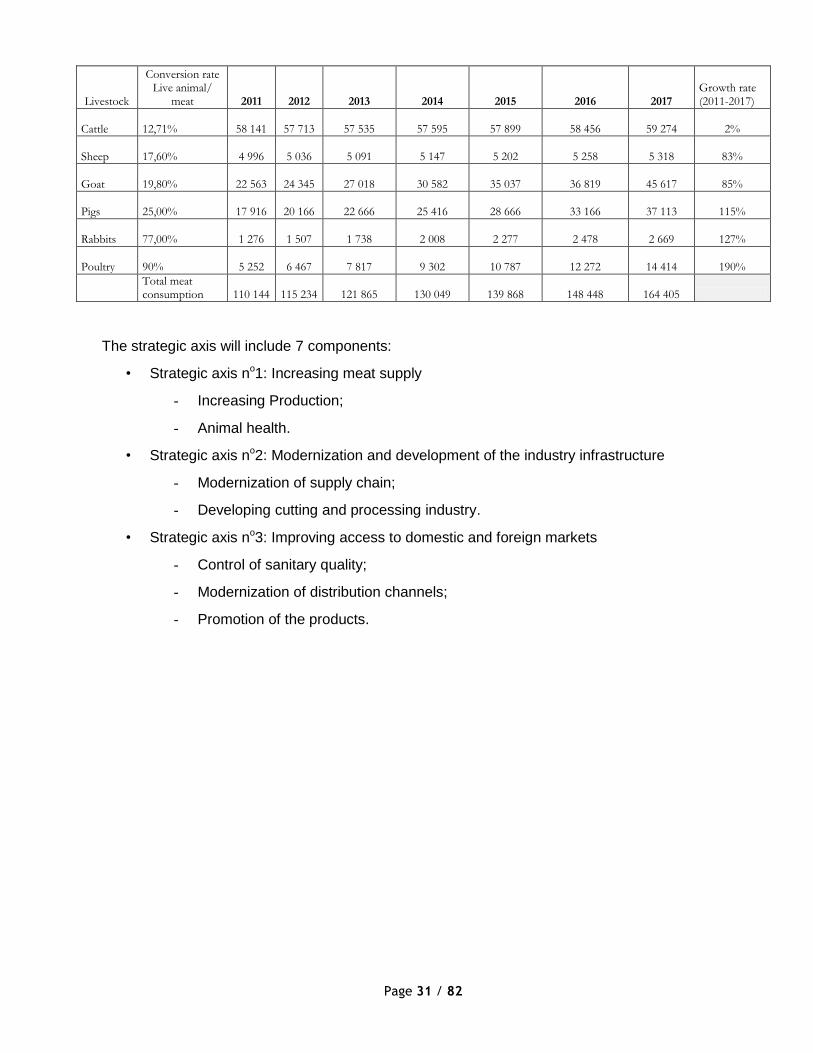
Table 1 : Trends of livestock populations
Livestock
Growth rate (2005-2011) 2011 2012 2013 2014 2015 2016 2017
Growth rate (2011-2017)
Cattle 6,18% 1 143 553 1 135 141 1 131 633 1 132 810 1 138 799 1 149 749 1 165 835 2%
Sheep -8,57% 630 860 635 860 642 860 649 860 656 860 663 860 671 418 6%
Goat 52,18% 2 532 277 2 732 277 3 032 277 3 432 277 3 932 277 4 132 277 5 119 760 102%
Pigs 57,16% 716 629 806 629 906 629 1 016 629 1 146 629 1 326 629 1 484 536 107%
Rabbits 94,10% 828 802 978 802 1 128 802 1 303 802 1 478 802 1 608 802 1 733 015 109%
Poultry 84% 3 890 274 4 790 274 5 790 274 6 890 274 7 990 274 9 090 274 10 677 269 174%
Source: Dr Papa Ndary NIANG, 2012
Trends of livestock population’s growth during the period 2005-2011 are shown in the table above.
For the next seven years, cattle population should increase by about 2% related to lack of land as
confirmed by Drs BUTERA and RUTAGWENDA (2004: Plan stratégique de transformation de
l’Agriculture au Rwanda , Animal production sub-sector).
Regarding other species, it is assumed that the growth rate within the period 2011-2017 will be
higher than the growth rates of the period 2005-2011, due to operational and investment plans
2012-2017 to develop small animals and meat industries in Rwanda.
The average take-off rates for meat animals are respectively 28%, 32%, 40%, 85% and 95% for
cattle, small ruminants, pigs, rabbits and poultry. When the mortality rates are taken into account,
the conversion rates live animals/meat are: cattle (12.71%); sheep (17.60%); goat (19.8%), pigs
(25%); rabbits (77%) and poultry (90%).
Table 2 : Trends of meat production (in tons)
Page 31 / 82
Livestock
Conversion rate Live animal/
meat 2011 2012 2013 2014 2015 2016 2017 Growth rate (2011-2017)
Cattle 12,71% 58 141 57 713 57 535 57 595 57 899 58 456
59 274 2%
Sheep 17,60% 4 996 5 036 5 091 5 147 5 202 5 258
5 318 83%
Goat 19,80% 22 563 24 345 27 018 30 582 35 037 36 819
45 617 85%
Pigs 25,00% 17 916 20 166 22 666 25 416 28 666 33 166
37 113 115%
Rabbits 77,00% 1 276 1 507 1 738 2 008 2 277 2 478
2 669 127%
Poultry 90% 5 252 6 467 7 817 9 302 10 787 12 272
14 414 190%
Total meat consumption 110 144 115 234 121 865 130 049 139 868 148 448
164 405
The strategic axis will include 7 components:
• Strategic axis no1: Increasing meat supply
- Increasing Production;
- Animal health.
• Strategic axis no2: Modernization and development of the industry infrastructure
- Modernization of supply chain;
- Developing cutting and processing industry.
• Strategic axis no3: Improving access to domestic and foreign markets
- Control of sanitary quality;
- Modernization of distribution channels;
- Promotion of the products.

Page 32 / 82
6 OPERATIONAL AND INVESTMENT PLAN
The overall budget to lift the meat industry of Rwanda to the rank of a performing meat industry
should be around 8 539 000 000 RWF (16 644 251 US $).
Table 3 : Budget of investment plan for meat industry strategy in Rwanda
Strategical axis Component Amount in RWF Amount in $
A1. Increasing meat supply
A1.C1. Animal Health 2 210 000 000 4 307 740.29
A1.C2.Increasing production 3 225 000 000 6 286 182.09
SUB TOTAL 1 5 435 000 000 10 593 922
A2. Modernization & development of the industry infrastructure
A2.C1.Modernization of Supply Chain 735 000 000 1 432 664.76
A2.C2. Development of a processing industry 850 000 000 1 656 823.19
SUB TOTAL 2 1 585 000 000 3 089 488
A3.Improvement markets access
A3.C1. Control of Sanitary Quality 390 000 000 760 189.46
A3.C2. Modernization of the Distribution Channels 250 000 000 487 300.94
A3.C3. Promotion products 729 000 000 1 420 969.53
SUB TOTAL 3 1 369 000 000 2 668 460
Transversal action: Coaching for the implementation of the operational action plan SUB TOTAL 4 150 000 000 292 381
TOTAL 8 539 000 000 16 644 251
Table 4 : Contribution of key actors
TIMEFRAME RWANDA
CONTRIBUTION PRIVATE SECTOR CONTRIBUTION
PARTNERS of DEVELOPMENT CONTRIBUTION TOTAL
SHORT TERM 80 000 000 0 135 000 000 215 000 000
MEDIUM TERM 762 500 000 350 000 000 1 602 500 000
2 715 000 000
LONG TERM 914 500 000 1 802 000 000 2 892 500 000 5 609 000
000
TOTAL 1 757 000 000 2 152 000 000 4 630 000 000 8 539 000
000
Contribution 21% 25% 54% 100%
Source: Dr Papa Ndary NIANG, 2012
6.1 Overall approach
Strategies for «Small animals industry» and «Meat industry» have many cross-cutting issues.
Indeed, strategies regarding animal health, policy and regulatory framework, promotion of livestock
and livestock products, capacity building for stakeholders, access to regional and international
market… cannot be dissociated. As a consequence, the need of consistency command the fusion
of the 2 operational and investment plans while emphasizing the specificities of each study.
The budgets of the strategic axis are determined as follows:

Page 33 / 82
• Taking into account of existing studies on costs of specific operation while adjusting these
to the context of our studies: e.g. costs of broodstock purchase in APEL document; costs of
capacity building for senior scientists in PSTA II document;
• Adjusting to the Rwandan context assessments of costs studies made by CABINET
AFRIQUE EMERGENCE CONSEIL in other countries: e.g. costs of HACCP system
implementation, costs of updating food security laboratories, feasibility studies for the
implementation of slaughterhouses;
• Adjusting to the Rwandan context assessments of costs undertaken in neighboring
countries: e.g. modernization of tanneries (Tanzania); or by organizations such as ILRI
(mapping of fodder resources).
6.2 Transversal actions
6.2.1 Management of the Approach & Harmonization of the Action Plans
Strategic approaches for «Meat industry» and «Small animals industry» were similar regarding the
methodological approach and the strategic diagnosis.
Harmonization of the 2 Action Plans is a prerequisite for an overall success, namely the strategic
axis no 1of the 2 studies (related to increase of meat production and the increase of livestock) and
the strategic axis no3 (related to the marketing of livestock and livestock products).
Two main actions to be included as cross-cutting actions and be included:
• The communication plan of the strategy with stakeholders, authorities and development
partners:
• Supporting the implementation of operational action plan through coaching (regular
meetings, monitoring and evaluation, strategic dashboard). This item must be budgeted for
6 years around 25 Million RWF per year (in total 150 Million RWF).
6.2.2 Guarantee fund & Fund for financial support
The funds will aim at the development of a dynamic private sector. It will enable:
• the vitalization of Agri-business through actions such as loans guarantee programs, rural
financial services and strengthening of stakeholder’s organizations;
• The development of exports through actions such as subsidies for upgrading and labeling
process, modernization of tanneries, promotion of livestock products.
Page 34 / 82
6.3 Strategic axis 1: Increasing meat supply
6.3.1 Component 1: Animal health
Ensuring good health of animals is the basis of any livestock development policy. Five strategic
objectives are needed to achieve the goal.
6.3.1.1 Strategic objectives
6.3.1.1.1 Communication of animal diseases and zoonosis information
The objective is to communicate timely and accurate animal disease information, including
information on zoonosis, by making the best use of scientific data modelling, modern information
technologies, and non-official information tracking systems:
• There are two main streams of communication of animal disease information: scientific
information gathering, analysis and official communication, and public communication
based on this scientific analysis;
• Communicating timely and accurate animal disease information, including information on
zoonosis, should be one of the core functions of the Veterinary services. That requires
processing and real-time operating of data on epidemiological monitoring conducted in the
laboratory of veterinary services;
• Dissemination of the official information in a transparent, responsive and efficient manner.
Implementation of a sanitary alert system based on epidemiological analysis of data in its
information system and in cooperation with the bordering countries.
6.3.1.1.2 Development and implementation of scientifically based standards and
guidelines
The objective is to Develop scientifically based standards and guidelines on all matters concerning
animal health, veterinary public health, animal welfare, diagnosis and control of diseases,
assessment and relevant recognition of animal health status, and sanitary safety in animal
production and international trade in animals and animal products.
• Developing scientifically based standards and guidelines for safe trade in animals and
animal products;
• Developing animal production food safety standards complementary to the food safety
standards;
• Improving public and private sector awareness of the importance of the national standards
for animal health and veterinary public health and;
• Strengthening collaboration with relevant international and regional Organizations on
technical and legal issues related to veterinary products, including legislation, registration
and control and monitoring of use.
The regulatory framework must be strengthened with laws, regulations and decrees as existing in
other countries:
• Regulations for the safety of plants, animals and food Legislative texts in the sub region;

Page 35 / 82
• Law on food control and fraud prevention;
• Law on hygiene code;
• Decree mandating deposit in cold storage of meat for consumption;
• Decree on production, processing, packaging and marketing of hides, skins and skin
appendages;
• Decree regulating the safety and health inspection of meat animals, meat and by-products
intended for human consumption;
• Decree on animal health measures;
• Standards on meat:
- Transportation of meat by cold storage;
- Meat and sausage;
- Meat cutting.
6.3.1.1.3 Prevention, control and eradication of animal diseases, including
zoonosis
The objective is to provide scientifically based recommendations on measures for the prevention,
control and eradication of animal diseases including zoonosis, taking into account the economic,
social and environmental impacts of such measures:
• Develop, together with partner organizations at international and regional levels, common
strategies concerning the control of transboundary diseases and their implications for trade;
• Cooperation with OIE in developing and carrying out coordinated regional programmes for
preventing, controlling and eradicating priority animal diseases;
• With international and regional partners, address the animal and zoonotic disease risks of
the smallholder farming sector, including communities in peri-urban areas;
• Strengthen cooperation and information exchange in relation to border control.
6.3.1.1.4 Ensuring the scientific excellence of information and advice
The objective is to ensure the scientific excellence and timeliness of information and advice
available to national Veterinary Services and to other interested parties in the country:
• Meeting the scientific standards of OIE.
• Specialization among scientist to incorporate new subjects such as climatology, ecology or
entomology as well as an increased degree of interaction and interdisciplinary across
diverse areas of science.
• Encouraging comprehensive and continuing epidemiological studies to understand infection
and disease transmission dynamics between wildlife, domestic animals and humans.
• Encouraging research into inter-species pathogen transmission and migration patterns, in
collaboration with the wildlife sector;
• Encouraging research into the surveillance of antimicrobial resistance in pathogens and the
possible causes leading to the development of antimicrobial resistance;
Page 36 / 82
• Strengthening opportunities for interaction between the public and private sectors in
scientific research to meet animal health and welfare challenges.
6.3.1.1.5 Capacity building for national veterinary services
The objective is to strengthen the capacity of Veterinary Services to achieve the improvement of
animal health, veterinary public health and animal welfare, while improving their ability to
participate in the development of international standards and guidelines on these matters; and
strengthen their ability to apply these standards and guidelines:
• Strengthening the good governance of Members’ Veterinary Services, including technical
and management capacities and legislation;
• Upgrading the laboratory of the Veterinary services to reach the level 3;
• Implementing a laboratory of food analysis;
• Develop surveillance capacity, including the development of tools and monitoring
processes for use at national, regional and global level;
• Encourage improved collaboration between the public health and animal health sectors
and other competent ministries to improve preparedness for and response to potential
natural or intentional infectious disease outbreaks;
• Encourage and evaluate the initial and continuing education of veterinarians and veterinary
para-professionals;
• Working with veterinary statutory bodies for a better selection of, and the continuing
education of, veterinarians and para-professionals.
Other objectives, not less significant are:
• The protection of public health by providing the consumer with meat free of any danger that
could compromise his health;
• The protection of the country from all animal diseases threats.
6.3.1.2 Evaluation indicators
These indicators will enable the monitoring of the rates of achievements of the strategic objectives:
• Number of seizures of carcasses;
• Number of cases of zoonosis reported;
• Number of national alerts;
• Gradual decrease of the prevalence of the controlled diseases/zoonosis;
• Integrating the OIE’s network of reference centers;
• Level 3 status for the laboratory of the veterinary services.
6.3.1.2.1 Operational and Invest plan
The operational and invest plan includes the stakeholders involved and the timeframe for each
strategic objective.

Page 37 / 82
Table 5: Operational and Investment plan for Animal Health
BUDGET (in
RWF)* 106
STAKEHOLDERS 2012 2013 2014 2015 2016 2017 PRIORITY RWANDA
CONTRIBUTION
PRIVATE SECTOR
CONTRIBUTION
PARTNERS of
DEVELOPMENT
CONTRIBUTION
Capacity building for research scientists (nutrition, animal health, genetics…) 400 MINAGRI/RAB
MEDIUM TERM 150 - 250
Capacity building for the Veterinary Services (equipment) 600 MINAGRI/RAB
MEDIUM TERM 180 - 420
Upgrading the laboratory of the veterinary services to level 3 400
MINAGRI/RAB/ VET SERVICES
MEDIUM TERM 120 - 280
Prevention, control and eradication of animal diseases including zoonosis 625
MINAGRI/RAB/ VET SERVICES
LONG TERM 187.5 - 437.5
Improvement of information system on animal diseases and zoonosis 100
MINAGRI/RAB/ VET SERVICES
LONG TERM 30 - 70
New Animal Heath Policy 25 MINAGRI/RAB/ VET SERVICES
MEDIUM TERM 7.5 - 17.5
Annual report on the animal health status in Rwanda 60
MINAGRI/RAB/ VET SERVICES
LONG TERM 20 - 40
Source: Dr Papa Ndary NIANG, 2012
Page 38 / 82
6.3.2 Component 2: Increasing meat production
To achieve an average meat consumption of 15.07 kg per capita by the year 2017, the strategy
must emphasize the development of small animals (Goats, sheep, pigs and poultry). Indeed, the
rearing of beef cattle is less relevant in the Rwandan context characterized by the lack of grazing
lands and the subsequent «Zero grazing» policy. The strategy to increase meat production is in a
large extent the strategy proposed to increase livestock production (cf. document on Small animal’s
strategy.).
6.3.2.1 Strategic objectives
• Ensure availability of the national herd (livestock and poultry) to offer consumers the choice
of a Rwandan variety of meat from several species (cattle, sheep, goats, poultry, pigs,
rabbits);
• Establish a genetic improvement program (cf. document on Small animal’s strategy.)
• Develop animal nutrition in Rwanda based on locally available and affordable feed
resources (cf. document on Small animal’s strategy).
• Reduce imports of meat from neighboring and industrial countries;
• Influence the price structure to provide meat at an accessible price to the Rwandan’
consumer;
• Impulse SME and farmers businessmen in Rwanda.
• Impulse Feedlot activities: feedlots is enterprise in which animals are fed grain and other
concentrates for usually 90-120 days to gain adequate muscle and finish (fat deposit) for
slaughter. This targets the local market which needs fat animals. Feedlot farms must be
encouraged. The principal functions of feedlot operations are to assemble large numbers of
sheep and goats, bulls, and pigs, often coming from different origins and produce products
of acceptable standard for Rwandan consumers. Fattening offers many advantages:
- Technically, it is quite simple and within the capabilities of small farmers to
implement; moreover, the results are highly visible. This helps farmers to have
confidence in the technique;
- Benefits can be realized within a short period of time unlike other animal production
activities;
- Fattening generates cash income that is eagerly sought by farmers;
- Fattening is generally profitable because the value per kilogram of live weight
increases as both weight and condition increase.
Traditional fattening can be done but modern fattening with by-products shall be the best
practice. This system can be promoted with sugar processing by-products such as
molasses and corn (grain and residue). Protein sources like oilseed cakes can be
purchased and/or forage legumes can be grown.
The strategy must be focused on:
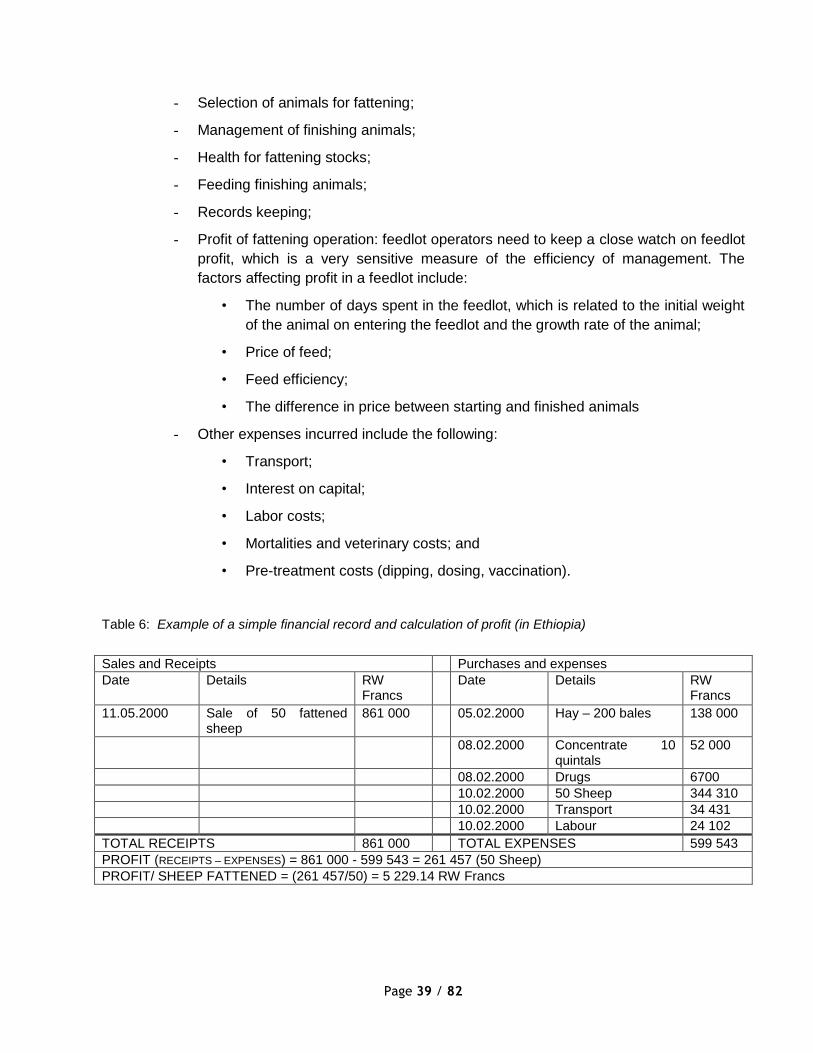
Page 39 / 82
- Selection of animals for fattening;
- Management of finishing animals;
- Health for fattening stocks;
- Feeding finishing animals;
- Records keeping;
- Profit of fattening operation: feedlot operators need to keep a close watch on feedlot
profit, which is a very sensitive measure of the efficiency of management. The
factors affecting profit in a feedlot include:
• The number of days spent in the feedlot, which is related to the initial weight
of the animal on entering the feedlot and the growth rate of the animal;
• Price of feed;
• Feed efficiency;
• The difference in price between starting and finished animals
- Other expenses incurred include the following:
• Transport;
• Interest on capital;
• Labor costs;
• Mortalities and veterinary costs; and
• Pre-treatment costs (dipping, dosing, vaccination).
Table 6: Example of a simple financial record and calculation of profit (in Ethiopia)
Sales and Receipts Purchases and expenses
Date Details RW Francs
Date Details RW Francs
11.05.2000 Sale of 50 fattened sheep
861 000 05.02.2000 Hay – 200 bales 138 000
08.02.2000 Concentrate 10 quintals
52 000
08.02.2000 Drugs 6700
10.02.2000 50 Sheep 344 310
10.02.2000 Transport 34 431
10.02.2000 Labour 24 102
TOTAL RECEIPTS 861 000 TOTAL EXPENSES 599 543
PROFIT (RECEIPTS – EXPENSES) = 861 000 - 599 543 = 261 457 (50 Sheep)
PROFIT/ SHEEP FATTENED = (261 457/50) = 5 229.14 RW Francs
Page 40 / 82
6.3.2.2 Evaluation indicators
These indicators will enable the monitoring of the rates of achievements of the strategic objectives:
• Growth rates of livestock;
• Growth rates by species;
• Increased rates of exotic breeds and crossbreeds
• Map of fodder resources according to the ecological zones and seasons Annual
assessments of crop residues and agricultural by-products
• Tables of bromatological values
• Standard diets developed from local by-products for each species
• Availability of industrial animal feed
• Feed standards controlled by RBS
• Trends in imports of livestock and meat from the sub-region;
• Evolution of the price of meat sold in the domestic market;
• Per capita consumption of meat by the Rwandan;
• Incomes of Farmers and SMEs solvability;
• Number of feedlot farmers;
• Incomes of feedlot farmers and profitability.
6.3.2.3 Operational and invest plan
The operational and investment plan includes the stakeholders involved and the timeframe for each
strategic objective.

Page 41 / 82
Table 7: Operational and Investment plan for Increasing Meat production
BUDGET
(in RWF)*106
STAKEHOLDERS 2012 2013 2014 2015 2016 2017 PRIORITY RWANDA CONTRIBUTION
PRIVATE SECTOR CONTRIBUTION
PARTNERS of
DEVELOPMENT
CONTRIBUTION
Business Plan for implementation of fattening farms 25 MINAGRI
SHORT TERM
5
20
Support the implementation of fattening farms 1 500 MINAGRI/RAB
/ GIRINKA LONG TERM
150 1 000 350
Capacity building for ruminants and pig fatteners 200 MINAGRI/RAB
LONG TERM
50
150
Capacity building for poultry producers 100 MINAGRI/RAB
LONG TERM
20 - 80
Contests of best breeders, annual livestock exhibition 250 MINAGRI/ RAB, RTV
MEDIUM TERM
50 50 150
Recovery of animal feed factory in PPP (participation in the capital)
500 MINAGRI/ RAB, RDB,
RPIA
MEDIUM TERM
100 300 100
Capacity building for ruminants and pig fatteners 150 MINAGRI/RAB LONG TERM
50 25 75
Mapping and quantification of fodder resources 100
MINAGRI/ RAB,
(Department of Statistics)
LONG TERM
20
80
Quantification of crop residues 100
MINAGRI/ RAB,
(Department of Statistics)
MEDIUM TERM
20
80
Determination of feeding values of feed resources 100
MINAGRI/ RAB, Consultants
MEDIUM TERM 30
70
Research – Development of linkages between the
ration formulations and the feed resources locally available 200
MINAGRI/ RAB, ISAE, Feed Industry
LONG TERM 50 50 100
Source: Dr Papa Ndary NIANG, 2012

Page 42 / 82
Page 43 / 82
6.4 Strategic axis 2: Modernization and development of the industry infrastructure
6.4.1 Component 1: Modernization of the supply chain
6.4.1.1 Strategic objectives
• To Strengthen the organizations of the different stakeholders of the supply chain:
cooperatives of farmers, poultry producers and slaughterhouses' cooperatives which are all
private;
• Contractualization of business relationships between these stakeholders to have a steady
offer for slaughterhouses and secure income for farmers;
• Bridging the gap between stakeholders by implementing slaughterhouses in the provinces;
• To have slaughter lines respecting health standards and give to consumers healthy and
diversified meat and meat products;
• To Provide a place of safe supply to meat consumers;
• Development of an industry training strategy for the abattoirs.
The aim of the Training Strategy is to effectively target the needs of the industry and
workers and ensure outcomes both in terms of industry productivity and established
pathways for workers both within the industry as well as for opportunities in other sectors.
The industry will face a number of challenges including the introduction of technology,
safety standards, restructuring and the development and implementation of an effective
training culture. The Training Strategy will effectively target existing training resources for
the industry and up skill employees in a range of essential requirements including quality
assurance, meat safety, language and literacy, management, workplace assessment and
training and information technology.
A variety of training needs can be summarized as:
• Increased provision and awareness of future training pathways to the industry (e.g.
prevocational training and apprenticeship and traineeship training);
• Hygiene and safety standards;
• Quality assurance;
• Qualifications regarding meat processing;
• Meat inspection.
The training strategy should involve veterinarians, slaughterhouses’ inspectors, butchers,
retailers.
6.4.1.2 Evaluation indicators
These indicators will enable the monitoring of the rates of achievements of the strategic objectives:
• Number of livestock markets upgraded;
• Number of rural slaughterhouses implemented;

Page 44 / 82
• Number and type of slaughterhouses built and upgraded ;
• Number of butchers trained.

Page 45 / 82
6.4.1.3 Operational and investment plan
The operational and investment plan includes the stakeholders involved and the timeframe for each strategic objective
Table 8: Operational and Investment plan for Modernization of the supply chain
BUDGET
(in RWF)*106
STAKEHOLDERS 2012 2013 2014 2015 2016 2017 PRIORITY RWANDA CONTRIBUTION
PRIVATE SECTOR CONTRIBUTION
PARTNERS of
DEVELOPMENT
CONTRIBUTION
Capacity building of agents in charge of control of slaughterhouses
20 MINAGRI/RAB
MEDIUM TERM
5 - 15
Rehabilitate a livestock market in each province and build 5 rural slaughterhouses
250 MINAGRI/RAB/ Cooperatives
LONG TERM
20 50 180
Business Plan for the implementation of modern slaughterhouses
25 MINAGRI/RAB
SHORT TERM
5 - 20
Establishment of a pig slaughterhouse in Kigali (PPP)
150 MINAGRI/RAB/ Cooperatives
LONG TERM
- 150 -
Establishment of a poultry slaughterhouse in Kigali (PPP)
150 MINAGRI/RAB,
RPIA, Cooperatives
LONG TERM
- 150 -
Support the implementation of the upgrade plan for delicatessens and butcheries
100
MINAGRI/RAB, Coop (SATRA,
SABAN), Delicatessens
LONG TERM
20 20 60
Training of butchers 40 MINAGRI/RAB, Coop (SATRA,
SABAN)
LONG TERM
10 - 30
Source: Dr Papa Ndary NIANG, 2012

Page 46 / 82
6.4.2 Component 2: Development of cutting and processing industry
The activities of the meat sector may be divided into three stages: slaughtering, meat cutting and
further processing. Each stage involves completely different technical operations which must not be
viewed as separate and independent processes. There are significant interactions between the
stages and shortcomings at one stage can have a serious negative impact on the product or
process in a subsequent stage. They may influence technological, biochemical or microbiological
aspects.
Improper slaughtering techniques such as faulty stunning, bleeding, skinning, evisceration and
carcass splitting can damage parts of the carcass and certain by products and make them
unsuitable for further use. Poor standards of hygiene during slaughtering or carcass handling result
in high levels of microbial contamination in the meat, thus reducing the shelf-life and adversely
affecting the sensory properties of products fabricated from this raw material. Although controls
imposed on the meat industries have become more stringent and effective, improper treatment of
slaughter animals and poor meat-handling techniques persist in many meat plants. These
problems are evident in many developing countries. Apart from deficiencies in veterinary meat
inspection, serious shortcomings with regard to general meat hygiene and meat technology can
frequently be observed. This is to some extent due to the lack of adequate facilities in the meat
sector in developing countries, but carelessness and lack of skills on the part of the personnel
involved in meat operations are also important factors, hence the industry training strategy
aforementioned.
The purpose of the expected guidelines is to disseminate practical information on meat hygiene
and meat technology to meat industry personnel, and to provide the necessary encouragement for
improving production in the meat sector and reducing post-harvest losses. The expected guidelines
will comprise basic techniques in slaughtering, meat cutting and further processing and the
respective hygienic regulations applicable to both the small-scale and the medium-sized meat
plants. Adherence to these basic guidelines would contribute to the production and consumption of
safe, good-quality meat and meat products. Other purpose is the process of slaughterhouses’ by-
products, namely hides and skins, in a way meeting environmental requirements
There is a wide variety of procedures and products in the meat sector all over the world. However,
the technological, microbiological and biochemical properties of the raw material (meat) do not vary
significantly and can easily be adapted to local conditions.
Where appropriate, reference will be made to the traditional meat-handling methods without
refrigeration, since these conditions are likely to prevail in the near future in many developing
countries, particularly in rural areas. On the other hand, in view of the growing populations not only
in urban but also in rural areas, refrigeration as a means of meat preservation will become more
and more important and information on these aspects will be included. Refrigeration of meat will
also have a positive impact on the introduction of further processing of meat in developing regions,
since refrigerated meat under suitable hygienic conditions is essential for most meat-processing
operations.
Page 47 / 82
Furthermore, the strict adherence to general hygienic rules in the meat industry can minimize food-
borne diseases. The expected guidelines will therefore also play a useful role in the public health
sector.
6.4.2.1 Strategic objectives
• Cutting and processing industry meeting hygiene and safety requirements;
• Valorize meat categories to match with the needs of consumers;
• Promote the emerging of a domestic supply of meat and meat products;
• Increase domestic market share by providing delicatessens with meat products currently
imported in a large extent: ham, sausage…;
• Increase domestic consumption by offering products that meet the needs of low-income
clients e.g. cutting of poultry.
6.4.2.2 Evaluation indicators
These indicators will enable the monitoring of the rates of achievements of the strategic objectives:
• Satisfaction rate of consumers (acceptance of poultry sold in pieces, organoleptic qualities
of meat and meat products);
• Percentage of processors upgraded;
• Incomes of Processors and SMEs solvability;
• Increase of skin exports;
• Tanneries certified;
• New guidelines before 2015.
6.4.2.3 Operational and investment plan
The operational and investment plan includes the stakeholders involved and the timeframe for each
strategic objective.

Page 48 / 82
Table 9: Operational and Investment plan for Development of cutting and processing industry
BUDGET
(in RWF)*106
STAKEHOLDERS 2012 2013 2014 2015 2016 2017 PRIORITY RWANDA
CONTRIBUTION
PRIVATE SECTOR
CONTRIBUTION
PARTNERS of DEVELOPMEN
T CONTRIBUTI
ON
Modernization of tanneries
600 MINAGRI/RAB, Tanneries cooperatives, NAEB, RBS
LONG TERM 50 100 450
Training of skins processors (skills, grading, storage technics)
200 MINAGRI/RAB, Tanneries cooperatives, NAEB, RBS
LONG TERM 50 - 150
Guidelines for skins processing effluent treatments and environmental standards
50 MINAGRI/RAB, Tanneries cooperatives, NAEB, RBS
LONG TERM 10 - 40
Source: Dr Papa Ndary NIANG, 2012

Page 49 / 82
6.5 Strategic axis n°3: Improving access to domestic and foreign markets
6.5.1 Component 1: Control of sanitary quality
Meat and meat products are derived from muscle, originally uncontaminated. The slaughter and
subsequent transformations undergone by these products are all risks of contamination of food by
these agents (bacteria or other) from live animals (endogenous contamination) or environment
itself (exogenous contamination). The dangers to the consumer through contamination of food by
germs such as Salmonella, Escherichia coli (enterohemorrhagic strain), Listeria monocytogenes,
and Campylobacter jejuni concern the possibility of outbreak of foodborne illness. The latter mostly
concerns the digestive tract, but some complications may worsen the prognosis, often at the level
of populations "at risk". Control methods in place to control the sanitary quality of this industry go
through analysis of the risks of contamination throughout the processing steps including the
breeding and marketing. This control requires minimizing opportunities for endogenous or
exogenous contamination (reducing animal infections, hygienic slaughter, further processing). It
also assumes the implementation of methods to prevent microbial growth (refrigeration, vacuum
packaging or controlled atmosphere ...). It finally passes through the use of methods that allow the
destruction of pathogens, either in commodities themselves (cooking, pasteurization, canning ...) or
at the "sources" who must be destroyed. Government and professional partners in this sector must
implement the methodology for risk management (HACCP) in the context of the implementation of
a new legislation regarding “Food Hygiene”.
6.5.1.1 The strategic objectives
• Fulfill the mission of protecting public health by fighting zoonosis and diseases related to
the post-mortem contaminations of carcasses;
• Get Hygiene and sanitary standards in the mid-term perspectives of promoting meat and
meat products exports;
• Protect public health by providing the consumer with meat free of any danger that could
compromise his health;
• Increasing consumer awareness on food quality and health;
• Give to consumers means and a framework to express their demands and influence in the
right direction the work of professionals.
6.5.1.2 Evaluation indicators
These indicators will enable the monitoring of the rates of achievements of the strategic objectives:
• Implementation rate of training programs;
• Number of consumers’ associations created;
• Consumers survey reports;
• Number of guides manufacturing practice validated;
• Level of sanitary quality of meat on the Rwandan market.
Page 50 / 82
6.5.1.3 Operational and investment plan
The operational and investment plan includes the stakeholders involved and the timeframe for each strategic objective.
Table 10: Operational and Investment plan for Control of sanitary quality
BUDGET (in
RWF)*106 STAKEHOLDERS 2012 2013 2014 2015 2016 2017 PRIORITY
RWANDA CONTRIBU
TION
PRIVATE SECTOR
CONTRIBUTION
PARTNERS of
DEVELOPMENT
CONTRIBUTION
Capacity building of agents in charge of food security
120 MINAGRI/
RAB LONG TERM
20 - 100
Upgrade the laboratory of food security 200 MINAGRI/ RAB/RBS
MEDIUM TERM
50 - 150
Strengthen the sanitary, phytosanitary and food safety system
20 MINAGRI/ RAB/RBS
MEDIUM TERM
10 - 10
Development of Guidelines for good hygiene practice Hygiene of meat for slaughter - Design, preparation and dissemination practices
50 MINAGRI/ RAB/RBS
MEDIUM TERM
15 - 35
Source: Dr Papa Ndary NIANG, 2012
Page 51 / 82
6.5.2 Component 2: Modernization of distribution channels
A modern distribution channel should include steps from the farmer to the consumer, favouring
implementations of SMEs working in meat processing and distribution.
Graph 24: Model of modern distribution channel
6.5.2.1 Strategic objectives
• Give to consumers opportunities to buy quality meat at safe retail outlets.
Farming
Consumers
Retailer/Food
service
Manufacturers
Logistics
Breeder
Farm
Meal
Markets
Further
processingAbattoir
Slaughtering
Cutting
Boning
Packing
Storage
Meal product
manufacturers
Retailer
Distribution
center
Food
service
Consumer
PU
BLIC
R
EG
ULA
TIO
N
Page 52 / 82
• Promote the development of SME recognized in terms of meat quality.
• Building capacities of commissioners.
• Upgrade the distribution chain: meat transport conditions, butcheries, delicatessens.
6.5.2.2 Evaluation indicators
These indicators will enable to monitor the rates of achievements of the strategic objectives:
• Evolution of the meat price from the domestic market.
• Number of SMEs upgraded.
• Number of SMEs certified HACCP or obtaining a quality label;
6.5.2.3 Operational and Investment plan
The operational and investment plan includes the stakeholders involved and the timeframe for each
strategic objective.
Page 53 / 82
Table 11: Operational and Investment plan for Modernization of distribution channels
BUDGET
(in RWF)*106 STAKEHOLDERS 2012 2013 2014 2015 2016 2017 PRIORITY
RWANDA CONTRIBUTI
ON
PRIVATE SECTOR
CONTRIBUTION
PARTNERS of
DEVELOPMENT
CONTRIBUTION
Labeling process for delicatessens and retail outlets
200 MINAGRI/RAB/RB
S LONG TERM
10 40 150
Strengthening organizations of the skin sector
50 MINAGRI/RAB/
Tanneries/ RBS/NAEB
LONG TERM
25 - 25
Source: Dr Papa Ndary NIANG, 2012
Page 54 / 82
6.5.3 Component 3: Promotion of the products
This component will be the outcome of the previous components reviewed. Producers who raise
livestock with the intent of marketing their own meat or processed meat products should give
careful consideration to where they will have their livestock slaughtered or meat processed. The
type of plant where animals are slaughtered has a significant impact on where the meat can be
marketed.
Marketing meat and meat products nationally or internationally requires adequate meat inspection.
If the intent is to market meat in foreign markets, the animal must be slaughtered and processed in
a certified slaughterhouse. Meat Inspection will be conducted by officials of MINAGRI/
VETSERVICES previously trained. On the other hand, new regulations containing strict facility
construction and sanitation standards to ensure the safety of the meat/meat product, and require
ante- and post-mortem inspection of each animal and carcass will be promoted.
Some countries require food safety standards above and beyond African countries’ certification.
The European Union, for example, applies its own certification standards above and beyond the
African ones. Some meat and meat products are subject to specific labelling requirements.
For all these reasons, the short and mid-terms exports targets should be limited to bordering
countries.
6.5.3.1 Strategic objectives
• Promote the consumption of meat produced in Rwanda.
• Understand changes in the meat market in Rwanda and the sub region and protect the
Rwandan consumer;
• Make available the consumption of meat through an accessible price;
• Ensure the competitiveness of the meat and meat products of Rwanda;
• Reduce taboos related to consumption of sheep, rabbit and modern poultry meats;
• Hence, the necessity of awareness campaigns ;
• Anticipate the intensifying competition of meat and meat products from foreign countries in
the context of the EAC by promoting the label «Made in Rwanda».
6.5.3.2 Evaluation indicators
These indicators will enable to monitor the rates of achievements of the strategic objectives:
• Growth rates of meat per capita consumption;
• Price trends on the domestic market and sub-regional pricing structure per actor of
the value chain;
• Availability of a desk for livestock statistics.
6.5.3.3 Operational and invest plan
The operational and invest plan includes the stakeholders involved and the timeframe for each
strategic objective.

Page 55 / 82
Table 12: Operational and Investment plan for Promotion of the products
BUDGET
(in RWF)*106 STAKEHOLDERS 2012 2013 2014 2015 2016 2017 PRIORITY
RWANDA CONTRIBUTION
PRIVATE SECTOR CONTRIBUTION
PARTNERS of
DEVELOPMENT
CONTRIBUTION
Establish a livestock statistic desk with real-time market information on livestock and livestock products
50 MINAGRI/RAB, G.D
of SP and PC SHORT TERM
10 - 40
Subsidize producer's costs of obtaining quality certifications
360 MINAGRI/RAB,
RBS, RDB LONG TERM
50 150 160
Harmonize quality standards of livestock products with the EAC region
15 MINAGRI/RAB, RBS, MINICOM,
RDB
SHORT TERM
15 - -
Establishment and support of consumers' associations
10
MINAGRI, RAB, Coop (SATRA,
SABAN), Professional
Organisations
LONG TERM
7 3 -
Strengthening the ability of meat sellers (animal traceability, meat grading, contracting for meat purchase and sale)
50 MINAGRI/RAB, Coop (SATRA,
SABAN)
LONG TERM
20 - 30
Advertisement campaigns to fight food taboos and promote food security
120 MINAGRI/RAB,
RTV LONG TERM
10 30 80
Promoting labels for Rwandan meat products (including Inyambo meat)
50 MINAGRI/RAB, MINICOM, RBS
LONG TERM
5 30 15
Annual report of meat consumption in Rwanda
24
MINAGRI, RAB, Professional
organisations, RBS, Consumer Associations,
MINICOM
LONG TERM
5 4 15
Geo-mapping of all infrastructures involved in the industry (Abattoirs, markets…)
50 MINAGRI/RAB
SHORT TERM
20 - 30
Source: Dr Papa Ndary NIANG, 2012

Page 56 / 82
SUMMARY TABLES
Table 13: Operational and Investment plan- Short term
BUDGET
(in RWF)*106 STAKEHOLDERS
2012
2013
2014
2015
2016
2017
RWANDA CONTRIBU
TION
PRIVATE SECTOR
CONTRIBUTION
PARTNERS of
DEVELOPMENT
CONTRIBUTION
Business Plan for implementation of fattening farms
25 MINAGRI
5
20
Establish a livestock statistic desk with real-time market information on livestock and livestock products
50 MINAGRI/RAB, G.D of SP
and PC 10 - 40
Business Plan for the implementation of modern slaughterhouses
25 MINAGRI/RAB
5 - 20
Harmonize quality standards of livestock products with the EAC region
15 MINAGRI/RAB, RBS,
MINICOM, RDB 15 - -
Geo-mapping of all infrastructures involved in the industry (Abattoirs, markets…)
50 MINAGRI/RAB
20 - 30
Transversal action: Coaching for the implementation of the operational action plan
50 MINAGRI/RAB,
PARTNERS 25 - 25
Source: Dr Papa Ndary NIANG, 2012

Page 57 / 82
Table 14: Operational and Investment plan- Medium term
BUDGET
(in RWF) *106
STAKEHOLDERS 201
2 201
3 201
4 201
5 201
6 201
7
RWANDA CONTRIBUTI
ON
PRIVATE SECTOR
CONTRIBUTION
PARTNERS of
DEVELOPMENT
CONTRIBUTION
Capacity building for research scientists (nutrition, animal health, genetics…)
400 MINAGRI/RAB
150 - 250
Capacity building of agents in charge of control of slaughterhouses
20 MINAGRI/RAB
5 - 15
Capacity building for the Veterinary Services (equipements)
600 MINAGRI/RAB
180 - 420
Upgraded the laboratory of food security 200 MINAGRI/RAB/RBS
50 - 150
Upgrading the laboratory of the veterinary services to level 3
400 MINAGRI/RAB/ VET SERVICES
120 - 280
Strengthen the sanitary, phytosanitary and food safety system
20 MINAGRI/RAB/RBS
10 - 10
Contests of best breeders, annual livestock exhibition
250 MINAGRI/RAB, RTV
50 50 150
New Animal Heath Policy 25 MINAGRI/RAB/ VET SERVICES
7.5 - 17.5
Development of Guidelines for good hygiene practice Hygiene of meat for slaughter - Design, preparation and dissemination practices
50 MINAGRI/RAB/RBS
15 - 35
Recovery of animal feed factory in PPP (participation in the capital)
500 MINAGRI/RAB, RDB, RPIA
100 300 100
Quantification of crop residues 100 MINAGRI/RAB, (Department of
Statistics) 20
80
Determination of feeding values of feed resources 100 MINAGRI/RAB, Consultants
30
70
Transversal action: Coaching for the implementation of the operational action plan
50 MINAGRI/RAB, PARTNERS
25 - 25
Source: Dr Papa Ndary NIANG, 2012
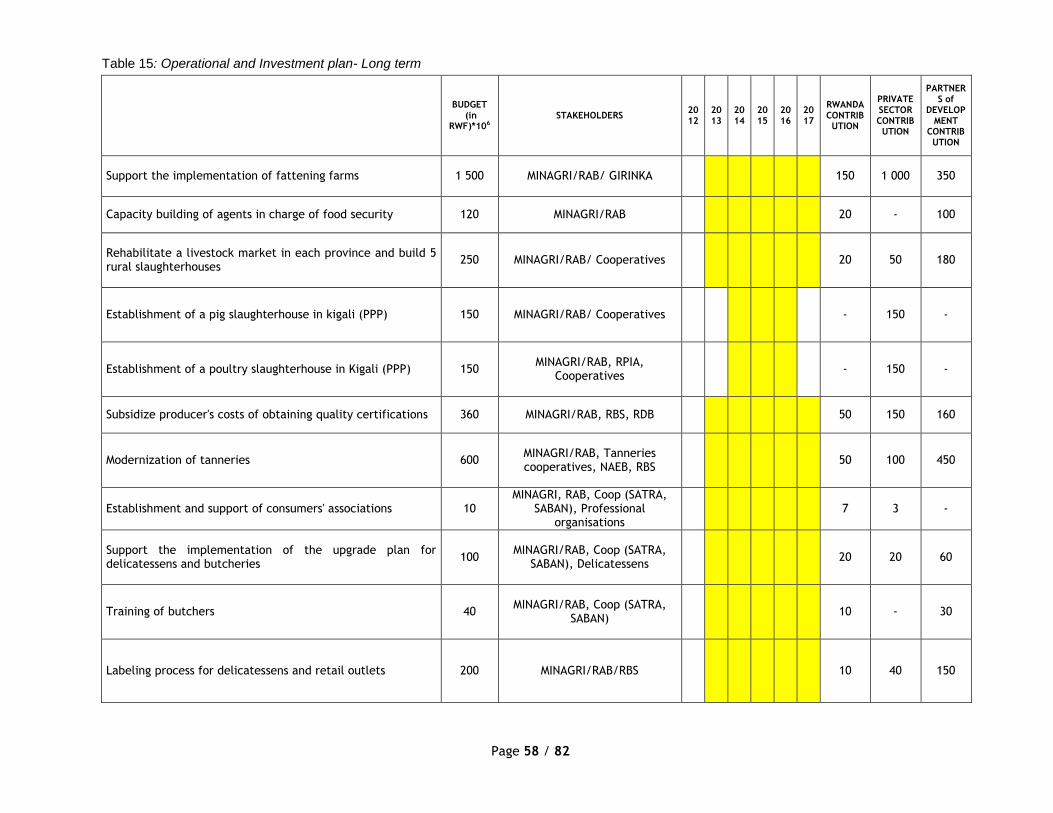
Page 58 / 82
Table 15: Operational and Investment plan- Long term
BUDGET (in
RWF)*106 STAKEHOLDERS
2012
2013
2014
2015
2016
2017
RWANDA CONTRIBUTION
PRIVATE SECTOR CONTRIBUTION
PARTNERS of
DEVELOPMENT
CONTRIBUTION
Support the implementation of fattening farms 1 500 MINAGRI/RAB/ GIRINKA
150 1 000 350
Capacity building of agents in charge of food security 120 MINAGRI/RAB
20 - 100
Rehabilitate a livestock market in each province and build 5 rural slaughterhouses
250 MINAGRI/RAB/ Cooperatives
20 50 180
Establishment of a pig slaughterhouse in kigali (PPP) 150 MINAGRI/RAB/ Cooperatives
- 150 -
Establishment of a poultry slaughterhouse in Kigali (PPP) 150 MINAGRI/RAB, RPIA,
Cooperatives - 150 -
Subsidize producer's costs of obtaining quality certifications 360 MINAGRI/RAB, RBS, RDB
50 150 160
Modernization of tanneries 600 MINAGRI/RAB, Tanneries cooperatives, NAEB, RBS
50 100 450
Establishment and support of consumers' associations 10 MINAGRI, RAB, Coop (SATRA,
SABAN), Professional organisations
7 3 -
Support the implementation of the upgrade plan for delicatessens and butcheries
100 MINAGRI/RAB, Coop (SATRA,
SABAN), Delicatessens 20 20 60
Training of butchers 40 MINAGRI/RAB, Coop (SATRA,
SABAN) 10 - 30
Labeling process for delicatessens and retail outlets 200 MINAGRI/RAB/RBS
10 40 150
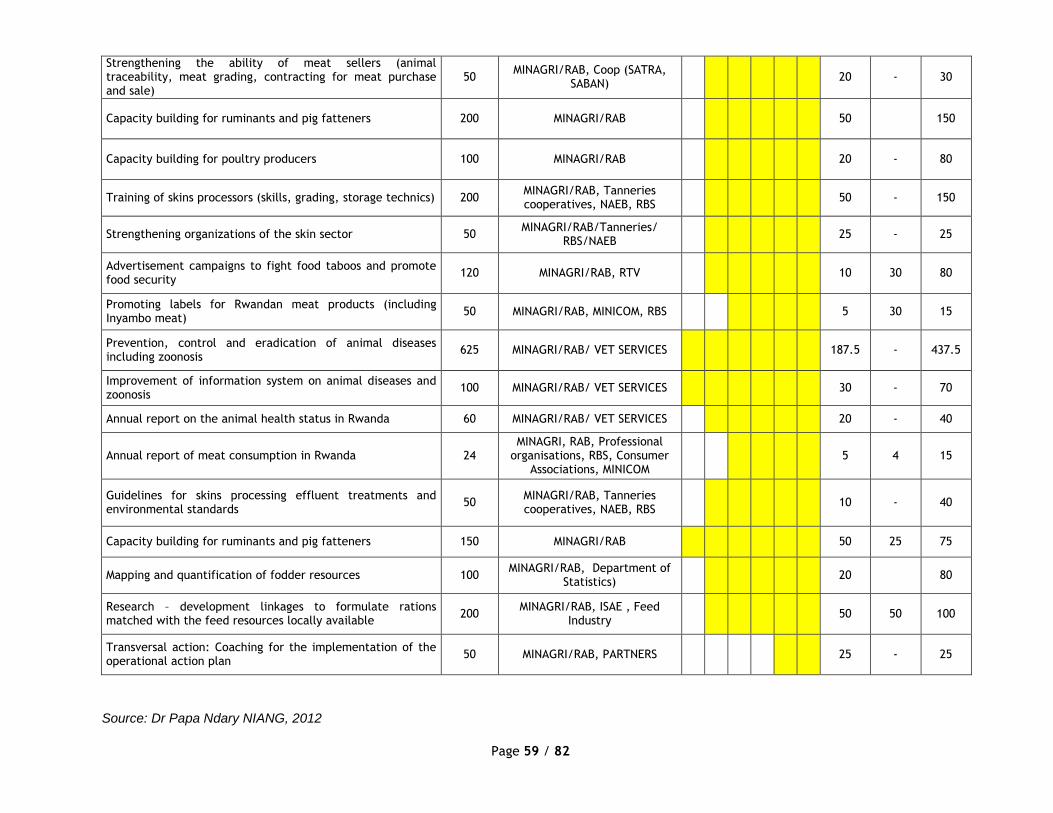
Page 59 / 82
Strengthening the ability of meat sellers (animal traceability, meat grading, contracting for meat purchase and sale)
50 MINAGRI/RAB, Coop (SATRA,
SABAN) 20 - 30
Capacity building for ruminants and pig fatteners 200 MINAGRI/RAB
50
150
Capacity building for poultry producers 100 MINAGRI/RAB
20 - 80
Training of skins processors (skills, grading, storage technics) 200 MINAGRI/RAB, Tanneries cooperatives, NAEB, RBS
50 - 150
Strengthening organizations of the skin sector 50 MINAGRI/RAB/Tanneries/
RBS/NAEB 25 - 25
Advertisement campaigns to fight food taboos and promote food security
120 MINAGRI/RAB, RTV
10 30 80
Promoting labels for Rwandan meat products (including Inyambo meat)
50 MINAGRI/RAB, MINICOM, RBS
5 30 15
Prevention, control and eradication of animal diseases including zoonosis
625 MINAGRI/RAB/ VET SERVICES
187.5 - 437.5
Improvement of information system on animal diseases and zoonosis
100 MINAGRI/RAB/ VET SERVICES
30 - 70
Annual report on the animal health status in Rwanda 60 MINAGRI/RAB/ VET SERVICES
20 - 40
Annual report of meat consumption in Rwanda 24 MINAGRI, RAB, Professional
organisations, RBS, Consumer Associations, MINICOM
5 4 15
Guidelines for skins processing effluent treatments and environmental standards
50 MINAGRI/RAB, Tanneries cooperatives, NAEB, RBS
10 - 40
Capacity building for ruminants and pig fatteners 150 MINAGRI/RAB
50 25 75
Mapping and quantification of fodder resources 100 MINAGRI/RAB, Department of
Statistics) 20
80
Research – development linkages to formulate rations matched with the feed resources locally available
200 MINAGRI/RAB, ISAE , Feed
Industry 50 50 100
Transversal action: Coaching for the implementation of the operational action plan
50 MINAGRI/RAB, PARTNERS
25 - 25
Source: Dr Papa Ndary NIANG, 2012
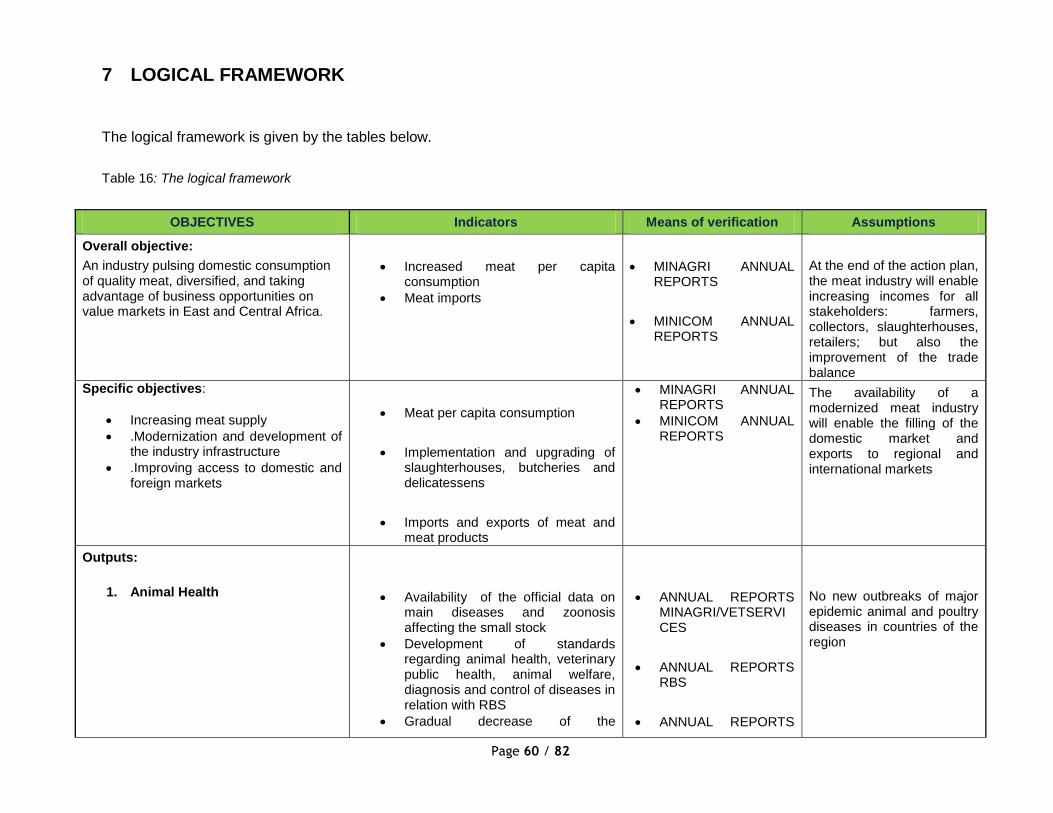
Page 60 / 82
7 LOGICAL FRAMEWORK
The logical framework is given by the tables below.
Table 16: The logical framework
OBJECTIVES Indicators Means of verification Assumptions
Overall objective:
An industry pulsing domestic consumption of quality meat, diversified, and taking advantage of business opportunities on value markets in East and Central Africa.
Increased meat per capita consumption
Meat imports
MINAGRI ANNUAL REPORTS
MINICOM ANNUAL REPORTS
At the end of the action plan, the meat industry will enable increasing incomes for all stakeholders: farmers, collectors, slaughterhouses, retailers; but also the improvement of the trade balance
Specific objectives:
Increasing meat supply
.Modernization and development of the industry infrastructure
.Improving access to domestic and foreign markets
Meat per capita consumption
Implementation and upgrading of slaughterhouses, butcheries and delicatessens
Imports and exports of meat and meat products
MINAGRI ANNUAL REPORTS
MINICOM ANNUAL REPORTS
The availability of a modernized meat industry will enable the filling of the domestic market and exports to regional and international markets
Outputs:
1. Animal Health
Availability of the official data on main diseases and zoonosis affecting the small stock
Development of standards regarding animal health, veterinary public health, animal welfare, diagnosis and control of diseases in relation with RBS
Gradual decrease of the
ANNUAL REPORTS MINAGRI/VETSERVICES
ANNUAL REPORTS RBS
ANNUAL REPORTS
No new outbreaks of major epidemic animal and poultry diseases in countries of the region
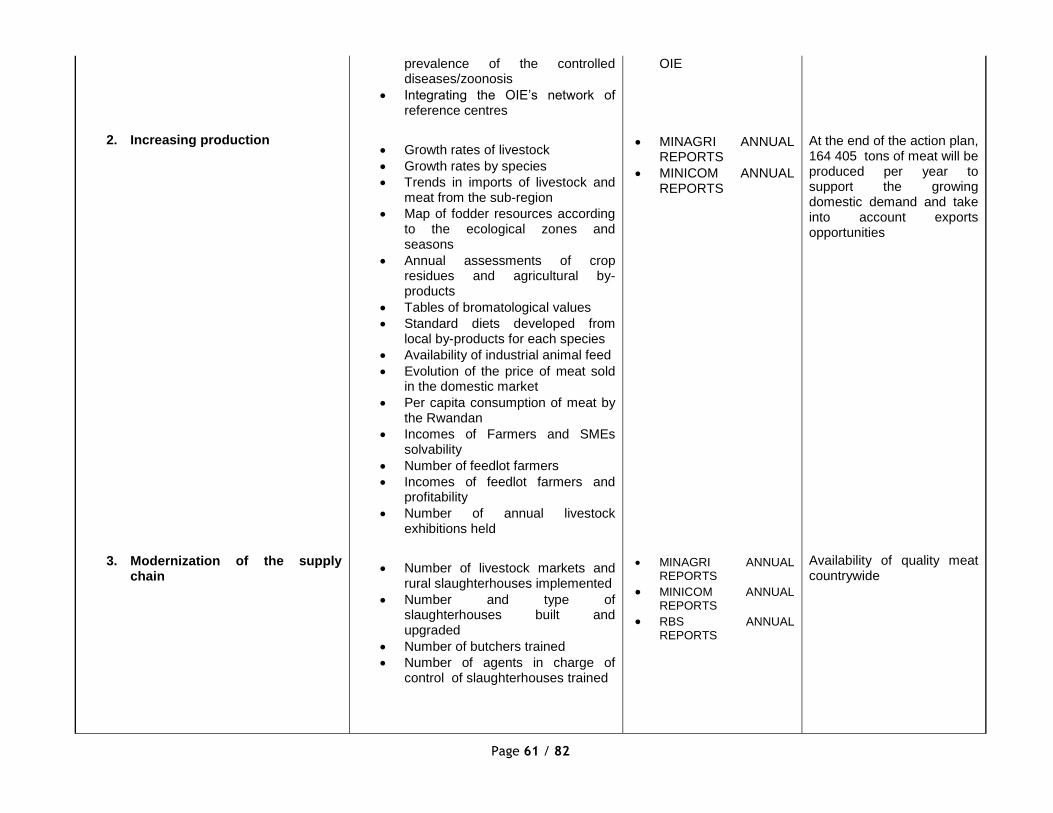
Page 61 / 82
2. Increasing production
3. Modernization of the supply chain
prevalence of the controlled diseases/zoonosis
Integrating the OIE’s network of reference centres
Growth rates of livestock
Growth rates by species
Trends in imports of livestock and meat from the sub-region
Map of fodder resources according to the ecological zones and seasons
Annual assessments of crop residues and agricultural by-products
Tables of bromatological values
Standard diets developed from local by-products for each species
Availability of industrial animal feed
Evolution of the price of meat sold in the domestic market
Per capita consumption of meat by the Rwandan
Incomes of Farmers and SMEs solvability
Number of feedlot farmers
Incomes of feedlot farmers and profitability
Number of annual livestock exhibitions held
Number of livestock markets and rural slaughterhouses implemented
Number and type of slaughterhouses built and upgraded
Number of butchers trained
Number of agents in charge of control of slaughterhouses trained
OIE
MINAGRI ANNUAL REPORTS
MINICOM ANNUAL REPORTS
MINAGRI ANNUAL
REPORTS
MINICOM ANNUAL REPORTS
RBS ANNUAL REPORTS
At the end of the action plan, 164 405 tons of meat will be produced per year to support the growing domestic demand and take into account exports opportunities
Availability of quality meat countrywide
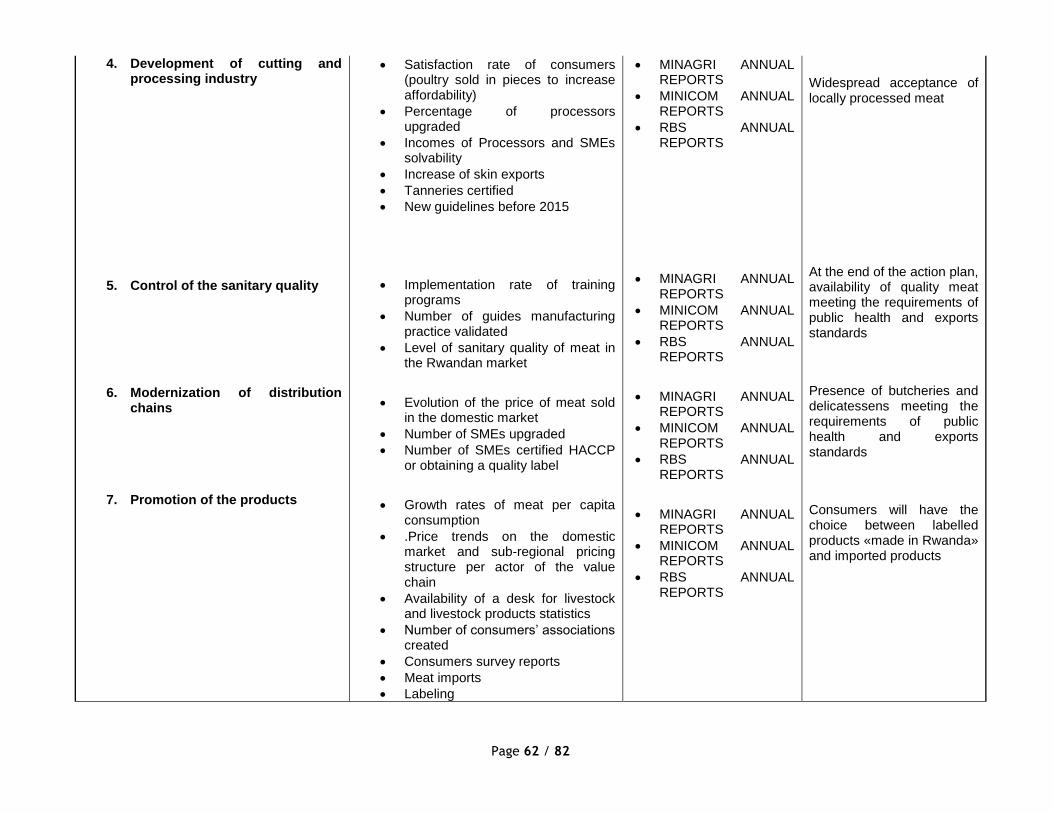
Page 62 / 82
4. Development of cutting and processing industry
5. Control of the sanitary quality
6. Modernization of distribution chains
7. Promotion of the products
Satisfaction rate of consumers (poultry sold in pieces to increase affordability)
Percentage of processors upgraded
Incomes of Processors and SMEs solvability
Increase of skin exports
Tanneries certified
New guidelines before 2015
Implementation rate of training programs
Number of guides manufacturing practice validated
Level of sanitary quality of meat in the Rwandan market
Evolution of the price of meat sold in the domestic market
Number of SMEs upgraded
Number of SMEs certified HACCP or obtaining a quality label
Growth rates of meat per capita consumption
.Price trends on the domestic market and sub-regional pricing structure per actor of the value chain
Availability of a desk for livestock and livestock products statistics
Number of consumers’ associations created
Consumers survey reports
Meat imports
Labeling
MINAGRI ANNUAL REPORTS
MINICOM ANNUAL REPORTS
RBS ANNUAL REPORTS
MINAGRI ANNUAL REPORTS
MINICOM ANNUAL REPORTS
RBS ANNUAL REPORTS
MINAGRI ANNUAL REPORTS
MINICOM ANNUAL REPORTS
RBS ANNUAL REPORTS
MINAGRI ANNUAL REPORTS
MINICOM ANNUAL REPORTS
RBS ANNUAL REPORTS
Widespread acceptance of locally processed meat
At the end of the action plan, availability of quality meat meeting the requirements of public health and exports standards
Presence of butcheries and delicatessens meeting the requirements of public health and exports standards
Consumers will have the choice between labelled products «made in Rwanda» and imported products

Page 63 / 82
ACTIVITIES BUDGETS STARTING CONDITIONS
Output 1: Operational and Investment plan for Animal Health
1.1. Capacity building for research scientists (nutrition, animal health, genetics…)
1.2. Capacity building for the Veterinary Services (equipment)
1.3. Upgrading the laboratory of the veterinary services to level 3
1.4. Prevention, control and eradication of animal diseases including zoonosis
1.5. Improvement of information system on animal diseases and zoonosis
1.6. New Animal health policy 1.7. Annual report on the animal
health status in Rwanda
Output 2: Operational and Investment plan for Increasing Meat production
2.1. Business Plan for implementation of fattening farms
2.2. Support the implementation of fattening farms
2.3. Capacity building for ruminants and pig fatteners
2.4. Capacity building for poultry producers
2.5. Contests of best breeders, annual livestock exhibition
2.6. Recovery of animal feed factory in PPP (participation in
7 984 000 000 RWF
2 125 000 000 RWF
400 000 000
600 000 000
400 000 000
625 000 000
100 000 000
25 000 000
60 000 000
2 925 000 000 RWF
25 000 000
1 500 000 000
200 000 000
100 000 000
250 000 000
500 000 000
Harmonization of the 3 Action Plans: «Meat industry strategy»; «Small animal industry strategy» and «Poultry industry strategy»
Communication plan of the strategy with stakeholders, authorities and development partners which support 34% of the budget
Calls for expressions of interest to select the private investors, which support 52% of the budget
Deposit of the government counterpart (14%)
Implementation of operational action plan through coaching (regular meetings, monitoring and evaluation, strategic dashboard). this component could be done in collaboration with a consultancy firm
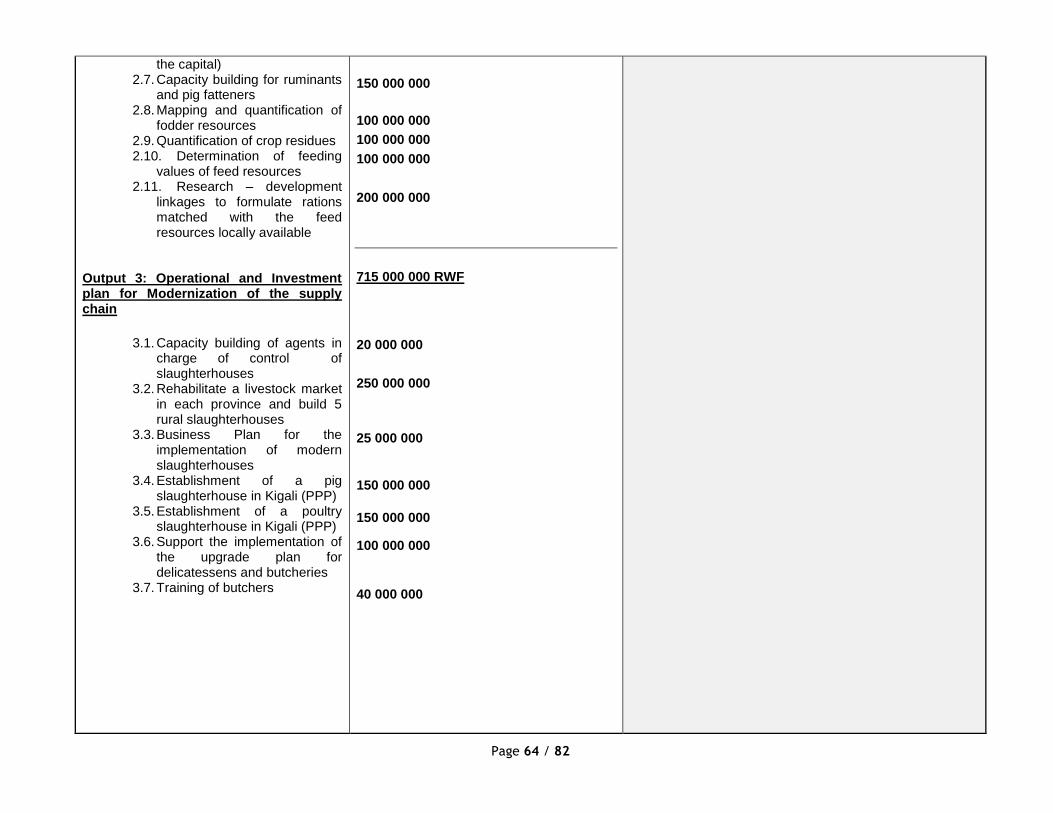
Page 64 / 82
the capital) 2.7. Capacity building for ruminants
and pig fatteners 2.8. Mapping and quantification of
fodder resources 2.9. Quantification of crop residues 2.10. Determination of feeding
values of feed resources 2.11. Research – development
linkages to formulate rations matched with the feed resources locally available
Output 3: Operational and Investment plan for Modernization of the supply chain
3.1. Capacity building of agents in charge of control of slaughterhouses
3.2. Rehabilitate a livestock market in each province and build 5 rural slaughterhouses
3.3. Business Plan for the implementation of modern slaughterhouses
3.4. Establishment of a pig slaughterhouse in Kigali (PPP)
3.5. Establishment of a poultry slaughterhouse in Kigali (PPP)
3.6. Support the implementation of the upgrade plan for delicatessens and butcheries
3.7. Training of butchers
150 000 000
100 000 000
100 000 000
100 000 000
200 000 000
715 000 000 RWF
20 000 000
250 000 000
25 000 000
150 000 000
150 000 000
100 000 000
40 000 000
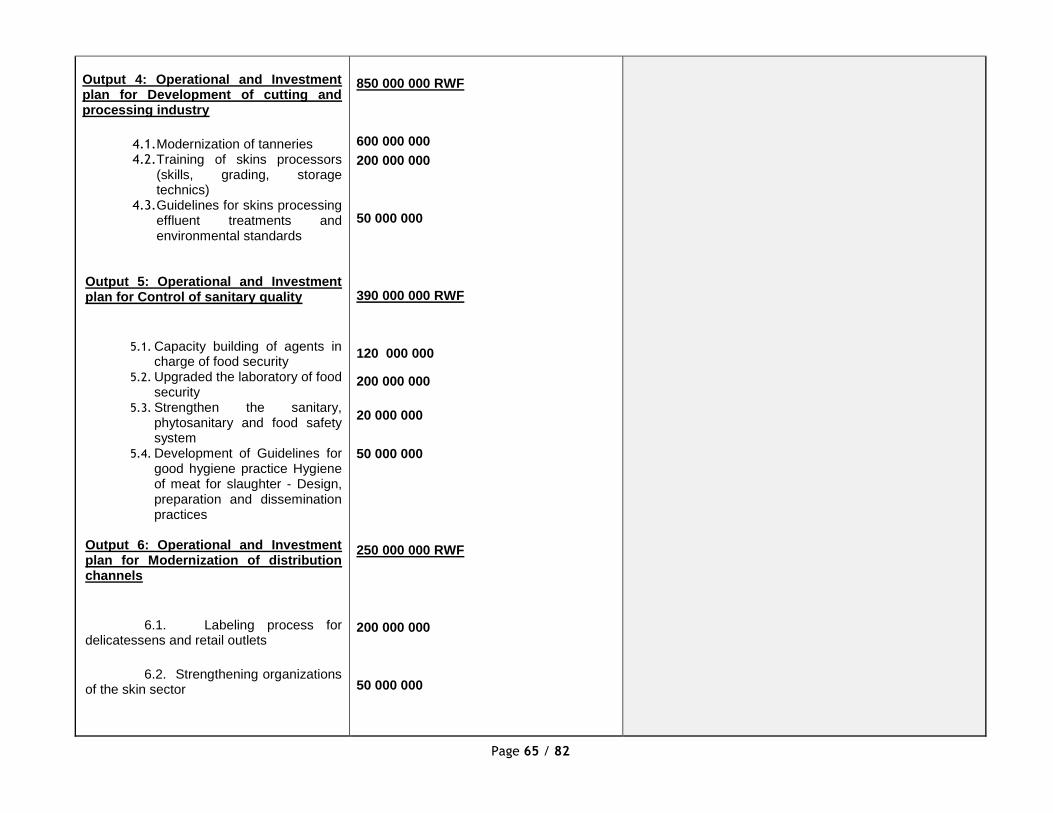
Page 65 / 82
Output 4: Operational and Investment plan for Development of cutting and processing industry
4.1. Modernization of tanneries 4.2. Training of skins processors
(skills, grading, storage technics)
4.3. Guidelines for skins processing effluent treatments and environmental standards
Output 5: Operational and Investment plan for Control of sanitary quality
5.1. Capacity building of agents in charge of food security
5.2. Upgraded the laboratory of food security
5.3. Strengthen the sanitary, phytosanitary and food safety system
5.4. Development of Guidelines for good hygiene practice Hygiene of meat for slaughter - Design, preparation and dissemination practices
Output 6: Operational and Investment plan for Modernization of distribution channels
6.1. Labeling process for delicatessens and retail outlets
6.2. Strengthening organizations of the skin sector
850 000 000 RWF
600 000 000
200 000 000
50 000 000
390 000 000 RWF
120 000 000
200 000 000
20 000 000
50 000 000
250 000 000 RWF
200 000 000
50 000 000

Page 66 / 82
Output 7: Operational and Investment plan for Promotion of the products
7.1. Establish a livestock statistic desk with real-time market information on livestock and livestock products
7.2. Subsidize producer's costs of obtaining quality certifications
7.3. Harmonize quality standards of livestock products with the EAC region
7.4. Establishment and support of consumers' associations
7.5. Strengthening the ability of meat sellers (animal traceability, meat grading, contracting for meat purchase and sale)
7.6. Advertisement campaigns to fight food taboos and promote food security
7.7. Promoting labels for Rwandan meat products (including Inyambo meat)
7.8. Annual report of meat consumption in Rwanda
7.9. Geo-mapping of all infrastructures involved in the industry (Abattoirs, markets…)
Output 8: Transversal action: coaching of the Action Plan
729 000 000 RWF
50 000 000
360 000 000
15 000 000
10 000 000
50 000 000
120 000 000
50 000 000
24 000 000
50 000 000
150 000 000 RWF
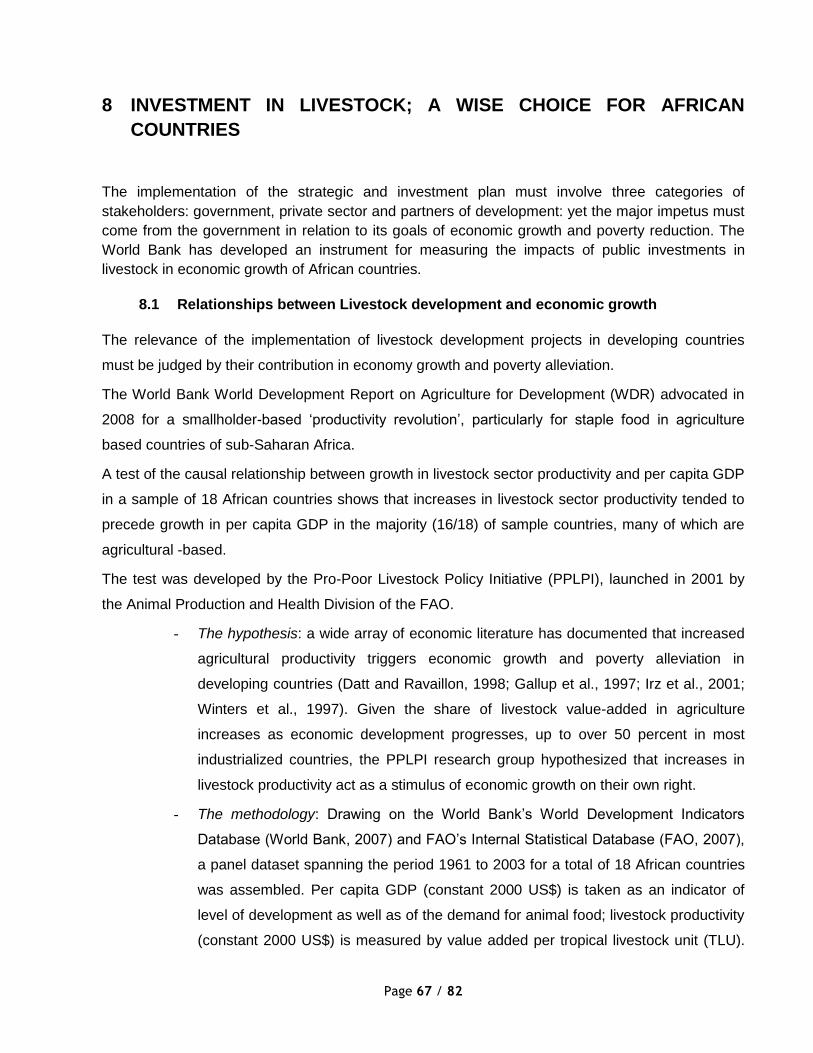
Page 67 / 82
8 INVESTMENT IN LIVESTOCK; A WISE CHOICE FOR AFRICAN
COUNTRIES
The implementation of the strategic and investment plan must involve three categories of
stakeholders: government, private sector and partners of development: yet the major impetus must
come from the government in relation to its goals of economic growth and poverty reduction. The
World Bank has developed an instrument for measuring the impacts of public investments in
livestock in economic growth of African countries.
8.1 Relationships between Livestock development and economic growth
The relevance of the implementation of livestock development projects in developing countries
must be judged by their contribution in economy growth and poverty alleviation.
The World Bank World Development Report on Agriculture for Development (WDR) advocated in
2008 for a smallholder-based ‘productivity revolution’, particularly for staple food in agriculture
based countries of sub-Saharan Africa.
A test of the causal relationship between growth in livestock sector productivity and per capita GDP
in a sample of 18 African countries shows that increases in livestock sector productivity tended to
precede growth in per capita GDP in the majority (16/18) of sample countries, many of which are
agricultural -based.
The test was developed by the Pro-Poor Livestock Policy Initiative (PPLPI), launched in 2001 by
the Animal Production and Health Division of the FAO.
- The hypothesis: a wide array of economic literature has documented that increased
agricultural productivity triggers economic growth and poverty alleviation in
developing countries (Datt and Ravaillon, 1998; Gallup et al., 1997; Irz et al., 2001;
Winters et al., 1997). Given the share of livestock value-added in agriculture
increases as economic development progresses, up to over 50 percent in most
industrialized countries, the PPLPI research group hypothesized that increases in
livestock productivity act as a stimulus of economic growth on their own right.
- The methodology: Drawing on the World Bank’s World Development Indicators
Database (World Bank, 2007) and FAO’s Internal Statistical Database (FAO, 2007),
a panel dataset spanning the period 1961 to 2003 for a total of 18 African countries
was assembled. Per capita GDP (constant 2000 US$) is taken as an indicator of
level of development as well as of the demand for animal food; livestock productivity
(constant 2000 US$) is measured by value added per tropical livestock unit (TLU).

Page 68 / 82
To trace the causality between GDP growth and livestock productivity Granger
causality test (1969) was used and the methodology developed by Toda and
Yamamoto (1995) applied (See Appendix 1).
- The results: The following table summarizes the empirical results for the African
countries in which a significant relationship (at 5 percent level) was found between
GDP growth and livestock productivity growth.
Table 17: Countries exhibiting causality between growth of livestock productivity (VA) and growth in per capita GDP
Country Livestock VA
GDP GDP Livestock VA
Stat. Prob. Stat. Prob.
Burundi** 9.48 0.01 22.31 0.00
Central African Rep.*
4.56 0.03 1.62 0.20
Congo DRep.* 53.13 0.00 1.76 0.62
Congo rep.* 4.06 0.04 1.12 0.29
Gambia* 13.09 0.00 3.08 0.21
Guinea Bissau* 39.88 0.00 1.10 0.58
Ghana* 15.14 0.00 2.57 0.28
Kenya* 8.90 0.01 1.63 0.44
Lesotho* 9.21 0.01 0.59 0.74
Madagascar* 7.22 0.03 1.87 0.39
Malawi** 41.39 0.00 9.63 0.01
Niger* 40.54 0.00 12.77 0.00
Nigeria** 21.13 0.00 7.64 0.02
Senegal* 8.83 0.00 0.67 0.41
South Africa** 8.25 0.02 6.85 0.03
Sudan* 18.71 0.00 1.04 0.6
Togo*** 0.43 0.51 4.22 0.04
Zambia*** 0.99 0.61 6.20 0.05
* Countries exhibiting causality from growth of livestock productivity to growth in per capita GDP; ** countries exhibiting bi-directional causality; *** countries exhibiting causality from growth in per capita GDP to growth in livestock productivity
In 16 of the 18 countries analyzed, that is in almost 90 percent of the sample, a statistically
significant causal relationship was found between livestock sector development and economic
growth. Almost all these countries are agricultural-based. In 16 of the 18 countries in which a
statistically significant relationship was found, livestock sector development appears to be / have
been a driver of per capita GDP growth; in four of these countries a bi-directional causality was
also found. Only in two countries (Togo, Zambia), increases in livestock sector productivity appear

Page 69 / 82
to be / have been driven by per capita GDP growth.
8.2 Findings and policy implications
The finding that increases in livestock sector productivity are associated with economic growth in
16 of the 18 countries in which a statistically significant relationship was found appears plausible.
There is a large body of economic literature which shows that increased agricultural productivity is
anticipated to lead to lower food prices that directly benefit the poor and also generate a surplus of
products and factors that can be exported from agriculture to the rest of the economy, thereby
facilitating economic growth and poverty alleviation. Historical evidence largely supports this
hypothesis. First, globally prices for agricultural products, including those of livestock products,
have declined by about 0.5 to 0.7 percent per year relative to those of other goods since 1900
(Mundlak, 1990), though some major increases have been recorded in the last years. Second, a
number of studies have empirically documented that agricultural growth supports broad-based
economic growth. Timmer (2002) finds that over the period 1960 to 1985 in a sample of 65
developing countries past growth in agricultural GDP has a significant impact on current non-
agricultural sector growth; Bravo-Ortega and Lederman (2005) replicate the analysis by Timmer for
the 1960 to 2000 period and obtain similar results, although they find some heterogeneity across
regions. For instance, in the case of Latin America, the impact appears weaker than in the case of
other developing regions, such as in our results. They also find a significant impact of non-
agricultural growth rates on agricultural growth, which suggests that the causality can run both
ways. Tiffin and Irz (2006) test for the direction of causality between agricultural value-added per
worker and gross domestic product in 85 countries and conclude that agricultural value-added is
the ‘causal’ variable in the majority of developing countries, such as our results suggest too.
Overall, PPLPI findings indicate that the orthodox paradigm of increased agricultural productivity
being a driver of economic growth in developing countries also applies to the livestock sector on its
own right, possibly because of the increased contribution to the sector in agricultural value added
along the process of economic development. The implications of these findings are that the WDR’s
vision of the livestock sector as primarily driven by exogenous demand factors can be misleading in
terms of policy conclusions. Whereas some priority should certainly be given to policies which allow
smallholders to profitable sell meat and milk in high-value markets, policies which address the
fundamental constraints to livestock sector development, such as for instance inadequate access
to forage, water and basic animal health services appear equally relevant.
In others words, the productivity revolution the WDR envisages for smallholder farmers should not
Page 70 / 82
only include basic staples but also livestock products, which are not only high-value products for
better-off consumers but also basic food items for many rural communities in developing countries.
8.3 Appendix
Granger (1969) defined a simple concept of causality by which a cause has to precede the effect: if
per capita GDP growth affects productivity in the livestock sector, knowledge of the former should
improve predictions of the latter (or vice versa). To avoid issues related to non-stationarity and co-
integration, we apply the methodology developed by Toda and Yamamoto (1995) who showed that,
irrespective of whether the variables involved are stationary or not and regardless of the existence
of a co-integrating relationship among them, tests for Granger non-causality can be performed by
estimating a Vector Autoregression Model VAR(p + dmax), where p is the optimal lag length in the
original VAR system and dmax is the maximum order of unit roots in the variables of the model.
The following VAR model are estimated:
gdpt = α11 gdpt-1 + ... + α1d gdpt-d + β11 livet-1 + ... + β1d livet-d + ε1t (1)
livet = α21 livet-1 + ... + α2d livet-d + β21 gdpt-1 + ... + β2d gdpt-d + ε2t (2)
where gdpt is per capita GDP in year t; livet is livestock value added per TLU in year t; d = p + dmax
is the number of time lags included in the model; εt is the error term. The Granger non-causality
test is a modified Wald test on the parameters of the true VAR (p) model, i.e. it involves testing
βi1=βi2=…=βip=0 for each equation with the remaining dmax parameters regarded as zeros. This test
has an asymptotic χ2 distribution when the augmented VAR (p + dmax) is estimated. Estimating the
above VAR requires three steps. First, Augmented Dickey Fuller (ADF) tests was used with trends
to determine the number of units roots for both GDP and livestock productivity in the sample
countries. The Schwarz Information Criterion (SIC) is used to determine the lag structures in the
ADF tests. Second, the Akaike's Final Prediction Error (FPE) criterion was used to select the
optimal lag length in the VAR models for each sample country. Finally, Seemingly Unrelated
Regressions (SUR) are used to estimate the VAR systems and perform the modified Wald tests on
the relevant coefficients, as these tests experience efficiency improvement when SUR models are
used in the estimation (Rambaldi and Doran, 1996). The null hypotheses are tested at the 5
percent significance level.
Page 71 / 82
9 BIBLIOGRAPHY
1. A. LEE WILLINGHAM, MARIA V. JOHANSEN, STIGTHAMSBORG, Securing Rural Livelihoods
through Improved Smallholder Pig Production in Eastern and Southern Africa. Section for
Parasitology, Health and Development, Faculty of Life Sciences, University of Copenhagen
Frederiksberg, Denmark and The Cysticercosis Working Group for Eastern and Southern Africa.
2. ABU O.A., ONIFADE A.A., ABANIKANNDA O.T.F., OBIYAN R.I, Status and promotional strategies
for rabbit production in Nigeria. 9th World Rabbit Congress – June 10-13, 2008 – Verona – Italy.
3. AFRICAN UNION INTERAFRICAN BUREAU FOR ANIMAL RESOURCES, Strategic plan 2010-
2014, December 2009, Nairobi, Kenya
4. AFRIQUE EMERGENCE CONSEIL Senegal Ministry of Livestock. Strategic and investment plan
2011-2018 to strenghten Poultry value chain in Senegal.
5. AUSTRALIA'S RED - MEAT AND LIVESTOCK INDUSTRY, Meat industry strategic plan 2010-
2015.
6. AVITALIA, unione nazionale associazioni du produttori avicunicoli, Production and world
market: the rabbit in the European Union.
7. AYYAT MS, MARAI I.F.M, Evaluation of application of the intensive rabbit production system under
the sub-tropical conditions of Egypt, World rabbit science, vol 6 (1) 213-217, 1998
8. BC FOOD PROCESSORS ASSOCIATION, Strategic Plan for Sustainable Food Safety for BC Post
licensing transition: the meat sector and beyond 2011 – 2013, 25 July 2011.
9. BISTER Jean-Loup, Genetic improvement strategy of small stock. Final Report, 2010.
10. BRUINSMA JELLE, World agriculture: towards 2015/2030 AN FAO PERSPECTIVE, FAO 2003.
11. BUTERA Jean-Bosco & RUTAGWENDA Theogen, MINAGRI GECAD, Plan stratégique de
transformation de l’agriculture au Rwanda, Animal production sub-sector, 2004.
12. CANADIAN SHEEP FEDERATION, Supplemental Application for Other Ruminants .Market
Development Program 2005-2006,Market Development Strategy, September 30, 2005.
13. CHEEKE P. R., OREGON STATE UNIVERSITY, Potentials of rabbit production in tropical and
subtropical agricultural systems, Corvallis 97331-6702. J. Anim. Sci. 1986.63:1581—1586.
14. CHEEKE P.R, Feeding system for tropical rabbit production emphasizing roots, tubers and bananas,
1986.
15. CIRAD, Production, health and marketing in Botswana. Monitoring production, health and marketing
of indigenous Tswana pigs in Ramotswa village of Botswana, 2011.
16. CLARKE MICHAEL, Poultry Industries Research, Development and Extension Strategy. A national
assessment of capabilities to ensure innovation that improves productivity and delivers public good
outcomes, 15 March 2010.
17. COTTRILL KEVIN, Chief executive officer, Meat Industry Strategic Plan 2010-2015, RMAC board
final, version 5.0 (5/6/2009), AMIC (Australian Meat Industry Council).
18. DAI PETERS, Improving Small-scale Livestock Production in Developing Countries: The Case of Pig
Production in Northern Vietnam, The international potato center, October 1997.

Page 72 / 82
19. DJEMALI. M , INAT, 43 Avenue Charles Nicole, 1083 Mahrajène, Tunis, Tunisia, Genetic
improvement objectives of sheep and goats in Tunisia. Lessons learned, CIHEAM - Options
Mediterranean's.
20. DUVERGE ANNE, Quel avenir pour la filière viande bovine du Sénégal, étude du circuit long de la
filière de tambacounda jusqu’à dakar. 93ème promotion Stage effectué dans la région de
Tambacounda et Dakar, Sénégal Du 29/04/2006 au 02/12/2006 au sein de VSF-CICDA Maître de
stage : BALDE Moussa.
21. ETHIOPIA SHEEP AND GOAT PRODUCTIVITY IMPROVEMENT PROGRAM (ESGPIP) : Short
term intensive fattening of sheep and goats for rapid improvement in weight and condition and also
producer incomes, 2001.
22. F. LEBAS Agricultural Engineer ,P. COUDERT Veterinary Surgeon, H. DE ROCHAMBEAU
Agricultural Engineer, R.G. THÉBAULT Engineer (INRA), The rabbit Husbandry, health and
production(new revised version),FOOD AND AGRICULTURE ORGANIZATION OF THE UNITED
NATIONS Rome, 1997.
23. FAO, Development of rural poultry production, final report. Report, June 2006.
24. FUCHANG LI, Rabbit production and organization in china. College of animal science and
technology shandong agricultural university, Sept 2010.
25. HYBU CIG CYMRU Meat promotion Wales, Strategic Action Plan for the Welsh Red Meat Industry,
A profitable, efficient, sustainable and innovative Welsh red meat industry, which responds
competitively to ever changing market trends and benefits the people of Wales, 28 April 2009.
26. JOHN MALONE, Sheep industry development strategy, June 2006.
27. LEKULE FAUSTIN P., KYVSGAARD NIELS C, Improving pig husbandry in tropical resource-poor
communities and its potential to reduce risk of porcine cysticercosis. Acta Tropica 87, 2003, 111/117.
28. LOGTÉNÉ Y. MOPATÉ, KOUSSOU M.O. & KABORÉ-ZOUNGRANA C.Y, L’élevage porcin au
Tchad: Bilan de l’introduction, de l’amélioration et de la diffusion des races exotiques. AGRI 2006,
38: 87-98.
29. MINISTRY OF FINANCE AND ECONOMIC PLANNING, Rwanda vision 2020, Kigali, July 2000.
30. NATIONAL INSTITUTE OF STATISTICS OF RWANDA, GDP Annual Estimates 2010/11 based on
2006 benchmark, September 2011.
31. NATIONAL INSTITUTE OF STATISTICS OF RWANDA, Statistical yearbook 2011 edition.
32. NORTHERN IRELAND RED MEAT INDUSTRY TASK FORCE: Strategy Review, Volume 1 – Main
Report October 2007.
33. OKALI C. AND J.E. SUMBERG, Sheep and goats, men and women: household relations and small
ruminant development in southwest Nigeria. Small Ruminant Programme International Livestock
Centre for Africa , P.M.B. 5320 Ibadan, Nigeria. Paper prepared for the conference on Intra-
household Processes and Farming Systems Analysis, 5-9 MareFT984, Bel]agio, Italy.
34. PERMIN A., RIISE J.C., KRYGER, K.N, Strategies for developing family poultry production at village
level - Experiences from West Africa and Asia. Network for Smallholder Poultry Development
(NSDP), Dyrlaegevej 2, 1870 Frederiksberg, Denmark. E-mail: [email protected].
35. REPUBLIC OF RWANDA, Economic development and poverty reduction strategy 2008-2012, Sept
200.7
Page 73 / 82
36. RIU (Research into Use), Poultry sector development validation workshop. MAMBA POINT HOTEL,
WILBERFORCE, FREETOWN, 25 August 2010.
37. RWANDA POULTRY INDUSTRY ASSOCIATION, “Together we can sustain the availability of
chicken and eggs to Rwandan Population”.
38. SINGH, R.H. The global market for small ruminant meat. Sources of supply and competitiveness of the CARICOM industry. Consultancy mission. 2006.
39. PSTA II, Strategic Plan for the Transformation of Agriculture in Rwanda – Phase II, Final Report
February 2009
40. SECK, M. Influence des facteurs de l’environnement sur la mortalité avant sevrage des agneaux
Peuls et Touabire élevés en station. Thèse de Médecine Vétérinaire. Dakar, 1992.
41. VAHID OMIDVAR, DEREK G. BREWIN, JARED G. CARLBERG, University of Manitoba, Meat
Processing in North America: Successes, Failures and Opportunities. Selected Paper prepared for
presentation at the Southern Agricultural Economics Association Annual Meetings Orlando, Florida,
February 5-8, 2006.
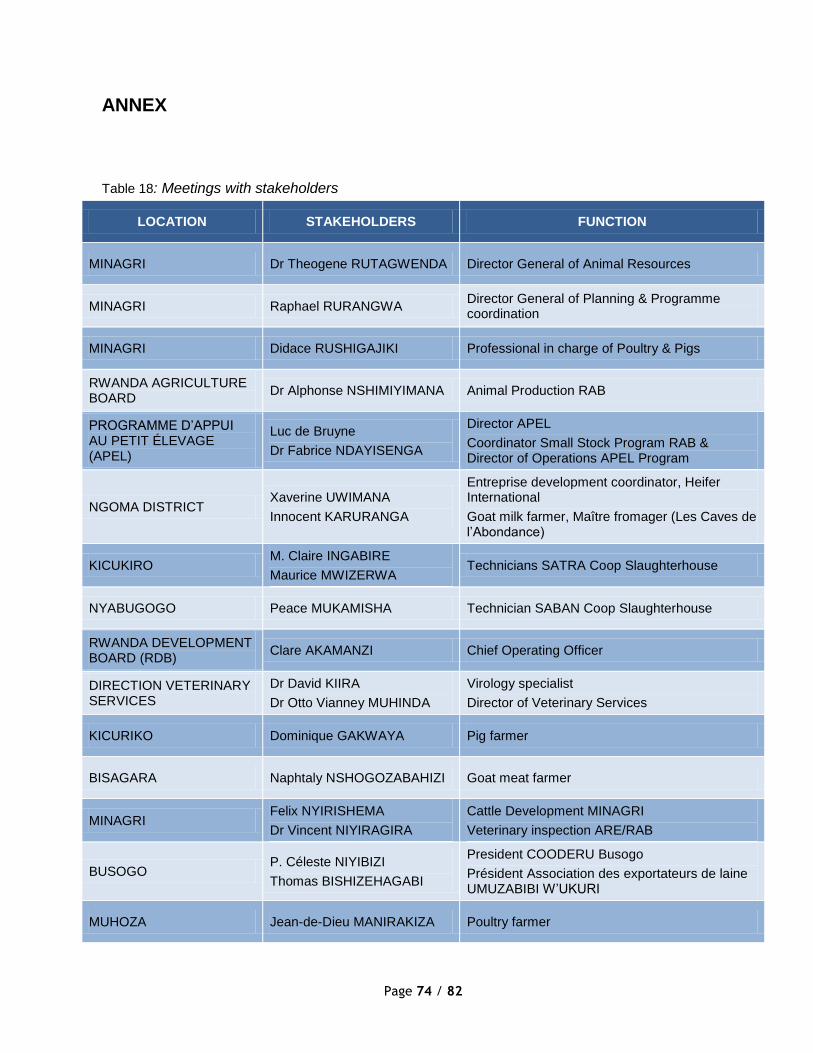
Page 74 / 82
ANNEX
Table 18: Meetings with stakeholders
LOCATION STAKEHOLDERS FUNCTION
MINAGRI Dr Theogene RUTAGWENDA Director General of Animal Resources
MINAGRI Raphael RURANGWA Director General of Planning & Programme coordination
MINAGRI Didace RUSHIGAJIKI Professional in charge of Poultry & Pigs
RWANDA AGRICULTURE BOARD
Dr Alphonse NSHIMIYIMANA Animal Production RAB
PROGRAMME D’APPUI AU PETIT ÉLEVAGE (APEL)
Luc de Bruyne
Dr Fabrice NDAYISENGA
Director APEL
Coordinator Small Stock Program RAB & Director of Operations APEL Program
NGOMA DISTRICT Xaverine UWIMANA
Innocent KARURANGA
Entreprise development coordinator, Heifer International
Goat milk farmer, Maître fromager (Les Caves de l’Abondance)
KICUKIRO M. Claire INGABIRE
Maurice MWIZERWA Technicians SATRA Coop Slaughterhouse
NYABUGOGO Peace MUKAMISHA Technician SABAN Coop Slaughterhouse
RWANDA DEVELOPMENT BOARD (RDB)
Clare AKAMANZI Chief Operating Officer
DIRECTION VETERINARY SERVICES
Dr David KIIRA
Dr Otto Vianney MUHINDA
Virology specialist
Director of Veterinary Services
KICURIKO Dominique GAKWAYA Pig farmer
BISAGARA Naphtaly NSHOGOZABAHIZI Goat meat farmer
MINAGRI Felix NYIRISHEMA
Dr Vincent NIYIRAGIRA
Cattle Development MINAGRI
Veterinary inspection ARE/RAB
BUSOGO P. Céleste NIYIBIZI
Thomas BISHIZEHAGABI
President COODERU Busogo
Président Association des exportateurs de laine UMUZABIBI W’UKURI
MUHOZA Jean-de-Dieu MANIRAKIZA Poultry farmer
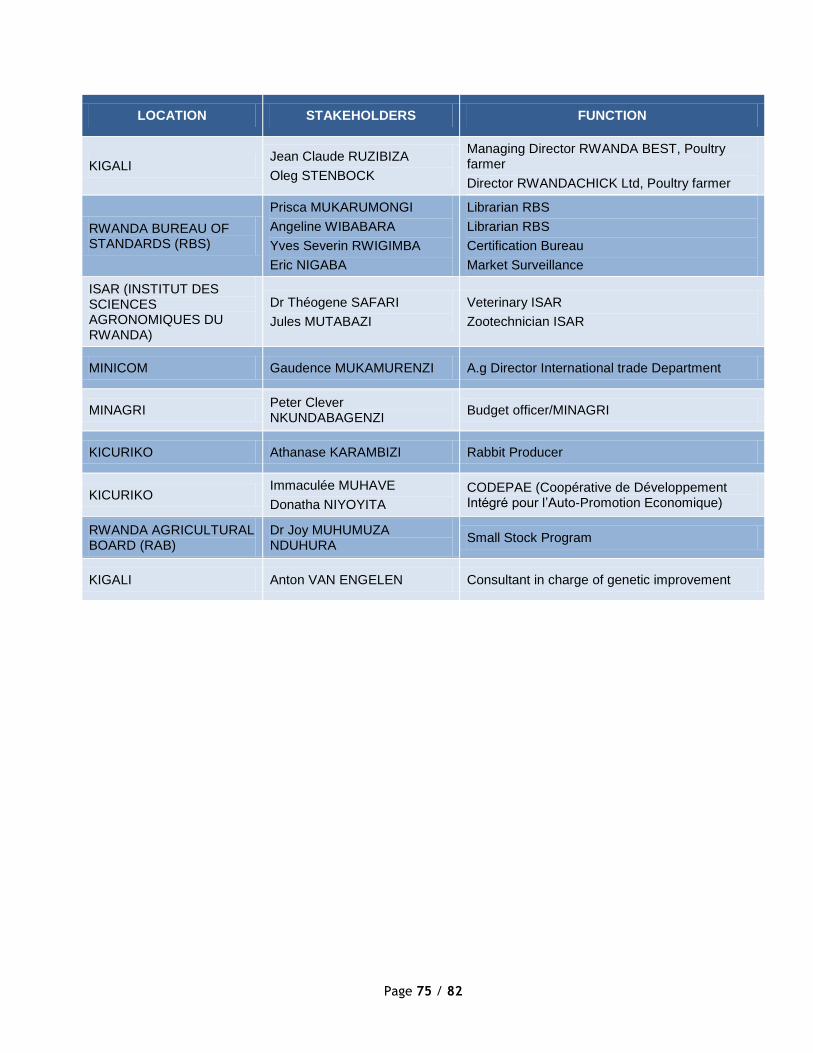
Page 75 / 82
LOCATION STAKEHOLDERS FUNCTION
KIGALI Jean Claude RUZIBIZA
Oleg STENBOCK
Managing Director RWANDA BEST, Poultry farmer
Director RWANDACHICK Ltd, Poultry farmer
RWANDA BUREAU OF STANDARDS (RBS)
Prisca MUKARUMONGI
Angeline WIBABARA
Yves Severin RWIGIMBA
Eric NIGABA
Librarian RBS
Librarian RBS
Certification Bureau
Market Surveillance
ISAR (INSTITUT DES SCIENCES AGRONOMIQUES DU RWANDA)
Dr Théogene SAFARI
Jules MUTABAZI
Veterinary ISAR
Zootechnician ISAR
MINICOM Gaudence MUKAMURENZI A.g Director International trade Department
MINAGRI Peter Clever NKUNDABAGENZI
Budget officer/MINAGRI
KICURIKO Athanase KARAMBIZI Rabbit Producer
KICURIKO Immaculée MUHAVE
Donatha NIYOYITA
CODEPAE (Coopérative de Développement Intégré pour l’Auto-Promotion Economique)
RWANDA AGRICULTURAL BOARD (RAB)
Dr Joy MUHUMUZA NDUHURA
Small Stock Program
KIGALI Anton VAN ENGELEN Consultant in charge of genetic improvement