strategic capital analysis - chfa
TRANSCRIPT

Strategic Capital Analysis Page 1
Presentation to:
Strategic Capital Analysis October 2020

Strategic Capital Analysis Page 2
Independent financial advisors • #1 ranked housing financial advisor for each year since 1982, according to Securities Data • Structured $90 billion of housing revenue bonds • Have worked for 26 state HFAs and currently represent:
Colorado, Mass., Michigan, Minnesota, Missouri, Montana, New Mexico, New York State, Tennessee and others • Structured capital adequacy studies for: Calif., Colorado, Mass., Minnesota, Missouri, New York, Virginia
Gene Slater, Chairman and Co-founder of CSG 42 years national experience in housing finance • Working with NCSHA to design national forbearance and rental housing initiatives to respond to COVID-19 • Designed and helped implement:
- major housing strategies for Pittsburgh, Chicago, Denver, D.C, Los Angeles, Phoenix, San Francisco, - public housing modernization for New Orleans, New York City, Puerto Rico, San Francisco - housing trust funds for Los Angeles, San Francisco, Seattle and Washington D.C. - long-range financial sustainability strategies for 7 state hfas and major housing authorities - Resolution Trust Corporation’s national financial advisor for tax-exempt assets from savings and loans
• HUD Central’s national advisor on housing rehabilitation, FHA multi-family refundings and expeditor for major HOPE VI projects
Education: B.A., Columbia University (summa cum laude); Kohn Fellow, London School of Economics; Master of City Planning, MIT; mid-career Loeb Fellow, Harvard; Master’s, Stanford on history of residential segregation
Tim Rittenhouse, President of CSG 40 years national experience in housing finance • Together with Gene, Initiated and helped design with U.S. Treasury what became the New Issue Bond Program
and Temporary Credit Liquidity Program • 25 years as financial advisor to 15 HFAs • Led underwriting teams for 22 HFAs Education: B.A., Swarthmore College; MBA in finance, SUNY, Albany
CSG Advisors

Strategic Capital Analysis Page 3
I. Strategic Capital Analysis for CHFA 1. Purpose 5 2. Approach 8
II. Financial Framework 3. Clarifying CHFA’s Capital Structure 11 4. Ratings, Balance Sheet and Risk 19 5. Net Annual Income as Key to Sustainability 29
III. Putting the Framework to Use 6. Homeownership Strategy 38 7. Multifamily Strategy 41 8. Addressing CHFA’s Strategic Priorities 45 9. Criteria for Major Decisions 48
IV. Appendix Action Plan Recommendations 50 Net Annual Income by Type of Income 53 Projected Cumulative Impact of Clarified Capital Structure 54 Interest Only Strip Transactions v. Single Family Bonds 55
Organization

Strategic Capital Analysis Page 4
I. Strategic Capital Analysis for CHFA

Strategic Capital Analysis Page 5
To Support CHFA’s Current Strategic Planning Effort
This Strategic Capital Analysis is designed to: • Identify resources to support plan priorities • Create ongoing transparency on how resources are being used • Provide funds for new programs while being financially sustainable • Outline mechanisms and approaches that can do both in a world of uncertainty
What is a Strategic Capital Analysis? • CHFA’s current and future capital requirements, • How they are affected by risk, • Availability of capital to meet CHFA’s needs, and • Most critically, future financial flexibility, to respond to challenges and needs
What the Analysis can provide
• Clear understanding – both internally and externally – of how CHFA’s components and programs affect each other financially
• Ongoing financial framework and systematic criteria for evaluating decisions
1. Purpose

Strategic Capital Analysis Page 6
Why is a detailed capital analysis especially useful for state HFAs? 1. Focus is inevitably on day-to-day actions 2. Decisions are usually considered individually and incrementally 3. HFAs such as CHFA are increasingly complex
- multiple programs - much more complex financings - more dynamic financially - multiple lines of business - many types of risk
4. Financial statements and rating agency evaluations are helpful but static and look backwards
Result: much more difficult for almost all HFAs to see how programs and finances are inter-connected Need an approach which is: comprehensive, systematic, both backward and forward looking, adjusts for risks, provides sensitivity analysis under different conditions, focuses on how programs and choices affect each other
1. Purpose

Strategic Capital Analysis Page 7
How have state HFAs used such studies? Agencies such as Colorado, Massachusetts, Minnesota, Missouri, New York and Virginia have used them to:
1. inform new multi-year strategic plans 2. provide a tool for analyzing major decisions 3. help inform stakeholders of what an HFA can, and can’t, sustainably do 4. provide a framework for annual budgeting, financing decisions and
investments for strategic priorities Help inform discussions of fundamental Board and staff questions
1. Where is the agency heading financially? 2. What are the major risks? 3. What choices do we have as an agency? 4. Especially, how do choices now affect what we will be able to do 3 to 5
years from now? Why especially useful for CHFA
1. Close relationship with the State and State programs and resources 2. Virtually all resources are managed under a single complex bond
resolution which makes clarity difficult about choices available to board and staff
1. Purpose

Strategic Capital Analysis Page 8
Systematic analysis of future financial flexibility: 1. Create clear financial framework of CHFA as a whole
• How the components and multiple lines of business affect each other
2. Analyze current finances and recent trends • 2019 audited financials and annualized 2020 based on 1st 6 months (recognizing
potential impacts of COVID-19) • Cash basis: excludes accounting adjustments that are in financial statements
3. Adjust for risks: • Both rating agency and management assumptions
4. Project income, assets, liabilities through 1/1/24 (“study period”) as basis for strategic planning (initially without assuming major changes in CHFA programs or allocation of resources)
5. Analyze under ‘study’ scenarios and rating agency stress tests at different interest rates and prepayment speeds to provide:
• Projected net worth minus rating agency risks = ‘risk-adjusted capital’ • How much of risk-adjusted capital is projected to be needed for future financial
sustainability and rating agency minimum requirements • Range of expected level of annual income • Basis for determining how much can be invested in strategic priorities
6. Focus on future annual net income
2. Approach

Strategic Capital Analysis Page 9
3 Scenarios for sensitivity testing
Table 1. Key Assumptions for Scenarios
* 2019 **Range from 2017 – 2019 ***2020
2. Approach
Recent Low Rates Higher Rates
Higher Rates Stress
LIBOR/equivalent index projected rate by 1/1/24 0.15% 0.75% 3.5% 4.0%
Single-Family Production $ 525 m.* $ 500 m. $ 500 m. $ 720 m.
SF Housing Bonds 525 m.* $ 500 m 500 m. 720 m.
tax-exempt spread on bonds 0.80% 0.80% 0.60%
servicer paid on MBS loans 0.15% 0.15% 0.15% 0.15%
CHFA payment to lender 0.56 pt. 0.56 pt. 0.56 pt. 1.00 pt.
Multi-Family Production w. bonds $ 115 m*** $ 115 m. 115 m. 75 m.
tax-exempt spread on bonds 1.0% 1.0% 0.75%
Reinvestment of ITA in new loans at interest rate of 3.0% 3.0% 3.0%
MF prepayments permitted no no no no
Loan losses: COVID-19 related (combined 2021 & 2022) SF: annual on non-FHA whole loans MF: annual bond loan losses MF: annual ITA loan losses
1.2 m***. .1% to .4%** .2 to 13.2 m** .3 to 2.3 m.**
3 m. .31% 1 m. 1 m.
3 m.
.31% 1 m. 1 m.
6 m.
.625% 2 m.
3.5 m.
CHFA fee income (loan fees, tax credit fees, etc.) 6.4 to 9.5m ** 7.4 m. 7.4 m. 5.2 m.
Operating Budget for 2021 Annual increase thereafter
30.7 m.* 0% 17-19
31 m. 2.5%
31 m. 2.5%
31 m. 3.5%
Strategic Capital Analysis Page 10
II. Financial Framework

Strategic Capital Analysis Page 11
Central Question: How can CHFA build its overall sustainability?
• The ability to do more 3 years from now rather than less. • Links the agency’s financial capacity and what it can do programmatically
To address this, the study looked at:
• how CHFA’s resources, constraints, risks, and overall financial flexibility have changed, and are likely to change over time, and
• how these compare to other HFAs with similar size balance sheets A. CHFA has Significant Financial Strengths
• Net worth of approx. $1 billion • Aaa ratings by both Moody’s and Standard & Poor’s • Positive net cash income, generally between $15 – 20 mill. in recent years • Modest real estate risk exposure, esp. from shifting to mortgage-backed securities for
single-family production in 2012 • Adequate risk-adjusted capital, as measured by rating agencies, of approx. $400 m.
(Moody’s) to $ 460 m. (S&P) given CHFA’s total liabilities • Large non-bond portfolio (broadly defined Investment Trust Account, incl. ITA itself, DECD,
and Prime) provides about $15 mill. of net income each year. This is a key resource of CHFA
• Unlike many HFAs, CHFA has continued to maintain and expand its balance sheet over the last 5 years, thus strengthening its future ongoing annual income
3. Clarifying CHFA’s Capital Structure

Strategic Capital Analysis Page 12
B. CHFA has a Capital Structure, however, which makes it difficult for board
and staff to understand and pro-actively invest its resources 1. This is largely due to the nature of its Housing Mortgage Finance Program Bond Resolution
(‘General Resolution’): • contains almost all CHFA’s assets and liabilities • unusually among HFAs, CHFA does not have a separate general fund with its own
resources, budget and issuer credit rating • because the Resolution has a backstop pledge from the State to replenish its debt
service reserve, it has legal restrictions on withdrawing funds - given the strength of the resolution, the backstop pledge est. in 1972 is not
financially necessary or ever expected to be drawn on - however, these restrictions, limit withdrawals to a single period each December
2. But beyond the legal limitations, a series of practices going back many decades:
• has made it difficult to clearly see: - the choices CHFA has, - what monies can be pro-actively invested in new programs, - the financial impacts of particular decisions
• has effectively used the agency’s net income to pay down bonds early, - thus building up the agency’s future net worth - but making it hard to make other choices today
3. Clarifying CHFA’s Capital Structure
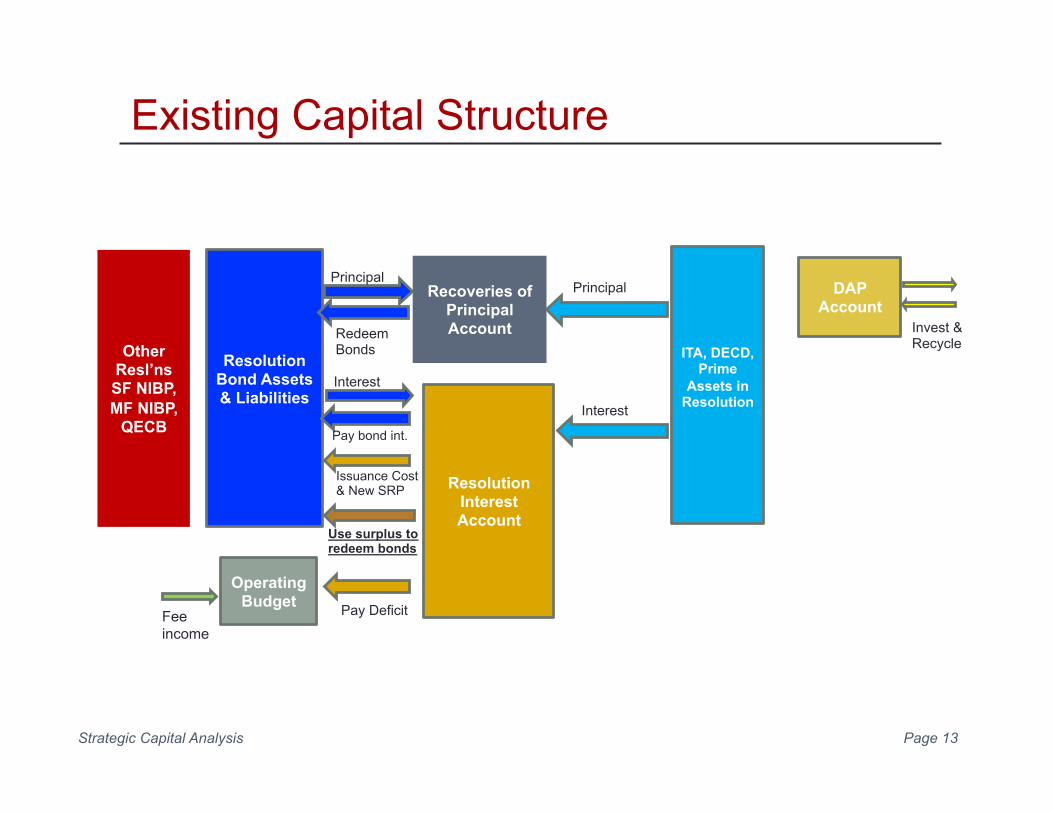
Strategic Capital Analysis Page 13
Other Resl’ns SF NIBP, MF NIBP,
QECB
Resolution Bond Assets & Liabilities
ITA, DECD, Prime
Assets in Resolution
Recoveries of Principal Account Redeem
Bonds
Principal
Resolution Interest Account
Interest
Interest
Pay bond int.
Issuance Cost & New SRP
Operating Budget Pay Deficit
DAP Account
Invest & Recycle
Use surplus to redeem bonds
Principal
Existing Capital Structure
Fee income

Strategic Capital Analysis Page 14
Other Resl’ns:
SF NIBP, MF
NIBP, QECB
General Resol’n Bond
Assets & Liabilities
ITA, DECD, Prime
Assets in Resolution
Opportunity Fund
Recoveries of Principal Account Redeem
bonds
Principal
Resolution Interest Account
Interest
Interest Pay bond interest
Issuance Cost & New SRP
Operating Budget Pay Deficit
Net interest earnings
Fee income
Surplus Account
Interest sub-account
Residual Transfer 50%
Transfer 50%
Surplus Account Principal Redeposit on 12/1
Invest & Recycle
DAP Account
Invest & Recycle
Principal
If needed
Sustainable Core
Proposed Capital Structure

Strategic Capital Analysis Page 15
C. Most important recommendation is thus to clarify the Capital Structure 1. Principal received on ITA loans would be redeposited to the ITA,
instead of automatically being used to call bonds.
Amount: In 2019, would have provided approx. $10 m. back into the ITA
Purpose: To fund new loans that meet CHFA’s mission, are interest-bearing and amortizing, and are reasonable investments receiving at least partial rating agency credit
(examples: new permanent multi-family loans on 9% projects, CHFA-funded downpayment assistance loans, possible new program of home improvement loans to low and moderate income homeowners)
The key is to maintain the overall credit quality of the ITA
Timing: Under Resolution requirements, these payments must be held in a surplus account until Dec. 1, in case needed for bond debt service, and can then revert to ITA
Lending plan for following year can outline proposed uses of reinvested funds
3. Clarifying CHFA’s Capital Structure

Strategic Capital Analysis Page 16
C. Clarify the Capital Structure (cont.) 2. Income from CHFA’s other resolutions (currently quite small, about $1 mill. annually)
would help pay operating costs, and thus increase net available to be split between ITA and Opportunity Fund
3. Residual in General Resolution interest account, e.g. CHFA’s net annual income,
would go into an interest surplus account, and on December 1,
- half would go back into the ITA account: to help maintain and build CHFA’s net worth while making new Agency ITA loans
- half would go into a newly established “Opportunity Fund” to make gap-type loans and interest subsidies – and would not be relied on by the rating agencies
This 50-50 approach, successfully used by MassHousing since 2013, creates a win-win: synergistically enhances and supports regular lending program and new initiatives
Projected amounts for 2020: approx. $8 mill. for ITA and $8 mill. for Opportunity Fund
3. Clarifying CHFA’s Capital Structure

Strategic Capital Analysis Page 17
D. Advantages of Proposed Capital Structure • Fully consistent with the existing bond documents, • Consistent with CHFA’s bond ratings, • Makes it easier to separate out available resources from complex bond cash flows.
Will make it easier: • For Board, staff and stakeholders to understand CHFA’s available resources, • For CFO to provide choices to the Board, including proposed $ and uses of Opportunity
Fund and new ITA resources for each year’s Lending Plan, • To pro-actively address housing challenges in the state, despite modest private
activity bond volume cap (PAB) and potential reductions in the State’s own funding, while maintaining CHFA’s long-term sustainability
E. Sustainable Core To distinguish Opportunity Fund from amounts counted on by rating agencies for paying bondholders, define CHFA’s “sustainable core”:
- General Resolution bond assets - ITA assets in the General Resolution - other resolutions (currently very minor)
The Opportunity Fund, like the state revolving DAP fund or any other state monies administered by CHFA, are outside the sustainable core
3. Clarifying CHFA’s Capital Structure
Strategic Capital Analysis Page 18
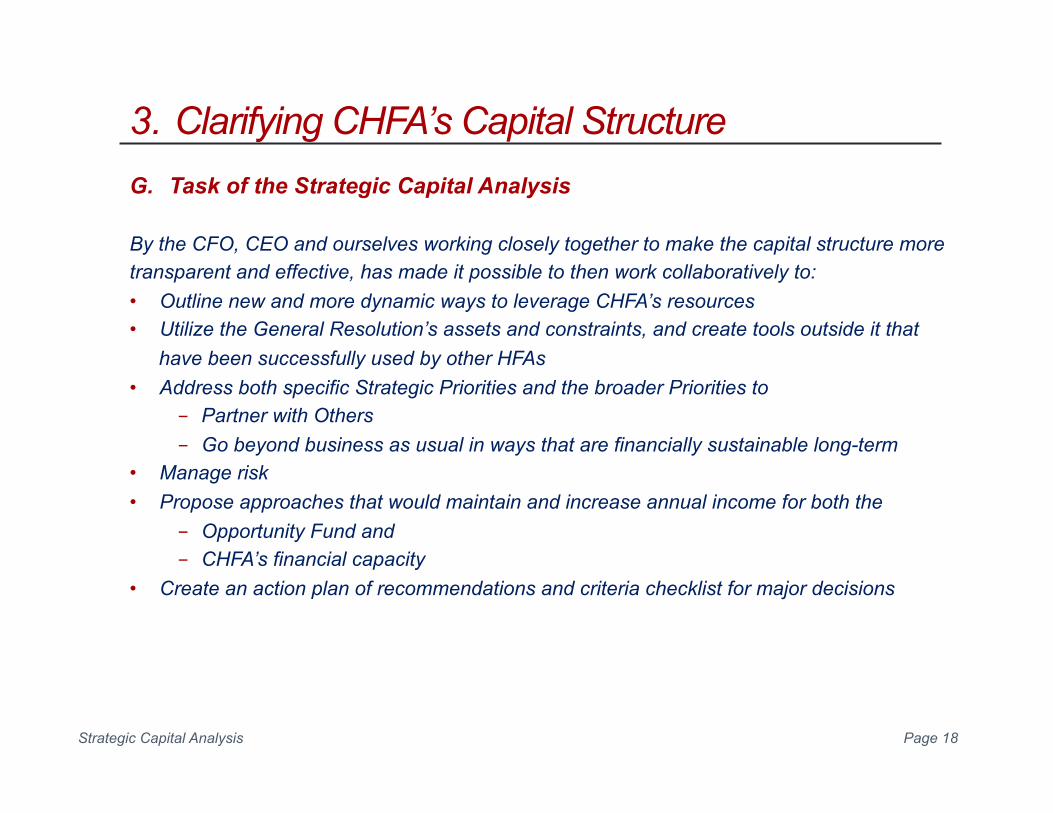
G. Task of the Strategic Capital Analysis By the CFO, CEO and ourselves working closely together to make the capital structure more transparent and effective, has made it possible to then work collaboratively to: • Outline new and more dynamic ways to leverage CHFA’s resources • Utilize the General Resolution’s assets and constraints, and create tools outside it that
have been successfully used by other HFAs • Address both specific Strategic Priorities and the broader Priorities to
- Partner with Others - Go beyond business as usual in ways that are financially sustainable long-term
• Manage risk • Propose approaches that would maintain and increase annual income for both the
- Opportunity Fund and - CHFA’s financial capacity
• Create an action plan of recommendations and criteria checklist for major decisions
3. Clarifying CHFA’s Capital Structure

Strategic Capital Analysis Page 19
Aaa Ratings on General Resolution Not a constraint possible to reduce, given Resolution legal restrictions on pledged assets, but: • Clarified capital structure allows CHFA to expand its program and financing choices • Rating enables CHFA to finance programs at very low cost, • Resolution’s rating should therefore be used as a tool for achieving CHFA’s objectives,
while creating other financing mechanisms as needed
Although Resolution is additionally secured by pledge from the State, CHFA’s rating Is now significantly higher than the State (Aaa v. A1/A) and not based on State
The high rating should not be relied on as proof of what CHFA’s will be, or how will it be rated, in the future – since rating agencies only look at existing production
Have therefore tested 3 additional years of production and then applied rating agencies’ stress cases: cash flow results are generally quite strong
4. Ratings, Balance Sheet and Risk

Strategic Capital Analysis Page 20
0
1,000
2,000
3,000
4,000
5,000
6,000
7,000
FYE2016
FYE2017
FYE2018
FYE2019
FYE2020Proj
FYE2021Proj.
FYE2022Proj.
FYE2023Proj.
.
4. Ratings, Balance Sheet and Risk
Fig. CHFA General Resolution FYE 2016 – Proj. 2023 with Low Rates and Proposed Capital Structure (in $ mill.)
Balance Sheet Growth Unlike many state HFA’s which have been selling most or all of their single-family MBS production, CHFA has been financing such production on balance sheet Enabled CHFA to maintain and significantly grow its balance sheet, and expected to continue

Strategic Capital Analysis Page 21
Net Worth
CHFA’s overall net worth – its total assets less its liabilities – of approx. $960 mill. at FYE 19 is pledged to protect bondholders and restricted by Resolution Maintaining it is important to financial sustainability and the Agency’s operations, since it provides: 1. The ongoing stream of net interest earnings that CHFA, like most HFAs, relies on to cover
bulk of its approx. $31 mill. annual operating budget 2. Resources to maintain the agency and its operations if future production were significantly
curtailed – such as Congress almost ending tax-exemption for single-family and multi-family bonds in December 2017. Cash flows rely on net worth to pay CHFA’s future operating costs
3. CHFA’s ability to cover potential adverse events, such as:
- loan losses on single-family whole loans during the Great Recession; - losses on multi-family projects such as $24.5 m. loss on Temple St. in Hartford in
2018; - any net losses CHFA may suffer as a result of COVID-19; and - impacts of changes in interest rates on CHFA’s income
More important than the net worth per se, therefore, is risk-adjusted net worth and how CHFA manages risks
4. Ratings, Balance Sheet and Risk

Strategic Capital Analysis Page 22
Vary significantly and include peculiarities, but measures that CHFA needs to be aware of and monitor 1. CHFA’s current level of rating agency
risk-adjusted net worth is generally seen as adequate for its balance sheet and operations,
2. Given the overall size of the agency and its balance sheet, it is important for CHFA to at least maintain and/or grow – and not reduce – its rating agency risk-adjusted net worth
3. As risks are reduced, CHFA has room to take on additional reasonable risks in expanded or new lending programs 100%
102%
104%
106%
108%
110%
112%
114%
116%
118%
120%
0
100
200
300
400
500
600
700
800
900
1,000
S&P Moody's S&P Moody's
AdjustedNetWorth RiskAdjustment %NetWorth/Liabilities
Rating Agency Risk-Adjusted Net Worth
Both S&P and Moody’s assume losses in a Depression-era scenario, calculating “haircuts” against each type of assets and deduct those from CHFA’s net worth
4. Ratings, Balance Sheet and Risk
Fig. 2. Risk-Adjusted Net Worth FYE 19 ($ mill.)

Strategic Capital Analysis Page 23
Tools for Maintaining Rating Agency Risk-Adjusted Net Worth
1. MBS Outside General Resolution. Wherever not more costly to do so, to avoid S&P haircuts, fund new single-family MBS in its own new resolution
2. FHA Risk-Share. For new multi-family first mortgage loans above $3 mill, consider using FHA risk-share insurance - very inexpensive: 0.125% covers 50% of net loss, providing real protection for CHFA - CHFA’s own underwriting standards generally conform to FHA requirements - risk-share underwriting can help CHFA streamline & standardize its own procedures, (and
simplify for loans below $3 mill.) - recently, and potentially again in future, Federal Financing Bank provided extremely low-
cost financing for risk-share loans enabling many HFAs to earn greater spreads & lower rates
- since risk-share during construction triggers Davis-Bacon wage requirements, it is more often used for permanent lending unless a project is already subject to Davis-Bacon
3. Risk Budget. In each annual Lending Plan, starting for 2022, include a simple 1-page risk budget, that allocates risk measured by rating agency (Colorado uses Moody’s) for lending in Sustainable Core, showing: - increase in the agency’s overall net worth during the prior year - reduction in risk as old assets have paid down - Moody’s adjustments on proposed new lending
This allows CHFA to maintain (or grow) its risk-adjusted capital while taking on new risks
4. Ratings, Balance Sheet and Risk

Strategic Capital Analysis Page 24
Allocation of risk capacity for FY ___ (illustrative) Sources of risk capacity Lending Amount Risk capacity
Increase in net worth during last FY, est. $ 7 million
Decrease in financing risk $ 0 million
Decrease in real estate risk due to existing loan paydowns $12 million
Subtotal: change in available risk capacity $19.0 million
Uses of risk capacity
Real estate risk on new loans FHA risk-share 50-50 other multi-family single-family second mortgages subtotal
$60 million $20 million $10 million $90 million
$ 8.4 million $ 5.6 million $ 5.0 million $19.0 million
Projected change in risk-adjusted net worth 0 million
Table 1. Illustrative Risk Budget
4. Ratings, Balance Sheet and Risk

Strategic Capital Analysis Page 25
FHASFWholeLoans,1,364 Non-FHASF
Loans,455Single-FamilyMBS,587MFWhole
Loans,1,319
Cash&OtherInvestments,791
FYE16TotalAssets
FHASFWholeLoans,1,100
Non-FHASFLoans,367
Single-FamilyMBS,
2,013MFWholeLoans,1,429
Cash&OtherInvestments,597
FYE19TotalAssets
Fig. 3. Reduced Asset Risk in General Resolution FYE 16 to FYE 19 ($ mill.)
Assessing CHFA’s Risks: Assets
Going beyond rating agency assessments: CHFA has far less actual risk today than it did during the financial crisis, by having shifted from whole loans to mortgage-backed securities CHFA’s major other loan risks are in its multi-family portfolio (including 1st mortgages backed by bonds and in the ITA, and riskier soft & residual mortgages acquired from DOH’s portfolio)
4. Ratings, Balance Sheet and Risk

Strategic Capital Analysis Page 26
Assessing CHFA’s Risks: Liabilities CHFA’s overall long-term variable rate debt of $1.4 bill., about 32% of its total long-term debt, is reasonable for its balance sheet, CHFA has an extraordinary opportunity to lock in historically low swap rate on $150 mill. of long-term unhedged variable rate debt Variable rate bonds, held by money market funds, change rates weekly and are currently about 0.15%, but were about 2.5% in 2018 and 5% in the late 2000’s Most of CHFA’s variable rate bonds have an interest rate swap in case rates go higher, but approx. $300 mill. of its long-term variable rate debt is unhedged. This is useful, since:
- It benefits CHFA in low-rate environments when CHFA’s income, like most HFAs is lower (since loans prepay more quickly and CHFA earns less on its short-term investments)
- CHFA’s long-term cash provides a natural ‘hedge’ for some variable rate debt - CHFA has done very well recently as short-term rates have dropped to historic levels
To protect itself, CHFA should limit unhedged bonds to the amount offset by its ongoing cash.
- Since CHFA has fixed rate loans to its borrowers, this will protect its future spread and net annual income if and when short-term rates rise from current very low levels
4. Ratings, Balance Sheet and Risk

Strategic Capital Analysis Page 27
Assessing CHFA’s Risks: Liabilities (cont.) Not using unhedged variable rate debt to lower the rates CHFA offers to homeowners has important implications for CHFA’s homeownership strategy
- CHFA has been offering extremely low mortgage rates – the lowest among our HFA clients – by reducing its expected spread far below what IRS allows and by using unhedged bonds
- In the long run this reduces CHFA’s sustainability
- We have therefore proposed a homeownership strategy drawing on CHFA’s other tools, by expanding downpayment assistance and a mix of financing methods
4. Ratings, Balance Sheet and Risk

Strategic Capital Analysis Page 28
.
Assessing Risks: Liquidity CHFA generally has: - Sufficient cash liquidity for its regular operations, through cash in the General Resolution - $100 million warehousing facility for its single-family loan pipeline before bonds are issued Liquidity. Prudent, however, to obtain a bank line of credit for approx. $50 million that can be drawn on if CHFA ever needs additional cash - Useful during emergencies, such as COVID-19, or for other purposes, since cash in the
General Resolution is generally needed for upcoming debt service - Given CHFA’s AAA rating it should be relatively easy and low-cost to obtain such a line,
similar to those used by Colorado or MassHousing Warehousing. Although not a risk, CHFA may increase its income by a combination of: - Short-term cash in the General Resolution and/or ITA - A drawdown warehousing line, so CHFA only pays interest to the extent it actually is
investing in and earning the loan rate on loans in its pipeline. - This combined approach has helped several agencies such as Colorado and
Massachusetts increase their income
4. Ratings, Balance Sheet and Risk

Strategic Capital Analysis Page 29
Importance of Future Net Annual Income
Driving factor determining what CHFA will be able to do, the programs it can offer, what it can contribute to the Opportunity Fund and reinvest in its future sustainability Recent trends show that: - CHFA has generally made between $16 to $20 mill. per year after paying its operating budget
and investing in new production (costs of new bond issues and servicing release premiums) - The exception in 2018 was due to multi-family loan losses, esp. Temple Street - Future pressures from increasing pension obligations and reduced Section 8 contract income
as HUD transfers projects to PBCA vendor - ITA is the key to CHFA’s income, generating close to $15 mill. of net income per year
2017 2018 2019 Annualized 2020
General Resolution:
Homeownership - 3.940 - 9.029 - 0.406 0.6
Multi-family, excluding ITA 4.945 -11.922 4.543 0.1
ITA 12.550 12.363 14.291 15.9
subtotal 15.359 -8.587 18.428 16.6
Other CHFA Resolutions 1.279 1.021 1.043 0.8
Total 16.639 -7.566 19.471 17.4
Table 2. Net Annual Income by Source FYE 17-20 ($ mill.)
5. Net Annual Income as Key to Sustainability

Strategic Capital Analysis Page 30
Projected Net Annual Income
Fig. 4. Projected Net Income: FY 17 – FY 23 ($ mill.)
5. Net Annual Income as Key to Sustainability
-10
-5
0
5
10
15
20
25
2017 2018 2019 2020 2021 2022 2023
HigherRates LowRates HigherRatesStress

Strategic Capital Analysis Page 31
Types of income
Importance of distinguishing 3 different types of HFA activities: 1. Ongoing income from past activities interest earnings, spread, servicing, losses on old loans
2. Current year activities fee income (tax credit fees, loan fees, etc.), operating expenses
3. Investment in future ongoing income issuing bonds, acquiring servicing
Key to future stability is building ongoing income from past activities
- Assures income in each future years (about $45 mill. per year) - Covers deficit in current year activities (approx. $20 million per year) - Maintains net worth and financial flexibility - Enables future contributions to Opportunity Fund - Helps CHFA successfully weather future recessions and other risks - Requires continuing to invest in future income
5. Net Annual Income as Key to Sustainability

Strategic Capital Analysis Page 32
-30
-20
-10
0
10
20
30
40
50
60
2017 2018 2019 Annualized2020
Source: Staff Framework Analysis.
Fig. 5. Historic Income by Type of Activity: FY 17 – FY 20
5. Net Annual Income as Key to Sustainability
Ongoing Income From Past Activities
Current Year Income
Combined Net Income
Investment In Future Income

Strategic Capital Analysis Page 33
Table 3. Projected Deposits to Opportunity Fund based on 50% of Net Annual Income ($ mill.)
Scenario FY 20 FY 21 FY 22 FY 23 Cumulative
Low Rates Projected Income 17.4 12.4 18.5 16.0 64.2
50% to ITA 8.7 6.2 9.2 8.0 32.1
50% for Opportunity Fund 8.7 6.2 9.2 8.0 32.1
Higher Rates Projected Income
17.4
15.1
20.9
16.6
70.0
50% to ITA 8.7 7.6 10.4 8.3 35.0
50% for Opportunity Fund 8.7 7.6 10.4 8.3 35.0
Higher Rates Stress Projected Income
17.4
7.7
11.1
5.7
41.9
50% to ITA 8.7 3.8 5.6 2.9 21.0
50% for Opportunity Fund 8.7 3.8 5.6 2.9 21.0
5. Net Annual Income as Key to Sustainability
Source: cfX projections for FY 21-23, with clarified capital structure and multi-family prepayments at average 25 years, plus income from other resolutions

Strategic Capital Analysis Page 34
Fig. 6 Projected Cumulative Deposits into ITA and Opportunity Fund from Net Income ($ mill.)
5. Net Annual Income as Key to Sustainability
Source: cfX management scenario projections for FY 21-23, with clarified capital structure and multi-family prepayments at average 25 years, plus income from other resolutions
0
20
40
60
80
2019 2020 2021 2022 2023
Millions
LowRates
CumulativeOppFund CumulativeITADeposits
0
20
40
60
80
2019 2020 2021 2022 2023
Millions
HigherRates
CumulativeITADeposits CumulativeOppFund
0
20
40
60
80
2019 2020 2021 2022 2023
Millions
HigherStressRates
CumulativeITADeposits CumulativeOppFund

Strategic Capital Analysis Page 35
Actions to Maintain and Increase Annual Income
Issue Significance Ways of Building Income Current Year Income Fee Income
Warehousing income
Administrative Expenses
Potential for TBA sales
Helps offset operating budget
Can provide significant income
Ongoing costs help determine net annual income
High premiums in current market
Explore Performance-Based Contract Administration for HUD
Use Resolution short-term funds for loan warehousing Obtain warehousing line of credit on drawdown basis
Maintain continuing disciplined cost approach
Regularly compare net present value of TBA v. bond sales
Ongoing Income from Past Activities Unhedged variable rate debt Frequency of calling bonds
Expand ITA lending
New single-family lending
Rise in rates of say 200 bp would reduce net income by $3 mill. Sometimes delayed until next bond sale, while reinvesting at lower rates
Important to reinvest principal and 50% of CHFA net income
Limited spreads on past lending
Lock in interest rate swaps on $150 m. not offset by CHFA’s long-term cash balances Obtain a revolving recycling line of credit to retain volume cap monthly if needed
CHFA-funded downpayment assistance loans to supplement DAP Expand multi-family lending such as for 9% tax credit projects Home improvement loan program
Compete for borrowers based on down payment assistance rather than solely on low rate
Explore alternatives with lower long-term cost of funds and that do not use PAB: such as interest-only strip executions (currently about 60 bp lower cost than bonds)
5. Net Annual Income as Key to Sustainability

Strategic Capital Analysis Page 36
Issue Significance Ways of Building Income
Investments in Future Income Costs of issuance for single-family bonds Service release fees
Currently about $5 to 6 m. per year May need to increase origination fees to lenders (potentially $2 m per year) Could also create zero point loan option for borrowers (potentially $5 m. per year)
Need higher spread on bond-financed loans Compare alternative executions Need to assure adequate return, either as spread or sale price May require increasing loan rates Need to be repaid through higher loan rate option (typically about 20 – 25 bp per point)
Actions to Maintain and Increase Annual Income
5. Net Annual Income as Key to Sustainability

Strategic Capital Analysis Page 37
III. Putting the Framework to Use

Strategic Capital Analysis Page 38
CHFA Strengths • Mortgage-backed securities platform that:
- eliminates financial risk to the agency - can be used for TBA sales and Interest-Only transactions as well as bonds, and - can be very efficiently hedged to protect against changes in rates
• Revolving downpayment assistance fund, financed by the state • Strong lending pipeline • Modest prepayment speeds that help keep loans outstanding longer • 3rd party servicer at a low-cost fixed servicing fee (now up for re-bidding) • Aaa-rated resolution with efficient pricing on tax-exempt and taxable bonds, and extensive
experience with variable rate bonds and swaps
Challenges • Modest total PAB, approx. $225 m. plus unused $ from other agencies, with multi-family priority • Downpayment assistance per borrower significantly cut in 2018 to avoid depleting State funds • Total lender compensation is low compared to other HFAs and non-HFA lending • In competing on loan rate, CHFA has greatly limited the spread it earns (and used unhedged
variable rate debt), - making it difficult to achieve adequate return on costs of issuance - stretching volume cap with taxable debt puts further pressure on spread
6. Homeownership Strategy

Strategic Capital Analysis Page 39
Approach 1. Provide significantly more downpayment assistance per borrower
Amount per Borrower: - Cover both downpayment and closing costs - Max. combined loan-to-value of 105% permitted by secondary market - Min. cash contribution from borrower of $1,000 - No asset test - Max. of $20,000 (avg. est. at $15,000)
Sources: - State DAP fund has been replenished with prepayments; its current $33 mill. could
fund these higher amounts for 3+ years - Even more important, the ITA could fund such loans, as an attractive investment
(such as Minnesota’s Monthly Payment Loans) - Thus CHFA does not have to worry about limiting the amount available
Resubordination: - Not permit when refinancing CHFA’s first mortgage - Encourages prepayment of 1st mortgage, lowering CHFA’s annual income, - Delays for years or decades replenishment of DAP - Helps old borrowers at the cost of CHFA not being able to help new homebuyers
6. Homeownership Strategy

Strategic Capital Analysis Page 40
Approach (cont.) 2. Set loan rates, if issuing bonds, to provide equivalent spread of 1.125%, but at least 1.0%,
without taking on future unhedged rate risk 3. Take advantage of CHFA’s MBS platform to fund loans not only through bonds but by
- selling loans on a TBA basis at significant cash premiums, - selling loans and buying back interest-only strips, enabling CHFA to earn the ongoing
spread approx. 60 basis points more than on tax-exempt bonds in recent month with almost no costs of issuance, and without using any PAB
- continuing to issue bonds selectively, to take advantage of refunding opportunities, recycle past bond authority and preserve zero participation interest rate subsidies
- regularly compare these approaches based on net present value to CHFA, impact on current and future ongoing income, and leveraging limited PAB
5. Establish a new more efficient Aaa-rated homeownership resolution 6. Protect against market rates rising after making loan reservations by hedging pipeline 7. Streamline loan delivery timetable to help reduce rate risk. This can include differential
lender fees for faster delivery 8. May need to consider increasing net origination fees paid to lenders, to maintain and
expand pipeline, and incentivize faster loan and document delivery. Would be funded through modestly higher loan rates and additional income from TBA sales
9. Create home improvement loan program, from ITA with 10% guarantee from Opp’y Fund
6. Homeownership Strategy

Strategic Capital Analysis Page 41
CHFA Strengths • Long-track record of multi-family lending both with bonds and its ITA • Well-performing portfolio of approx. $1.4 billion • Priority for using PAB for 4% tax credit projects • New clear and highly attractive loan rates in the 3.50 to 3.75 range • Serves as allocator of 9% tax credits and allocates $10 mill. per year of state tax credits for non-
profits • Direct partnership with state DOH for gap funds • Joint developer engagement process with DOH generating over 140 requests and feedback • Applied for $4 mill. of Treasury Capital Magnet Fund to match with CHFA’s own funds
Challenges • Conflict over long-standing policy of generally not allowing borrowers to prepay • Perception as not user-friendly multi-family lender: reviews, procedures, asset management • Most of CHFA’s 4% as well as 9% tax credit projects require deep subsidies, but
- DOH has increasingly limited funds available for such subsidies - CHFA has done relatively little lending in suburban communities crucial to housing choice - CHFA’s QAP requirements for 4% projects makes it difficult for projects which would not
need deep subsidies but would increase housing choice • Increasing expectations for CHFA to be more active in multi-family lending, reflecting limited
state funds, new strategic plan and developer engagement process
7. Multifamily Strategy
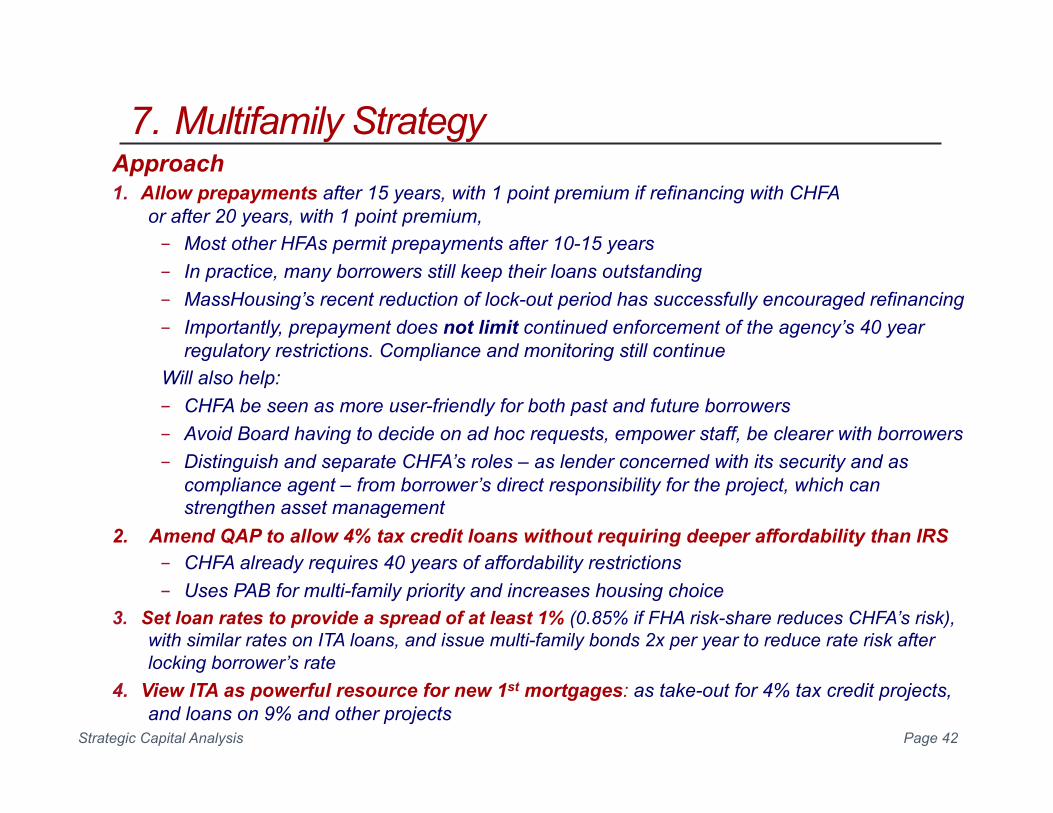
Strategic Capital Analysis Page 42
Approach 1. Allow prepayments after 15 years, with 1 point premium if refinancing with CHFA
or after 20 years, with 1 point premium, - Most other HFAs permit prepayments after 10-15 years - In practice, many borrowers still keep their loans outstanding - MassHousing’s recent reduction of lock-out period has successfully encouraged refinancing - Importantly, prepayment does not limit continued enforcement of the agency’s 40 year
regulatory restrictions. Compliance and monitoring still continue Will also help: - CHFA be seen as more user-friendly for both past and future borrowers - Avoid Board having to decide on ad hoc requests, empower staff, be clearer with borrowers - Distinguish and separate CHFA’s roles – as lender concerned with its security and as
compliance agent – from borrower’s direct responsibility for the project, which can strengthen asset management
2. Amend QAP to allow 4% tax credit loans without requiring deeper affordability than IRS - CHFA already requires 40 years of affordability restrictions - Uses PAB for multi-family priority and increases housing choice
3. Set loan rates to provide a spread of at least 1% (0.85% if FHA risk-share reduces CHFA’s risk), with similar rates on ITA loans, and issue multi-family bonds 2x per year to reduce rate risk after locking borrower’s rate
4. View ITA as powerful resource for new 1st mortgages: as take-out for 4% tax credit projects, and loans on 9% and other projects
7. Multifamily Strategy

Strategic Capital Analysis Page 43
Approach (cont.)
5. Become FHA risk-share lender, protecting risk-adjusted net worth and cutting CHFA’s exposure by 50%, and provide way to standardize loan underwriting
6. Use Opportunity Fund to: a. Buy down the interest rate on selected bond and ITA loans
Colorado uses its ‘affordability fund’ to buy down rate by 50 basis points (at a cost of 5 cents per $, $50,000 on a $1 million loan). This simple, inexpensive rate subsidy helped Colorado become permanent lender on 3 / 4 of 9% tax credit projects. Helps projects that otherwise do not need deep subsidies (and might become costlier or slower if used)
b. Enable ITA to lock-in rates 2 years in advance for permanent take-out Minnesota offers permanent loan rates at 50 bp above its current lending rate. If rate environment then is even higher, small amount of Opportunity Fund covers up to another 50 bp higher effective yield on ITA’s own funds
c. Directly provide modest gap loans Often $250,000 - 500,000 (not to exceed $1 mill.) to help borrowers cover costs of using CHFA’s bond and ITA loans.
7. Explore with local housing authorities the use of project-based vouchers to finance high-quality units for lower income tenants where market rents are above tax credit rents. This can provide additional supportable debt service and reduce the need for other subsidies, while increasing diversity of housing opportunities.
8. Provide a portion of unused state volume cap to be used by CHFA for conduit multi-family financings. Up to $40 million of volume cap not used by other agencies could be carried forward as multi-family and used by CHFA for conduit transactions, with fees that maintain CHFA’s sustainability
7. Multifamily Strategy

Strategic Capital Analysis Page 44
Strategic Priorities Capital Analysis Approach 1. Partner with Others Allow eligible multi-family prepayments
Explore opportunities for pairing multi-family loans with project-based vouchers through local housing authorities
Match Helping to House New England grant with $1 mill. from ITA
Use Opportunity Fund $ for small gap loans to help borrowers use CHFA bond and ITA multi-family loans
Partner with FHA risk-share on multi-family loans above $3 mill
2. Use QAP to expand high-quality housing choices and create sustainable housing near public transportation and good quality educational and employment choices
Simplify QAP requirements for 4% tax credit projects to Federal affordability restrictions
Use Opportunity Fund for interest-rate buydowns and small gap loans on projects that do not require deep subsidies
3. Help low and moderate-income households build wealth through homeownership
Significantly expand downpayment assistance, including: - Increasing limits on assistance to each borrower - Being able to use CHFA’s ITA to supplement state’s DAP
Develop and implement home preservation programs for current homeowners
Create ITA-funded home improvement loan program such as that operated by Minnesota Use Opportunity Fund for small guarantee to protect ITA
4. Determine cost and merit of taking more risk in financing opportunities
Strategic Capital Analysis Risk budget for allocating risk
Revise capital structure to establish Opportunity Fund with 50% of CHFA’s net annual income while continuing to build CHFA’s financial sustainability
5. Go beyond business as usual. Strengthen communication with current and future stakeholders
Make multi-family lending more user-friendly through prepayment policy, streamlining/standardizing requirements and two bond issues per year
8. Addressing CHFA’s Strategic Priorities

Strategic Capital Analysis Page 45
Synergistic Resources for the State’s Housing Challenges
CHFA Funds State Funds Sustainable Core Outside Core
Other Resolution
Bond Funds
General Resolution
Bond Funds
ITA Opportunity Fund
State DAP Fund
Special Needs
Resolution
DOH Subsidy Funds
Where held Each resolution General Resolution
General Resolution Either in or outside General Resolution
General Resolution
Special Needs Resolution
DOH
CHFA’s Sustainable Core
Yes Yes Yes No No No No
What can be invested in
Bond-eligible loans that support that resolution’s rating
Bond-eligible loans that support CHFA’s rating
Loans that support CHFA’s rating
Up to CHFA’s board Revolving DPA loans
Group homes approved by state
Specific Projects approved by DOH
Potential new uses
A new SF MBS resolution
Surplus funds can be used to fund CHFA DPA loans
- CHFA DPA loans - Home improve. loans - Mobile home
refinancing loans - MF loans incl. 9% tax
credit projects, take-out of bond loans, and bridge acquis’n loans
- Warehouse MBS
- Modest guarantee for CHFA DPA and home improve. loans
- MF Capital Magnet Fund
- Buy-down rate on MF bond & ITA loans
- Small gap loans
n.a. Additional group homes
n.a.
8. Addressing CHFA’s Strategic Priorities

Strategic Capital Analysis Page 46
Proposed Uses of Opportunity Fund for 2021
Purpose Opportunity Fund Funds to be Leveraged
Total Program
Amount for 2021
Uses Leveraging
Capital Magnet Fund subsidies for very low- income rental housing
$ 4 million Subsidies for very low-income rental housing
Potentially 2 to 1
U.S. Treasury, if awarded
$ 8 mill.
Homeownership lending guarantee fund
$ 1 million Cover 10% of risk on new home improvement lending program
10 to 1 ITA $ 10 mill.
Enhance CHFA multi-family lending
$ 3 million - Interest rate buydown of 1/2 of 1% on selected mf bond/ITA loans
- Interest rate protection of ½ of 1% for ITA permanent take-out loans
- Small gap loans, typically 250 – 500,000
20 to 1 ITA and multi-family bonds
$ 60 mill.
Sub-total $ 8 million $ 78 mill.
8. Addressing CHFA’s Strategic Priorities

Strategic Capital Analysis Page 47
Purpose Helping to House New England Funds to be Leveraged
Total Program
Mobile home refinancing program
$ 1 million Subsidize rate to 1% Approx. 6 to 1 ITA $ 6 mill.
Proposed Use of Helping to House New England
8. Addressing CHFA’s Strategic Priorities
Proposed ITA Lending Priorities for 2021 Purpose ITA for 2021 Funds to be Leveraged
Home improvement loan program $ 9 million $ 1 mill. from Opportunity Fund
Mobile home refinancing program $ 5 million $ 1 mill. Helping to House New England
MF loans for 9% tax credit projects, perm. take-out for bond loans, bridge acquisition loans
$ 14 million Opportunity Fund: - selected rate buydowns - interest rate protection on permanent loans - small gap loans
Sub-total $ 28 million

Strategic Capital Analysis Page 48
Does the action or decision: Why? __1. Make it easier for Board, staff, stakeholders to see CHFA’s
available resources and risks
Provide clear, comprehensive basis for decisions
__2. Reduce sensitivity to future interest rates Limit unhedged bonds to amount of CHFA’s cash investments
So CHFA is less affected by changes
__3. Maintain or increase future risk-adjusted net worth Key for CHFA’s long-term financial flexibility
__4. Help increase and stabilize long-term annual income
Determines what CHFA can do
__5. Use net annual income to increase equally: • ITA net worth and • Opportunity Fund
Assure long-term financial sustainability Create win-win
__6. Increase CHFA’s return on its investment in future income (e.g. costs of issuance and servicing release premium)
Importance of investing in ongoing income
__7. Use PAB to help maximize return to CHFA and meet needs that cannot be served otherwise
Key limited scarce resource
__8. Utilize Opportunity Fund synergistically to support bond and ITA investments
Enables CHFA to expand production while maintaining sustainability
Checklist for maintaining sustainability
9. Criteria for Major Decisions

Strategic Capital Analysis Page 49
IV. Appendix

Strategic Capital Analysis Page 50
Financial Recommendation Why Important 1. Clarify financial structure with 50% of net annual income to
Opportunity Fund and 50% to ITA Enhance both mission and long-term sustainability; provide clear choices for Board
2. Reinvest ITA principal recoveries in ITA Resource for future lending
3. Hedge $150 million of unhedged variable rate debt use hedged rather than unhedged variable rate on future issues
Protect future annual income
4. Create annual risk budget Allocates risk on new lending to help maintain rating agency-risk-adjusted net worth
5. Create rolling amendment to General Resolution to remove State pledge and create more flexibility (reduce debt service reserve to 6 months on whole loans, allow 2nd mortgages, etc.)
When ultimately incorporated in 2/3 of outstanding bonds will make General Resolution far more useful
6. Establish new single-family MBS resolution by refunding and transferring net assets from single-family NIBP resolution
More efficient single-family financings for many transactions
7. Establish drawdown warehousing line for single-family, when replacing existing warehousing facility
Improve net interest income
8. Obtain $50 mill. unsecured line of credit Supplements general liquidity if ever needed
9. Establish recycling line of credit for private activity bond cap More timing flexibility on refunding old bonds rather than keep higher-rate bonds outstanding for additional months
10. Make available two pooled multi-family issues each year, rather than one
Reduce risk if interest rates rise
11. Begin hedging single-family loan pipeline Reduce risk if interest rates rise
12. Offer single-family mortgage-backed securities for TBA sale May improve net present value compared to bond financing, Does not use PAB
13. Use interest-only strip transactions to annuitize spread income from single-family mortgage-backed securities
Where lower cost of funds than bonds to increase future annual income Does not use PAB and reduces cost of issuance
Action Plan Recommendations

Strategic Capital Analysis Page 51
Homeownership Recommendation Why Important
1. Revise downpayment assistance guidelines Help meet borrower needs Compete on downpayment assistance rather than loan rate, to help increase annual ongoing income
2. Supplement state DAP funds with ITA to assure adequate $ for expanded downpayment assistance
Avoid having to restrict amounts for borrowers Create attractive revolving investment for ITA with modest amount of Opportunity Fund $ as loss reserve
3. Do not resubordinate downpayment assistance loans
Resubordination reduces CHFA’s annual income on 1st mortgages by encouraging prepayments, and restricts $ available to help new homebuyers
4. Set mortgage rates to achieve at least 1% expected spread if bonding production
Assure adequate return given costs of issuance
5. Speed up loan and document delivery times Reduces CHFA’s rate risk
6. Consider raising net origination fees retained by lenders
If helpful to spur production and to incentivize faster deliveries Offset by slightly higher loan rate
7. Develop home improvement loan program funded by ITA
Meet strategic priority Assist many borrowers with lower, fixed cost of funds Provide attractive investment for ITA with modest amount of Opportunity Fund $ as loss reserve
Action Plan Recommendations

Strategic Capital Analysis Page 52
Multi-Family Recommendation Why Important 1. Allow prepayment:
- in 15 years with 1 point if refinancing with CHFA, - after 20 years with 1 point
Create more user-friendly relationship Encourage new lending
2. Use FHA risk-share on loans above $3 mill. Maintain rating agency risk-adjusted net worth Reduce CHFA’s exposure by 50% at almost no cost (1/8 of 1%)
3. Simplify loan underwriting for loans below $3 m. Create more user-friendly lending and reduce staff time needed
4. Amend QAP to allow 4% tax credit projects without requiring deeper affordability
Meet strategic priority Use PAB for multi-family lending as its highest priority Help finance projects which do not need deep subsidies without reducing resources for those needing such subsidies Expand CHFA’s lending
5. Explore opportunities to link CHFA lending with local project-based vouchers
Supplement limited state subsidies
6. Set interest rates to earn spread of at least 1% on bonds (or .85% with risk-share)
Maintain annual income
7. Use Opportunity Fund to buy down rates on selected loans Enables CHFA to lower loan rate by up to 50 basis points
8. Make permanent loan commitments from ITA at 50 basis points above current lending rate
Provides long-term income for ITA as take-out lender, incl. for 4% tax credit projects Enhances CHFA’s cooperation with construction lenders Use Opportunity Fund to provide additional yield protection to ITA
9. Use Opportunity Fund to make small gap loans Helps projects that do not need deep subsidies to use CHFA bond and ITA lending
10. Make available pooled bond issues twice yearly More user-friendly for borrowers Reduces CHFA interest rate exposure
11. Can provide conduit bonds on portion of redirected state PAB
Enables CHFA to offer alternative execution for up to $40 mill. per year while providing fee income
Action Plan Recommendations

Strategic Capital Analysis Page 53
Table 4. Income by Type, FY 17 – annualized 2020
Type of Income 2017 2018 2019 Annualized 2020
Ongoing from past activities
Net interest earnings* 54.887 48.966 54.673 43.5
Servicing, bond management -4.388 - 2.644 -1.049 1.8
Loan losses & foreclosure expenses - 3.100 -19.381 -4.995 -1.3**
Ongoing from past activities 47.449 26.921 48.629 45.2
Current year income
Fee income 9.496 6.820 8.773 7.3
Administrative expenses -28.602 -29.802 -28.539 -27.9
Current year income -19.106 -22.981 -19.766 -20.6
Investment in future ongoing income (costs of issuance & servicing release fees)
-11.704 -11.506 -9.392 -7.2
Total 16.639 -7.566 19.471 17.4
* Income on other resolutions is included in net interest earnings; ** foreclosures deferred by moratorium
Net Annual Income by Type of Income

Strategic Capital Analysis Page 54
Table 5. Present Value of Projected Net Worth of General Resolution and Opportunity Fund deposits through 2030 ($ mill.)
Scenario With
Existing Structure
With New Proposed Approach
Low Rates General Resolution 815 747 Opportunity Fund 0 71 Total 815 818
Higher Rates General Resolution 821 746 Opportunity Fund 0 71 Total 821 817
Higher Rates Stress General Resolution 712 681 Opportunity Fund 0 24 Total 712 705
Source: cfX cash flow projections with new production through 2023, average multi-family prepayment at 25 years, and deposits to Opportunity Fund beginning in 2020. Resolution net worth in 2030 and deposits to Opportunity Fund are present valued at 3% discount rate
Projected Cumulative Impact of Capital Structure The new proposed approach reflects recycling principal in the ITA, allocating half of net annual income to ITA and half to Opportunity Fund, and allowing multi-family prepayments as proposed

Strategic Capital Analysis Page 55
IO Strips versus Single-Family Bonds In recent months, IO strips have provided significantly greater present value executions for HFAs
Fig. 6. Impacts of IO Strips v. Bonds
Interest Only Strip Transactions v. Bonds
Notes: - Assumes $45MM financed per month - Uses actual executed IO strip pricing from other HFAs - Uses indicative and actual taxable monthly pass-through bond rates
$0
$2
$4
$6
$8
$10
$12
$14
$16
$18
$20
June July August September
Million
s
CumulativePresentValueof4MonthsofTransactions
IOStrip Bond