strategic action programme (sap) for the … sea lme sap.pdf · gef undp/gef project entitled...
TRANSCRIPT

GEFGEF
UNDP/GEF PROJECT ENTITLED “REDUCING ENVIRONMENTAL STRESS IN THE YELLOW SEA LARGE MARINE ECOSYSTEM”
STRATEGIC ACTION PROGRAMME (SAP)
FOR
THE YELLOW SEA LARGE MARINE ECOSYSTEM
UNDP/GEF Project entitled “Reducing Environmental Stress in The Yellow Sea Large Marine Ecosystem”
November 2009

Table of Contents
EXECUTIVE SUMMARY.........................................................................................................................V LIST OF ABBREVIATIONS.................................................................................................................. XI ACKNOWLEDGEMENTS .................................................................................................................. XIII 1. ENVIRONMENTAL CHALLENGES IN THE YELLOW SEA: ENVIRONMENT STATUS...1 2. ENVIRONMENTAL PROBLEMS AND CAUSES ......................................................................3
2.1 POLLUTION AND CONTAMINANTS .............................................................................................3 2.2 EUTROPHICATION......................................................................................................................4 2.3 HARMFUL ALGAL BLOOMS (HABS) ........................................................................................4 2.4 FISHING EFFORT EXCEEDING ECOSYSTEM CARRYING CAPACITY..........................................4 2.5 MARICULTURE FACING UNSUSTAINABLE PROBLEMS .............................................................5 2.6 HABITAT LOSS AND DEGRADATION .........................................................................................5 2.7 CHANGE IN ECOSYSTEM STRUCTURE ......................................................................................5 2.8 JELLYFISH BLOOMS..................................................................................................................6 2.9 CLIMATE CHANGE-RELATED ISSUES........................................................................................6
3. INSTITUTIONAL AND LEGAL FRAMEWORK IN PROTECTION OF MARINE ENVIRONMENT AND SUSTAINABLE USE OF MARINE AND COASTAL RESOURCES: CURRENT STATUS AND LIMITATIONS. ..................................................................................7
3.1 INSTITUTIONAL ARRANGEMENTS..............................................................................................7 3.2 LEGAL STANDARDS...................................................................................................................7 3.3 STAKEHOLDERS’ INVOLVEMENT...............................................................................................8
4. ENVIRONMENTAL AND SCIENTIFIC BASIS FOR THE MANAGEMENT STRATEGIES: ECOSYSTEM CARRYING CAPACITY AND REGIONAL MANAGEMENT TARGETS .....9
4.1 ECOSYSTEM SERVICES.............................................................................................................9 4.2 ECOSYSTEM CARRYING CAPACITY ..........................................................................................9 4.3 FUTURE OF ECC IN THE YELLOW SEA...................................................................................11 4.4 REGIONAL MANAGEMENT TARGETS .....................................................................................11
5. MANAGEMENT STRATEGIES: INTERVENTIONS AND ACTIONS TOWARDS 2020....13 5.1 ACTIONS PRIMARILY ADDRESSING PROVISIONING SERVICES ..............................................14
5.1.1 Technical actions...........................................................................................................15 5.1.2 Governance Actions .....................................................................................................17 5.1.3 Indicators of management actions............................................................................17
5.2 ACTIONS PRIMARILY ADDRESSING REGULATING SERVICES ................................................18 5.2.1 Technical actions...........................................................................................................18 5.2.2 Governance actions ......................................................................................................20 5.2.3 Indicators of management actions............................................................................20
5.3 ACTIONS PRIMARILY ADDRESSING CULTURAL SERVICES ....................................................20 5.3.1 Technical actions...........................................................................................................21 5.3.2 Governance actions ......................................................................................................22 5.3.3 Indicators of management actions............................................................................22
5.4 ACTIONS PRIMARILY ADDRESSING SUPPORTING SERVICES ................................................22 5.4.1 Technical actions...........................................................................................................23 5.4.2 Governance Action........................................................................................................25 5.4.3 Indicators of management actions............................................................................26
6. ECONOMIC JUSTIFICATION AND ASSESSMENT...............................................................27 6.1 ECONOMY OF MANAGEMENT ACTIONS ..................................................................................27 6.2 A CASE STUDY: WOULD MANAGEMENT ACTIONS BE EFFICIENT?.......................................28
iii

6.3 INTEGRATION OF ECONOMIC ANALYSIS INTO ECOSYSTEM MANAGEMENT ..........................31 7. INSTITUTIONAL & LEGISLATIVE ACTIONS AND FINANCIAL MECHANISM FOR
IMPLEMENTATION OF SAP ......................................................................................................32 7.1 GOVERNANCE .........................................................................................................................32
7.1.1 Institutional actions: creation of the YSLME Commission .................................32 7.1.2 Actions to improve effectiveness of legal instruments .......................................32 7.1.3 Stakeholders’ wide participation ...............................................................................33 7.1.4 Guidelines for the improvement of national governance....................................34
7.2 UPGRADING NATIONAL CAPACITY .........................................................................................34 7.3 FINANCIAL MECHANISM FOR THE IMPLEMENTATION OF YSLME SAP.................................34
8. MONITORING AND EVALUATION ...........................................................................................35 8.1 INDICATORS OF MONITORING AND EVALUATION ...................................................................35
8.1.1 Process Indicators ........................................................................................................35 8.1.2 Stress Reduction Indicators .......................................................................................36 8.1.3 Environmental Status Indicators ...............................................................................37
8.2 MECHANISM OF MONITORING AND EVALUATION ...................................................................38 8.2.1 Project Implementation Review (PIR) .......................................................................38 8.2.2 Mid-Term Evaluation .....................................................................................................38 8.2.3 Final Evaluation..............................................................................................................38
9. CONCLUSIONS ............................................................................................................................38 10. REFERENCES...............................................................................................................................39 ANNEX ......................................................................................................................................................43
iv

Executive Summary Project objectives and activities The objective of the UNDP/GEF Yellow Sea Large Marine Ecosystem (YSLME) Project is to facilitate the ecosystem-based management and environmentally-sustainable use of the Yellow Sea and its watershed by reducing development pressure and promoting sustainable development of this densely populated, heavily urbanised, and industrialised semi-enclosed shelf sea ecosystem. To achieve this objective, the YSLME Project prepared a Transboundary Diagnostic Analysis (TDA) and regional Strategic Action Programme (SAP). National Yellow Sea Action Plans (NSAPs) and demonstration activities of the SAP management actions were also prepared. Transboundary environmental problems in the Yellow Sea According to the TDA (2007) as well as to the new information reported since then, nine major transboundary environmental concerns have been identified:
• Pollution and Contaminants; • Eutrophication; • Harmful Algal Blooms (HABs); • Fishing Effort Exceeding Ecosystem Carrying Capacity; • Mariculture Facing Unsustainable Problems; • Habitat Loss and Degradation; • Change in Ecosystem Structure; • Jellyfish Blooms; and • Climate Change-related issues.
Purpose of SAP for the Yellow Sea To address these environmental issues, the YSLME SAP sets regional management targets for environmental quality of the Yellow Sea, and the required management actions to achieve these targets by 2020. Based on the concept of the “ecosystem carrying capacity” (ECC), the SAP proposes the targets and actions according to the services that the Yellow Sea ecosystem provides. The actions consists of both technical and institutional/legislative (governance) interventions. For more information about the contents of the SAP, see Section 2 in this document. Brief history of SAP development To ensure the concerns of all stakeholders were addressed in the SAP, seven meetings with regional scientists, government officials, and other relevant stakeholders such as NGOs were organised in 2007 and 2008. Initially, a consultation meeting prepared a concept paper describing the objectives and central theme of the SAP. Next, two ad-hoc working group meetings identified the regional management targets and the management actions. The final two drafting group meetings prepared the draft SAP for the special Project Steering Committee (PSC) meeting, organised immediately after the third ad-hoc working group meeting. The PSC reviewed and approved the SAP as the final draft to be submitted to the participating governments for their consideration and endorsement.
v

This document was drafted by Mr. CHUNG Suh-Yong, Mr. ENDO Isao, Mr. JIANG Yihang, Mr. JIN Xianshi, Mr. WALTON Mark, Mr. WEN Quan, and Mr. YOO Sinjae with additional contributions from Ms. CHIANG Connie, Mr. CHO Dong-Oh, Mr. FANG Jianguang, Mr. HUH Hyung-Tack, Mr. JANG In Kwon, Ms. KANG Young Shil, Mr. KWON Sukjae, Mr. LEE Jang-Uk, Mr. LEE Sang-Go, Mr. LEE Youn Ho, Mr. LI Haiqing, Ms. LI Jingmei, Mr. LIANG Fengkui, Mr. LIU Hongbin, Mr. PARK Gyung Soo, Mr. TOBAI Sadayosi, Mr. WANG Songlin, Mr. WANG Zongling, Mr. XU Xiangmin, Mr. YANG Dong Beom, Mr. YANG Yafeng, Ms. YU Ming, Mr. ZHANG Xuelei, Ms. ZHENG Wei, and Mr. ZHU Mingyuan. Ecosystem-based approach The YSLME SAP uses an innovative “ecosystem-based approach” to manage the complicated relationships between the environmental stresses and the resulting problems. The ecosystem-based approach uses scientific knowledge to guide appropriate management actions that preserve the ecosystem function of the YSLME. The goal of the YSLME SAP is to preserve the ECC which is defined as the capacity of the ecosystem to provide its ecosystem services. These services are vital for the welfare of communities surrounding the Yellow Sea. They include provisioning services (e.g. fisheries & mariculture), regulating services (e.g. regulation of climate change and water quality), cultural services (e.g. tourism), and supporting services (e.g. nutrient cycling & primary production). Traditionally, the management actions targeted problems by sector. However, this approach is of limited effectiveness as environmental problems are not normally the result of a single cause. The sector approach cannot address all the underlying causes. Based on this past experience, the ecosystem-based approach, advocated by the YSLME SAP, targets multiple ecosystem services holistically to sustain the ECC of the Yellow Sea. Regional management targets and actions The YSLME SAP proposes eleven regional management targets to sustain the ECC (Box 1). These targets primarily address a particular ecosystem service, with the understanding that achievement of a target will also benefit other ecosystem services. These targets are set using current scientific understanding and most are quantitatively measurable. Under ecosystem-based management, scientific monitoring is essential to assess the impact of the management actions and management must be adaptive to respond to new knowledge. Technical actions To achieve these regional targets, the SAP proposes associated technical management actions.
vi

Box 1: Regional targets and technical actions proposed by the YSLME SAP Provisioning Services Target 1: 25-30% reduction in fishing effort • Action 1-1: Control fishing boat numbers • Action 1-2: Stop fishing in certain areas/seasons • Action 1-3: Monitor and assess stock fluctuations
Target 2: Rebuilding of over-exploited marine living resource • Action 2-1: Increase mesh size • Action 2-2: Enhance stocks • Action 2-3: Improve fisheries management
Target 3: Improvement of mariculture techniques to reduce environmental stress • Action 3-1: Develop environment-friendly mariculture methods and technology • Action 3-2: Reduce nutrient discharge • Action 3-3: Control diseases effectively
Regulating Services Target 4: Meeting international requirements on contaminants • Action 4-1: Conduct intensive monitoring and assessment • Action 4-2: Control contaminants discharge with reference to Codex alimentarius and Stockholm
Convention • Action 4-3: Implementing MARPOL 1973/78 effectively
Target 5: Reduction of total loading of nutrients from 2006 levels • Action 5-1: Control total loading from point sources • Action 5-2: Control total loading from non-point sources and sea-based sources • Action 5-3: Apply new approaches for nutrient treatment
Cultural Services Target 6: Reduced standing stock of marine litter from current level • Action 6-1: Control source of litters and solid wastes • Action 6-2: Improve removal of marine litter • Action 6-3: Increase public awareness of marine litter
Target 7: Reduce contaminants, particularly in bathing beaches and other marine recreational waters, to nationally acceptable levels • Action 7-1: Conduct regular monitoring, assessment and information dissemination particularly in
bathing beaches and other recreational waters • Action 7-2: Control pollution in bathing beaches and other marine recreational waters
Supporting Services Target 8: Better understanding and prediction of ecosystem changes for adaptive management • Action 8-1: Assess and monitor the impacts of N/P/Si ratio change • Action 8-2: Assess and monitor the impacts of climate change • Action 8-3: Forecast ecosystem changes in the long-term scale • Action 8-4: Monitor the transboundary impact of jellyfish blooms • Action 8-5: Monitor HAB occurrences
Target 9: Maintenance and improvement of current populations/distributions and genetic diversity of the living organisms including endangered and endemic species • Action 9-1: Establish and implement regional conservation plan to preserve biodiversity
Target 10: Maintenance of habitats according to standards and regulations of 2007 • Action 10-1: Develop regional guidelines for coastal habitat management
vii
• Action 10-2: Establish network of MPAs • Action 10-3: Control new coastal reclamation • Action 10-4: Promote public awareness of the benefits of biodiversity conservation
Target 11: Reduction of the risk of introduced species • Action 11-1: Control and monitor ballast water discharge • Action 11-2: Introduce precautionary approach and strict control of introduction of non-native species
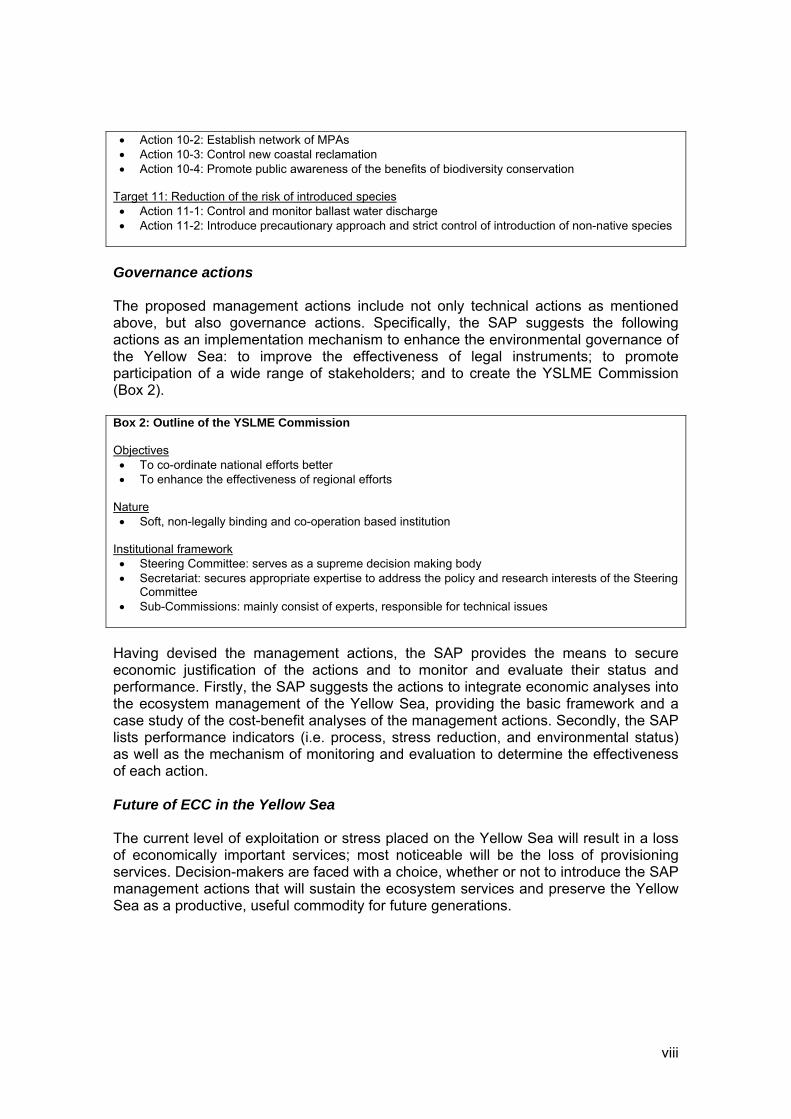
Governance actions The proposed management actions include not only technical actions as mentioned above, but also governance actions. Specifically, the SAP suggests the following actions as an implementation mechanism to enhance the environmental governance of the Yellow Sea: to improve the effectiveness of legal instruments; to promote participation of a wide range of stakeholders; and to create the YSLME Commission (Box 2). Box 2: Outline of the YSLME Commission Objectives • To co-ordinate national efforts better • To enhance the effectiveness of regional efforts
Nature • Soft, non-legally binding and co-operation based institution
Institutional framework • Steering Committee: serves as a supreme decision making body • Secretariat: secures appropriate expertise to address the policy and research interests of the Steering
Committee • Sub-Commissions: mainly consist of experts, responsible for technical issues
Having devised the management actions, the SAP provides the means to secure economic justification of the actions and to monitor and evaluate their status and performance. Firstly, the SAP suggests the actions to integrate economic analyses into the ecosystem management of the Yellow Sea, providing the basic framework and a case study of the cost-benefit analyses of the management actions. Secondly, the SAP lists performance indicators (i.e. process, stress reduction, and environmental status) as well as the mechanism of monitoring and evaluation to determine the effectiveness of each action. Future of ECC in the Yellow Sea The current level of exploitation or stress placed on the Yellow Sea will result in a loss of economically important services; most noticeable will be the loss of provisioning services. Decision-makers are faced with a choice, whether or not to introduce the SAP management actions that will sustain the ecosystem services and preserve the Yellow Sea as a productive, useful commodity for future generations.
viii

Conclusions To address the transboundary environmental problems in the Yellow Sea, the YSLME SAP develops an ecosystem-based approach to sustain the ECC holistically. The SAP not only sets regional management targets, but also devises the management actions to achieve the targets. The actions consist of both the technical and governance actions. With the implementation of these actions, the ECC of the Yellow Sea will improve and thereby continue to provide the ecosystem services. Several characteristics make the YSLME SAP unique compared to other SAPs. Firstly, the YSLME SAP employs the ecosystem-based approach rather than the traditional sector approach. Secondly, the SAP provides the concrete and measurable targets and the comprehensive management actions to achieve them. Lastly, the SAP proposes mechanisms for regional co-ordination and co-operation, including the YSLME Commission. The Yellow Sea ecosystem and its ECC will change in the future, for better or worse. If all the pressures exerted on the ecosystem continue, the Yellow Sea will degrade and its ECC will decline. However, if all the management actions proposed in this SAP are implemented and regional management targets met, the Yellow Sea will improve its capacity to supply its provisioning, regulating, cultural and supporting services and the Yellow Sea would remain a living, vital, productive, and healthy sea.
ix


List of Abbreviations CBA Cost-Benefit Analysis CBD Convention on Biological Diversity DPRK Democratic People’s Republic of Korea ECC ecosystem carrying capacity EBFM Ecosystem-based fisheries management GEF Global Environment Facility FAO Food and Agriculture Organization of the United Nations GAP Good Aquaculture Practice HABs harmful algal blooms IMO International Maritime Organisation (of United Nations) IMTA Integrated Multi-trophic Aquaculture IOC Intergovernmental Oceanographic Commission of UNESCO ITQ Individual Transfer Quota LME Large Marine Ecosystem MARPOL International Convention for the Prevention of Pollution from Ships
MPA Marine Protected Area MOU Memorandum of Understanding NGO Non-governmental organisation NOWPAP UNEP Northwest Pacific Action Plan NSAP National Strategic Action Plan PAHs polycyclic aromatic hydrocarbons PEMSEA Partnerships in Environmental Management for the Seas of East
Asia PIR Project Implementation Review POPs persistent organic pollutants ROK Republic of Korea PSC Project Steering Committee RWG Regional Working Group SAP Strategic Action Programme TAC Total Allowable Catch TDA Transboundary Diagnostic Analysis UNEP United Nations Environment Programme UNESCO United Nations Educational, Scientific and Cultural Organization UNDP United Nations Development Programme WESTPAC IOC Sub-Commission for the Western Pacific YSLME Yellow Sea Large Marine Ecosystem YSLME CSC YSLME Commission Steering Committee
xi


Acknowledgements The UNDP/GEF YSLME Project wishes to thank all those who contributed to the production of this Document.
xiii


STRATEGIC ACTION PROGRAMME (SAP) FOR
THE YELLOW SEA LARGE MARINE ECOSYSTEM 1. Environmental Challenges in the Yellow Sea: Environment status The geographic area of Yellow Sea Large Marine Ecosystem (YSLME) for use in the project was defined in the UNDP/GEF Project document [1] as the body of water bounded as follows: to the west by the Chinese coastline south of Penglai; to the north by a line from Penglai to Dalian; to the east by the Korean Peninsula and Jeju Island and a line drawn from Jindo Island off the south coast of the Korean mainland to the north coast of Jeju Island; and to the south by a line running from the north bank of the mouth of the Yangtze River (Chang Jiang) to the south-western coast of Jeju Island (Figure 1). This shallow sea has an average depth of 44m [2]. The seafloor slopes gently from China and more steeply from Korea to a trough in the eastern portion that runs south to the Okinawa Trench [2]. It was carved by the ancient Yellow River (Huang He) when Yellow Sea was dry during the last glacial period [3]. The Yellow Sea region is under the influence of the Asian monsoon system, where seasonal winds prevail. The region is also located between the Siberian High and the subtropical Pacific Low, which results in cold-dry winters and warm-wet summers [4]. The bio-geochemistry of the sea is strongly influenced by fresh water and airborne (aeolian) material. Rivers discharge approximately 1.6 billion tonnes of sediment and 1,500 billion tonnes of freshwater into the Yellow Sea annually [5] with a further 460 billion tonnes of water from rainfall [3]. The huge freshwater inputs result in temperature and salinity differences that limit the water exchange between the Yellow Sea and the East China Sea [6], so that water is only exchanged every 7 years [7] making this sea vulnerable to pollution. There are two seasonal water circulation patterns (Fig 1) but water circulation is weak [7] meaning that coastal areas are susceptible to localised pollution discharges. Nevertheless, the Yellow Sea is very productive and supports substantial populations of fish, birds, mammals, invertebrates and a huge human coastal population. This population relies on the Yellow Sea LME for many services such as: provision of fisheries (2.3 million tonnes per year) & mariculture (6.2 million tonnes per year); the support of wildlife, provision of bathing beaches & tourism, and its capacity to absorb nutrients and other pollutants. The ability of the Yellow Sea to provide these services is defined here as “ecosystem carrying capacity”. Catches of the ten most important species landed in the Yellow Sea area 1 have increased rapidly since 1986 from 400,000 tonnes to 2.3 million tonnes in 2004 [5]. However, this level of exploitation is not sustainable. In common with many other seas, over-exploitation of marine living resources mean that catches in the Yellow Sea once mostly consisting of large, long-lived, valuable demersal fish such as hairtail and small yellow croaker are now dominated by short-lived, smaller, lower trophic level and less valuable species such as anchovy and sandlance [9].
1 Yellow Sea catches may include catch from adjacent areas, likewise catch from the Yellow Sea may be landed in elsewhere
1
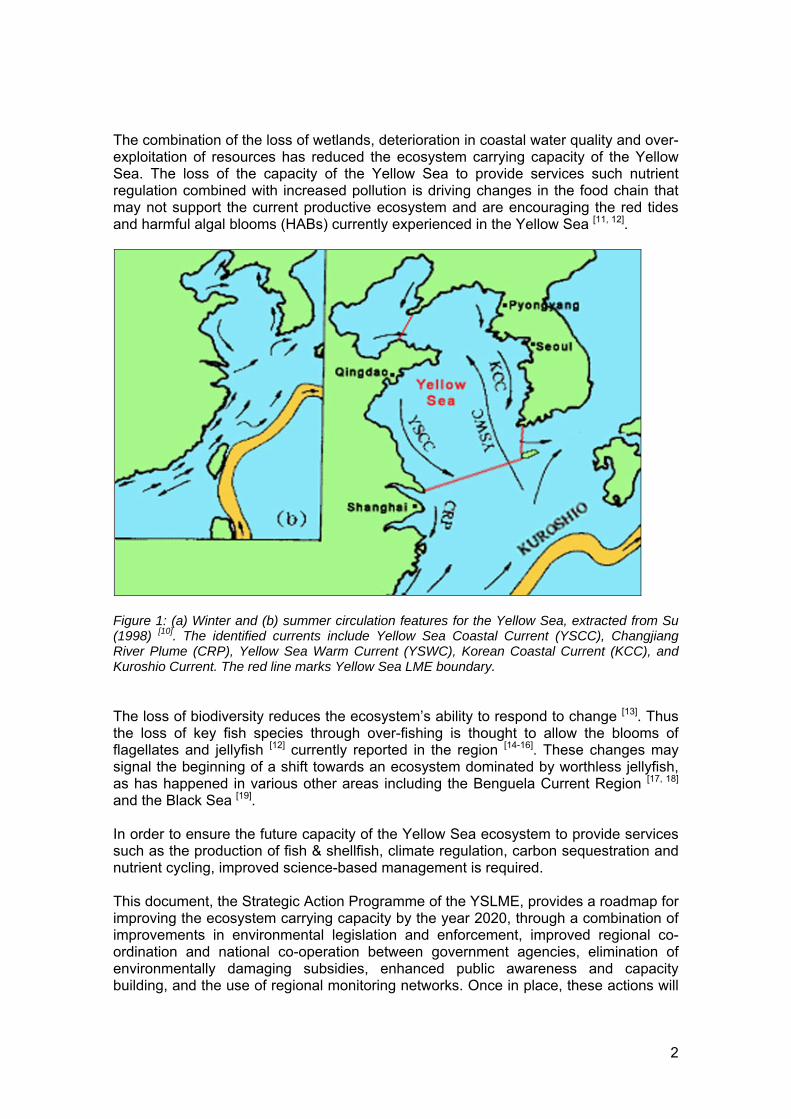
The combination of the loss of wetlands, deterioration in coastal water quality and over-exploitation of resources has reduced the ecosystem carrying capacity of the Yellow Sea. The loss of the capacity of the Yellow Sea to provide services such nutrient regulation combined with increased pollution is driving changes in the food chain that may not support the current productive ecosystem and are encouraging the red tides and harmful algal blooms (HABs) currently experienced in the Yellow Sea [11, 12].
Figure 1: (a) Winter and (b) summer circulation features for the Yellow Sea, extracted from Su (1998) [10]. The identified currents include Yellow Sea Coastal Current (YSCC), Changjiang River Plume (CRP), Yellow Sea Warm Current (YSWC), Korean Coastal Current (KCC), and Kuroshio Current. The red line marks Yellow Sea LME boundary. The loss of biodiversity reduces the ecosystem’s ability to respond to change [13]. Thus the loss of key fish species through over-fishing is thought to allow the blooms of flagellates and jellyfish [12] currently reported in the region [14-16]. These changes may signal the beginning of a shift towards an ecosystem dominated by worthless jellyfish, as has happened in various other areas including the Benguela Current Region [17, 18] and the Black Sea [19]. In order to ensure the future capacity of the Yellow Sea ecosystem to provide services such as the production of fish & shellfish, climate regulation, carbon sequestration and nutrient cycling, improved science-based management is required. This document, the Strategic Action Programme of the YSLME, provides a roadmap for improving the ecosystem carrying capacity by the year 2020, through a combination of improvements in environmental legislation and enforcement, improved regional co-ordination and national co-operation between government agencies, elimination of environmentally damaging subsidies, enhanced public awareness and capacity building, and the use of regional monitoring networks. Once in place, these actions will
2

help limit the loss of habitat, reduce environmental degradation and improve the state of over-exploited marine living resources stocks. Using the principles of ecosystem-based management and sustainable use can ensure these ecosystem services for future generations. Environmental impacts from an adjacent area, the Bohai Sea, are addressed by similar management actions identified in this document. China’s “National Action Plan for the Blue Bohai Sea” has documented reductions of fishing efforts and pollution discharge. The GEF-funded PEMSEA Project developed the “Bohai Sea Declaration”, and Environment Management Strategy in the Bohai Sea, with participation of the provinces and cities around the Bohai Sea. These efforts are going on in the region. Relevant information and impact assessment of management actions will be provided by the PEMSEA Project and the appropriate governmental agencies in China. 2. Environmental Problems and Causes The Transboundary Diagnostic Analysis (TDA) is part of the mechanism that the GEF recommends to ensure that nations sharing an large marine ecosystem (LME) begin to address coastal and marine issues by jointly analysing factual, scientific information on transboundary concerns [20]. The root causes and priorities for management actions to address those concerns are examined in the Causal Chain Analysis. The TDA process provides a useful mechanism to foster participation at all levels. This section sets out the primary environmental concerns as expressed in TDA and new information reported since the TDA was published. 2.1 Pollution and Contaminants
Pollution is the introduction of contaminants into the environment that causes harm to organisms or damage to the environment [21]. These cover a range of compounds resulting from human activities due to discharges of industrial and domestic waste. These enter the marine environment through rivers, groundwater and through the atmosphere as wet or dry deposition. Some of these contaminants occur naturally and are essential for supporting life, while others have only been found since industrialisation occurred. Most of these compounds have no detrimental effect until a certain critical concentration is reached either in food or in the environment. The Regional Working Group (RWG) - Pollution identified inorganic nitrogen and phosphate, faecal substances, heavy metals, persistent organic pollutants (POPs), polycyclic aromatic hydrocarbons (PAHs) and marine litter as the major contaminants in the Yellow Sea [1].
Inorganic nitrogen and phosphate are important nutrients that sustain phytoplankton (single celled algae) communities, which form the basis of the marine food chain. However, high concentrations stimulate excessive phytoplankton growth that cannot be consumed by zooplankton leading to eutrophication (see 2.2) and HABs (2.3). Faecal compounds from domestic waste disposal can result in contaminated water supplies or seafood, like mussels, oysters and scallops. The resulting illnesses vary from stomach ailments to dysentery or typhoid. Heavy metals, although possibly important locally around industrial areas, are not considered a transboundary problem. PAHs are also likely to be a more localised issue associated with certain industrial processes although
3

this class of compound can be mutagenic or carcinogenic [1]. Incorporation of POPs in to the food chain is, however, part of a global problem and can lead to increased health risks in humans [1]. 2.2 Eutrophication
The extensive and frequent over-use of chemical fertilizers and the increased discharges of partially treated industrial and domestic waste have raised the concentration of dissolved inorganic nitrogen in coastal waters. This nutrient enrichment acts as a fertilizer stimulating the growth of phytoplankton often to a problematic degree as evidenced by algal blooms and red tides. Few species are able to grow in this environment and feed on this productivity and therefore biodiversity is decreased. Normal food chains that support fish and shellfish are highly impacted, and production suffers[1]. The Yellow Sea is very vulnerable to eutrophication as it is isolated from the East China Sea by a strong thermohaline front [6] and internally, water circulation is weak [7]. This results in a flushing time of 7 years [7] meaning that contaminants like nitrogen can accumulate in the system.
2.3 Harmful Algal Blooms (HABs)
Frequently, the eutrophication promotes phytoplankton growth to such an extent that the bloom collapses, and the resulting bacterial decomposition causes oxygen depletion in the surrounding water causing fish kills and mass mortality of other less mobile organisms, especially in mariculture establishments [1].
Silicate (Si2-) is the result of the erosion and weathering of rocks and is carried to the sea by rivers, ground water and by the wind as dust. As a result of changing freshwater flows due to irrigation and hydroelectric projects, much of the silicate is trapped before entering the sea. The decreased silicate inputs in combination with increased nitrogen (N) concentrations have changed the ratio. This Si:N ratio is vital in sustaining the growth of diatoms. Diatoms are the most important group of phytoplankton in economically productive systems, accounting for approximately 60% of primary production by biomass in the worlds oceans [22] However, when the ratio of Si:N falls beneath a ratio of 1:1 (Redfield ratio), the lack of silicate prevents diatoms from forming their silica body walls and consequently flagellate species are favoured [23-25]. Since 1980, the Si concentration in the Yellow Sea has been close to the ecological threshold required for diatom growth [26]. The result is that organisms that are not dependent on this nutrient benefit most, such as flagellates. Some of these flagellates produce blooms (red tides and HABs) that are either toxic to higher organisms, such as human shellfish poisoning, or reduce palatability of seafood. Intense blooms can also reduce survival of fish and shellfish through gill clogging and reduced oxygen levels [1]. 2.4 Fishing Effort Exceeding Ecosystem Carrying Capacity
There is rapid increase in catches2 in the Yellow Sea from 400,000 tonnes in 1986 to almost 2.5 million tonnes in 2004, which indicate that fishing effort has exceeded Ecosystem Carrying Capacity [27, 28]. The over-exploitation is evidenced by the decrease in mean size at catch of some species over the same time period [29]. In addition the composition of catches have dramatically changed in the last decades: in 2 Yellow Sea catches may include catch from adjacent areas, likewise catch from the Yellow Sea may be landed elsewhere.
4
the 1950’s and ‘60’s the catch was dominated by small yellow croaker, large hairtail and shrimp; in the ‘70’s herring dominated the catch briefly and in the late 80’s to the present day anchovy has been the dominant species, although recently even catches of anchovy have declined and a new fishery for sandlance has developed. In general large commercially valuable species have been replaced by smaller, lower trophic level, less valuable pelagic species [1, 9, 30, 31]. Furthermore, the mean trophic level of the main commercial species in the Yellow Sea has decreased due to dietary changes as a result of ontogenetic shifts in diet, climate change induced changes in availability of dietary items and over-fishing of the prey items of carnivorous fish e.g. anchovy [32].
2.5 Mariculture Facing Unsustainable Problems The production from mariculture and freshwater aquaculture from China and Republic of Korea (ROK) has grown spectacularly and in 2005 these countries accounted for 44 million metric tonnes[33] or 70% of the world’s total production, with China accounting for the bulk of the growth [1]. Mariculture accounted for approximately 14 million tonnes in 2004 of which the greatest increases were from mollusc culture. However there are signs that these increases are facing some problems, and recently the productivity per unit area has begun to fall as the area under cultivation grows [1, 5]. This fall in productivity maybe due to the fact that only unsuitable cultivation areas now remain, or that increased proximity of farms has resulted in: increased disease transmission between farms; raised concentrations of organic wastes; and competition for food resources amongst cultivated organisms [1]. These factors all increase stress and lower the growth and survival rates of the culture organisms, thus reducing productivity.
2.6 Habitat Loss and Degradation Habitat has been lost at a staggering rate with almost 40% of coastal wetlands being converted to other uses [8] and both countries have further development plans. Coastal construction has altered coastal habitats, and industrial, agricultural and domestic effluent, aggregate mining and dumping have further degraded the marine coastal environment. These coastal wetlands are important habitat for shellfish fisheries and culture, and many of the commercially important fish species use these areas as nursery or feeding grounds at some stage in their life cycle. Additionally many endangered bird species depend on these wetlands as feeding and breeding grounds on their migration routes [5]. Moreover these wetlands perform import biogeochemical functions such as sediment retention, carbon sequestration, nutrient cycling, prevention of saltwater intrusion and coastline stabilisation.
2.7 Change in Ecosystem Structure Changes in the biomass and composition of phytoplankton and zooplankton communities could have serious consequences for fisheries productivity as these groups form the basis of the food chain. The national reports by the YSLME project indicated increases in the biomass of phytoplankton fraction > 77 μm, but decreases in the zooplankton > 500 μm on the Chinese side, while on the Korean side of the Yellow Sea increased biomass of zooplankton > 330 μm were recorded [1, 5, 27, 28]. The ratio of diatoms to dinoflagellates was reported to have decreased in recently years, possibly in response to the increasing eutrophication and decreased ratio of Si:N [1] as mentioned previously. Benthic biomass also appears to have decreased and the proportion of polychaetes seems to have increased [5], these changes are frequently associated with
5
increasing eutrophication of the sediments. The reduced benthic community could have significant consequences as it is an important food source for many commercially important fish species. As mentioned previously, there have also been changes in the composition of catches suggesting that community structure has altered as a result of overfishing and other anthropogenic impacts. 2.8 Jellyfish Blooms The TDA reported that the abundance of jellyfish has increased in recent years leading to clogging of fishing nets and increased likelihood of bathers being stung [1]. Recently it was reported that the increase in marine litter and construction of concrete structures (e.g. jetties and wharfs) has expanded the habitat available for the asexual reproductive stage of jellyfish [34]. In addition, the reduction of plankton-eating fish stocks, brought about by over-fishing, has increased the food available to support the growth of jellyfish blooms [18, 35]. There appears to be a growing consensus that pollution, acidification of the sea and changing phytoplankton communities is leading to increased jellyfish densities [12, 17, 35-38]. Not only do these higher jellyfish densities impact the tourists and fishermen in the Yellow Sea, they also directly impact fish stocks through feeding on the fish larvae and reducing the availability of zooplankton which is an important food source for larval fish [37, 39-43].
2.9 Climate Change-related Issues Air temperatures over the Korean Peninsula have increased at a rate of 0.23°C/decade since the 1960’s [44]. Although annual variation in sea temperatures appears to be connected with other major climate systems (e.g. El Nino/Southern Oscillation and the Aleutian Low) [44] , mean sea temperatures have increased 0.38 – 0.94°C/decade in the Yellow Sea [26]. The warming trend has been accelerating in recent decades and there has been a northward movement of isothermals during the period [45]. Climate change will affect marine ecosystems in many ways [46]. Changes in global precipitation and temperature patterns could alter large-scale oceanic circulation patterns [47]. As a result, circulation in marginal seas such as the Yellow Sea will be affected as well. This will affect migration and dispersal of marine organisms. Intensified stratification can reduce the productivity in the upper layer as reported from offshore waters of California [48]. Diseases are more likely in the warming environment. Already the incidence of disease in many marine species is increasing around the world [49]. Most of the major commercial fish species over-winter in the bottom cold water mass located in the central southern portion of the Yellow Sea [28]. Shrinkage of cold water mass due to climate change could have serious consequences for these stocks. Already some cold-water species, such as Pacific cod and herring, are no longer found in commercial numbers due to over-fishing and/or warming of the water mass [44]. Climate change can cause the mistiming of the arrival of migratory birds and breeding season with food availability as evidenced in other seas [50, 51]. In addition, climate driven changes in sea level could have significant impacts of the food availability to wading birds [52].
6
The increase in carbon dioxide emissions due to anthropogenic activities that is driving climate change is also causing acidification of seawater. A decrease 0.7 pH units is expected by the time fossil fuels are depleted. Already the pH of the worlds oceans has decreased 0.1 pH units, representing a 30% increase the H+ ion concentration [53]. The speed of change is causing concern, as oceans are unlikely to be able to adapt so quickly [53]. Already links between jellyfish density and acidification have been reported [54] 3. Institutional and Legal Framework in Protection of Marine Environment and
Sustainable Use of Marine and Coastal Resources: Current Status and Limitations.
3.1 Institutional Arrangements Status: Regional Co-operative institutions (e.g., YSLME, NOWPAP) exist, but the co-ordination among institutions could be improved to address environmental stresses in the region. Several international institutions exist in the region. While the YSLME Project is directly related to the regional governance in the Yellow Sea, other institutions such as Northwest Pacific Action Plan (NOWPAP), Partnerships in Environmental Management for the Seas of East Asia (PEMSEA), and IOC/WESTPAC also have some relevance to the Yellow Sea region [55]. There are also bilateral co-operative institutions including those between China and ROK based on two bilateral treaties on the environment and fisheries, i.e. the Joint Committee on the Environmental Co-operation and the Joint Fisheries Commission [55]. However, the level of co-ordination among the institutions to bring synergic effects and the efforts to avoid the duplication problem is low. For example, considering the serious impacts of the recent oil spill accident in 2007 along the west coast of ROK, better co-ordination between the YSLME Project and NOWPAP could have increased the effectiveness of regional efforts to deal with the problems. Gaps: There is a need to improve regional co-ordination. Improved regional co-ordination will enhance overall effectiveness using limited resources in the Yellow Sea region. This can be achieved by a creation of a regional co-ordinating mechanism such as the YSLME Commission. 3.2 Legal standards Status: There are several treaties and guidelines related to the environment of the Yellow Sea region, but the level of strictness and scope of coverage of these legal instruments varies. The United Nations Convention on the Law of the Sea, the London Convention and its 1996 Protocol, MARPOL, the Convention on Biological Diversity, the Ramsar Convention and the FAO Code of Conduct for Responsible Fisheries are examples of multilateral treaties and guidelines [55]. Bilateral treaties such as those between China
7
and ROK on the environment and fisheries are also relevant to the environment in the Yellow Sea [55]. However, not all of the coastal countries in the Yellow Sea region are the members of the treaties including the 1996 Protocol to the London Convention and Annex VI of the MARPOL [55]. Furthermore some treaties such as the United Nations Convention on the Law of the Sea, and the Convention on Biological Diversity do not provide detailed legally binding standards to address the problems in the Yellow Sea to the coastal countries. The FAO Code of Conduct for the Responsible Fisheries, on the other hand, may not be effective due to its non-legally binding nature. At the national level, national laws and regulations of coastal countries in the region have not been sufficiently developed to implement regional standards [55]. There exist inconsistencies of existing laws and regulations. Limited enforcement of laws and regulations contribute to the problem of implementation of legal instruments. Gaps: There is a need to improve the strictness, scope of coverage and enforcement mechanism of legal instruments. Improvement of the strictness and scope of coverage of legal instruments at the regional level will help enhance overall effectiveness of the legal instruments. Development of a regional mechanism to harmonise national legal institutions is also necessary in order to achieve equally effective implementation of legal instruments in each participating country. 3.3 Stakeholders’ Involvement Status: Several stakeholders are involved in the regional governance in the Yellow Sea region. However, the level of importance and participation varies. The government is the most important stakeholder. The role of the central governments of the participating countries has been critical. However, among the coastal countries in the Yellow Sea region, the Democratic People’s Republic of Korea (DPRK) has not fully participated in the regional efforts. Several international organisations have participated in the regional governance. UNDP has actively participated in the regional governance while the UNEP and IMO are also related to the regional governance in the Yellow Sea. Other stakeholders such as NGOs and private sectors have participated in the regional governance less actively compared with other realms [55]. Gaps: Securing participation of all the coastal countries and relevant stakeholders in the regional governance is necessary. Capacity building of some stakeholders is also important before their full participation in the regional governance. Despite some progress in securing the participation of DPRK in regional efforts, full participation of the DPRK, which is important in terms of geographical completeness and effectiveness of regional governance in the Yellow Sea region, has not been achieved yet[55]. Enhanced co-ordination among the participating governments is also necessary to enhance the effectiveness. Further constructive participation of relevant
8

international organisations needs to be sought. Capacity building of local governments and NGOs is necessary to encourage their full participation in regional governance. Finally a constructive participation of private sectors is also important to enhance overall effectiveness of regional governance in the Yellow Sea region. 4. Environmental and Scientific Basis for the Management Strategies:
Ecosystem Carrying Capacity and Regional Management Targets 4.1 Ecosystem Services The Yellow Sea provides many benefits that are crucial for the lives and wellbeing of people in the surrounding countries. The coastal population especially, relies on the Yellow Sea ecosystem for a large portion of their basic and economic requirements. These benefits obtained from ecosystems are called ecosystem services [56] and are generally classified into four categories: provisioning, regulating, cultural and supporting services [57]. Provisioning services provide ecosystem goods such as seafood (cultured as well as natural), fuels, bio-products, genetic resources and raw materials (e.g. sand & salt). Regulating services play a crucial role in the maintenance of environmental quality. These include water quality regulation, sewage treatment, waste disposal, and disease regulation. Cultural services provide non-material benefits such as spiritual, aesthetical, and recreational amenities. While some cultural services, like tourism, have market values [58], others, such as spiritual services might be difficult to be valued. Whether or not cultural services have market values, they have direct implications for human well-being. Therefore, provisioning, regulating, and cultural services provide benefits directly usable by people. There are other kinds of ecosystem services that human society needs, although they are not as visible as the above three service categories. For the three directly-usable services to be maintained, basic ecosystem functions and processes have to work. Physico-chemical and biological processes are involved in such basic ecosystem functions. For example, people eat fish and fish eat plankton, and therefore in order to sustain fish production, production of plankton communities should be maintained. Production of plankton is furthermore controlled by many physico-chemical factors. These functions that support the basic processes of ecosystems are called supporting services. Supporting services include primary production, nutrient cycling, and maintenance of biodiversity. Without supporting services, the other directly-usable services cannot be sustained. 4.2 Ecosystem Carrying Capacity Not every ecosystem provides the same quantity and quality of ecosystem services. This is because ecosystem services are the result of many physico-chemical and biological processes within the ecosystem, and different ecosystems have different structures and processes. Therefore, it is obvious that there is a limit to the ecosystem services that an ecosystem can provide. Also, as an ecosystem changes, the ecosystem services that they provide will change. For example, if the environmental conditions deteriorate, marine living resources decline and we get less seafood. The factors that change the structure and productivity of ecosystems are called drivers of the ecosystem changes [56]. Most physico-chemical factors are called direct drivers as they immediately influence ecosystems. But it is the indirect drivers that are ultimately
9

responsible for direct drivers. Urbanisation and population growth are good examples. These indirect drivers will increase the nutrient loads (a direct driver) which will lead to eutrophication. Figure 2 describes the relationship of ecosystem, ecosystem services, direct and indirect drivers, human societies, and climate system. These form a cycle which is driven by human societies and climate system.
Figure 2: Relationship of ecosystem, ecosystem services, direct and indirect drivers, human societies, and climate system. Thus, in the face of a changing world, the goal of ecosystem management will be to maximise and sustain ecosystem services. However, managing ecosystem services is a complicated issue as there are linkages and tradeoffs among services [57]. For instance, if provisioning service (aquaculture production) is unsustainably maximised, other services, such as regulating, cultural, and supporting, will be diminished in addition to reduction of wild fish catch. Because of linkages and trade-offs, we cannot manage each ecosystem service separately. This is why sectorial approaches have not been very successful. Another problem is that, not all the drivers of ecosystem changes are controllable (e.g., climate change). Climate change will further complicate the management issue as its effects will interact with anthropogenic drivers. Therefore, there is a need for a comprehensive and holistic quantity that describes this fundamental capacity of ecosystem to provide its services. We define “ecosystem carrying capacity3 (ECC)” as the capacity of an ecosystem to provide its services or the 3 “Carrying capacity” concept was originally proposed by Verhulst (1845)[59] to describe logistic growth of human population. The concept has been widely used in population ecology, e.g. Begon et al (2006) [60]. Recently, Olsen et al. (2006)[61] used the term as “ability of ecosystems to sustain fishery and other living resources"
10

sum of all the ecosystem services it can provide. ECC will be determined by various ecological processes that are inter-dependent, which in turn are determined by ecosystem configuration and state. As such, ECC will change under different environmental conditions as the ecosystem structure and processes will change. The environmental conditions will change as societal requirements increase and climate change accelerates. 4.3 Future of ECC in the Yellow Sea During the past decades, we have witnessed many signs of the deterioration of the Yellow Sea’s ECC, such as the decline of commercially important fish landings, increase of algal blooms, and novel jellyfish blooms [1]. We have identified the major environmental threats to the health of the Yellow Sea ecosystem in section 1 and 2. The problems can be summarised into five broad categories: pollution, habitat modification, mariculture facing unsustainable problems, fishing effort exceeding Ecosystem Carrying Capacity, and climate change. These problems have impacted fundamental ecosystem properties, which in turn have been changing ECC of the Yellow Sea. How will the Yellow Sea ecosystem and its ECC change in the future? If the trends identified in the TDA continue, we will experience further degradation of the Yellow Sea ecosystem and reduction of ECC. Moreover, global climate change will exacerbate the situation. Disturbances in the hydrological cycle, sea-level rise, ocean acidification, spread of diseases, rising temperature, and strengthened stratification among others will amplify the on-going problems [46, 62-68]. The impacts of climate change will be experienced throughout the whole basin. Such ecosystem changes are difficult to predict with certainty because of complicated interactions and un-controllable forcing. The future management of the Yellow Sea ecosystem therefore should be designed and executed as an adaptive, learning-based process that applies the principles of the scientific methods to the processes of management. The ultimate target of ecosystem-based management should be to sustain ECC of the Yellow Sea ecosystem. This requires that the management actions should be based on long-term scientific research and adaptive strategies. 4.4 Regional Management Targets 4 In this document, the Regional Management Targets are the regional management objectives to be achieved by 2020 through implementation of management actions. Each of the five major environmental problems mentioned above as major stresses changes ECC and affects multiple ecosystem services (Figure 3). The regional management targets should aim to the reduction of those stresses and the improvement of ECC as a whole through ecosystem-based approach. Improving ECC means improving all of its components: provisioning, regulating, cultural, and supporting services.
4 Regional Management Targets are equivalent to the Regional Ecosystem Quality Objectives from GEF document
11
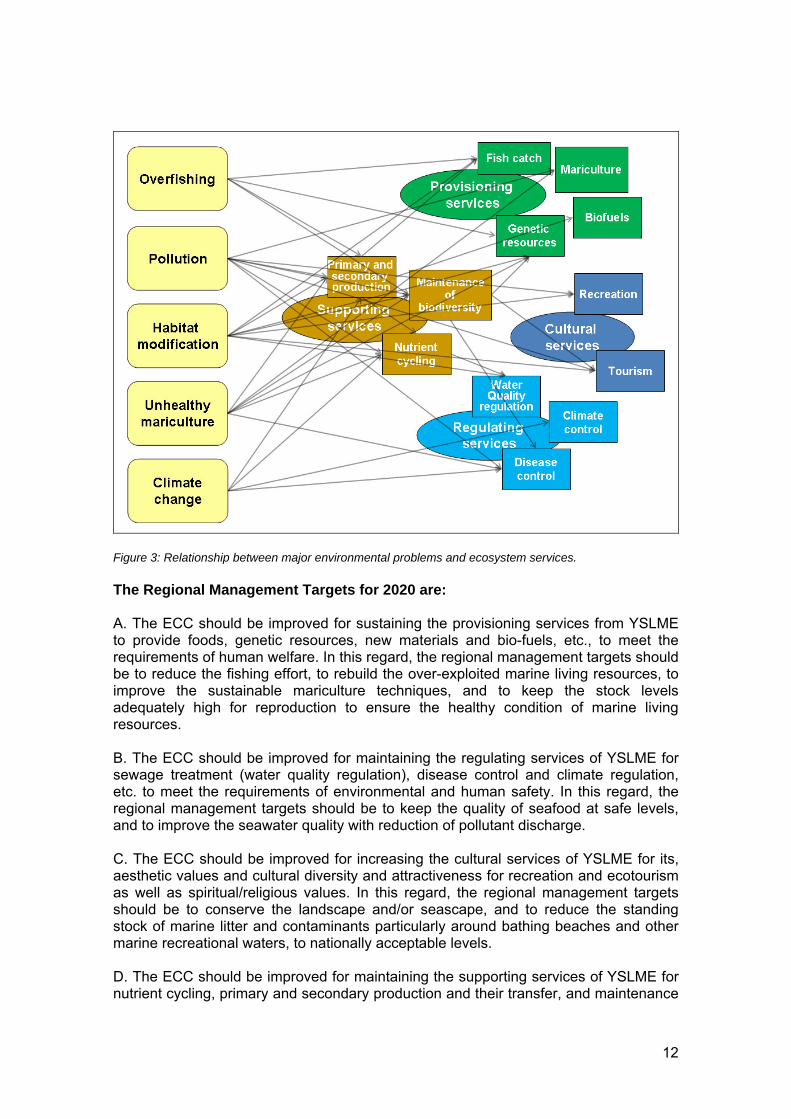
Figure 3: Relationship between major environmental problems and ecosystem services. The Regional Management Targets for 2020 are: A. The ECC should be improved for sustaining the provisioning services from YSLME to provide foods, genetic resources, new materials and bio-fuels, etc., to meet the requirements of human welfare. In this regard, the regional management targets should be to reduce the fishing effort, to rebuild the over-exploited marine living resources, to improve the sustainable mariculture techniques, and to keep the stock levels adequately high for reproduction to ensure the healthy condition of marine living resources. B. The ECC should be improved for maintaining the regulating services of YSLME for sewage treatment (water quality regulation), disease control and climate regulation, etc. to meet the requirements of environmental and human safety. In this regard, the regional management targets should be to keep the quality of seafood at safe levels, and to improve the seawater quality with reduction of pollutant discharge. C. The ECC should be improved for increasing the cultural services of YSLME for its, aesthetic values and cultural diversity and attractiveness for recreation and ecotourism as well as spiritual/religious values. In this regard, the regional management targets should be to conserve the landscape and/or seascape, and to reduce the standing stock of marine litter and contaminants particularly around bathing beaches and other marine recreational waters, to nationally acceptable levels. D. The ECC should be improved for maintaining the supporting services of YSLME for nutrient cycling, primary and secondary production and their transfer, and maintenance
12

of biodiversity, habitat preservation, etc. In this regard, the regional management targets should be to reduce the human impacts in order to maintain and improve current populations/distributions and genetic diversity of organisms including endangered and endemic species, to maintain the habitats according to standards and regulations of 2007, and to reduce the risks from introduced species and red tides. Also required is better understanding and prediction of ecosystem changes to ensure effective adaptive management.
Figure 4: The relationship between Ecosystem Carrying Capacity (ECC), ecosystem services (left) and the regional targets (right) that seek to maintain these services. 5. Management Strategies: Interventions and Actions towards 2020 To improve ECC, or the ecosystem services as a whole, eleven regional targets have been selected (Figure 4). Appropriate managements for these targets will improve physical, chemical, biological processes that sustain ecosystem services, and thereby will improve ECC eventually. In Figure 4, how these targets are related to ecosystem services are indicated by red arrows. These solid arrows indicate the major links but achieving these targets will improve more than one service. Such additional effects are indicated by dotted arrows in blue. While the eleven targets are classified by the major linkages, their effects will be multiple and holistic. Also note that the targets mainly related to supporting services will promote other services. Although supporting services are not directly usable by humans, they support other directly usable services. To sustain or maximise ECC, not only the directly-usable services, i.e., provisioning, regulating, and cultural services, but also supporting services should be maintained.
13

That is why targets seemingly having indirect relevance are included, such as monitoring and assessment of ecosystem structure and productivity. For example reducing fishing effort may not have the desired effect of rebuilding marine living resources, without a reduction in the pollutant discharge (Figure 5). This is because pollution is affecting the supporting services, degrades the environment, changing the composition of the phytoplankton (micro-algae) which in turn affects the zooplankton composition which affects the fish production. Figure 5 represents choices faced by decision makers, whether to introduce management actions to sustain ecosystem services and the resulting maintenance of fisheries catches. Or take no action with the result that by 2020 if trends continue, marine living resources will be significantly reduced and consist of smaller less valuable fish.
Figure 5: A simplified overview of the state of the ecosystem in 2020 with and without management actions. Planning and implementation of comprehensive regional ecosystem quality objectives that address problems faced by all ecosystem services are fundamental for adaptive, scientific, ecosystem-based management. 5.1 Actions Primarily Addressing Provisioning Services Due to limitation of ECC, decline in landings of many commercially important fish species and unsustainable mariculture practices have been identified as the major factors affecting the provisioning services of the Yellow Sea ecosystem. The following actions principally aim to make provisioning services of the Yellow Sea ecosystem sustainable. The first goal is to increase fisheries resources by reducing fishing pressure and rebuilding marine living resources. The second goal is to increase the sustainability of mariculture by reducing its impacts on the environment and controlling diseases effectively. Although these actions will primarily improve provisioning services, they will also have pervasive effects on regulating, cultural, and supporting services as well.
14

Regarding the Provisioning Services component including control on over-fishing and reduction of fishing efforts, the YSLME project will be in line with bilateral consultations and agreements between the competent authorities of the People’s Republic of China and the Republic of Korea. 5.1.1 Technical actions
Target 1: 25-30% reduction in fishing effort5
Management Actions 1-1: Control fishing boat numbers Reduction in fishing effort already has been implemented in the region for several years. Optional buy-back of fishing boats from fishermen will continue, a reduction of 25-30% of total marine fishing boats is recommended during 2004-2020 based on the current stock level. In addition, new boat building should be strictly controlled. Management Action 1-2: Stop fishing in certain areas/seasons Closed season and areas for fishing have been used for many years. Limitation of fishing is implemented in certain areas, such as spawning and nursery grounds in the coastal waters, and is a useful measure to conserve marine living resource. Closed seasons and areas for fishing need to be continued based on improved scientific knowledge. In China, after 12 years in practice, the summer fishing ban has been demonstrated to efficiently conserve juvenile fish stock, and should be continued. Marine protected areas for fishery resources need to be established for conservation of the spawners and genetic resources of living resources. Management Action 1-3: Monitor and assess stock fluctuations There is a need to improve quality of data and of stock and/or individual-level biological parameters. Stock assessment is the basis of fisheries management, and should be based on scientifically monitored data and independent information. Joint monitoring and analysis of major stocks, compatible data and assessment methodology need to be undertaken co-operatively as a demonstration of the benefits to the individual country. Establishment of a regional database is recommended. Target 2: Rebuilding of over-exploited marine living resources Management Action 2-1: Increase mesh size Yellow Sea is exploited by many different types of fisheries all using different gears. The main fishing method used in the YSLME is the bottom trawl which is fairly unselective in what it catches. Increasing mesh-size can reduce the percentage of
5 Estimation of reduction required to avoid over-exploitation explained and presented at the First Yellow Sea Regional Science Conference[69], the specification of management actions will be adjusted according to new regional knowledge, including the regional stock assessment organised under the project.
15

juveniles caught. More selective fishing gears and optimum mesh-size based on the studies of gear performance and fish behaviour are recommended to reduce by-catch.
Management Action 2-2: Enhance stocks To rebuild over-exploited stocks, degraded habitats for fishery resources will be improved by transplanting sea-grass and by controlling pollution and construction. Healthy, genetically diverse fry of high value fish and shellfish species will continue to be released into the sea in order to increase recruitment and help rebuild stocks. Designation of protected areas and building of artificial reefs in appropriate areas of the sea with suitable monitoring is encouraged to conserve and increase marine living resources and improve their environment. Impact of the release of hatchery-raised juveniles and construction of artificial reefs on the ecosystem should be monitored and assessed.
Management Action 2-3: Improve fisheries management Ecosystem-based fisheries management (EBFM) has been widely discussed worldwide due to the failure of single species management. Introduction of EBFM is suggested based on improved knowledge. Establishment of a self-regulation system by fishermen and community-based management in the coastal areas are recommended. Use of Total Allowable Catch (TAC) and Individual Transfer Quota (ITQ) based on survey and assessment should be encouraged in fisheries management. Fish landings should be substantially reduced to optimal levels to keep biomass at biologically safe levels. Each participating country should implement the reduction in fishing efforts to nationally acceptable level, making efforts to ensure effectiveness in securing the sustainability of provisioning services. Target 3: Improvement of mariculture techniques to reduce environmental stress Management Action 3-1: Develop environment-friendly mariculture methods and technology Yellow Sea region is one of the most productive areas in mariculture, many methods have been used. As an environment-friendly mariculture method, Integrated Multi-trophic Aquaculture (IMTA) is recommended as it will also increase economic benefit. Standard offshore technologies to different conditions should be developed. Good Aquaculture Practice (GAP) should be demonstrated at commercial scales. Management Action 3-2: Reduce nutrient discharge The development of mariculture in the region is the fastest in the world, in order to reduce its negative impacts on the ecosystem, limited water exchange aquaculture systems, recirculating systems are recommended to be established, and artificial diet improvement should be practiced on a commercial scale. Management Action 3-3: Control diseases effectively Mariculture diseases seriously affect the production. Diagnosis and control techniques for major diseases need to be developed and established. The network for an early
16

warning and diagnosis system of diseases is suggested. New techniques and management measure to control disease should be introduced to the farmers. 5.1.2 Governance Actions
Public awareness of the future benefits that a reduction of fishing boats, closed seasons/areas and improved regulations will bring, should be increased, especially among fishermen. A mechanism should be created to increase the public awareness of the benefits of IMTA, offshore aquaculture and limited-water exchange systems and artificial feeds.
Alternative livelihoods should be provided until all ex-fishermen have new job
opportunities, preferential taxation should be given to the fishermen who are engaged in non-fishing work, and subsidies for impoverished ex-fishermen are recommended [70].
Training programmes should be encouraged to provide ex-fishermen with new
techniques, information and skills.
Incorporation of stakeholders into the various decision-making systems related to marine resource management, coastal zone management, pollution management etc. is encouraged. Co-ordination is also desirable between scientists, managers, fishermen, farmers, government departments and countries.
Various management measures have already been implemented. However, with
the development of fisheries industries and international ocean environment, the current laws and regulations for fisheries management need to be improved to meet today’s requirements.
Illegal fishing and mariculture should be strictly controlled. Capacity building for
enforcement of relevant regulations should be increased.
Licenses that control both farm area and species are recommended. Standards and regulations for offshore mariculture are needed to as this industry develops. Improved regulations to control nutrient discharge and diseases in mariculture are needed, and policies to discourage use of trash fish should be encouraged.
Establishment of regional marine living resources scientific committee, as a
subsidiary body of the YSLME Commission is recommended, to conduct joint monitoring and assessment for trans-boundary marine living resources stocks and ecosystem to evaluate trans-boundary resource and to provide advice for fishery management.
5.1.3 Indicators of management actions
The following indicators are considered for management actions that address the provisioning service function of YSLME:
A 1/4 - 1/3 reduction in the number of motorized fishing boats by 2020 from 2004,
and a harvesting level will meet the “surplus yield”, implying that the stocks are kept at biologically safe levels to ensure sufficient reproductive capacity to maintain
17

marine living resources in a healthy condition. Recovery of some over-exploited commercial fish stocks.
The release of billions of fry into the sea for stock enhancement after necessary
evaluation in accordance with ecosystem stability.
The establishment of at least ten protected areas for fishery resources in the Yellow Sea.
Reduced environmental stress as a result of the widespread adoption of
environment-friendly mariculture and sustainable mariculture techniques.
Efficient operation of a network of an early warning and diagnosis system of mariculture diseases.
5.2 Actions Primarily Addressing Regulating Services
Problems affecting nutrient cycling, such as pollutant discharge, eutrophication, abnormal nutrient ratios and solid waste disposal were identified as major factors affecting regulating services of the Yellow Sea ecosystem. The following actions principally aim to improve regulating services of the Yellow Sea ecosystem. The first goal is to control contaminant discharge according to the international standards. The second goal is to reduce eutrophication by diminishing nutrient loading. Although these actions will primarily improve regulating services, they will also have pervasive effects on provisioning, cultural, and supporting services as well.
5.2.1 Technical actions Target 4: Meeting international requirements on contaminants Management Action 4-1: Conduct intensive monitoring and assessment Monitoring and assessment in the Yellow Sea have been implemented independently for many years by each of the coastal countries. A new mechanism for regional monitoring and assessment should be established. It is recommended that intensive and regional routine monitoring and assessment on marine environmental pollution in the Yellow Sea should be conducted, and a regional workshop held every 5 years focused on monitoring technology and assessment methodology. It is also recommended that a diagnostic strategy for identifying sources and sinks of pollutants should be established. Regional methodologies for monitoring and assessment of status & trends of environment should be developed and the environmental status and trends report on the Yellow Sea be prepared and issued. Management Action 4-2: Control contaminants discharge with reference to Codex alimentarius and Stockholm Convention The coastal countries have taken measures to control the discharge of contaminants for many years. It is encouraged that a basin-wide strategy be developed to address the pollution in YSLME, and to update facilities/equipment to control or reduce discharge from industrial and municipal sources with the reference to the seafood safety and reducing health risks. Regional monitoring and assessment of contaminant
18
sources and fates should be continued. The economic instruments to encourage reduced pollution loads should be introduced and a protocol to control dumping at sea be developed. Management Action 4-3: Implementing MARPOL 1973/78 effectively For control of oil pollution in Yellow Sea, effective implementation of MARPOL 1973/78 is encouraged with improvements in national and regional contingency strategies and plans for oil spills in YSLME, covering both vessels and offshore installations. The capacity for early warning and response to extreme pollution events on the sea should be strengthened. The necessary steps to fully exercise the enforcement powers should be taken. The co-operative research on measures to avoid any introductions of exotic species into the YSLME should be conducted. Target 5: Reduction of total loading of nutrients from 2006 levels
Management Action 5-1: Control total loading from point sources The total loading from point sources has been controlled in recent decades. The continuation of the strict control of pollution loading from point sources is encouraged. The routine monitoring of major input sources and loads should be enhanced with the exchange of data and information at a regional level. The total-quantity-control methodologies of pollutant discharge in combination with best available techniques should be adopted. The hot spot control should be conducted with the calculation of loads in hot spot areas. The recommendations for waste treatment capacity, including reviewing the current waste treatment facilities and for facility's future development every 5 years should be given. Clean production techniques, recycling, improvements in waste treatment systems and capacity and policies for the construction of new treatment plants should be promoted. The continuation of strict control of total nutrient loading control programme is encouraged through reduction of point and non-point pollution sources discharge, or increasing the portion of sewerage treatment. With those actions China planned to reduce total nutrient loading from point sources 10% from 2006-2010, and the reduction policy will be continued in the future. Management Action 5-2: Control total loading from non-point sources and sea-based sources The atmospheric deposition and inputs from the watershed are considered important sources of Yellow Sea pollution [71, 72]. Therefore the research on atmospheric deposition, especially of nitrogen and toxic substances (heavy metals and POPs, etc.) should be expanded. Improved management of fertiliser use is needed, including the monitoring and assessment of fertiliser use, and technical recommendations on better fertiliser use. The management on sea-based sources should also be encouraged, including monitoring and assessment of sea based sources, practice of sustainable mariculture, and dredging to remove contaminated sediments. The development of storm water treatment systems is also recommended.
Management Action 5-3: Apply new approaches for nutrient treatment
19
The new approaches for treatment of pollutants have been developed rapidly and should be applied during the period of implementing SAP. Existing or construction of additional wetlands could be further utilised as nutrient sinks. Bio-technology for treatment of nutrients in wastewater and sewage could be applied. The cost-effective means of treating municipal wastewater should be investigated and the regional recommendations be produced. 5.2.2 Governance actions
A mechanism for agreements and the methodology to share monitoring results, ecotoxicological data and relevant information should be established.
An operational mechanism for a regional forum for integrated review of hot spots
and to improve understanding of environmental capacity should be established.
A mechanism to promote best available techniques and best environmental practices for related land and sea-based industries should be established
A mechanism to encourage use of organic fertilisers, eco-agriculture and organic
fertiliser use and sustainable utilisation of wetlands should be implemented.
A mandatory review of environmental quality standards every 5 years should be conducted.
Existing regulations, with international requirements, on clean production, recycling
use, etc. should be improved.
Participating countries are recommended to establish a total nutrient loading control programme in the context of their relevant development plans.
5.2.3 Indicators of management actions The following indicators are considered for management actions that address the regulating service function of YSLME:
Well-operated regional monitoring network;
Provision of access to reliable monitoring information on environmental quality for state governance bodies and the public;
Significant reduction of total loading of the pollutants;
Significant improvement of seawater quality with reduction of human health risk.
5.3 Actions Primarily Addressing Cultural Services Marine litter and the contamination of recreational waters have been identified as major problems threatening the cultural services of the Yellow Sea ecosystem. The following actions principally aim to improve cultural services of the Yellow Sea ecosystem. The goal is to reduce contaminants and litter around bathing beaches and other recreational marine areas. To achieve this, control and monitoring of contaminants as
20
well as public participation is important. Although these actions will primarily improve cultural services, they will also have pervasive effects on provisioning, regulating, and supporting services as well. 5.3.1 Technical actions
Target 6: Reduced standing stock of marine litter from current level
Management Action 6-1: Control source of litters and solid wastes Marine litter has become a global challenge [73]. Litter and solid waste has become a major issue in coastal areas. Management of waste from coastal cities, counties and watershed should be encouraged. The technologies for waste reduction, re-use, recovery, and disposal should be implemented and the clean production and development of re-cycling economy be promoted.
Management Action 6-2: Improve removal of marine litter Litter on beaches and in coastal waters has impacted not only the aesthetics but also the lives of animals. Development and implementation of a monitoring programme for marine litter is encouraged, in conjunction with the assessment and dissemination of information, and exchange of data and information in the region. It is also recommended that the local governments and NGOs develop and implement programmes for cleaning marine litter in YSLME coastal waters.
Management Action 6-3: Increase public awareness of marine litter Public awareness of the benefits of environmental protection for young generations is the key for ensuring sustainable development of YSLME. The development and implementation of environmental awareness and education programmes, especially for primary, middle and high schools are recommended. The opportunities for NGOs participation should be created and/or provided. Educational information packages should be produced for use in schools. Target 7: Reduce contaminants, particularly in bathing beaches and other marine recreational waters, to nationally acceptable levels
Management Action 7-1: Conduct regular monitoring, assessment and information dissemination particularly in bathing beaches and other recreational waters Water quality in recreational waters will directly impact human health. To minimise health risks, agreed measurement techniques for bathing water quality should be developed with a common quality assurance support mechanism. The intensive monitoring, early-warning, assessment in the seasons and the information dissemination for bathing waters and other marine recreational waters should be conducted. The national acceptable criteria or guidelines on water quality for those areas should be developed and/or improved.
21

Management Action 7-2: Control pollution in bathing beaches and other marine recreational waters Enhanced control of pollution discharge and mediation of the impacts of accidents especially on bathing and other marine recreational waters is encouraged. The emergency response system for human health in these areas should be improved and/or developed. 5.3.2 Governance actions
More funding opportunities for recycling enterprises should be provided.
The operational approach or system for litter removal should be developed.
The environmental awareness and education programmes should be mainstreamed into national plans.
Network for government-issued public announcements on beach closures should
be established. The reporting network, especially the public participation and reporting system should be established.
More regular and stricter enforcement of marine litter laws should be carried out, and compliance with waste management laws and regulations be improved.
Clear national & regional guidelines on marine litter monitoring and assessment
should be established.
Legislation of sub-standard recreational waters should be promoted. 5.3.3 Indicators of management actions The following indicators are considered for the management actions that address the cultural services function of YSLME:
Regional guidelines for marine litter monitoring and assessment;
Establishment of operational mechanism for beach cleaning;
Published educational information package ;
Improved legislation on waste and litter management.
5.4 Actions Primarily Addressing Supporting Services
Improving provisioning, regulating, and cultural services is impossible without improving supporting services as well. This is because ecosystem functions rely on complex physical, chemical, and biological processes. Also climate change could alter overall ecosystem structure and productivity in the long run. Therefore, adaptive ecosystem managements are crucial to improve ECC of the Yellow Sea ecosystem. The following actions primarily aim to improve supporting services of the Yellow Sea ecosystem. These include maintaining habitats and biodiversity, and providing relevant
22

information of current status and forecasts on the Yellow Sea ecosystem for adaptive, scientific, ecosystem-based management. 5.4.1 Technical actions Target 8: Better understanding and prediction of ecosystem changes for adaptive management Management action 8-1: Assess and monitor the impacts of N/P/Si ratio change The basin-scale change of nutrient ratio has been observed in the Yellow Sea in the past decades [26]. Although such change could potentially impact the ecosystem structure and productivity, and ECC, these potential changes are not being systematically assessed. The long-term trend in the nutrient ratio and its impacts on the ecosystem structure should be monitored and assessed. For this, existing national monitoring and assessment methodologies need to be reviewed and harmonised. Management action 8-2: Assess and monitor the impacts of climate change There are many signs of global climate changes on regional scales. Certainly these changes will continue in the coming decades and exacerbate anthropogenic problems. The Yellow Sea ecosystem is anticipated to undergo fundamental changes in the future and its ECC shall change. For better management of the Yellow Sea ecosystem, basin-scale monitoring and assessment of the ecosystem status is necessary. For this, existing national monitoring and assessment methodologies need to be reviewed and harmonised. If necessary, sampling and assessment schemes should be improved. Management action 8-3: Forecast ecosystem changes in the long-term scale Climate-induced long-term changes in ecosystems, despite its devastating nature, cannot be managed by human. In such circumstances, forecasting the future changes and developing adaptive management scheme are the best strategy. Basic science and technologies exist for forecasting future changes of ecosystems, e.g., climate-ocean circulation models and ecosystem models. Regional efforts should be focused on integrating models and developing scenario-based projections for the future ecosystem changes. Management action 8-4: Monitor the transboundary impact of jellyfish blooms Recent outbreaks of jellyfish in the North-western Pacific are truly a transboundary problem in that reproduction occurs in the Yellow Sea or East China Sea and medusae spread out to the East Sea/Sea of Japan. These novel outbreaks not only cause damages to the fisheries but also indicate fundamental ecosystem changes. An international co-operation is required for proper monitoring and mitigation of jellyfish blooms on regional scale. This includes developing national and regional monitoring methodologies of jellyfish blooms Management action 8-5: Monitor HAB occurrences Continued eutrophication in the coasts of the Yellow Sea for the past decades resulted in increases in algal blooms since late 1980’s. Although the frequency of algal blooms
23
has not increased in recent years, monitoring these nuisance blooms should be continued for potential impacts to aquaculture, fisheries and public health. In addition the regional capability for HAB monitoring and mitigation needs to be improved. Target 9: Maintenance and improvement of current populations/distributions and genetic diversity of the living organisms including endangered and endemic species Management Action 9-1: Establish and implement regional conservation plan to preserve biodiversity As signatories to the Convention on Biological Diversity (CBD)[73], both countries already have national conservation strategies. The next logical step is to establish a regional conservation plan that would include: the establishment of new regional nature reserves/MPAs needed to maintain the population structure, distribution and genetic diversity of the living organisms and endangered and endemic species; regular regional biodiversity monitoring to assess the effectiveness of the conservation plan; and the promotion of the concept of sustainable use.
Target 10: Maintenance of habitats according to standards and regulations of 2007 Management Action 10-1: Develop regional guidelines for coastal habitat management Under the CBD, signatories are obliged to identify areas that are important for biological diversity in combination with management plans for protecting these critical habitats through promotion of the sustainable use and creation of protected areas. Management Action 10-2: Establish network of MPAs Inter-linkage of MPAs is important to ensure that migration routes and genetic exchange are maintained. As required by CBD operational objective 3.1, a national and regional system of representative nature reserves/MPAs should be established. Moreover in order to improve effectiveness of these reserves/MPAs, enforcement should be strengthened and management improved through annual assessments. Management Action 10-3: Control new coastal reclamation Intertidal wetlands play a vital role in the provision of supporting services such as nutrient absorption, carbon sequestration, sediment deposition, shore line stability, and as habitat for many commercially important fish and shell fish species as well as birds and other animals. Therefore, governments should enforce strict limits on new coastal reclamation according to current government plans. Management Action 10-4: Promote public awareness of the benefits of biodiversity conservation The benefits of biodiversity preservation in terms of increased productivity from fisheries and mariculture and the ability of the ecosystem to adapt to change and continue providing the vital ecosystem services is not generally appreciated by the
24
general public. To raise support for conservation measures increased public awareness of both the benefits of biodiversity preservation and the conservation regulations are required. Target 11: Reduction of the risk of introduced species Management Action 11-1: Control and monitor ballast water discharge The introduction of non-native species through exchange of ballast water is a growing international problem that can reduce the productivity of native species in the existing ecosystem, such as the introduction of zebra mussel to the American Great Lakes and transfer of toxic dinoflagellates that cause human shellfish poisoning, from Asia to Australia[74]. Improved control and monitoring of ballast water discharge is needed following the International Convention for the Control and Management of Ships Ballast Water & Sediments. Management Action 11-2: Introduce precautionary approach and strict control of introduction of non-native species Aquaculture farmers frequently select non-native species for their growth performance, but these introductions can have serious consequences for native species. The precautionary principle should be employed when assessing the risk of introducing a non-native species [75], and once introduced strict monitoring of the organism should continue until the risk of ecosystem modification is negligible. 5.4.2 Governance Action
For monitoring the impacts of nutrient ratio change and climate change, establishing cross-basin monitoring network and implementing monitoring activities are crucial. For this, the following activities are necessary; to create regional committee to co-ordinate monitoring and assessment; to conduct routine monitoring; to hold annual meetings to conduct joint assessment.
For ecosystem modelling activities and HAB assessment, the establishment of two
regional science committees is necessary to co-ordinate these activities. These regional science committees will oversee further activities; to establish national science committees for integrative modelling activity; to hold regular regional science committee meetings; to co-ordinate HAB assessment activities.
For monitoring jellyfish blooms, following actions are required; to establish
international monitoring network; to develop regional monitoring strategy; to implement regional monitoring.
Development of a regional framework is needed to incorporate the assessment
into management policies for climate change impacts, HAB, and jellyfish blooms. Activities to achieve this goal include; the review of monitoring strategies in national management policy; the review of the existing policy making framework; and incorporation of assessment activities in management policy.
Development of a framework to incorporate the forecasts of ecosystem change
into management policy is recommended. Activities to achieve this goal include; a
25

review of national management policy regarding climate changes and a revision of the national framework to incorporate forecasts of ecosystem change.
Creation of a regional mechanism for co-operation (such as the YSLME
Commission) is recommended and strengthened national mechanisms for inter-agency co-ordination and between government agencies and stakeholders to share information on biodiversity and biodiversity management are needed.
Improved legislation and enforcement to ensure that vulnerable and endemic
species and critical habitats are protected are required as recommended in the Convention on Biological Diversity;
Regional and national mechanisms for raising awareness of environmental issues
and legislation should be improved and public involvement through educational programmes and the promotion of eco-tourism and ecotourism livelihoods should be encouraged.
A regional conservation plan and strengthened national legislation on coastal
habitat management (including MPAs) as agreed under the Convention of Biological Diversity in addition to the creation of appropriate enforcement bodies should be established.
Clear national and regional guidelines on biodiversity monitoring and assessments
of the benefit of biodiversity to the local economy and the effectiveness of management should be identified.
Improved enforcement of international regulations on the introduction of non-native
species in combination with a strengthening of national legislation on species introductions and the use of risk assessment procedures is recommended.
5.4.3 Indicators of management actions
Continuation of cross-basin monitoring of N/P/Si change, climate impacts, and HAB trends
Working international monitoring network for jellyfish blooms,
Regular status reports of N/P/Si change, climate impacts, jellyfish blooms, HAB
trends
Scenario-based long-term projection of ecosystem changes
Development of adaptive management strategies using ecosystem status assessment and forecasting
Policy making based on adaptive management strategies
Species composition, species diversity indexes, and the density of vulnerable and
endemic species at selected sites is maintained and improved compared to the 2007 situation.
26

Area of current habitats is maintained according to standards and regulations of 2007.
The incidence of disease/parasites and impacts endemic/vulnerable species
caused by introduction of non-native species is reduced. 6. Economic Justification and Assessment 6.1 Economy of Management Actions It may be difficult to gain public support for actions which are less likely to produce economic benefits even though the actions greatly contribute to maintaining and/or improving the ecosystem services. Therefore, the management actions, described in Section 5 in this document, should be economically beneficial. To examine the economy or efficiency of a management action(s), economic analysis, specifically Cost-Benefit Analysis (CBA), is used.6 CBA compares the net benefits (i.e., the difference between “gross” benefits and costs) of management actions under two scenarios: with or without the actions. A research question that CBA addresses is: “What would happen if conservation measures [management actions] were implemented [compared] to what would have happened if they were not” [76]. The analysis then uses simple yet effective decision criteria: Comparing the gains (benefits) with the losses (costs) of an action, if the former exceeds the latter, support the action; otherwise, oppose it [77] i.e. the proposed actions are accepted if the net benefits are positive, or declined if the net benefits are negative. Figure 6 illustrates the concept of the CBA under with or without scenarios. Properly measured, the economic value of goods today may be illustrated as the leftmost column in the figure. Suppose that these benefits will decrease in the future because of environmental degradation; then, the benefits would be as shown in the next column to the right. The difference in the amount of the economic value between today and the future is the scale of predicted degradation. With management actions implemented, however, this degradation might be less (third column from the left). Comparing the results of the two scenarios, with or without management actions, would reveal the benefit of the actions. 7 In the subsequent cost-benefit analysis (the rightmost column), the benefit of implementing the management actions is compared with the cost of implementing them. The cost might consist of both direct costs and opportunity costs. If the benefits exceed the costs, it is reasonable to support the management actions.
6 CBA is regarded as the most appropriate way to assess the economy of environmental management actions, although other methods such as the cost-effectiveness analysis and the economic impact analysis can be used alternatively, if necessary. 7 The benefit, described in this document, is the “benefit of implementing management actions,” that can be defined as the prevented future loss measured in economic value. The benefit of management actions is different from the “benefit of consuming ecosystem services.” The former can be described as the difference in the amount of economic value between with- and without scenarios, while the latter can be described as the amount of the value itself. The benefit of ecosystem services can be gross or net depending on whether the cost of producing the services is included or not.
27
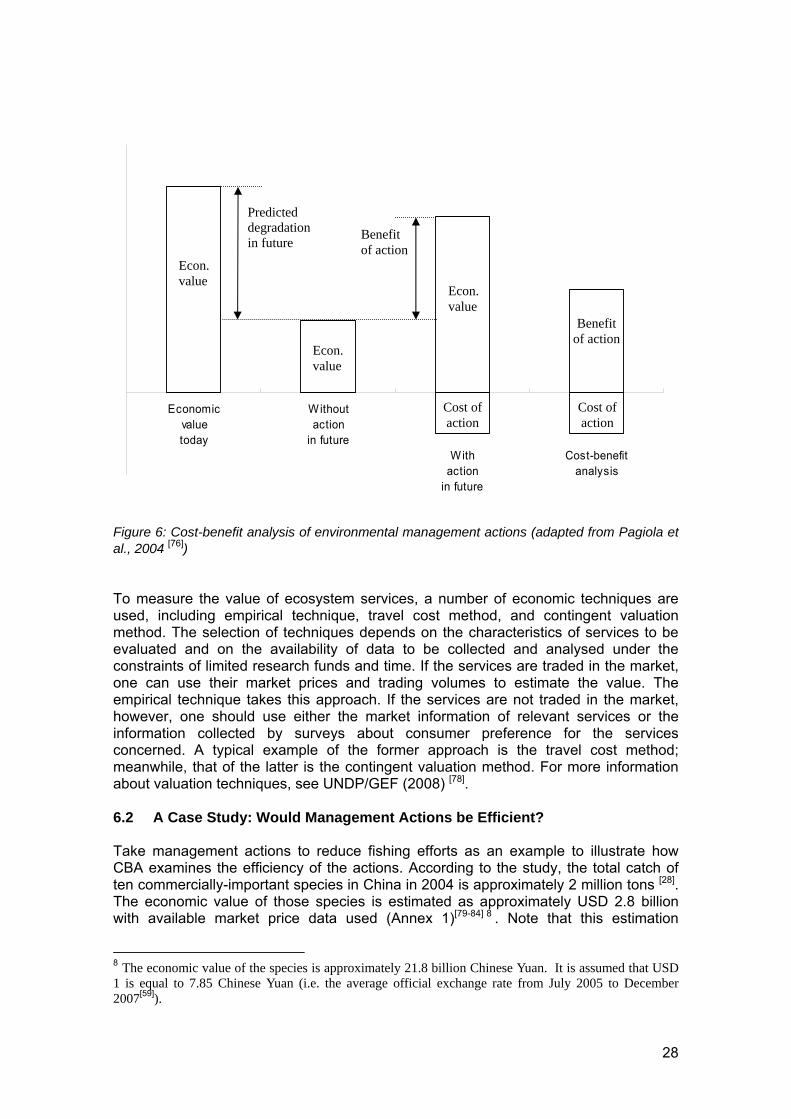
Economicvaluetoday
Withoutaction
in futureWith
actionin future
Cost-benefitanalysis
Benefit of action
Predicted degradation in future
Econ. value
Econ. value
Benefit of action
Econ. value
Cost of action
Cost of action
Figure 6: Cost-benefit analysis of environmental management actions (adapted from Pagiola et al., 2004 [76]) To measure the value of ecosystem services, a number of economic techniques are used, including empirical technique, travel cost method, and contingent valuation method. The selection of techniques depends on the characteristics of services to be evaluated and on the availability of data to be collected and analysed under the constraints of limited research funds and time. If the services are traded in the market, one can use their market prices and trading volumes to estimate the value. The empirical technique takes this approach. If the services are not traded in the market, however, one should use either the market information of relevant services or the information collected by surveys about consumer preference for the services concerned. A typical example of the former approach is the travel cost method; meanwhile, that of the latter is the contingent valuation method. For more information about valuation techniques, see UNDP/GEF (2008) [78]. 6.2 A Case Study: Would Management Actions be Efficient? Take management actions to reduce fishing efforts as an example to illustrate how CBA examines the efficiency of the actions. According to the study, the total catch of ten commercially-important species in China in 2004 is approximately 2 million tons [28]. The economic value of those species is estimated as approximately USD 2.8 billion with available market price data used (Annex 1)[79-84] 8 . Note that this estimation
8 The economic value of the species is approximately 21.8 billion Chinese Yuan. It is assumed that USD 1 is equal to 7.85 Chinese Yuan (i.e. the average official exchange rate from July 2005 to December 2007[59]).
28

represents the value of eight species, not all species, in the Yellow Sea 9. One of the major problems in fisheries in the Yellow Sea is the decline in landings of commercially-important species [1]. To address this problem, the SAP proposes management actions, including boat buy-back programme, seasonal/area fishing ban, and alternative livelihood provision, to reduce fishing efforts by 25-30% by 2020: Would those actions be efficient? Suppose that reducing fishing effort would increase fish stock; as a result, fish catch would remain constant with the management actions taken; in contrast, the catch would decrease without the actions taken. Figure 7 shows expected fish catch by 2020 under those two scenarios.10 Note that fish catch under the with-scenario remains constant from 2010 through 2020, while that under the without-scenario decreases by 30% by 2020 in this figure.
0
500,000
1,000,000
1,500,000
2,000,000
2,500,000
1986 1996 2006 2016
Year
Fish
cat
ch (t
on)
Actual catch Expected catch without action Expected catch with action
Figure 7: Expected fish catch by 2020 under with-and-without scenarios The benefits of the management actions, shown as a shaded area in Figure 7, are the difference between the fish catch under the with-scenario and that under the without-scenario. The benefits of the actions in terms of the monetary value are approximately USD 0.8 – 4.2 billion (Table 1: Row, “Benefit”). In order to compare future monetary benefits with cost of management actions put into effect at the current time, this example uses a social discount rate of between 0 - 7%. This rate equates future benefits to the present day value.11 For detailed calculation, see Annex 1. 9 This case study deals with the following eight species: Acetes, Anchovy, Chub Mackerel, Fleshy Prawn, Largehead Hairtail, Small Yellow Croaker, Spanish Mackerel, and Squid. 10 It is assumed that (i) fish catch in 2010 would be the same amount as the average of fish catch from 2000 to 2004; (ii) without the management actions, fish catch would decrease by 10-30% by 2020 due to the depletion of fish stock; (iii) with the actions, fish catch would remain constant at the same level as the average of fish catch from 2000 to 2004; and (iv) fish prices would remain constant at the level in 2007. 11 Literature suggests using 2 to 4 percent as a social discount rate, although higher rates might have been applied to the analysis of fisheries conventionally with the high risk the industry faces considered. It is
29
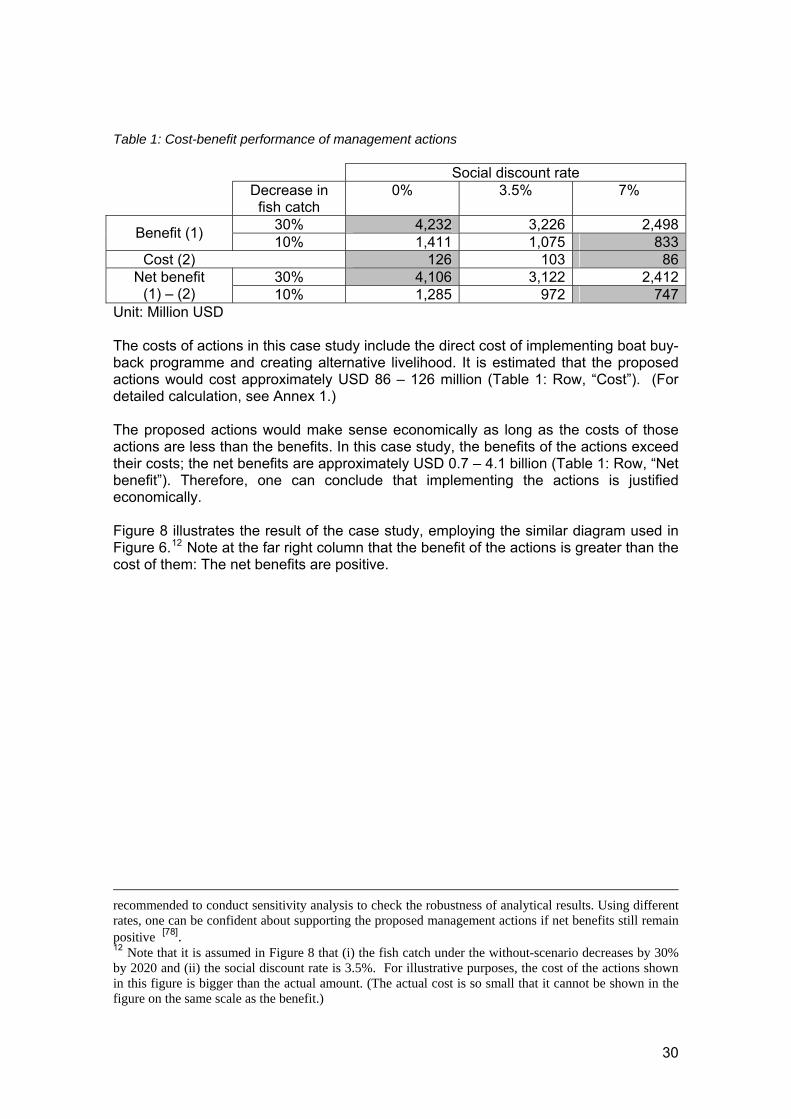
Table 1: Cost-benefit performance of management actions
Social discount rate Decrease in
fish catch 0% 3.5% 7%
30% 4,232 3,226 2,498Benefit (1) 10% 1,411 1,075 833Cost (2) 126 103 86
30% 4,106 3,122 2,412Net benefit (1) – (2) 10% 1,285 972 747
Unit: Million USD The costs of actions in this case study include the direct cost of implementing boat buy-back programme and creating alternative livelihood. It is estimated that the proposed actions would cost approximately USD 86 – 126 million (Table 1: Row, “Cost”). (For detailed calculation, see Annex 1.) The proposed actions would make sense economically as long as the costs of those actions are less than the benefits. In this case study, the benefits of the actions exceed their costs; the net benefits are approximately USD 0.7 – 4.1 billion (Table 1: Row, “Net benefit”). Therefore, one can conclude that implementing the actions is justified economically. Figure 8 illustrates the result of the case study, employing the similar diagram used in Figure 6.12 Note at the far right column that the benefit of the actions is greater than the cost of them: The net benefits are positive.
recommended to conduct sensitivity analysis to check the robustness of analytical results. Using different rates, one can be confident about supporting the proposed management actions if net benefits still remain positive [78]. 12 Note that it is assumed in Figure 8 that (i) the fish catch under the without-scenario decreases by 30% by 2020 and (ii) the social discount rate is 3.5%. For illustrative purposes, the cost of the actions shown in this figure is bigger than the actual amount. (The actual cost is so small that it cannot be shown in the figure on the same scale as the benefit.)
30

Withoutaction
in futureWith
actionin future
Cost-benefitanalysis
3.2
23.1
19.9
3.2 0.1 0.1
Unit: Billion USD Figure 8: Cost-benefit analysis of reducing fishing efforts 6.3 Integration of Economic Analysis into Ecosystem Management In general, there is a lack of the economic considerations of ecosystem management in the region. Few analyses have been conducted on conservation activities from the perspective of cost-benefit performance. The CBA of major management actions should be conducted to provide more information. To integrate economic aspects into ecosystem management, it is recommended to take the following preparatory actions by 2020:
Improve the regional guideline for economic analyses of environmental management actions;
Conduct pilot CBA studies on selected demonstration activities of the actions;
Organise technical trainings on CBA to build and/or strengthen the capacity of the
participating countries;
Integrate economic analyses into the workplan of relevant authorities to design and implement better conservation activities; and
Review the results of all the above preparatory work to not only improve the
regional guidelines, but also strengthen the national capacity.
31

7. Institutional & Legislative Actions and Financial Mechanism for
Implementation of SAP 7.1 Governance 7.1.1 Institutional actions: creation of the YSLME Commission It is desirable to establish the YSLME Commission as an institutional vehicle to continue and expand current efforts through the YSLME Project. The YSLME Commission will contribute not only to better co-ordination of national efforts but also to enhancing effectiveness of regional efforts. Nature of the YSLME Commission
The YSLME Commission is to be a soft, non-legally binding and co-operation based institution. Considering complex geopolitical situation in the Yellow Sea region, it is not appropriate to have a legally binding treaty-based institution though it could be sought in the future. However, sufficient political wills among participating governments should be secured in the form of a joint declaration or an MOU [55]. Institutional framework
YSLME Commission Steering Committee (YSLME CSC): YSLME Commission Steering Committee will serve as a supreme decision making body. YSLME CSC will include representatives of each participating government and the Secretariat.
Secretariat: The establishment of a permanent secretariat will provide secretariat
functions to the YSLME CSC. The secretariat should be small but secure appropriate expertise to address policy and research interests of the YSLME CSC.
Sub-Commissions: Several Sub-Commissions will be created and responsible for
technical issues in its own. Sub-Commissions will be mainly composed of experts.
Ensuring DPRK’s full participation DPRK’s full participation is important in terms of geographical completeness and effectiveness of the work of the YSLME Commission. More efforts need to be made to ensure DPRK’s full participation in the YSLME Commission. 7.1.2 Actions to improve effectiveness of legal instruments Improving the implementation of international & regional treaties and guidelines
In order to improve the strictness, scope of coverage and enforcement of the legal instruments, actions need to be made including, but not limited to the following:
Ensuring full ratification of the treaties;
Strengthening co-ordination between the bilateral Fisheries Agreement between China and ROK in the YSLME Commission Context;
32
Developing regional guidelines in order to incorporate suggested guidelines of the
FAO Code of Conduct for Responsible Fisheries into the YSLME Commission’s Context; and
Developing guidelines on matters not covered in detail by the United Nations
Convention on the Law of the Sea, Convention on Biological Diversity and Ramsar Convention.
Developing guidelines for periodic review of the implementation of treaties by each of the participating countries
Exchange of information on relevant domestic legislation Developing projects to harmonise domestic legislation according to the regional standards and guidelines to be developed through YSLME Commission 7.1.3 Stakeholders’ wide participation Strengthening partnerships with existing regional co-operative institutions
In order to enhance overall effectiveness, strengthening partnership with existing regional co-operative institutions, strengthening partnership with these regional institutions is necessary including, but not limited to the followings:
Strengthening co-ordination with bilateral co-operation mechanisms such as the Joint Committee on Environmental Co-operation, the Joint Fisheries Commission, China-Korea Joint Ocean Research Center, between the coastal countries
Strengthening partnership with other regional co-operative mechanisms, especially
with NOWPAP
Further strengthening current Yellow Sea Partnership among related stakeholders
Developing strong partnerships with relevant regional and international institutions to address the oil spill problems
Private sector’s involvement As private sector is an important stakeholder in the environmental and sustainable development in the Yellow Sea region, it is necessary to ensure private sector’s involvement in the YSLME Commission process. Relevant private sectors include the related industries and research and education institutions. Capacity building for NGOs and Local Governments Capacity building for NGOs and local governments is important to help these stakeholders engaging in regional governance in the Yellow Sea region in constructive ways. Capacity building for NGOs and local governments include, but not limited to the following:
33
Increasing understanding of international/regional institutions
Learning advanced management measures
Developing co-operation abilities with related stakeholders in the regional governance
7.1.4 Guidelines for the improvement of national governance Ultimate implementation of regional policies in the Yellow Sea region is made at the national level. Therefore it is important that the actions for the national governance in each participating country are appropriately taken at national level to implement regional measures effectively. Actions for the national governance in each participating country include, but not limited to the following:
Enactment and modification of legislation in order to fully incorporate regional guidelines and standards into the national legislation
Improvement of the enforcement mechanism of the policy measures
Institutional reforms to ensure effective co-ordination among the relevant
governmental bodies and other stakeholders
Wider stakeholders’ participation in the national governance
Increasing public awareness 7.2 Upgrading National Capacity Upgrading capacities of national institutions play an important role in the implementation of SAP. Based on the root cause(s) from the TDA, the weak capacities of national institutions were identified, such as the inadequate balance between development and environmental protection policy, the limited compliance assurance infrastructures, lack of co-ordination between public health sector and private sector. The actions should be taken to update the capacities of national institutions, which involve the effective management programmes, capacity-building programmes, formulation of projects eligible to be financed by international financial donors, the involvement of all identified stakeholders into the implementation of SAP. The relevant actions should be detailed in the National Strategic Action Plan (NSAP). 7.3 Financial Mechanism for the Implementation of YSLME SAP
In order to establish a sustainable financial mechanism to support implementation of YSLME SAP, there is a need to identify the financial requirements; to identify relevant financial resources and establish effective financial mechanism for raising necessary funds from possible sources, managing financial resources, and reporting financial status.
Financial requirements for implementation of SAP will be identified following the
identification of actions and activities of SAP implementation.
34

It is necessary to identify sources to meet the financial requirements for implementation of SAP, including GEF financial support, contribution from the governments of the participating countries, and potential donors. It should be noted that the financial commitments from the governments of the participating countries will be critical source of funding to show political willingness of the countries.
Financial Mechanism will be established following the establishment of the YSLME
Commission as implementing mechanism for the SAP. A staged arrangements will be prepared:
For the first 5 years (2010-2014), GEF funding will be the major financial
resource to cover the incremental costs of the project activities. In the meantime, the national co-financial resources will be used as substantive support to the project implementation.
For the second 6 years (2015-2020), the participating countries will establish a
sustained financial mechanism to cover the costs of the implementation of project activities.
Fund-raising campaign will be established within the YSLME Commission to generate financial support from private sectors and other donors. The YSLME Commission will provide overall policy on the fund raising campaign. The Head of the secretariat of the YSLME Commission has principal responsibility for identifying the financial sources, and fund raising campaigns. If necessary, special consideration should be given to this important element, including establishing a special post within the secretariat dedicated to fund raising. 8. Monitoring and Evaluation 8.1 Indicators of Monitoring and Evaluation Monitoring is a continuous or periodic function that uses systematic collection of data, qualitative and quantitative, for the purposes of keeping activities on track. It is first and foremost a management instrument [85]. This document is focused on the Project Indicator Monitoring as defined by the GEF. 8.1.1 Process Indicators The establishment of process indicators is essential to characterize the completion of institutional processes on the multi-country level or the single-country national level that will result in joint action on needed policy, legal, and institutional reforms and investments that aim to reduce environmental stress on transboundary water bodies [86].
Regional Agreement on establishing the Yellow Sea Commission for implementing the Regional SAP;
35
Based on the results and recommendations made by the Regional Governance Analysis of the Project, it is recommended that a Yellow Sea Commission should be established in charge of the implementation of the SAP. As one of the most important indicators, the establishment and effective operation of the Yellow Sea Commission will be a good “process indicator”. This indicator presents the regional mechanism for the implementation of the SAP. It is hoped that the DPRK would join the Commission in an appropriate stage.
Established national mechanism for implementing the National SAPs; The Inter-Ministerial Co-ordinating Committee established within the project should be strengthened to take more responsibilities in implementing activities identified in SAP, in particular those activities have transboundary nature. The well-established and well-functioned national mechanism provides national institutional arrangement to protect marine environment in the Yellow Sea.
Establishment of cross-basin monitoring network & implementation of regional monitoring activities, (including scientific research);
As the project objective is to establish ecosystem-based management of the marine environment in the Yellow Sea, a basin-wide monitoring programme should be established to provide scientific knowledge and environment information on the status of marine environment. The regional monitoring network should cover all the elements relevant to marine environment, and should have regular and effective monitoring activities and reports.
Improved regulation and legislation and strengthened enforcement in the participating countries will cover following aspects:
To promote sustainable exploitation of fish stocks. To control total loading of pollutants. To establish regional conservation plan to protect endemic and vulnerable
species.
To establish national and regional systems of representative nature reserves/MPAs and to integrate into a global network and as a contribution to globally agreed goals.
To establish environment-target-control mariculture practice.
Established sustainable financial mechanism for implementation of SAP.
8.1.2 Stress Reduction Indicators Stress reduction indicators relate to the specific on-the-ground measures implemented by the collaborating countries. Often a combination of stress reduction indicators in several nations may be needed to produce detectable changes in transboundary waters.
Reduced and controlled fishing efforts, to reduce stress in over-fishing;
36

Reduced number of fishing boat. Improved selectivity of fishing gear. Scientific assessment of summer fishing-ban.
Enhanced sustainable mariculture
Established carrying capacity guidelines for planning mariculture. Enhanced integrated multi-trophic mariculture techniques to reduce
introduction of pollutants to the marine environment.
Established new MPAs and improved management effectiveness of existing nature reserves/MPAs to reduce stress in loss and modification of marine habitats
Improved effectiveness of management for MPAs including the quality of
prepared management plans. Restriction on new reclamation. Increase public involvement in MPAs management.
Controlled and/or reduced pollution discharge to reduce stress of marine
environment pollution
Updated knowledge of current waste treatment facilities. Improved treatment system and capacities, including established new
treatment facilities. Established regional regular monitoring system to better understand status and
trends of pollutants in marine environment. 8.1.3 Environmental Status Indicators For projects in damaged transboundary systems, years may go by before a sufficient number of countries have implemented sufficient stress reduction measures to enable a change to be detected in the transboundary water environment.
Established cross-basin monitoring network and implementing monitoring activities to better understand the environment status in the Yellow Sea
Harmonised monitoring methodologies and assessment of impacts ecosystem. Developed comprehensive models to predict change and its impact on
fisheries.
Better understanding of environment status in the Yellow Sea through established regional monitoring system;
Marine living resources stock improvement after reduction of fishing efforts. Reduced pollution load and concentration.
Protected marine habitats, in particular coastal wetlands
Reduced rate of habitat loss. Maintained ecological characters of critical habitats including species
compositions, species diversity indexes.
37
Reduced number of endangered species. 8.2 Mechanism of Monitoring and Evaluation The YSLME Commission is the overall responsible body for monitoring and evaluation of the implementation of the SAP. 8.2.1 Project Implementation Review (PIR) The YSLME secretariat is responsible for preparation of annual Project Implementation Review (PIR) to be submitted to the Commission for review and decision-making whenever deemed necessary. The PIR will also be submitted to UNDP and GEF. The YSLME secretariat should prepare management responses to the comments and decisions made by the Commission. 8.2.2 Mid-Term Evaluation Mid-term evaluation should be organised at the midpoint of the first phase of the SAP implementation (first 5 years), and at the midpoint of the second phase of SAP implementation. The mid-term evaluation should be carried out by the external/independent experts selected by the Commission, in consultation with UNDP and GEF, based on the indicators established for the monitoring and evaluation. 8.2.3 Final Evaluation Final evaluation should be organised in the end of first phase of the SAP implementation (first 5 years), and in the end of the second phase of SAP implementation. The final evaluation should be carried out by the external/independent experts selected by the Commission, in consultation with UNDP and GEF (for the first phase of implementation), based on the indicators established for the monitoring and evaluation. 9. Conclusions The Yellow Sea ecosystem and its ECC will change in the future, for worse or for better. If all threats and the problems to the ecosystem continue, following the trends identified in the TDA, the Yellow Sea will undergo further degradation of its ecosystem and reduction in its ECC, which means the Yellow Sea will have reduced capacity to provide its services that support human welfare. If all the management actions listed in this SAP are implemented to meet regional targets, the Yellow Sea would improve its capacity to provide provisioning, regulating, cultural and supporting services. By 2020, it is expected that if all the management actions have been taken, the Yellow Sea will be a living sea, which is vital, productive and healthy. Moreover, by 2020, if all the management targets have been achieved by coastal countries, the Yellow Sea would be a sea of co-operation, a sea of friendship, a sea of peace and a sea of safety.
38

10. References 1. UNDP/GEF, 2007. Transboundary diagnostic analysis for the Yellow Sea LME. UNDP/GEF
project: Reducing environmental stress in the Yellow Sea Large Marine Ecosystem, Ansan, Republic of Korea. p. 98.
2. J. Song, 1997. Chemistry of the sediment-seawater interface of the China seas (in Chinese). Beijing: China Ocean Press. 222.
3. C.S. Chung, Hong, G.H., Kim, S.H., Park, J.K., Bang, I.K., Kim, Y.I., Moon, D.S., Zhang, J., and Yang, D.B.. 2000. Estuarine systems of the East Asia region: carbon, nitrogen and phosphorus fluxes. LOICZ Reports & Studies No.16,. p. 37-40.
4. PICES, 2004. Marine ecosystems of the North Pacific., in PICES Special Publication 1. p. 280.
5. UNDP/GEF, 2007. The Yellow Sea: Analysis of the Environmental Status and Trends. Volume 3: Regional synthesis reports. UNDP/GEF project: Reducing environmental stress in the Yellow Sea Large Marine Ecosystem, Ansan, Republic of Korea. p. 408.
6. H. J. Lie, Cho, C. H., Lee, J. H., Lee, S., Tang, Y. X., and Zou, E. M., 2001. Does the Yellow Sea Warm Current really exist as a persistent mean flow? Journal of Geophysical Research-Oceans. 106(C10): p. 22199-22210.
7. I.K. Chung, Kang, Y.H., Yarish, C., Kraemer, G.P., and Lee, J.A., 2002. Application of seaweed cultivation to the bioremediation of nutrient-rich effluent. Algae. 17(3): p. 187-194.
8. M. Barter, 2002. Shorebirds of the Yellow Sea. Wetlands International -Oceania: Canberra, Australia. p. 104.
9. X. S. Jin and Tang, Q. S., 1996. Changes in fish species diversity and dominant species composition in the Yellow Sea. Fisheries Research. 26(3-4): p. 337-352.
10. J. Su, 1998. Circulation Dynamics of the China Seas North of 18 N, in The Sea, Robinson, A.R. and K.H. Brink, Editors. Wiley: New York. p. 483–505.
11. C.B. Officer and Ryther, J.H., 1980. The possible importance of silicon in marine eutrophication. Marine Ecology Progress Series. 3: p. 83-91.
12. V. Vasas, Lancelot, C., Rousseau, V., and Jordan, F., 2007. Eutrophication and overfishing in temperate nearshore pelagic food webs: a network perspective. Marine Ecology-Progress Series. 336: p. 1-14.
13. K. S. McCann, 2000. The diversity-stability debate. Nature. 405(6783): p. 228-233. 14. M. Kawahara, Uye, S., Ohtsu, K., and Izumi, H., 2006. Unusual population explosion of the
giant jellyfish Nemopilemia nomurai (Scyphozoa : Rhizostomeae) in East Asian waters. Marine Ecology-Progress Series. 307: p. 161-173.
15. W. W. Xian, Kang, B., and Liu, R. Y., 2005. Jellyfish blooms in the Yangtze Estuary. Science. 307(5706): p. 41-41.
16. S. Uye and Ueta, U., 2004. Recent increase of jellyfish populations and their nuisance to fisheries in the Inland Sea of Japan. Bulletin of the Japanese Society of Fisheries Oceanography. 68(1): p. 9-19.
17. A. Bakun and Weeks, S. J., 2006. Adverse feedback sequences in exploited marine systems: are deliberate interruptive actions warranted? Fish and Fisheries. 7(4): p. 316-333.
18. C. P. Lynam, Gibbons, M. J., Axelsen, B. E., Sparks, C. A. J., Coetzee, J., Heywood, B. G., and Brierley, A. S., 2006. Jellyfish overtake fish in a heavily fished ecosystem. Current Biology. 16(13): p. R492 - R493.
19. G. M. Daskalov, 2002. Overfishing drives atrophic cascade in the Black Sea. Marine Ecology-Progress Series. 225: p. 53-63.
20. K. Sherman, 2005. A modular strategy for recovery and management of biomass yields in large marine ecosystems. Strategic Management of Marine Ecosystems. 50: p. 65-80.
21. Anon, 2008. Merriam-Webster dictionary. http://www.merriam-webster.com/dictionary/pollution,
22. P. Tréguer, Nelson, D. M., van Bennekom, A. J., DeMaster, D. J., Leynaert, A., and Quéguiner, B., 1995. The silica balance in the world ocean: a reestimate. Science. 268: p. 375–379.
39

23. C. Humborg, 2000. Silicon retention in river basins: Far-reaching effects on biogeochemistry and aquatic food webs in coastal marine environments. AMBIO. 29(1): p. 45-50.
24. J. W. Dippner, 1998. Competition between different groups of phytoplankton for nutrients in the southern North Sea. Journal of Marine Systems. 14(1-2): p. 181-198.
25. R.E. Turner, Qureshi, N., Rabalais, N., Dortch, Q., Justic, D., Shaw, R.F., and Cope, J., 1998. Fluctuating silicate: nitrate ratios and coastal plankton food webs. Proceedings of the National Academy of Sciences. USA.. 95: p. 13048–13051.
26. C. Lin, Ning, X., Su, J., Lin, Y., and Xu, B., 2005. Environmental changes and the responses of the ecosystems of the Yellow Sea during 1976-2000. Journal of Marine Systems. 55(3-4): p. 223-234.
27. UNDP/GEF, 2007. The Yellow Sea: Analysis of the Environmental Status and Trends. Volume 2: National reports - Republic of Korea. UNDP/GEF project: Reducing environmental stress in the Yellow Sea Large Marine Ecosystem, Ansan, Republic of Korea. p. 718.
28. UNDP/GEF, 2007. The Yellow Sea: Analysis of the environmental status and trends. Volume 1: National reports - China. UNDP/GEF project: "Reducing environmental stress in the Yellow Sea Large Marine Ecosystem", Ansan, Republic of Korea. p. 620.
29. B.D. Xu and Jin, X.S., 2005. Variations in fish community structure during winter in the southern Yellow Sea over the period 1985-2002. Fisheries Research. 71(1): p. 79-91.
30. X. Jin, Xu, B., and Tang, Q., 2003. Fish assemblage structure in the East China Sea and southern Yellow Sea during autumn and spring. Journal of Fish Biology. 62(5): p. 1194-1205.
31. X. S. Jin, 2003. Fishery biodiversity and community structure in the Yellow and Bohai Seas. Proceedings of the Third World Fisheries Congress. 38: p. 643-650.
32. B. Zhang, Tang, Q., and Jin, X., 2007. Decadal-scale variations of trophic levels at high trophic levels in the Yellow Sea and the Bohai Sea ecosystem. Journal of Marine Systems. 67: p. 304-311.
33. FAO, 2008. http://www.fao.org/figis/servlet/SQServlet?ds=Aquaculture&k1=COUNTRY&k1v=1&k1s=41&outtype=html,
34. S. Uye. 2007. Jellyfish bloom in the Northwest Pacific: Current status and environmental impacts. in UNDP/GEF Yellow Sea Project, First Yellow Sea Regional Science Conference "Ecosystem carrying capacity of the Yellow Sea: Scientific approaches for marine environmental management". Hangzhou, China, 14-16 August 2007: UNDP/GEF & China Ocean News.
35. C.E. Mills, 2001. Jellyfish blooms, are populations increasing globally in response to changing ocean conditions. Hydrobiologia. 451: p. 55-68.
36. D. Malakoff, 2001. Interest blooms in growing jellyfish boom. Science. 293(5536): p. 1766-1766.
37. Jennifer E. Purcell and Arai, Mary N., 2001. Interactions of pelagic cnidarians and ctenophores with fish: A review. Hydrobiologia. (451): p. 27-44.
38. J. E. Purcell, 2005. Climate effects on formation of jellyfish and ctenophore blooms: a review. Journal of the Marine Biological Association of the United Kingdom. 85(3): p. 461-476.
39. K. Barz and Hirche, H. J., 2007. Abundance, distribution and prey composition of scyphomedusae in the southern North Sea. Marine Biology. 151(3): p. 1021-1033.
40. J. Titelman and Hansson, L. J., 2006. Feeding rates of the jellyfish Aurelia aurita on fish larvae. Marine Biology. 149(2): p. 297-306.
41. L. J. Hansson, Moeslund, O., Kiorboe, T., and Riisgard, H. U., 2005. Clearance rates of jellyfish and their potential predation impact on zooplankton and fish larvae in a neritic ecosystem (Limfjorden, Denmark). Marine Ecology-Progress Series. 304: p. 117-131.
42. C. P. Lynam, Heath, M. R., Hay, S. J., and Brierley, A. S., 2005. Evidence for impacts by jellyfish on North Sea herring recruitment. Marine Ecology-Progress Series. 298: p. 157-167.
43. S. Hay, 2006. Marine ecology: Gelatinous bells may ring change in marine ecosystems. Current Biology. 16(17): p. R679-R682.
40

44. S. Kim, Zhang, C-I., Kim, J-Y., Oh, J-H., Kang, S., and Lee, JB, 2007. Climate variability and Its effects on major fisheries in Korea. Ocean Science Journal. 42(3): p. 179-192.
45. S.D. Hahn, 1994. SST warming of Korean coastal waters during 1881-1990. KODC Newsletter. 24: p. 29-37.
46. J.T. Hardy, 2003. Climate Change: Causes, effects, and solutions. West Sussex: John Wiley and Sons. 247.
47. A.J. Weaver, 1993. The oceans and global warming. Nature. 364: p. 192-193. 48. D. Roemmich and McGowan, J., 1995. Climatic warming and the decline of zooplankton in
the California Current. Science. 267: p. 1324-1326. 49. C.D. Harvell, Kim, K., Burkholder, J.M., Colwell, R.R., Epstein, P.R., and Grimes, D.J.,
1999. Emerging marine diseases-climate links and anthropogenic factors. Science. 285: p. 1505-1510.
50. M. Frederiksen, Edwards, M., Mavor, R. A., and Wanless, S., 2007. Regional and annual variation in black-legged kittiwake breeding productivity is related to sea surface temperature. Marine Ecology-Progress Series. 350: p. 137-143.
51. S. Wanless, Frederiksen, M., Daunt, F., Scott, B. E., and Harris, M. P., 2007. Black-legged kittiwakes as indicators of environmental change in the North Sea: Evidence from long-term studies. Progress in Oceanography. 72(1): p. 30-38.
52. Graham E. Austin and Rehfisch, Mark M., 2003. The likely impact of sea level rise on waders (Charadrii) wintering on estuaries. Journal for Nature Conservation (Jena). 11(1): p. 43-58.
53. J. C. Blackford and Gilbert, F. J., 2007. pH variability and CO2 induced acidification in the North Sea. Journal of Marine Systems. 64(1-4): p. 229-241.
54. M. J. Attrill, Wright, J., and Edwards, M., 2007. Climate-related increases in jellyfish frequency suggest a more gelatinous future for the North Sea. Limnology and Oceanography. 52(1): p. 480-485.
55. UNDP/GEF, 2008. The Yellow Sea: Analysis of the environmental status and trends. Volume 4: Governance analysis. UNDP/GEF project: "Reducing environmental stress in the Yellow Sea Large Marine Ecosystem", Ansan, Republic of Korea. p. 336.
56. W.V. Reid, Mooney, H.A., Cropper, A., Capistrano, D., Carpenter, S.R., Chopra, K., Dasgupta, P., Dietz, T., Duraiappah, A.K., Hassan, R., Kasperson, R., Leemans, R., May, R.M., McMichael, A.J., Pingali, P., Samper, C., Scholes, R., Watson, R.T., Zakri, A.H., Shidong, Z., Ash, N.J., Bennett, E., Kumar, P., Lee, M.J., Raudsepp-Hearne, C., Simons, H., Thonell, J., and Zurek, M.B., 2005. Ecosystems and human well-being: Synthesis: Island Press, Washington, District of Columbia. 155.
57. R. Hassan, Scholes, R., and Ash, N., 2005. Ecosystems and human well-being: current state and trends: findings of the Condition and Trends Working Group of the Millenium Ecosystem Assessment: Island Press. 917.
58. R. Costanza, dArge, R., deGroot, R., Farber, S., Grasso, M., Hannon, B., Limburg, K., Naeem, S., Oneill, R. V., Paruelo, J., Raskin, R. G., Sutton, P., and vandenBelt, M., 1997. The value of the world's ecosystem services and natural capital. Nature. 387(6630): p. 253-260.
59. P.F. Verhulst, 1845. Recherches mathematiques sur la loi d'accroissement de la population. Nouveaux Memoires de l'Academie Royale des Sciences et Belles-Lettres de Bruxelles. 18: p. 1-45.
60. M. Begon, Townsend, C.R., and Harper, JL. . 2006. Ecology: From individuals to ecosystems: Blackwell Publishing,. 738.
61. S. B. Olsen, Sutinen, J. G., Juda, L., Hennessey, T. M., and Grigalunas, T. A., 2006. A handbook on governance and socioeconomics of large marine ecosystems: University of Rhode Island. 94.
62. P. M. Cox, Betts, R. A., Jones, C. D., Spall, S. A., and Totterdell, I. J., 2000. Acceleration of global warming due to carbon-cycle feedbacks in a coupled climate model. Nature. 408(6809): p. 184-187.
63. R. A. Feely, Sabine, C. L., Lee, K., Berelson, W., Kleypas, J., Fabry, V. J., and Millero, F. J., 2004. Impact of anthropogenic CO2 on the CaCO3 system in the oceans. Science. 305(5682): p. 362-366.
41
42
64. C. D. Harvell, Mitchell, C. E., Ward, J. R., Altizer, S., Dobson, A. P., Ostfeld, R. S., and Samuel, M. D., 2002. Ecology - Climate warming and disease risks for terrestrial and marine biota. Science. 296(5576): p. 2158-2162.
65. J. L. Sarmiento, Gruber, N., Brzezinski, M. A., and Dunne, J. P., 2004. High-latitude controls of thermocline nutrients and low latitude biological productivity. Nature. 427(6969): p. 56-60.
66. IPCC, 2007. Climate Change 2007: Impacts, adaptation and vulnerability. Contribution of Working Group II to the Fourth Assessment Report of the Intergovernmental Panel on Climate Change, ed. Parry, M.L., O.F. Canziani, J.P. Palutikof, P.J. van der Linden, and C.E. Hanson. Cambridge, UK: Cambridge University Press. 976.
67. J. Raven, Caldeira, K., Elderfield, H., Hoegh-Guldberg, O., Liss, P., Riebesell, U., Shepherd, J., C., Turley, and Watson, A., 2005. Ocean acidification due to increasing atmospheric carbon dioxide. Policy document 12/05. The Royal Society, The Clyvedon Press Ltd: Cardiff. p. 68.
68. C.L. Sabine, Heimann, M., Artaxo, P., Bakker, D.C.E., Chen, C.T.A., Field, C.B., and Gruber, N., 2004. Current status and past trends of the global carbon cycle, in Global carbon cycle: Integrating humans, climate, and the natural world, Field, C.B. and M.R. Raupach, Editors. Island Press,Washington, Distict of Columbia. p. 17-44.
69. J. U. Lee. 2007. Status and management issues of fisheries in the Yellow Sea. in UNDP/GEF Yellow Sea Project, First Yellow Sea Regional Science Conference "Ecosystem carrying capacity of the Yellow Sea: Scientific approaches for marine environmental management". Hangzhou, China, 14-16 August 2007: UNDP/GEF & China Ocean News.
70. China State Council, 2006. Action Compendium of Conservation of Aquatic Living Resources of China. http://www.cnfm.gov.cn,
71. P. Zou. 2007. Nitrogen and phosphorus loading in 5 estuaries to the Yellow Sea during the past 20 years in Jiangsu Coast, China. in UNDP/GEF Yellow Sea Project, First Yellow Sea Regional Science Conference "Ecosystem carrying capacity of the Yellow Sea: Scientific approaches for marine environmental management". 14-16 August 2007Hangzhou, China,: UNDP/GEF & Ocean China News.
72. S. Liu. 2007. Atmospheric depositions to the Yellow Sea. in UNDP/GEF Yellow Sea Project, First Yellow Sea Regional Science Conference "Ecosystem carrying capacity of the Yellow Sea: Scientific approaches for marine environmental management". Hangzhou, China,14-16 August 2007: UNDP/GEF & China Ocean News.
73. UNEP, 2006. Report of the second session of the intergovernmental review meeting on the implementation of the Global Programme of Action for the Protection of the Marine Environment from Land-based Activities. UNEP/GPA/IGR.2/7. p. 16.
74. FRS, 2006. Aquatic organisms in ships' ballast water, 2008 75. COP, 2002. Conference of the Parties 6 Decision VI/23: Guiding principles for the
prevention, introduction and mitigation of impacts of alien species that threaten ecosystems, habitats or species.,
76. S. Pagiola, Ritter, K., and Bishop, J., 2004. How much is an ecosystem worth?: Assessing the economic value of conservation. Washington, DC.: World Bank:. 48.
77. T.H. Tietenberg, 2003. Environmental and natural resource economics. 6th ed. Boston, Massachusetts.: Addison Wesley. 646.
78. UNDP/GEF, 2008. Guideline for economic analysis of environmental management actions for the Yellow Sea., Endo, I., Editor. UNDP/GEF project: Reducing environmental stress in the Yellow Sea Large Marine Ecosystem: Ansan, Republic of Korea. p. 29.
79. Anon, 2007. http://www.shuichan.com, December 2007 80. Anon, 2007. http://www.21food.com, December 2007 81. Anon, 2007. http://fish.gov.cn, December 2007 82. Anon, 2007. http://www.cappma.com, December 2007 83. Anon, 2007. http://00968.com, December 2007 84. Anon, 2007. http://feed.aweb.com.cn, December 2007 85. GEF, 2006. The Global Environment Facility Monitoring and Evaluation Policy. 86. A. M. Duda, 2002. Monitoring and Evaluation Indicators for GEF International Waters
Projects. Monitoring and Evaluation Working Paper 10.

Annex Annex 1. Summary of economic analysis of fisheries management actions Economic value of commercially-important species
Table A1: Economic Value of commercially-important species in 2004
Year Small Yellow
Croaker
Spanish Mackerel Anchovy Chub
Mackerel Largehead
Hairtail Acetes Fleshy Prawn Squids Total
Fish catch in 2004
(ton)
187,309 273,699 878,512 136,159 303,321 293,820 7,651 29,982 2,110,453
Price in 2007
(Yuan per ton)
13,905 14,000 1,740 7,000 12,180 26,000 160,000 12,000
Value in 2004
(in 2007 million Yuan)
2,605 3,832 1,529 953 3,694 7,639 1,224 360 21,836
Value in 2004
(in 2007 million USD)
332 488 195 121 471 973 156 46 2,782
Note: It is assumed that USD 1 is equal to 7.85 Chinese Yuan[59]. Estimation of fish catch Fish catch from 2010 to 2020 is expected based on the following assumptions:
• Fish catch in 2010 would be the same amount as the average of fish catch from 2000 to 2004 [4]; • Without the management actions, fish catch would decrease by 10-30% by 2020 due to the depletion of fish stock (Table A2
[a]); • With the actions, fish catch would remain constant at the same level as the average of fish catch from 2000 to 2004 (Table A2
[b]);
43

Table A2: Estimated fish catch from 2010 to 2020 (a) Without action
Year Small Yellow
Croaker
Spanish Mackerel Anchovy Chub
Mackerel Largehead
Hairtail Acetes Fleshy Prawn Squids Total
2010 164,920 254,029 988,960 145,058 242,477 266,197 7,260 42,743 2,111,644 2011 159,973 246,408 959,291 140,706 235,202 258,211 7,042 41,461 2,048,295 2012 155,025 238,787 929,622 136,355 227,928 250,226 6,824 40,178 1,984,946 2013 150,078 231,166 899,953 132,003 220,654 242,240 6,607 38,896 1,921,596 2014 145,130 223,546 870,285 127,651 213,380 234,254 6,389 37,614 1,858,247 2015 140,182 215,925 840,616 123,299 206,105 226,268 6,171 36,332 1,794,898 2016 135,235 208,304 810,947 118,948 198,831 218,282 5,953 35,049 1,731,548 2017 130,287 200,683 781,278 114,596 191,557 210,296 5,735 33,767 1,668,199 2018 125,340 193,062 751,609 110,244 184,282 202,310 5,518 32,485 1,604,850 2019 120,392 185,441 721,941 105,892 177,008 194,324 5,300 31,202 1,541,500 2020 115,444 177,820 692,272 101,541 169,734 186,338 5,082 29,920 1,478,151
Unit: Ton Note: It is assumed that fish catch would decrease by 30% by 2020 in this table.
(b) With action
Year Small Yellow
Croaker
Spanish Mackerel Anchovy Chub
Mackerel Largehead
Hairtail Acetes Fleshy Prawn Squids Total
2010 164,920 254,029 988,960 145,058 242,477 266,197 7,260 42,743 2,111,644 2011 164,920 254,029 988,960 145,058 242,477 266,197 7,260 42,743 2,111,644 2012 164,920 254,029 988,960 145,058 242,477 266,197 7,260 42,743 2,111,644
… … … … … … … … … … 2020 164,920 254,029 988,960 145,058 242,477 266,197 7,260 42,743 2,111,644
Unit: Ton Note: It is assumed that fish catch would remain constant from 2010 through 2020.
44

45
Price of commercially-important species Suppose that fish prices would remain constant at the level in 2007 (Table A3).
Table A3: Price of commercial fish in 2007 Small Yellow
Croaker Spanish Mackerel Anchovy Chub Mackerel Largehead
Hairtail Acetes Fleshy Prawn Squids
13,905 14,000 1,740 7,000 12,180 26,000 160,000 12,000 Unit: Chinese Yuan per ton Source: Retrieved in December 2007 and January 2008 on http://www.shuichan.com, http://www.21food.com, http://fish.gov.cn, http://www.cappma.com, http://00968.com, and http://feed.aweb.com.cn.

Benefits of management actions The value of fish catch under the with- and without-scenarios is calculated based on the information of Table A2 and A3. That is, the value of fish catch in any given year is the sum of the amount of each species in that year multiplied by the corresponding price in 2007. See Column 1 and 2 in Table A4. The benefits of the actions are then calculated by taking the difference between the value of fish catch under the with-scenario and that under the without-scenario. See the far-right column in Table A4.
Table A4: Value of fish catch under with- and without-scenarios Year Value of catch
without action Value of catch
with action Benefit of action
(1) (2) (2) – (1) 2010 20,134,836,038 20,134,836,038 - 2011 19,530,790,957 20,134,836,038 604,045,081 2012 18,926,745,876 20,134,836,038 1,208,090,162 2013 18,322,700,795 20,134,836,038 1,812,135,243 2014 17,718,655,713 20,134,836,038 2,416,180,325 2015 17,114,610,632 20,134,836,038 3,020,225,406 2016 16,510,565,551 20,134,836,038 3,624,270,487 2017 15,906,520,470 20,134,836,038 4,228,315,568 2018 15,302,475,389 20,134,836,038 4,832,360,649 2019 14,698,430,308 20,134,836,038 5,436,405,730 2020 14,094,385,227 20,134,836,038 6,040,450,811
PV (r = 0.0%) 33,222,479,463 PV (r = 3.5%) 25,320,675,561 PV (r = 7.0%) 19,611,217,348
Unit: Chinese Yuan per ton Note: It is assumed that fish catch would decrease by 30% by 2020 in this table. The total (gross) benefits of management actions, measured in terms of present value (PV), depend on the expected decrease in fish catch as well as on the social discount rates (r). Table A5 summarises expected benefits ranging from approximately 6.5 to 33.2 billion Chinese yuan (USD 0.8 – 4.2 billion).
Table A5: Expected benefits of management actions
Social discount rate (r) 0% 3.5% 7%
30%
33,222,479,463(4,232,162,989)
25,320,675,561(3,225,563,766)
19,611,217,348 (2,498,244,248) Decrease in
fish catch (%) 10%
11,074,159,821(1,410,720,996)
8,440,225,187(1,075,187,922)
6,537,072,449 (832,748,083)
Unit: Chinese Yuan Note: The unit of the numbers in parentheses is U. S. dollars. The total costs of the actions, in this example, are the sum of the direct cost of implementing the following activities: boat buy-back programme, alternative livelihood provision, and law enforcement. The annual national budget for the first two activities is
46

270 million Chinese Yuan; that for the last activity is 90 million Chinese Yuan. The national budget covers the four seas: the Bohai Sea, the East China Sea, the South Sea, and the Yellow Sea. The annual budget for the Yellow Sea is roughly 90 million Chinese Yuan, taking the total budget divided by four: (270 million + 90 million) / 4 = 90 million. Table A6 shows the expected budget or the costs of the actions that will accrue from 2010 to 2020.
Table A6: Expected costs of management actions
Year Cost of action 2010 90,000,0002011 90,000,0002012 90,000,000
… …2020 90,000,000
PV (r = 0.0%) 990,000,000(126,114,650)
PV (r = 3.5%) 810,139,593(103,202,496)
PV (r = 7.0%) 674,880,690(85,972,062)
Unit: Chinese Yuan Note: The unit of the numbers in parentheses is U. S. dollars. The total net benefits of the actions are the difference between the benefits and costs of implementing the actions. The difference can be calculated based on the information provided in Table A5 and A6. Table A7 summarises the cost-benefit information of the actions with the estimated net benefits.
Table A7: Cost-benefit performance of management actions
Social discount rate Decrease in
fish catch 0% 3.5% 7%
30% 33,222,479,463(4,232,162,989)
25,320,675,561 (3,225,563,766)
19,611,217,348(2,498,244,248)
Benefit (1) 10% 11,074,159,821
(1,410,720,996)8,440,225,187
(1,075,187,922) 6,537,072,449(832,748,083)
Cost (2) 990,000,000
(126,114,650)810,139,593
(103,202,496) 674,880,690(85,972,062)
30% 32,232,479,463(4,106,048,339)
24,510,535,967 (3,122,361,270)
18,936,336,658(2,412,272,186)Net benefit
(1) – (2) 10% 10,084,159,821
(1,284,606,347)7,630,085,594 (971,985,426)
5,862,191,759(746,776,020)
Unit: Chinese Yuan Note: The unit of the numbers in parentheses is U. S. dollars.
47