straight talk - canada west foundationcwf.ca/wp-content/uploads/2015/12/cwf_straighttalk... ·...
TRANSCRIPT
Straight Talk
Property Taxes in WesternCanada’s Big Six
October 2004
Casey Vander PloegSenior Policy Analyst
Western Cities Project Report #33
F O U N D A T I O N
WestCanada

www.cwf.caISBN 1-894825-53-5
© 2004 Canada West Foundation
Printed in Calgary, Alberta, Canada
CWF Report 2004-17
Canada West Foundation recognizes and thanks the funders of this research study on property taxes. Funders include the
Alberta Department of Municipal Affairs and the Cities of Edmonton, Calgary, Saskatoon, Regina, and Winnipeg.
Additional funding for the larger Western Cities Project is provided by the Federation of Canadian Municipalities (FCM),
the Alberta Urban Municipalities Association (AUMA), and the City of Red Deer.
The author would like to thank the CWF Urban Finance Advisory Committee for their ongoing advice and suggestions with
respect to this study. The Advisory Committee includes Marlys Bilanski (City of Saskatoon), Georges Chartier (City of
Winnipeg), Harvey Crone (City of Edmonton), John Dunfield (City of Calgary), Doug Fisher (City of Regina), Mel McMillan
(University of Alberta), and Bruce Richards (City of Saskatoon).
The author also extends a special note of thanks to CWF Policy Analyst Vien Huynh for collecting a number of the data
variables used in this study and the Dominion Bond Rating Service (DBRS), whose reports on municipal, federal, and
provincial finances were used to develop components of the CWF property tax datasets.
Straight Talk was authored by Canada West Foundation Senior Policy Analyst Casey Vander Ploeg. This report is part of a
larger series of reports discussing municipal finance issues, and is part of the Foundation’s Western Cities Project. The
opinions expressed in this report are those of the author alone and not necessarily those of the Advisory Committee or
Canada West Foundation’s donors, subscribers, or Board. Permission is hereby granted by the Canada West Foundation to
reproduce this document for non-profit and educational purposes. Copies are available for download from the CWF web site
(www.cwf.ca).
PROJECTWESTERN CITIES
This research report is part of the Canada West Foundation’s Western Cities Project, a multi-year research and public consultation
initiative focused on identifying the policy challenges facing western Canada’s largest cities, and best practices in resolving such
policy challenges. Through the Canada West Foundation’s emphasis on citizen engagement, the Western Cities Project promotes
public awareness of the growing importance of cities to the economic, social, and cultural lives of western Canadians. The project,
which began in 2000, includes the following research components:
• Urban Water Management • Urban Growth and Affordable Housing
• Urban Infrastructure • Municipalities in Federalism
• Urban Finance • Urban Arts and Culture
• Urban Regions • Urban Aboriginal People
To learn more about the Western Cities Project, please visit the Canada West Foundation web site (www.cwf.ca).
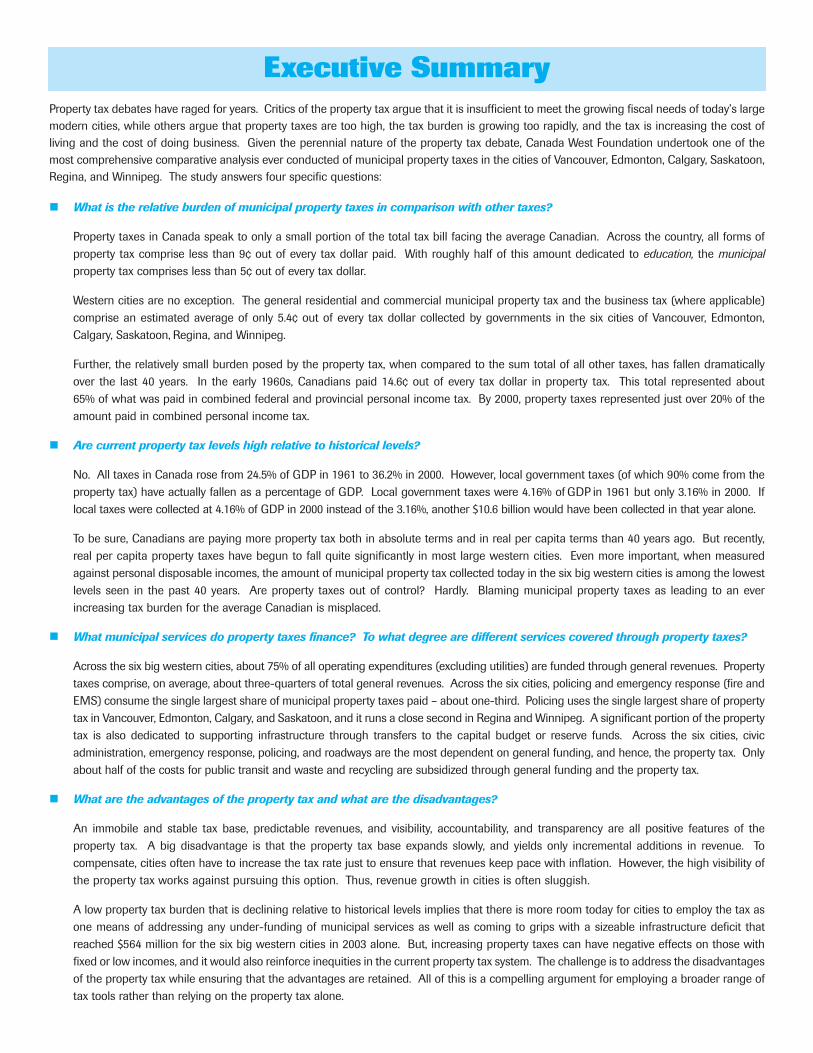
Property tax debates have raged for years. Critics of the property tax argue that it is insufficient to meet the growing fiscal needs of today’s largemodern cities, while others argue that property taxes are too high, the tax burden is growing too rapidly, and the tax is increasing the cost ofliving and the cost of doing business. Given the perennial nature of the property tax debate, Canada West Foundation undertook one of themost comprehensive comparative analysis ever conducted of municipal property taxes in the cities of Vancouver, Edmonton, Calgary, Saskatoon,Regina, and Winnipeg. The study answers four specific questions:
�� What is the relative burden of municipal property taxes in comparison with other taxes?
Property taxes in Canada speak to only a small portion of the total tax bill facing the average Canadian. Across the country, all forms of property tax comprise less than 9¢ out of every tax dollar paid. With roughly half of this amount dedicated to education, the municipal property tax comprises less than 5¢ out of every tax dollar.
Western cities are no exception. The general residential and commercial municipal property tax and the business tax (where applicable) comprise an estimated average of only 5.4¢ out of every tax dollar collected by governments in the six cities of Vancouver, Edmonton, Calgary, Saskatoon, Regina, and Winnipeg.
Further, the relatively small burden posed by the property tax, when compared to the sum total of all other taxes, has fallen dramatically over the last 40 years. In the early 1960s, Canadians paid 14.6¢ out of every tax dollar in property tax. This total represented about 65% of what was paid in combined federal and provincial personal income tax. By 2000, property taxes represented just over 20% of the amount paid in combined personal income tax.
�� Are current property tax levels high relative to historical levels?
No. All taxes in Canada rose from 24.5% of GDP in 1961 to 36.2% in 2000. However, local government taxes (of which 90% come from the property tax) have actually fallen as a percentage of GDP. Local government taxes were 4.16% of GDP in 1961 but only 3.16% in 2000. If local taxes were collected at 4.16% of GDP in 2000 instead of the 3.16%, another $10.6 billion would have been collected in that year alone.
To be sure, Canadians are paying more property tax both in absolute terms and in real per capita terms than 40 years ago. But recently, real per capita property taxes have begun to fall quite significantly in most large western cities. Even more important, when measured against personal disposable incomes, the amount of municipal property tax collected today in the six big western cities is among the lowest levels seen in the past 40 years. Are property taxes out of control? Hardly. Blaming municipal property taxes as leading to an ever increasing tax burden for the average Canadian is misplaced.
�� What municipal services do property taxes finance? To what degree are different services covered through property taxes?
Across the six big western cities, about 75% of all operating expenditures (excluding utilities) are funded through general revenues. Property taxes comprise, on average, about three-quarters of total general revenues. Across the six cities, policing and emergency response (fire and EMS) consume the single largest share of municipal property taxes paid – about one-third. Policing uses the single largest share of property tax in Vancouver, Edmonton, Calgary, and Saskatoon, and it runs a close second in Regina and Winnipeg. A significant portion of the property tax is also dedicated to supporting infrastructure through transfers to the capital budget or reserve funds. Across the six cities, civic administration, emergency response, policing, and roadways are the most dependent on general funding, and hence, the property tax. Only about half of the costs for public transit and waste and recycling are subsidized through general funding and the property tax.
�� What are the advantages of the property tax and what are the disadvantages?
An immobile and stable tax base, predictable revenues, and visibility, accountability, and transparency are all positive features of the property tax. A big disadvantage is that the property tax base expands slowly, and yields only incremental additions in revenue. To compensate, cities often have to increase the tax rate just to ensure that revenues keep pace with inflation. However, the high visibility of the property tax works against pursuing this option. Thus, revenue growth in cities is often sluggish.
A low property tax burden that is declining relative to historical levels implies that there is more room today for cities to employ the tax as one means of addressing any under-funding of municipal services as well as coming to grips with a sizeable infrastructure deficit that reached $564 million for the six big western cities in 2003 alone. But, increasing property taxes can have negative effects on those with fixed or low incomes, and it would also reinforce inequities in the current property tax system. The challenge is to address the disadvantages of the property tax while ensuring that the advantages are retained. All of this is a compelling argument for employing a broader range of tax tools rather than relying on the property tax alone.
Executive Summary

STRAIGHT TALK: Property Taxes in Western Canada’s Big Six
INTRODUCTION
Ask any Canadian how much tax he or she pays, and the likely
answer will be “too much!” Most taxpayers, this one included,
often feel that taxes are simply too high. This sentiment is not
restricted to the public community, broadly speaking. It can also
be found in debates occurring within the more narrow political
and economic policy community. The fact is, debates have raged
for years over the issue of taxes. But nowhere is this debate
more vigorous and enduring than in Canada’s municipalities.
Whether one lives in a large metropolitan centre, a medium-sized
city, a small town, or a rural village, property taxes are often the
local issue of the day.
In one corner are those residents, business owners, and other
interests who argue that property taxes are too high, the tax
burden is growing too rapidly, and the tax is increasing the cost
of living and the cost of doing business. In the opposite corner
is another group of taxpayers, along with the municipal
administrations responsible for delivering local services. They
understand that the property tax base does not always grow
alongside the broader economy and incremental increases in the
property tax rate are sometimes needed to cover the costs of
inflation, accommodate population growth, and simply maintain
services never mind increasing overall revenues in real terms.
Caught in the middle are mayors and city councillors –
confronted with the choice of “raising taxes” to maintain services
and support infrastructure, or pursuing a “zero-percent” property
tax increase policy and finding ways to trim expenditures and
even cut local services.
Given the perennial nature of the property tax debate, this study
seeks answers to four specific questions. In large part, the
questions are designed to uncover whether the municipal
property tax debate has been overstated.
� What is the relative burden of municipal property taxes in comparison with other taxes such as personal income tax, corporate income tax, and sales taxes?
� Are current property tax levels high relative to historical levels?
� What municipal services do property taxes finance? To what degree are different services covered through property taxes?
� What are the relative advantages of the property tax and what are the disadvantages?
METHODOLOGY
Answering these questions demands a study rich in data. Here,
Canada West Foundation researchers employed four strategies.
First, a dataset was constructed detailing the taxes collected by
the three orders of government in Canada from 1961-2000. In
building this dataset, almost 40 years of National Income and
Expenditure Accounts (NIEA) data published by Statistics Canada
were reviewed. (These data are often referred to as the system of
National Accounts or the Provincial Economic Accounts.) With
these data, the various taxes collected can be totalled and the
relative burden of each tax measured. The various taxes can also
be set against a number of control variables such as economic
output (GDP) or personal incomes to determine whether taxes
have increased in real or relative terms.
The system of National Accounts is a consistent and reliable source
of tax data, but unfortunately, amounts are not broken out for
individual cities and the municipal portion of the property tax is not
separated from the education portion. Because our questions
speak to the relative municipal property tax burden facing citizens
in western Canada’s six large cities, Canada West Foundation
researchers also built city-specific datasets using the Public
Accounts – annual reports and budgets published by individual
governments, and other reports such as those of the bond rating
agencies. This effort resulted in five detailed tax datasets for the
incorporated cities of Edmonton, Calgary, Saskatoon, Regina, and
Winnipeg from 1960-2003. A dataset was also built for Vancouver,
but issues of data consistency, comparability, and access limit this
dataset to the 1990-2003 period.
To determine the relative property tax burden in the large
western cities, property taxes were compared to federal and
provincial Public Accounts tax data drawn from past budgets and
bond rating reports issued by the Dominion Bond Rating Service
(DBRS). To uncover whether property taxes in the six large
western cities have actually increased, a number of control
variables were also collected, particularly the incomes generated
in the cities. These data were secured from Revenue Canada’s
Tax Statistics on Individuals. In building the city-specific dataset,
the financial statements and supporting schedules in some 250
separate municipal annual reports issued by the six cities were
explored, along with forty volumes of income tax statistics
published by Revenue Canada, and dozens of bond rating
reports issued by the DBRS.
1
WestCanada
Third, each of the cities under review (with the exception of
Vancouver) was requested to submit to the Canada West
Foundation a dataset highlighting the specific services funded by
the property tax in their cities. These datasets allowed researchers
to determine the extent to which certain services are funded by the
property tax as opposed to other financing such as user fees.
Finally, results of a literature review were pulled together to
uncover the primary arguments both for and against the property
tax as a means of financing large cities. In addition, financial
directors in each of the cities were asked their opinions. A
number of these arguments have been put forward in prior
Canada West Foundation studies on municipal finance, but in
this report they are more carefully assessed, better organized,
and more formally framed. This helps in arriving at an overall
assessment of the appropriateness of the property tax in funding
today’s large modern cities.
CHALLENGES and CAVEATS
Collecting and comparing decades of government tax collections
is no small assignment. The system of National Accounts eases
the frustration because these data share a common set of
baseline parameters. With these data, there are only two
cautions to note. First, the National Accounts used for this study
represent three separate reporting periods with slightly different
methodologies (1961-1980, 1981-1991, and 1992-2000). Slight
variances between the three periods are evident with a number
of data points. Second, the 1992-2000 period may include some
federal and provincial taxes that were not recorded in earlier
years. However, the overall impact of these irregularities is not
significant, rarely producing more than a 2.0% difference on any
data point between the three periods.
More caution is in order regarding the Public Accounts. Here,
governments are generally more free to employ their own
accounting methods. Changes in accounting standards,
government operations, and consolidation practices occur
frequently, and comparable figures are not always restated for
prior years. Furthermore, no two governments deliver an identical
set of services. Different accounting and presentation styles,
changing accounting practices, inconsistent definitions, significant
changes in government operations, and differing service levels
make it difficult to arrive at a comparable set of tax numbers
between governments and even for a single government or city
over an extended period of time.
To control for these difficulties, researchers employed a number
of strategies. With regards to the cities, research always started
with the most recent Consolidated Financial Statements. Using
historical information in the annual reports, efforts turned to
building a consistent set of tax data for the most recent period
(late 1990s to 2003). As data for earlier years were secured and
changes to accounting practices emerged, adjustments were
made to ensure consistency. In some instances, this was not
always possible, but such instances were generally rare.
For the most part, this study focuses only on those taxes based
upon property values such as the general residential and
commercial property tax, local improvement levies, and business
taxes based on rental values. Other taxes such as revenue-in-lieu
of property tax (a type of grant from federal and provincial
governments, and large private and public utility companies,
whose property is difficult to assess), franchise fees, utility sales
taxes and access fees, amusement taxes, and other non-property
related taxes are ignored wherever practicable. While revenue-in-
lieu of tax can be formally considered “property tax”, it is not
dependent on the mill rate and cities cannot always control the
amounts remitted. However, separating revenue-in-lieu and other
types of taxes was not always possible. In this study, the emphasis
remains on ensuring data consistency over time and between
cities for each separate analysis. This means that the basket of
property taxes under review in one analysis may not be the same
basket of property taxes included in another analysis. However,
each individual analysis remains a valid comparison.
Greater consistency emerges with federal and provincial Public
Accounts data. Several governments produce ten and even
twenty-year running records of past tax collections (e.g., Alberta)
and the reports issued by the Dominion Bond Rating Service
(DBRS) also helped in developing a consistent set of data. Only
one specific caution needs to be made – the federal and
provincial taxes collected within each specific city had to be
estimated. The general rule of thumb was to employ a
conservative approach that underestimates the federal and
provincial taxes collected in the cities.
Further, some tax and income data points had to be estimated.
In developing estimates, researchers typically interpolated the
amounts based on a consistent rate of growth or decline in
certain variables, or extrapolated the estimates based on an
average rate of growth in the last few years. (Readers who desire
more depth on these issues can refer to Appendix 1.)
2
STRAIGHT TALK: Property Taxes in Western Canada’s Big Six
As a final check, all the data charts were sent to the financial
departments of each city for verification and comment. It appears
that Canada West Foundation’s datasets provide a reasonable
platform upon which to compare property taxes in western
Canada’s big cities. At the same time, they remain an imperfect
effort, in large part due to data accessibility challenges. As such,
readers are encouraged to avoid ranking or comparing cities with
these data. It may appear that some cities collect more property
taxes than others because the amounts include revenue-in-lieu
(e.g., Vancouver), they have accounted differently for utility taxes
(e.g., Winnipeg) or they simply deliver more municipal services
than other cities. As such, the focus needs to remain on similar
trends shared by the cities. Where useful and reasonable
comparisons can be made, we have done so.
SETTING THE STAGE
1. Understanding the “Tax Mix”
Before examining where the property tax fits into the larger
Canadian tax picture, it is helpful to take a snapshot of the
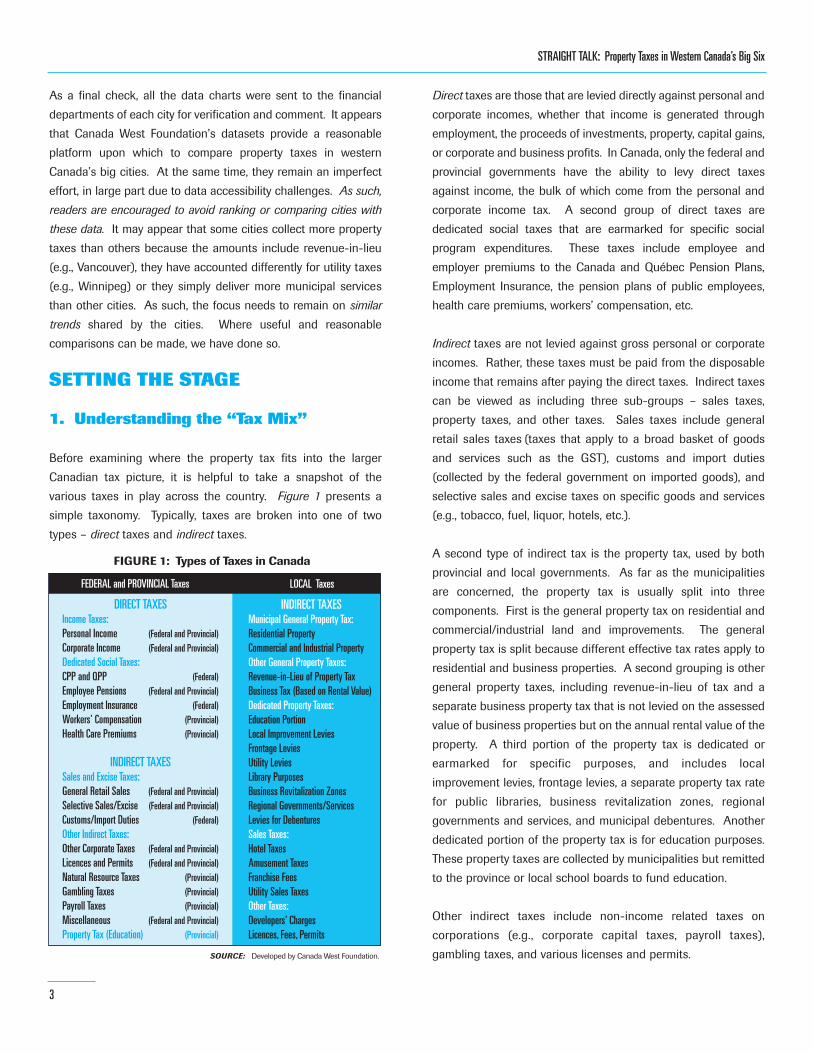
various taxes in play across the country. Figure 1 presents a
simple taxonomy. Typically, taxes are broken into one of two
types – direct taxes and indirect taxes.
Direct taxes are those that are levied directly against personal and
corporate incomes, whether that income is generated through
employment, the proceeds of investments, property, capital gains,
or corporate and business profits. In Canada, only the federal and
provincial governments have the ability to levy direct taxes
against income, the bulk of which come from the personal and
corporate income tax. A second group of direct taxes are
dedicated social taxes that are earmarked for specific social
program expenditures. These taxes include employee and
employer premiums to the Canada and Québec Pension Plans,
Employment Insurance, the pension plans of public employees,
health care premiums, workers’ compensation, etc.
Indirect taxes are not levied against gross personal or corporate
incomes. Rather, these taxes must be paid from the disposable
income that remains after paying the direct taxes. Indirect taxes
can be viewed as including three sub-groups – sales taxes,
property taxes, and other taxes. Sales taxes include general
retail sales taxes (taxes that apply to a broad basket of goods
and services such as the GST), customs and import duties
(collected by the federal government on imported goods), and
selective sales and excise taxes on specific goods and services
(e.g., tobacco, fuel, liquor, hotels, etc.).
A second type of indirect tax is the property tax, used by both
provincial and local governments. As far as the municipalities
are concerned, the property tax is usually split into three
components. First is the general property tax on residential and
commercial/industrial land and improvements. The general
property tax is split because different effective tax rates apply to
residential and business properties. A second grouping is other
general property taxes, including revenue-in-lieu of tax and a
separate business property tax that is not levied on the assessed
value of business properties but on the annual rental value of the
property. A third portion of the property tax is dedicated or
earmarked for specific purposes, and includes local
improvement levies, frontage levies, a separate property tax rate
for public libraries, business revitalization zones, regional
governments and services, and municipal debentures. Another
dedicated portion of the property tax is for education purposes.
These property taxes are collected by municipalities but remitted
to the province or local school boards to fund education.
Other indirect taxes include non-income related taxes on
corporations (e.g., corporate capital taxes, payroll taxes),
gambling taxes, and various licenses and permits.
3
FIGURE 1: Types of Taxes in Canada
Developed by Canada West Foundation.SOURCE:
FEDERAL and PROVINCIAL Taxes
DIRECT TAXESIncome Taxes:Personal Income (Federal and Provincial)Corporate Income (Federal and Provincial)Dedicated Social Taxes:CPP and QPP (Federal)Employee Pensions (Federal and Provincial)Employment Insurance (Federal)Workers' Compensation (Provincial)Health Care Premiums (Provincial)
INDIRECT TAXESSales and Excise Taxes:General Retail Sales (Federal and Provincial)Selective Sales/Excise (Federal and Provincial)Customs/Import Duties (Federal)Other Indirect Taxes:Other Corporate Taxes (Federal and Provincial)Licences and Permits (Federal and Provincial)Natural Resource Taxes (Provincial)Gambling Taxes (Provincial)Payroll Taxes (Provincial)Miscellaneous (Federal and Provincial)Property Tax (Education) (Provincial)
LOCAL Taxes
INDIRECT TAXESMunicipal General Property Tax:Residential PropertyCommercial and Industrial PropertyOther General Property Taxes:Revenue-in-Lieu of Property TaxBusiness Tax (Based on Rental Value)Dedicated Property Taxes:Education PortionLocal Improvement LeviesFrontage LeviesUtility LeviesLibrary PurposesBusiness Revitalization ZonesRegional Governments/ServicesLevies for DebenturesSales Taxes:Hotel TaxesAmusement TaxesFranchise FeesUtility Sales TaxesOther Taxes:Developers' ChargesLicences, Fees, Permits
WestCanada
4
In Canada, the property tax is the single largest source of local
government tax revenue, comprising over 90% of all taxes
collected by the local sector. The remaining taxes come in the
form of a small group of selective sales taxes or franchise fees
primarily directed at amusement or entertainment events, hotel
accommodations, and utility services (e.g., electrical and natural
gas distribution). In the West, Regina, Saskatoon, and Winnipeg
collect a small amusement tax, but only Vancouver has access to
its own hotel tax, which is earmarked for tourism development.
(The NIEA system includes developers’ charges and various
licences and permits as a tax, while the Public Accounts typically
define them as a user fee. Depending on the data source,
franchise fees on utilities can be defined as a tax or a user fee.)
2. How Much Tax Do Canadians Pay?
According to Statistics Canada’s system of National Accounts, in
2000 individual Canadians paid just under $340 billion in direct
and indirect taxes to all three orders of government in Canada.
This total tax bill was paid out of a gross personal income of
some $840 billion. Thus, the total taxes paid by Canadians in
2000 were about 40% of all income earned in that year. The tax
bill rises to $385 billion when considering the $45 billion paid by
corporations on a gross profit of $130 billion earned in 2000.
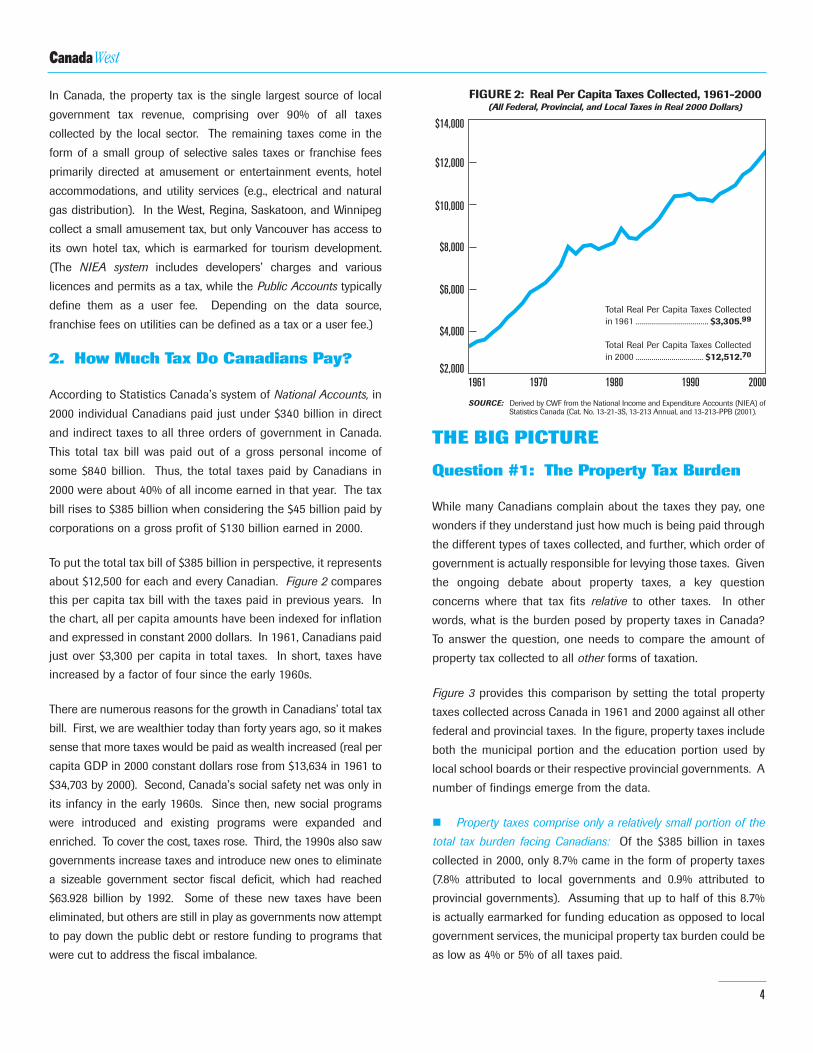
To put the total tax bill of $385 billion in perspective, it represents
about $12,500 for each and every Canadian. Figure 2 compares
this per capita tax bill with the taxes paid in previous years. In
the chart, all per capita amounts have been indexed for inflation
and expressed in constant 2000 dollars. In 1961, Canadians paid
just over $3,300 per capita in total taxes. In short, taxes have
increased by a factor of four since the early 1960s.
There are numerous reasons for the growth in Canadians’ total tax
bill. First, we are wealthier today than forty years ago, so it makes
sense that more taxes would be paid as wealth increased (real per
capita GDP in 2000 constant dollars rose from $13,634 in 1961 to
$34,703 by 2000). Second, Canada’s social safety net was only in
its infancy in the early 1960s. Since then, new social programs
were introduced and existing programs were expanded and
enriched. To cover the cost, taxes rose. Third, the 1990s also saw
governments increase taxes and introduce new ones to eliminate
a sizeable government sector fiscal deficit, which had reached
$63.928 billion by 1992. Some of these new taxes have been
eliminated, but others are still in play as governments now attempt
to pay down the public debt or restore funding to programs that
were cut to address the fiscal imbalance.
THE BIG PICTURE
Question #1: The Property Tax Burden
While many Canadians complain about the taxes they pay, one
wonders if they understand just how much is being paid through
the different types of taxes collected, and further, which order of
government is actually responsible for levying those taxes. Given
the ongoing debate about property taxes, a key question
concerns where that tax fits relative to other taxes. In other
words, what is the burden posed by property taxes in Canada?
To answer the question, one needs to compare the amount of
property tax collected to all other forms of taxation.
Figure 3 provides this comparison by setting the total property
taxes collected across Canada in 1961 and 2000 against all other
federal and provincial taxes. In the figure, property taxes include
both the municipal portion and the education portion used by
local school boards or their respective provincial governments. A
number of findings emerge from the data.
� Property taxes comprise only a relatively small portion of the
total tax burden facing Canadians: Of the $385 billion in taxes
collected in 2000, only 8.7% came in the form of property taxes
(7.8% attributed to local governments and 0.9% attributed to
provincial governments). Assuming that up to half of this 8.7%
is actually earmarked for funding education as opposed to local
government services, the municipal property tax burden could be
as low as 4% or 5% of all taxes paid.
$2,000
$4,000
$6,000
$8,000
$10,000
$12,000
$14,000
FIGURE 2: Real Per Capita Taxes Collected, 1961-2000(All Federal, Provincial, and Local Taxes in Real 2000 Dollars)
1961 2000199019801970
Derived by CWF from the National Income and Expenditure Accounts (NIEA) of Statistics Canada (Cat. No. 13-21-3S, 13-213 Annual, and 13-213-PPB (2001).
SOURCE:
Total Real Per Capita Taxes Collected in 1961 ..................................... $3,305.99
Total Real Per Capita Taxes Collected in 2000 .................................. $12,512.70

STRAIGHT TALK: Property Taxes in Western Canada’s Big Six
5
Provincial CorporateIncome Tax 4.0%
EI Premiums ............................... 2.8%Pensions and Other ..................... 2.2%
Customs & Import Duties ............. 5.2%Excise Duties .............................. 3.6%Other Sales & Excise Taxes ........ 13.1%
2000 TOTAL TAXATION: $385.276 Billion
Dedicated Social Taxes (2.2%)Health Premiums ...................... 0.5%Workers Comp & Other ............. 1.7%
FIGURE 3: Total Taxes Collected in Canada, 2000 and 1961(All Federal, Provincial, and Local Taxes in Nominal Dollars)
Federal PersonalIncome Tax
23.4%
Federal CorporateIncome Tax
7.7%
Federal DedicatedSocial Taxes
11.4%EI Premiums ............................... 4.8%Canada Pension Plan .................. 5.1%Québec Pension Plan .................. 1.5%
Excise andSales Taxes
9.8%Goods and Services Tax ............... 7.0%Customs & Import Duties ............. 0.6%Excise Duties .............................. 0.6%Other Sales & Excise Taxes .......... 1.6%
Provincial PersonalIncome Tax
13.9%
Provincial General andSelective Sales Taxes
9.8%
Other Federal Taxes (0.1%)
Other ProvincialTaxes 8.0%
Payroll Taxes ............................ 2.1%Other Corporate Taxes ............... 1.0%Gambling ................................. 1.4%Liquor Commission Profit .......... 0.8%Licences & Permits ................... 0.4%Other Taxes .............................. 2.3%
Local PropertyTaxation
7.8%
Other Local Taxes (1.0%)Business Tax ............................... 0.3%Developer Charges ...................... 0.2%Licences and Permits .................. 0.2%Other Taxes ................................. 0.3%
Federal CorporateIncome Tax
13.5%
Federal DedicatedSocial Taxes 5.0%
Excise andSales Taxes
21.9%
Other Federal Taxes (0.1%)
Local PropertyTaxation14.5%
Other Local Taxes (2.5%)
Provincial Personal Income Tax (1.4%)
Provincial Corporate Income Tax (3.0%)
Provincial General andSelective Sales Taxes
7.5%
Other ProvincialTaxes 6.1%
Provincial Property Taxes (0.1%)
1961 TOTAL TAXATION: $9.952 Billion
ProvincialProperty Tax (0.9%)
Liquor Commission Profit .......... 1.9%Licences & Permits ................... 1.5%Other Corporate Taxes ............... 0.2%Other Taxes .............................. 2.5%
Federal PersonalIncome Tax
21.4%
Derived by CWF from the National Income and Expenditure Accounts (NIEA) of Statistics Canada (Cat. No. 13-21-3S, 13-213 Annual, and 13-213-PPB (2001).
SOURCE:
Dedicated Social Taxes (3.0%)Health Premiums ...................... 1.2%Workers Comp & Other ............. 1.8%
FederalProvincialLocal
$6.164 (61.9%)$2.100 (21.1%)$1.688 (17.0%)
FederalProvincialLocal
$202.026 (52.4%)$149.567 (38.8%)$33.683 (8.8%)
WestCanada
6
� The federal and provincial governments clearly collect the bulk
of taxes in Canada: In 2000, Ottawa was responsible for collecting
52.4% of all taxes in Canada, while the provinces collected another
38.8%. The remaining 8.8% accrued to local governments. Again,
a significant portion of the local amount is used for educational
purposes as opposed to municipal purposes.
� Direct personal taxes collected by the federal and provincial
governments constitute the single largest group of taxes: Over
half of the entire tax bill paid by Canadians (50.9%) comes in the
form of direct personal taxation. Personal income taxes at the
federal and provincial level comprise 37.3% of the total tax
amount, while collections for the Canada and Québec Pension
Plans, Employment Insurance, health premiums and workers’
compensation comprise another 13.6%.
� Federal and provincial indirect sales taxes run a distant second
to direct personal taxation: Federal and provincial general retail
sales taxes, customs and import duties, and selective sales taxes
on fuel, tobacco, liquor, hotels, and other goods and services
represent 19.6% of all taxes paid by Canadians. However, the
provinces appear to be more dependent on sales taxes than the
federal government. (About 25% of all provincial taxes accrue
from consumption-based taxation compared to 19% for the
federal government).
� The remaining taxes are about equally split between corporate
income taxes and other tax levies: Just over 10% of all taxes paid
in Canada come from the corporate income tax (7.7% of all taxes
are in the form of the federal corporate income tax and another
4.0% accrue to provincial governments). The remaining portion
of the total tax bill amounts to just under 10%, with almost all of
it being collected by provincial governments. Such taxes include
payroll taxes, licences and permits, other corporate taxes, and
gambling revenues.
Another interesting feature of Figure 3 is how the total taxburden facing Canadians has changed over the last 40 years. Inparticular, four points can be made.
� Property taxes comprise a much smaller portion of the total
tax pie today than they did in 1961: One of the most interesting
findings is the significantly lower relative burden of the property
tax today than forty years ago. In 1961, property taxes accounted
for 14.6% of the entire tax bill. In 2000, property taxes were just
8.7% of all taxes paid. Other local taxes, which comprised 2.5%
of all taxes in 1961, constituted only 1.0% in 2000.
� The provincial personal income tax burden has increased the
most relative to other taxes: In 1961, Canada’s provinces
collected very little personal income tax, relying more heavily on
federal grants in lieu of tax. However, with the introduction of
public health care and a variety of other federal and provincially
funded social programs, an agreement was struck by which the
federal government transferred personal income tax points to the
provinces as a means to fund these programs. As a result,
provincial income taxes have become a much more significant
feature of the Canadian tax system and the overall tax burden
facing Canadians. The federal personal income tax burden,
relative to all other taxes, has also risen slightly since 1961.
� Earmarked federal social taxes have grown substantially: The
amount of federal taxes dedicated to fund social programs has
grown significantly since the early 1960s. Much of this reflects
the creation of the Canada and Québec Pension Plans in 1965,
enhanced Employment Insurance benefits, and recent CPP and
QPP premium increases.
� Sales taxes are significantly less important for Ottawa today,
and only slightly more important to the provinces: Even with the
introduction of the federal Goods and Services Tax (GST) that
replaced the hidden Federal Manufacturer’s Sales Tax (FMST) in
1990, sales taxes have become less important in the overall tax
mix. In 1961, just under one-third of all taxes collected came in
the form of sales and excise taxes. That percentage has since
dropped to under one-fifth of all taxes paid.
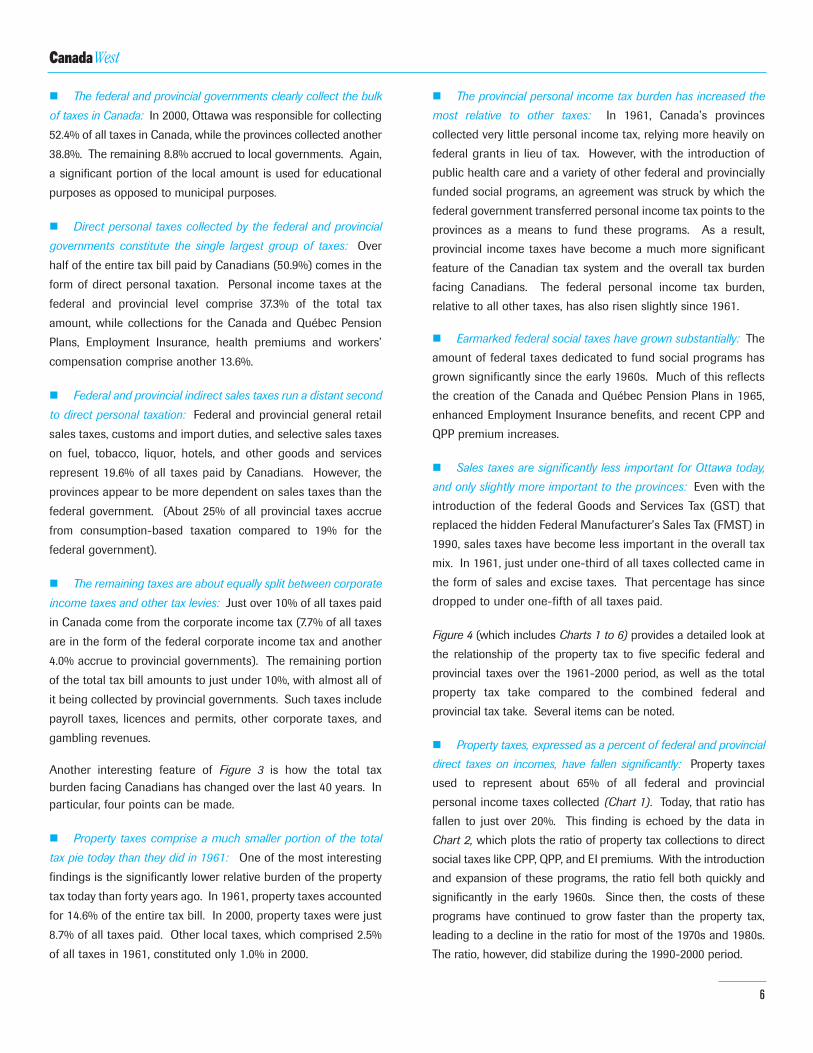
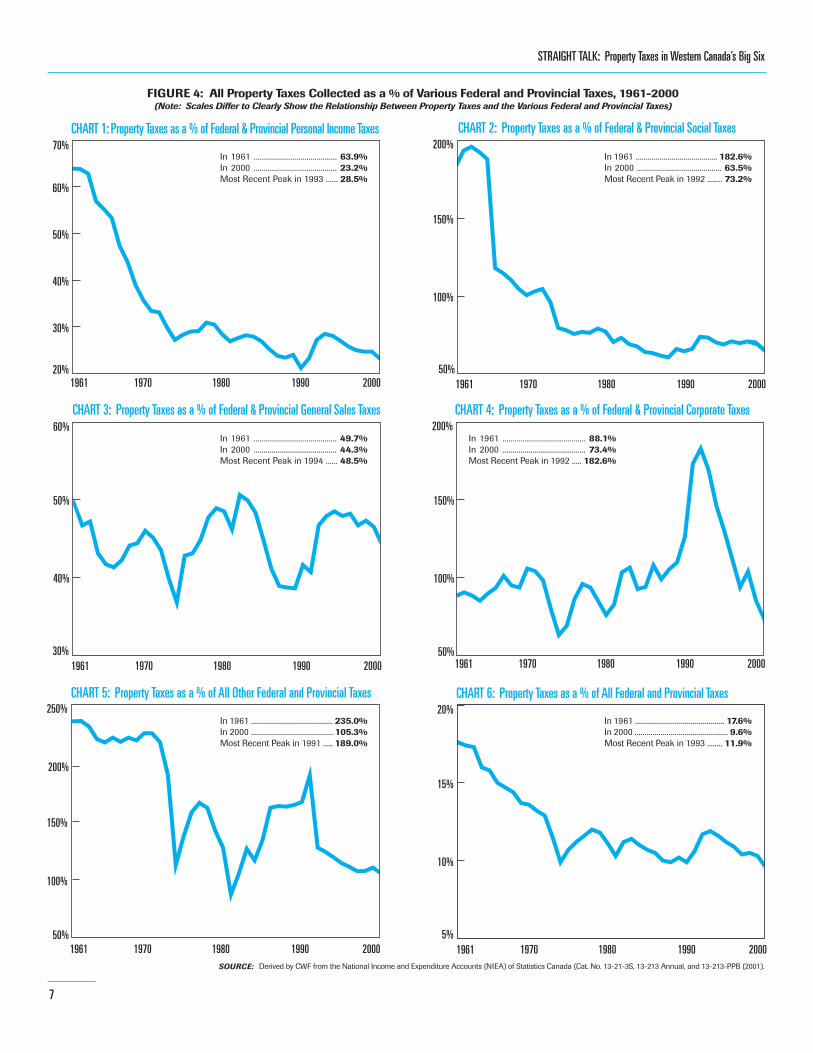
Figure 4 (which includes Charts 1 to 6) provides a detailed look at
the relationship of the property tax to five specific federal and
provincial taxes over the 1961-2000 period, as well as the total
property tax take compared to the combined federal and
provincial tax take. Several items can be noted.
� Property taxes, expressed as a percent of federal and provincial
direct taxes on incomes, have fallen significantly: Property taxes
used to represent about 65% of all federal and provincial
personal income taxes collected (Chart 1). Today, that ratio has
fallen to just over 20%. This finding is echoed by the data in
Chart 2, which plots the ratio of property tax collections to direct
social taxes like CPP, QPP, and EI premiums. With the introduction
and expansion of these programs, the ratio fell both quickly and
significantly in the early 1960s. Since then, the costs of these
programs have continued to grow faster than the property tax,
leading to a decline in the ratio for most of the 1970s and 1980s.
The ratio, however, did stabilize during the 1990-2000 period.
7
STRAIGHT TALK: Property Taxes in Western Canada’s Big Six
20%
30%
40%
50%
60%
70%
CHART 5: Property Taxes as a % of All Other Federal and Provincial Taxes
CHART 3: Property Taxes as a % of Federal & Provincial General Sales Taxes
CHART 1: Property Taxes as a % of Federal & Provincial Personal Income Taxes
1961 2000199019801970
CHART 4: Property Taxes as a % of Federal & Provincial Corporate Taxes
CHART 2: Property Taxes as a % of Federal & Provincial Social Taxes
FIGURE 4: All Property Taxes Collected as a % of Various Federal and Provincial Taxes, 1961-2000(Note: Scales Differ to Clearly Show the Relationship Between Property Taxes and the Various Federal and Provincial Taxes)
CHART 6: Property Taxes as a % of All Federal and Provincial Taxes
Derived by CWF from the National Income and Expenditure Accounts (NIEA) of Statistics Canada (Cat. No. 13-21-3S, 13-213 Annual, and 13-213-PPB (2001).SOURCE:
50%
100%
150%
200%
30%
40%
50%
60%
50%
100%
150%
200%
50%
100%
150%
200%
250%
5%
10%
15%
20%
1961 20001990198019701961 2000199019801970
1961 2000199019801970
1961 2000199019801970 1961 2000199019801970
In 1961 ......................................... 63.9%In 2000 ......................................... 23.2%Most Recent Peak in 1993 ...... 28.5%
In 1961 ......................................... 182.6%In 2000 .......................................... 63.5%Most Recent Peak in 1992 ........ 73.2%
In 1961 ......................................... 49.7%In 2000 ......................................... 44.3%Most Recent Peak in 1994 ...... 48.5%
In 1961 ......................................... 88.1%In 2000 ......................................... 73.4%Most Recent Peak in 1992 ..... 182.6%
In 1961 ......................................... 235.0%In 2000 ......................................... 105.3%Most Recent Peak in 1991 ..... 189.0%
In 1961 ............................................. 17.6%In 2000 ............................................... 9.6%Most Recent Peak in 1993 ........ 11.9%

WestCanada
8
� Property taxes, expressed as a percentage of federal and
provincial sales and corporate income taxes, have also fallen:
Charts 3 and 4 demonstrate that property taxes have also fallen
when measured against various sales taxes as well as the
corporate income tax take. However, the overall change is less
dramatic and the ratio has fluctuated wildly from year to year. In
large part, this is because corporate income tax and sales taxes
are among the most elastic of taxes – the revenue produced grows
rapidly during times of economic expansion, but quickly contracts
during recession, while property taxes are more stable over the
business cycle. For example, in the early 1980s and again in the
1990s, property taxes as a percent of sales taxes increased
significantly, but largely because sales tax revenues stalled as a
result of economic recession (Chart 3). The sharp increase in the
property tax to corporate income tax ratio in the early 1990s
demonstrates the collapse in corporate profits during that
recession rather than a sharp rise in property taxes (Chart 4).
� Property taxes have not risen relative to other federal and
provincial taxes: Chart 5 plots the property tax against all other
federal and provincial taxes (e.g., payroll taxes, gambling,
permits). In 1961, property taxes were almost two and half times
as large as this group. By 2000, the amount of property tax was
roughly equivalent (100%) to the sum total of these federal and
provincial taxes.
The overall effect of the shifting tax burden is plotted in Chart 6.
Here, total property tax revenues of the local government sector
(which include some property tax collected for educational
purposes) are set against all federal and provincial taxes. In
1961, local property taxes were 17.6% of all federal and provincial
tax revenues. That ratio slipped to 9.6% in 2000.
SUMMARY: The data highlighted here show that the ongoing
debate over property taxes in Canada really speaks to only a
small portion of the total tax bill facing the average Canadian.
Further, the burden posed by the property tax, when compared
to the sum total of all other taxes, has fallen over the last 40
years. To be sure, the burden posed by the property tax can
radically differ between individual Canadians. For example,
those who have retired from the workforce, those on fixed
incomes, or those with low income may pay very little personal
income tax. For them, the property tax can form a significant
share of their total tax bill. But the essential point remains – on
average, the municipal property tax is only a small part of the
total tax burden confronting Canadians.
Question #2: Growth of the Property Tax
A singular focus on the burden posed by the property tax relative
to other taxes presents only one aspect of the tax picture in
Canada. To be sure, the property tax burden appears to be
relatively small and it has also shrunk when compared to other
taxes. But all of that is small comfort for taxpayers because most
of those other taxes have grown substantially over the years. As
such, a small property tax burden does not mean that the tax
itself has not increased. To complete the picture, growth in
various taxes need to be explored.
Figure 5 presents the actual amounts collected by governments
through various taxes in 1961 and 2000, and also presents the
real per capita amounts. The last column in the chart presents
the average annual growth rate of the real per capita amounts
between 1961 to 2000. A number of findings emerge.
� Federal and provincial dedicated social taxes (e.g., CPP, QPP,
and EI), along with personal income taxes, have the highest average
annual growth rates: Since 1961, total real per capita taxes paid
to the federal and provincial governments for things like CPP,
QPP, EI, and health care premiums have grown, on average, by
about 5.4% per year. Real per capita federal and provincial
personal income taxes have grown, on average, by about 4.9%
per year. This comes as no surprise given the introduction of new
income support programs like the Canada and Québec Pension
Plans, and the taxes required to pay for a bevy of federal and
provincial programs inaugurated since the 1960s. Provincial
personal income taxes have grown, on average, by 11.8%
annually, but this is somewhat deceptive – those taxes
experienced a massive increase in the early 1960s as tax points
were shifted to the provinces, and this ripples throughout the last
40 years by drastically increasing the average annual growth rate.
� The average annual growth rate of real per capita corporate
income tax collections is somewhat lower. Average annual growth
in sales tax collections is about half that of personal income taxes:
Real per capita amounts collected through federal and provincial
corporate income taxes have averaged 3.2% annual growth for
the last 40 years, while real per capita sales tax revenue has
grown, on average, by about 2.5% a year. Other taxes (which
accrue primarily to the provinces) have shown steady growth
over the period, increasing on average by about 4.4% annually
from 1961-2000.

9
STRAIGHT TALK: Property Taxes in Western Canada’s Big Six
� Property tax collections have the lowest average annual
growth rate: From 1961-2000, real per capita property taxes (for
both municipal and educational purposes) have grown, on
average, by only 2.1% per year. This is less than half the growth
rates recorded by federal and provincial direct taxes on incomes.
Real per capita property taxes attributed directly to the local
sector have grown, on average, by only 1.9% per year. Property
taxes attributed provincially have grown by an average of 14.2%
per year. The higher average annual growth rate of provincial real
per capita property taxes reflects the fact that some provinces
began centralizing educational taxes in the early 1990s. These
taxes began accruing to the provincial sector, which then granted
revenues back to local school boards through a funding formula.
Thus, some property taxes were shifted from the local sector to
the provincial sector, which affects the average annual growth
rate. As such, the focus should remain on total property tax
collections, which are more consistent over time.
� Total real per capita taxes collected by the local sector
demonstrate a significantly lower average annual growth rate than
federal and provincial total taxes: Over the 1961-2000 period, real
per capita taxes paid to the provinces show the highest average
annual growth rate (5.3%) with federal tax revenues coming
second (3.2%). Again, the shift in taxing responsibility between
the two sectors is partly responsible for the higher provincial
growth rates. Real per capita local tax revenues, however, show a
much slower rate of average annual growth at only 1.8% a year.
Focusing on the average annual growth rate of specific taxes
helps fill in the picture, but it can also be somewhat deceptive.
For example, a tax can record remarkable annual growth, but if it
is only a small part of the total tax mix, the overall impact of the
tax would be marginal. Figure 6 provides additional data by
calculating the gross increase in taxes paid from 1961 to 2000,
and which taxes contributed the most to that increase.
FIGURE 5: Nominal and Real Per Capita Taxes, 1961 and 2000(All Federal, Provincial, and Local Taxes in Nominal Dollars and Real 2000 Dollars)
Derived by CWF from the National Income and Expenditure Accounts (NIEA) of Statistics Canada (Cat. No. 13-21-3S, 13-213 Annual, and 13-213-PPB (2001).SOURCE:
Federal Personal Income TaxProvincial Personal Income TaxTotal Personal Income Tax
Federal Dedicated Social TaxesProvincial Dedicated Social TaxesTotal Dedicated Social Taxes
Federal Corporate Income TaxProvincial Corporate Income TaxTotal Corporate Taxes
Federal Excise and Sales TaxesProvincial Sales TaxesTotal Excise and Sales Taxes
Other Federal TaxesOther Provincial TaxesOther Local TaxesAll Other Taxes
Provincial Property TaxesLocal Property TaxesTotal Property Taxes
1961 ACTUAL(Billions of Current $)
2000 ACTUAL(Billions of Current $)
1961REAL PER CAPITA
2000REAL PER CAPITA
$ 2.1300.141
2.271
0.4990.296
0.795
1.3450.304
1.649
2.1750.747
2.922
0.0150.6030.245
0.863
0.0091.443
1.452
6.1642.1001.688
$ 9.952
$ 89.99353.495
143.488
44.0138.429
52.442
29.85915.501
45.360
37.59337.650
75.243
0.56831.0573.813
35.438
3.43529.870
33.305
202.026149.56733.683
$ 385.276
3.9%11.8%4.9%
6.7%3.1%
5.4%
2.6%5.3%
3.2%
1.6%4.4%
2.5%
42.3%4.6%1.5%
4.4%
14.2%1.9%
2.1%
3.2%5.3%1.8%
3.5%
ANNUAL AVERAGE GROWTH(Real Per Capita)
$ 707.57
46.84
754.41
165.76
98.33
264.09
446.80
100.99
547.79
722.52
248.15
970.67
4.98
200.31
81.39
286.68
2.99
479.36
482.35
2,047.63
697.61
560.75
$ 3,305.99
$ 2,922.72
1,737.37
4,660.09
1,429.42
273.75
1,703.17
969.74
503.43
1,473.17
1,220.92
1,222.77
2,443.69
18.45
1,008.64
123.84
1,150.93
111.56
970.09
1,081.65
6,561.25
4,857.52
1,093.93
$ 12,512.70
DIRECT TAXES:
INDIRECT TAXES:
Total FEDERAL Taxes:Total PROVINCIAL Taxes:Total LOCAL Taxes:
TOTAL TAXES

WestCanada
10
TOTAL INCREASE 1961-2000: $375.324 Billion
Federal Corporate Income Tax ............ 7.6%Provincial Corporate Income Tax ........ 4.0%
Federal Sales Taxes .................. 9.4%Provincial Sales Taxes .............. 9.8%
Federal PIT ............................... 23.4%Provincial PIT ........................... 14.2%
Federal Social Taxes .................. 11.6%Provincial Social Taxes ................ 2.2%
Other Federal Taxes .................. 0.2%Other Provincial Taxes .............. 8.1%
Other Local Taxes (1.0%)
FIGURE 6: % Contribution of Various Taxes to the Overall Increase in Taxation, 1961-2000(All Federal, Provincial, and Local Taxes in Nominal Dollars)
Derived by CWF from the National Income and Expenditure Accounts (NIEA) of Statistics Canada (Cat. No. 13-21-3S, 13-213 Annual, and 13-213-PPB (2001).
SOURCE:
Personal Income Tax37.6%
Corporate Income Tax11.6%
DedicatedSocial Taxes
13.8%
Sales Taxes19.2%
Other8.3%
Property Taxes8.5%
Provincial Property Taxes .......... 0.9%Local Property Taxes ................. 7.6%
% Contribution to Increased Taxation
FederalProvincialLocalTotal
$195.862 Billion (52.2%)$147.467 Billion (39.3%)$31.995 Billion (8.5%)$375.324 Billion (100.0%)
In 1961, Canadians paid $10 billion in taxes to the three orders of
government. In 2000, they paid $385 billion. Which taxes were
responsible for this $375 billion nominal tax increase?
� Clearly, it is direct federal and provincial personal taxes on
income that have had the largest impact: Federal and provincial
personal income tax and dedicated social taxes form over half of
the $375.3 billion increase in taxes since 1961. Federal and
provincial sales taxes were only responsible for about one-fifth
of the overall increase, while corporate income taxes were
responsible for another one-tenth.
� Property taxes have contributed only a small portion of the
overall increase in taxation: Property taxes paid for both
municipal and educational purposes contributed only 8.5% of the
total increase in taxes since 1961. In other words, for every
additional dollar that Canadians have had to pay in tax over the
last forty years, less than one dime was put on the table for
property tax increases. Again, if half of all property taxes are
used for educational purposes, then municipal property taxes
account for less than one nickel out of every extra dollar paid in
tax since 1961.
To complete the tax picture, it is critical not to ignore how each
tax has grown relative to income or the specific tax base out of
which the taxes must be paid. Figure 7 sets the revenue take
from various taxes against several control variables.
� Total taxes paid to all three orders of government, when
compared to GDP, have grown significantly: Clearly, today’s
taxpayers are feeling the pinch of a much larger tax bill. In 1961,
the total taxes paid to all governments was 24.5% of GDP. Taxes
rose steadily past 30% of GDP by the mid-1970s, peaking in 1991
at almost 40% of GDP. Since then, the tax-to-GDP ratio has fallen
slightly. In 2000, the tax-to-GDP ratio sat at 36.2% (Chart 1).
� Federal and provincial personal income taxes and dedicated
social taxes reflect this larger pattern: Because of the significant
part played by federal and provincial direct taxation in the overall
tax increase in Canada, setting these taxes against growth in
personal incomes yields much the same picture as the total tax-to-
GDP ratio. Personal income taxes have grown from 7.4% of total
personal incomes in 1961 to 17.1% in 2000 (Chart 2). Dedicated
social taxes have grown from 2.6% of Canadians’ personal incomes
to over 6.3%, a 142% increase in that particular ratio (Chart 3).

11
20%
25%
30%
35%
40%
CHART 5: All Corporate Income Taxes as a % of Corporate Profits
CHART 3: All Dedicated Social Taxes as a % of Personal Income
CHART 1: All Taxes as a % of GDP
1961 2000199019801970
CHART 2: All Personal Income Taxes as a % of Personal Income
CHART 4: All Sales Taxes as a % of Personal Disposable Income
CHART 6: All Property Taxes as a % of Personal Disposable Income
Derived by CWF from the National Income and Expenditure Accounts (NIEA) of Statistics Canada (Cat. No. 13-21-3S, 13-213 Annual, and 13-213-PPB (2001).SOURCE:
5%
10%
15%
20%
2%
3%
4%
5%
6%
7%
8%
5%
10%
15%
20%
20%
30%
40%
50%
2%
4%
6%
8%
10%
1961 2000199019801970
1961 2000199019801970 1961 2000199019801970
1961 2000199019801970 1961 2000199019801970
FIGURE 7: Taxes Collected as a % of Various Control Variables, 1961-2000(Note: Scales Differ to Clearly Show the Relationship Between Various Taxes and Their Tax Base)
In 1961 ............................................... 7.4%In 2000 ............................................. 17.1%Most Recent Peak in 1998 ......... 17.2%
In 1961 ............................................... 2.6%In 2000 ............................................... 6.3%Most Recent Peak in 1995 ........... 6.4%
In 1961 ............................................ 10.7%In 2000 ............................................ 11.8%Most Recent Peak in 1991 ........ 12.4%
In 1961 ............................................ 40.0%In 2000 ............................................ 34.9%Most Recent Peak in 1992 ........ 44.5%
In 1961 ............................................... 5.3%In 2000 ............................................... 5.2%Most Recent Peak in 1994 ........... 5.6%
In 1961 ............................................In 2000 ............................................Most Recent Peak in 1991 ......
24.5%36.2%37.2%
STRAIGHT TALK: Property Taxes in Western Canada’s Big Six
WestCanada
In 1961 for example, the gross personal income of Canadians was
$30.5 billion. After federal and provincial direct and indirect
personal taxation, Canadians were left with $23.6 billion in personal
disposable income (77.5% of the original income amount). After
paying property taxes, Canadians were left with $22.2 billion in
personal disposable income (72.8% of the original amount). In
1961, then, property taxes reduced personal disposable incomes by
4.7%. In 2000, Canadians earned $838.9 billion in gross personal
income. After federal and provincial direct and indirect personal
taxation, Canadians were left with $532.3 billion in personal
disposable income (63.4% of the original income amount). After
paying property taxes, Canadians were left with $499.0 billion in
personal disposable income (59.5% of the original amount). In
2000, property taxes reduced personal disposable income by 3.9%
compared to 4.7% in 1961. This is a 17.0% reduction.
SUMMARY: Have property taxes increased? Not really. In fact,
when measured against personal disposable incomes, the amount
of property tax paid by Canadians has actually fallen since the early
1960s. Are property taxes out of control? Hardly. There is little to
no evidence to support such a conclusion. Canadians are paying
no more of their personal disposable income in property tax than
they were in the 1960s or early 1970s, during which the tax peaked.
If Canadians insist on complaining about an increasing tax burden,
the focus needs to shift from the property tax to the real culprits –
the direct taxation of personal incomes that accrues entirely to the
federal and provincial governments. Putting the blame on the
property tax as leading to an ever increasing tax burden for the
average Canadian is, frankly, misplaced.
� Federal and provincial sales taxes have risen only slightly:
Sales taxes are paid out of Canadians’ personal disposable
income – the income left after direct taxes are paid. In 1961,
total sales taxes amounted to 10.7% of Canadians’ personal
disposable income. In 2000, all sales taxes paid were just slightly
higher at 11.8% of personal disposable income (Chart 4).
� Corporate income taxes have not really increased either: The
amount of corporate income tax paid by corporations in 1961
amounted to 40.0% of all gross corporate profits. In 2000, the ratio
of federal and corporate income tax collected to profit was 34.9%.
In general, corporate income taxes tend to fluctuate significantly,
but not much has changed over the forty year period. Corporate
income taxes tend to bounce around 30% to 40% of gross profits,
depending on current economic conditions (Chart 5).
� Property taxes, as a percent of personal disposable income, have
shown little growth over the last 40 years: In 1961, property taxes in
Canada were 5.3% of personal disposable income. In 2000, they
were 5.2% (Chart 6). The highest ratio ever recorded existed in
1970 at 5.8%, and this has never been repeated. The 1990
recession, which saw income growth slide, resulted in a larger
property tax bite compared to personal disposable incomes than
seen over the 1975 to 1990 period. However, the trend toward the
end of the 1990s is a lower ratio once again. In short, over the last
40 years, property taxes have revolved around a very narrow
range, never exceeding 6.0% of personal disposable income and
seldom falling below 4.5%. Of all taxes paid by Canadians, the
property tax has been the most stable and the most predictable.
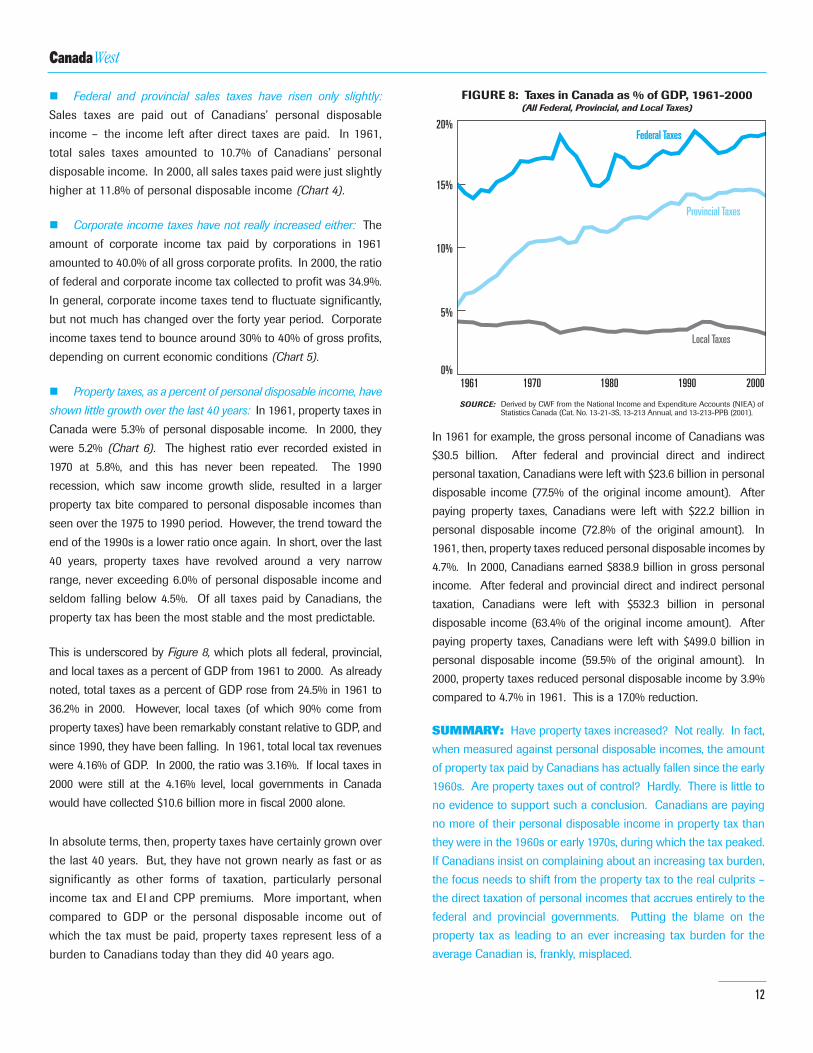
This is underscored by Figure 8, which plots all federal, provincial,
and local taxes as a percent of GDP from 1961 to 2000. As already
noted, total taxes as a percent of GDP rose from 24.5% in 1961 to
36.2% in 2000. However, local taxes (of which 90% come from
property taxes) have been remarkably constant relative to GDP, and
since 1990, they have been falling. In 1961, total local tax revenues
were 4.16% of GDP. In 2000, the ratio was 3.16%. If local taxes in
2000 were still at the 4.16% level, local governments in Canada
would have collected $10.6 billion more in fiscal 2000 alone.
In absolute terms, then, property taxes have certainly grown over
the last 40 years. But, they have not grown nearly as fast or as
significantly as other forms of taxation, particularly personal
income tax and EI and CPP premiums. More important, when
compared to GDP or the personal disposable income out of
which the tax must be paid, property taxes represent less of a
burden to Canadians today than they did 40 years ago.
12
FIGURE 8: Taxes in Canada as % of GDP, 1961-2000(All Federal, Provincial, and Local Taxes)
1961 2000199019801970
Derived by CWF from the National Income and Expenditure Accounts (NIEA) of Statistics Canada (Cat. No. 13-21-3S, 13-213 Annual, and 13-213-PPB (2001).
SOURCE:
0%
5%
10%
15%
20%Federal TaxesFederal Taxes
Local Taxes
Provincial Taxes

13
STRAIGHT TALK: Property Taxes in Western Canada’s Big Six
� Like the larger national trend, it is the federal government that
collects the largest share of taxes in the six cities: Taxes collected
by the federal government account for almost 60% of the entire
tax bill averaged across the six cities. The provinces appear to
collect, on average, about 34% of all taxes paid. (Federal tax
collections are the highest in Vancouver, Edmonton, and Calgary.
Provincial tax collections are the highest in Saskatoon, Regina,
and Winnipeg.)
At the same time, it is important to remember that these
percentages are estimates – actual federal and provincial tax
collections could be even higher. First, every federal and
provincial tax was apportioned to each city based on the city’s
share of federal and provincial personal income tax as reported
by Revenue Canada. While this method produces a reasonable
estimate, it ignores the fact that most corporations are
headquartered in the cities (yielding a higher proportion of
corporate income tax) and retail sales are likely more robust in
the large cities as well (yielding more sales tax revenue).
Second, revenue-in-lieu of tax was not removed in this analysis.
Here, it accrues entirely to the cities. But, a good portion of
revenue-in-lieu is really federal and provincial tax revenue that is
sent back to the cities as a grant. In the end, federal and
provincial governments may be collecting even more taxes in the
six cities than our data show.
2) Historical Trends with the Property Tax Burden:
Charts 1 and 2 in the city-specific datasets highlight the
changing burden of property taxation in the cities relative to
federal and provincial personal income tax and the education
property tax (the only two taxes for which there is hard data).
� The data demonstrate that the burden of municipal property
taxes has been continually and steadily falling as a result of the
growing burden of federal and provincial personal income taxes:
Across the entire decade of the 1960s, municipal property taxes
in the cities, measured against federal and provincial personal
income tax collected in the cities, fell both dramatically and
steadily (Chart 1). At the start of the decade, the municipal
property taxes paid by citizens in the cities were anywhere from
35% to 45% of their total federal and provincial personal income
tax bill. By the early 1970s, that ratio had fallen to about 15% or
20% in most cities. Again, this reflects the broader trend
discussed above, and for the same reasons.
FOCUSING ON THE CITIES
National current and historical trends regarding the relative
burden posed by property taxes raise an interesting question –
how well do western Canada’s six largest cities reflect the pattern
evidenced across Canada as a whole? To answer the question,
one needs to move beyond National Accounts data and turn to the
Public Accounts produced by the federal, provincial, and individual
city governments. The various charts in the city-specific datasets
on pages 15 to 26 provide valuable information to help answer the
question, and unlike the NIEA data, the focus can also turn to the
municipal portion of the property tax as opposed to the combined
municipal and education property tax levy.
Question #1: The Property Tax Burden
The property tax burden in the West’s six largest cities
(Vancouver, Edmonton, Calgary, Saskatoon, Regina, and
Winnipeg) reflects the broader national trends outlined above,
with only minor differences.
1) The Picture in 2003:
The first column of charts in the city-specific datasets provides a
detailed estimate of the various taxes collected in each city for
fiscal year 2003, along with a tax profile for each city.
� On average, total municipal property taxes in the six cities in
2003 were 5.8% of all taxes collected: This amount includes all
forms of property taxation, such as the general residential and
commercial property tax, revenue-in-lieu, local improvements,
business tax, and other earmarked levies (e.g., libraries, business
revitalization zones). Across the cities, the general property tax,
revenue-in-lieu, and the business tax (where applicable)
represent only about 5.4% of all taxes collected. The entire
municipal tax burden, which includes all forms of taxation, (e.g.,
franchise fees, utility levies) averages 6.3% of all taxes collected,
exceeding 7.0% in only two instances.
A high degree of similarity exists across the six cities, with no
one city differing radically from the others. Residents of
Regina, Saskatoon and Calgary appear to pay the least in total
property taxes (about 4% to 5% of all taxes) but that is not
much lower than either Winnipeg, Edmonton, or Vancouver
(about 6% to 7%).
WestCanada
14
But this is not the end of the story. For most cities, the ratio
began to climb slightly in the 1970s. During the recession of the
early 1980s, the ratio in most cities experienced a small spike
upward as incomes (and the taxes paid on those incomes)
suffered due to the economic malaise. Following that event, the
municipal property tax to personal income tax ratio again began
to fall, only to repeat another spike during the 1990 recession.
Ever since, the municipal property tax, as a percent of personal
income tax, has fallen steadily for most cities.
� The relationship of the municipal property tax to the personal
income tax since the mid-1990s tells an interesting story: When
recessions hit national, regional, and even provincial economies,
it can be expected that property taxes will rise compared to
personal income taxes because the two taxes have very
different tax bases. Revenues generated from the personal
income tax will respond both negatively and immediately to any
recession as incomes fall. Property taxes depend on the
assessed value of property, a much more recession-proof tax
base. In short, it should be expected that municipal property
taxes would rise as a percent of income taxes in the early 1990s
as the recession began to bite, and property taxes as a percent
of income taxes would naturally begin to fall again as incomes
grew during the economic recovery that followed.
But again, this is not the end of the story. A close look at Chart 1
in the city-specific datasets demonstrates that municipal
property taxes collected by most cities have continued their
decline when measured against the amount of personal income
taxes payable – even following the economic recovery of the
mid-1990s. The drop is most pronounced in Edmonton, Regina,
and Winnipeg. In Vancouver, Saskatoon, and Calgary, the ratio
of municipal property taxes paid to personal income taxes also
fell, but in the last few years it has stabilized.
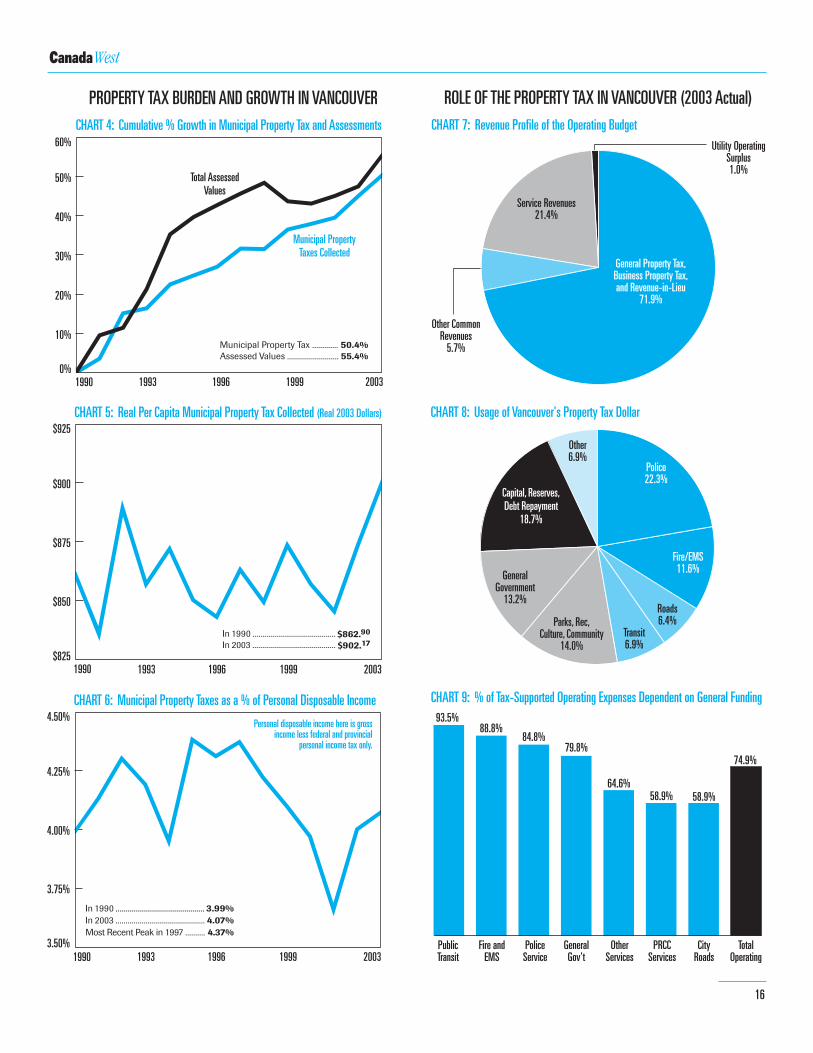
� Taxpayers should realize that in 2003, residents in western
Canada’s largest cities were paying the lowest level of municipal
property tax compared to personal income tax that they have ever
paid in the last 40 years: The upshot of the data in Chart 1 is that
the municipal property tax bill facing urbanites in western
Canada’s largest cities has never been lower when compared to
the amount of personal income tax they are paying. Not only has
the relative burden of the municipal property tax been declining,
it likely has never been lower.
A key issue regarding the property tax burden for many large
cities is the competition that exists between municipalities and
the education component for room within the property tax
system. The Tax Profile and Chart 2 in the city-specific datasets
examine the relationship between municipal and education
property taxes.
� Western Canada’s cities clearly have differing experiences
when considering the education portion of the property tax: In
western Canada, two particular groups of cities emerge with
respect to the education portion of the property tax. The first
group is comprised of Vancouver, Edmonton, and Calgary. In
these three cities, residents can expect to see less than 40% of
their entire property tax bill going toward education. (In these
provinces, the education property tax rates are set by the
province and collected by the cities, which then remit the
amounts to the province.)
The experience of Saskatoon, Regina, and Winnipeg appears to be
quite different, particularly considering the higher burden of the
education component of the property tax relative to the municipal
component. In these three cities, education property taxes tend to
comprise over 40% of the total property tax collected. In one case,
the education portion exceeds 50%.
� Over the last 40 years, comparative growth in municipal and
education property taxes have roughly mirrored each other, with
neither component pulling drastically ahead of the other in terms
of overall growth: Chart 2 in the city-specific datasets plots the
accumulated annual percentage increase registered by the
education and municipal portion of the cities’ property tax bill
over the last 40 years. Generally speaking, the accumulated
average annual growth in the revenues produced by the two
taxes have been quite similar. The interesting part of the chart
comes in the changing relationship between the two tax
components in the last few years.
Again, two groups of cities emerge. The first group is comprised
of Vancouver, Edmonton, Saskatoon, and Winnipeg. In these
cities, the accumulated annual growth rate of municipal property
tax revenues has either slightly outpaced the education
component for some time (e.g., Saskatoon and Winnipeg) or it
has recently begun to do so (e.g., Vancouver and Edmonton).
Calgary and Regina also appear to be similar. In these two cities,
the accumulated annual average growth rate of education

15
STRAIGHT TALK: Property Taxes in Western Canada’s Big Six
VANCOUVERBRITISH COLUMBIA
ESTIMATED TAX BURDEN IN VANCOUVER, 2003(Federal, Provincial, Municipal Taxes)
Estimated Federal Taxes ........................... $4,650,837,567Estimated Provincial Taxes ....................... $1,871,679,600Education Property Taxes and Rev-in-Lieu ...... $317,847,000Municipal Property Taxes and Rev-in-Lieu ....... $512,834,000Other Vancouver Municipal Taxes .................... $7,601,000Total Taxes (2003) .................................. $7,360,799,167Total Per Capita ............................................... $12,949.08
2003 Total: $7,360,799,167
VANCOUVER MUNICIPAL TAXES (7.1%)
VANCOUVER TAX PROFILE, 2003(As Reported by the City of Vancouver)
2003 Total: $838,282,000
MUNICIPALPROPERTY TAXES
61.2%
FEDERAL TAXES 63.2%
Personal Income Tax ....... 27.5%Corporate Income Tax ....... 5.0%EI Premiums .................... 5.5%CPP Premiums ............... 10.5%GST ................................. 9.5%All Other Taxes ................. 5.2%
BC TAXES29.7%
Personal Income Tax ...... 10.1%Corporate Income Tax ..... 2.5%General Sales Tax ........... 9.3%Education Property Tax ..... 4.3%All Other Taxes ............... 3.5%
EDUCATIONPROPERTY TAXES
37.9%
MUNICIPAL NON-PROPERTY BASED TAXESVancouver Hotel Tax ............................... 0.9%
General, Business, R-in-L ..... 6.0%Regional Transit ................. 0.6%BC Assessment/Finance ..... 0.2%To the GVRD ...................... 0.1%Local Improvements ........... 0.1%Hotel Tax ........................... 0.1%
(Includes General PropertyTax and Revenue-in-Lieu)
General and Rev-in-Lieu .... 53.0%Regional Transit .................. 5.1%BC Assessment/Finance ...... 1.4%To GVRD ............................ 1.2%Local Improvements ........... 0.5%
For all data on these pages, see Appendix 1.SOURCE:
1990 2003199919961993
CHART 3: Growth in Real Per Capita Tax Revenues (Real 2003 Dollars)
PROPERTY TAX BURDEN AND GROWTH IN VANCOUVER
CHART 2: Cumulative % Growth in Municipal vs. Education Property Taxes
CHART 1: Municipal Property Taxes as a % of Total Personal Income Taxes
1990 2003199919961993
0%
10%
20%
30%
40%
50%
60%
12%
14%
16%
18%
20%
$ 2,455.32
616.07
852.40
833.90
573.28
5,330.97
1,367.64
303.08
788.41
344.70
2,803.83
862.69
532.41
1990 2003
$ 2,617.95
901.53
1,378.54
856.79
455.26
6,210.07
1,000.82
249.12
915.21
343.91
2,509.06
902.17
559.15
Federal Personal Income TaxFederal Corporate Income TaxFederal EI and CPP PremiumsFederal GSTOther Federal TaxesTOTAL FEDERAL TAXES
Provincial Personal Income TaxProvincial Corporate Income TaxProvincial General Retail Sales TaxOther Provincial TaxesTOTAL PROVINCIAL TAXES
VANCOUVER Municipal Property TaxPROVINCIAL Education Property Tax
(Real Per Capita $) % Change
+ 6.6%+ 46.3%+ 61.7%+ 2.7%– 20.6%+ 16.5%
– 26.8%– 17.8%+ 16.1%– 0.2%– 10.5%
+ 4.6%+ 5.0%
Municipal Property Taxes
Education Property Taxes
In 1990 ............................................ 15.0%In 2003 ............................................ 15.6%Most Recent Peak in 1994 ........ 18.0%
Municipal Property Tax ............. 50.4%Education Property Tax ............. 22.9%
WestCanada
16
PROPERTY TAX BURDEN AND GROWTH IN VANCOUVER
1990 1993
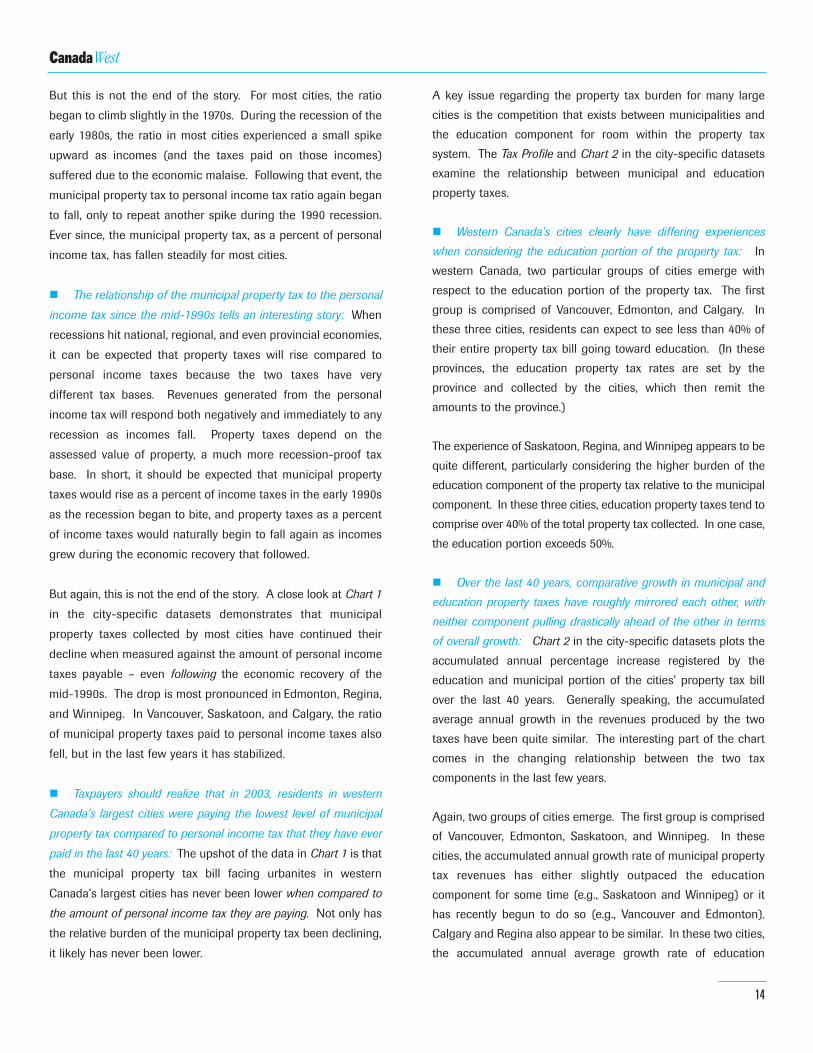
CHART 4: Cumulative % Growth in Municipal Property Tax and Assessments
199919960%
10%
20%
30%
40%
50%
60%
2003
Municipal PropertyTaxes Collected
Total AssessedValues
CHART 6: Municipal Property Taxes as a % of Personal Disposable Income
1990 20031999199619933.50%
3.75%
4.00%
4.25%
4.50%
CHART 5: Real Per Capita Municipal Property Tax Collected (Real 2003 Dollars)
1990 2003199919961993$825
$850
$875
$900
$925
Personal disposable income here is grossincome less federal and provincial
personal income tax only.
Municipal Property Tax ............. 50.4%Assessed Values .......................... 55.4%
In 1990 ............................................. 3.99%In 2003 ............................................. 4.07%Most Recent Peak in 1997 .......... 4.37%
$862.90
$902.17In 1990 ..........................................In 2003 ..........................................
CHART 7: Revenue Profile of the Operating Budget
ROLE OF THE PROPERTY TAX IN VANCOUVER (2003 Actual)
CHART 9: % of Tax-Supported Operating Expenses Dependent on General Funding
CHART 8: Usage of Vancouver's Property Tax Dollar
General Property Tax,Business Property Tax,and Revenue-in-Lieu
71.9%
Service Revenues21.4%
Other CommonRevenues
5.7%
Utility OperatingSurplus1.0%
Police22.3%
Fire/EMS11.6%
Roads6.4%
Transit6.9%
Parks, Rec,Culture, Community
14.0%
GeneralGovernment
13.2%
Other6.9%
PublicTransit
Fire andEMS
PoliceService
GeneralGov't
OtherServices
PRCC Services
CityRoads
TotalOperating
93.5%88.8%
84.8%79.8%
64.6%58.9% 58.9%
74.9%
Capital, Reserves,Debt Repayment
18.7%
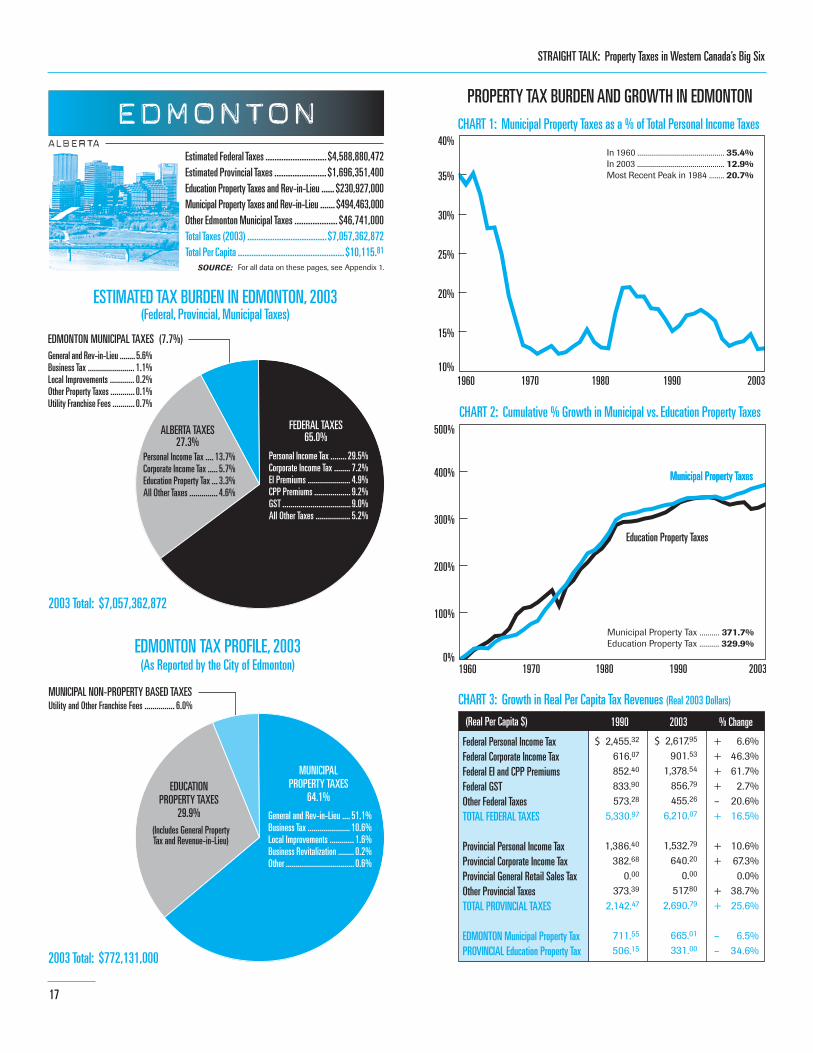
17
STRAIGHT TALK: Property Taxes in Western Canada’s Big Six
Estimated Federal Taxes ........................... $4,588,880,472Estimated Provincial Taxes ....................... $1,696,351,400Education Property Taxes and Rev-in-Lieu ...... $230,927,000Municipal Property Taxes and Rev-in-Lieu ....... $494,463,000Other Edmonton Municipal Taxes ................... $46,741,000Total Taxes (2003) ................................... $7,057,362,872Total Per Capita ............................................... $10,115.81
EDMONTONALBERTA
ESTIMATED TAX BURDEN IN EDMONTON, 2003(Federal, Provincial, Municipal Taxes)
2003 Total: $7,057,362,872
EDMONTON MUNICIPAL TAXES (7.7%)
EDMONTON TAX PROFILE, 2003(As Reported by the City of Edmonton)
2003 Total: $772,131,000
FEDERAL TAXES65.0%
Personal Income Tax ........ 29.5%Corporate Income Tax ........ 7.2%EI Premiums ..................... 4.9%CPP Premiums .................. 9.2%GST .................................. 9.0%All Other Taxes ................. 5.2%
ALBERTA TAXES27.3%
Personal Income Tax .... 13.7%Corporate Income Tax ..... 5.7%Education Property Tax ... 3.3%All Other Taxes .............. 4.6%
General and Rev-in-Lieu ........ 5.6%Business Tax ....................... 1.1%Local Improvements ............ 0.2%Other Property Taxes ............ 0.1%Utility Franchise Fees ........... 0.7%
MUNICIPALPROPERTY TAXES
64.1%EDUCATION
PROPERTY TAXES29.9%
MUNICIPAL NON-PROPERTY BASED TAXESUtility and Other Franchise Fees ............... 6.0%
(Includes General PropertyTax and Revenue-in-Lieu)
General and Rev-in-Lieu .... 51.1%Business Tax ..................... 10.6%Local Improvements ............ 1.6%Business Revitalization ........ 0.2%Other .................................. 0.6%
For all data on these pages, see Appendix 1.SOURCE:
PROPERTY TAX BURDEN AND GROWTH IN EDMONTON
0%
100%
200%
300%
400%
500%
1960 1970
CHART 2: Cumulative % Growth in Municipal vs. Education Property Taxes
CHART 1: Municipal Property Taxes as a % of Total Personal Income Taxes
1960 2003199019801970
19901980
10%
15%
20%
25%
30%
35%
40%
2003
Municipal Property TaxesMunicipal Property Taxes
Education Property Taxes
CHART 3: Growth in Real Per Capita Tax Revenues (Real 2003 Dollars)
$ 2,455.32
616.07
852.40
833.90
573.28
5,330.97
1,386.40
382.68
0.00
373.39
2,142.47
711.55
506.15
1990 2003
$ 2,617.95
901.53
1,378.54
856.79
455.26
6,210.07
1,532.79
640.20
0.00
517.80
2,690.79
665.01
331.00
Federal Personal Income TaxFederal Corporate Income TaxFederal EI and CPP PremiumsFederal GSTOther Federal TaxesTOTAL FEDERAL TAXES
Provincial Personal Income TaxProvincial Corporate Income TaxProvincial General Retail Sales TaxOther Provincial TaxesTOTAL PROVINCIAL TAXES
EDMONTON Municipal Property TaxPROVINCIAL Education Property Tax
(Real Per Capita $) % Change
+ 6.6%+ 46.3%+ 61.7%+ 2.7%– 20.6%+ 16.5%
+ 10.6%+ 67.3%
0.0%+ 38.7%+ 25.6%
– 6.5%– 34.6%
In 1960 ............................................ 35.4%In 2003 ............................................ 12.9%Most Recent Peak in 1984 ........ 20.7%
Municipal Property Tax .......... 371.7%Education Property Tax .......... 329.9%

WestCanada
18
PROPERTY TAX BURDEN AND GROWTH IN EDMONTON
1970
CHART 6: Municipal Property Taxes as a % of Personal Disposable Income
1970
CHART 4: Cumulative % Growth in Municipal Property Tax and Assessments
199019800%
100%
200%
300%
400%
2003
CHART 5: Real Per Capita Municipal Property Tax Collected (Real 2003 Dollars)
1960 2003199019801970$300
$400
$500
$600
$700
$800
1960 19901980 20031.0%
2.0%
3.0%
4.0%
5.0%
1960
In 1960 ......................................... $348.46
In 2003 ......................................... $665.01
Most Recent Peak in 1986 ...... $785.31
Municipal Property Tax ........... 371.7%Assessed Values ....................... 196.7%
In 1960 ............................................. 3.71%In 2003 ............................................. 2.93%Most Recent Peak in 1987 ......... 4.30%
Municipal PropertyTaxes Collected
Total AssessedValues
Personal disposable income here is grossincome less federal and provincial
personal income tax only.
CHART 7: Revenue Profile of the Operating Budget
ROLE OF THE PROPERTY TAX IN EDMONTON (2004 Budget)
CHART 9: % of Tax-Supported Operating Expenses Dependent on General Funding
CHART 8: Usage of Edmonton's Property Tax Dollar
Property Tax50.2%
ServiceRevenues
23.9%
Other CommonRevenues
22.6%
Utility OperatingSurplus3.3%
Police18.7%
Fire/EMS13.3%
Roads8.9%
Transit12.7%
Parks, Rec,Culture, Community
13.7%
GeneralGovernment
9.4%
Other5.6%
GeneralGov't
Fire andEMS
PoliceService
PublicTransit
PRCC Services
CityRoads
96.2%92.2% 89.5%
83.3%
63.2% 61.0%
General Property Tax ..... 40.5%Business Tax ................... 8.3%Revenue-in-Lieu ............. 1.4%
Waste and Recycling2.5%
73.0%
59.7%
TotalOperating
32.8%
OtherServices
Waste &Recycle
Capital, Reserves,Debt Repayment
15.2%

19
STRAIGHT TALK: Property Taxes in Western Canada’s Big Six
Estimated Federal Taxes ........................... $9,244,332,997Estimated Provincial Taxes ....................... $3,417,312,200Education Property Taxes and Rev-in-Lieu ..... $428,064,000Municipal Property Taxes and Rev-in-Lieu ....... $760,416,000Other Calgary Municipal Taxes ...................... $68,485,000Total Taxes (2003) ................................. $13,918,610,197Total Per Capita ............................................... $15,090.95
CALGARYALBERTA
ESTIMATED TAX BURDEN IN CALGARY, 2003(Federal, Provincial, Municipal Taxes)
2003 Total: $13,918,610,197
CALGARY MUNICIPAL TAXES (6.0%)
CALGARY TAX PROFILE, 2003(As Reported by the City of Calgary)
2003 Total: $1,256,965,000
FEDERAL TAXES66.4%
Personal Income Tax ....... 30.1%Corporate Income Tax ........ 7.4%EI Premiums ..................... 5.0%CPP Premiums .................. 9.4%GST ................................. 9.2%All Other Taxes ................ 5.3%
ALBERTA TAXES27.6%
Personal Income Tax ....... 14.0%Corporate Income Tax ....... 5.8%Education Property Tax ..... 3.1%All Other Taxes ................. 4.7%
EDUCATIONPROPERTY TAXES
34.0%
General Property Tax ......... 3.8%Revenue-in-Lieu ............... 0.5%Business Tax ..................... 1.1%Local Improvements .......... 0.1%Utility Franchise Fees ........ 0.5%
Utility Franchise Fees ............................... 5.5%
MUNICIPALPROPERTY TAXES
60.5%
General Property Tax ....... 42.3%Business Tax ................... 11.9%Revenue-in-Lieu ............... 5.6%Local Improvements .......... 0.7%
General Property Tax ....... 33.3%Revenue-in-Lieu ............... 0.7%
MUNICIPAL NON-PROPERTY BASED TAXES
For all data on these pages, see Appendix 1.SOURCE:
PROPERTY TAX BURDEN AND GROWTH IN CALGARY
1970
CHART 2: Cumulative % Growth in Municipal vs. Education Property Taxes
CHART 1: Municipal Property Taxes as a % of Total Personal Income Taxes
1960 2003199019801970
199019800%
100%
200%
300%
400%
500%
5%
10%
15%
20%
25%
30%
35%
40%
2003
Municipal Property TaxesMunicipal Property Taxes
Education Property Taxes
1960
CHART 3: Growth in Real Per Capita Tax Revenues (Real 2003 Dollars)
$ 2,455.32
616.07
852.40
833.90
573.28
5,330.97
1,386.40
382.68
0.00
373.39
2,142.47
727.00
531.28
1990 2003
$ 2,617.95
901.53
1,378.54
856.79
455.26
6,210.07
1,532.79
640.20
0.00
517.80
2,690.79
747.62
464.12
Federal Personal Income TaxFederal Corporate Income TaxFederal EI and CPP PremiumsFederal GSTOther Federal TaxesTOTAL FEDERAL TAXES
Provincial Personal Income TaxProvincial Corporate Income TaxProvincial General Retail Sales TaxOther Provincial TaxesTOTAL PROVINCIAL TAXES
CALGARY Municipal Property TaxPROVINCIAL Education Property Tax
(Real Per Capita $) % Change
+ 6.6%+ 46.3%+ 61.7%+ 2.7%– 20.6%+ 16.5%
+ 10.6%+ 67.3%
0.0%+ 38.7%+ 25.6%
+ 2.8%– 12.6%
In 1960 ............................................ 33.7%In 2003 ............................................ 10.1%Most Recent Peak in 1984 ........ 15.5%
Municipal Property Tax .......... 418.8%Education Property Tax .......... 420.2%
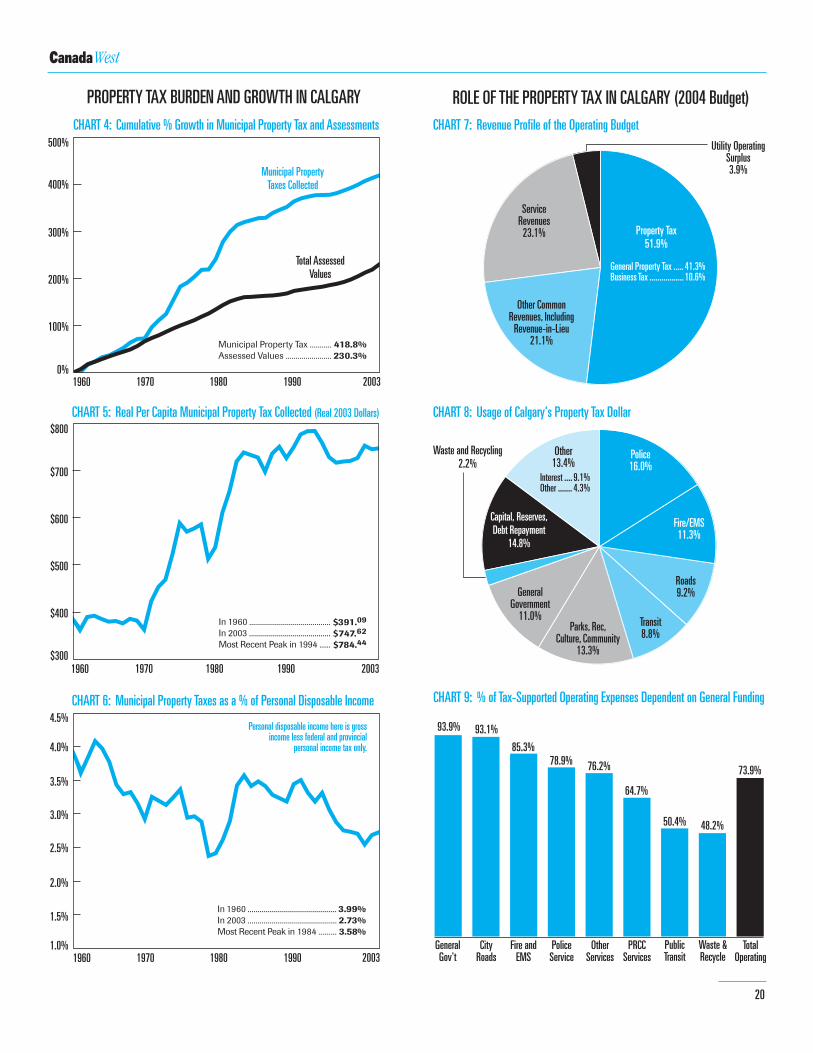
WestCanada
20
PROPERTY TAX BURDEN AND GROWTH IN CALGARY
CHART 6: Municipal Property Taxes as a % of Personal Disposable Income
1970
CHART 4: Cumulative % Growth in Municipal Property Tax and Assessments
199019800%
100%
200%
300%
400%
500%
2003
CHART 5: Real Per Capita Municipal Property Tax Collected (Real 2003 Dollars)
1960 2003199019801970$300
$400
$500
$600
$700
$800
1960 1970 19901980 20031.0%
1.5%
2.0%
2.5%
3.0%
3.5%
4.0%
4.5%
1960
Municipal PropertyTaxes Collected
Total AssessedValues
Municipal Property Tax ........... 418.8%Assessed Values ....................... 230.3%
In 1960 ............................................. 3.99%In 2003 ............................................. 2.73%Most Recent Peak in 1984 ......... 3.58%
Personal disposable income here is grossincome less federal and provincial
personal income tax only.
In 1960 .........................................In 2003 .........................................Most Recent Peak in 1994 ......
$391.09
$747.62
$784.44
CHART 7: Revenue Profile of the Operating Budget
ROLE OF THE PROPERTY TAX IN CALGARY (2004 Budget)
CHART 9: % of Tax-Supported Operating Expenses Dependent on General Funding
CHART 8: Usage of Calgary's Property Tax Dollar
Property Tax51.9%
ServiceRevenues
23.1%
Other CommonRevenues, Including
Revenue-in-Lieu21.1%
Utility OperatingSurplus3.9%
Police16.0%
Fire/EMS11.3%
Roads9.2%
Transit8.8%
Parks, Rec,Culture, Community
13.3%
GeneralGovernment
11.0%
Other13.4%
GeneralGov't
Fire andEMS
PoliceService
PRCCServices
OtherServices
CityRoads
93.9% 93.1%
85.3%78.9% 76.2%
64.7%
Waste and Recycling2.2%
73.9%
50.4%
TotalOperating
48.2%
PublicTransit
Waste &Recycle
Interest .... 9.1%Other ....... 4.3%
General Property Tax ..... 41.3%Business Tax ................. 10.6%
Capital, Reserves,Debt Repayment
14.8%
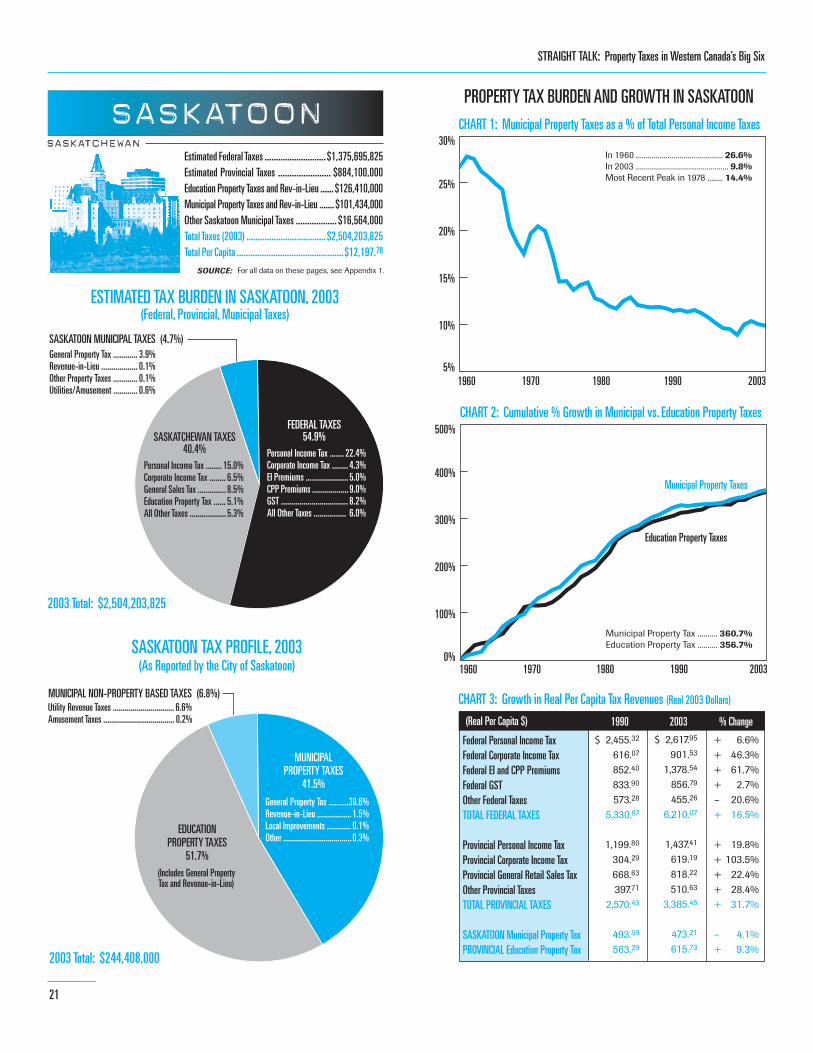
STRAIGHT TALK: Property Taxes in Western Canada’s Big Six
21
Estimated Federal Taxes ........................... $1,375,695,825Estimated Provincial Taxes ....................... $884,100,000Education Property Taxes and Rev-in-Lieu ...... $126,410,000Municipal Property Taxes and Rev-in-Lieu ....... $101,434,000Other Saskatoon Municipal Taxes .................. $16,564,000Total Taxes (2003) ................................... $2,504,203,825Total Per Capita ............................................... $12,197.78
Personal Income Tax ....... 22.4%Corporate Income Tax ........ 4.3%EI Premiums ..................... 5.0%CPP Premiums .................. 9.0%GST ................................. 8.2%All Other Taxes ................ 6.0%
SASKATOONSASKATCHEWAN
ESTIMATED TAX BURDEN IN SASKATOON, 2003(Federal, Provincial, Municipal Taxes)
2003 Total: $2,504,203,825
SASKATOON MUNICIPAL TAXES (4.7%)
SASKATOON TAX PROFILE, 2003(As Reported by the City of Saskatoon)
2003 Total: $244,408,000
MUNICIPALPROPERTY TAXES
41.5%
MUNICIPAL NON-PROPERTY BASED TAXES (6.8%)
FEDERAL TAXES54.9%SASKATCHEWAN TAXES
40.4%Personal Income Tax ........ 15.0%Corporate Income Tax ........ 6.5%General Sales Tax .............. 8.5%Education Property Tax ...... 5.1%All Other Taxes .................. 5.3%
General Property Tax ............ 3.9%Revenue-in-Lieu .................. 0.1%Other Property Taxes ............ 0.1%Utilities/Amusement ............ 0.6%
EDUCATIONPROPERTY TAXES
51.7%(Includes General PropertyTax and Revenue-in-Lieu)
General Property Tax ..........39.6%Revenue-in-Lieu ................. 1.5%Local Improvements ............ 0.1%Other .................................. 0.3%
Utility Revenue Taxes ............................... 6.6%Amusement Taxes .................................... 0.2%
For all data on these pages, see Appendix 1.SOURCE:
PROPERTY TAX BURDEN AND GROWTH IN SASKATOON
1970
CHART 2: Cumulative % Growth in Municipal vs. Education Property Taxes
CHART 1: Municipal Property Taxes as a % of Total Personal Income Taxes
1960 2003199019801970
199019800%
100%
200%
300%
400%
500%
5%
10%
15%
20%
25%
30%
2003
CHART 3: Growth in Real Per Capita Tax Revenues (Real 2003 Dollars)
$ 2,455.32
616.07
852.40
833.90
573.28
5,330.97
1,199.80
304.29
668.63
397.71
2,570.43
493.59
563.29
1990 2003
$ 2,617.95
901.53
1,378.54
856.79
455.26
6,210.07
1,437.41
619.19
818.22
510.63
3,385.45
473.21
615.73
Federal Personal Income TaxFederal Corporate Income TaxFederal EI and CPP PremiumsFederal GSTOther Federal TaxesTOTAL FEDERAL TAXES
Provincial Personal Income TaxProvincial Corporate Income TaxProvincial General Retail Sales TaxOther Provincial TaxesTOTAL PROVINCIAL TAXES
SASKATOON Municipal Property TaxPROVINCIAL Education Property Tax
(Real Per Capita $) % Change
+ 6.6%+ 46.3%+ 61.7%+ 2.7%– 20.6%+ 16.5%
+ 19.8%+ 103.5%+ 22.4%+ 28.4%+ 31.7%
– 4.1%+ 9.3%
Municipal Property Taxes
Education Property Taxes
1960
In 1960 ............................................ 26.6%In 2003 ............................................... 9.8%Most Recent Peak in 1978 ........ 14.4%
Municipal Property Tax .......... 360.7%Education Property Tax .......... 356.7%
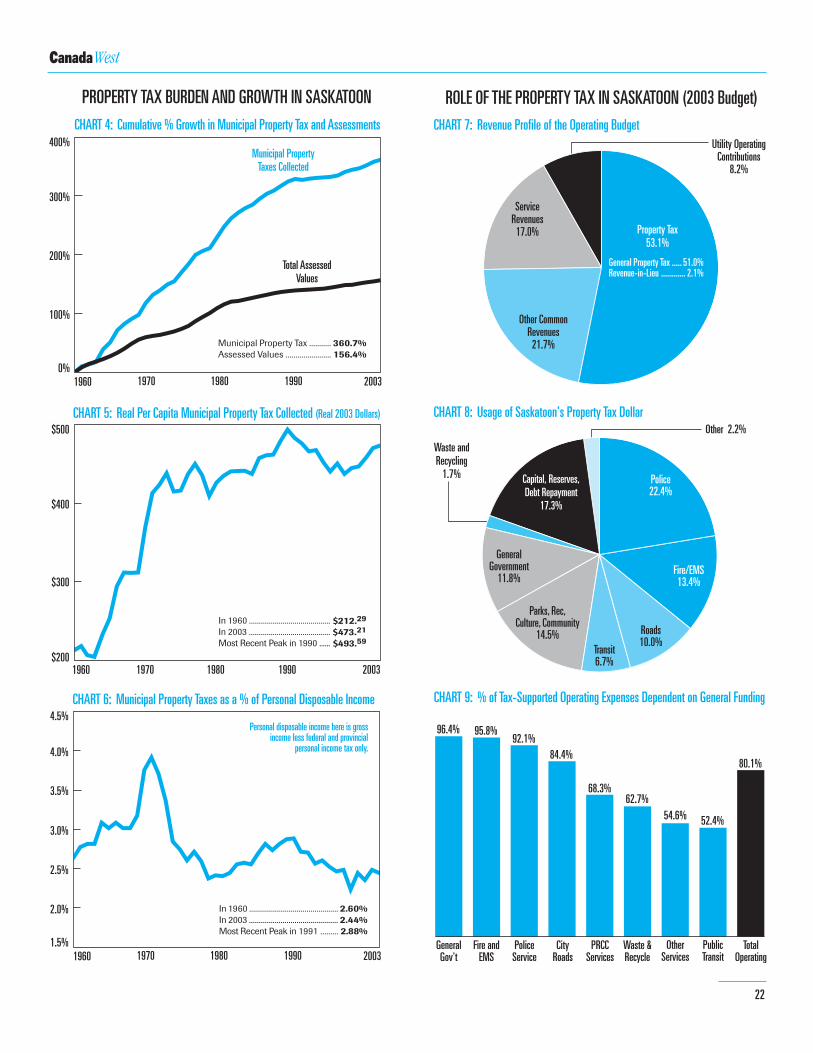
WestCanada
22
PROPERTY TAX BURDEN AND GROWTH IN SASKATOON
CHART 6: Municipal Property Taxes as a % of Personal Disposable Income
1970
CHART 4: Cumulative % Growth in Municipal Property Tax and Assessments
199019800%
100%
200%
300%
400%
2003
CHART 5: Real Per Capita Municipal Property Tax Collected (Real 2003 Dollars)
1960 2003199019801970$200
$300
$400
$500
1960 1970 19901980 20031.5%
2.0%
2.5%
3.0%
3.5%
4.0%
4.5%
1960
Municipal PropertyTaxes Collected
Total AssessedValues
Municipal Property Tax ........... 360.7%Assessed Values ....................... 156.4%
In 1960 ............................................. 2.60%In 2003 ............................................. 2.44%Most Recent Peak in 1991 ......... 2.88%
Personal disposable income here is grossincome less federal and provincial
personal income tax only.
In 1960 .........................................In 2003 .........................................Most Recent Peak in 1990 ......
$212.29
$473.21
$493.59
CHART 7: Revenue Profile of the Operating Budget
ROLE OF THE PROPERTY TAX IN SASKATOON (2003 Budget)
CHART 9: % of Tax-Supported Operating Expenses Dependent on General Funding
CHART 8: Usage of Saskatoon's Property Tax Dollar
Property Tax53.1%
ServiceRevenues
17.0%
Other CommonRevenues
21.7%
Utility OperatingContributions
8.2%
Police22.4%
Fire/EMS13.4%
Roads10.0%
Transit6.7%
Parks, Rec,Culture, Community
14.5%
GeneralGovernment
11.8%
GeneralGov't
PoliceService
CityRoads
Waste &Recycle
PRCCServices
Fire andEMS
96.4% 95.8%92.1%
84.4%
68.3%62.7%
Waste andRecycling
1.7%
80.1%
54.6%
TotalOperating
OtherServices
General Property Tax ..... 51.0%Revenue-in-Lieu ............ 2.1%
Other 2.2%
52.4%
PublicTransit
Capital, Reserves,Debt Repayment
17.3%

STRAIGHT TALK: Property Taxes in Western Canada’s Big Six
23
Estimated Federal Taxes ........................... $1,266,164,234Estimated Provincial Taxes ....................... $813,708,800Education Property Taxes and Rev-in-Lieu ...... $110,501,000Municipal Property Taxes and Rev-in-Lieu ....... $115,757,000Other Regina Municipal Taxes ....................... $30,720,000Total Taxes (2003) ................................... $2,336,851,034Total Per Capita ............................................... $12,292.75
Personal Income Tax ......... 22.1%Corporate Income Tax .......... 4.3%EI Premiums ....................... 4.9%CPP Premiums .................... 8.9%GST .................................... 8.1%All Other Taxes ................... 5.9%
REGINASASKATCHEWAN
ESTIMATED TAX BURDEN IN REGINA, 2003(Federal, Provincial, Municipal Taxes)
2003 Total: $2,336,851,034
REGINA MUNICIPAL TAXES (6.2%)
REGINA TAX PROFILE, 2003(As Reported by the City and Regina's Two School Boards)
2003 Total: $256,978,000
MUNICIPALPROPERTY TAXES
45.1%
MUNICIPAL NON-PROPERTY BASED TAXES (11.9%)
FEDERAL TAXES54.2%
SASKATCHEWAN TAXES39.6%
Personal Income Tax ........ 14.8%Corporate Income Tax ........ 6.4%General Sales Tax .............. 8.4%Education Property Tax ...... 4.7%All Other Taxes ................. 5.3%
General Property Tax .................. 4.4%Revenue-in-Lieu ........................ 0.4%Other Property Taxes .................. 0.1%Utility Revenues/Amusement ..... 1.3%
EDUCATIONPROPERTY TAXES
43.0%
Utility Franchise Fees .......... 11.8%Amusement Tax .................... 0.1%
(Includes General PropertyTax and Revenue-in-Lieu)
General Property Tax .......... 40.5%Revenue-in-Lieu ................. 3.5%Local Improvements/Other .... 1.1%
For all data on these pages, see Appendix 1.SOURCE:
PROPERTY TAX BURDEN AND GROWTH IN REGINA
1970
CHART 2: Cumulative % Growth in Municipal vs. Education Property Taxes
CHART 1: Municipal Property Taxes as a % of Total Personal Income Taxes
1960 2003199019801970
199019800%
100%
200%
300%
400%
10%
15%
20%
25%
30%
35%
40%
2003
CHART 3: Growth in Real Per Capita Tax Revenues (Real 2003 Dollars)
$ 2,455.32
616.07
852.40
833.90
573.28
5,330.97
1,199.80
304.29
668.63
397.71
2,570.43
628.58
581.61
1990 2003
$ 2,617.95
901.53
1,378.54
856.79
455.26
6,210.07
1,437.41
619.19
818.22
510.63
3,385.45
572.84
602.38
Federal Personal Income TaxFederal Corporate Income TaxFederal EI and CPP PremiumsFederal GSTOther Federal TaxesTOTAL FEDERAL TAXES
Provincial Personal Income TaxProvincial Corporate Income TaxProvincial General Retail Sales TaxOther Provincial TaxesTOTAL PROVINCIAL TAXES
REGINA Municipal Property TaxPROVINCIAL Education Property Tax
(Real Per Capita $) % Change
+ 6.6%+ 46.3%+ 61.7%+ 2.7%– 20.6%+ 16.5%
+ 19.8%+ 103.5%+ 22.4%+ 28.4%+ 31.7%
– 8.9%+ 3.6%
Municipal Property Taxes
Education Property Taxes
1960
In 1960 ............................................. 37.0%In 2003 ............................................ 11.4%Most Recent Peak in 1978 ........ 19.5%
Municipal Property Tax .......... 306.8%Education Property Tax .......... 338.8%
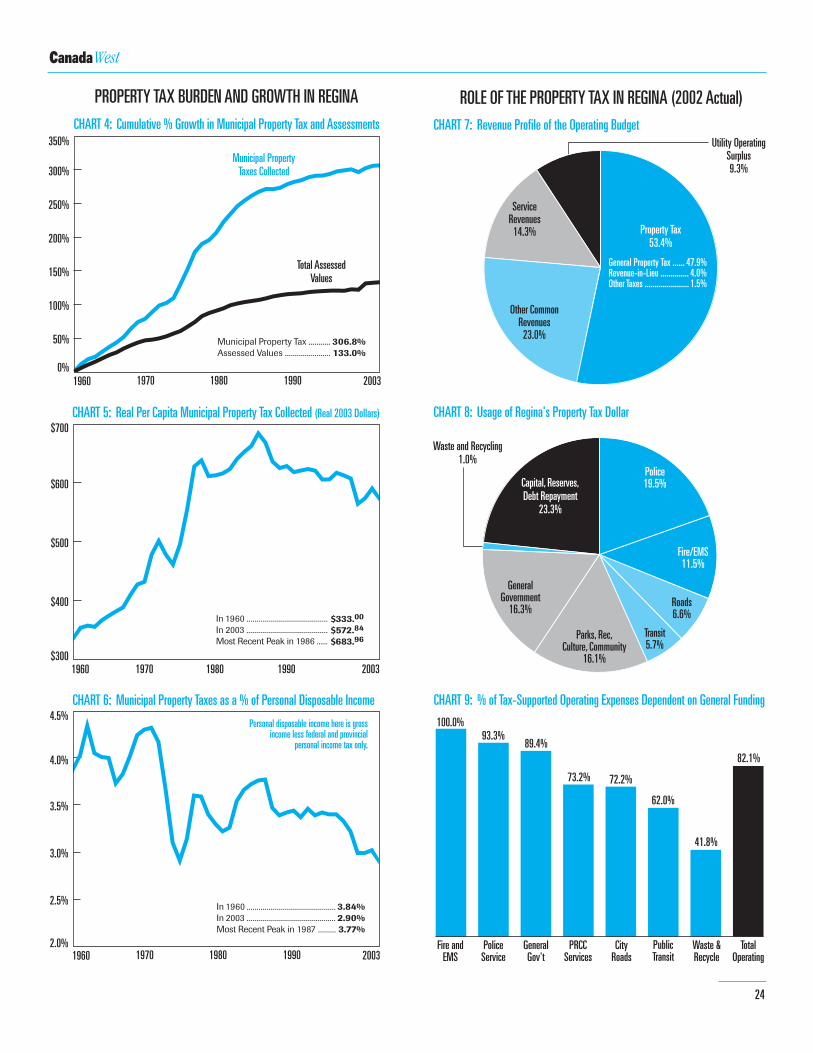
WestCanada
CHART 9: % of Tax-Supported Operating Expenses Dependent on General Funding
CHART 7: Revenue Profile of the Operating Budget
ROLE OF THE PROPERTY TAX IN REGINA (2002 Actual)
CHART 8: Usage of Regina's Property Tax Dollar
Property Tax53.4%
ServiceRevenues
14.3%
Other CommonRevenues
23.0%
Utility OperatingSurplus9.3%
Police19.5%
Fire/EMS11.5%
Roads6.6%
Transit5.7%
Parks, Rec,Culture, Community
16.1%
GeneralGovernment
16.3%
GeneralGov't
Fire andEMS
CityRoads
Waste &Recycle
PRCCServices
PoliceService
100.0%93.3%
89.4%
73.2% 72.2%
62.0%
Waste and Recycling1.0%
82.1%
41.8%
TotalOperating
PublicTransit
General Property Tax ...... 47.9%Revenue-in-Lieu .............. 4.0%Other Taxes ...................... 1.5%
Capital, Reserves,Debt Repayment
23.3%
24
PROPERTY TAX BURDEN AND GROWTH IN REGINA
1970
CHART 4: Cumulative % Growth in Municipal Property Tax and Assessments
199019800%
50%
100%
150%
200%
250%
300%
350%
2003
CHART 5: Real Per Capita Municipal Property Tax Collected (Real 2003 Dollars)
1960 2003199019801970$300
$400
$500
$600
$700
1960 1970 199019802.0%
2.5%
3.0%
3.5%
4.0%
4.5%
2003
1960
CHART 6: Municipal Property Taxes as a % of Personal Disposable Income
Municipal PropertyTaxes Collected
Total AssessedValues
Municipal Property Tax ........... 306.8%Assessed Values ....................... 133.0%
In 1960 ............................................. 3.84%In 2003 ............................................. 2.90%Most Recent Peak in 1987 ......... 3.77%
Personal disposable income here is grossincome less federal and provincial
personal income tax only.
In 1960 .........................................In 2003 .........................................Most Recent Peak in 1986 ......
$333.00
$572.84
$683.96

STRAIGHT TALK: Property Taxes in Western Canada’s Big Six
25
Estimated Federal Taxes ........................... $4,261,132,769Estimated Provincial Taxes ....................... $2,528,455,500Education Property Taxes and Rev-in-Lieu ...... $425,053,000Municipal Property Taxes and Rev-in-Lieu ....... $471,953,000Other Winnipeg Municipal Taxes ................... $18,043,000Total Taxes (2003) ................................... $7,704,637,269Total Per Capita ............................................... $11,954.44
Personal Income Tax ....... 23.2%Corporate Income Tax ....... 4.6%EI Premiums .................... 5.4%CPP Premiums ................. 9.7%GST ................................. 7.6%All Other Taxes ................. 4.8%
WINNIPEGMANITOBA
ESTIMATED TAX BURDEN IN WINNIPEG, 2003(Federal, Provincial, Municipal Taxes)
2003 Total: $7,704,637,269
WINNIPEG MUNICIPAL TAXES (6.4%)
WINNIPEG TAX PROFILE, 2003(As Reported by the City of Winnipeg)
2003 Total: $915,049,000
MUNICIPALPROPERTY TAXES
51.6%
MUNICIPAL NON-PROPERTY BASED TAXES (2.0%)
FEDERAL TAXES55.3%
MANITOBA TAXES38.3%
Personal Income Tax ........ 14.2%Corporate Income Tax ........ 5.3%General Sales Tax .............. 8.8%Education Property Tax ...... 5.5%All Other Taxes ................ 4.5%
General Property Tax ........ 4.7%Business Tax .................... 0.8%Local Improvements ......... 0.4%Revenue-in-Lieu ............... 0.3%Utilities/Amusement ........ 0.2%
EDUCATIONPROPERTY TAXES
46.4%
General Property Tax ........ 39.4%Business Tax ...................... 6.7%Local Improvements ........... 3.1%Revenue-in-Lieu ................ 2.4%
General Property Tax ........ 43.6%Revenue-in-Lieu ................ 2.8%
Utility Franchise Fees ......... 1.7%Amusement Tax ................. 0.3%
For all data on these pages, see Appendix 1.SOURCE:
PROPERTY TAX BURDEN AND GROWTH IN WINNIPEG
1970
CHART 2: Cumulative % Growth in Municipal vs. Education Property Taxes
CHART 1: Municipal Property Taxes as a % of Total Personal Income Taxes
1960 2003199019801970
199019800%
100%
200%
300%
400%
10%
15%
20%
25%
30%
35%
40%
2003
CHART 3: Growth in Real Per Capita Tax Revenues (Real 2003 Dollars)
$ 2,455.32
616.07
852.40
833.90
573.28
5,330.97
1,245.02
530.13
748.70
597.75
3,121.60
768.05
576.46
1990 2003
$ 2,617.95
901.53
1,378.54
856.79
455.26
6,210.07
1,406.95
521.16
866.01
448.92
3,243.04
698.29
619.57
Federal Personal Income TaxFederal Corporate Income TaxFederal EI and CPP PremiumsFederal GSTOther Federal TaxesTOTAL FEDERAL TAXES
Provincial Personal Income TaxProvincial Corporate Income TaxProvincial General Retail Sales TaxOther Provincial TaxesTOTAL PROVINCIAL TAXES
WINNIPEG Municipal Property TaxPROVINCIAL Education Property Tax
(Real Per Capita $) % Change
+ 6.6%+ 46.3%+ 61.7%+ 2.7%– 20.6%+ 16.5%
+ 13.0%– 1.7%+ 15.7%– 24.9%+ 3.9%
– 9.1%+ 7.5%
Municipal Property Taxes
Education Property Taxes
1960
In 1960 ............................................ 37.0%In 2003 ............................................ 14.6%Most Recent Peak in 1978 ........ 24.3%
Municipal Property Tax .......... 433.3%Education Property Tax .......... 409.5%
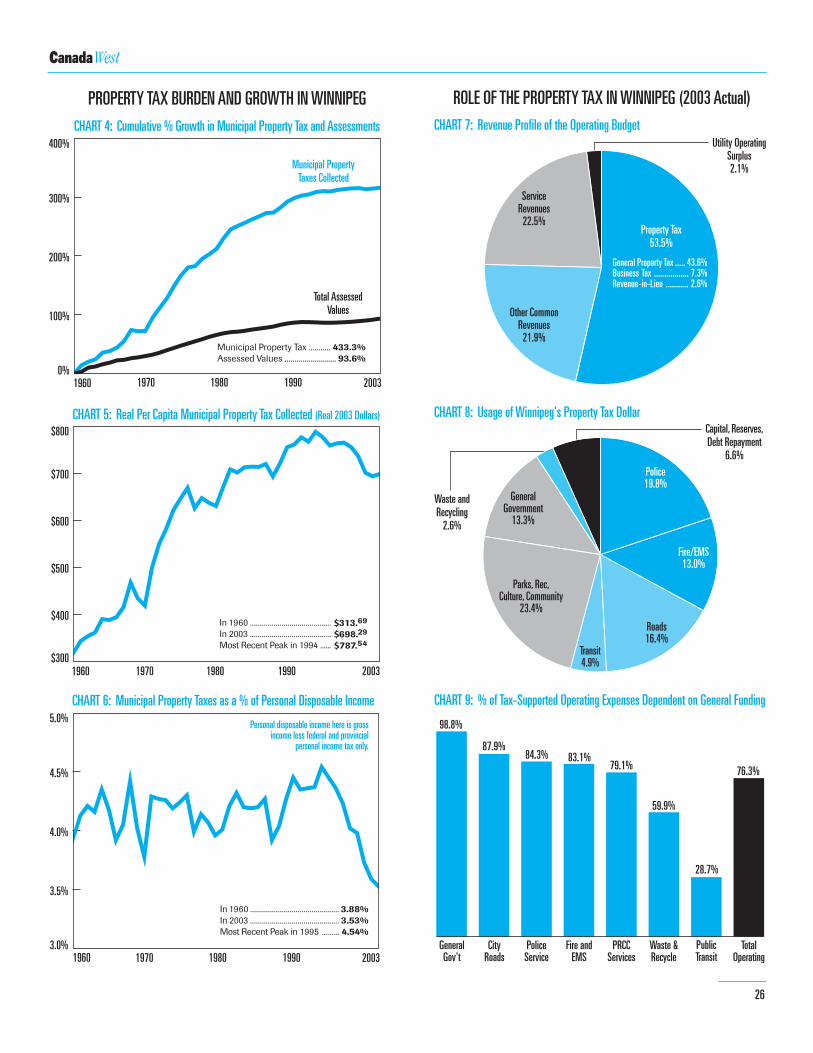
WestCanada
26
PROPERTY TAX BURDEN AND GROWTH IN WINNIPEG
1970
CHART 4: Cumulative % Growth in Municipal Property Tax and Assessments
199019800%
100%
200%
300%
400%
2003
CHART 5: Real Per Capita Municipal Property Tax Collected (Real 2003 Dollars)
1960 2003199019801970$300
$400
$500
$600
$700
$800
1960 1970 19901980 20033.0%
3.5%
4.0%
4.5%
5.0%
1960
CHART 6: Municipal Property Taxes as a % of Personal Disposable Income
Municipal PropertyTaxes Collected
Total AssessedValues
Municipal Property Tax ........... 433.3%Assessed Values .......................... 93.6%
In 1960 ............................................. 3.88%In 2003 ............................................. 3.53%Most Recent Peak in 1995 ......... 4.54%
Personal disposable income here is grossincome less federal and provincial
personal income tax only.
In 1960 .........................................In 2003 .........................................Most Recent Peak in 1994 ......
$313.69
$698.29
$787.54
CHART 9: % of Tax-Supported Operating Expenses Dependent on General Funding
CHART 7: Revenue Profile of the Operating Budget
ROLE OF THE PROPERTY TAX IN WINNIPEG (2003 Actual)
CHART 8: Usage of Winnipeg's Property Tax Dollar
Property Tax53.5%
ServiceRevenues
22.5%
Other CommonRevenues
21.9%
Utility OperatingSurplus2.1%
Police19.8%
Fire/EMS13.0%
Roads16.4%
Transit4.9%
Parks, Rec,Culture, Community
23.4%
GeneralGovernment
13.3%
GeneralGov't
Fire andEMS
CityRoads
Waste &Recycle
PRCCServices
PoliceService
98.8%
87.9%84.3% 83.1%
79.1%
59.9%
Waste andRecycling
2.6%
76.3%
28.7%
TotalOperating
PublicTransit
General Property Tax ..... 43.6%Business Tax ................. 7.3%Revenue-in-Lieu ........... 2.6%
Capital, Reserves,Debt Repayment
6.6%
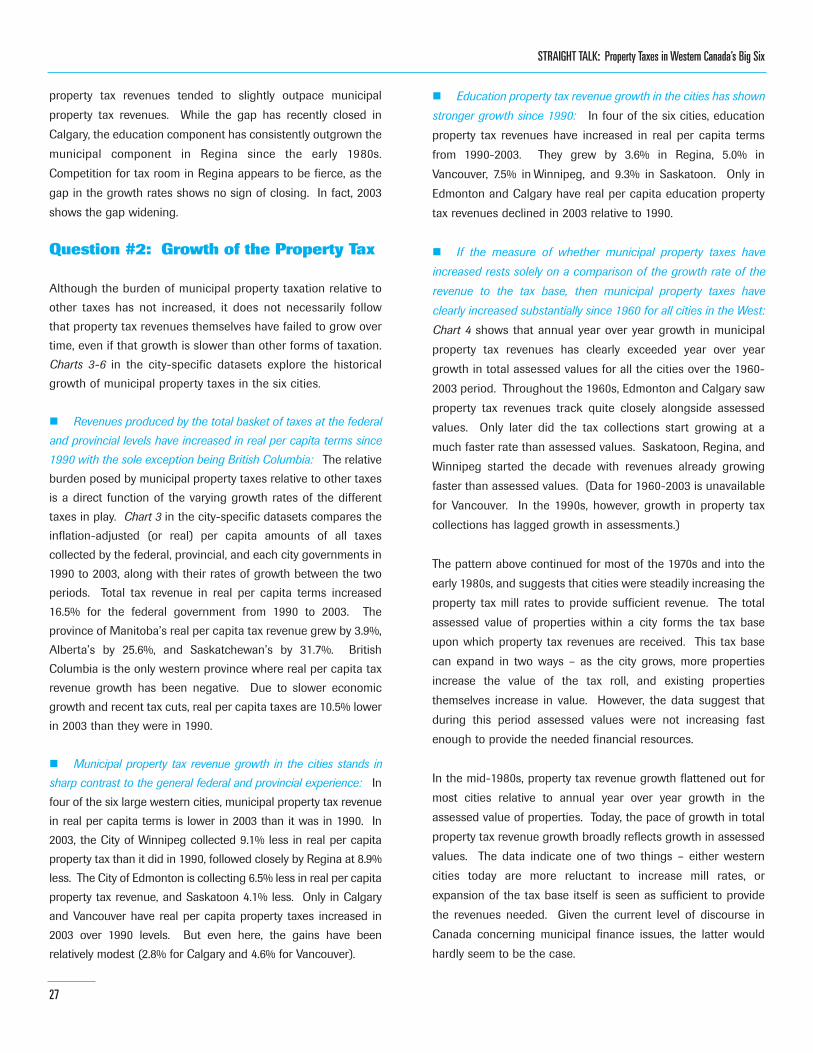
STRAIGHT TALK: Property Taxes in Western Canada’s Big Six
27
property tax revenues tended to slightly outpace municipal
property tax revenues. While the gap has recently closed in
Calgary, the education component has consistently outgrown the
municipal component in Regina since the early 1980s.
Competition for tax room in Regina appears to be fierce, as the
gap in the growth rates shows no sign of closing. In fact, 2003
shows the gap widening.
Question #2: Growth of the Property Tax
Although the burden of municipal property taxation relative to
other taxes has not increased, it does not necessarily follow
that property tax revenues themselves have failed to grow over
time, even if that growth is slower than other forms of taxation.
Charts 3-6 in the city-specific datasets explore the historical
growth of municipal property taxes in the six cities.
� Revenues produced by the total basket of taxes at the federal
and provincial levels have increased in real per capita terms since
1990 with the sole exception being British Columbia: The relative
burden posed by municipal property taxes relative to other taxes
is a direct function of the varying growth rates of the different
taxes in play. Chart 3 in the city-specific datasets compares the
inflation-adjusted (or real) per capita amounts of all taxes
collected by the federal, provincial, and each city governments in
1990 to 2003, along with their rates of growth between the two
periods. Total tax revenue in real per capita terms increased
16.5% for the federal government from 1990 to 2003. The
province of Manitoba’s real per capita tax revenue grew by 3.9%,
Alberta’s by 25.6%, and Saskatchewan’s by 31.7%. British
Columbia is the only western province where real per capita tax
revenue growth has been negative. Due to slower economic
growth and recent tax cuts, real per capita taxes are 10.5% lower
in 2003 than they were in 1990.
� Municipal property tax revenue growth in the cities stands in
sharp contrast to the general federal and provincial experience: In
four of the six large western cities, municipal property tax revenue
in real per capita terms is lower in 2003 than it was in 1990. In
2003, the City of Winnipeg collected 9.1% less in real per capita
property tax than it did in 1990, followed closely by Regina at 8.9%
less. The City of Edmonton is collecting 6.5% less in real per capita
property tax revenue, and Saskatoon 4.1% less. Only in Calgary
and Vancouver have real per capita property taxes increased in
2003 over 1990 levels. But even here, the gains have been
relatively modest (2.8% for Calgary and 4.6% for Vancouver).
� Education property tax revenue growth in the cities has shown
stronger growth since 1990: In four of the six cities, education
property tax revenues have increased in real per capita terms
from 1990-2003. They grew by 3.6% in Regina, 5.0% in
Vancouver, 7.5% in Winnipeg, and 9.3% in Saskatoon. Only in
Edmonton and Calgary have real per capita education property
tax revenues declined in 2003 relative to 1990.
� If the measure of whether municipal property taxes have
increased rests solely on a comparison of the growth rate of the
revenue to the tax base, then municipal property taxes have
clearly increased substantially since 1960 for all cities in the West:
Chart 4 shows that annual year over year growth in municipal
property tax revenues has clearly exceeded year over year
growth in total assessed values for all the cities over the 1960-
2003 period. Throughout the 1960s, Edmonton and Calgary saw
property tax revenues track quite closely alongside assessed
values. Only later did the tax collections start growing at a
much faster rate than assessed values. Saskatoon, Regina, and
Winnipeg started the decade with revenues already growing
faster than assessed values. (Data for 1960-2003 is unavailable
for Vancouver. In the 1990s, however, growth in property tax
collections has lagged growth in assessments.)
The pattern above continued for most of the 1970s and into the
early 1980s, and suggests that cities were steadily increasing the
property tax mill rates to provide sufficient revenue. The total
assessed value of properties within a city forms the tax base
upon which property tax revenues are received. This tax base
can expand in two ways – as the city grows, more properties
increase the value of the tax roll, and existing properties
themselves increase in value. However, the data suggest that
during this period assessed values were not increasing fast
enough to provide the needed financial resources.
In the mid-1980s, property tax revenue growth flattened out for
most cities relative to annual year over year growth in the
assessed value of properties. Today, the pace of growth in total
property tax revenue growth broadly reflects growth in assessed
values. The data indicate one of two things – either western
cities today are more reluctant to increase mill rates, or
expansion of the tax base itself is seen as sufficient to provide
the revenues needed. Given the current level of discourse in
Canada concerning municipal finance issues, the latter would
hardly seem to be the case.

WestCanada
28
� Real per capita municipal property taxes have grown
substantially since 1960, but have recently begun to fall significantly:
As seen earlier, total real per capita taxes have increased by a
factor of four since the early 1960s. Western Canada’s cities also
saw significant growth in real per capita municipal property tax
revenues, but this growth tapered off in the late 1980s and early
1990s. Since then, real per capita municipal property tax
revenues for most cities have actually fallen, especially in
Edmonton, Regina, and Winnipeg (Chart 5).
� Property tax revenues, as a percentage of personal disposable
incomes in the cities, have fallen to some of the lowest levels seen
over the past 40 years: The amount of municipal property tax
collected in 2003 by both Regina and Winnipeg represented the
lowest ever levels collected relative to personal disposable
incomes over the last 40 years, continuing a steady decline in
play since the mid-1990s. In Edmonton, Calgary, and Saskatoon,
the ratio of municipal property tax revenue collected to personal
disposable incomes approaches some of the lowest levels ever
seen (Chart 6). Without sufficient data, it is hard to get a fix on
the situation in Vancouver, but the past ten years in that city do
show a downward trend as well, even though property tax
revenues did rebound slightly in 2003.
� Municipal property taxes have contributed very little to the
overall nominal increase in taxation since 1990: The growth rates of
various taxes tells only part of the story. In Figure 9, the total
nominal increase in taxation from 1990 to 2003 was calculated for
each of the six cities. The percentage of the increase due to
municipal property taxes was then determined. On average,
municipal property taxes account for only 4.2% of the total
nominal increase in taxes from 1990 to 2003. Total municipal taxes
(including non-property based taxes) accounts for 4.9%. Clearly,
the great bulk of increased taxes since 1990 has accrued to the
federal and provincial governments.
Figure 10 (page 29) caps the discussion over any “increase” in
municipal property taxes by quantifying the amount of additional
property taxes that the six cities would have collected in fiscal
2003 if property tax revenues had not declined relative to personal
disposable incomes. If the cities had collected municipal property
taxes at the same tax-to-personal-disposable-income ratio that
prevailed in 1960, an additional $529.6 million in property tax
would have been levied in fiscal 2003 alone by Edmonton, Calgary,
Saskatoon, Regina, and Winnipeg. This would have represented a
6.7% to 46.2% increase in municipal property tax revenues.
Annual property tax collections relative to personal disposable
incomes were also averaged from 1960-2003. If the cities had
collected property taxes at the average annual ratio prevailing
from 1960-2003, another $295.7 million in property taxes would
have been collected by the five prairie cities in 2003 – a 12.8% to
23.3% increase. Simply maintaining the 1990-2003 average ratio
in 2003 would have resulted in another $253.0 million in
municipal property tax collections across all six cities.
The argument here is not that the cities should have kept the
property tax-to-personal-disposable-income ratio steady.
Rather, the point is to simply demonstrate that when it comes to
municipal property taxes, most of western Canada’s large cities
are providing taxpayers with a bargain when compared to
historical levels of taxation.
SUMMARY: Of all the ways to look at growth in property
taxes, the most significant measure is to set the revenue
collected by the tax against the personal disposable incomes
being earned in the city. This measure is critical for two reasons.
First, all taxes – whether direct or indirect – must be paid out of
incomes earned, regardless of whether the actual tax base is
income itself or the value of one’s property. Secondly, in order
Federal Tax Share
Provincial Tax Share
Education Property Tax
SUB-TOTAL
Municipal Property Tax
Other Municipal Taxes
TOTAL TAX INCREASE
Derived by CWF from Revenue Canada Income Statistics (1960-2003), DBRS, and Annual Reports of the Cities (1990-2003).SOURCE:
$ 2,121,352
574,466
63,482
2,759,300
198,355
2,937
2,960,592
71.7%
19.4%
2.1%
93.2%
6.7%
0.1%
100.0%
FIGURE 9: % Contribution of Various Taxes to the Overall Increase in Taxation, 1990-2003(All Federal, Provincial, and Local Taxes in 000s of Nominal Dollars)
$ 000s %
EDMONTON WINNIPEGREGINASASKATOONVANCOUVER CALGARY
$ 1,829,148
751,872
9,026
2,590,046
148,443
29,549
2,768,038
66.1%
27.1%
0.3%
93.5%
5.4%
1.1%
100.0%
$ 5,069,031
2,001,378
164,862
7,235,271
350,080
28,485
7,613,836
66.6%
26.3%
2.1%
95.0%
4.6%
0.4%
100.0%
Nominal Increase In:
$ 715,771
420,127
48,854
1,184,752
30,811
5,683
1,221,246
58.6%
34.4%
4.0%
97.0%
2.5%
0.5%
100.0%
$ 566,371
317,764
37,890
922,025
29,769
13,058
964,852
58.7%
32.9%
3.9%
95.5%
3.1%
1.4%
100.0%
$ 1,922,814
720,507
127,447
2,770,768
87,642
5,175
2,863,585
67.1%
25.2%
4.4%
96.7%
3.1%
0.2%
100.0%
$ 000s % $ 000s % $ 000s % $ 000s % $ 000s %
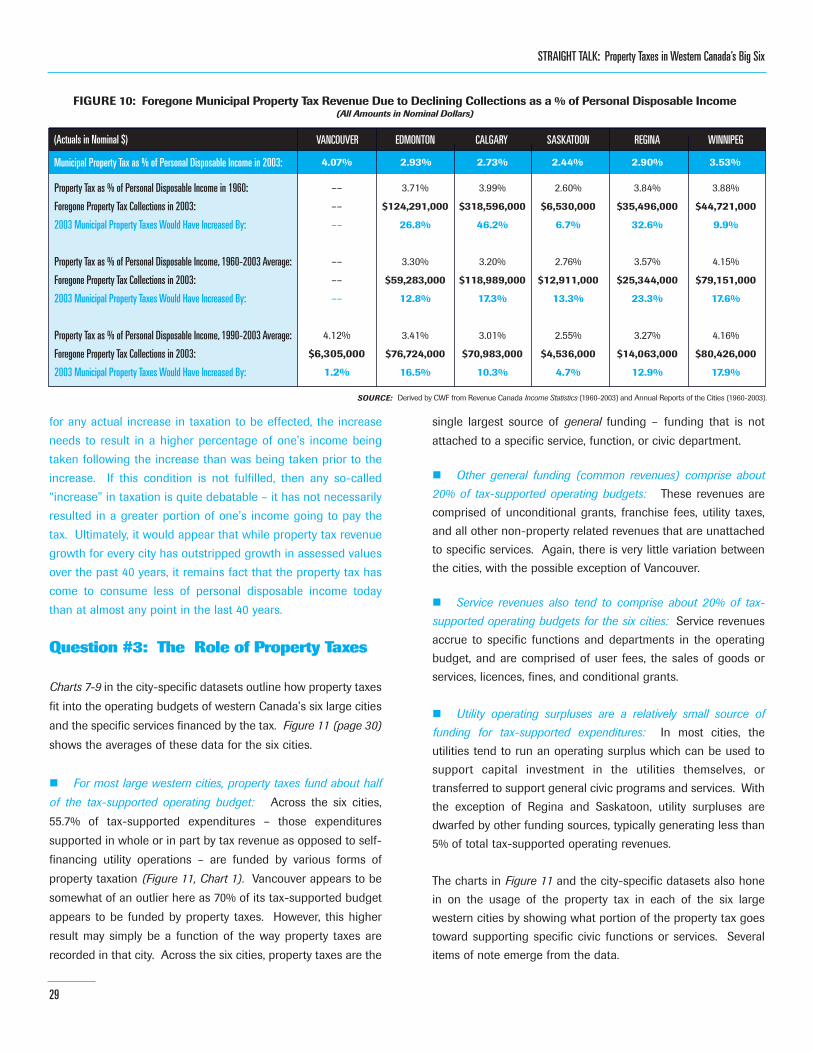
STRAIGHT TALK: Property Taxes in Western Canada’s Big Six
29
for any actual increase in taxation to be effected, the increase
needs to result in a higher percentage of one’s income being
taken following the increase than was being taken prior to the
increase. If this condition is not fulfilled, then any so-called
“increase” in taxation is quite debatable – it has not necessarily
resulted in a greater portion of one’s income going to pay the
tax. Ultimately, it would appear that while property tax revenue
growth for every city has outstripped growth in assessed values
over the past 40 years, it remains fact that the property tax has
come to consume less of personal disposable income today
than at almost any point in the last 40 years.
Question #3: The Role of Property Taxes
Charts 7-9 in the city-specific datasets outline how property taxes
fit into the operating budgets of western Canada’s six large cities
and the specific services financed by the tax. Figure 11 (page 30)
shows the averages of these data for the six cities.
� For most large western cities, property taxes fund about half
of the tax-supported operating budget: Across the six cities,
55.7% of tax-supported expenditures – those expenditures
supported in whole or in part by tax revenue as opposed to self-
financing utility operations – are funded by various forms of
property taxation (Figure 11, Chart 1). Vancouver appears to be
somewhat of an outlier here as 70% of its tax-supported budget
appears to be funded by property taxes. However, this higher
result may simply be a function of the way property taxes are
recorded in that city. Across the six cities, property taxes are the
single largest source of general funding – funding that is not
attached to a specific service, function, or civic department.
� Other general funding (common revenues) comprise about
20% of tax-supported operating budgets: These revenues are
comprised of unconditional grants, franchise fees, utility taxes,
and all other non-property related revenues that are unattached
to specific services. Again, there is very little variation between
the cities, with the possible exception of Vancouver.
� Service revenues also tend to comprise about 20% of tax-
supported operating budgets for the six cities: Service revenues
accrue to specific functions and departments in the operating
budget, and are comprised of user fees, the sales of goods or
services, licences, fines, and conditional grants.
� Utility operating surpluses are a relatively small source of
funding for tax-supported expenditures: In most cities, the
utilities tend to run an operating surplus which can be used to
support capital investment in the utilities themselves, or
transferred to support general civic programs and services. With
the exception of Regina and Saskatoon, utility surpluses are
dwarfed by other funding sources, typically generating less than
5% of total tax-supported operating revenues.
The charts in Figure 11 and the city-specific datasets also hone
in on the usage of the property tax in each of the six large
western cities by showing what portion of the property tax goes
toward supporting specific civic functions or services. Several
items of note emerge from the data.
FIGURE 10: Foregone Municipal Property Tax Revenue Due to Declining Collections as a % of Personal Disposable Income(All Amounts in Nominal Dollars)
––
––
––
––
––
––
4.12%
$6,305,000
1.2%
Property Tax as % of Personal Disposable Income in 1960:
Foregone Property Tax Collections in 2003:
2003 Municipal Property Taxes Would Have Increased By:
Property Tax as % of Personal Disposable Income, 1960-2003 Average:
Foregone Property Tax Collections in 2003:
2003 Municipal Property Taxes Would Have Increased By:
Property Tax as % of Personal Disposable Income, 1990-2003 Average:
Foregone Property Tax Collections in 2003:
2003 Municipal Property Taxes Would Have Increased By:
3.99%
$318,596,000
46.2%
3.20%
$118,989,000
17.3%
3.01%
$70,983,000
10.3%
3.71%
$124,291,000
26.8%
3.30%
$59,283,000
12.8%
3.41%
$76,724,000
16.5%
2.60%
$6,530,000
6.7%
2.76%
$12,911,000
13.3%
2.55%
$4,536,000
4.7%
3.84%
$35,496,000
32.6%
3.57%
$25,344,000
23.3%
3.27%
$14,063,000
12.9%
3.88%
$44,721,000
9.9%
4.15%
$79,151,000
17.6%
4.16%
$80,426,000
17.9%
Derived by CWF from Revenue Canada Income Statistics (1960-2003) and Annual Reports of the Cities (1960-2003).SOURCE:
Municipal Property Tax as % of Personal Disposable Income in 2003:
EDMONTON(Actuals in Nominal $) WINNIPEGREGINASASKATOONVANCOUVER CALGARY
4.07% 3.53%2.90%2.44%2.73%2.93%
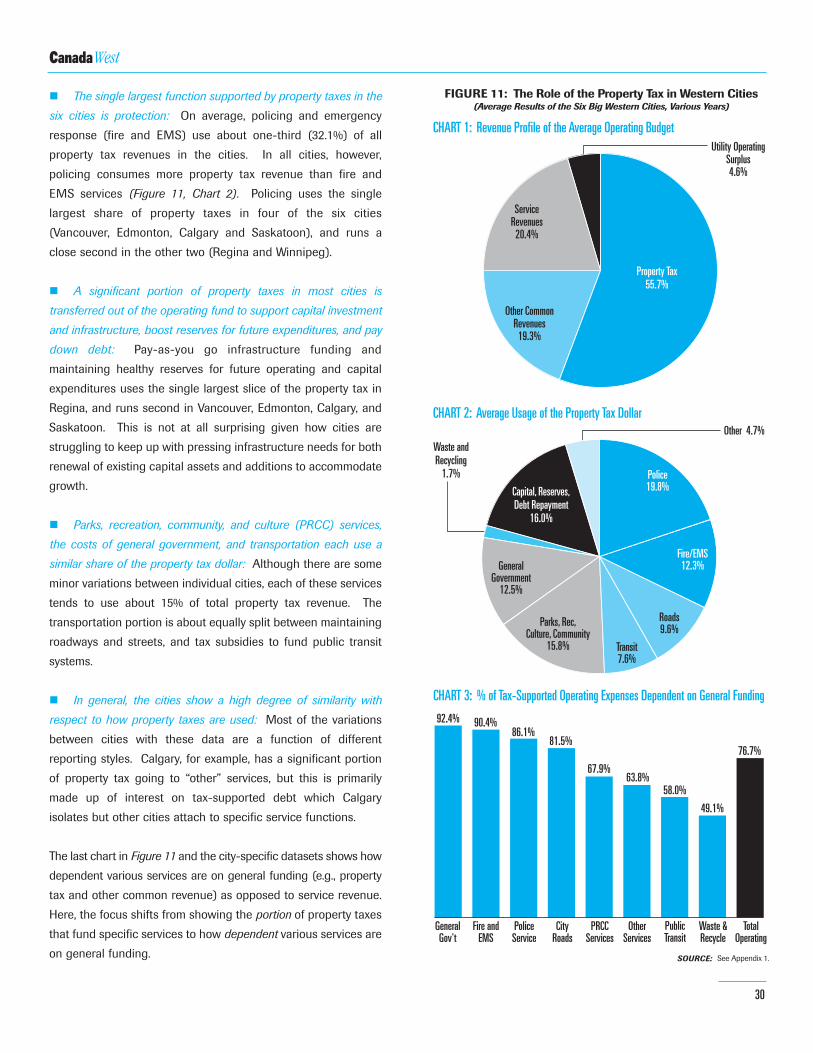
WestCanada
30
� The single largest function supported by property taxes in the
six cities is protection: On average, policing and emergency
response (fire and EMS) use about one-third (32.1%) of all
property tax revenues in the cities. In all cities, however,
policing consumes more property tax revenue than fire and
EMS services (Figure 11, Chart 2). Policing uses the single
largest share of property taxes in four of the six cities
(Vancouver, Edmonton, Calgary and Saskatoon), and runs a
close second in the other two (Regina and Winnipeg).
� A significant portion of property taxes in most cities is
transferred out of the operating fund to support capital investment
and infrastructure, boost reserves for future expenditures, and pay
down debt: Pay-as-you go infrastructure funding and
maintaining healthy reserves for future operating and capital
expenditures uses the single largest slice of the property tax in
Regina, and runs second in Vancouver, Edmonton, Calgary, and
Saskatoon. This is not at all surprising given how cities are
struggling to keep up with pressing infrastructure needs for both
renewal of existing capital assets and additions to accommodate
growth.
� Parks, recreation, community, and culture (PRCC) services,
the costs of general government, and transportation each use a
similar share of the property tax dollar: Although there are some
minor variations between individual cities, each of these services
tends to use about 15% of total property tax revenue. The
transportation portion is about equally split between maintaining
roadways and streets, and tax subsidies to fund public transit
systems.
� In general, the cities show a high degree of similarity with
respect to how property taxes are used: Most of the variations
between cities with these data are a function of different
reporting styles. Calgary, for example, has a significant portion
of property tax going to “other” services, but this is primarily
made up of interest on tax-supported debt which Calgary
isolates but other cities attach to specific service functions.
The last chart in Figure 11 and the city-specific datasets shows how
dependent various services are on general funding (e.g., property
tax and other common revenue) as opposed to service revenue.
Here, the focus shifts from showing the portion of property taxes
that fund specific services to how dependent various services are
on general funding.
CHART 1: Revenue Profile of the Average Operating Budget
CHART 3: % of Tax-Supported Operating Expenses Dependent on General Funding
CHART 2: Average Usage of the Property Tax Dollar
Property Tax55.7%
ServiceRevenues
20.4%
Other CommonRevenues
19.3%
Utility OperatingSurplus4.6%
Police19.8%
Fire/EMS12.3%
Roads9.6%
Transit7.6%
Parks, Rec,Culture, Community
15.8%
GeneralGovernment
12.5%
GeneralGov't
PoliceService
CityRoads
OtherServices
PRCCServices
Fire andEMS
92.4% 90.4%86.1%
81.5%
67.9%63.8%
Waste andRecycling
1.7%
76.7%
58.0%
TotalOperating
PublicTransit
Capital, Reserves,Debt Repayment
16.0%
FIGURE 11: The Role of the Property Tax in Western Cities(Average Results of the Six Big Western Cities, Various Years)
Other 4.7%
49.1%
Waste &Recycle
See Appendix 1.SOURCE:
STRAIGHT TALK: Property Taxes in Western Canada’s Big Six
31
� General government expenditures are the most dependent on
general funding, and by implication, property taxes: The costs of
administration have few service revenues attached to them, and
are the most dependent on general funding. On average, 92.4%
of these expenditures need to be funded by general revenues
(Figure 11, Chart 3). In four of the cities (Edmonton, Calgary,
Saskatoon, and Winnipeg), general government expenditures are
the one service area that most requires general funding.
� The costs of combined fire and EMS services run a very close
second: Emergency response in the West’s six big cities is also
highly dependent on general funding, with an average of 90.4%
of these costs being covered through property taxes and other
common revenues. Many EMS services operate on a partial cost
recovery basis, but when it is merged with fire response, the two
still require significant general funding. Emergency response is
the most dependent service on general funding in Regina, and
second in both Vancouver and Saskatoon.
� Policing is also highly dependent on general funding with
86.1% of all costs coming from general funding sources: While
police service is not the most dependent on general funding in
any city, it still runs second in Regina and third in Vancouver,
Saskatoon, and Winnipeg.
� Most other municipal services are much less dependent on
general funding in that they raise at least a certain portion of own-
source revenue to fund operations: On average, about one-third
of the cost of parks, recreation, cultural, and community services
are covered through service revenue, with the remainder covered
from the property tax and other common revenues. Across the
West, public transit appears to require about a 60% subsidy from
general funding, with the rest coming from fares or conditional
operating grants. However, Vancouver’s contribution to the
regional transit system is entirely tax-based, which skews the
results. Across the five prairie cities, about 50% of the cost of
transit appears to come from general funding, a similar amount
as that recorded for solid waste services and recycling.
SUMMARY: Across the West, 76.7% of tax-supported services
require general funding. There is little difference between cities.
Edmonton appears to use general funding the least (73.0%), but
that is not much lower than Calgary (73.9%), Vancouver (74.9%)
or Winnipeg (76.3%). Saskatoon and Regina appear to be
somewhat more dependent on general funding, but this may also
result from different reporting practices.
QUESTION #4: Assessing the Property Tax
The property tax has been an established feature of the tax
system in Canada for over a century. It is well entrenched and
has gained general – if somewhat reluctant – acceptance as a
means to finance city services. Not only are the administration
mechanisms in place, but property owners expect to pay
property tax. In many ways, the property tax tends to work well
for local governments, but it has increasingly come under fire as
an outdated tax ill-suited for the needs of today’s large cities.
What are the advantages and disadvantages of the property tax?
1. Advantages
� A dedicated local tax: The property tax has traditionally been
understood as the reserve of local governments. This, coupled
with the relatively straightforward computation and collection of
the tax, has led to historical support and appreciation for the
purposes behind the tax.
� Property tax rates are set locally: Citizens and their civic
leaders settle on the bundle of services desired for the taxes they
are willing to pay. In large metropolitan areas, such locally set tax
rates foster choice and competition between cities, strengthening
the cities and driving them to excel.
� A good fit with the “benefits principle” of taxation: The tax is
equitable if only because all residents pay for the benefits that
accrue from the services financed by the tax. Many city services
and improvements are provided directly to properties, which also
increases property values. There are a number of ties here that
make the property tax quite appropriate in the local context.
� An immobile and stable tax base: Property cannot get up and
move. Further, non-payment of the tax jeopardizes ownership.
Thus, property taxes are hard to duck, leading to reasonable tax
compliance and good collection rates. As a tax base, property
values also exhibit low volatility despite happenings in the broader
economy – the assessed value of property is generally better
insulated against economic shocks than most other tax bases.
� Stable and predictable revenues: If property values and the
assessment base are relatively healthy, the property tax produces
a very important advantage in the form of reliable and stable
revenue flows. In other words, the property tax is relatively
inelastic – revenues do not surge in response to economic growth
nor do they collapse during recession.

WestCanada
32
� A highly visible tax: Unlike a tax embedded in the price of a
good or service, property taxes are clearly stated on a tax bill that
accompanies a formal notice of assessment. Many taxpayers are
unaware of the amount of sales or income tax they pay, but know
to the penny their property tax liability. Paying the tax in
installments blurs the visibility, but it never fully recedes out of view.
� An accountable and transparent tax: Visibility automatically
leads to accountability, both in how the tax is used and any move
to increase it. The property tax is perhaps one of the most
transparent taxes going – every percentage point change is
subject to intense public debate and media scrutiny.
2. Disadvantages
� Historical appeal of the property tax as a local tax may be
weakening: Increasingly complex assessment practices and
centralization of the education tax component threaten to weaken
the local nature of the property tax. Further, taxpayers do not always
distinguish between the municipal and education tax levy, which
gives the impression that the costs of municipal services are too
high. Cities themselves often work to limit municipal tax increases
only to see the vacated tax room threatened or swallowed by other
authorities. In some cities, the education property taxes need to be
forwarded even if arrears or tax appeals have prevented collection
of the full levy. This cuts into municipal revenues.
� Setting tax rates locally is not all it could be: Assessment
practices, many of which are determined by provincial legislation,
are just as important as the tax rate in determining the final
property tax payable. Provinces often stipulate the various
property classes as well as the portion of actual property valuation
that is taxable. Prescribed exemption of some properties presents
another limitation, and revenue-in-lieu of tax cannot be directly
controlled. Cities are not as free with the property tax as most
would like to believe.
� The “benefits principle” does not always apply: Like any tax,
everyone pays whether they use a particular service or not. Also,
many city services do not link to individual properties, being more
regional in nature. Under the current system, properties of similar
type are assessed the same regardless of the costs of service
provision – the tax payable does not always reflect the variable
costs of providing services to different properties. For example,
properties that are “close-in” are usually more expensive and carry
higher assessed values than similar properties in the suburbs. Yet,
the costs of servicing peripheral properties and their attendant
infrastructure are arguably higher. Of particular concern is that
the tax is not uniformly applied across all properties – there is
discrimination in assessed values, and differential tax rates are
often applied to different classes of property. It is generally
conceded that multi-family residences carry a higher effective tax
rate than single-family residences, and commercial and industrial
properties are taxed at a higher rate than all types of residential
properties (Kitchen and Slack 1993, UNSM 2001, Kitchen 2000).
None of this constitutes a link between the taxes paid, the cost of
services or infrastructure provided, and the benefits received. Such
cross-subsidization has opened the property tax up to the charge
that it violates principles of fairness and equity, it rewards urban
sprawl, and it artificially increases both the demand for, and the
costs of, services and infrastructure.
� Unlike other taxes, there is no completely objective measure of
the property tax base: Property values are estimated through a
process of assessment, which can be labour intensive, expensive,
and open to dispute. Assessment is as much art as it is science,
and even experienced and accredited appraisers can disagree on
the value of the same property. This can result in under-
assessment and under-taxation, once again affecting the
equitable distribution of the property tax and exposing cities to
numerous appeals and tax refunds. A high number of appeals can
affect revenue stability from year to year, undercutting a key
advantage of the property tax. In some cities, it is not unheard of
to have 10% of the commercial assessment base under challenge
through appeals. No other government has such challenges
facing their tax base.
� The tax base expands only slowly: The revenue generated by a
tax is a function of the size of the tax base, the value of the base,
and the rate that is applied. For the property tax, the base is the
total assessed value of real property. This is a narrow tax base that
links directly to only one aspect of the economy – real estate. This
tax base expands only slowly, often less than the rate of inflation.
Further, increases in the value of the tax base are captured only
when a reassessment occurs. This tends to happen infrequently,
unless a city is following a practice of market value assessment that
is updated annually (City of Edmonton 2000, City of Regina 2001).
Because the property tax base expands slowly and the full
increase in the value of the tax base is not always factored into the
tax equation, many cities find themselves having to increase the
tax rate simply to compensate for inflation, never mind increasing
the amount of revenue in real dollar terms (UNSM 2001). In the
media and the minds of the public, this is a tax increase. What is
conveniently forgotten is that a portion of the so-called “increase”
is accounted for by inflation, and is likely offset by increases in
incomes as well (Loreto and Price 1990).
STRAIGHT TALK: Property Taxes in Western Canada’s Big Six
33
� Sluggish revenue growth: The high visibility of the property tax
combined with the need to continually adjust the mill rate, places
city officials at a significant disadvantage. Fearing public
backlash, many civic leaders are hesitant to adjust the property tax
rate to ensure sufficient revenue growth – it is viewed as a tax
increase (McCready 1984). As long as the economy continues
expanding, revenues from personal income taxes and sales
taxes automatically increase without touching the tax rate.
The base of a sales tax, for example, increases annually as
more goods are purchased. The value of the base increases
with the value of the goods and services sold. The rate always
captures the effects of inflation, which are reflected in the
prices of the goods or services consumed. Cities, singularly
dependent on the property tax, are simply not afforded this
luxury. Ensuring adequate revenue growth that reflects growth in
the overall economy takes more than just political debate, but
steely resolve.
� Sluggish growth is a double-whammy: Slow revenue growth
creates a fiscal gap between revenues and growing demands for
services and infrastructure, but it also limits the ability of cities to
debt-finance capital expenditures. When revenues expand at a
reasonable pace, some of that growth can be leveraged with
modest amounts of debt without increasing the interest burden to
the operating budget. If revenues grow slowly, the interest that
accompanies any increase in debt consumes more and more
operating revenue, squeezing out other priorities. Given the size
of municipal infrastructure deficits, this is no small consideration.
� The tax is unrelated to ability to pay: The property tax does not
link directly to incomes earned, but only indirectly through the
value of a capital asset owned, which may or may not reflect ability
to pay. For those with low or fixed incomes, higher property taxes
can be a significant burden. Thus, many suspect that the property
tax is highly regressive. However, regressivity likely depends on
the type of property, the assessment practices in place, and the
availability of tax credits, deferrals, exemptions, reductions, or
refunds (Loreto and Price 1990, McCready 1984). In general, the
jury is still out on this issue.
� Free-riding: From a big city perspective, one of the biggest
disadvantages of the property tax is its inability to capture tax
revenue from a host of outsiders who pay their property taxes
elsewhere but nonetheless impose a cost to the city. For example,
at least some of the investment in the capital infrastructure of a
city is required to meet the demands of commuters and truckers,
and many of the services produced by the municipality are also
consumed by tourists, business travellers, and other outsiders.
Yet, these individuals do not contribute to the residential property
tax base upon which many of these services and infrastructure
depend. In the past, grants used to help ameliorate this problem,
but with ongoing support a thing of the past and more and more
urbanization concentrating just outside large cities rather than
within, the problems of “fiscal disequivalence” and “free-riding”
are bound to loom even larger in the future.
� Property tax revenues can lag urban growth: The full revenue
effect of the property tax is often delayed until new property
construction is completed. A good portion of the infrastructure
required to accommodate increased population growth may have
to be financed and constructed by cities in advance of receiving
any property tax revenue generated from that growth. To be sure,
this may simply be a short-term cash flow problem, and the extent
and magnitude of any “lag time” is unclear. But, some still
maintain it can be quite problematic under certain circumstances.
� Concerns continue to be expressed about the impact of the
property tax across the economy broadly speaking, and its role
within the new information economy in particular: The property tax
really amounts to a tax on capital. Capital taxes target savings and
investment – the very fuel that drives the engine of economic
growth, innovation, and productivity. As such, some economists
argue that capital taxes are the worst taxes possible (Clemens
2002). Further, the property tax does not always seem to provide
a good fit for the commercial and industrial sector – the size of a
building does not always bear a direct relation to the level of
economic activity. This concern can only be expected to grow as
the transition to a knowledge economy continues to weaken the
link between property ownership and wealth creation.
SUMMARY: Many of the disadvantages of the property tax are
simply the flip-side of the advantages. That is true of any tax. An
elastic tax that automatically generates a vibrant and growing
stream of revenue cannot at the same time act as an inelastic tax
that produces predictable and stable revenues over the long-
term. Thus, addressing the disadvantages of the property tax
while ensuring that the advantages are retained is a powerful
argument for better tax diversity within Canada’s cities. Only then
can the pros and cons of a single tax be balanced. At the same
time, it is also clear that a number of the pitfalls with the property
tax relate to political questions concerning its administration as
opposed to any inherent economic weakness in the nature of the
tax itself. For example, simplifying the tax or allowing cities more
freedom with it are decisions that can be made to strengthen the
tax as a funding source for cities in the future.

WestCanada
34
CONCLUSION
The municipal property tax burden in the West’s six big cities is
low relative to other taxes. When measured in a number of ways,
the burden posed by the municipal property tax has also been
declining. Real per capita municipal property tax collections have
been falling, and property tax collections are also edging
downward relative to the size of the economy in general and
Canadians’ personal disposable incomes in particular. Today,
taxpayers in most large western cities are paying some of the
lowest municipal property taxes – as a percentage of total personal
disposable incomes – than at any point in the past 40 years.
A likely rejoinder is that the cities are getting more revenue
elsewhere, and this is compensating for the lower property tax
take. But preliminary evidence suggests this is not the case. In
most cities, growth in user fee revenue has not been sufficient to
offset the decrease in tax revenue. In Calgary, total user fees
comprised 27.0% of all operating revenues in 1990, rising only
slightly to 30.5% in 2003. From 1990-2003, Calgary’s user fees
averaged 2.21% of all personal disposable incomes, but in 2003
they represented 2.07%. In Edmonton, user fees comprised
20.6% of operating revenues in 1990, falling slightly to 20.3% in
2003. From 1990-2003, Edmonton’s user fees represented 2.04%
of all personal disposable incomes and in 2003 they were
virtually unchanged at 2.02%. Falling taxes and stable user fees
have not been offset by radically increased granting levels either.
All of this begs an interesting question: how are cities staying
afloat? In an earlier Canada West Foundation study entitled Big
Spenders, it was found that total real per capita spending fell for
most big cities in the West from 1990-2002 (Vander Ploeg 2004).
In A Capital Question, it was reported that Calgary has a backlog
of some $1.1 billion in high priority infrastructure needs over the
next five years and Edmonton is short $3.2 billion over the next
ten years. In 2003 alone, $564 million in needed capital
investments in the West’s six big cities did not proceed because
of a lack of funding (Vander Ploeg 2003). Our cities are not really
“staying afloat” at all, and the cracks are beginning to show.
In many ways a singular over-reliance on the property tax has led
to some of the fiscal stresses facing western Canada’s cities. On
the one hand, some of this is wound up in a lack of political will to
employ the property tax sufficiently – pursuing small, incremental,
but regular increases that generate adequate revenue growth and
that capture the wealth being generated in the local economy. On
the other hand, some of this is simply wound up in the economic
nature of the property tax itself.
Logically, a low property tax burden that is declining relative to
historical levels implies that there is more room today for cities to
employ the tax as one means of addressing any under-funding
of municipal services as well as coming to grips with sizeable
infrastructure deficits. And, it appears that many western
Canadians also understand this. In 2004, as part of its Looking
West Survey, Canada West Foundation asked 3,200 western
Canadians if, given the choice, they would rather see local
services cut or property taxes raised (Berdahl 2004). Almost 60%
of westerners favoured raising property taxes. Tax-wary Albertans
registered the highest number of respondents favouring this option
(60.8%). Only 30% of respondents favoured cutting services.
Is all of this a blank cheque for cities to hike property taxes? That
misses the point. Single-mindedly raising property taxes can
produce two negative side effects. First, there are those with fixed
or low incomes whose property taxes do present a considerable
burden. At low-income levels, the property tax can be quite
regressive. Second, there is considerable debate about inequities
in the property tax system – multi-family housing is taxed heavier
than single-family housing and business properties are taxed
heavier than all types of residential properties. Properties that are
“close-in” typically carry higher assessments and thus pay more
tax compared to properties on the periphery. The residential
property tax does not capture any revenue from outsiders who
use a city’s services and infrastructure, leaving local taxpayers to
pick up the tab. None of these inequities relate to the costs of
servicing properties. Rather, they lead to cross-subsidization and
ever increasing demands for services and infrastructure. These
inequities are not solved if property taxes are increased willy-nilly.
Western cities have not been retaining a fair share of local
economic growth occurring within their borders, and going after
that growth with the property tax can carry some bad side-effects.
All of this is a compelling argument for employing a broader range
of tax tools rather than relying on the property tax alone. When a
city has some decent tax diversity at its disposal, the advantages of
the property tax can be retained, while its disadvantages can be
offset by different taxes. In many ways, it is unreasonable to expect
one tax alone to carry the burden of financing a large modern city.
In the final analysis, current and future debates over property
taxes in our cities need to reflect an axiom that applies to most
of life – everything in moderation. Property taxes should not be
too high, nor should they be too low. What is required is a
healthy balance – a balance that would be easier to achieve if the
property tax itself were balanced by other tax tools. �

STRAIGHT TALK: Property Taxes in Western Canada’s Big Six
35
A. National Income and Expenditure Accounts (NIEA) Data
These data were secured from Statistics Canada’ssystem of National Accounts. The data represent threedistinct reporting periods (1961-1980, 1981-1991, and1992-2000). Slight differences in methodology occuracross the three periods. However, the differences aresmall. In this analysis, a small group of “other” federaland provincial direct taxes were combined with “other”indirect taxes. The combined amount was consideredas indirect taxation. Direct taxes include only personalincome tax, dedicated social taxes, and corporateincome tax.
B. City-Specific Datasets
All data were derived by Canada West Foundation fromStatistics Canada, various budgets and annual reportsof the cities, the provinces, and the federal government,and the Dominion Bond Rating Service (DBRS). Thecity-specific datasets are broken into four separatecolumns. Each column contains three distinctpresentations of data.
Column 1: General Data, Tax Burden, and City Tax Profiles:The tax burden for each city was estimated from PublicAccounts data (e.g., budgets, annual reports, andDominion Bond Rating Service reports). The allocation offederal and provincial tax was estimated. All federaltaxes were distributed first to the province. This was doneby applying to the public accounts data the provincialshare of these taxes in the NIEA system. To allocate thisprovincial share to the cities, the ratio of personal incometax collected in the city as compared to the province as awhole (secured from Revenue Canada’s Income TaxStatistics) was applied to all the various taxes. Sincepersonal income taxes are the single largest share oftaxes in Canada, applying this ratio to all the other taxesprovides a reasonable proxy for the province’s share offederal taxes that come from the cities. The provincialtaxes were allocated in the same fashion. This approachis conservative, and may actually understate the federaland provincial taxes actually collected in the cities. Themunicipal tax total is the sum of all taxes (property basedtaxes and non-property based taxes) collected by the Cityas reported in their 2003 Annual Report. The taxesshown are as defined by the City themselves with only afew exceptions. Franchise fees were added toEdmonton’s tax total and utility contributions and thebusiness improvement tax were added to Saskatoon’stotal. School taxes in Regina were secured from the twoschool districts. The City of Regina’s reported municipaltax totals are net of allowances for tax appeals while theeducation portion is not. Using the City’s amount wouldincrease the education property tax relative to themunicipal property tax. All amounts include revenue-in-lieu. Education property taxes reported by the provinceswere ignored in this data column. Rather, the actualeducation taxes levied in the cities form part of theprovincial total. CPP premiums, which do not form partof the budget of the federal government under the PublicAccounts, were derived from the DBRS and includeemployer and employee contributions.
Column 2: Municipal Property Tax Compared to PersonalIncome Taxes and Education Property Taxes, and Real PerCapita Growth Rates: The municipal property taxesunder consideration in this column are the generalresidential and commercial property tax, any separatelevies for public libraries, the business tax, localimprovements, and other property related taxes.Education taxes, franchise fees, utility taxes, amusementtaxes, hotel taxes, and revenue-in-lieu are excluded.(Vancouver’s total does, however, include revenue-in-lieu.) Taxes paid by EPCOR to Edmonton were removedto ensure data consistency over time. ENMAX taxes toCalgary are presented as revenue-in-lieu, which wasalso removed for Calgary. In Saskatoon and Regina,several adjustments were made to historical data toensure consistent treatment of licences, tax discounts,and various smaller taxes. The changes do notdrastically alter the property taxes collected. Years priorto the amalgamation in Winnipeg presented asignificant challenge. Total municipal property taxcollections and education taxes prior to 1972 wereadjusted upwards. The pre-amalgamation population ofthe incorporated City of Winnipeg relative to the CMA(which essentially became the amalgamated entity) wasused to factor the data upwards. This factor meantincreasing the taxes collected anywhere from 46%-55%for various years between 1960-1971. The approachassumes that property tax collections in Winnipeg wouldhave increased proportionately to the size of the city if ithad actually been amalgamated at the time. Personalincome taxes are the total federal and provincialamount. Due to a lack of data, amounts for 1997 wereinterpolated based on a consistent rate of growthbetween 1996 and 1998. For 2002 and 2003, personalincome taxes payable were also estimated based on aconsistent rate of growth over the last few years. Whilethe municipal property tax excludes revenue-in-lieu oftax, it is included in the education portion for all citiesexcept Winnipeg. Removing this amount fromeducation property taxes was not always possible. Thisdoes not drastically affect the comparison of municipalproperty tax growth to education property tax growth asannual collections of each are consistent over time.Real per capita growth figures (both here and acrossthe entire report) were calculated using populationestimates of Statistics Canada and those found invarious annual reports. The CPI for each city, province,and the country as a whole was used to adjust the percapita amounts for inflation. The federal data for thereal per capita growth rates is not the same data usedin column one. A different set of federal tax data wasemployed to ensure consistency over time.
Column 3: Municipal Property Tax and Assessments, RealPer Capita Municipal Property Taxes Collected, andMunicipal Property Tax as a Percentage of PersonalDisposable Incomes: The same basket of municipalproperty taxes in Column 2 were used for all data chartsin Column 3. Adjustments to the accumulatedpercentage increase in assessments were made for allcities as the total assessed value of property canincrease dramatically when reassessments occur. Inyears where a reassessment occurred, the percentageincrease was ignored. A variable was inserted into the
data to bridge the gap between the growth rates of thetwo years surrounding the reassessment. The result is aset of smoother data. In Winnipeg, the pre-1972assessments were increased (using the same approachas outlined under Column 1) to control for theamalgamation. Real per capita municipal property taxeswere calculated using Statistics Canada’s CPI andpopulation estimates as found in the annual reports andprovided by Statistics Canada. Personal disposableincomes in the cities are the total declared incomesreported on tax forms submitted to Revenue Canada lessfederal and provincial personal income taxes paid.Dedicated social taxes could not be removed frompersonal incomes for the cities. Personal disposableincomes for 2002 and 2003 were estimated based on thehistorical relationship of the Revenue Canada incomedata to the Provincial Labour Income data in the NIEA.Using average relationships in the past few years, acomparable provincial income amount for 2002 and 2003was established, and the average city income as apercent of the provincial total for the last few yearsresulted in an estimate of each cities’ personaldisposable income for 2002 and 2003.
Column 4: Role of the Property Tax: Data for this sectioncame from a number of sources and different years foreach city. For each city, the focus was the operatingbudget only. Utility revenues and expenditures werenetted to produce a surplus that could be available forfunding other general expenditures or capital. InVancouver, data came from the details of the GeneralRevenue Fund in the 2003 Annual Report. Not all servicerevenue could be identified for Vancouver, whichincreased the degree of general funding. Data forEdmonton and Calgary were collected from the 2004Operating Budget of the two cities, which clearlyoutlined service revenues attached to specific functions,the property tax levy, and other general revenues. Datafor Regina are 2002 actual operating results provided bythe City to the Canada West Foundation. Data forSaskatoon reflect the 2003 operating budget of the city.Like Vancouver, Saskatoon’s service revenue issomewhat understated. This increases the generalfunding component. Winnipeg’s data were provided bythe City of Winnipeg. The inclusion of services in theirrespective categories was relatively straightforward forpolicing, fire and EMS, transit, roads, transfers to capitaland reserves, and waste and recycling. However, thegeneral government category and parks, recreation,culture, and community (PRCC) serve as “catch-all”categories that can vary widely between cities. As such,those two categories should be viewed in combinationwhen comparing between cities. Further, Calgary is theonly city that clearly separates interest on debt as aseparate expense, while other cities attach it to specificexpenditures. Thus, Calgary’s numbers are different. Indeveloping the share of property taxes going to funddifferent services, it was assumed at the outset that theproperty tax and all other general revenues weredistributed equally across all functions requiring generalfunding. In other words, we assume that it is not thecase that the property tax alone would fund 100% ofpolicing needs while other general revenues would fund100% of the waste and recycling needs.
WORKS CITED
Berdahl, Loleen. 2004. Western Directions: An Analysis of the Looking West 2004 Survey. Canada West Foundation. Calgary, AB. City of Edmonton. 2000. Annual Report. Edmonton, AB. City of Regina. 2001. Brief on Provincial Issues From Regina City Council to Members of the Legislative Assembly. Regina, SK. Clemens, Jason, Emes, Joel, and Scott, Rodger. 2002. The Corporate Capital Tax: Canada’s Most Damaging Tax in Public Policy Sources. Fraser Institute. Vancouver, BC. Kitchen, Harry. 2000. Municipal Finance in a New Fiscal Environment (CD Howe Institute Commentary No. 147). CD Howe Institute. Toronto, ON. Kitchen, Harry and Slack, Enid. 1993. Business Property Taxation (Discussion Paper 93-24). School of Policy Studies, Queen’s University. Kingston, ON. Loreto, Richard A. and Price, Trevor (eds). 1990. Urban Policy Issues: Canadian Perspectives. McClelland and Stewart Inc. Toronto, ON. McCready, Douglas J. 1984. The Canadian Public Sector. Butterworth and Company. Toronto, ON. UNSM (Union of Nova Scotia Municipalities). 2001. Municipal-Provincial Roles and Responsibilities Review: A Literature Review. (see www.unsm.ca). Halifax, NS. Vander Ploeg, Casey. 2003. A Capital Question: Infrastructure in Western Canada’s Big Six. Canada West Foundation. Calgary, AB. Vander Ploeg, Casey. 2004. Big Spenders: An Expenditure Profile of Western Canada’s Big Six. Canada West Foundation. Calgary, AB.
APPENDIX 1: The Datasets

F O U N D A T I O N
WestCanada
C HAN G E TH E WO R LD2004 has the potential to be a year of great change in Canada: there has been a federal
election, the future of our cities is a hot topic, Canada-US relations are evolving, and the nature
of our democracy is being debated.
As Canadians talk aboutthese issues, it is criticalthat the aspirations,perspectives, and ideasof western Canadiansare heard.
Through its Western Cities,Building the New West and Westin Canada Projects, theCANADA WEST FOUNDATIONis actively working to generateideas for positive change and tomake sure that the views ofwestern Canadians are anintegral part of the nationaldebates during this time ofchange.
Without ideas – and an organized effort to get them heard – changewill not happen. This is what the Canada West Foundation does. But,we can't do it without your support. If you want to help ensure thatwestern Canadian ideas are front and centre on the national stage, weinvite you to become a FRIEND of the Canada West Foundation bymaking a donation. Please contact our Director of Finance andAdministration Lori Zaremba (403.264.9535 ext. 347 or toll free1.888.825.5293 or [email protected]) for more information.
H O W C A N Y O U H E L P ?
900, 1202 Centre St reet SouthCalgary, A lber ta , CANADA • T2G 5A5
Ph: 403.264.9535 • To l l Free: 1 .888.825.5293Fax: 403.269.4776 • Emai l : [email protected]
I D E A S

F O U N D A T I O N
WestCanadaSuite 900, 1202 Centre Street SouthCalgary, Alberta, Canada T2G 5A5
Telephone: 403.264.9535
www.cwf.ca