storage requirements for pv power ramp rate control
TRANSCRIPT

Available online at www.sciencedirect.com
www.elsevier.com/locate/solener
ScienceDirect
Solar Energy 99 (2014) 28–35
Storage requirements for PV power ramp-rate control
J. Marcos a,⇑, O. Storkel b, L. Marroyo a, M. Garcia a, E. Lorenzo b
a Dpto. Ingenierıa Electrica y Electronica, Universidad Publica de Navarra, Campus Arrosadia, 31006 Pamplona, Spainb Instituto de Energıa Solar, EUIT Telecomunicacion, Campus Sur UPM, 28031 Madrid, Spain
Received 30 August 2013; received in revised form 24 October 2013; accepted 28 October 2013
Communicated by: Associate Editor Elias Stefanakos
Abstract
Short-term variability in the power generated by large grid-connected photovoltaic (PV) plants can negatively affect power quality andthe network reliability. New grid-codes require combining the PV generator with some form of energy storage technology in order toreduce short-term PV power fluctuation. This paper proposes an effective method in order to calculate, for any PV plant size and max-imum allowable ramp-rate, the maximum power and the minimum energy storage requirements alike. The general validity of this methodis corroborated with extensive simulation exercises performed with real 5-s one year data of 500 kW inverters at the 38.5 MW Amaraleja(Portugal) PV plant and two other PV plants located in Navarra (Spain), at a distance of more than 660 km from Amaraleja.� 2013 Elsevier Ltd. All rights reserved.
Keywords: Grid-connected PV plants; Power fluctuations smoothing; Ramp-rate control; Energy storage sizing
1. Introduction
Concerns about the potential of PV output fluctuationscaused by transient clouds were expressed more than25 years ago (Jewell and Ramakumar, 1987; Jewell andUnruh, 1990) and are now attracting widespread interestand attention, as a result of growing PV penetration rates.As the PV power share in the grid increases, such fluctua-tions may adversely affect power quality and reliability(Marcos et al., 2011a). In particular, power fluctuationsof less than 10 min are typically absorbed by the grid asfrequency fluctuations. This issue is of special importancein relatively small grids, such as islands, with high penetra-tion rates, because the smoothing effect from the aggrega-tion of geographically dispersed PV plants is intrinsically
0038-092X/$ - see front matter � 2013 Elsevier Ltd. All rights reserved.
http://dx.doi.org/10.1016/j.solener.2013.10.037
⇑ Corresponding author. Address: Edificio Los Pinos, Dpto. IngenierıaElectrica y Electronica, Universidad Publica de Navarra, CampusArrosadia, 31006 Pamplona, Spain. Tel.: +34 948 169 277; fax: +34 948169 884.
E-mail address: [email protected] (J. Marcos).
limited (Marcos et al., 2011b; Perpinan et al., 2013). Itwas precisely an island grid operator, The Puerto RicoElectric Power Authority, that recently opened the doorfor PV power variability regulations, by imposing a 10%per minute rate (based on nameplate capacity) limitationon the PV plants being connected to its grid (PREPA,2012).
Standard (without storage) PV plants exhibit powervariations far beyond this limitation. For example, up to90% and 70% per minute variations have been recorded,respectively, at 1 MW and 10 MW PV plants (Marcoset al., 2010). Hence, compliance with such regulationsrequires combining the PV generator with some form ofenergy storage technology, to either add or subtract powerto or from the PV output in order to smooth out the highfrequency components of the PV power. Fuel cells(Rahman and Tam, 1988), electric-double layer capacitors(Kakimoto et al., 2009) and, mainly, batteries (Hund et al.,2010; Byrne et al., 2012; Ellis et al., 2012; Leitermann,2012; Xiangjun et al., 2013) have been proposed. Smooth-ing algorithms can be found (Kakimoto et al., 2009; Hund
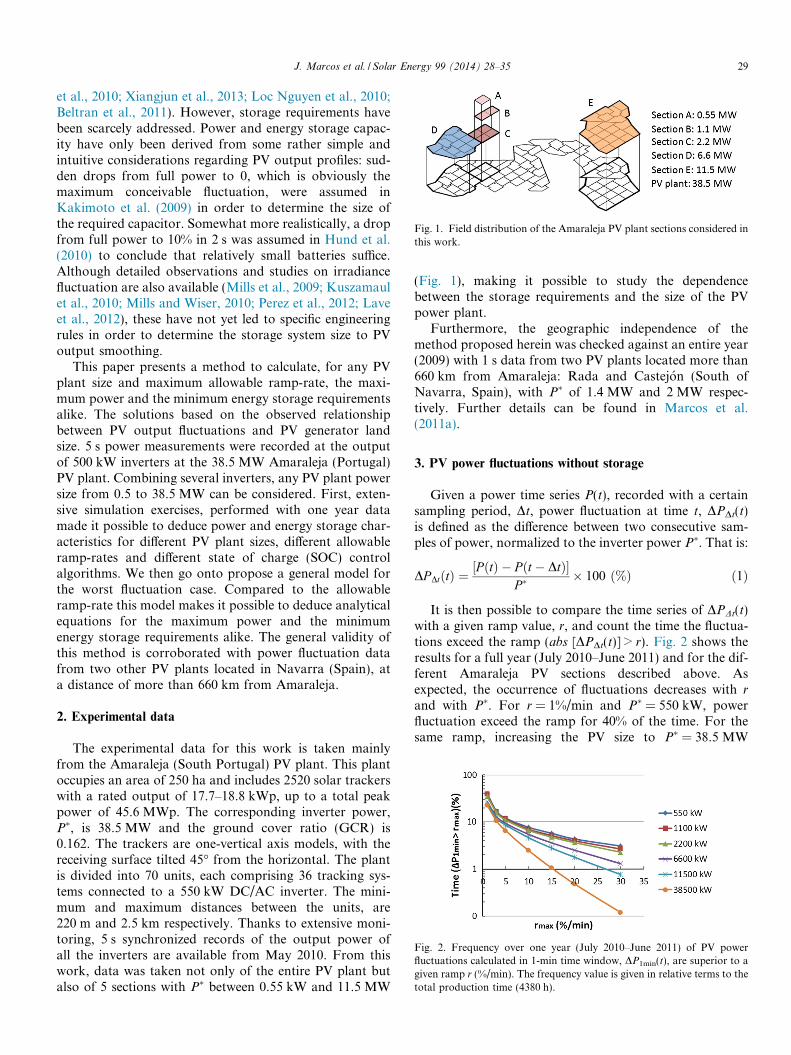
Fig. 1. Field distribution of the Amaraleja PV plant sections considered inthis work.
Fig. 2. Frequency over one year (July 2010–June 2011) of PV powerfluctuations calculated in 1-min time window, DP1min(t), are superior to agiven ramp r (%/min). The frequency value is given in relative terms to thetotal production time (4380 h).
J. Marcos et al. / Solar Energy 99 (2014) 28–35 29
et al., 2010; Xiangjun et al., 2013; Loc Nguyen et al., 2010;Beltran et al., 2011). However, storage requirements havebeen scarcely addressed. Power and energy storage capac-ity have only been derived from some rather simple andintuitive considerations regarding PV output profiles: sud-den drops from full power to 0, which is obviously themaximum conceivable fluctuation, were assumed inKakimoto et al. (2009) in order to determine the size ofthe required capacitor. Somewhat more realistically, a dropfrom full power to 10% in 2 s was assumed in Hund et al.(2010) to conclude that relatively small batteries suffice.Although detailed observations and studies on irradiancefluctuation are also available (Mills et al., 2009; Kuszamaulet al., 2010; Mills and Wiser, 2010; Perez et al., 2012; Laveet al., 2012), these have not yet led to specific engineeringrules in order to determine the storage system size to PVoutput smoothing.
This paper presents a method to calculate, for any PVplant size and maximum allowable ramp-rate, the maxi-mum power and the minimum energy storage requirementsalike. The solutions based on the observed relationshipbetween PV output fluctuations and PV generator landsize. 5 s power measurements were recorded at the outputof 500 kW inverters at the 38.5 MW Amaraleja (Portugal)PV plant. Combining several inverters, any PV plant powersize from 0.5 to 38.5 MW can be considered. First, exten-sive simulation exercises, performed with one year datamade it possible to deduce power and energy storage char-acteristics for different PV plant sizes, different allowableramp-rates and different state of charge (SOC) controlalgorithms. We then go onto propose a general model forthe worst fluctuation case. Compared to the allowableramp-rate this model makes it possible to deduce analyticalequations for the maximum power and the minimumenergy storage requirements alike. The general validity ofthis method is corroborated with power fluctuation datafrom two other PV plants located in Navarra (Spain), ata distance of more than 660 km from Amaraleja.
2. Experimental data
The experimental data for this work is taken mainlyfrom the Amaraleja (South Portugal) PV plant. This plantoccupies an area of 250 ha and includes 2520 solar trackerswith a rated output of 17.7–18.8 kWp, up to a total peakpower of 45.6 MWp. The corresponding inverter power,P�, is 38.5 MW and the ground cover ratio (GCR) is0.162. The trackers are one-vertical axis models, with thereceiving surface tilted 45� from the horizontal. The plantis divided into 70 units, each comprising 36 tracking sys-tems connected to a 550 kW DC/AC inverter. The mini-mum and maximum distances between the units, are220 m and 2.5 km respectively. Thanks to extensive moni-toring, 5 s synchronized records of the output power ofall the inverters are available from May 2010. From thiswork, data was taken not only of the entire PV plant butalso of 5 sections with P� between 0.55 kW and 11.5 MW
(Fig. 1), making it possible to study the dependencebetween the storage requirements and the size of the PVpower plant.
Furthermore, the geographic independence of themethod proposed herein was checked against an entire year(2009) with 1 s data from two PV plants located more than660 km from Amaraleja: Rada and Castejon (South ofNavarra, Spain), with P� of 1.4 MW and 2 MW respec-tively. Further details can be found in Marcos et al.(2011a).
3. PV power fluctuations without storage
Given a power time series P(t), recorded with a certainsampling period, Dt, power fluctuation at time t, DPDt(t)is defined as the difference between two consecutive sam-ples of power, normalized to the inverter power P�. That is:
DPDtðtÞ ¼½P ðtÞ � Pðt � DtÞ�
P �� 100 ð%Þ ð1Þ
It is then possible to compare the time series of DPDt(t)with a given ramp value, r, and count the time the fluctua-tions exceed the ramp (abs [DPDt(t)] > r). Fig. 2 shows theresults for a full year (July 2010–June 2011) and for the dif-ferent Amaraleja PV sections described above. Asexpected, the occurrence of fluctuations decreases with r
and with P�. For r = 1%/min and P� = 550 kW, powerfluctuation exceed the ramp for 40% of the time. For thesame ramp, increasing the PV size to P� = 38.5 MW
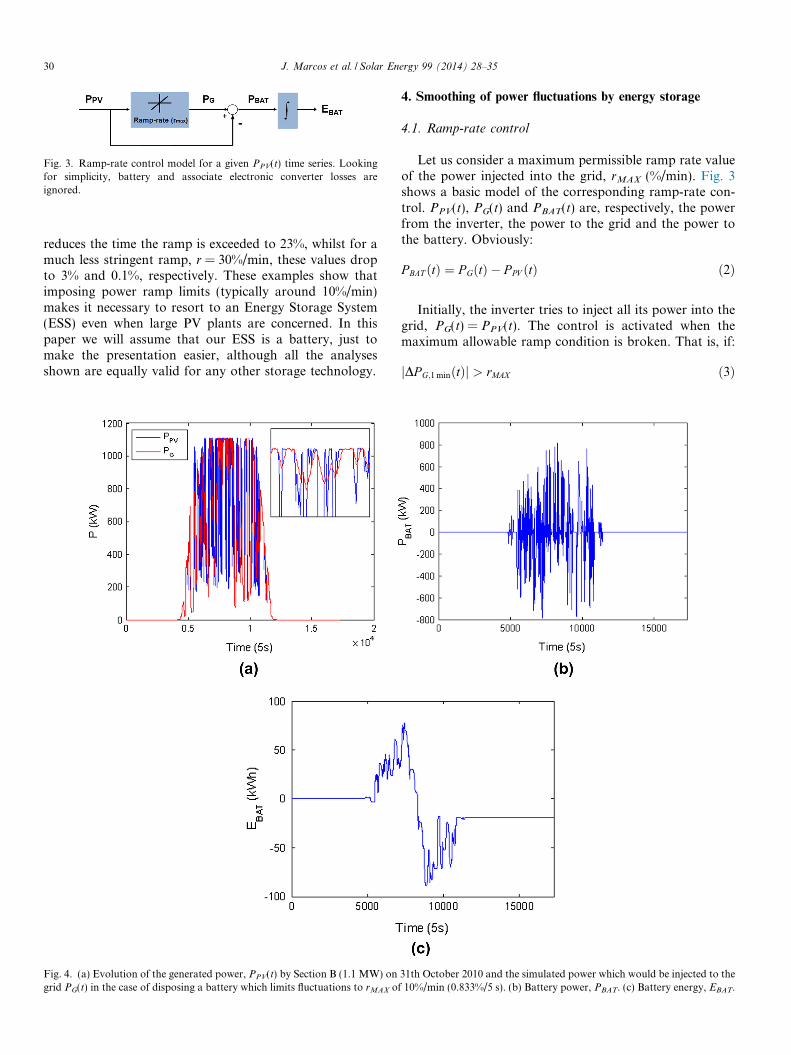
Fig. 3. Ramp-rate control model for a given PPV(t) time series. Lookingfor simplicity, battery and associate electronic converter losses areignored.
30 J. Marcos et al. / Solar Energy 99 (2014) 28–35
reduces the time the ramp is exceeded to 23%, whilst for amuch less stringent ramp, r = 30%/min, these values dropto 3% and 0.1%, respectively. These examples show thatimposing power ramp limits (typically around 10%/min)makes it necessary to resort to an Energy Storage System(ESS) even when large PV plants are concerned. In thispaper we will assume that our ESS is a battery, just tomake the presentation easier, although all the analysesshown are equally valid for any other storage technology.
Fig. 4. (a) Evolution of the generated power, PPV(t) by Section B (1.1 MW) ongrid PG(t) in the case of disposing a battery which limits fluctuations to rMAX o
4. Smoothing of power fluctuations by energy storage
4.1. Ramp-rate control
Let us consider a maximum permissible ramp rate valueof the power injected into the grid, rMAX (%/min). Fig. 3shows a basic model of the corresponding ramp-rate con-trol. PPV(t), PG(t) and PBAT(t) are, respectively, the powerfrom the inverter, the power to the grid and the power tothe battery. Obviously:
P BAT ðtÞ ¼ P GðtÞ � P PV ðtÞ ð2Þ
Initially, the inverter tries to inject all its power into thegrid, PG(t) = PPV(t). The control is activated when themaximum allowable ramp condition is broken. That is, if:
jDP G;1 minðtÞj > rMAX ð3Þ
31th October 2010 and the simulated power which would be injected to thef 10%/min (0.833%/5 s). (b) Battery power, PBAT. (c) Battery energy, EBAT.

J. Marcos et al. / Solar Energy 99 (2014) 28–35 31
Then, the corresponding power excess or shortage iseither taken from (PBAT(t) > 0) or stored into (PBAT(t)< 0)the battery. The energy stored at the battery, EBAT(t), isgiven by the integral of PBAT(t) over time. In this way,the behavior of the whole system can be easily simulatedfor any time series of PPV(t). For the sake of simplicity,any potential battery and associated electronic converterlosses are disregarded here.
As a representative example, Fig. 4 shows, forrMAX = 10%/min, the 1.1 MW Amaraleja PV section onan extremely fluctuating day (31th October, 2010), theresulting evolution of PPV(t) and PG(t) (Fig. 4a), PBAT(t)(Fig. 4b) and EBAT(t) (Fig. 4c). Battery requirements forthis day derive from the corresponding maximum powerand energy values. In this example, the required batterypower is PBAT,MAX = 873 kW (or PBAT,MAX = 0.79P�)and the required battery capacity is CBAT = EBAT,MAX -� EBAT,MIN = 175 kW h (or 10 min of capacity, equivalentto 0.16 h of PV plant production at P�). It is worth men-tioning that the daily battery energy balance is negative(�20 kW h). At first glance, this may appear counter-intu-itive, because the PV power fluctuation distribution isessentially symmetrical (clouds reaching and leaving thePV field). However, this can be understood by carefullyobserving the battery charge and discharge dynamic. Notethat the area of upper regions (charging) is larger than thearea of lower ones (discharging).
Fig. 5 shows the result of extending the simulation exer-cise to an entire year (July 2010–June 2011), to all theAmaraleja PV sections, and for rMAX = 10%/min. TheState of Charge (SOC) of the battery at the end of a dayhas been concatenated with the SOC at the beginning ofthe next day. As the example shown in Fig. 4, the tendencyof the battery to discharge continuously affects the entireone year period. An important initial conclusion can bedrawn: instead of distributing the storage systems for singlepower plants or sections within a power plant, it seemswiser to add multiple sections or power plants to a singlestorage system. On the other hand, the battery dischargingtendency leads to excessive battery capacity requirements,in the order of some hours. More practical alternativesare obtained when adding charge to the battery at different
Fig. 5. Evolution of storage time, EBAT/P� (h), in the battery during oneyear (July 2010–June 2011), limiting the ramps to a maximum of 10%/minin different PV systems.
times throughout the year, as will be seen below. Neverthe-less, an important conclusion can be reached from Fig. 5:the energy that must be managed through the storage sys-tems is very low, only about 0.3% of the total energy pro-duction for limiting the power ramps of a 0.5 MW plant ata maximum of 10%/min (for this case, as Fig. 2 showed, thebattery time of use is equal to 8%). Thus, efficiency relatedaspects are scarcely relevant.
4.2. Overnight battery recharging
Overnight battery recharging from the grid makes sensebecause electricity demand usually drops at night. Fig. 6presents the results of a simulation exercise similar toFig. 5, except that this time, if required, energy at the bat-tery is restored each night. That is:
EBAT ;end dayi�1< 0) EBAT ;beginning dayi
¼ 0 ð4Þ
In this way the tendency of the battery to discharge con-tinuously does not affect the entire period of one year, butis limited to one day and therefore significantly reduces therequired battery size, which is now in the order of someminutes. For example, battery requirements forrMAX = 10%/min in the 1.1 MW Amaraleja PV sectionare now PBAT,MAX = 890 kW (or PBAT,MAX = 0.81�P�)and EBAT,MAX = 451 kW h (or 25 min of capacity, equiva-lent to 0.41 h of PV plant production at P�). The compar-ison of these figures with the above mentioned results for31th October 2010, reveals that power battery require-ments, which are obviously imposed by the worst individ-ual fluctuation, tend to be constant throughout theanalysis period. However, the same is not true for the bat-tery energy requirements, which are imposed by the fluctu-ation distribution throughout the worst day.
4.3. Daytime battery recharging controlled by state of charge
Another interesting battery recharging possibility, notrequiring energy to be supplied from the grid, consists inestablishing a reference value for the energy stored in the
Fig. 6. Evolution of storage time, EBAT/P� (h), in the battery during oneyear (July 2010–June 2011), limiting the ramps to a maximum of 10%/minin different PV systems with overnight recharge.

Fig. 7. Ramp-rate control model modified with additional SOC control.Notice that the SOC control action is also smoothed by the ramp-limiterin order to guarantee that power fluctuations are always below rMAX.
Fig. 9. Worst fluctuation model. The blue line represents the PPV(t)response to an irradiance fluctuation (yellow line) and the red one is thepower injected to the grid PG with a ramp-rate control. The differencebetween PG and PPV is PBAT, the maximum difference corresponds toPBAT,MAX and the defined integral of PBAT corresponds to EBAT,MAX. (Forinterpretation of the references to color in this figure legend, the reader isreferred to the web version of this article.)
32 J. Marcos et al. / Solar Energy 99 (2014) 28–35
battery, EBAT,REF and in implementing a control loop thatcontinuously tries to return EBAT(t) to this reference, pro-viding the ramp-rate limit is observed and energy is nevertaken from the grid (nighttime charging forbidden). Fig. 7presents the corresponding model. The control will be fasteror slower depending on the value of K. For example, a valueof K = 1 means that if EBAT(t) � EBAT,REF = 1 kW h thecontrol would request 1 kW from the battery. Obviously,once the battery capacity is defined, EBAT control is equiva-lent to SOC control.
In this way the battery tendency to continuously dis-charge has no effect on the entire one year period or onthe entire one day period, but only on the short period thecontrol requires to restore EBAT,REF. This therefore furtherreduces the required battery size. Fig. 8 shows the resultsof a simulation exercise again for the 1.1 MW AmaralejaPV section and for a one year period (July 2010–June2011). EBAT,REF and K have been arbitrarily set to175 kW h and 6, respectively. The latter allows for a goodcompromise between system stability and fast batteryrecharging. Now, corresponding battery requirements arePBAT,MAX = 890 kW (or PBAT,MAX = 0.81�P�) andCBAT = EBAT,MAX � EBAT,MIN = 124 kW h (or 6.7 min ofcapacity, equivalent to 0.11 h of PV plant production atP�). Thus, the required battery capacity is significantly lowerthan that corresponding to nighttime recharging. In fact,this K value is large enough to almost restore EBAT,REF justafter each fluctuation. Thus the impacts of successive fluctu-ations become independent of each other and battery
Fig. 8. Evolution along July 2010–June 2011 of EBAT (a) and PBAT (b) for sectiohave been arbitrarily set to 175 kW h and 6, respectively.
requirements become essentially linked to the “worst fluctu-ation”, i.e. the individual fluctuation requiring the highestenergy demand.
5. The worst fluctuation model
Careful study of real worst fluctuations observed atAmaraleja lead us to postulate that the worst fluctuationis properly described (Fig. 9) by a power exponential decayfrom P� to 0.1P� (or an exponential rise from 0.1P� to P�)with a time constant, s (s), which is empirically correlated(Fig. 10) with the shortest dimension of the perimeter ofthe PV plant, l (m), by an expression such as:
s ¼ a � lþ b ð5Þwhere a = 0.042 (s/m) and b = �0.5 s. Table 1 presents thereal s values observed at the different PV Amaraleja sec-tions and Fig. 10 shows that they are in good agreementwith Eq. (5).
n B (1.1 MW), a rMAX of 10%/min and with SOC control. EBAT,REF and K

Fig. 10. Adjustment of observed time constant values s vs. shortestperimeter dimension l, Eq. (5). The general expression of this equation isy = mx + n, where m gives the coherency to the units. In our case,m = 0.042 (s/m).
Table 1Characteristic power P�, shortest perimeter dimension l and time constants of the observed worst fluctuation at the different Amaraleja PV sections.
Power, P� (MW) Short dimension, l (m) Tau, s (s)
0.55 158 81.1 158 92.2 318 116.6 626 25
11.5 896 3238.5 1786 77
J. Marcos et al. / Solar Energy 99 (2014) 28–35 33
Battery requirements for ramp-rate limitation are easilyderived from the model showed in Fig. 9. We can see theresponse of PPV(t) and PG(t) to a negative irradiance G(t)fluctuation. PPV(t) evolution corresponds to a first ordersystem with a time constant s, while PG decreases with a
Fig. 11. Storage requirements for ramp-rate control: (a) battery power PBAT,MA
Results derived from the worst fluctuation model show good agreement with thdifferent Amaraleja PV sections.
rhythm being set by rMAX. The power demanded to the bat-tery PBAT(t) corresponds with the difference between PG(t)and PPV(t), Eq. (2). Therefore, PBAT(t) along the worstfluctuation time is given by:
P BAT ðtÞ ¼P �
100½90ð1� expð�t=sÞÞ � t � rMAX � ð6Þ
where rMAX is expressed as % per time. This expression getsa maximum for
tP BAT ;MAX ¼ s � ln 90
s � rMAXð7Þ
Thus, the required battery power is given by:
P BAT ;MAX ðtÞ ¼P �
10090� s � rMAX 1þ ln
90
s � rMAX
� �� �ð8Þ
where P�, PBAT,MAX is expressed in (kW), rMAX in (%/s)and s in (s). On the other hand, the battery dischargingprocess lasts until the time the power ramp reaches 0.1P�.Corresponding time span, TR, is:
T R ¼90
rMAXð9Þ
Thus, the required battery energy is given by:
EBAT ;MAX ¼Z T R
0
P BAT ðtÞdt
¼ 0:9P �
3600
90
2 � rMAX� s � 1� exp � 90
s � rMAX
� �� �� �
� 0:9P �
3600
90
2 � rMAX� s
� �
ð10Þwhere P� is expressed in (kW), rMAX in (%/s), s in (s) andEBAT,MAX in (kW h). As the sign of the first fluctuation isunknown, a double capacity battery is required to absorbboth the upwards and downwards fluctuation:
X, normalized to inverter power P� and (b) storage time CBAT/P�, in hours.e ones derived from detailed simulation based on 5 s real data recorded at

Fig. 12. Worst fluctuation model validation compared to data from two other PV plants, at a distance of 660 km from Amaraleja PV plant: (a) batterypower PBAT,MAX in MW and (b) battery capacity CBAT, in MW h.
34 J. Marcos et al. / Solar Energy 99 (2014) 28–35
CBAT ¼ 2 � EBAT ;MAX ¼1:8P �
3600
90
2 � rMAX� s
� �ð11Þ
For example, for P� = 1.1 MW and l = 158 m, Eq. (5) leadsto s = 6.14 s, and battery requirements for limiting theramp-rate to rMAX = 10%/min are, from Eq. (8),PBAT,MAX = 0.84�P� = 928 kW and, from Eq. (11),CBAT = P��0.132 h = 145 kW h. For P� = 38.5 MW andl = 1786 m, corresponding results are s = 74.51s,PBAT,MAX = 0.53P� = 20.4 MW and CBAT = P��0.098 h =3773 kW h.
Fig. 11 compares the battery requirements for the differ-ent PV Amaraleja sections and for different ramp-ratelimits, as deduced from simulation based on a year ofobserved 5 s data and as given by Eqs. (8) and (11). Goodagreement is clearly observed. Furthermore, in order tocheck the general validity of the worst fluctuation model,we performed a similar exercise for two different PV plantslocated at a distance of about 660 km from Amaraleja, atRada (P� = 1.4 MW; l = 260 m; s = 10 s) and Castejon(P� = 2 MW; l = 310 m; s = 12 s), both in the South ofNavarra (Spain). Fig. 12 presents the corresponding resultswhich, again, show very good agreement between modelledand simulation-derived data.
6. Conclusions and outlook
This paper has dealt with storage requirements forsmoothing short term PV power fluctuations, studying therelationship between PV plant size and ramp-rate limits,and the required power and capacity of the battery. We pro-pose an effective method in order to calculate, for any PVplant size and maximum allowable ramp-rate, the maximumpower and the minimum energy storage requirements alike.
Extensive simulations based on observed 5 s power mea-surements recorded at different peak power PV sections,ranging from 0.5 MW to 38.5 MW, at the Amaraleja PVplant were performed, considering three battery rechargingpossibilities: at the end of the year, each night and
continuous SOC controlled recharging throughout theday. Relevant conclusions are that the energy managedthrough the storage system is in practice very low, and thatPV peak power aggregation reduces battery power andcapacity requirements alike.
When SOC controlled battery recharging is applied,which probably represents the most practical alternative,battery requirements are essentially imposed by the “worstfluctuation”. An analytical theoretical model for this fluctu-ation case has been proposed and validated, by comparingthe corresponding battery requirements with the onesderived from detailed simulations based on real power data.
Ramp-rate control is not the only method for smoothingfluctuations; therefore, there is a need to study new wayswith smarter SOC controls that may result in a better useof the ESS. Finally, the results presented in this paper indi-cate that the time during which fluctuations exceed themaximum allowable ramp is very short. Consequently, itwould be necessary to analyze possible auxiliary functionsto be performed by the ESS (such as frequency regulationor time shifting) to maximize its value.
Acknowledgments
The authors would like to thank ACCIONA for autho-rizing measurements at its PV plants and for their staffhelpful collaboration. This work has been financed by theSeventh Framework Programme of the European Commis-sion with the project PVCROPS (Photovoltaic CostR€duction, Reliability, Operational Performance, Predic-tion and Simulation – Grant Agreement No: 308468).
References
Beltran, H., Swierczynski, M., Luna, A., Vazquez, G., Belenguer, E., 2011.Photovoltaic plants generation improvement using Li-ion batteries asenergy buffer. In: 2011 IEEE International Symposium on IndustrialElectronics (ISIE), 27–30 June 2011, pp. 2063–2069. doi: http://dx.doi.org/10.1109/ISIE.2011.5984478.
J. Marcos et al. / Solar Energy 99 (2014) 28–35 35
Byrne, R., Donnelly, M., Loose, V., Trudnowski, D., 2012. Methodologyto determine the technical performance and value proposition for grid-scale energy storage systems: a study for the DOE energy storagesystems program. (No. SAND2012-10639). Montana Tech of TheUniversity of Montana, Butte, MT; Sandia National Laboratories(SNL-NM), Albuquerque, NM (United States).
Ellis, A., Schoenwald, D., Hawkins, J., Willard, S., Arellano, B., 2012. PVoutput smoothing with energy storage. In: 38th IEEE PhotovoltaicSpecialists Conference (PVSC), 3–8 June 2012, pp. 001523–001528.doi: http://dx.doi.org/10.1109/PVSC.2012.6317885.
Hund, T.D., Gonzalez, S., Barrett, K., 2010. Grid-Tied PV system energysmoothing. In: 35th IEEE Photovoltaic Specialists Conference(PVSC), 20–25 June 2010, pp. 002762–002766. doi: http://dx.doi.org/10.1109/PVSC.2010.5616799.
Jewell, W.T., Ramakumar, R., 1987. The effects of moving clouds onelectric utilities with dispersed photovoltaic generation. IEEE Trans-actions on Energy Conversion EC-2 (4), 570–576. http://dx.doi.org/10.1109/TEC.1987.4765894.
Jewell, W.T., Unruh, T.D., 1990. Limits on cloud-induced fluctuation inphotovoltaic generation. IEEE Transactions on Energy Conversion 5(1), 8–14. http://dx.doi.org/10.1109/60.50805.
Kakimoto, Naoto, Satoh, H., Takayama, S., Nakamura, K., 2009. Ramp-rate control of photovoltaic generator with electric double-layercapacitor. IEEE Transactions on Energy Conversion 24 (2), 465–473.http://dx.doi.org/10.1109/TEC.2008.2001580.
Kuszamaul, S., Ellis, A., Stein, J., Johnson, L., 2010. Lanai high-densityirradiance sensor network for characterizing solar resource variabilityof MW-scale PV system. In: 35th IEEE Photovoltaic SpecialistsConference (PVSC), 20–25 June 2010, pp. 000283–000288. doi: http://dx.doi.org/10.1109/PVSC.2010.5615868.
Lave, M., Kleissl, J., Arias-Castro, E., 2012. High-frequency irradiancefluctuations and geographic smoothing. Solar Energy 86 (8), 2190–2199 (ISSN 0038-092X).
Leitermann, O., 2012. Energy Storage for Frequency Regulation on theElectric Grid. Diss. Massachusetts Institute of Technology.
Loc Nguyen, Khanh, Seo, Jae-Jin, Kim, Yun-Seong, Won, Dong-Jun,2010. Power-management strategies for a grid-connected PV–FChybrid system. IEEE Transactions on Power Delivery 25 (3), 1874–1882. http://dx.doi.org/10.1109/TPWRD.2010.2047735.
Marcos, J., Marroyo, L., Lorenzo, E., Alvira, D., Izco, E., 2010. Poweroutput fluctuations in large scale PV plants: one year observations with
one second resolutions and a derived analytic model. Progress inPhotovoltaics: Research and Applications 19 (2), 218–227. http://dx.doi.org/10.1002/pip.1016.
Marcos, J., Marroyo, L., Lorenzo, E., Alvira, D., Izco, E., 2011a. Fromirradiance to power fluctuations: the PV plant as a low pass filter.Progress in Photovoltaics: Research and Applications 19 (5), 505–510.http://dx.doi.org/10.1002/pip.1063.
Marcos, J., Marroyo, L., Lorenzo, E., Alvira, D., Izco, E., 2011b.Smoothing of PV power fluctuations by geographical dispersion.Progress in Photovoltaics: Research and Applications 20, 226–237.http://dx.doi.org/10.1002/pip.1127.
Mills, A., Wiser, R., 2010. Implications of Wide-area GeographicDiversity for Short-Term Variability of Solar Power. LawrenceBerkeley National Laboratory (on-line available).
Mills, A., Ahlstrom, M., Brower, M., Ellis, A., George, R., Hoff T.,Kroposki, B., Lenox, C., Miller, N., Stein, J., Wan, Y., 2009.Understanding Variability and Uncertainty of Photovoltaics forIntegration with the Electric Power System. Lawrence BerkeleyNational Laboratory (on-line available).
Perez, R., Kivalov, S., Schlemmer, J., Hemker, K., Hoff, T., 2012. Short-term irradiance variability: preliminary estimation of station paircorrelation as a function of distance. Solar Energy 86 (8), 2170–2176(ISSN 0038-092X).
Perpinan, O., Marcos, J., Lorenzo, E., 2013. Electrical power fluctuationsin a network of DC/AC inverters in a large PV plant: relationshipbetween correlation, distance and time scale. Solar Energy 88(February), 227–241 (ISSN 0038-092X).
PREPA, 2012. Puerto Rico Electric Power Authority Minimum TechnicalRequirements for Photovoltaic Generation (PV) Projects. <http://www.fpsadvisorygroup.com/rso_request_for_quals/PREPA_Appen-dix_E_PV_Minimum_TechnicalRequirements.pdf.> (accessed March2013).
Rahman, S., Tam, K.S., 1988. A feasibility study of photovoltaic-fuel cellhybrid energy system. IEEE Transactions on Energy Conversion 3 (1),50–55. http://dx.doi.org/10.1109/60.4199.
Xiangjun, Li, Hui, Dong, Lai, Xiaokang, 2013. Battery energy storagestation (BESS)-based smoothing control of photovoltaic (PV) andwind power generation fluctuations. IEEE Transactions on Sustain-able Energy 4 (2), 464–473. http://dx.doi.org/10.1109/TSTE.2013.2247428.