stomatal control xylem hydraulics and leaf …
TRANSCRIPT
STOMATAL CONTROL, XYLEM HYDRAULICS AND LEAF MORPHOLOGY IN THE 40 BEF-CHINA TREE SPECIES: TRAIT INTERRELATIONSHIPS,
FUNCTIONAL DIVERSITY AND TREE GROWTH PREDICTION
Kumulative Dissertation
zur Erlangung des Doktorgrades der Naturwissenschaften (Dr. rer. nat.)
der Naturwissenschaftlichen Fakultät I
Biowissenschaften
der Martin-Luther-Universität Halle-Wittenberg
vorgelegt
von Herrn Diplom-Biologen Wenzel Kröber geboren am 30.10.1982 in Halle (Saale)

Gutachter
1. Helge Bruelheide 2. Stan Harpole 3. Karsten Wesche
Datum der Verteidigung: 24.02.2015

“My precious”
John Ronald Reuel Tolkien (1937)

Copyright notice
Chapters 2 to 5 have been either published in or submitted to international journals. Copyright is with the authors. Reprint of the presented material requires the authors’ permissions, except for chapter 3, which has been published open access.

Table of Contents
Chapter 1 .................................................................................................................................... 1!
1.1 Summary .......................................................................................................................... 1!
1.2 �� .................................................................................................................................. 3!
1.3 Zusammenfassung ............................................................................................................ 5!
1.4 Introduction ...................................................................................................................... 7!
1.4.1 How is biodiversity linked to ecosystem functioning? ............................................. 7!
1.4.2 Plant functional traits ................................................................................................. 8!
1.4.3 Are ecosystem functions better explained by the environment, by community
weighted means or by functional diversity? ............................................................ 14!
1.5 Objectives of the thesis ................................................................................................... 16!
1.5.1 Outline ..................................................................................................................... 17!
1.5.2 Hypotheses tested in the thesis ................................................................................ 19!
1.6 References ...................................................................................................................... 21!
Chapter 2 .................................................................................................................................. 29
Transpiration and stomatal control: a cross-species study of leaf traits in 39 evergreen
and deciduous broadleaved subtropical tree species
Chapter 3 .................................................................................................................................. 47
Linking xylem hydraulic conductivity and vulnerability to the leaf economics
spectrum – a cross-species study of 39 evergreen and deciduous broadleaved
subtropical tree species
Chapter 4 .................................................................................................................................. 75
Leaf morphology of 40 evergreen and deciduous broadleaved subtropical tree species
and relationships to functional ecophysiological traits
Chapter 5 .................................................................................................................................. 89
Early subtropical forest growth is driven by community mean trait values and
functional diversity rather than the abiotic environment
Chapter 6 ................................................................................................................................ 119!
6.1 Discussion .................................................................................................................... 119!
6.1.1 Stomatal conductance regulation ........................................................................... 120!
6.1.2 Xylem hydraulics .................................................................................................. 121!
6.1.3 Leaf microscopy traits ........................................................................................... 123!

6.1.4 Biodiversity, traits & ecosystem functioning ........................................................ 124!
6.1.5 Conclusion ............................................................................................................. 126!
6.2 References .................................................................................................................... 129!
6.3 Thanks .......................................................................................................................... 145!
6.4 Appendix ...................................................................................................................... 146!
6.4.1 Curriculum vitae .................................................................................................... 146!
6.4.2 List of publications ................................................................................................ 148!
6.4.3 Eigenständigkeitserklärung ................................................................................... 149!

1
Chapter 1
1.1 Summary
Research on biodiversity-ecosystem functioning (BEF) has undergone considerable progress
especially due to lessons learned in BEF experiments lately. With 400.000 trees and shrubs
planted in 566 plots and a tree species diversity gradient between 1 and 24 species per plot,
BEF-China is one of the largest BEF experiments with woody plants. The present thesis
consists of four papers all based on data from the BEF-China tree species.
The first three studies that form part of this thesis deal with the interrelationships of plant
functional traits in the 40 subtropical broadleaved tree species planted in the BEF-China
experiment. Investigating the interplay between different plant functional traits, this thesis
addressed the following questions: How are traits related to each other and are there any
ecophysiologically determined trade-offs in different trait complexes such as xylem
hydraulics and stomatal regulation parameters? Are these ecophysiological characteristics
related to leaf traits captured by the leaf economics spectrum (LES)?
Several new key parameters that describe stomata conductance (gS) regulation were extracted
from gS-vapour pressure deficit curves. As hypothesized, traits characteristic for the LES, for
example, leaf nitrogen concentration and leaf carbon-to-nitrogen ratio, were related to mean
gS. Interestingly, other leaf traits not correlated with the LES, such as stomatal traits, were
found to be good predictors of stomatal regulation characteristics.
Water flow in vascular plants connects xylem hydraulics and leaf morphology and anatomy.
The quantification of the specific xylem hydraulic conductivity and the xylem pressure at
which 50% loss of the maximum specific xylem hydraulic conductivity of the study species
occurs (Ψ50) revealed that cavitation resistance was closely linked to the traits of the LES, but
not to any parameter of gS regulation though. Moreover, several leaf traits that typically are
not considered in research, for instance, microscopy and morphologic traits such as leaf
thickness, the log ratio of palisade to spongy mesophyll thickness and microstructure of the
leaf surface, determined gS regulation significantly. For xylem hydraulics, however, the leaf
habit overruled any further signal from other traits.
Although analysis of plant functional traits represents a reliable approach in biodiversity
ecology, BEF studies that would focus on the parallel analysis of the impact of biotic and
abiotic effects on ecosystem functions such as productivity in forest ecosystems have been
scarce so far. Thus, the dominant drivers of forest growth like the environment, the identity of

2
specific species or the magnitude of functional diversity in the respective communities have
not been fully understood yet.
The fourth study focused on the impact that the following factors may have on the mean tree
crown increment of the experimental plots: the environmental conditions, community
weighted mean (CWM) traits or functional diversity. The trait values aggregated in CWM
displayed the biggest effect on the variation in productivity of the forest plots; FD scored
medium impact whereas the environment, contrary to expectation, had only a very limited
impact. Thus, already at an early stage of the experiment, biotic influences overruled effects
from the environmental setting.
Summing up, this thesis provides deeper insight into stomatal control and contributes to the
knowledge about xylem vulnerability and morphological proxies for physiological leaf traits.
In addition, a framework to predict ecosystem functioning was tested and environment was
found to be the least important parameter. The results of this thesis demonstrate that the
specific plant functional traits employed in BEF research should be chosen carefully in order
to maximize methodological efficiency and to minimize unwanted data redundancy.

3
1.2 ��
đx¥(�ÐÈ]®��Ð�äë8ó(äÓÙÞE��ġďÓĔ¶�É3�Ę
Đ�ä1Ó�5iīÙÞ��T�Äu¯¨ÐÈ]®��Ð�äë8óiī�BEF-
China��Õ6�Ò�ÿ²�_Ó¢£±ÈBEF�5iī���Ĉiī'ąî 566�®
��;O40]°�¢Pâ�y�Æ=Û424Û&Û LÓ]®�»w03Ĕú�
ąĂě±�£�ÓRá+jW�Y�¥õBEF-China®V40ÛÈÛU L]®�»w�
Ó��ðg��
Ą�Ó6á�ý�ă�ē40ÛĤJÛ8ó�Ê�ģÓÖ�(ä�ÂCÓ(Ġ
ÜeĢĩ �8ó�Êģ�ģ��®Ö�(ñÓ� LÓ8ó�Ê[Kßģĝ�Nd
U�hÓÐÎÐ�wû(ä�¸a¢Čę»7m{�¹cĊöB��NÖ(�ē�Ð
ÎÐ���Ê�NP*XÓJÇ~��Ê�ģdU�h(ä�
£�ÓÙÞê©ü��Ñ��ĕ¹cm{Ċö¤5ÓB���¹cm{-ù¼@s
�æ��EÓ�´a$ą�Ĩ¿�r�JÇéÀċX�LES�Ó8ó�ÊĚP¹cwW
m{�øÖ(�aJºOğPJÇÚº¸�ð)fPJÇéÀċX��øÖ(Ó¹c
~��Ê?ó�`ÓĨ¿¹cĊö¤5�
µ\�lÕ«ÈÛÓ¢Čęm»ËP»:Óğ<ê©DÍ�±È�ßÝ<ó7P
r�JÇéÀċXÓ�ÊåkÖ(�P¹cm{Ċö¤5ÓB�?½ �ø(ä�ð
H\�� vÑÓJÇ8ó�Ê?P¹cĊöåkÖ(�a���þP~��Ê�J
ÇA{�JǪ¬PÁìçèÓA{¸ CJüÔÓ�þê¦�l�¢Čęm{�J
Ç�ÊÓ�Q��òĐ)f�Ê�
qãté _ğÙÞĆ�Y�8ó�ÊÓ�¾�ÙÞÐÈ]®�ÓIħė��Å
M×´n)zÑ�ÐÈ]®��Ð�äë8óÙÞ�Ñ¥āĜÐÈPĦÐÈSblÐ
�äë8ó�QÓÙÞĒ��Ïp�¸aÞà�ÌZ�ÉhÈÛĒ�8ó]®�Ī9
�¯¨¢ÐġĒ �ā.�£�ÓâRá>��ăÌZ�ï÷»wÓ8ó�Ê C
8ó]®�l¨-ÐġÓÖlĞý��ê©ü�ï÷»wÓ8ó�Êó^�]āĜ®
VÐ�7ÓF|�)³�8ó]®��ðÌZSb�čÓ"Ñ�o��Gćĉ�>#
UiīÓ�¡ĥ·�téDÍÐÈSblÐ�äë8óÓ�QĎĐ�ĦÐÈSb�
í��ĕ�£Ą��%�ÓĀ{0§�¯¨¢Ó¹c�5¤5�¢Čęô}�
CJÇÐÎ�ÊÓ~�eÉ��y�ĘĐīĆ]�ó^Ĩ¿Ð�äë8óÓSbD

4
ÍÌZU)�čØy ĞýÓ"Ñ�ê©��/U�M(�BEFÓÙÞ�z�ĞĖ�
Éh±È8ó�ÊÓĞý�� �_<�Ĭ�¾Ó2ÑË C�o<��Ó,!��

5
1.3 Zusammenfassung
Die Biodiversitätsforschung auf ökosystemarer Ebene hat vor allem durch Erkenntnisse aus
Experimenten, die den Zusammenhang zwischen Diversität und Ökosystemfunktionen
untersuchen, beträchtliche Fortschritte erzielt. Das Projekt BEF-China (Biodiversity-
Ecosystem Functioning) ist mit 400.000 angepflanzten Bäumen und Sträuchern in 566
Untersuchungsflächen eines der größten Experimente dieser Art weltweit. Auf einem Areal in
Südost-China wurde in den Jahren 2009 und 2010 eine Bepflanzung realisiert, die
Untersuchungsflächen mit bis zu 24 Baumarten umfasste. Daten aus diesem Experiment
bilden die Grundlage der vier Manuskripte auf denen die vorliegende Dissertation basiert.
Die ersten drei Manuskripte beschäftigen sich mit Zusammenhängen zwischen funktionalen
Pflanzenmerkmalen der 40 subtropischen Laubbaumarten, die im BEF-China Experiment
gepflanzt worden sind. Dabei wurden folgende Fragen gestellt: Über welche Funktionen sind
die Merkmale untereinander verknüpft? Gibt es ökophysiologisch getriebene Kompromisse in
der Ausprägung eines Merkmals, das unterschiedliche Funktionen hat, so zum Beispiel
Merkmale des Xylems und Faktoren, die stomatäre Leitfähigkeit regulieren? Sind diese
ökophysiologischen Kenngrößen mit Blattmerkmalen assoziiert, welche durch das leaf
economics spectrum (LES) abgebildet werden?
Aus Funktionskurven zwischen stomatärer Leitfähigkeit und Dampfdruckgefälle wurden neue
Schlüsselgrößen, die die Regulierung stomatärer Leitfähigkeit beschreiben, abgeleitet. Wie
zuvor angenommen, standen Merkmale, welche typisch für das LES sind, wie die Stickstoff-
Konzentration und das Kohlenstoff-Stickstoff-Verhältnis, im Zusammenhang mit mittlerer
stomatärer Leitfähigkeit. Interessanterweise ließ sich von weiteren Merkmale, wie Dichte und
Größe der Stomata, die als nicht korreliert mit dem LES bekannt sind, gut auf die Regulation
von stomatärer Leitfähigkeit schließen.
Der Wasserfaden in Gefäßpflanzen verbindet in funktionaler Weise das Xylem mit der
Blattmorphologie und -anatomie. Mittels der Quantifizierung von spezifischer hydraulischer
Leitfähigkeit des Xylems und des Xylemdruckes, bei dem 50% Verlust der maximalen
spezifischen hydraulischen Leitfähigkeit des Xylems auftraten, konnte gezeigt werden, dass
die Kavitationsresistenz eng mit Merkmalen des LES verknüpft ist, jedoch mit keinem
stomatären Regulationsparameter. Verschiedene Blattmerkmale, welche sonst nur sehr selten
untersucht werden, so zum Beispiel mikroskopische und morphologische Merkmale wie
Blattdicke, das logarithmierte Verhältnis der Stärke von Schwamm- und Palisadenparenchym
und Mikrostrukturen der Blattoberfläche, beeinflussten in signifikanter Weise die Regulation
6
von stomatärer Leitfähigkeit. Im Bereich der Xylemmerkmale war dagegen das Signal der
Blattlebensdauer maßgeblich.
Funktionale Pflanzenmerkmale stellen einen bewährten Ansatz in der Biodiversitäts- und
Ökosystemfunktionsforschung dar. Dennoch sind Biodiversitäts- und Ökosystemfunktions-
studien, welche zugleich die Einflüsse von sowohl biotischen als auch abiotischen Effekten
auf Ökosystemfunktionen, wie zum Beispiel Produktivität in Waldökosystemen, untersuchen,
immer noch selten. Daher sind die wichtigsten Einflussgrößen auf Waldwachstum wie
Umwelt, Artidentitätseffekte oder der Einfluss von funktioneller Diversität noch nicht
vollkommen erforscht.
Das vierte Manuskript zeigt, inwieweit das mittlere Kronenwachstum der Bäume einer
Untersuchungsfläche durch die abiotische Umwelt, gemittelte Eigenschaften aller Bäume der
Untersuchungsfläche (community weighted means, CWM) oder funktionelle Diversität erklärt
werden kann. Die durch CWM zusammengefassten Merkmale erklärten den größten Anteil an
Variation in der Produktivität der Walduntersuchungsflächen, funktionale Diversität erreichte
einen mittleren Einfluss, wohingegen die unbelebte Umwelt nur sehr geringe Erklärungskraft
bot. Trotz des frühen Sukzessionsstadium der Untersuchungsflächen überwogen biotische
Effekte gegenüber Umwelteinflüssen.
Zusammengefasst führt diese Dissertation zu neuen Erkenntnissen über stomatäre Kontrolle,
Kavitationsresistenz und morphologische Schätzwerte für physiologische Pflanzenmerkmale.
Die Analysen wurden mit einem umfangreichen Datensatz durchgeführt, so dass die
gewonnenen Erkenntnisse von hoher Generalisierbarkeit sind. Zusätzlich wurde ein Konzept
zur Vorhersage von Ökosystemfunktionen getestet, wobei festgestellt wurde, dass
Umwelteinflüsse den geringsten Effekt auf die Produktivität hatten. Die Ergebnisse dieser
Arbeit belegen die große Bedeutung der Auswahl von spezifischen funktionalen
Pflanzenmerkmalen für die Maximierung methodischer Effizienz und die Minimierung
ungewollter Redundanz der Daten in der Biodiversitäts- und Ökosystemforschung.

7
1.4 Introduction
1.4.1 How is biodiversity linked to ecosystem functioning?
Humankind depends on stable and reliable ecosystem functioning (Díaz et al. 2006; Haines-
Young and Potschin 2010). Ecosystem functioning is defined as all biological, geochemical
and physical processes that control cycles of organic matter, nutrients and energy in an
environment, for example, primary production, nutrient cycling or decomposition (Maynard et
al. 2010; Cardinale et al. 2012). In turn, the complexity of these processes depends on
biodiversity. Compelling evidence for many positive links between diversity of ecosystems
and their functioning has been found in the growing body of experiments in recent research on
biodiversity–ecosystem functioning (BEF) (Balvanera et al. 2014; Tobner et al. 2014).
Productivity defined as the rate of biomass production in an ecosystem is one example of
ecosystem functioning. A more specific term - net primary production - refers to productivity
of autotrophs, here plants (Chapin et al. 2011).
However, the specific mechanisms behind the interplay of biodiversity and ecosystem key
functions such as productivity have not been satisfactorily understood yet (Cardinale et al.
2006; Balvanera et al. 2014). One of the reasons is the complexity of biodiversity itself that
includes all variability in living creatures and ecological complexes they are part of, expressed
in genetic, species and ecosystem variability (Balvanera et al. 2006; Cardinale et al. 2006;
Cardinale et al. 2012; CBD). To achieve efficient future land use strategies and conservation
policy, further research is needed to extend the current knowledge about a wide range of
systems and environments. Regardless the specific definition or level of biodiversity one
refers to (Mace et al. 2012), if species decline in frequency or become extinct, they are no
longer available for ecosystems (Hooper et al. 2012) such as those examined in this
dissertation.
Drawing conclusions across different ecosystems, environments and species represents a great
challenge. Systematic approaches under comparable settings are therefore indispensable and
should be strived for. BEF experiments may be an answer to this challenge and represent the
state of the art in the current ecological research.

8
The present thesis consists of four papers that are all based on the data and the design of the
BEF-China experiment (Yang et al. 2013; Bruelheide et al. 2014). On two experimental sites
40 broadleaved subtropical tree species native to the surrounding forests have been planted in
a design with diversity levels ranging from monocultures to 2, 4, 8, 16 and 24 species per plot.
The sites are located in Jiangxi province, 400 km west of Shanghai.
In order to relate functioning to biodiversity in BEF experiments, different facets of
biodiversity need to be quantified (Reiss et al. 2009). However, there is no simple measure as
biodiversity comprises many different facets including diversity at the genetic, species or
ecosystem levels (Davies and Cadotte 2011). The concept of diversity is based on differences
that can be described by several indices, one of which is functional diversity (FD) (Schleuter
et al. 2010). FD is considered to perform better than pure species richness index in prediction
of ecosystem functioning, for example, in prediction of productivity of a community, since
FD captures various facets of the communities. In contrast, species richness is only a
compilation of species presence data for a community (Tilman 1997; Petchey et al. 2004). In
the case of functional diversity FD, these differences can be partitioned into two main
components: distances in qualities of objects, on the one hand, and relative abundances of
these objects, on the other hand (Purvis and Hector 2000). In ecology these “qualities” are
termed traits. A functional trait is a measurable attribute of an individual plant which affects
its performance in terms of growth, reproduction or survival (Lavorel and Garnier 2002;
Violle et al. 2007; Perez-Harguindeguy et al. 2013). Consequently, FD is defined as the range
of trait dissimilarities and divergence and as the distribution of species in a community
(Tilman 2001).
1.4.2 Plant functional traits
Functional traits represent a major area of interest within the field of plant ecology (Messier et
al. 2010; Perez-Harguindeguy et al. 2013). Since plant functional traits carry a large part of
relevant information about a species, they may help to predict the interactions between
species as well as the characteristics of communities and even of the whole ecosystems
(Naeem and Wright 2003; Grime 2006; Luck et al. 2009). However, this relationship is not a
simple one because traits are often pleiotropic: one trait usually affects several functions, and,
vice versa, one function is often driven by several traits. Elementary trade-offs between
functional traits are one of the basic concepts in functional ecology (Sterck et al. 2011). These

9
trade-offs may have different causes: they can either be allocation-based, such as specific leaf
area (SLA) and leaf nitrogen-to-carbon ratio (Evans and Poorter 2001), or have an
evolutionary basis, such as the different strategies in leaf defence mechanisms between
polyphenols and leaf toughness (Schuldt et al. 2014). It has been shown that trade-offs can act
in a general way across biomes and can cause limitations in possible trait combinations in
plant species even on a global scale (Reich et al. 1999).
Among all traits of a plant, particularly leaf traits have been confirmed to be highly effective
predictors of plant performance due to their central role in the plant’s functionality and due to
their key player function, for instance, in gas exchange or light acquisition (Reich et al. 1999;
Poorter et al. 2004; Sterck et al. 2006; Kröber et al. 2012). Thus, leaf traits not only play a
central role in primary productivity (Wilson et al. 1999; Marron et al. 2005; Pontes et al.
2007; Cadotte et al. 2009) but also capture many of the essential trade-offs over a large array
of functions. An important framework that can explain a large amount of leaf trait
interrelationships is the leaf economics spectrum (LES) that sorts species according to their
nutrient investment strategies from fast-return to slow-return ones (Wright et al. 2004).
However, it has not been fully understood so far how different trait complexes, for example,
anatomical and physiological leaf traits, are connected to the LES. The LES runs from short-
lived leaves, which are highly physiologically active and contain high nutrient concentrations,
to long-lived leaves, which are less physiologically active and contain lower nutrient
concentrations (Shipley et al. 2006; Osnas et al. 2013). The LES describes the intensity of
photosynthetic assimilation in a leaf and its dark respiration rate and is thus reflected in leaf
traits such as SLA, leaf nitrogen concentration and leaf phosphorous concentration (Maire et
al. 2013). Nutrient contents discriminate plant species globally along a gradient from
acquisitive to conservative investment strategies (Wright et al. 2004; Freschet et al. 2010).
The LES, in addition, validly accounts for variation in leaf habit (Edwards et al. 2014).
Besides explaining the nutrient use in leaves, the LES may also predict other physiologically
relevant aspects such as water use (Reich 2014). Recent studies have revealed that the traits
represented in the LES are related to plant water use and thus to traits that reflect stomatal
conductance (gS) (Aasamaa and Sõber 2011), xylem hydraulics (Hoeber et al. 2014) and
anatomical features like leaf vein density (Blonder et al. 2014). However, the relationship
between LES and plant water relations has been seen controversially as some studies do not
confirm clear links between LES and physiological parameters related to stomatal control
(Juhrbandt et al. 2004; Sales-Come and Hölscher 2010). Thus, this thesis aimed to test for
such relationships in the set of trees in the BEF-China experiment.

10
Stomatal conductance traits, xylem hydraulic traits & leaf microscopy traits
The regulation of gS is a key process for the water balance in vascular plants. The most
frequently measured parameters of stomatal regulation are mean und maximum gS. However,
these parameters do not capture the regulatory abilities of tree species. In particular, they do
not take into account the responsiveness to external environmental factors, of which the most
important is vpd (Farquhar and Sharkey 1982). During periods of drought stress, sensitive and
precise stomatal regulation is crucial to prevent cavitation (Hacke et al. 2006). Although some
earlier studies modelled the relationships between gS and vpd, they mostly employed linear
relationships (Schulze et al. 1994; Oren et al. 1999). Only few attempts were made to quantify
the point of down-regulation at high vpd, and most studies focused on the vpd range, in which
the degree of stomata opening increases (Leuning 1995; Patanè 2011). So far, no consistent
model has been proposed to predict the vpd at which plants down-regulate gS. One of the aims
of the first manuscript in this thesis (see Chapter 2) was to develop a model that would allow
to extract these parameters. Subsequently, these new parameters could be tested for
relationships with traits such as those described by the LES and traits that have not been often
studied yet (Walker et al. 2014). For instance, gS regulation is known to be affected by leaf
habit. In general, deciduous species were found to have higher gS values; under drought
conditions, however, their gS values were lower than those of evergreen species (Sobrado
1998; Liu et al. 2011; Zhang et al. 2013). Table 1 shows the list of particular traits that were
included in this study to test for such relationships.
In contrast to the process of determining the parameters of gS regulation, methods that assess
sensitivity of xylem hydraulics are well established (Sperry et al. 1988; Tyree and Sperry
1989). Specific xylem hydraulic conductivity and sensitivity to cavitation are quantified via
flow-through measurements and using a modified Scholander pressure chamber.
Nevertheless, these methods require sophisticated lab equipment and are highly labour- and
time-consuming. Thus, detecting proxies for xylem hydraulic traits would increase the
efficiency in screening plant species in comparative physiology studies. Several studies on
trees have shown that high xylem hydraulic conductivity and high sensitivity to cavitation are
related to low wood density and thus to high SLA (Poorter et al. 2010; Markesteijn et al.
2011a; Choat et al. 2012). The parameters of gS control and xylem hydraulics may be
expected to be related because transpiration and xylem hydraulics are tightly linked through a
specific water use strategy of a particular plant species. Consequently, tree species that under
drought conditions down-regulate gS at high vpd quickly and efficiently often have xylem
vessels highly sensitive to cavitation (Martorell et al. 2014; Franks and Casson 2014; Dow

11
and Bergmann 2014; Nardini and Luglio 2014). In contrast, tree species with cavitation-
resistant vessels are able to sustain high gS in phases of high vpd and therefore tolerate low
water potentials in the xylem. Conversely, a high photosynthetic capacity of leaves, as
expressed by a high SLA, might be associated with high xylem hydraulic conductivity to
facilitate sufficient water supply required for high gS. These expectations were tested in the
second manuscript of this thesis: the specific xylem hydraulic conductivity and the xylem
pressure that leads to 50% loss of the maximum specific xylem hydraulic conductivity (Ψ50)
were quantified and related to the LES traits (Table 1).
Various studies have aimed at finding mechanistic links between xylem hydraulics and plant
functional traits assigned to other complexes in order to predict xylem hydraulics (Poorter et
al. 2010; Markesteijn et al. 2011a; Choat et al. 2012). In such studies, these were mainly the
LES traits that were tested for relationships to stomatal regulation and xylem hydraulics.
However, a much bigger variety of traits is available for research, and these traits seem to be
worth analysing since they may describe physiological processes better than the established
LES traits (Somavilla et al. 2014; DosAnjos et al. 2014). Because other traits have been rarely
studied, not much is known about their interrelationships (Wylie 1951; Jackson 1967).
Particularly the traits describing aspects of the leaf surface may hold information relevant to
plant water relations since the leaf surface is the main barrier for water loss and the
occurrence of specific microscopy structures on the leaf surface may be related to specific
physiological parameters describing the plant’s water use strategy (Eglinton and Hamilton
1967; Jeffree 1986; Barthlott et al. 1998). Since the internal leaf structure links xylem and
stomata, it might hold causal information on how leaf functionality connects different
physiological demands (Evans 1999; Mediavilla et al. 2001; Santiago et al. 2004).

12
Table 1
Overview of all functional traits examined in this thesis with references to the respective publications. The traits are arranged by trait complexes. The main functions each trait presumably has are listed. Traits that are associated with the same function may be related to each other.
Trait Function Manuscript no.
Code sorted by trait complex Meaning Productivity Longevity
Water transport efficiency
Drought resistance 1 2 3 4
Physiological leaf traits CONMEAN average gS
[1] +++ + - x x x CONMAX maximum gS
[2] +++ - ++ x x x VPDMAX vpd at CONMAX +++ x x x CONMAXFIT fitted max. gS
[2] +++ x x x x VPDMAXFIT vpd at CONMAXFIT + ++ + x x x x
VPDPOI vpd at the second point of inflection of the gS-vpd model
+ ++ ++ x x x
Chemical leaf traits N Leaf nitrogen content [3] +++ --- x x x C Leaf carbon content [3] --- +++ + x x x
CN Leaf carbon to nitrogen ratio [3] --- +++ x x x
CA Leaf calcium content [4] + - x x x K Leaf potassium content [5] + - x x x MG Leaf magnesium content [6] +++ --- x x x
Macromorphological leaf traits LEAFHABIT Leaf duration [7, 8] + - x x LA Leaf area [7] + - x x x LDMC Leaf dry matter content [7] - + x x x SLA Specific leaf area [7] - x x x LEAFTOUGH Leaf toughness [9] --- +++ x x x EXTRAFLORAL Extrafloral nectaries [10] + x x x x LEAFPIN Leaf pinnation [11] + x x LEAFMAR Leaf margin type [11] + x x
Microscopy leaf traits STOMDENS Stomata density [12] +++ x x x STOMSIZE Stomata size [12] + x x x STOIND Stomata index [12] + x x x DIAMVEIN1 Diameter veins 1st order [13] +++ x x x x DIAMVEIN2 Diameter veins 2nd order [13] +++ x x x x
VEINLENGTH Length of veins in 1 mm2 [13,
14] +++ x x x x
TRICHOM Type of trichomes [15] - ++ x COVTRIUP Cover of trichomes on
adaxial side of leaf [15] ++ x
COVTRILO Cover of trichomes on abaxial side of leaf [15] ++ x
CUTFOLDUP Folding of upper cuticle [16] + x
CUTFOLDLO Folding of lower cuticle [17,
18] + x

13
Table 1 continued
Trait Function Manuscript no.
Code sorted by trait complex Meaning Productivity Longevity
Water transport efficiency
Drought resistance 1 2 3 4
Microscopy leaf traits continued
EPIWAXUP Pattern of upper epicuticular wax layer [17, 18] + + x
EPIWAXLO Pattern of lower epicuticular wax layer [17] + + x
UPPEREPI Thickness of upper epidermis [19] + x x
PALIS Thickness of palisade parenchyma [19] +++ x x
SPONGY Thickness of spongy parenchyma [19] + + x x
LOG10RATIO log10 of the ratio of thickness of palisade to spongy parenchyma [20, 21]
+++ x x
LEAFTHICK Leaf thickness [22] - + x x
SUBEPID Presence of a subepidermis [19] x x
EPICELLSIZ Ratio of the cell size of upper and lower epidermis [19] x x
PALSTR Layer structure of palisade parenchyma [21, 23] ++ x x
EXCRET Presence of excretory glands [22] - x x
DENSINTCEL Density of spongy parenchyma [24, 25] - x x
COLSCLER Presence of column of sclerenchyma cells through the leaf [19]
- + x x
PAPILL Presence of papillae [17] + x x
Physiological wood traits WPOT Water potential [26] x x
PSI50 Loss of 50% initial conductivity [26] --- --- x x x
HYDCOND maximum specific xylem hydraulic conductivity [26] +++ +++ x x x
B Parameter b (sigmoid regression of PSI50) x x
Microscopy wood traits
MEANAREA mean area of conducting vessels [26] + +++ --- x
MEANROUND mean roundness of conducting vessels [27] ++ + x
WOODDENS Wood density [26] --- +++ x x
DHYD hydraulically weighted diameter of conducting vessels [13, 27] +++ --- x
1 (Ewers et al. 2007), 2 (Schulze et al. 1994), 3 (Hiyama et al. 2005), 4 (White and Broadley 2003), 5 (Humble and Raschke 1971), 6 (Wasilewska et al. 2008), 7 (Pringle et al. 2011), 8 (Aerts 1995),9 (Schuldt et al. 2014), 10 (Koptur 1992), 11 (Taylor 1975), 12 (Franks and Farquhar 2007), 13 (Sack et al. 2013), 14 (Lambers et al. 2008), 15 (Schuepp 1993), 16 (Arambarri et al. 2008), 17 (Wilkinson 1979), 18 (Riederer and Schreiber 2001), 19 (Slaton et al. 2001), 20 (Zhang et al. 2012a), 21 (Dineva 2004), 22 (Gerosa et al. 2003), 23 (Vogelmann et al. 1996), 24 (Van Wittenberghe et al. 2012), 25 (Bussoti 2008), 26 (Markesteijn et al. 2011b), 27 (Tyree and Zimmermann 2002)

14
Microscopy traits characterising anatomical features of the leaf such as spongy mesophyll
thickness may be related to carbon assimilation strategies of a plant, which in turn should be
inseparably related to the plant's water use strategy. As decreasing cuticle thickness, stomatal
densities and the ratio of palisade to spongy mesophyll ratio have been associated with
increased shading (Qin et al. 2012) and since increased shading often translates into lower gS
values, it may be assumed that morphological leaf traits related to shaded environment are
also related to lower gS values (Kitajima 1994; Poorter 1999; Aranda et al. 2005). The same
comparison may be made for drought conditions. Bacelar et al. (2004) observed that several
structural leaf traits connected with sclerophylly increase under more severe drought
conditions, thus the same traits may be more pronounced in tree species with high xylem
cavitation resistance. Hence, the aim of the third manuscript in this thesis (Chapter 4) was to
assess leaf microscopy traits of the 40 BEF-China species and to test for their relationships to
physiological parameters (see Table 1).
1.4.3 Are ecosystem functions better explained by the environment, by community weighted
means or by functional diversity?
The final challenge of this thesis was to identify the factors that best describe ecosystem
functioning of the experimental communities in BEF-China. As a key function in ecosystems
the thesis focused on productivity. As the BEF-China experimental sites at Xingangshan
cover an exceptionally wide environmental range of different slopes and aspects which are
associated with a high variability in microclimatic conditions between the experimental plots,
a strong environmental impact on productivity would be expected. It is well known that
environmental effects at a local scale can alter valid patterns in trait variation globally (Wright
and Sutton-Grier 2012). Besides the impact of the environment, ecosystem functioning may
be affected by the community's functional composition. The functional composition of a
community can be described by two different measures that highlight complementary aspects:
the community weighted mean (CWM) and functional diversity (FD) (Ricotta and Moretti
2011). CWM is defined as the mean in trait values across all occurring species of a
community weighted by their abundances (Garnier et al. 2004; Lavorel et al. 2008).
Therefore, CWM allows for direct comparisons of communities in absolute trait values; FD,
in contrast, captures information on the range of values and abundances of traits in a
community (Chapin et al. 2000; Díaz and Cabido 2001; Loreau et al. 2001; Hooper et al.
2005).

15
It has also to be considered that ecosystem functioning is dependent neither on the
environment nor on CWM and FD exclusively. Not only does the environment affect
ecosystem functioning, for example, productivity, directly but also acts indirectly on the
relative abundance and composition of species in a community over time. Thus, when trying
to tear these different factors apart it is crucial to control for environmental influence in
experimental settings.
Certain base parameters are used to estimate maximum productivity for a given community at
a given place. The magnitude of biomass production is ultimately related to resource supply,
such as nutrient availability, photosynthetically active photon flux density and water
availability. Other essential parameters include the amount of these resources captured by the
individuals of a community and, finally, the efficiency in resource use, in other words, how
efficiently plants transform these necessary elements into biomass production. These terms
were aggregated by Monteith et al. (1977) and then further refined by Binkley et al. (2004)
and Richards et al. (2010) in the Production Ecology Equation:
where p is biomass production, r is resource supply, f is fraction of resources captured and e is
the efficiency of resource use (p & r being area normalized). When transposed into the terms
introduced above, the environment is assumed to have the strongest impact on r. In contrast,
f & e both represent a summary of the relevant traits of the species in the community, as
captured by CWM and FD. However, equating r with environment and f & e with traits in the
Production Ecology Equation is certainly too simple since the environment does also affect
f & e. In particular, f & e are also affected by stem density, canopy layer structure and
successional stage of the community. One of the major advantages of the BEF-China
experiment is that these last two factors have been controlled for as the trees were planted at
the same time in equal density.
FD is positively linked to various ecosystem functions, for example, to biomass production,
although the magnitude of its impact may be lower than environmental effects or specific
species characteristics (Paquette and Messier 2011; Vilà et al. 2013; Isbell et al. 2013).
Functional leaf and wood traits of a community averaged by CWM are considered specifically
significant in predicting tree growth and thus in predicting productivity (Healy et al. 2008;
Ricotta and Moretti 2011). Many authors provided evidence for a positive relationship
p = r ∗ f ∗e

16
between forest biodiversity and productivity (Kelty 1988; Caspersen and Pacala 2001; Liang
et al. 2007; Lei et al. 2009; Young et al. 2011; Zhang et al. 2012b; Vilà et al. 2013; Gamfeldt
et al. 2013).
In the Jena grassland experiment Roscher et al. (2012) observed that CWM had a stronger
effect on productivity than FD; however, their study did not explicitly include environmental
factors. Despite differing environmental conditions across the experimental plots, such as
distance to the river, environment did not affect productivity predictions since in the
experimental design employed random blocks, which accounted for differing environmental
conditions statistically. Only few studies analysed the combined impact of the environment
and FD on ecosystem properties (Díaz et al. 2007). In one of these studies, Vilà et al. (2013)
established that tree species richness positively influenced the tree wood production at the
local scale across a large range of environments. However, in BEF studies the biodiversity
signal has to be separated from environmental impacts. The need to do so was demonstrated,
for example, in the Sardinilla Experiment in Panama, where Healy et al. (2008) found the
environment to create a greater impact on the plot-level productivity than biodiversity.
Nevertheless, effects of biodiversity could account for 23-30% in variation of productivity.
It remains unclear which specific functional traits might be the best predictors for
productivity. In general, traits that are functionally associated with productivity (see Table 1)
should be good predictors in systematic approaches where a multitude of functional traits is
tested for its impact on community biomass production.
1.5 Objectives of the thesis
The overall aim of this thesis is to contribute to the general understanding of how biodiversity
loss entails loss in ecosystem functioning. Therefore, mechanisms were studied that
potentially relate functionality to biodiversity in ecosystems. This can be achieved in BEF
experiments where biodiversity has been experimentally manipulated and most of the
confounding environmental factors are controlled for. Consequently, this thesis made use of
the large–scale biodiversity–ecosystem function experiment BEF-China.
On the basis of the experimental setup, this dissertation addressed the following main
questions: How are the LES, the parameters of stomatal control, xylem hydraulics and
microscopy leaf traits, interrelated in the 40 broadleaved tree species planted in the

17
BEF-China experiment? Which traits, in addition to the LES, predict plant physiological key
functions such as gS regulation and xylem sensitivity to cavitation?
Taking productivity as an important ecosystem function, how can differences in trait
composition of plots explain variation in productivity? More specifically, how can plot-level
tree crown increment be best predicted from traits?
1.5.1 Outline
This thesis is composed of four papers and is structured as follows: the four papers are
presented in chapters two to five, and the discussion is found in the final chapter six. The first
paper determines the parameters of stomatal regulation extracted from gS – vpd models of
different tree species and tests how these parameters are linked to functional leaf traits, with a
particular focus on traits related to the LES. The second paper deals with xylem hydraulics
and the relationships between xylem hydraulics and stomatal control. The third paper focuses
on leaf microscopy traits, and asks how these rarely studied traits can explain aspects of leaf
physiology that are not covered by the LES. The first three papers form the basis for the
fourth paper. This last paper asks how tree growth of the experimental plots in BEF-China can
be best explained, by environment, CWM or FD.
Figure 1 shows how the four papers build upon each other. Whereas paper one and two take a
physiological perspective, paper three puts the emphasis on leaf morphology. Finally, paper
four focuses on ecosystem functioning exemplified by biomass production. The studies have
all been conducted at the same geographical site and with the same species under identical
conditions. The advantage of such systematic approach is that the results presented in all four
papers are highly comparable.
Table 2 gives a synopsis of the species examined and data used for each study. The aim was
to include all species of the two sites A and B in all papers. However, the number of species
included in the studies differed slightly (see Table 2) because species had not been
sufficiently established at the sites and tree growth data had not been available for both plots
at the time of writing this thesis.
The final chapter draws upon the entire thesis tying up various theoretical and empirical
strands. It also discusses implications of the findings for the future research into this area.
Finally, the conclusion gives a brief summary and critical assessment of the findings.

18
Figure 1
A simplified view on the relationships between ecological functions and trait complexes analysed in the thesis. The boxes represent the ecological functions and trait complexes and the arrows demonstrate the direction of the relationships. The numbers indicate the number of the manuscript and its main hypothesis, respectively. For the specific relationship, see also Table 1.
Table 2
Overview of the species included and the data analysed for the four studies.
Manuscript Sites Number of species Leaf traits
Stomatal conductance traits
Xylem hydraulic traits
Leaf microscopy traits
Additional data
1 A&B 391 2 A&B 392 3 A&B all 40 4 A 233 Li et al. (2014)
1 excluding Castanopsis carlesii; 2 excluding Quercus phillyraeoides; 3 all broadleaved tree species planted in site A excluding Castanopsis carlesii
Stomatal conductance
regulation
Xylem hydraulics
Leaf microscopy
traits
Productivity
Physiology FunctionMorphology
Leaf economics spectrum
1
3
2
3 4
4
4
4
2

19
1.5.2 Hypotheses tested in the thesis
Figure 1 represents an overview of the hypotheses tested where the numbers stand for the
summarized hypotheses for each manuscript.
1. Rationale: The LES captures nutrient investment strategies in leaves; therefore important
physiological parameters should be linked to the LES. Leaf habit as a key trait should
differentiate species in their physiological parameters.
Hypothesis: Parameters of gS are linked to traits described by the LES, such as SLA and leaf
dry matter content, and high gS values correspond to species with tender leaves and high
photosynthetic capacity. Evergreen species have lower mean and maximum gS than deciduous
species.
2. Rationale: The importance of the LES is also reflected in wood characteristics and in the
resulting physiological constraints.
Hypothesis: Parameters of xylem hydraulics are related to leaf traits describing the LES. In
particular, evergreen species have lower Ψ50 values compared to deciduous species. Finally,
parameters of gS regulation and parameters of xylem hydraulics should be related to each
other.
3. Rationale: Leaf traits such as SLA, leaf dry matter content or leaf nitrogen concentration
are the main traits used in functional plant ecology analyses. Further leaf traits describing
microscopy features provide additional physiological parameters and thus predict plant water
relations even better than LES traits.
Hypothesis: Microscopy leaf traits are connected to both parameters – parameters of gS
regulation and parameters of xylem hydraulics.
4. Rationale: Combining all plant functional traits analysed in the first three papers, the
impact of functional composition on tree growth can be quantified. In the BEF-China
experiment, topographic heterogeneity is very high, and thus the environmental impact can be
expected to be large. In contrast, due to the young age of the tree individuals, interaction
between them cannot yet be expected to be of considerable magnitude yet, thus abiotic effects
should not play a very important role.
Hypothesis: Single variables out of environment, CWM and FD do explain tree growth, but in
sum environmental predictors have a higher explanatory power for tree growth than CWM or
FD.

20
The sequence of the hypotheses is reflected in the sequence of the manuscripts in the
following chapters. Explicit hypotheses postulated in each manuscript further specify the four
condensed hypotheses formulated here.

21
1.6 References
Aasamaa K, Sõber A (2011) Stomatal sensitivities to changes in leaf water potential, air humidity, CO2 concentration and light intensity, and the effect of abscisic acid on the sensitivities in six temperate deciduous tree species. Environ Exp Bot 71:72–78.
Aerts R (1995) The advantages of being evergreen. Trends Ecol Evol 10:402–407. Arambarri AM, Freire SE, Colares MN et al. (2008) Leaf anatomy of medicinal shrubs and
trees from Misiones forest of the Paranaense Province (Argentina). Part 2. Bol Soc Argent Bot 43:31–60.
Aranda I, Castro L, Pardos M et al. (2005) Effects of the interaction between drought and shade on water relations, gas exchange and morphological traits in cork oak (Quercus suber L.) seedlings. Forest Ecol Manag 210:117–129.
Bacelar EA, Correia CM, Moutinho-Pereira JM et al. (2004) Sclerophylly and leaf anatomical traits of five field-grown olive cultivars growing under drought conditions. Tree Physiol 24:233–239.
Balvanera P, Pfisterer AB, Buchmann N et al. (2006) Quantifying the evidence for biodiversity effects on ecosystem functioning and services. Ecol Letters 9:1146–1156.
Balvanera P, Siddique I, Dee L et al. (2014) Linking biodiversity and ecosystem services: current uncertainties and the necessary next steps. Bioscience 64:49–57.
Barthlott W, Neinhuis C, Cutler D et al. (1998) Classification and terminology of plant epicuticular waxes. Bot J Linn Soc 126:237–260.
Binkley D, Stape JL, Ryan MG (2004) Thinking about efficiency of resource use in forests. Forest Ecol Manag 193:5–16.
Blonder B, Violle C, Bentley LP, Enquist BJ (2014) Inclusion of vein traits improves predictive power for the leaf economic spectrum: a response to Sack et al. (2013). J Exp Bot 65:5109–5114.
Bruelheide H, Nadrowski K, Assmann T et al. (2014) Designing forest biodiversity experiments: general considerations illustrated by a new large experiment in subtropical China. Methods Ecol Evol 5:74–89.
Bussoti F (2008) Functional leaf traits, plant communities and acclimation processes in relation to oxidative stress in trees: a critical overview. Global Change Biol 14:2727–2739.
Cadotte MW, Cavender-Bares J, Tilman D, Oakley TH (2009) Using phylogenetic, functional and trait diversity to understand patterns of plant community productivity. PLOS ONE 4:e5695.
Cardinale BJ, Duffy JE, Gonzalez A et al. (2012) Biodiversity loss and its impact on humanity. Nature 486:59–67.
Cardinale BJ, Srivastava DS, Emmett Duffy J et al. (2006) Effects of biodiversity on the functioning of trophic groups and ecosystems. Nature 443:989–992.
Caspersen JP, Pacala SW (2001) Successional diversity and forest ecosystem function. Ecol Res 16:895–903.
CBD Convention on biological diversity (1993) http://www.cbd.int/doc/legal/cbd-en.pdf Accessed 4 Jul 2014
Chapin FS III, Zavaleta E, Eviner V et al. (2000) Consequences of changing biodiversity. Nature 405:234–242.
Chapin FS III, Matson PA, Vitousek PM (2011) Principles of terrestrial ecosystem ecology. Springer, New York, Dordrecht, Heidelberg, London. 529 p.
Choat B, Jansen S, Brodribb TJ et al. (2012) Global convergence in the vulnerability of forests to drought. Nature 491:752–755.

22
Davies TJ, Cadotte MW (2011) Quantifying biodiversity: does it matter what we measure? In: Zachos FE, Habel JC (Ed) Biodiversity hotspots. Springer, Berlin, Heidelberg. pp 43–60.
Dineva SB (2004) Comparative studies of the leaf morphology and structure of white ash Fraxinus americana L. and London plane tree Platanus acerifolia Willd growing in polluted area. Dendrobiology 52:3–8.
Díaz S, Cabido M (2001) Vive la différence: plant functional diversity matters to ecosystem processes. Trends Ecol Evol 16:646–655.
Díaz S, Fargione J, Chapin FS III, Tilman D (2006) Biodiversity loss threatens human well-being. PLOS Biol 4:e277.
Díaz S, Lavorel S, de Bello F et al. (2007) Incorporating plant functional diversity effects in ecosystem service assessments. PNAS 104:20684–20689.
DosAnjos L, Oliva MA, Kuki KN et al. (2014) Key leaf traits indicative of photosynthetic plasticity in tropical tree species. Trees in Press
Dow GJ, Bergmann DC (2014) Patterning and processes: how stomatal development defines physiological potential. Curr Opin Plant Biol 21:67–74.
Edwards EJ, Chatelet DS, Sack L, Donoghue MJ (2014) Leaf life span and the leaf economic spectrum in the context of whole plant architecture. J Ecol 102:328–336.
Eglinton G, Hamilton RJ (1967) Leaf epicuticular waxes. Science 156:1322–1335. Evans JR (1999) Leaf anatomy enables more equal access to light and CO2 between
chloroplasts. New Phytol 143:93–104. Evans JR, Poorter H (2001) Photosynthetic acclimation of plants to growth irradiance: the
relative importance of specific leaf area and nitrogen partitioning in maximizing carbon gain. Plant Cell Environ 24:755–767.
Ewers BE, Oren R, Kim HS et al. (2007) Effects of hydraulic architecture and spatial variation in light on mean stomatal conductance of tree branches and crowns. Plant Cell Environ 30:483–496.
Farquhar GD, Sharkey TD (1982) Stomatal conductance and photosynthesis. Ann Rev Plant Phys 33:317–345.
Franks PJ, Casson S (2014) Connecting stomatal development and physiology. New Phytol 201:1079–1082.
Franks PJ, Farquhar GD (2007) The mechanical diversity of stomata and its significance in gas-exchange control. Plant Physiol 143:78–87.
Freschet GT, Cornelissen JHC, van Logtestijn RSP, Aerts R (2010) Evidence of the “plant economics spectrum” in a subarctic flora. J Ecol 98:362–373.
Gamfeldt L, Snäll T, Bagchi R et al. (2013) Higher levels of multiple ecosystem services are found in forests with more tree species. Nat Commun 4:1–8.
Garnier E, Cortez J, Billès G et al. (2004) Plant functional markers capture ecosystem properties during secondary succession. Ecology 85:2630–2637.
Gerosa G, Marzuoli R, Bussotti F, Pancrazi M (2003) Ozone sensitivity of Fagus sylvatica and Fraxinus excelsior young trees in relation to leaf structure and foliar ozone uptake. Environ Pollut 125:91–98.
Grime JP (2006) Trait convergence and trait divergence in herbaceous plant communities: mechanisms and consequences. J Veg Sci 17:255–260.
Hacke UG, Sperry J, Wheeler JK, Castro L (2006) Scaling of angiosperm xylem structure with safety and efficiency. Tree Physiol 26:689–701.
Haines-Young R, Potschin M (2010) The links between biodiversity, ecosystem services and human well-being. In: Raffaelia DG, Frid CLJ (Ed) Ecosystem ecology. Cambridge University Press, Cambridge. pp 102–133.

23
Healy C, Gotelli NJ, Potvin C (2008) Partitioning the effects of biodiversity and environmental heterogeneity for productivity and mortality in a tropical tree plantation. J Ecol 96:903–913.
Hiyama T, Kochi K, Kobayashi N, Sirisampan S (2005) Seasonal variation in stomatal conductance and physiological factors observed in a secondary warm-temperate forest. Ecol Res 20:333–346.
Hoeber S, Leuschner C, Köhler L et al. (2014) The importance of hydraulic conductivity and wood density to growth performance in eight tree species from a tropical semi-dry climate. Forest Ecol Manag 330:126–136.
Hooper D, Chapin FS III, Ewel J et al. (2005) Effects of biodiversity on ecosystem functioning: a consensus of current knowledge. Ecol Monogr 75:3–35.
Hooper DU, Adair EC, Cardinale BJ et al. (2012) A global synthesis reveals biodiversity loss as a major driver of ecosystem change. Nature 486:105–108.
Humble GD, Raschke K (1971) Stomatal opening quantitatively related to potassium transport evidence from electron probe analysis. Plant Physiol 48:447–453.
Isbell F, Reich PB, Tilman D et al. (2013) Nutrient enrichment, biodiversity loss, and consequent declines in ecosystem productivity. PNAS 110:11911–11916.
Jackson LWR (1967) Effect of shade on leaf structure of deciduous tree species. Ecology 48:498.
Jeffree C (1986) The cuticle, epicuticular waxes and trichomes of plants, with reference to their structure, functions and evolution. In: Juniper B, Southwood R (Ed) Insects and the plant surface. Edward Arnold, London, pp 23–64.
Juhrbandt J, Leuschner C, Hölscher D (2004) The relationship between maximal stomatal conductance and leaf traits in eight Southeast Asian early successional tree species. Forest Ecol Manag 202:245–256.
Kelty MJ (1988) Productivity of New England hemlock/hardwood stands as affected by species composition and canopy structure. Forest Ecol Manag 28:237–257.
Kitajima K (1994) Relative importance of photosynthetic traits and allocation patterns as correlates of seedling shade tolerance of 13 tropical trees. Oecologia 98:419–428.
Koptur S (1992) Extrafloral nectary-mediated interactions beetwen insects and plants. In: Bernays E (Ed) CRC series on insect/plant interactions. CRC Press, Boca Raton. pp 85–132.
Kröber W, Böhnke M, Welk E et al. (2012) Leaf trait-environment relationships in a subtropical broadleaved forest in South-East China. PLOS ONE 7:e35742.
Lambers H, Chapin FS III, Pons T (2008) Plant physiological ecology. Springer, New York, Dordrecht, Heidelberg, London. 623 p.
Lavorel S, Garnier E (2002) Predicting changes in community composition and ecosystem functioning from plant traits: revisiting the Holy Grail. Funct Ecol 16:545–556.
Lavorel S, Grigulis K, McIntyre S et al. (2008) Assessing functional diversity in the field – methodology matters! Funct Ecol 22:134–147.
Lei X, Wang W, Peng C (2009) Relationships between stand growth and structural diversity in spruce-dominated forests in New Brunswick, Canada. Can J For Res 39:1835–1847.
Leuning R (1995) A critical appraisal of a combined stomatal-photosynthesis model for C3 plants. Plant Cell Environ 18:339–355.
Li Y, Härdtle W, Bruelheide H et al. (2014) Site and neighborhood effects on growth of tree saplings in subtropical plantations (China). Forest Ecol Manag 327:118–127.
Liang J, Buongiorno J, Monserud RA et al. (2007) Effects of diversity of tree species and size on forest basal area growth, recruitment, and mortality. Forest Ecol Manag 243:116–127.

24
Liu C-C, Liu Y-G, Guo K et al. (2011) Comparative ecophysiological responses to drought of two shrub and four tree species from karst habitats of Southwestern China. Trees 25:537–549.
Loreau M, Naeem S, Inchausti P et al. (2001) Biodiversity and ecosystem functioning: current knowledge and future challenges. Science 294:804–808.
Luck GW, Harrington R, Harrison PA et al. (2009) Quantifying the contribution of organisms to the provision of ecosystem services. Bioscience 59:223–235.
Mace GM, Norris K, Fitter AH (2012) Biodiversity and ecosystem services: a multilayered relationship. Trends Ecol Evol 27:19–26.
Maire V, Gross N, Hill D et al. (2013) Disentangling coordination among functional traits using an individual-centred model: impact on plant performance at intra- and inter-specific levels. PLOS ONE 8:e77372.
Markesteijn L, Poorter L, Bongers F et al. (2011a) Hydraulics and life history of tropical dry forest tree species: coordination of species’ drought and shade tolerance. New Phytol 191:480–495.
Markesteijn L, Poorter L, Paz H et al. (2011b) Ecological differentiation in xylem cavitation resistance is associated with stem and leaf structural traits. Plant Cell Environ 34:137–148.
Marron N, Villar M, Dreyer E et al. (2005) Diversity of leaf traits related to productivity in 31 Populus deltoides x Populus nigra clones. Tree Physiol 25:425–435.
Martorell S, Diaz-Espejo A, Medrano H et al. (2014) Rapid hydraulic recovery in Eucalyptus pauciflora after drought: linkages between stem hydraulics and leaf gas exchange. Plant Cell Environ 37:617–626.
Maynard S, James D, Davidson A (2010) The development of an ecosystem services framework for South East Queensland. Environ Manage 45:881–895.
Mediavilla S, Escudero A, Heilmeier H (2001) Internal leaf anatomy and photosynthetic resource-use efficiency: interspecific and intraspecific comparisons. Tree Physiol 21:251–259.
Messier J, Mcgill BJ, Lechowicz MJ (2010) How do traits vary across ecological scales? A case for trait-based ecology. Ecol Letters 13:838–848.
Monteith JL, Moss CJ (1977) Climate and the efficiency of crop production in Britain. Philos T Roy Soc B 281:277–294.
Naeem S, Wright JP (2003) Disentangling biodiversity effects on ecosystem functioning: deriving solutions to a seemingly insurmountable problem. Ecol Letters 6:567–579.
Nardini A, Luglio J (2014) Leaf hydraulic capacity and drought vulnerability: possible trade‐offs and correlations with climate across three major biomes. Funct Ecol 28:810–818
Oren R, Sperry J, Katul GG et al. (1999) Survey and synthesis of intra- and interspecific variation in stomatal sensitivity to vapour pressure deficit. Plant Cell Environ 22:1515–1526.
Osnas JLD, Lichstein JW, Reich PB, Pacala SW (2013) Global leaf trait relationships: mass, area, and the leaf economics spectrum. Science 340:741–744.
Paquette A, Messier C (2011) The effect of biodiversity on tree productivity: from temperate to boreal forests. Global Ecol Biogeogr 20:170–180.
Patanè C (2011) Leaf area index, leaf transpiration and stomatal conductance as affected by soil water deficit and vpd in processing tomato in semi arid mediterranean climate. J Agron Crop Sci 197:165–176.
Perez-Harguindeguy N, Díaz S, Garnier E et al. (2013) New handbook for standardised measurement of plant functional traits worldwide. Aust J Bot 61:167–234.

25
Petchey O, Hector A, Gaston K (2004) How do different measures of functional diversity perform? Ecology 85:847–857.
Pontes LDS, Soussanna JF, Loualt F et al. (2007) Leaf traits affect the above‐ground productivity and quality of pasture grasses. Funct Ecol 21:844–853.
Poorter L (1999) Growth responses of 15 rain‐forest tree species to a light gradient: the relative importance of morphological and physiological traits. Funct Ecol 13:396–410.
Poorter L, Mcdonald I, Alarcón A et al. (2010) The importance of wood traits and hydraulic conductance for the performance and life history strategies of 42 rainforest tree species. New Phytol 185:481–492.
Poorter L, Plassche M, Willems S, Boot RGA (2004) Leaf traits and herbivory rates of tropical tree species differing in successional status. Plant Biology 6:746–754.
Pringle EG, Adams RI, Broadbent E et al. (2011) Distinct leaf-trait syndromes of evergreen and deciduous trees in a seasonally dry tropical forest. Biotropica 43:299–308.
Purvis A, Hector A (2000) Getting the measure of biodiversity. Nature 405:212–219. Qin F-F, Li Q, Cui Z-M et al. (2012) Leaf anatomical structures and ecological adaptabilities
to light of three alfalfa cultivars with different fall dormancies under shading during overwintering. Chin J Plant Ecol 36:333–345.
Reich PB (2014) The world‐wide “fast–slow” plant economics spectrum: a traits manifesto. J Ecol 102:275–301.
Reich PB, Ellsworth DS, Walters MB et al. (1999) Generality of leaf trait relationships: a test across six biomes. Ecology 80:1955–1969.
Reiss J, Bridle JR, Montoya JM, Woodward G (2009) Emerging horizons in biodiversity and ecosystem functioning research. Trends Ecol Evol 24:505–514.
Richards AE, Forrester DI, Bauhus J, Scherer-Lorenzen M (2010) The influence of mixed tree plantations on the nutrition of individual species: a review. Tree Physiol 30:1192–1208.
Ricotta C, Moretti M (2011) CWM and Rao's quadratic diversity: a unified framework for functional ecology. Oecologia 167:181–188.
Riederer M, Schreiber L (2001) Protecting against water loss: analysis of the barrier properties of plant cuticles. J Exp Bot 52:2023–2032.
Roscher C, Schumacher J, Gubsch M et al. (2012) Using plant functional traits to explain diversity-productivity relationships. PLOS ONE 7:e36760.
Sack L, Scoffoni C, John GP et al. (2013) How do leaf veins influence the worldwide leaf economic spectrum? Review and synthesis. J Exp Bot 64:4053–4080.
Sales-Come R, Hölscher D (2010) Variability and grouping of leaf traits in multi-species reforestation (Leyte, Philippines). Forest Ecol Manag 260:846–855.
Santiago LS, Goldstein G, Meinzer FC et al. (2004) Leaf photosynthetic traits scale with hydraulic conductivity and wood density in Panamanian forest canopy trees. Oecologia 140:543–550.
Schleuter D, Daufresne M, Massol F, Argillier C (2010) A user's guide to functional diversity indices. Ecosphere 80:469–484.
Schuepp PH (1993) Tansley review No. 59 Leaf boundary layers. New Phytol 125:477–507. Schuldt A, Assmann T, Bruelheide H et al. (2014) Functional and phylogenetic diversity of
woody plants drive herbivory in a highly diverse forest. New Phytol 202:864–873. Schulze E-D, Kelliher F, Körner C et al. (1994) Relationships among maximum stomatal
conductance, ecosystem surface conductance, carbon assimilation rate, and plant nitrogen nutrition: a global ecology scaling exercise. Ann Rev Ecol Syst 25:629–662.
Shipley B, Lechowicz MJ, Wright I, Reich PB (2006) Fundamental trade-offs generating the worldwide leaf economics spectrum. Ecology 87:535–541.

26
Slaton MR, Raymond Hunt E, Smith WK (2001) Estimating near-infrared leaf reflectance from leaf structural characteristics. Am J Bot 88:278–284.
Sobrado MA (1998) Hydraulic conductance and water potential differences inside leaves of tropical evergreen and deciduous species. Biol Plantarum 40:633–637.
Somavilla NS, Kolb RM, Rossatto DR (2014) Leaf anatomical traits corroborate the leaf economic spectrum: a case study with deciduous forest tree species. Braz J Bot 37:69–82.
Sperry J, Donelly J, Tyree MT (1988) A method for measuring hydraulic conductivity and embolism in xylem. Plant Cell Environ 11:35–40.
Sterck F, Markesteijn L, Schieving F, Poorter L (2011) Functional traits determine trade-offs and niches in a tropical forest community. PNAS 108:20627–20632.
Sterck FJ, Poorter L, Schieving F (2006) Leaf traits determine the growth-survival trade-off across rain forest tree species. Am Nat 167:758–765.
Taylor SE (1975) Optimal leaf form. In: Gates DM, Schmerl RB (Ed) Perspectives of biophysical ecology. Springer Berlin Heidelberg. pp 73–86.
Tilman D (1997) Distinguishing between the effects of species diversity and species composition. Oikos 80:185.
Tilman D (2001) Functional diversity. In: Levin SA (Ed) Encyclopedia of biodiversity. Academic Press, Oxford. pp 100–113.
Tobner CM, Paquette A, Reich PB et al. (2014) Advancing biodiversity–ecosystem functioning science using high-density tree-based experiments over functional diversity gradients. Oecologia 174:609–621.
Tyree MT, Sperry J (1989) Vulnerability of xylem to cavitation and embolism. Annu Rev Plant Biol 40:19–36.
Tyree MT, Zimmermann MH (2002) Xylem structure and the ascent of sap. Springer, New York, Dordrecht, Heidelberg, London.. 284 p.
Van Wittenberghe S, Adriaenssens S, Staelens J et al. (2012) Variability of stomatal conductance, leaf anatomy, and seasonal leaf wettability of young and adult European beech leaves along a vertical canopy gradient. Trees 26:1427–1438.
Vilà M, Carrillo-Gavilán A, Vayreda J et al. (2013) Disentangling biodiversity and climatic determinants of wood production. PLOS ONE 8:e53530.
Violle C, Navas M-L, Vile D et al. (2007) Let the concept of trait be functional! Oikos 116:882–892.
Vogelmann TC, Bornman JF, Yates DJ (1996) Focusing of light by leaf epidermal cells. Physiologia Plant 98:43–56.
Walker AP, Beckerman AP, Gu L et al. (2014) The relationship of leaf photosynthetic traits – Vcmax and Jmax – to leaf nitrogen, leaf phosphorus, and specific leaf area: a meta‐analysis and modeling study. Ecol Evol 4:3218–3235.
Wasilewska A, Vlad F, Sirichandra C et al. (2008) An update on abscisic acid signaling in plants and more ... Mol Plant 1:198–217.
White P, Broadley M (2003) Calcium in plants. Ann Bot-London 92:487–511. Wilkinson HP (1979) The plant surface (mainly leaf). In: Metcalfe CR, Chalk L (Ed)
Anatomy of the Dicotyledons. Clarendon Press, Oxford, pp 124–131. Wilson P, Thompson K, Hodgson J (1999) Specific leaf area and leaf dry matter content as
alternative predictors of plant strategies. New Phytol 143:155–162. Wright IJ, Reich PB, Westoby M et al. (2004) The worldwide leaf economics spectrum.
Nature 428:821–827. Wright JP, Sutton-Grier A (2012) Does the leaf economic spectrum hold within local species
pools across varying environmental conditions? Funct Ecol 26:1390–1398.

27
Wylie RB (1951) Principles of foliar organization shown by sun-shade leaves from ten species of deciduous dicotyledonous trees. Am J Bot 355–361.
Yang X, Bauhus J, Both S et al. (2013) Establishment success in a forest biodiversity and ecosystem functioning experiment in subtropical China (BEF-China). Eur J Forest Res 132:593–606.
Young B, Liang J, Chapin FS III (2011) Effects of species and tree size diversity on recruitment in the Alaskan boreal forest: a geospatial approach. Forest Ecol Manag 262:1608–1617.
Zhang J-L, Poorter L, Cao K-F (2012a) Productive leaf functional traits of Chinese savanna species. Plant Ecology 213:1449–1460.
Zhang Y, Chen HYH, Reich PB (2012b) Forest productivity increases with evenness, species richness and trait variation: a global meta-analysis. J Ecol 100:742–749.
Zhang Y-J, Meinzer FC, Qi J-H et al. (2013) Midday stomatal conductance is more related to stem rather than leaf water status in subtropical deciduous and evergreen broadleaf trees. Plant Cell Environ 36:149–158.

28

29
Chapter 2
TRANSPIRATION AND STOMATAL CONTROL: A CROSS-SPECIES STUDY
OF LEAF TRAITS IN 39 EVERGREEN AND DECIDUOUS BROADLEAVED
SUBTROPICAL TREE SPECIES
Wenzel Kröber & Helge Bruelheide
Trees (2014) 28:901-914

30

31
ORIGINAL PAPER
Transpiration and stomatal control: a cross-species study of leaftraits in 39 evergreen and deciduous broadleaved subtropical treespecies
Wenzel Krober • Helge Bruelheide
Received: 9 September 2013 / Revised: 22 January 2014 / Accepted: 5 March 2014 / Published online: 29 March 2014! Springer-Verlag Berlin Heidelberg 2014
AbstractKey message Using an extensive dataset for 39 sub-tropical broadleaved tree species, we found traits of theleaf economics spectrum to be linked to mean stomatalconductance but not to stomatal regulation.Abstract The aim of our study was to establish links
between stomatal control and functional leaf traits. Wehypothesized that mean and maximum stomatal conduc-
tance (gs) varies with the traits described by the leaf eco-
nomics spectrum, such as specific leaf area and leaf drymatter content, and that high gs values correspond to species
with tender leaves and high photosynthetic capacity. In
addition, we hypothesized that species with leaves of lowstomata density have more limited stomatal closure than
those with high stomata density. In order to account for
confounding site condition effects, we made use of a com-mon garden situation in which 39 deciduous and evergreen
species of the same age were grown in a biodiversity eco-
system functioning experiment in Jiangxi (China). Dailycourses of gs were measured with porometry, and the spe-
cies-specific gs*vpd relationships were modeled. Ourresults show that mean stomatal conductance can be pre-
dicted from leaf traits that represent the leaf economics
spectrum, with a positive relationship being related to leafnitrogen content and a negative relationship with the leaf
carbon: nitrogen ratio. In contrast, parameters of stomatal
control were related to traits unassociated with the leafeconomics spectrum. The maximum of the conduc-
tance*vpd curve was positively related to leaf carbon
content and vein length. The vpd at the point of inflection ofthe conductance*vpd curve was lower for species with
higher stomata density and higher for species with a high
leaf carbon content. Overall, stomata size and density as wellas vein length were more effective at explaining stomatal
regulation than traits used in the leaf economics spectrum.
Keywords BEF-China ! Biodiversity ecosystemfunctioning ! Leaf economics spectrum ! Leaf traits !Stomatal conductance ! Subtropics
Introduction
In higher terrestrial plants, transpiration and carbon
assimilation are intimately linked because plants cannotassimilate carbon without simultaneously losing water
(Jarvis and Davies 1998; Roelfsema and Hedrich 2005).
Stomatal conductance (gs) is strongly dependent on theenvironment and it is subject to diurnal changes that are
mainly driven by photosynthetically active photon flux
density (PPFD), ambient air temperature (Ta), and leaf-to-air vapor pressure deficit (vpd) (Waring and Landsberg
2011). For typical C3 plants, a diurnal course on a dry and
sunny day is described by stomata opening at sunrise, withmaximum conductance (gsmax) occurring in the early
morning, followed by stomatal closure at noon (Larcher
2003; Luttge and Hertel 2009). Stomatal opening is phys-iologically triggered by photosynthetically active radiation
Communicated by T. Grams.
W. Krober (&) ! H. BruelheideInstitute of Biology/Geobotany and Botanical Garden,Martin-Luther-University Halle-Wittenberg, Am Kirchtor 1,06108 Halle (Saale), Germanye-mail: [email protected]
H. BruelheideGerman Centre for Integrative Biodiversity Research (iDiv)Halle-Jena-Leipzig, Deutscher Platz 5e, 04103 Leipzig,Germany
123
Trees (2014) 28:901–914
DOI 10.1007/s00468-014-1004-3

32
or blue light (Roelfsema and Hedrich 2005) and stomatal
closure is induced by decreasing water potentials mediatedby abscisic acid (ABA) (Acharya and Assmann 2009).
When photon flux density regulatory mechanisms are
not limiting, the daily course of stomatal regulation is bestdescribed by gs*vpd curves (Jones 1998). Plants invari-
ably close stomata at high vpd to keep leaf water potentials
above a certain threshold of w to avoid cavitation of vesselsand inactivation of metabolic processes (Whitehead 1998).
As the threshold of w is highly species-specific (Jacobsenet al. 2007), species are also expected to differ in the shape
of their gs*vpd curves. It should be noted that vpd is not
the only driver of gs, as the same vpd on two different daysmight be associated with a different stomatal conductance
depending on the plant’s water status (Siegert and Levia
2011; Strobl et al. 2011). During spells of similar climaticconditions, however, vpd explains a large proportion of
variation in gs. As such, Oren et al. (1999) recommended
the use of a modified version of Lohammar’s function anda reference conductance at vpd = 1 kPa to derive stomatal
sensitivity from a linear regression of gs to ln(vpd). In their
analysis, they excluded gs values below 1 kPa, as undersuch conditions gs may not be measured with sufficient
accuracy, and low vpd often occurs when irradiance is low
(Martin et al. 1997). However, the inferred assumption of acontinuous decline of gs with increasing vpd beyond a
threshold of vpd = 1 kPa may be inaccurate for species
that reach gsmax only at vpd values higher than 1 kPa (pers.observation). Furthermore, Oren et al. (1999) noted that the
log-linear relationship bears the risk of predicting unreal-
istic vpd values at gs = 0, i.e., when stomata are fullyclosed. For these reasons, Leuning (1995) proposed to
apply a hyperbolic function to relate gs to vpd, while in
later studies, Eamus et al. (2008) used a 3-parameterpolynomial and Patane (2011) used a 3-parameter expo-
nential function to fit the gs*vpd relationship when
studying stomatal sensitivity in Eucalyptus haemastomaand Lycopersicon esculentum, respectively. However, not
all of these parameters are physiologically meaningful to
describe mechanistics, which is certainly desirable incomparative approaches across different species.
For the current study, we model gs*vpd curves by
regressing the logits of gs to gsmax in a generalized linearmodel on vpd and by using vpd in a quadratic regressor
term as a measure of vpd for which gs is down-regulated
with increasing vpd, and which allows for the derivation ofslopes and the point of inflection.
In addition to deriving parameters for stomata sensitiv-
ity, this approach can also be used to extract modeledvalues of gsmax and vpd at gsmax, both of which are key
parameters describing a plant’s basic hydraulic character-
istics (Choat et al. 2006; Franks et al. 2009; Van Witten-berghe et al. 2012).
Most of the earlier models on stomata responses were
developed to understand the carbon balance of leaves,single plants, and whole communities (e.g. Cowan 1982;
Leuning 1995; Oren et al. 1999). The key parameters of a
plant’s carbon balance are photosynthetic capacity (Amax)and the CO2 compensation point of assimilation in the
presence of dark respiration (Rdark). Wright et al. (2004)
found Amax and Rdark to be highly correlated to the leafeconomics spectrum, which describes the two opposing
strategies of either long-lived leaves with low mass-basedcarbon assimilation rates or short-lived leaves with high
photosynthetic capacity per leaf mass. The leaf economics
spectrum is characterized by increasing specific leaf area(SLA), leaf nitrogen (N), phosphorus (P) and cation con-
tent, and decreasing leaf dry matter content (LDMC) and
carbon to nitrogen ratios (CN). As maximum conductancegsmax is proportional to Amax (Wong et al. 1979; Santiago
and Kim 2009), —and mass-based Amax and Rdark covary
with the leaf economics spectrum, mainly because of theirproportionality to leaf area (Osnas et al. 2013)—gsmax
should also be related to the leaf economics spectrum.
While short-lived leaves with high mass-based Amax andrapid returns would be expected to have high stomatal
conductance, long-lived leaves with low mass-based car-
bon assimilation rates and low returns on carbon andnutrient investments should display low stomatal conduc-
tance. There is some support for such a relationship as
gsmax was found to be related to leaf N concentration(Schulze et al. 1994; Chaturvedi et al. 2013). In contrast,
Santiago and Kim (2009) did not find a correlation between
gs and SLA. Still, multi-species studies are rare, and thosethat have been conducted have not often made an attempt
to relate stomatal regulation to morphological or anatom-
ical traits. In any case, large species-specific differences instomatal conductance and stomatal regulation have been
described in the past (Jacobsen et al. 2008; Hiromi et al.
2012). Aasamaa and Sober (2011) compared stomatalsensitivities as a response to environmental factors in six
temperate deciduous tree species and found a link between
stomatal regulation and growth rates. Fast- and slow-growing species showed low and high stomatal sensitivity,
respectively. The ability to attain high values of stomatal
conductance has consequences at the whole plant level, asdemonstrated by Nardini and Salleo (2000) for 11 Medi-
terranean woody species that showed a positive relation-
ship between gsmax and shoot xylem hydraulicconductance. Using eight southeast Asian tree species,
Juhrbandt et al. (2004) tested whether leaf traits were
connected to maximal stomatal conductance. They foundthat leaf size and area-based leaf nitrogen content exhibited
the highest correlations to gsmax. Interestingly, they did not
encounter a significant relationship with SLA and only aweak one with leaf N per unit dry mass. Similarly, in a
902 Trees (2014) 28:901–914
123

33
study of 16 tree species from a species-rich, lowland dip-
terocarp forest, Sales-Come and Holscher (2010) foundgsmax to only be related to the corresponding carbon isotope
ratio d13C; the relationship with SLA only emerged when
the analysis was confined to dipterocarp species. All theseequivocal findings might be explained by the strong
dependence of gs on environmental conditions and, in
particular, vpd. This point was raised by Auge et al. (2000),who studied gs in 11 temperate deciduous tree species and
found environmental conditions such as vpd to be muchmore important than hydraulic and chemical traits. Thus, it
may be assumed that using the parameters of the gs*vpd
relationship provide more insight into the relationshipsbetween stomatal regulation and traits.
As the leaf economics spectrum also reflects the dif-
ference between deciduous and evergreen leaves, differ-ences in stomatal conductance would also be expected
between these two types of leaf habit. Indications for such
differences are already provided by Sobrado (1998), whostudied six tropical tree species and found gs to be higher in
deciduous than in evergreen species. Similarly, Zhang et al.
(2013) encountered higher midday gs in deciduous than inevergreen broadleaved tree species in a subtropical cloud
forest in Southwest China. The comparison of six shrub
and Chinese karst tree species by Liu et al. (2011) suggeststhat deciduous trees display more conservative stomatal
control, thus avoiding drought stress more effectively.
However, a more consistent understanding of how stomatalregulation might be related to leaf habit has not yet been
achieved.
While a relationship between mean gs or gsmax and traitsof the leaf economics spectrum may be expected, values of
vpd at gsmax or at the point of inflection may alternatively
be related to stomata size or stomata density, not leastbecause stomata density is generally thought to be posi-
tively related to a plant’s ability to regulate transpiration
(Carpenter and Smith 1975). Some evidence does, how-ever, indicate that stomata size and density are independent
from the traits that define the leaf economics spectrum,
e.g., in a study of 120 subtropical species, Krober et al.(2012) found that stomata density was inversely related to
stomata size in a principal component analysis (PCA) and
that the stomata density-stomata size axis was perpendic-ular to the axis of the leaf economics spectrum. However,
there is only indirect evidence to suggest a relationship
between stomata density and gs. Miyazawa et al. (2006)manipulated stomatal density by exposing poplars to
increased CO2 concentrations, which resulted in reduced
stomatal density, stomatal index (i.e., the ratio of stomatanumber to leaf epidermal cell number), and level of gs.
Comparing stomatal control mechanisms across different
tree species requires the use of a common environment thathosts trees of similar size and age, such as that encountered
in a dendrological garden or in common garden situations
such as those found in the tree plantations of biodiversity-ecosystem functioning (BEF) experiments. BEF-China
represents the largest of these BEF experiments (Bruelhe-
ide et al. 2014); with a species pool of 40 tree speciescomprising an equal amount of deciduous and evergreen
trees (Yang et al. 2013), it offers an ideal site on which to
study species-specific differences in stomatal control.Comparing 39 species in a common garden situation, we
hypothesized that (1) conductance parameters would belinked to leaf traits represented in the leaf economics
spectrum. In particular, we expected mean gs and gsmax to
be positively related to specific leaf area (SLA) and leafnitrogen content (N), but negatively related to the leaf
carbon to nitrogen ratio (CN). In accordance, we addi-
tionally hypothesized that (2) evergreen species woulddisplay lower mean gs and gsmax values than deciduous
species and that (3) traits related to stomata, such as sto-
mata density or stomata size, would describe additionalcharacteristics of stomatal control that are not captured by
the leaf economics spectrum. Specifically, we expected
species with a high density of stomata to be able to toleratehigh vpd, and thus show higher vpd values at gsmax or at the
point of inflection of the gs*vpd curve.
Materials and methods
Study site and project design
The study was carried out in the BEF China project inSoutheast China, Jiangxi Province (http://www.bef-china.
de). For the project, a total of 219,000 trees belonging to 42
different species were planted as saplings in 2008 and 2009on a net area of 38 ha (Yang et al. 2013). The resulting
diversity gradient spans six different levels of tree species
richness, ranging from monocultures up to 24 tree speciesper plot. The tree species represent typical elements of the
regional subtropical broadleaved forest. Leaf phenology
type is equally distributed between evergreen and decidu-ous species (for species names see Table 1). A detailed
description of the establishment procedure is given by
Yang et al. (2013). The study site is located within sub-tropical China and the natural vegetation type is broad-
leaved laurophyllous mixed forest. Mean annual tempera-
ture is 16.7 !C and mean annual precipitation is 1,821 mm(mean from 1971 to 2000, Yang et al. 2013).
Measurement design
We randomly selected 12 high-diversity plots, each con-
taining 16 or 24 species, which allowed us to compare asmany species as possible across relatively short distances
Trees (2014) 28:901–914 903
123

34
and in a monogamous topographical setting. The sampling
number per plot ranged between 11 and 23 species as notall planted species were represented with full-grown indi-
viduals in every plot. In total, we took 3,290 measurements
of stomatal conductance in leaf tissue of 218 individualsfrom 39 distinct species, with 3 to 13 individuals being
sampled per species.
Measurements of stomatal conductance
We recorded daily courses of stomatal conductance for allspecies in a particular plot by taking repeated measure-
ments on the same leaf from the same individual. Fig-
ure 1 presents the results from five daily courses. Eachsampled leaf was fully developed, undamaged, and fully
Table 1 Tree species plantedin the BEF-China experimentand included in this study
Species names are inaccordance with nomenclaturein The Flora of China (http://flora.huh.harvard.edu/china)
d deciduous, e evergreen
Species name Family Abbreviation Leafhabit
Acer davidii Franch. Aceraceae Ad d
Ailanthus altissima (Miller) Swingle Simaroubaceae Aa d
Alniphyllum fortunei (Hemsl.) Makino Styracaceae Af d
Betula luminifera Winkl. Betulaceae Bl d
Castanopsis eyrei (Champion ex Bentham) Tutcher Fagaceae Ce e
Castanopsis fargesii Franch. Fagaceae Cf e
Castanea henryi (Skan) Rehd. et Wils. Fagaceae Ch d
Castanopsis sclerophylla (Lindley & Paxton) Schottky Fagaceae Cs e
Celtis biondii Pamp. Cannabaceae Cb d
Choerospondias axillaris (Roxb.) Burtt et Hill Anacardiaceae Ca d
Cinnamomum camphora (Linn.) Presl Lauraceae Cc e
Cyclobalanopsis glauca (Thunberg) Oersted Fagaceae Cg e
Cyclobalanopsis myrsinifolia (Blume) Oersted Fagaceae Cm e
Daphniphyllum oldhamii (Hemsl.) Rosenthal Daphniphyllaceae Do e
Diospyros japonica Siebold & Zuccarini Ebenaceae Dj d
Elaeocarpus chinensis (Gardn. et Chanp.) Hook. f. exBenth.
Elaeocarpaceae Ec e
Elaeocarpus glabripetalus Merr. Elaeocarpaceae Eg e
Elaeocarpus japonicus Sieb. et Zucc. Elaeocarpaceae Ej e
Idesia polycarpa Maxim. Flacourtiaceae Ip d
Koelreuteria bipinnata Franch. Sapindaceae Kb d
Liquidambar formosana Hance Altingiaceae Lf d
Lithocarpus glaber (Thunb.) Nakai Fagaceae Lg e
Machilus grijsii Hance Lauraceae Mg e
Machilus leptophylla Hand.-Mazz. Lauraceae Ml e
Machilus thunbergii Sieb. et Zucc. Lauraceae Mt e
Manglietia fordiana (Oliver) HuY.W.Law Magnoliaceae Manf e
Melia azedarach Linn. Meliaceae Ma d
Meliosma flexuosa Blume Sabiaceae Mf d
Nyssa sinensis Oliver Nyssaceae Ns d
Phoebe bournei (Hemsl.) Yen C. Yang, Lauraceae Pb e
Quercus acutissima Carruthers Fagaceae Qa d
Quercus fabri Hance Fagaceae Qf d
Quercus phillyreoides A. Gray Fagaceae Qp e
Quercus serrata Murray Fagaceae Qs d
Rhus chinensis Mill. Anacardiaceae Rc d
Sapindus saponaria Linn. Sapindaceae Sd d
Triadica cochinchinensis Loureiro Euphorbiaceae Sm d
Triadica sebifera (L.) Small Euphorbiaceae Ss d
Schima superba Gardn. et Champ. Theaceae Schs e
904 Trees (2014) 28:901–914
123

35
exposed to the sun each day, and leaves were marked
with colored plastic ties to ensure the same leaf wasmeasured each day. To provide comparable environmental
conditions, all measurements were taken in summer dur-
ing dry spells and only on sunny days. Stomatal con-ductance was measured using an SC1 porometer
(Decagon), which is based on steady-state technology. It
measures the gradient of relative humidity at two dis-tances from the leaf and then calculates vapor flux from
the stomata and stomatal conductance per area and time.
Only stomatal conductance of the abaxial leaf side wasmeasured as none of the species displayed adaxial sto-
mata. For each measurement of stomatal conductance, we
also recorded air temperature and relative humidity usinga T2 thermo-hygrometer (Trotec) as well as photosyn-
thetically active photon flux density (PPFD) using a
HD2102.2 PAR Logger (DELTA OHM). The field studiestook place in August to October 2010, May/June 2011
and August to October 2011 and only included continuous
periods of sunny days to ensure radiation was not limitingphotosynthesis and stomatal conductance. There were
only 154 and 347 measurements with a PPFD \300 and
\500 lmol m-2 s-1, respectively, out of the total of
3,290 measurements. However, we made sure that theselow-light values did not affect our findings by calculating
the parameters of stomatal control (see below) by both
using the full data set of available measurements and onlythose taken at PPFD [300 and [500 lmol m-2 s-1.
Measurement of leaf traits
We measured 19 leaf traits (see Table 2 for a complete list
including abbreviations) following the protocols of Cor-nelissen et al. (2003) unless stated otherwise. We classified
these traits across five groups: (1) categorical leaf type: leaf
margin (LeafMar), leaf pinnation (LeafPin), leaf habit(LeafHabit), and extrafloral nectaries (ExtfloNec); (2)
quantitative leaf traits: leaf area (LA), leaf toughness (LT),
specific leaf area (SLA), and leaf dry matter content(LDMC); (3) leaf element content: leaf calcium content
(Ca), leaf magnesium content (Mg), leaf potassium content
(K), leaf carbon content (LCC), and leaf nitrogen content(LNC); (4) stomata-related traits: stomata density (Sto-
Dens), stomata width (StoW), stomata length (StoL), and
Fig. 1 Daily course ofa stomatal conductance (gs),b vapor pressure deficit (vpd),and c Photosynthetically activephoton flux density (PPFD).Symbols refer to one individualeach of five different species(Castanea henryi, Schimasuperba, Liquidambarformosana, Castanopsis eyrei,and Lithocarpus glaber),measured on five different days.Values from the same specieswere measured on the same leafof the same individual on thesame day. The smoothing lineswere obtained by applying theloess function, a localpolynomial regression fittingfunction
Trees (2014) 28:901–914 905
123

36
(5) quantitative leaf vein traits: diameter of veins of first
order (DiamVein1), diameter of veins of second order(DiamVeins2), and vein length (VeinLength). Vein length
was determined as the total length of first order veins in an
area of 1 cm2. From these measurements we calculated afurther three traits: stomata size (StoSize), stomata index
(StoInd), and carbon to nitrogen ratio (CN). We computed
stomata size from stomata length and stomata width,assuming an elliptic stomata shape. Stomata index was
computed as the product of stomata size and stomatadensity.
Five leaves from five individuals were sampled per
species and measured for leaf area, leaf fresh weight, leafdry weight, leaf nitrogen content, and leaf carbon content
(elementar vario EL). We also calculated specific leaf area,
leaf dry matter content, and carbon to nitrogen ratio. Leafcalcium, potassium, and magnesium content were analyzed
by means of atom absorption spectrometry (AAS vario 6
analytik jena) for a set of 15 leaves per species (threeindividuals per species). Leaf vein patterns were analyzed
according to modified methods described in Sack and Frole
(2006), and stomata traits were assessed following theprotocols of Gerlach (1984). Stomata were counted on
three leaves from three individuals per species on a mini-
mum of 50,000 mm2. Length and width were measured onthree stomata per replicate and stomata density was
expressed as stomata number per mm2. The observation
was done with a light-optical microscope (Zeiss Axioskop
2 plus) and image analysis was carried out using the Axio
Vision (Version 3.0) software. Data for stomatal density,length, and width of the guard cells were collected from the
same leaves on which stomatal conductance was measured
during the field campaigns.Extra sets of 30 leaves originating from three indi-
viduals per species were used for measuring leaf tough-
ness. Leaf toughness was measured as leaf tensilestrength, using a modified tearing apparatus, developed
and based on the descriptions of Hendry and Grime(1993). A fragment of 5 mm width was cut from the
central part of each leaf (not including the midrib) along
the longitudinal axis, which did not include main veins.This fragment was then positioned between the two
clamps in the tearing apparatus. The two clamps, steered
by an external wheel, tore apart the leaf fragment until itruptured. A spring balance showed the maximal force
needed to rupture the leaf fragment. All traits were
assessed for all species with the same number of repli-cates per species. In addition, we determined the presence
of leaf pinnation, entire leaf margin, and extrafloral nec-
taries. Leaf habit was compiled from The Flora of China(http://flora.huh.harvard.edu/china).
Statistical analyses
We analyzed the relationship of gs to vpd by non-linear
regression. Vpd was derived from air temperature and
Table 2 List of the leaf traitsmeasured across the 39 treespecies
All traits were assessed on theindividuals planted in theexperiment. The table includesthe trait abbreviations (code)used throughout the text
Code Trait Analytical technique Type Units/categories
LeafHabit Leaf habit Literature Binary (0) evergreen; (1)deciduous
LeafPin Leaf pinnation Field observation Binary (0) pinnate; (1) simple
LeafMar Leaf margin Field observation Binary (0) dentate; (1) entire
ExtfloNec Extrafloral nectaries Field observation Binary (0) no; (1) yes
LA Leaf area Scanner Continuous mm2
LDMC Leaf dry matter content Balance Continuous mg g-1
SLA Specific leaf area Scanner, balance Continuous m2 kg-1
LT Leaf toughness Leaf toughness device Continuous N mm-1
StoDens Stomata density Microscopy Continuous 1 mm-2
StoSize Stomata size Microscopy Continuous lm2
StoInd Stomata index Microscopy Continuous Ratio
LNC Leaf nitrogen content CN analyzer Continuous mg g-1
LCC Leaf carbon content CN analyzer Continuous mg g-1
CN Carbon to nitrogen ratio CN analyzer Continuous g g-1
Ca Leaf calcium content AAS analyzer Continuous mg g-1
K Leaf potassium content AAS analyzer Continuous mg g-1
Mg Leaf magnesium content AAS analyzer Continuous mg g-1
Diamvein1 Diameter veins 1st order Scanner Continuous cm
Diamvein2 Diameter veins 2nd order Scanner Continuous cm
VeinLength Length of veins in 1 mm2 Scanner Continuous cm cm-2
906 Trees (2014) 28:901–914
123

37
relative humidity following the August-Roche Magnus
formula (Murray 1967):
es Tð Þ ¼ 6:109417:625T=ðTþ243:04Þ;
where es = saturation water vapor pressure (hPa), andT = temperature (!C)
For every measurement of gs, we obtained a vpd value
(Fig. 1b). Then, for each species, all gs data were plottedagainst vpd (Fig. 2a). This allowed us to combine the data
from several days into one analysis. We then determined
maximum stomatal conductance (ConMax) and vpd atConMax (VpdMax) for all species. As VpdMax is the
actually measured vpd at maximum stomatal conductance
it may represent a threshold of vpd, at which the specificindividual is limiting stomatal conductance due to high
vpd. In addition, we calculated the mean of all conductance
measurements per species (ConMean, Fig. 2a). Stomatalconductance data were then scaled per species by dividing
observed values through the maximum value observed for
that species (gs/gsmax). For each species, we regressed thelogits of gs/gsmax to vpd and the quadratic term of vpd using
a generalized linear model with a binomial error distribu-
tion (a, b and c represent regression parameters):
lngs
gsmax
! "¼ a vpd2 þ b vpdþ c
Using the logits instead of regressing gs directly to vpd
made sure that modeled maximum values (ConMaxfit) didnot exceed gsmax and that gs approached 0 at high vpd.
From the model obtained, we derived conductance and
vpd values for the following two points: (1) conductanceand vpd at the maximum of the model: (ConMaxfit) and
(VpdMaxfit), and (2) vpd at the second point of inflection
of the curve: (VpdPoi, Fig. 2b). VpdPoi can be interpreted
as the sensitivity of stomatal control, as lower valuesindicate less pronounced stomata closure.
All parameters derived from the gs*vpd curves were
correlated to the species’ traits in a PCA employing theFactoMineR package in R (http://cran.r-project.org/web/
packages/FactoMineR/index.html). We employed linear
models to test for bivariate relationships between themodeled parameters and means of leaf traits. The calcu-
lations were done with all measurements obtained. To
exclude the possibility that low light values affected sto-matal conductance, we repeated all measurements using
only those taken at PPFD [300 and [500 lmol m-2 s-1.
For all statistical analyses, we used the software R version3.0.0 (R Core Team 2013).
Results
Maximum stomatal conductance gsmax ranged between850.3 and 2,979.5 mmol m-2 s-1 for Cyclobalanopsis
myrsinifolia and Elaeocarpus japonicus, respectively.
Mean stomatal conductance (gs) varied from 1,221.8 to291.4 mmol m-2 s-1 and was closely linked to maximum
stomatal conductance values gsmax (r2 = 0.66, p \ 0.0001,
n = 39). Figure 2 shows an example of how the relation-ship of stomatal conductance to vpd was modeled.
To compare differences in stomatal conductance and
stomata regulation, the regression lines of all models of allspecies were transposed into one graph (Fig. 3). There
were no significant differences in any conductance
Fig. 2 Stomatal conductance as a function of vapor pressure deficit(vpd), taking Liquidambar formosana as an example. Circles showthe observed values. a Absolute stomatal conductance (gs) data wereused to calculate maximum stomatal conductance and the vpd atmaximum stomatal conductance as well as mean stomatal conduc-tance. b Stomatal conductance was scaled by dividing gs by the
maximum stomatal conductance. The regression line was obtained byregressing the logits of gs/gsmax to vpd and the quadratic term of vpdusing a generalized linear model with a binomial error distribution.The physiological parameters of stomata control obtained from thisregression are shown as dots
Trees (2014) 28:901–914 907
123

38
parameter between deciduous and evergreen species
(Table 3).
For the PCA, 28 leaf traits were used to ordinate the 39species. The first three axes explained 46.55 % of the total
variance, with eigenvalues of 5.51, 3.87 and 3.68 being
produced, respectively. As traits representing the leafeconomics spectrum, LNC, LeafHabit, and SLA correlated
strongly with the first PCA axis (Fig. 4a; digital Appendix
Table 5). Positive loadings on the first axis decreased inimportance from LA, Mg, ExtfloNec to Ca. Negative
loadings on the first axis included CN, LT, LeafPin, LCC,and VeinLength. The second axis was mainly characterized
by stomata-related traits with StoW, StoSize and StoL
showing positive loadings, and StoInd and StoDensshowing negative loadings. The two physiological param-
eters ConMax and ConMean showed similar positive
loadings on all three axes. The extracted physiologicalparameters ConMaxfit, VpdMaxfit, and VpdPoi showed
strong loadings on the third axis (Fig. 4b). VpdMax dis-
played lesser loadings on all three axes. In the PCA, therange of species formed two clear groups on the first axis
according to leaf habit (see Fig. 4c). No clear pattern in
leaf habit was apparent for the second and the third axes(Fig. 4c, d; digital Appendix Table 6).
We found several leaf traits to be significantly related to
physiological parameters of stomatal control (Table 4).Mean conductivity (ConMean) was positively and nega-
tively related to leaf nitrogen content (LNC), and leafcarbon to nitrogen ratio (CN), respectively (Fig. 5a, b). The
maximum of modeled conductances (ConMaxfit) was
positively related to leaf carbon content (LCC) and veinlength (Fig. 6a, b). Vpd at maximum conductance (Vpd-
Maxfit) showed a negative correlation with specific leaf
area (SLA) and stomata size (Fig. 7a, b) and a negativecorrelation with LCC (Fig. 7c). Vpd at the point of
inflection (VpdPoi) significantly decreased with stomata
density and stomata index (Fig. 8a, b) and increased withLCC (Fig. 8c). No relationships were recorded for any of
the morphological leaf traits for maximum conductance
(ConMax). We obtained essentially the same significantrelationships when only using the measurements taken at
PPFD [300 lmol m-2 s-1 (data not shown). The only
difference was that ConMaxfit was no longer significantlyrelated to vein length (Table 4). When taking only mea-
surements at PPFD [500 lmol m-2 s-1, four further
relationships were lost. However, ConMean was still sig-nificantly related to LNC and CN, ConMaxfit to LCC, and
VpdPoi to stomata index and LCC (data not shown).
Discussion
Our study covering 39 subtropical tree species revealed clear
relationships between the parameters of stomatal control and
other important functional leaf traits. As stomatal conduc-tance under field situations is potentially influenced by a
number of confounding environmental variables, our
approach of modeling gs*vpd curves by regressing the
Fig. 3 Regression lines of models of stomatal conductance as afunction of vapor pressure deficit (vpd) for all 39 species included inthe study. Evergreen species are shown in black, deciduous speciesshown in red
Table 3 Mean values (±standard deviation) for the parameters of stomatal control for deciduous and evergreen leaf habit
Parameter of stomatal conductance Mean deciduous Mean evergreen SD deciduous SD evergreen F value p
ConMean (mmol m2 s-1) 749.8 699.4 243.1 188.1 0.5106 0.4794
ConMax (mmol m2 s-1) 2,107.2 2,081.2 519.8 574 0.22 0.8828
VpdMax (hPa) 22.2 23.6 5.1 5.7 0.6868 0.4126
ConMaxfit 0.4439 0.4113 0.09802 0.05157 1.6221 0.2107
VpdMaxfit (hPa) 21.7 24.4 5.8 4.9 2.3164 0.1365
VpdPoi (hPa) 43.43 46.85 10.4 8.8 1.2037 0.2797
ConMaxfit is a relative unit, obtained from relating gs to gsmax. F and p values refer to a one-factorial ANOVA comparing the mean values, with37 degrees of freedom
908 Trees (2014) 28:901–914
123

39
Fig. 4 Principal componentanalysis (PCA) biplots showingthe relationships between themean values of all chemical andmorphological leaf traits (greenarrows) and all parameters ofstomatal regulation (bluearrows). a, c PCA axes 1 and 2,b, d PCA axes 1 and 3. a,b Loadings of the differenttraits. Eigenvalues: axis1 = 5.51, axis 2 = 3.87, axis3 = 3.68, with cumulativeproportion of explained inertia21.0, 34.5, and 46.5 %,respectively. See Table 2 forabbreviations of trait names. c,d Species scores in the PCAshown separately by leafhabit.Evergreen species are shown inblack and deciduous in red. SeeTable 1 for abbreviations ofspecies names
Table 4 Correlation matrixbetween the leaf traits and theparameters of stomatal control
The correlations were calculatedfrom linear model analysisbetween functional leaf traitsand the extracted physiologicalparameters. Significantrelationships are shown in boldletters
ConMean mean gs, ConMaxmean gsmax, VpdMax vpd atgsmax, ConMaxfit modeledgsmax, VpdMaxfit vpd atmodeled gsmax, VpdPoi vpd atthe point of inflection of thegs*vpd curve
ConMean ConMax VpdMax ConMaxfit VpdMaxfit VpdPoi
r p r p r p r p r p r p
LA 0.16 0.33 0.10 0.56 0.09 0.57 0.19 0.24 0.22 0.18 0.28 0.09
LDMC -0.20 0.21 -0.30 0.06 0.01 0.97 0.18 0.28 0.04 0.83 -0.04 0.82
SLA -0.21 0.20 -0.27 0.10 0.09 0.58 -0.04 0.79 -0.40 0.01 -0.26 0.11
LT -0.23 0.15 -0.18 0.26 0.12 0.45 -0.15 0.37 0.13 0.43 0.09 0.58
StoDens -0.29 0.08 -0.23 0.17 0.06 0.72 -0.04 0.81 -0.22 0.18 -0.33 0.04
StoSize 0.07 0.69 0.05 0.77 -0.16 0.34 -0.11 0.49 -0.33 0.04 -0.16 0.34
StoInd -0.21 0.20 -0.18 0.28 0.03 0.83 -0.01 0.95 -0.29 0.07 -0.35 0.03
LNC 0.32 0.05 0.18 0.28 0.25 0.12 0.26 0.12 -0.15 0.37 0.05 0.78
LCC 0.08 0.61 -0.10 0.53 0.06 0.71 0.33 0.04 0.36 0.02 0.37 0.02
CN -0.32 0.05 -0.21 0.20 -0.23 0.15 -0.22 0.19 0.24 0.14 0.09 0.60
Ca -0.09 0.58 0.06 0.73 -0.12 0.46 -0.07 0.66 -0.09 0.58 -0.14 0.39
K 0.04 0.81 0.14 0.38 0.03 0.84 -0.20 0.23 -0.06 0.72 0.13 0.42
Mg 0.00 0.98 0.09 0.60 -0.11 0.52 -0.03 0.86 -0.10 0.56 -0.11 0.51
DiamVein1 0.10 0.55 0.18 0.28 0.05 0.75 -0.05 0.76 -0.06 0.70 -0.01 0.97
DiamVein2 0.20 0.22 0.27 0.10 0.02 0.92 0.10 0.57 0.07 0.67 0.10 0.55
VeinLength 0.15 0.37 -0.01 0.94 -0.10 0.55 0.34 0.04 0.03 0.86 -0.04 0.82
Trees (2014) 28:901–914 909
123

40
logits of gs to gsmax on vpd in a generalized linear model andthen testing the parameters from the regression for trait
relationships revealed patterns that had not previously been
encountered. We were also able to eliminate a large pro-portion of environmental noise using the experimental
setting of a common garden situation, with sampling ses-sions only being conducted on sunny days and multitude
species being measured on the same day. However, using
field data cannot fully exclude that our modeled gs*vpdrelationship might have been affected by PPFD, as under
Fig. 5 Mean stomatalconductance (ConMean) as afunction of a leaf nitrogencontent and b leaf carbon tonitrogen ratio
Fig. 6 Maximum of modeledstomatal conductance(ConMaxfit) as a function ofa leaf carbon content and b veinlength
Fig. 7 Vapor pressure deficit (vpd) at the maximum modeled conductance (VpdMaxfit) as a function of a specific leaf area, b stomata size, andc leaf carbon content
910 Trees (2014) 28:901–914
123

41
field conditions PPFD covaries with vpd. Confining our
analyses to values taken at PPFD [300 and
[500 lmol m-2 s-1 did not fundamentally change ourresults. At these PPFD values many of our study species
have reached 70–80 or[90 % of Amax, as was shown by Liu
et al. (2012) for, e.g., Schima superba and Castanopsis spec.The results partly confirm our first hypothesis of a link
between conductance parameters and leaf traits of the leaf
economics spectrum, as the mean and modeled maximumstomatal conductance showed significant relationships with
particular leaf traits. Although mean gs and gsmax were not
related to SLA as hypothesized, we encountered a positivecorrelation between gs and gsmax and leaf nitrogen content,
and a negative correlation with the leaf carbon to nitrogen
ratio. The positive correlation of stomatal conductance andleaf nitrogen content is in accordance with the global
review of Schulze et al. (1994), who found clear links
between leaf nitrogen content and gsmax. Similarly, ourresults confirm those of Juhrbandt et al. (2004), who
reported significant relationships between gsmax and leaf
area and leaf nitrogen content. As in our study, the authorsdid not find a relationship between gs or gsmax and SLA,
leaf potassium content or leaf calcium content. Elsewhere,
Poorter and Bongers (2006) reported a close link betweengs and the main traits represented by the leaf economics
spectrum, with gs decreasing with increasing leaf lifespan.
In our study, the link between mean conductanceparameters and SLA, leaf carbon and nitrogen content
explains the clear segregation of deciduous and evergreen
species encountered on the first PCA axis. However, oursecond hypothesis suggesting differences between decid-
uous and evergreen species could not be confirmed by a
direct statistical comparison for any parameter of stomatacontrol, although the tendency was the same as in the
PCA. The missing statistical segregation between species
of evergreen and deciduous leaf habit is explained by the
high variance of all parameters and traits observed within
the two groups and suggests that leaf habit is a poor
predictor for traits on the leaf economics spectrum. In acomparative study, Brodribb and Holbrook (2005) pro-
posed that leaf habit and leaf physiological strategies are
not necessarily linked, and they further suggested that awide range of combinations of functional traits are pos-
sible within both the deciduous and evergreen leaf habit.
We also found support for our third hypothesis sug-gesting additional characteristics of stomatal control are
related to stomata density and stomata size. Species with
large stomata displayed low values of vpd at maximumconductance (VpdMaxfit). This finding is a hint that not all
physiologically meaningful information is captured by the
leaf economics spectrum. However, somewhat surpris-ingly, species with high stomata density and high stomata
index showed low values of vpd at the point of inflection of
the gs*vpd curve.In a leaf trait study on 53 rainforest species, Poorter and
Bongers (2006) successfully predicted plant performance
variables such as growth, survival, and light requirements. Intheir analysis, they demonstrated close coordination between
various leaf traits, including physiological parameters such
as stomatal conductance and the slow–fast continuum ofnutrient investment in leaves. We only found studies that
describe a positive relationship between stomata size and
stomatal conductance (Aasamaa et al. 2001; Camposeo et al.2011), suggesting that stomatal control may not be invariably
related to important functional leaf traits, a view echoed by
Wright and Sutton-Grier (2012), who further emphasize thelimited explanatory power of the leaf economics spectrum in
relation to their two greenhouse experiments.
Some physiological characteristics may, therefore, berelated to stomata size and density, and smaller stomata
have indeed been found to confer increased water-use
efficiency in plants, as they allow for a quicker response to
Fig. 8 Vapor pressure deficit (vpd) at the point of inflection of the gs*vpd curve (VpdPoi) as a function of a stomata density, b stomata index,and c leaf carbon content
Trees (2014) 28:901–914 911
123

42
changing vpd (Cowan and Farquhar 1977; Hetherington
and Woodward 2003; Franks and Farquhar 2007). In con-sequence, leaves with small stomata would allow for more
fine-tuning of stomata control, and thus, would allow
species to operate closer to the physiological limit at highvpd. With smaller stomata, plants may also be able to avoid
xylem embolisms more effectively (Franks and Beerling
2009). Size and frequency of stomata may, therefore, bekey parameters in terms of plant adaptation to prevailing
environmental conditions.Consistent with the findings of our study, Franks found
stomata size and density to be inversely related (Franks and
Beerling 2009), and Franks et al. (2009) found a similarrelationship between density and stomatal pore length. In a
paleobotanical context, Franks and Beerling (2009)
showed that this negative relationship accounted forchanges in global CO2 levels. In paleobotany, stomatal
density is considered a valid predictor for past CO2 con-
centrations, as higher CO2 concentrations result in lowerstomatal density (Van Der Burgh et al. 1993; Mcelwain
2004; van Hoof et al. 2006). Franks et al. (2009) modeled
different combinations of stomatal density and stomatalsize and found that smaller stomatal size in combination
with higher stomatal density was related to higher gsmax.
Accordingly, Willmer and Fricker (1996) found that manyspecies with high densities of small stomata are capable of
very high stomatal conductance. The relationships
between stomatal density and size are also encounteredwithin single species. For example, Franks et al. (2009)
described a trade-off between stomatal density and size
within a single species (Eucalyptus globulus) and con-cluded that this trade-off limited the plasticity of gsmax in
the species. In addition, Miyazawa et al. (2006) studied the
stomatal development of new leaves in poplar trees andfound a positive relationship between gs and stomatal
index.
Conclusion
In conclusion, our study confirms the close link between
stomatal conductance and traits aggregated in the leaf
economics spectrum. However, we also demonstrate thatthe leaf economics spectrum does not capture all
information and aspects of stomatal regulation and that
additional information can be derived from the modeledparameters of the conductance *vpd curve. Further-
more, leaf traits such as stomata size, density, and index
as well as vein length may serve as simple proxies forsome of these parameters and thus might confer addi-
tional information in comparative studies on plant
functional traits.
Acknowledgments We are indebted to Xuefei Yang, Sabine Both,Lin Chen and Kaitian Wang for coordinating the fieldwork estab-lishing the BEF-China experiment. We are also grateful to the wholeBEF-China research group for their general support. BEF-China ismainly funded by the German Research Foundation (DFG FOR 891/1and 2) and funding for this particular project was provided by theGerman Research Foundation to H.B. (DFG BR 1698/9-2). We arealso thankful for the travel grants and summer schools financed by theSino-German Centre for Research Promotion in Beijing (GZ 524,592, 698, 699 and 785). In addition we would like to thank Isa Plath,David Eichenberg, Michael Staab, Katja Grotius, Silvana Tornack,Heike Heklau, Lin Chen, and Shouren Zhang for their support in thefield and in the lab.
Conflict of interest The authors declare that they have no conflictof interest.
Appendix
See Tables 5 and 6
Table 5 Loadings of traits in the principal components analysis(PCA)
Traits Dim.1 Dim.2 Dim.3 Dim.4 Dim.5
ExtfloNec 0.64 0.21 0.11 0.10 0.20
LA 0.67 -0.09 0.34 0.02 -0.51
LDMC -0.50 -0.60 -0.03 0.38 -0.02
SLA 0.44 0.05 -0.48 -0.34 -0.05
LT -0.78 0.03 0.19 -0.03 0.08
ConMean 0.35 0.31 0.39 0.62 0.38
ConMax 0.31 0.30 0.28 0.36 0.50
VpdMax -0.03 -0.20 0.15 -0.23 -0.32
ConMaxfit 0.17 -0.10 0.35 0.56 -0.03
VpdMaxfit -0.08 -0.05 0.84 0.04 -0.11
VpdPoi 0.02 0.10 0.73 -0.01 -0.25
StoL 0.03 0.72 -0.46 0.27 -0.31
StoW -0.28 0.72 -0.38 0.27 -0.22
StoSize -0.10 0.75 -0.44 0.28 -0.29
StoInd -0.16 -0.63 -0.52 0.38 -0.06
StoDens -0.11 -0.83 -0.40 0.18 0.02
LNC 0.74 -0.09 -0.09 0.33 -0.09
LCC -0.30 0.15 0.56 0.10 -0.14
CN -0.74 0.13 0.21 -0.32 -0.04
Ca 0.45 -0.33 0.02 -0.25 -0.03
K 0.47 0.29 -0.09 -0.25 0.05
Mg 0.65 0.02 -0.06 -0.37 -0.06
DiamVein1 0.32 0.09 0.03 -0.11 0.41
DiamVein2 0.21 -0.18 -0.02 0.13 0.61
VeinLength -0.28 -0.08 0.02 0.62 -0.24
LeafHab 0.75 -0.20 -0.31 0.16 -0.10
LeafPin -0.60 0.18 -0.44 -0.03 0.46
LeafMar -0.14 0.37 0.14 -0.26 0.33
See Table 2 for full trait names
912 Trees (2014) 28:901–914
123

43
References
Aasamaa K, Sober A (2011) Stomatal sensitivities to changes in leafwater potential, air humidity, CO2 concentration and lightintensity, and the effect of abscisic acid on the sensitivities in sixtemperate deciduous tree species. Environ Exp Bot 71:72–78
Aasamaa K, Sober A, Rahi M (2001) Leaf anatomical characteristicsassociated with shoot hydraulic conductance, stomatal conductance
and stomatal sensitivity to changes of leaf water status in temperatedeciduous trees. Aust J Plant Physiol 28:765–774
Acharya BR, Assmann SM (2009) Hormone interactions in stomatalfunction. Plant Mol Biol 69:451–462
Auge RM, Green CD, Stodola AJW et al (2000) Correlations ofstomatal conductance with hydraulic and chemical factors inseveral deciduous tree species in a natural habitat. New Phytol145:483–500
Brodribb TJ, Holbrook NM (2005) Leaf physiology does not predictleaf habit; examples from tropical dry forest. Trees 19:290–295
Bruelheide H, Nadrowski K, Assmann T, et al (2014) Designingforest biodiversity experiments: general considerations illus-trated by a new large experiment in subtropical China. MethodsEcol Evol 5(1):74–89
Camposeo S, Palasciano M, Vivaldi GA, Godini A (2011) Effect ofincreasing climatic water deficit on some leaf and stomatalparameters of wild and cultivated almonds under Mediterraneanconditions. Sci Hortic 127:234–241
Carpenter S, Smith N (1975) Stomatal distribution and size insouthern Appalachian hardwoods. Can J Bot 53:1153–1156
Chaturvedi RK, Raghubanshi AS, Singh JS (2013) Growth of treeseedlings in a tropical dry forest in relation to soil moisture andleaf traits. JPE 6:158–170
Choat B, Ball M, Luly J et al (2006) Seasonal patterns of leaf gasexchange and water relations in dry rain forest trees ofcontrasting leaf phenology. Tree Physiol 26:657–664
Cornelissen H, Lavorel S, Garnier E et al (2003) A handbook ofprotocols for standardised and easy measurement of plantfunctional traits worldwide. Aust J Bot 51:335–380
Cowan IR (1982) Regulation of water use in relation to carbon gain inhigher plants. In: Lange OL, Nobel PS, Osmond CB, Ziegler H(eds) Encyclopedia of plant physiology. Springer, BerlinHeidelberg, pp 589–613
Cowan IR, Farquhar G (1977) Stomatal function in relation to leafmetabolism and environment. In: Jennings DH (ed) Integrationof activity in the higher plant. Cambridge University Press,Cambridge, pp 471–505
Eamus D, Taylor DT, Macinnis-Ng CMO et al (2008) Comparingmodel predictions and experimental data for the response ofstomatal conductance and guard cell turgor to manipulations ofcuticular conductance, leaf-to-air vapour pressure difference andtemperature: feedback mechanisms are able to account for allobservations. Plant Cell Environ 31:269–277
Franks PJ, Beerling DJ (2009) Maximum leaf conductance driven byCO2 effects on stomatal size and density over geologic time.PNAS 106:10343–10347
Franks PJ, Farquhar GD (2007) The mechanical diversity of stomataand its significance in gas-exchange control. Plant Physiol143:78–87
Franks PJ, Drake PL, Beerling DJ (2009) Plasticity in maximumstomatal conductance constrained by negative correlationbetween stomatal size and density: an analysis using Eucalyptusglobulus. Plant Cell Environ 32:1737–1748
Gerlach D (1984) Botanische Mikrotechnik. Thieme, Stuttgart, NewYork
Hendry G, Grime J (1993) Methods in comparative plant ecology: alaboratory manual. Chapman & Hall, London
Hetherington A, Woodward F (2003) The role of stomata in sensingand driving environmental change. Nature 424:901–908
Hiromi T, Ichie T, Kenzo T, Ninomiya I (2012) Interspecific variationin leaf water use associated with drought tolerance in fouremergent dipterocarp species of a tropical rain forest in Borneo.J For Res 17:369–377
Jacobsen AL, Pratt RB, Ewers FW, Davis SD (2007) Cavitationresistance among 26 chaparral species of southern California.Ecol Monogr 77:99–115
Table 6 PCA scores for all species
Species Dim.1 Dim.2 Dim.3 Dim.4 Dim.5
Acer davidii 0.39 -2.05 -3.53 -1.57 0.37
Ailanthus altissima 4.47 -0.13 1.88 0.18 -2.03
Alniphyllum fortunei 1.67 -1.06 0.31 2.35 0.57
Betula luminifera 2.65 -0.65 -1.65 2.55 0.48
Castanopsis eyrei -3.02 1.83 0.93 1.17 -0.60
Castanopsis fargesii -0.90 -0.91 0.32 -0.57 2.85
Castanea henryi 0.33 2.14 -1.52 1.89 1.22
Castanopsis sclerophylla -3.50 2.09 1.55 -0.01 1.54
Celtis biondii 2.93 -3.05 -3.10 -1.45 1.29
Choerospondias axillaris 2.57 -0.65 0.32 -3.27 -2.72
Cinnamomum camphora -1.09 -0.04 1.09 0.51 -0.46
Cyclobalanopsis glauca -2.55 0.09 0.27 -0.50 -0.13
Cyclobalanopsismyrsinifolia
-1.75 0.80 -2.57 -0.21 -1.34
Daphniphyllum oldhamii -1.56 -2.37 0.92 -0.73 -1.52
Diospyros japonica 2.90 -3.21 0.94 1.71 1.01
Elaeocarpus chinensis -1.84 -0.88 0.17 0.29 -0.89
Elaeocarpusglabripetalus
-0.23 0.44 0.48 0.49 1.65
Elaeocarpus japonicus -1.27 0.65 1.38 0.08 -0.25
Idesia polycarpa 2.29 -1.21 1.52 0.61 1.88
Koelreuteria bipinnata 1.12 2.85 -0.63 -3.37 -0.59
Liquidambar formosana 0.05 -1.84 -2.35 -1.72 -0.31
Lithocarpus glaber -3.77 -1.72 1.19 -0.39 -0.53
Machilus grijsii -1.21 -1.78 0.22 0.16 0.36
Machilus leptophylla -0.99 -2.18 1.07 -0.98 1.78
Machilus thunbergii -3.13 -0.48 0.25 -0.12 -2.45
Manglietia fordiana -1.07 -1.11 1.82 2.20 -0.14
Melia azedarach 5.74 1.89 1.26 -1.71 0.98
Meliosma flexuosa -0.51 -2.73 -2.11 0.73 -0.85
Nyssa sinensis -0.44 0.21 -0.61 0.68 -2.30
Phoebe bournei -1.55 -0.33 -0.43 0.37 1.92
Quercus acutissima -0.28 3.54 -1.92 2.12 -1.03
Quercus fabri -0.38 3.67 -3.02 1.01 -0.68
Quercus phillyraeoides -4.03 0.28 0.60 -1.79 -0.85
Quercus serrata -0.46 3.68 -2.30 -1.62 3.14
Rhus chinensis 2.45 3.07 3.63 -2.02 0.30
Sapindus saponaria 2.94 0.00 0.90 -1.15 -1.37
Schima superba -2.14 -0.36 2.05 -0.41 1.76
Triadica cochinchinensis 2.51 2.06 0.80 2.96 -1.22
Triadica sebifera 2.64 -0.56 -0.14 1.53 -0.83
Trees (2014) 28:901–914 913
123

44
Jacobsen AL, Pratt RB, Davis SD, Ewers FW (2008) Comparative
community physiology: nonconvergence in water relationsamong three semi-arid shrub communities. New Phytol180:100–113
Jarvis AJ, Davies WJ (1998) The coupled response of stomatalconductance to photosynthesis and transpiration. J Exp Bot49:399–406
Jones HG (1998) Stomatal control of photosynthesis and transpira-tion. J Exp Bot 49:387–398
Juhrbandt J, Leuschner C, Holscher D (2004) The relationshipbetween maximal stomatal conductance and leaf traits in eightSoutheast Asian early successional tree species. Forest EcolManage 202:245–256
Krober W, Bruelheide H, Bohnke M et al (2012) Leaf trait-environment relationships in a subtropical broadleaved forestin South-east China. PLoS One 7:e35742
Larcher W (2003) Physiological plant ecology, 4th edn. Springer,Berlin, Heidelberg, New York, Hong Kong, London, Milan,Paris, Tokyo
Leuning R (1995) A critical appraisal of a combined stomatal-photosynthesis model for C3 plants. Plant Cell Environ18:339–355
Liu C–C, Liu Y-G, Guo K et al (2011) Comparative ecophysiologicalresponses to drought of two shrub and four tree species fromkarst habitats of Southwestern China. Trees 25:537–549
Liu N, Ren H, Yang L et al (2012) Interactions between native treespecies and a dominant shrub Rhodomyrtus tomentosa. JTFS24:455–464
Luttge U, Hertel B (2009) Diurnal and annual rhythms in trees. Trees23:683–700
Martin TA, Brown KJ, Cermak J et al (1997) Crown conductance andtree and stand transpiration in a second-growth Abies amabilisforest. Can J For Res 27:797–808
Mcelwain JC (2004) Climate-independent paleoaltimetry usingstomatal density in fossil leaves as a proxy for CO2 partialpressure. Geology 32:1017–1020
Miyazawa SI, Livingston NJ, Turpin DH (2006) Stomatal develop-ment in new leaves is related to the stomatal conductance ofmature leaves in poplar (Populus trichocarpa 9 P. deltoides).J Exp Bot 57:373–380
Murray FW (1967) On the computation of saturation vapor pressure.J Appl Meteorol 6:203–204
Nardini A, Salleo S (2000) Limitation of stomatal conductance byhydraulic traits: sensing or preventing xylem cavitation? Trees15:14–24
Oren R, Sperry JS, Katul GG et al (1999) Survey and synthesis ofintra- and interspecific variation in stomatal sensitivity to vapourpressure deficit. Plant Cell Environ 22:1515–1526
Osnas JLD, Lichstein JW, Reich PB, Pacala SW (2013) Global leaftrait relationships: mass, area, and the leaf economics spectrum.Science 340:741–744
Patane C (2011) Leaf area index, leaf transpiration and stomatalconductance as affected by soil water deficit and vpd inprocessing tomato in semi arid mediterranean climate. J AgronCrop Sci 197:165–176
Poorter L, Bongers F (2006) Leaf traits are good predictors of plantperformance across 53 rain forest species. Ecology87:1733–1743
R Core Team (2013) R: a language and environment for statisticalcomputing. Vienna. R Foundation for Statistical Computing.http://www.r-project.org/. Accessed 1 Feb 2013
Roelfsema MRG, Hedrich R (2005) In the light of stomatal opening:new insights into ‘‘the watergate’’. New Phytol 167:665–691
Sack L, Frole K (2006) Leaf structural diversity is related to hydrauliccapacity in tropical rain forest trees. Ecology 87:483–491
Sales-Come R, Holscher D (2010) Variability and grouping of leaftraits in multi-species reforestation (Leyte, Philippines). For EcolManage 260:846–855
Santiago LS, Kim SC (2009) Correlated evolution of leaf shape andphysiology in the woody Sonchus alliance (Asteraceae: Sonchi-nae) in Macaronesia. Int J Plant Sci 170:83–92
Schulze E, Kelliher F, Korner C et al (1994) Relationships amongmaximum stomatal conductance, ecosystem surface conduc-tance, carbon assimilation rate, and plant nitrogen nutrition: aglobal ecology scaling exercise. Ann Rev Ecol Syst 25:629–662
Siegert CM, Levia DF (2011) Stomatal conductance and transpirationof co-occurring seedlings with varying shade tolerance. Trees25:1091–1102
Sobrado MA (1998) Hydraulic conductance and water potentialdifferences inside leaves of tropical evergreen and deciduousspecies. Biol Plant 40:633–637
Strobl S, Fetene M, Beck EH (2011) Analysis of the ‘‘shelter tree-effect’’ of natural and exotic forest canopies on the growth ofyoung Podocarpus falcatus trees in southern Ethiopia. Trees25:769–783
Van Der Burgh J, Visscher H, Dilcher DL, Kurschner WM (1993)Paleoatmospheric signatures in neogene fossil leaves. Science(New York, NY) 260:1788
van Hoof TB, Bunnik FPM, Waucomont JGM et al (2006) Forest re-growth on medieval farmland after the Black Death pandemic—implications for atmospheric CO2 levels. Palaeogeogr Palaeo-climatol Palaeoecol 237:396–409
Van Wittenberghe S, Adriaenssens S, Staelens J et al (2012)Variability of stomatal conductance, leaf anatomy, and seasonalleaf wettability of young and adult European beech leaves alonga vertical canopy gradient. Trees 26:1427–1438
Waring RH, Landsberg JJ (2011) Generalizing plant-water relationsto landscapes. JPE 4:101–113
Whitehead D (1998) Regulation of stomatal conductance andtranspiration in forest canopies. Tree Physiol 18:633–644
Willmer CM, Fricker M (1996) Stomata, 2nd edn. Chapman and Hall,London
Wong SC, Cowan IR, Farquhar GD (1979) Stomatal conductancecorrelates with photosynthetic capacity. Nature 282:424–426
Wright JP, Sutton-Grier A (2012) Does the leaf economic spectrumhold within local species pools across varying environmentalconditions? Funct Ecol 26:1390–1398
Wright IJ, Reich PB, Westoby M et al (2004) The worldwide leafeconomics spectrum. Nature 428:821–827
Yang X, Bauhus J, Both S, Fang T, Hardtle W, Krober W, Ma K,Nadrowski K, Pei K, Scherer-Lorenzen M, Scholten T, SeidlerG, Schmid B, Oheimb G, Bruelheide H (2013) Establishmentsuccess in a forest biodiversity and ecosystem functioningexperiment in subtropical China (BEF-China). Eur J For Res132:593–606
Zhang Y-J, Meinzer FC, Qi J-H et al (2013) Midday stomatalconductance is more related to stem rather than leaf water statusin subtropical deciduous and evergreen broadleaf trees. PlantCell Environ 36:149–158
914 Trees (2014) 28:901–914
123

45

46

47
Chapter 3
LINKING XYLEM HYDRAULIC CONDUCTIVITY AND VULNERABILITY TO
THE LEAF ECONOMICS SPECTRUM – A CROSS SPECIES STUDY OF 39 EVERGREEN AND BROADLEAVED SUBTROPICAL TREE SPECIES
Wenzel Kröber, Shouren Zhang, Merten Ehmig & Helge Bruelheide
PLOS ONE (2014) 9:e109211

48

49
RESEARCH ARTICLE
Linking Xylem Hydraulic Conductivity andVulnerability to the Leaf EconomicsSpectrum—A Cross-Species Study of 39Evergreen and Deciduous BroadleavedSubtropical Tree SpeciesWenzel Krober1*, Shouren Zhang2, Merten Ehmig1, Helge Bruelheide1,3
1. Institute of Biology, Geobotany and Botanical Garden, Martin-Luther-University Halle-Wittenberg, Halle(Saale), Germany, 2. State Key Laboratory of Vegetation and Environmental Change, Institute of Botany, theChinese Academy of Sciences, Beijing, China, 3. German Centre for Integrative Biodiversity Research (iDiv)Halle-Jena-Leipzig, Leipzig, Germany
AbstractWhile the fundamental trade-off in leaf traits related to carbon capture as described
by the leaf economics spectrum is well-established among plant species, the
relationship of the leaf economics spectrum to stem hydraulics is much less known.
Since carbon capture and transpiration are coupled, a close connection between
leaf traits and stem hydraulics should be expected. We thus asked whether xylem
traits that describe drought tolerance and vulnerability to cavitation are linked to
particular leaf traits. We assessed xylem vulnerability, using the pressure sleeve
technique, and anatomical xylem characteristics in 39 subtropical tree species
grown under common garden conditions in the BEF-China experiment and tested
for correlations with traits related to the leaf economics spectrum as well as to
stomatal control, including maximum stomatal conductance, vapor pressure deficit
at maximum stomatal conductance and vapor pressure deficit at which stomatal
conductance is down-regulated. Our results revealed that specific xylem hydraulic
conductivity and cavitation resistance were closely linked to traits represented in
the leaf economic spectrum, in particular to leaf nitrogen concentration, as well as
to log leaf area and leaf carbon to nitrogen ratio but not to any parameter of
stomatal conductance. The study highlights the potential use of well-known leaf
traits from the leaf economics spectrum to predict plant species’ drought resistance.
OPEN ACCESS
Citation: Krober W, Zhang S, Ehmig M, BruelheideH (2014) Linking Xylem Hydraulic Conductivity andVulnerability to the Leaf Economics Spectrum—ACross-Species Study of 39 Evergreen andDeciduous Broadleaved Subtropical TreeSpecies. PLoS ONE 9(11): e109211. doi:10.1371/journal.pone.0109211
Editor: Dana L. Royer, Wesleyan University,United States of America
Received: May 7, 2014
Accepted: August 27, 2014
Published: November 25, 2014
Copyright: ! 2014 Krober et al. This is an open-access article distributed under the terms of theCreative Commons Attribution License, whichpermits unrestricted use, distribution, and repro-duction in any medium, provided the original authorand source are credited.
Data Availability: The authors confirm that all dataunderlying the findings are fully available withoutrestriction. All relevant data are within the paperand its Supporting Information files. Requests canalso be directed to Wenzel Krober, [email protected].
Funding: The authors gratefully acknowledgefunding by the German Research Foundation (DFGFOR 891/1 and 891/2) with a grant to H.B. (DFGBR 1698/9-2) and the Sino-German Centre forResearch Promotion in Beijing (GZ 524, 592, 698,699, 785, 970 and 1020) as well as a grant to S.Z.of the National Natural Science Foundation ofChina (No. 31170457). The funders had no role instudy design, data collection and analysis, decisionto publish, or preparation of the manuscript.
Competing Interests: The authors have declaredthat no competing interests exist.
PLOS ONE | DOI:10.1371/journal.pone.0109211 November 25, 2014 1 / 24

50
Introduction
The worldwide leaf economics spectrum (LES) represents an important frame-work of trade-offs between key functional leaf traits [1]. It describes differentstrategies of carbon capture among vascular land plants, from that of short-livedleaves with high photosynthetic capacity per leaf mass, to long-lived leaves withlow mass-based carbon assimilation rates. Mass-based photosynthetic capacity ispositively related to mass-based leaf nitrogen concentration (LNC) and to specificleaf area [2] and is negatively related to leaf life span [1]. Many studies haveconfirmed the global validity of these trade-off patterns [3–5], and Osnas et al. [6]recently demonstrated that such relationships between traits in the LES resultfrom relationships to leaf area and from normalizing area-proportional traits byleaf mass. Krober & Bruelheide [7] have demonstrated that there are additionaldimensions to plants’ functional traits that are orthogonal to the LES. They foundparameters of stomatal regulation (derived from stomatal conductance - vaporpressure deficit relationships), stomatal density and stomatal size to beindependent from the LES.
So far, reported relationships between traits of the LES and those of plantorgans other than leaves, such as wood or roots, are equivocal. For example,Baraloto et al. [8] found the main axes in leaf and wood traits to be decoupled,while Freschet et al. [9] provided evidence for a tight relationship between themain dimensions of the leaf, stem and root economics spectra. However, from a’whole plant’ perspective, tight relationships would be expected for those leaf andwood traits that determine a plant’s tolerated minimum water potential, becausethe plant’s water status links a multitude of physiological processes [10]. Choatet al. [11] and Poorter et al. [12] reported that leaves with high specific leaf area(SLA) were linked to stems with low wood density. Similar to wood density,hydraulic xylem properties would also be expected to be correlated across roots,stems and leaves. In particular, a high photosynthetic capacity of leaves, asexpressed by high SLA, should be associated with high xylem hydraulicconductivity to facilitate sufficient water supply required for high stomatalconductance. Accordingly, in a study on ten tropical tree species in Panama, Sackand Frole [13] reported that leaf hydraulic resistance was strongly linked to leafvenation and mesophyll structure. The relationship between hydraulic con-ductivity and leaf venation was also confirmed across 43 species worldwide [14].However, Sack et al. [15] argued that leaf hydraulic conductance might bemechanistically independent from the LES, but might be linked statistically asboth hydraulic conductance and LES traits affect mass-based photosynthesis.
Besides being hydraulically efficient, another required feature of the vascularplumbing network is drought resistance. In this regard, species with stress-resistant leaves, as indicated by low SLA values, should be expected to have stress-resistant wood. Wood stress resistance is reflected in high wood density, which isthought to confer a higher tolerance from shade, wind, herbivores and drought[16]. In particular, drought resistance determined by measuring xylemvulnerability to cavitation should be correlated between leaves and wood, because
Xylem Hydraulic Conductivity and Vulnerability in 39 Subtropical Trees
PLOS ONE | DOI:10.1371/journal.pone.0109211 November 25, 2014 2 / 24

51
cavitation is a persistent hazard under drought stress and affects leaves and wood[17]. Sustaining low water potentials requires high cavitation resistance ofconduits, as derived from xylem vulnerability curves [18]. These curves allowquantifying the specific xylem hydraulic conductivity of the xylem (KS) and thexylem pressure at which 50% loss of the maximum specific xylem hydraulicconductivity occurs (Y50). Y50 is mainly determined by pit size and structure[19, 20]. However, low water potentials are transmitted throughout the wholeplant, from the point where the water-pathway ends and the regulation of thewater flow takes place to the xylem, where cavitation occurs. Thus, Y50 should bereflected in functional leaf traits and parameters of stomatal regulation.
Tree species that are able to endure severe drought periods have characteristicleaves. The leaves are tough and have a high leaf dry matter content (LDMC),allowing them to sustain low water potentials [21, 22]. Such species shouldlikewise be characterized by low Y50 values. SLA is inversely related to LDMC, inthat it decreases with drought resistance [23, 24], and it would be expected to scalenegatively with Y50. In addition, cavitation vulnerability should also be related tostomatal regulation, because cavitation-sensitive and -insensitive species would beexpected to close their stomata at low and high vapor pressure deficits,respectively [25–27]. Such parameters of stomatal closure have recently beenprovided by Krober & Bruelheide [7] for the same 39 species used also in thecurrent study. The authors measured daily courses of stomatal conductance (gs)with porometry in the same plots as in the present study, and modeled thespecies-specific gs , vapor pressure deficit (VPD) relationships. They found thatmean gs can be predicted from leaf traits that reflect the LES, with a positiverelationship to LNC and a negative relationship to leaf carbon to nitrogen ratio. Incontrast, the maximum of the gs , VPD curve was unrelated to traits of the LESand increased with leaf carbon concentration (LCC) and vein length. The VPD atwhich gs was down-regulated, characterized by the point of inflection of the gs ,VPD curve at high VPD, was lower for species with higher stomatal density andlower leaf carbon concentration. In addition to leaf trait measurements, we usethese parameters of stomatal control from Krober & Bruelheide [7] to predictxylem hydraulics.
The objective of our study was to quantify hydraulic conductivity and Y50 fromxylem vulnerability curves, making use of the common garden situation of theBEF-China experiment. Comparing 39 broad-leaved tree species, we hypothesizedthat (1) leaf traits describing the leaf economics spectrum are related to specificxylem hydraulic conductivity and cavitation resistance. Accordingly, we expectedthat (2) evergreen species characterized by low SLA and high LDMC are moreresistant to cavitation, i.e. have lower Y50 values than deciduous species, Finally,(3) we tested the hypothesis that parameters of stomatal regulation, such asmaximum stomatal conductance, the vapor pressure deficit (VPD) at maximumstomatal conductance and VPD at which stomatal conductance is down-regulated, are related to high xylem hydraulic conductivity.
Xylem Hydraulic Conductivity and Vulnerability in 39 Subtropical Trees
PLOS ONE | DOI:10.1371/journal.pone.0109211 November 25, 2014 3 / 24

52
Materials and Methods
Study Site
The study was conducted in the BEF-China project, which is a biodiversity-ecosystem functioning experiment based in Jiangxi Province, southeast China(http://www.bef-china.de; 29.08–29.11 N, 117.90–117.93 E). The climate at theexperimental site is subtropical with moderately cold and dry winters and warmsummers. Based on data of meteorological stations established at the sites, meanannual temperature was 17.4 C and mean annual precipitation was 1635 mm(Fig. 1). Across an area of 38 ha, 219,000 trees were planted at different levels ofspecies richness [29]. The diversity gradient spans from monoculture to two, four,eight, 16 and up to 24 species per plot. The 39 tree species included in the study(see Table 1) are representative of the local natural broadleaved subtropical forestcommunity [30, 31], and the trees assessed had already reached an age of four orfive years at the time when our study was carried out. Using young even-aged treesin a common garden situation allowed for controlling for confounding factors,such as different ontological stage, but also allowed to sample leaves and branchesat a standardized height above ground. No specific permissions were required forthese locations and activities. The field studies did involve neither endangered norprotected species.
Figure 1. Climate diagram according to Walter & Lieth [28] of Xingangshan, the location of theexperimental sites. Elevation: 211 m above sea level. Observation period was March 2009 to October 2012.Mean annual temperature was 17.4˚C and total annual precipitation was 1635 mm. Monthly precipitationbelow 100 mm is scaled 2:1 with mean monthly temperature (vertically hatched) and above 100 mm 15:1.Turquoise bars below the x-axis show the months where frosts can occur (when absolute monthly minimumsare equal or lower than 0˚C). Climate data were recorded by a meteorological station established at the verycenter of the experimental site (Kuhn, unpublished).
doi:10.1371/journal.pone.0109211.g001
Xylem Hydraulic Conductivity and Vulnerability in 39 Subtropical Trees
PLOS ONE | DOI:10.1371/journal.pone.0109211 November 25, 2014 4 / 24

53
Table 1. Tree species planted in the BEF-China experiment and included in this study.
Species name Family Abbreviation Leaf habit
Acer davidii Franch. Aceraceae Ad d
Ailanthus altissima (Miller) Swingle Simaroubaceae Aa d
Alniphyllum fortunei (Hemsl.) Makino Styracaceae Af d
Betula luminifera Winkl. Betulaceae Bl d
Castanopsis eyrei (Champion ex Bentham) Tutcher Fagaceae Ce e
Castanopsis fargesii Franch. Fagaceae Cf e
Castanea henryi (Skan) Rehd. et Wils. Fagaceae Ch d
Castanopsis sclerophylla (Lindley & Paxton) Schottky Fagaceae Cs e
Celtis biondii Pamp. Cannabaceae Cb d
Choerospondias axillaris (Roxb.) Burtt et Hill Anacardiaceae Ca d
Cinnamomum camphora (Linn.) Presl Lauraceae Cc e
Cyclobalanopsis glauca (Thunberg) Oersted Fagaceae Cg e
Cyclobalanopsis myrsinifolia (Blume) Oersted Fagaceae Cm e
Daphniphyllum oldhamii (Hemsl.) Rosenthal Daphniphyllaceae Do e
Diospyros japonica Siebold & Zuccarini Ebenaceae Dj d
Elaeocarpus chinensis (Gardn. et Chanp.) Hook. f. ex Benth. Elaeocarpaceae Ec e
Elaeocarpus glabripetalus Merr. Elaeocarpaceae Eg e
Elaeocarpus japonicus Sieb. et Zucc. Elaeocarpaceae Ej e
Idesia polycarpa Maxim. Flacourtiaceae Ip d
Koelreuteria bipinnata Franch. Sapindaceae Kb d
Liquidambar formosana Hance Altingiaceae Lf d
Lithocarpus glaber (Thunb.) Nakai Fagaceae Lg e
Machilus grijsii Hance Lauraceae Mg e
Machilus leptophylla Hand.-Mazz. Lauraceae Ml e
Machilus thunbergii Sieb. et Zucc. Lauraceae Mt e
Manglietia fordiana (Oliver) HuY.W.Law Magnoliaceae Manf e
Melia azedarach Linn. Meliaceae Ma d
Meliosma flexuosa Blume Sabiaceae Mf d
Nyssa sinensis Oliver Nyssaceae Ns d
Phoebe bournei (Hemsl.) Yen C. Yang, Lauraceae Pb e
Quercus acutissima Carruthers Fagaceae Qa d
Quercus fabri Hance Fagaceae Qf d
Quercus phillyreoides A. Gray Fagaceae Qp e
Quercus serrata Murray Fagaceae Qs d
Rhus chinensis Mill. Anacardiaceae Rc d
Sapindus saponaria Linn. Sapindaceae Sd d
Triadica cochinchinensis Loureiro Euphorbiaceae Tc d
Triadica sebifera (L.) Small Euphorbiaceae Ts d
Schima superba Gardn. et Champ. Theaceae Schs e
Species names are in accordance with nomenclature in The Flora of China (http://flora.huh.harvard.edu/china). d5 deciduous, e5 evergreen.
doi:10.1371/journal.pone.0109211.t001
Xylem Hydraulic Conductivity and Vulnerability in 39 Subtropical Trees
PLOS ONE | DOI:10.1371/journal.pone.0109211 November 25, 2014 5 / 24

54
Tree Species and Vulnerability Curves
We randomly chose three individuals per species in the high-diversity plots, withone individual per species being sampled per plot. This enabled us to minimizetime between sample cutting and lab procession of samples because differentspecies grew in close proximity to each other. Xylem conductivity andvulnerability and leaf stomatal conductance (see below) were measured on thesame plots, but not explicitly on the same individuals. The sampling andmeasurements on xylem hydraulics were conducted in August - October 2012.This period was characterized by monthly mean temperatures of about 20 C and amonthly precipitation of 40 mm (Fig. 1), which involved dry spells of severalweeks, typically resulting in midday depressions of stomatal conductance. Sampleswere always taken in the early morning hours between 6 and 8 am, when relativehumidity was still high (70–95% Rh) and temperatures were around 20 C.Measurements of leaf water potentials were made in spring 2012, using a PMSM1000 Scholander pressure chamber. These data showed that water potentialswere well above 22 MPa, and for many species.21 MPa. A twig with no leaves,buds or branches, around 15 cm in length and 5–15 mm diameter was cut andimmediately immersed in water. We are aware that maximum vessel length ofsome of the species might be larger than 15 cm [32], which would result inoverestimating specific xylem hydraulic conductivity (KS) and the absolute valueof the xylem pressure at which 50% loss of the maximum specific xylem hydraulicconductivity occurs (Y50). However, it has been shown that extreme vessel lengthsare very rare [33]. In any case, obtaining non-ramified twigs longer than 15 cmwould have been impossible in most species. After transportation to the lab, thestem pieces were then placed into a double-ended pressure sleeve (PMS M1000Scholander pressure chamber) in the laboratory following established protocols[18, 34] (Fig. 2). Xylem vulnerability was measured within at maximum fourhours after cutting. Increasing the air pressure in the cavitation chamber was usedto simulate increasingly negative xylem sap pressures [35]. Before themeasurements were taken, each twig segment was treated for one hour withperfusion solution pressurized at 0.15 MPa in order to flush out air from olderembolism events and any potential air entry into the xylem during the cutting andhandling of samples. We used 10 mM citric acid perfusion solution, using filteredand demineralized water to prevent any blockages caused by microorganisms.
Specific xylem hydraulic conductivity (KS) was measured as the mass of flow-through perfusion solution through the piece of wood per unit of time and percross-sectional area of the twig. The measurements were started at ambient airpressure and repeated as pressure was increased in increments of 0.5 MPa up to7 MPa, or to the pressure at which no more perfusion solution flow wasencountered.
Measurements of Stomatal Conductance
Data on stomatal conductance were taken from [7]. For the measurements ofstomatal conductance the authors had randomly selected twelve high-diversity
Xylem Hydraulic Conductivity and Vulnerability in 39 Subtropical Trees
PLOS ONE | DOI:10.1371/journal.pone.0109211 November 25, 2014 6 / 24

55
plots (with 16 or 24 species). Eleven to 23 individuals of all species were measuredper plot. In total, 3,290 measurements of stomatal conductance were made inAugust to October 2010, May/June 2011 and August to October 2011. Each of the39 species was represented between at least three and at maximum 13 individuals,resulting in 218 individuals in total. This non-balanced sampling design resultedfrom measuring daily course of stomatal conductance, which required walkingtime to be minimal. The repeated measurements were taken on the same leaf,which was fully developed, undamaged and fully exposed to the sun. Daily coursesof stomatal conductance were produced for all species in every plot. Stomatalconductance was recorded with an SC1 porometer (Decagon). Air temperatureand relative humidity was measured simultaneously using a T2 thermo-hygrometer (Trotec). Vapor pressure deficit (VPD) was calculated following theAugust-Roche Magnus formula. The daily courses of all different individuals fromall different daily courses were then aggregated to one gs , VPD relationshipwhich included all data for one species. Mean and maximum stomatalconductance (gsmax) could then be estimated per species. The species-specific gs ,VPD relationships were modeled by regressing the logits of gs/gsmax to VPD andthe quadratic term of VPD using a generalized linear model with a binomial errordistribution. The parameters of the model allowed calculating the maximumstomatal conductance and the VPD at which the modeled stomatal conductancewas maximal.
Trait Measurements
A total of 34 leaf and wood traits were assessed to analyze possible relationshipswith Y50 and KS (see Table 2). To accomplish this, four total sets of samples were
Figure 2. Simplified overview of the xylem hydraulics measurement installation. A) Pressure chamberwith the stem segment, B) tank with the perfusion solution, C) flush tank, D) three-way stopcock, E) electronicscale, F) nitrogen pressure cylinder, and G) pressure gauge.
doi:10.1371/journal.pone.0109211.g002
Xylem Hydraulic Conductivity and Vulnerability in 39 Subtropical Trees
PLOS ONE | DOI:10.1371/journal.pone.0109211 November 25, 2014 7 / 24

56
taken: 1) A set of five individuals with five leaves being sampled per individual forthe traditional leaf traits, such as absolute area per leaf, leaf fresh-weight, leaf dry-weight, leaf nitrogen concentration (LNC) and leaf carbon concentration (LCC).The data were used to calculate specific leaf area (SLA), leaf dry matter content(LDMC) and carbon to nitrogen ratio (CN). We also determined leaf habit(deciduous/evergreen), leaf pinnation (pinnate or simple), leaf margin (entire orserrate) and recorded the presence or absence of extrafloral nectaries. 2) Another30 leaves were sampled from three individuals per species to determine leaf tensilestrength as a measure of leaf toughness. Leaf tensile strength was measured with atearing apparatus modified after Hendry [36]. 3) The same leaves on whichstomatal conductance was measured (see above), were taken to analyze thestomatal related traits. Stomatal traits were analyzed after Gerlach [37], withstomata being counted on a minimum area of 50,000 mm2 on three leaves fromthree individuals per species. Stomata were counted on nail polish impressionsmade on leaf samples, which had been stored in 70% ethanol. Length and width ofthree stomata per replicate were measured, and stomatal density was expressed asstomatal number per area. The analysis was performed with a light-opticalmicroscope (Zeiss Axioskop 2 plus) and using the Axio Vision (Version 3.0)software. 4) A sample was taken from each twig used in the cavitation sensitivityanalysis for further xylem anatomical investigation. Twig sections were preparedfor light microscopic inspection and, from an area of 4.4 mm2 per sample, everyxylem vessel was analyzed. To determine xylem traits, we made use ofXylemDetector that was implemented as part of the open-source package MiToBo(http://www.informatik.uni-halle.de/mitobo), an extension of the Java imageprocessing software ImageJ. We measured the mean lumen area of conductingvessels (MEANAREA) and the mean roundness of conducting vessels(MEANROUND), which is a measure of how close the vessel shape is to a perfectcircle, and ranges from 0 to 1. MEANROUND was calculated as:
meanround~4pap2
where a is the area and p the perimeter of the lumen.Following Sperry [38], we calculated hydraulically weighted conduit diameter
(DHYD) from the lumen area data according to:
dhyd~2P
r5P
r4
where r are the circle radii calculated from the lumen areas.
Statistical Analyses
We plotted vulnerability curves that show the flow rates of perfusion solutionthrough stem segments as a function of water potential [35]. A sigmoid, three-parameter regression was applied to the vulnerability data [39, 40]:
Xylem Hydraulic Conductivity and Vulnerability in 39 Subtropical Trees
PLOS ONE | DOI:10.1371/journal.pone.0109211 November 25, 2014 8 / 24

57
Table 2. List of the leaf traits measured across the 39 tree species.
Code TraitAnalyticaltechnique Type Units/categories
Y50 Loss of 50% initial conductivity PressureChamber
Continuous MPa
KS Maximum conductivity PressureChamber
Continuous kg m21 s21 MPa21
b Parameter b (Sigmoid Regression) PressureChamber
Continuous nondimensional
CONMEAN Average stomatal condutance Porometer Continuous mmol m2 s21
CONMAX Maximum stomatal condutance Porometer Continuous mmol m2 s21
VPDMAX VPD at CONMAX Porometer,Hygrometer,Thermometer
Continuous hPa
CONMAXFIT Fitted Max. stomatal conductance Porometer,Hygrometer,Thermometer
Continuous nondimensional
VPDMAXFIT VPD at CONMAXFIT Porometer,Hygrometer,Thermometer
Continuous hPa
VPDPOI VPD at point of inflection of fitted stomatal conductance Porometer,Hygrometer,Thermometer
Continuous hPa
SLA Specific leaf area Scanner,Balance
Continuous m2 kg21
LOG10LA Decadic log (Leaf Area) Scanner Continuous mm2
LDMC Leaf dry matter content Balance Continuous mg g21
LT Leaf toughness Leaftoughnessdevice
Continuous N mm21
LEAFHABIT Leaf habit Literature Binary (0) evergreen; (1) deciduous
LNC Leaf nitrogen concentration CN Analyzer Continuous mg g21
LCC Leaf carbon concentration CN Analyzer Continuous mg g21
CN Carbon-nitrogen ratio CN Analyzer Continuous ratio
CA Leaf calcium concentration AAS Analyzer Continuous mg g21
K Leaf potassium concentration AAS Analyzer Continuous mg g21
MG Leaf magnesium concentration AAS Analyzer Continuous mg g21
LEAFPIN Leaf pinnation FieldObservation
Binary (0) pinnate; (1) simple
LEAFMAR Leaf margin FieldObservation
Binary (0) dentate; (1) entire
EXTRAFLO Extrafloral nectaries FieldObservation
Binary (0) no; (1) yes
STODENS Stomata density Microscopy Continuous 1 mm22
STOSIZE Stomata size Microscopy Continuous mm2
STOIND Stomata index Microscopy Continuous ratio
DIAMVEIN1 Diameter veins 1st order Scanner Continuous cm
DIAMVEIN2 Diameter veins 2nd order Scanner Continuous cm
VEINDENS Length of veins per unit leaf area Scanner Continuous cm cm22
WPOT Water potential PressureChamber
Continuous MPa
Xylem Hydraulic Conductivity and Vulnerability in 39 Subtropical Trees
PLOS ONE | DOI:10.1371/journal.pone.0109211 November 25, 2014 9 / 24

58
KS~a
1ze{(Y{Y50
b )
where KS is the specific hydraulic conductivity of the xylem [kg m21 s21 MPa21],Y is the xylem pressure at which water flow was measured [MPa], a is the originalmaximum specific xylem hydraulic conductivity, b is the slope of the regressionand Y50 is the xylem pressure at which 50% loss of the original maximum specificxylem hydraulic conductivity occurs. Fig. 3 shows an example of how the sigmoidmodel was fitted to predict the loss of specific xylem hydraulic conductivity (KS)from water potential (please refer to the Figure S1 and Table S1 for raw data onxylem vulnerability). We made use of the FactoMineR package in R (http://cran.r-project.org/web/packages/FactoMineR/index.html) to correlate the physiologicalparameters to the species’ traits in a PCA. KS, Y50 and the slope b of the KS , Y
Table 2. Cont.
Code TraitAnalyticaltechnique Type Units/categories
WOODDENS Wood density Balance Continuous g cm3
MEANAREA Mean area of conducting vessels Microscopy Continuous mm2
MEANROUND Mean roundness of conducting vessels Microscopy Continuous nondimensional
DHYD Hydraulically weighted diameter of conducting vessels Microscopy Continuous mm
All traits were assessed on the individuals planted in the experiment. The table includes the trait abbreviations (Code) used throughout the text.
doi:10.1371/journal.pone.0109211.t002
Figure 3. Conductivity rates as a function of decreasing water potential, taking Castanea henryi as anexample. Outline dots show the measured values of three independent vulnerability curves. Dotted linesshow the single regression functions obtained from the measured value per vulnerability curve, obtained froma 3-parametric sigmoid function. The bold line shows the regression lines constructed from the means of theparameters from the three single vulnerability curves. Filled dots represent Y50 values.
doi:10.1371/journal.pone.0109211.g003
Xylem Hydraulic Conductivity and Vulnerability in 39 Subtropical Trees
PLOS ONE | DOI:10.1371/journal.pone.0109211 November 25, 2014 10 / 24

59
relationship were tested for differences between deciduous and evergreen leafhabit by analysis of variance (ANOVA) and for bivariate relationships to leaf traitsby linear regression models. As these tests performed multiple testing, they run therisk of error inflation and cannot be used to infer statistical significances. Thesetests were exploratory and had the purpose to identify possible candidatepredictors and to show the direction of their effects. To further investigate theemerging significant relationships, we rerun all significant linear regressions byadditionally including the interaction with leaf habit. For all statistics, R softwareversion 3.0.2 was used.
Results
Fig. 4 shows the vulnerability curves for all 39 species included in the study.Values of Y50 ranged between 21.08 MPa and 26.6 MPa for Celtis biondii andLithocarpus glaber, respectively, with an overall mean of 23.78 MPa (SD51.48).Specific xylem hydraulic conductivity (KS) was highest in Melia azedarach,Triadica sebifera and Castanea henryi (17.52, 11.01 and 10.40 kg m21 s21 MPa21,respectively) and lowest in Machilus grijsii (0.036 kg m21 s21 MPa21), with aoverall mean of 2.44 kg m21 s21 MPa21 (SD53.31). KS and Y50 were notcorrelated across all species (p50.512). Evergreen species had significantly lowervalues of maximum hydraulic conductivity and lower Y50 values than deciduousspecies (Fig. 5).
Fig. 6 shows the principal components analysis (PCA) of all 34 leaf traits,including the parameters of stomatal control and xylem vulnerability for all 39study species (Fig. 6 a, b). The species mean values of all traits are provided inTable S1. The first three PCA axes explained 43.3% of the total variance, with
Figure 4. Plots of modeled specific xylem hydraulic conductivity KS versus water potentials for all 39 species included in the study. A) and B) showthe same data at different scale of KS. Deciduous species are shown in red, evergreen species shown in black. For species abbreviations see Table 1. Fordetails of calculation of regression lines, see Fig. 2 and Methods.
doi:10.1371/journal.pone.0109211.g004
Xylem Hydraulic Conductivity and Vulnerability in 39 Subtropical Trees
PLOS ONE | DOI:10.1371/journal.pone.0109211 November 25, 2014 11 / 24
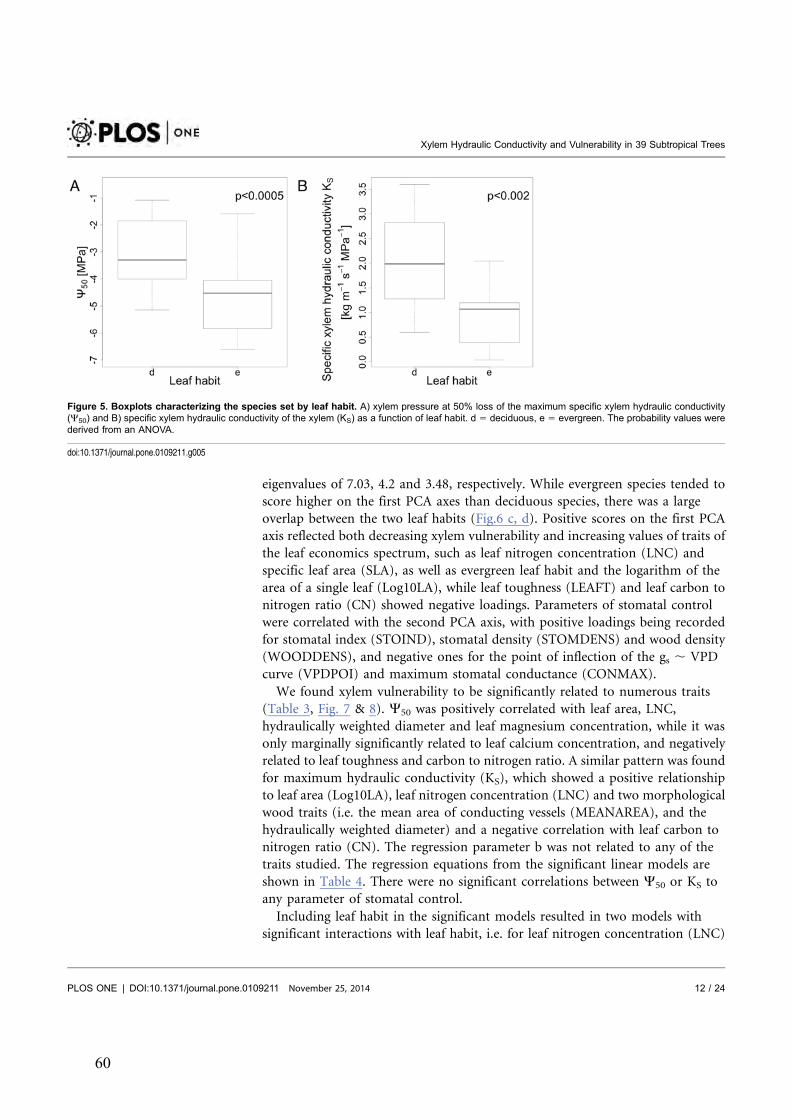
60
eigenvalues of 7.03, 4.2 and 3.48, respectively. While evergreen species tended toscore higher on the first PCA axes than deciduous species, there was a largeoverlap between the two leaf habits (Fig.6 c, d). Positive scores on the first PCAaxis reflected both decreasing xylem vulnerability and increasing values of traits ofthe leaf economics spectrum, such as leaf nitrogen concentration (LNC) andspecific leaf area (SLA), as well as evergreen leaf habit and the logarithm of thearea of a single leaf (Log10LA), while leaf toughness (LEAFT) and leaf carbon tonitrogen ratio (CN) showed negative loadings. Parameters of stomatal controlwere correlated with the second PCA axis, with positive loadings being recordedfor stomatal index (STOIND), stomatal density (STOMDENS) and wood density(WOODDENS), and negative ones for the point of inflection of the gs , VPDcurve (VPDPOI) and maximum stomatal conductance (CONMAX).
We found xylem vulnerability to be significantly related to numerous traits(Table 3, Fig. 7 & 8). Y50 was positively correlated with leaf area, LNC,hydraulically weighted diameter and leaf magnesium concentration, while it wasonly marginally significantly related to leaf calcium concentration, and negativelyrelated to leaf toughness and carbon to nitrogen ratio. A similar pattern was foundfor maximum hydraulic conductivity (KS), which showed a positive relationshipto leaf area (Log10LA), leaf nitrogen concentration (LNC) and two morphologicalwood traits (i.e. the mean area of conducting vessels (MEANAREA), and thehydraulically weighted diameter) and a negative correlation with leaf carbon tonitrogen ratio (CN). The regression parameter b was not related to any of thetraits studied. The regression equations from the significant linear models areshown in Table 4. There were no significant correlations between Y50 or KS toany parameter of stomatal control.
Including leaf habit in the significant models resulted in two models withsignificant interactions with leaf habit, i.e. for leaf nitrogen concentration (LNC)
Figure 5. Boxplots characterizing the species set by leaf habit. A) xylem pressure at 50% loss of the maximum specific xylem hydraulic conductivity(Y50) and B) specific xylem hydraulic conductivity of the xylem (KS) as a function of leaf habit. d 5 deciduous, e 5 evergreen. The probability values werederived from an ANOVA.
doi:10.1371/journal.pone.0109211.g005
Xylem Hydraulic Conductivity and Vulnerability in 39 Subtropical Trees
PLOS ONE | DOI:10.1371/journal.pone.0109211 November 25, 2014 12 / 24

61
and the leaf carbon to nitrogen ratio (CN). While with increasing CN anddecreasing LNC, KS increased in evergreen species, deciduous species showed adecrease (Fig. 8 a, b).
Discussion
We found a large variation in specific xylem hydraulic conductivity and xylemvulnerability among our study species, which points to different complementary
Figure 6. Principal component analysis (PCA) biplots showing the relationships between the mean values of all chemical and morphological leaftraits (black arrows), all parameters of stomatal regulation (green arrows) and all parameters of cavitation sensitivity (blue arrows). A) and C) PCAaxes 1 and 2, B) and D) PCA axes 1 and 3. A) and B) loadings of the different traits. C) and D) species scores in the PCA shown separately by leaf habit.Deciduous species are shown in red and evergreen species in black. See Table 1 for abbreviations of species names. Eigenvalues: axis 157.03, axis254.2, axis 353.48, with cumulative proportion of explained inertia 20.1%, 33.0% and 43.3%, respectively. See Table 2 for abbreviations of trait names.
doi:10.1371/journal.pone.0109211.g006
Xylem Hydraulic Conductivity and Vulnerability in 39 Subtropical Trees
PLOS ONE | DOI:10.1371/journal.pone.0109211 November 25, 2014 13 / 24

62
strategies of the species in the same subtropical forest community. Thus, ourresults conform to the findings of Bohnke et al. [41], who revealed a high andtemporally constant level of functional diversity in the course of succession inthese forests. In particular, variation in cavitation resistance could offer anexplanation for species coexistence in the same community [42]. Our values onspecific xylem hydraulic conductivity with a range of KS between 0.036 and17.52 kg m21 s21 MPa21 and xylem vulnerability to cavitation Y50 between21.08 and 26.6 MPa cover a large part of the total range recorded for such
Table 3. Correlation matrix of hydraulic xylem characteristics with numerical leaf traits and parameters of stomatal control.
Y50 KS b
r p r p r p
CONMEAN 0.12 0.49 0.13 0.42 20.12 0.49
CONMAX 0.02 0.92 0.02 0.91 20.06 0.73
VPDMAX 20.04 0.81 0.15 0.36 0.14 0.39
CONMAXFIT 0.14 0.41 0.26 0.12 20.11 0.50
VPDMAXFIT 20.13 0.43 0.18 0.26 20.01 0.96
VPDPOI 0.13 0.44 0.13 0.44 20.10 0.53
SLA 0.27 0.09 0.05 0.78 20.17 0.30
LOG10LA 0.34 0.03 0.10 0.04 20.20 0.22
LDMC 20.02 0.91 20.02 0.91 20.03 0.85
LEAFT 20.47 0.00 20.23 0.16 0.02 0.90
LNC 0.43 0.01 0.59 0.00 20.08 0.62
LCC 20.23 0.17 20.12 0.49 0.05 0.76
CN 20.43 0.01 20.48 0.00 0.05 0.75
CA 0.32 0.05 0.09 0.58 20.16 0.35
K 0.16 0.33 0.05 0.75 20.13 0.44
MG 0.33 0.04 0.02 0.91 20.24 0.15
STOMDENS 0.09 0.58 0.07 0.65 20.08 0.64
STOMSIZE 0.06 0.74 20.06 0.71 20.01 0.96
STOIND 0.11 0.52 0.01 0.69 20.09 0.59
DIAMVEIN1 0.20 0.23 20.09 0.59 20.23 0.17
DIAMVEIN2 0.17 0.33 0.01 0.93 20.14 0.42
VEINLENGTH 20.15 0.37 20.09 0.61 0.19 0.24
WPOT 0.09 0.57 20.04 0.79 0.01 0.95
WOODDENS 20.06 0.73 0.06 0.71 20.13 0.42
MEANAREA 0.24 0.15 0.85 0.00 20.11 0.52
MEANROUND 0.04 0.82 20.01 0.94 20.02 0.92
DHYD 0.39 0.01 0.72 0.00 20.20 0.23
The correlations were calculated from linear model analyses between functional leaf traits and the extracted physiological parameters. Significantrelationships are shown in bold letters.Y505 xylem pressure at which 50% loss of the original maximum specific xylem hydraulic conductivity occurred, KS5specific hydraulic conductivity of the xylem, b5 slope of the three-parametric sigmoid model of the vulnerability curve, CONMEAN 5 mean gs; CONMAX 5mean gs max; VPDMax 5 VPD at gs max; CONMAXFIT 5 modeled gs max; VPDMaxfit 5 VPD at modeled gs max, and VPDPoi 5 VPD at the point of inflexionof the gs , VPD curve, MEANAREA 5 the mean area of conducting vessels, MEANROUND 5 the mean roundness of conducting vessels, and DHYD thehydraulically weighted diameter of conducting vessels.
doi:10.1371/journal.pone.0109211.t003
Xylem Hydraulic Conductivity and Vulnerability in 39 Subtropical Trees
PLOS ONE | DOI:10.1371/journal.pone.0109211 November 25, 2014 14 / 24

63
Figure 7. Y50 as a function of A) leaf area (p50.0315, r50.34), B) leaf toughness (p,0.0003, r520.47), C) leaf nitrogen concentration (p,0.0075,r50.43), D) leaf carbon to nitrogen ratio (p,0.0078, r520.43), E) leaf magnesium concentration (p,0.042, r50.33) and F) hydraulically weightedconduit diameter (p,0.01, r50.39). Filled black dots represent species of evergreen leaf habit; empty dots represent species of deciduous leaf habit.
doi:10.1371/journal.pone.0109211.g007
Xylem Hydraulic Conductivity and Vulnerability in 39 Subtropical Trees
PLOS ONE | DOI:10.1371/journal.pone.0109211 November 25, 2014 15 / 24

64
Xylem Hydraulic Conductivity and Vulnerability in 39 Subtropical Trees
PLOS ONE | DOI:10.1371/journal.pone.0109211 November 25, 2014 16 / 24

65
variables in other studies [43]. For example, Cavender-Bares et al. [44] described arange of maximum specific xylem hydraulic conductivity of between 1.75 and5 kg m21 s21 MPa21 for 17 oak species, while Maherali et al. [45] reported amean of 1.36 kg m21 s21 MPa21 of maximum specific xylem hydraulicconductivity (n species 587) and a mean of 23.15 MPa for Y50 values (n species5167). Slightly higher Y50 values of 21.2 up to 22.76 MPa were encountered foreight tree species from a tropical dry forest [46]. However, we have to considerthat extreme values of KS of more than 10 kg m21 s21 MPa21 might bemethodological artifacts, caused by some open vessels in these samples. However,the three species with extreme KS also ranked high in values of the predictor traitsfor KS, indicating that the relative rank in KS in these species might be realistic. Asvessel length of the species was not measured, and thus, in some species, specificxylem hydraulic conductivity might have been overestimated, comparisons toother studies should be done with caution. However, as Melcher et al. [33]pointed out, such an overestimation is probably not severe, as long vessels are alsovery rare.
Important leaf traits such as leaf nitrogen concentration (LNC) and leaf area(Log10LA) were highly correlated to Y50 and KS. Thus, we can fully confirm ourfirst hypothesis that leaf traits describing the leaf economics spectrum are related
Figure 8. KS as a function of A) leaf area (p,0.044, r50.1), B) leaf nitrogen concentration (p,0.00001, r50.59), C) leaf carbon to nitrogen ratio(p,0.0019, r50.48), D) mean area of conducting vessels (p,0.0001, r50.85), and E) hydraulically weighted diameter of conducting vessels(p,0.0001, r50.72). Filled black dots represent species of evergreen leaf habit and empty dots represent species of deciduous leaf habit. In B) and C) KS
also showed significant interactions with leaf habits. Dotted lines represent species of evergreen and broken lines represent species of deciduous leaf habit.B) leaf habit p50.061, interaction leaf nitrogen concentration and leaf habit p50.049, C) leaf habit p50.026, interaction leaf carbon to nitrogen ratio and leafhabit p50.031.
doi:10.1371/journal.pone.0109211.g008
Table 4. Regression equations for all significant correlations of Y50 and KS to the functional traits.
Xylem parameter Functional trait Equation
Y50 LOG10LA y51.0090x27.3717
Y50 LEAFT y523.2808x22.3454
Y50 LNC y51.9556x27.1038
Y50 CN y520.12210x20.25799
Y50 MG y50.2763x25.0792
Y50 DHYD y50.0136x25.005
KS LOG10LA y52.0699x24.8375
KS LNC y56.003x27.734
KS CN y520.31132x+11.44974KS MEANAREA y50.0011481x20.7089940
KS DHYD y50.0569x22.611
The correlations were calculated from linear model analyses. Y505 xylem pressure at which 50% loss of the original maximum specific xylem hydraulicconductivity occurred, KS5 specific hydraulic conductivity of the xylem, b5 slope of the three-parametric sigmoid model of the vulnerability curve,CONMEAN 5 mean gs; CONMAX 5 mean gs max; VPDMax 5 VPD at gs max; CONMAXFIT 5 modeled gs max; VPDMaxfit 5 VPD at modeled gs max, andVPDPoi 5 VPD at the point of inflexion of the gs , VPD curve, MEANAREA 5 the mean area of conducting vessels, and DHYD the hydraulically weighteddiameter of conducting vessels.
doi:10.1371/journal.pone.0109211.t004
Xylem Hydraulic Conductivity and Vulnerability in 39 Subtropical Trees
PLOS ONE | DOI:10.1371/journal.pone.0109211 November 25, 2014 17 / 24

66
to specific xylem hydraulic conductivity and cavitation resistance. Interestingly,there were no significant correlations for some of the traits of the leaf economicsspectrum, such as SLA and LDMC. Thus, leaf thickness and water content ofleaves seem to have less importance for hydraulic characteristics than the leaves’absolute size and protein content. This contrasts with the findings reported byWillson et al. [47], who described a significant relationship between SLA and Y50
for the genus Juniperus. Thus, comparative studies confined to certain taxonomiclevels, such as congeneric comparisons, might arrive at different conclusions thanstudies covering a wider range of taxa. Alternatively, SLA may have a differinglevel of importance with regard to the physiology of gymnosperms andangiosperms. Interestingly, our study did also not support a link between KS andleaf vein density, which was predicted by the flux trait network suggested by Sacket al. [15]. However, there was only equivocal evidence for a significantrelationship between KS and leaf vein density in their reviewed studies [15].
Our results of a strong relationship of Y50 and KS to leaf area, conform to thoseencountered for eight southern African tree species of a seasonally dry tropicalforest by Vinya et al. [48], except that they reported a link to leaf area only for KS,but not for Y50. Our findings of a relationship of Y50 to Mg concentration and amarginal one to Ca concentration might indicate that the non-vein and non-sclerenchyma mesophyll density in the leaf are more relevant for cavitationresistance than overall leaf tissue density. As a central component of chlorophyll,Mg concentration is directly related to photosynthetic capacity, and thus, mightcapture this proportion of actively assimilating tissue in the leaf. In addition, as acofactor of many enzymatic processes, Mg can be considered an indicator for theplant’s nutrition status [49].
The absence of any direct relationship between SLA or LDMC with Y50 or KS
which is in accordance with Sack et al. [50], in combination with the large overlapin Y50 and KS detected between deciduous and evergreen species, is not aconclusive result. It appears that evergreen and deciduous subtropical forestspecies form two ends of a gradient from cavitation resistance to cavitationavoidance, respectively. This view is supported by a recent study by Fu et al. [17],who investigated the relationship of stem hydraulics and leaf phenology in Asiantropical dry forest species. In particular, they found a negative relationshipbetween leaf life span and KS but no significant relationship between leaf life spanand Y50. In accordance with our results, Maherali et al., Choat et al. and Chen etal. [27, 45, 51] also reported significant differences in Y50 and KS between thedifferent leaf habit groups. Such differences in hydraulic characteristics alsotranslate to higher growth rates, as shown by Fan et al. [52] for 40 Asian tropicaltrees. However, some other studies failed to detect any differences, such as that ofMarkesteijn et al. [42], who attributed the substantial differences theyencountered in Y50 and KS to shade tolerance. They also argued that thedistinction between pioneer vs. shade-tolerant species predicts hydraulic proper-ties better than leaf habit, because there are considerable overlaps in strategiesalong the gradient of leaf longevity. As Givnish [53] pointed out, evergreen leavescan be advantageous under a wide range of ecological conditions, and the
Xylem Hydraulic Conductivity and Vulnerability in 39 Subtropical Trees
PLOS ONE | DOI:10.1371/journal.pone.0109211 November 25, 2014 18 / 24

67
relationship of leaf habit with Y50 and KS may therefore strongly depend on thesystem considered. We can also confirm our second hypothesis that evergreenspecies characterized by low SLA and high LDMC show lower Y50 and KS valuesthan deciduous species. Interestingly, we found leaf habit to significantly influencethe relationships of KS to leaf nitrogen concentration and carbon to nitrogenratio, which might be explained by differences in basic leaf constructingprinciples. Deciduous species tend to invest high amounts of nitrogen tomaximize photosynthetic assimilation per leaf mass, whereas in evergreen species,the focus is on increased leaf lifespan, which is reflected in higher leaf carbonconcentration [54]. Furthermore, deciduous species show a more conservativestomatal control to avoid embolism, whereas evergreen species tend to have morecavitation-resistant vessels [7, 25–27, 55]. The underlying reason is that evergreenspecies are mostly diffuse-porous, which also explains the strong impact of thehydraulically weighted conduit diameter and mean area of conducting vessels onKS, which is also well-known from the literature [19].
Contrary to expectations, this study did not find a significant link betweenxylem hydraulic conductivity and parameters of stomatal regulation. Neither themaximum stomatal conductance, the vapor pressure deficit at maximum stomatalconductance nor the vapor pressure deficit at which stomatal conductance isdown-regulated was related to any parameter of the xylem vulnerability curves. Assuch, our third hypothesis has to be rejected, which implies that the ability of avery precise and fast stomatal regulation versus a retarded and inert stomatalregulation does not translate into cavitation resistance. Additional insights intothe relationship between KS and leaf stomatal regulation might be gained bycalculating leaf-specific xylem hydraulic conductivity KL, which would directlyrefer to the capacity of the vascular system of a stem to supply the water to thatstem [56]. However, our results confirm those of Brodribb et al. [46], who foundno correlation between Y50 and the leaf water potential at stomatal closure ineight tropical, dry forest trees. They concluded that xylem cavitation and stomatalclosure are linked through complex indirect regulatory mechanisms and arguethat this potential linkage is considerably flexible, especially with regard todifferent leaf phenology strategies, and that there may be carry-over effects ofpreceding embolism events on stomatal control. A further explanation of a lackingrelationship between xylem vulnerability and stomatal regulation may be thedifferent scale at which stomatal regulation is considered. At the level of wholetrees, Litvak et al. [55] found a strong linear relationship between the sensitivity oftree-level sap flow to VPD and Y50 both within diffuse- and ring-porous species,which was not encountered for leaf-level transpiration rates. The authors arguethat the tree-level transpiration sensitivity, in addition to stomatal regulation, alsodirectly responds to drought-induced embolisms.
Several studies showed a trade-off between high hydraulic conductivity andcavitation resistance [57–60]. In contrast to these studies, we found Y50 and KS tobe unrelated. According to our current understanding of the causes of xylemembolism under drought conditions, there may indeed be no mechanistic linkbetween these two hydraulic characteristics. As such, diameter and length of vessels
Xylem Hydraulic Conductivity and Vulnerability in 39 Subtropical Trees
PLOS ONE | DOI:10.1371/journal.pone.0109211 November 25, 2014 19 / 24

68
may differ autonomously from pit structure and size [19]. While KS is mainly drivenby vessel diameter, Y50 depends on pit size and structure [19, 20]. The pit areahypothesis states that cavitation resistance is linked to the total area of inter-vesselpits per vessel [61, 62]. Thus, the risk of an embolism expanding between vesselsrises with the maximum size of the pit membrane pore, which in turn is dependenton the associated pit membrane area per vessel. This was demonstrated by Hackeet al. [57], who reported a strong negative link between xylem vulnerability and pitmembrane area per vessel, resulting in small pits potentially increasing hydraulicresistance and decreasing KS. However, pit size may be of minor importance to KS
compared to that of vessel diameter, and the relationship of hydraulic conductivityand cavitation resistance might depend on the specific ecosystem considered. Tyreeet al. [59] distinguished between frost- and drought-induced cavitation. In theirmeta-analysis, the trade-off between hydraulic conductivity and cavitationresistance was mainly related to frost-induced cavitation events. Although frostsoccur in the Chinese subtropics, they are neither very strong, nor long-lasting [63].Thus, cavitation in the forests of our study area will mainly be brought about bydrought events, which may result in far fewer, or insignificant, trade-offs.
Since all our individuals have the same age, our species set provides a highcomparability usually not found in comparative studies. We expect that some ofour response variables will change with tree age, such as specific xylem hydraulicconductivity [64, 65]. In addition, future comparisons should take the sustainedleaf area into account, as whole-tree leaf-specific hydraulic conductance (KL) isknown to decrease with tree age [66, 67].
Conclusion
For the studied subtropical forest community, we demonstrated a clear link of KS
and Y50 with functional traits, and particularly with leaf nitrogen concentration,log leaf area and leaf carbon to nitrogen ratio. Thus, easily measured leaf traitsfrom the LES have the potential to predict plant species’ drought resistance.However, current knowledge on xylem vulnerability and traits from otherecosystems do not allow generalizing from these results. In addition, our findingof an absence of any relationship between parameters of stomatal control raisesthe question whether stomatal control as characteristics that are an independentaxis of the LES might be related to an axis of xylem characteristics that areindependent of specific xylem hydraulic conductivity and xylem vulnerability.
Supporting Information
Figure S1. Raw data for the vulnerability curves of the 39 study speciesanalyzed. Filled dots represent measured data, empty dots show estimated Y50
values and the broken lines represent the fitted models of xylem vulnerability. Forspecies abbreviations see Table 1.doi:10.1371/journal.pone.0109211.s001 (PNG)
Xylem Hydraulic Conductivity and Vulnerability in 39 Subtropical Trees
PLOS ONE | DOI:10.1371/journal.pone.0109211 November 25, 2014 20 / 24

69
Table S1. Trait raw data for the 39 study species analyzed. For trait codes andfull species names, please see Tables 1 and 2.doi:10.1371/journal.pone.0109211.s002 (TXT)
Acknowledgments
We are very grateful for the help of Xuefei Yang, Sabine Both, Lin Chen andXiaojuan Liu in coordinating the fieldwork for the BEF-China experiment. Wealso thank the whole BEF-China research group for their general support. Inaddition, we would like to thank Ricardo Schops, Ricarda Pohl and Michael Staabfor their support in the lab. Special thanks are due to Tim Langhammer andStefan Posch for providing data on the xylem structure and to Peter Kuhn forproviding climate data.
Author ContributionsConceived and designed the experiments: WK SZ ME HB. Performed theexperiments: WK ME. Analyzed the data: WK HB. Contributed reagents/materials/analysis tools: WK SZ ME HB. Wrote the paper: WK SZ ME HB.
References
1. Wright IJ, Reich PB, Westoby M, Ackerly DD, Baruch Z, et al. (2004) The worldwide leaf economicsspectrum. Nature 428: 821–827.
2. Reich PB, Ellsworth DS, Walters MB, Vose JM, Gresham C, et al. (1999) Generality of leaf traitrelationships: A test across six biomes. Ecology 80: 1955–1969.
3. Shipley B, Lechowicz MJ, Wright I, Reich PB (2006) Fundamental trade-offs generating the worldwideleaf economics spectrum. Ecology 87: 535–541.
4. Cornelissen JHC, Wright IJ, Reich PB, Falster DS, Garnier E, et al. (2005) Assessing the generalityof global leaf trait relationships. New Phytol 166: 485–496.
5. Santiago LS (2007) Extending the leaf economics spectrum to decomposition: evidence from a tropicalforest. Ecology 88: 1126–1131.
6. Osnas JLD, Lichstein JW, Reich PB, Pacala SW (2013) Global leaf trait relationships: mass, area, andthe leaf economics spectrum. Science 340: 741–744.
7. Krober W, Bruelheide H (2014) Transpiration and stomatal control: A cross-species study of leaf traitsin 39 evergreen and deciduous broadleaved subtropical tree species. Trees 28: 901–914.
8. Baraloto C, Paine C, Poorter L, Beauchene J, Bonal D, et al. (2010) Decoupled leaf and stemeconomics in rain forest trees. Ecol Letters 13: 1338–1347.
9. Freschet GT, Cornelissen JHC, van Logtestijn RSP, Aerts R (2010) Evidence of the ‘‘plant economicsspectrum’’ in a subarctic flora. J Ecol 98: 362–373.
10. Lambers H, Chapin F III, Pons T (2008) Plant Physiological Ecology. 2nd ed. Berlin: Springer. 623 pp.
11. Sperry J, Choat B, Jansen S, Brodribb TJ, Cochard H, et al. (2012) Global convergence in thevulnerability of forests to drought. Nature 491: 752–755.
12. Poorter L, Mcdonald I, Alarcon A, Fichtler E, Licona J-C, et al. (2010) The importance of wood traitsand hydraulic conductance for the performance and life history strategies of 42 rainforest tree species.New Phytol 185: 481–492.
Xylem Hydraulic Conductivity and Vulnerability in 39 Subtropical Trees
PLOS ONE | DOI:10.1371/journal.pone.0109211 November 25, 2014 21 / 24

70
13. Sack L, Frole K (2006) Leaf structural diversity is related to hydraulic capacity in tropical rain foresttrees. Ecology 87: 483–491.
14. Brodribb TJ, Feild TS, Jordan GJ (2007) Leaf maximum photosynthetic rate and venation are linked byhydraulics. Plant Physiol 144: 1890–1898.
15. Sack L, Scoffoni C, John GP, Poorter H, Mason CM, et al. (2013) How do leaf veins influence theworldwide leaf economic spectrum? Review and synthesis. J Exp Bot 64: 4053–4080.
16. Chave J, Coomes D, Jansen S, Lewis SL, Swenson NG, et al. (2009) Towards a worldwide woodeconomics spectrum. Ecol Letters 12: 351–366.
17. Fu P-L, Jiang Y-J, Wang A-Y, Brodribb TJ, Zhang J-L, et al. (2012) Stem hydraulic traits and leafwater-stress tolerance are co-ordinated with the leaf phenology of angiosperm trees in an Asian tropicaldry karst forest. Ann Bot-London 110: 189–199.
18. Sperry J, Donelly J, Tyree MT (1988) A method for measuring hydraulic conductivity and embolism inxylem. Plant Cell Environ 11: 35–40.
19. Hacke U, Sperry J (2000) Functional and ecological xylem anatomy. PPEES 4: 97–115.
20. Tyree MT, Zimmermann MH (2002) Xylem Structure and the Ascent of Sap. 2nd ed. Berlin: Springer.302 pp.
21. Kursar TA, Engelbrecht BM, Burke A, Tyree MT, EI Omari B, et al. (2009) Tolerance to low leaf waterstatus of tropical tree seedlings is related to drought performance and distribution. Funct Ecol 23: 93–102.
22. Engelbrecht BM, Kursar TA (2003) Comparative drought-resistance of seedlings of 28 species of co-occurring tropical woody plants. Oecologia 136: 383–393.
23. Fonseca CR, Overton JM, Collins B, Westoby M (2000) Shifts in trait-combinations along rainfall andphosphorus gradients. J Ecol 88: 964–977.
24. Skarpe C (1996) Plant functional types and climate in a southern African savanna. J Veg Sci 7: 397–404.
25. Brodribb TJ, Jordan GJ (2008) Internal coordination between hydraulics and stomatal control in leaves.Plant Cell Environ 31: 1557–1564.
26. Cochard H, Breda N, Granier A (1996) Whole tree hydraulic conductance and water loss regulation inQuercus during drought: evidence for stomatal control of embolism? Ann For Sci 53: 197–206.
27. Choat B, Ball MC, Luly JG, Holtum JAM (2005) Hydraulic architecture of deciduous and evergreen dryrainforest tree species from north-eastern Australia. Trees 19: 305–311.
28. Walter H, Lieth H (1967) Klima-Diagramm Weltatlas. Jena: Gustav Fischer Verlag. 250 pp.
29. Bruelheide H, Nadrowski K, Assmann T, Bauhus J, Both S, et al. (2014) Designing forest biodiversityexperiments: general considerations illustrated by a new large experiment in subtropical China. MethodsEcol Evol 5: 74–89.
30. Yang X, Bauhus J, Both S, Fang T, Hardtle W, et al. (2013) Establishment success in a forestbiodiversity and ecosystem functioning experiment in subtropical China (BEF-China). Eur J Forest Res132: 593–606.
31. Bruelheide H, Bohnke M, Both S, Fang T, Assmann T, et al. (2011) Community assembly duringsecondary forest succession in a Chinese subtropical forest. Ecol Monogr 81: 25–41.
32. Ennajeh M, Simoes F, Khemira H, Cochard H (2011) How reliable is the double-ended pressure sleevetechnique for assessing xylem vulnerability to cavitation in woody angiosperms? Physiologia Plant 142:205–210.
33. Melcher PJ, Michele Holbrook N, Burns MJ, Zwieniecki MA, Cobb AR, et al. (2012) Measurementsof stem xylem hydraulic conductivity in the laboratory and field. Methods Ecol Evol 3: 685–694.
34. Perez-Harguindeguy N, Dıaz S, Garnier E, Lavorel S, Poorter H, et al. (2013) New handbook forstandardised measurement of plant functional traits worldwide. Aust J Bot 61: 167–234.
35. Cochard H, Badel E, Herbette S, Delzon S, Choat B, et al. (2013) Methods for measuring plantvulnerability to cavitation: a critical review. J Exp Bot 64: 4779–4791.
Xylem Hydraulic Conductivity and Vulnerability in 39 Subtropical Trees
PLOS ONE | DOI:10.1371/journal.pone.0109211 November 25, 2014 22 / 24

71
36. Hendry G, Grime J (1993) Methods in comparative Plant Ecology: a laboratory Manual. London:Chapman & Hall. 252 pp.
37. Gerlach D (1984) Botanische Mikrotechnik. Stuttgart, New York: Thieme. 289 pp.
38. Sperry J, Nichols KL, Sullivan JEM, Eastlack SE (1994) Xylem embolism in ring-porous, diffuse-orous, and coniferous trees of Northern Utah and interior Alaska. Ecology 75: 1736.
39. Vander Willigen C, Sherwin HW, Pammenter NW (2000) Xylem hydraulic characteristics of subtropicaltrees from contrasting habitats grown under identical environmental conditions. New Phytol 145: 51–59.
40. Domec J, Gartner BL (2001) Cavitation and water storage capacity in bole xylem segments of matureand young Douglas-fir trees. Trees 15: 204–214.
41. Bohnke M, Krober W, Welk E, Wirth C, Bruelheide H (2013) Maintenance of constant functionaldiversity during secondary succession of a subtropical forest in China. J Veg Sci 25: 897–911.
42. Markesteijn L, Poorter L, Paz H, Sack L, Bongers F (2011) Ecological differentiation in xylemcavitation resistance is associated with stem and leaf structural traits. Plant Cell Environ 34: 137–148.
43. Sperry J, Tyree MT (1989) Vulnerability of xylem to cavitation and embolism. Annu Rev Plant Biol 40:19–36.
44. Cavender-Bares J, Kitajima K, Bazzaz FA (2004) Multiple trait associations in relation to habitatdifferentiation among 17 Floridian oak species. Ecol Monogr 74: 635–662.
45. Maherali H, Pockman WT, Jackson RB (2004) Adaptive variation in the vulnerability of woody plants toxylem cavitation. Ecology 85: 2184–2199.
46. Brodribb TJ, Holbrook NM, Edwards E, Gutierrez MRVA (2003) Relations between stomatal closure,leaf turgor and xylem vulnerability in eight tropical dry forest trees. Plant Cell Environ 26: 443–450.
47. Willson CJ, Manos PS, Jackson RB (2008) Hydraulic traits are influenced by phylogenetic history inthe drought-resistant, invasive genus Juniperus (Cupressaceae). Am J Bot 95: 299–314.
48. Vinya R, Malhi Y, Brown N, Fisher JB (2012) Functional coordination between branch hydraulicproperties and leaf functional traits in miombo woodlands: implications for water stress management andspecies habitat preference. Acta Physiol Plant 34: 1701–1710.
49. Bell P (2000) Green Plants: their Origin and Diversity. Cambridge: Cambridge Univ Pr. 349 pp.
50. Sack L, Cowan PD, Jaikumar N, Holbrook NM (2003) The ‘‘hydrology’’ of leaves: co-ordination ofstructure and function in temperate woody species. Plant Cell Environ 26: 1343–1356.
51. Chen J-W, Zhang Q, Cao K-F (2009) Inter-species variation of photosynthetic and xylem hydraulic traitsin the deciduous and evergreen Euphorbiaceae tree species from a seasonally tropical forest in south-western China. Ecol Res 24: 65–73.
52. Fan ZX, Zhang S-B, Hao GY, Ferry Slik JW, Cao K-F (2012) Hydraulic conductivity traits predict growthrates and adult stature of 40 Asian tropical tree species better than wood density. J Ecol 100: 732–741.
53. Givnish T (2002) Adaptive significance of evergreen vs. deciduous leaves: solving the triple paradox.Silva Fenn 36: 703–743.
54. Aerts R (1995) The advantages of being evergreen. Trends Ecol Evol 10: 402–407.
55. Litvak E, McCarthy HR, Pataki DE (2012) Transpiration sensitivity of urban trees in a semi-arid climateis constrained by xylem vulnerability to cavitation. Tree Physiol 32: 373–388.
56. Choat B, Sack L, Holbrook NM (2007) Diversity of hydraulic traits in nine Cordia species growing intropical forests with contrasting precipitation. New Phytol 175: 686–698.
57. Hacke UG, Sperry J, Wheeler JK, Castro L (2006) Scaling of angiosperm xylem structure with safetyand efficiency. Tree Physiol 26: 689–701.
58. Markesteijn L, Poorter L, Bongers F, Paz H, Sack L (2011) Hydraulics and life history of tropical dryforest tree species: coordination of species’ drought and shade tolerance. New Phytol 191: 480–495.
59. Tyree MT, Davis SD, Cochard H (1994) Biophysical perspectives of xylem evolution: is there a tradeoffof hydraulic efficiency for vulnerability to dysfunction? IAWA J 15: 335–360.
60. Martınez-Vilalta J, Prat E, Oliveras I, Pinol J (2002) Xylem hydraulic properties of roots and stems ofnine Mediterranean woody species. Oecologia 133: 19–29.
Xylem Hydraulic Conductivity and Vulnerability in 39 Subtropical Trees
PLOS ONE | DOI:10.1371/journal.pone.0109211 November 25, 2014 23 / 24

72
61. Jarbeau JA, Ewers FW, Davis SD (1995) The mechanism of water-stress-induced embolism in twospecies of chaparral shrubs. Plant Cell Environ 18: 189–196.
62. Hargrave KR, Kolb KJ, Ewers FW, Davis SD (1994) Conduit diameter and drought-induced embolismin Salvia mellifera Greene (Labiatae). New Phytol 126: 695–705.
63. Box E, Peet R, Masuzawa T, Yamada I, Fujiwara K, et al, editors (1995) Vegetation Science inForestry. Dordrecht: Kluwer Academic Publishers. 664 pp.
64. Domec JC, Gartner BL (2003) Relationship between growth rates and xylem hydraulic characteristics inyoung, mature and old-growth ponderosa pine trees. Plant Cell Environ 26: 471–483.
65. Rosner S, Klein A, Muller U, Karlsson B (2008) Tradeoffs between hydraulic and mechanical stressresponses of mature Norway spruce trunk wood. Tree Physiol 28: 1179–1188.
66. McDowell N, Phillips N, Lunch C, Bond B, Ryan M (2002) An investigation of hydraulic limitation andcompensation in large, old Douglas-fir trees. Tree Physiol 22: 763–774.
67. Delzon S, Sartore M, Burlett R, Dewar R, Lousteau D (2004) Hydraulic responses to height growth inmaritime pine trees. Plant Cell Environ 27: 1077–1087.
Xylem Hydraulic Conductivity and Vulnerability in 39 Subtropical Trees
PLOS ONE | DOI:10.1371/journal.pone.0109211 November 25, 2014 24 / 24

73

74

75
Chapter 4
LEAF MORPHOLOGY OF 40 EVERGREEN AND DECIDUOUS
BROADLEAVED SUBTROPICAL TREE SPECIES AND RELATIONSHIPS TO
FUNCTIONAL ECOPHYSIOLOGICAL TRAITS
Wenzel Kröber, Heike Heklau & Helge Bruelheide
Plant Biology (2014) in Press

76

77
RESEARCH PAPER
Leaf morphology of 40 evergreen and deciduous broadleavedsubtropical tree species and relationships to functionalecophysiological traitsW. Kr€ober1, H. Heklau1 & H. Bruelheide1,2
1 Institute of Biology/Geobotany and Botanical Garden, Martin-Luther-University Halle-Wittenberg, Halle, Germany
2 German Centre for Integrative Biodiversity Research (iDiv) Halle-Jena-Leipzig, Leipzig, Germany
Keywords
BEF-China; ecophysiological traits; leaf
anatomical traits; leaf functional traits;
subtropics; trees.
Correspondence
W. Kr€ober, Institute of Biology/Geobotany and
Botanical Garden, Martin-Luther-University
Halle-Wittenberg, Am Kirchtor 1, D-06108
Halle (Saale), Germany.
E-mail: [email protected]
Editor
J. Sparks
Received: 28 July 2014; Accepted: 15 August
2014
doi:10.1111/plb.12250
ABSTRACT
We explored potential of morphological and anatomical leaf traits for predicting eco-physiological key functions in subtropical trees. We asked whether the ecophysiologicalparameters stomatal conductance and xylem cavitation vulnerability could be predictedfrommicroscopy leaf traits. We investigated 21 deciduous and 19 evergreen subtropicaltree species, using individuals of the same age and from the same environment in theBiodiversity-Ecosystem Functioning experiment at Jiangxi (BEF-China). Information-theoretic linear model selection was used to identify the best combination of morpho-logical and anatomical predictors for ecophysiological functions. Leaf anatomy andmorphology strongly depended on leaf habit. Evergreen species tended to have thickerleaves, thicker spongy and palisade mesophyll, more palisade mesophyll layers and athicker subepidermis. Over 50% of all evergreen species had leaves with multi-layeredpalisade parenchyma, while only one deciduous species (Koelreuteria bipinnata) hadthis. Interactions with leaf habit were also included in best multi-predictor models forstomatal conductance (gs) and xylem cavitation vulnerability. In addition, maximum gswas positively related to log ratio of palisade to spongy mesophyll thickness. Vapourpressure deficit (vpd) for maximum gs increased with the log ratio of palisade to spongymesophyll thickness in species having leaves with papillae. In contrast, maximumspecific hydraulic conductivity and xylem pressure at which 50% loss of maximumspecific xylem hydraulic conductivity occurred (Ψ50) were best predicted by leafhabit and density of spongy parenchyma. Evergreen species had lower Ψ50 valuesand lower maximum xylem hydraulic conductivities. As hydraulic leaf and woodcharacteristics were reflected in structural leaf traits, there is high potential foridentifying further linkages between morphological and anatomical leaf traits andecophysiological responses.
INTRODUCTION
Plant functional traits have been successfully used to link bio-logical diversity to ecosystem functioning (EF) of communities(Garnier et al. 2004; D"ıaz et al. 2007). However, the assessmentof physiologically relevant traits often requires high expendi-ture of time and lab resources. For example, determination ofxylem cavitation vulnerability as a measure of drought stressrequires several hours per sample (Sperry et al. 1988; Kr€oberet al. 2014). Hence, there are only a few multi-species studiesthat connect leaf traits to more than a single ecophysiologicalresponse. However, establishing relationships between leaftraits and ecophysiological mechanisms across large species setswould certainly improve our understanding of ecosystem func-tioning (Sack & Holbrook 2006). For many leaf traits, the func-tional relevance is well known. For example, specific leaf area(SLA) was found to be closely linked to mass-based photosyn-thesis and respiration rates (Wright et al. 2004). In addition,leaves with low SLA are physically more robust, less prone toherbivory and tend to have a longer life span (Sterck et al.
2006). It should be considered that functional relationships ofecophysiological responses to leaf traits might not be universal,but are only valid in a specific context. For example, low SLAwas found to be only associated with higher shade tolerance inevergreen species, but only weakly in deciduous trees (Lusk &Warton 2007). For many other leaf traits, links to ecophysio-logical functions still have to be established. In particular, ourknowledge is limited on how morphological and anatomicalleaf traits are related to physiologically relevant wood traits(Zanne et al. 2010; B€ohnke et al. 2011).Many structural leaf traits vary with the evergreen or decidu-
ous leaf habit. In particular, evergreen leaves are often sclero-phyllous and associated with a lower SLA, lower leaf nitrogencontent and lower mass-based photosynthetic capacity (Reichet al. 1997; Shipley et al. 2006; Curtis & Ackerly 2008), whichresults in increased durability and leaf life span (Medina 1984).In contrast, deciduous leaves are often mesophyllous or hydro-phyllous. Because of higher elasticity of leaf cells, deciduousspecies with mesophyllous leaves display more variation in cellvolume but only tolerate small variation in leaf water potential
Plant Biology © 2014 German Botanical Society and The Royal Botanical Society of the Netherlands 1
Plant Biology ISSN 1435-8603

78
(Ψ) as compared to evergreen species with sclerophyllousleaves (Sobrado 1986). Since Orians & Solbrig (1977) pub-lished their seminal paper on the trade-off between photosyn-thetic capacity and leaf longevity, many studies at the global(Kikuzawa 1991; Reich et al. 1997; Cornelissen et al. 2005) orregional scale (Mulkey et al. 1995; Diemer 1998; Pringle et al.2011) have supported this view. Meanwhile, the concept of theleaf economics spectrum (LES; Wright et al. 2004) that reflectsthis trade-off has become widely accepted in trait-based ecol-ogy. The LES describes a universal spectrum of leaf economicsconsisting of key chemical, structural and physiological proper-ties. The spectrum runs from rapid to slow return on invest-ment in nutrients and dry mass of leaves, and operates largelyindependently of growth form, plant functional type or biome(Wright et al. 2004). However, much less attention has beenpaid to other ecophysiological functions that are not reflectedin the LES or morphological traits other than leaf longevity orleaf toughness. One example of such a key ecophysiologicalfunction is xylem vulnerability. Comparing four species, eachof deciduous and evergreen leaf habit from Costa Rican drytropical forests, Brodribb et al. (2003) did not find a close linkbetween xylem vulnerability and leaf traits, and in particular,no link to leaf habit. In contrast, Kr€ober et al. (2014) encoun-tered significantly lower values of maximum specific hydraulicconductivity and lower Ψ50 values (xylem pressure at which50% loss of maximum specific hydraulic conductivity occurs)in evergreen than deciduous species. Accordingly, Ψ50
decreased with leaf nitrogen content and log leaf area andincreased with leaf carbon-to-nitrogen ratio. However, struc-tural leaf traits such as thickness of the epidermis or wax layershave not yet been tested for relationships to xylem cavitationresistance.In another study, Kr€ober & Bruelheide (2014) established
links between parameters of stomatal control and traits of theLES. There was a positive relationship of stomatal conductance(gs) to leaf nitrogen content and a negative one to the leaf car-bon-to-nitrogen ratio. In contrast, stomatal control parame-ters, which were derived from the conductance–vapourpressure deficit (vpd) curve, were not related to the LES but tostomatal traits. The stomatal traits, in turn, were unrelated tothe LES. The vpd at the point of inflection of the conductance–vpd curve was the higher, the lower the stomata density andthe higher the leaf carbon content. Furthermore, maximumconductance was positively associated with leaf carbon contentand vein length. However, Kr€ober & Bruelheide (2014) onlyconsidered leaf traits related to stomata and veins and did notexplore relationships to other anatomical and morphologicaltraits.The expectation of connections between leaf morphology
and leaf functionality is based on the fundamental idea that leafstructure reflects functional coordination (Sis"o et al. 2001; Sacket al. 2003). For example, a less densely packed leaf has moreextensive intercellular spaces, which should facilitate CO2 andH2O diffusion, and thus be connected to stomatal or xylemconductance. However, Aasamaa et al. (2001) did not find thevolume of intercellular space to be related to specific hydraulicconductivity. The leaf anatomy, in particular the regulararrangement of palisade mesophyll cells, affects light percep-tion of deeper cell layers, and thus has consequences forphotosynthetic efficiency (Smith & Hughes 2009). The regulararrangement of palisade mesophyll cells is thought to efficiently
absorb incident radiation of high intensity, whereas spongymesophyll results in higher scattering of light, which increasesabsorption at low light intensities (Beck 2010). The fact thatthicker mesophyll requires increased gas exchange per leaf unitarea explains why Sack & Frole (2006) found palisade meso-phyll thickness to be negatively correlated with xylem hydraulicconductance in a set of ten tropical rain forest tree species. Fur-thermore, leaf hydraulic conductance was positively related tothe ratio of palisade to spongy mesophyll thickness. This ratioof thickness of the two types of photosynthetically active tissueshas been highlighted as being tightly correlated to leaf venationmore than 50 yrs ago (Wylie 1946). The underlying mechanis-tic explanation is that with increasing ratio of palisade tospongy mesophyll thickness, the density of chloroplasts perunit leaf volume increases. This translates into higher photo-synthesis rates per unit leaf area. This is only true up to a cer-tain threshold of the palisade to spongy mesophyll thicknessratio, since some spongy mesophyll is required for intercellulargas diffusion. Popma et al. (1992) reported that lowland rainforest species in Mexico having leaves of high photosyntheticcapacity had thicker palisade parenchyma and higher palisadeto spongy parenchyma ratios. For five dipterocarp rain foresttree species, Kenzo et al. (2004) found leaf thickness and pali-sade layer thickness to be strongly correlated to photosyntheticcapacity. Leaf hydraulic conductance was also linked positivelyto leaf thickness in temperate woody species (Sack et al. 2003).Finally, light absorption not only depends on the thickness andstructure of the green mesophyll but also on epidermal traits.For example, Vogelmann et al. (1996a) reported that leaf epi-dermal cells can enhance photosynthesis through focusing lightonto the underlying mesophyll.The morphological and anatomical leaf structure is also
expected to affect transpiration and drought resistance. Ingeneral, thin-leaved plants with high SLA are consideredmore vulnerable to drought stress than those with thick androbust leaves (Mediavilla et al. 2001; Li et al. 2009). As lowSLA leaves transpire less water, they would be expected tohave higher water use efficiency (WUE). However, in astudy with six poplar species, Cao et al. (2012) found intrin-sic WUE not to be related to SLA but only to increase withabaxial stomatal density and decrease with vessel lumen area.In contrast to SLA and mesophyll traits, the structure of theepidermis and the cuticle has received surprisingly littleattention in comparative studies. As both a thick outer epi-dermal wall and a cuticle reinforced with wax layers shoulddecrease transpiration during stomata closure, they would beexpected to occur predominantly in leaves with high WUE.Accordingly, water permeability of epicuticular waxes hasbeen reported to be positively correlated with plant sensitiv-ity to vpd (Kerstiens 1997). However, linking water perme-ation across the cuticle directly to its structure orcomposition has turned out to be difficult (Riederer &Schreiber 2001) because the cuticle and epicuticular waxesalso have additional functions, such as protecting the leaffrom radiation, insect herbivory and microbial infection(Kerstiens 2006; Pruem et al. 2012).Similarly, trichomes are thought to play an important role in
leaf hydraulic properties. Similar to the cuticle, trichomes alsohave multiple functions: temperature insulation, reflection ofradiation, increase in boundary layer thickness, and thusincrease in the gas diffusion pathway, reduced ion leaching and
Plant Biology © 2014 German Botanical Society and The Royal Botanical Society of the Netherlands2
Tree leaf morphology and functional trait relationships Kr€ober, Heklau & Bruelheide

79
trapping of moisture on the leaf surface (Gutschick 1999; Press1999; Gates 2003).In summary, relationships between ecophysiology and leaf
morphology and anatomy are only partly established, althoughthe need to compare these relationships across different lifeforms and habitats has been pointed out (Sack & Holbrook2006). We set out to analyse these structure–function relation-ships using four ecophysiological key traits with high relevancefor species performance and survival as functional responses.In addition, we investigated interrelationships among leafmicroscopy traits, with particular emphasis on the species’evergreen or deciduous leaf habit. Thus, we asked whichmicroscopy leaf traits were connected to: (i) stomatal regula-tion, expressed as the absolute maximum fitted stomatal con-ductance and to vpd at the maximum modelled stomatalconductance–vpd relationship, and (ii) maximum xylem spe-cific hydraulic conductivity and xylem hydraulics, expressed asxylem pressure at which 50% loss of maximum specifichydraulic conductivity occurs (Ψ50). To our knowledge, ourstudy is the first that explores such functional–morphologicalrelationships systematically across a large set of plant species.
MATERIAL AND METHODS
Plant material
We studied the leaf anatomy of 40 indigenous tree species(Table S4), which are all typical of the subtropical monsoonforest in southeast China, Jiangxi Province (http://www.bef--china.de). Warm and humid summers and dry winters withoccasional frost events characterise the local subtropical cli-mate. Mean annual precipitation at the study site is 1821 mmand mean annual temperature is 16.7 °C, measured from 1971to 2000 (Yang et al. 2013). The sampled plants were all plantedin the Biodiversity-Ecosystem Functioning experiment (BEF-China) as 1-year-old or 2-year-old saplings in 2008 and 2009.Total tree number in the experiment is 219,000, arranged in566 plots with 400 tree individuals per plot on an area of 38 ha(Bruelheide et al. 2014). The studied 40 tree species represent19 families (Table S4). According to their representation in thenatural forests in a nearby nature reserve (Bruelheide et al.2011), some families were planted with numerous species, e.g.Fagaceae (12 species), Lauraceae (five), Sapindaceae (three)and Elaeocarpaceae (three). In total, 19 and 21 species wereevergreen and deciduous, respectively (Table S4).
Leaf sampling
Five leaves were sampled each from five randomly chosen indi-viduals per species (in total 25 leaves) for leaf trait analyses(SLA and microscopy leaf traits), taking the five individualsfrom different plots. Only fully exposed healthy sun leaves withno visible damage from e.g. herbivory were sampled, with afocus on sampling at comparable plant heights. SLA was mea-sured following Cornelissen et al. (2003). The microscopy traitswere measured in accordance to Gerlach (1984), with at leastthree replicates per nominal trait and species and at least 30replicates per numerical trait and species. A full list of the mor-phological traits studied is provided in Table S8.The four functional leaf traits related to stomatal conduc-
tance and hydraulic xylem properties (CONMAXFITA,
absolute maximum of fitted stomatal conductance; VPDMAX-FIT, vpd at maximum of modelled gs–vpd relationship; HYDC-OND, maximum specific xylem hydraulic conductivity; PSI50,xylem pressure Ψ50, at which 50% loss of maximum specifichydraulic conductivity occurs) were assessed in two precedingstudies (Kr€ober & Bruelheide 2014; Kr€ober et al. 2014). Stoma-tal conductance was measured with a SC1 porometer (Deca-gon, Pullman, WA, USA), based on steady-state technology.Daily courses were measured on at least three individuals perspecies, always on the same leaf, in the high-diversity plots ofthe experiment. Then gs–vpd relationships were aggregated byspecies. To derive parameters of stomatal control, we modelledthese species-specific gs–vpd relationships by regressing the log-its of gs/gsmax to vpd and the quadratic term of vpd using a gen-eralised linear model with binomial error distribution. Fromthese relationships, we extracted the absolute maximum fittedconductance as the maximum value of the fitted model and thevpd, thus the corresponding x-value for the maximum of themodelled gs–vpd relationship for every species. By making useof logits we ensured that modelled maximum values (CON-MAXFIT) did not exceed gsmax, and that gs approached zero athigh vpd. For further details see Kr€ober & Bruelheide (2014).A second study focused on xylem vulnerability. Using three
samples per species, maximum specific xylem hydraulic con-ductivity and Ψ50 were investigated. Freshly sampled twigswere placed in a cavitation chamber (PMS 1505D-EXP; PMSInstrument Co., Albany, OR, USA) connected to a Scholanderpressure chamber (PMS M1000), and air was flushed out fromprevious embolism events following established protocols(Sperry et al. 1988; Perez-Harguindeguy et al. 2013). To ensurethat all air was evacuated from the xylem, the twig segmentswere flushed for 1 h with 10 mM citric acid perfusion solution,using filtered and demineralised water at 0.15 MPa. Maximumspecific xylem hydraulic conductivity was measured as the massof water through-flow per time, related to the length of thetwig and to the cross-sectional area of the twig. Then, withincreasing air pressure, we simulated decreasingly negativewater potentials and determined the xylem cavitation sensitiv-ity by applying a sigmoid, three-parameter regression to thevulnerability data, where KS is the specific hydraulic conductiv-ity of the xylem (kg!m"1!s"1!MPa"1; thus it is related to cross-sectional area). Ψ is the xylem pressure at which water flowwas measured (MPa); Ψ50 is defined as the point of xylem pres-sure at which 50% loss of the original maximum specifichydraulic conductivity occurs. For further information seeKr€ober et al. (2014).
Anatomical preparations
We applied traditional botanical microtechniques as describedin Gerlach (1984). Formalin–acetic acid–70% alcohol (FAA;5 ml 40% formaldehyde, 5 ml glacial acetic acid, 90 ml 70%ethanol) was used as fixing agent to prepare microscope slides.Transverse sections of leaves, enclosed in natural cork, weremade with a Reichert slide microtome at a thickness of 20–30 lm. Safranin was used to red-stain lignified tissue and Astrablue or alcian blue to blue-stain non-lignified cell walls. First,the sections were placed in Astra blue or alcian blue for 5 min,washed in distilled water, placed in Safranin (1% Safranin in50% alcohol) for 2–5 min and transferred to 50% alcohol.After dehydration through an alcohol series (50%, 70%, 92%
Plant Biology © 2014 German Botanical Society and The Royal Botanical Society of the Netherlands 3
Kr€ober, Heklau & Bruelheide Tree leaf morphology and functional trait relationships

80
and 100% alcohol), the sections were placed in Histo-Clear!
(distilled essential oils, food grade) or xylene and mounted inEuparal or Canada balsam. The embedded sections were driedin the laboratory oven at 60 °C overnight.
Light microscopy features
Slides were examined under a light microscope (Zeiss Axio-skop 2; Zeiss, Jena, Germany) and digital photographs taken(Zeiss Axio Cam MRc). Measurements of leaf anatomy char-acteristics were made using the Axio Vision software (Zeiss,Rel. 4.8). Leaf transverse sections were prepared to measurethickness of the upper and lower epidermis, palisade andspongy parenchyma. In each leaf transverse section, ten mea-surements were made and averaged. In addition, we calcu-lated the log10 ratio between thickness of palisade to spongyparenchyma (Table S8). The epidermis as a boundary tissueis build from one layer of cells; however, in several species,we found multilayer epidermal structures and defined thelayer beneath the final layer as subepidermis. Density of thespongy parenchyma was assessed optically in three ordinalcategories in relation to the frequency of intercellular spaces,and classified as: 0 = extensive intercellular space; 0.5 = someintercellular spaces; 1.0 = closely packed cells.
Scanning electron microscopy (SEM)
For sample preparation and investigation of the adaxial andabaxial leaf surfaces, we used the scanning electron microscopeat the Jodrell Laboratory of the Royal Botanic Gardens, Kew(UK). Minute parts of leaves were fixed in 70% ethanol insmall-sized caskets and dehydrated in an ethanol series (70%,90% and 100%). To remove liquid in a controlled way, thedehydrated samples were subjected to supercritical drying in aTousimus critical point dryer. This procedure avoids damageto delicate structures, such as breakage of cell walls throughsurface tension as the boundary of liquid–gas transition movesby. Supercritical drying employs high temperature and highpressure to avoid crossing phase boundaries. The fluid usedwas CO2, which has equal density to the liquid and vapourphase at the critical point. In the Tousimus critical point dryerliquid CO2 is heated to the critical point (31.04 °C), at whichtime pressure can be gradually released, allowing the gas toescape and leaving dried samples. Subsequently, the minute leafsamples were removed from the caskets and mounted on stubsusing double-sided Sellotape. The stubs with the samples wereput in the Quorum sputter coater Q150 T (Quorum Technolo-gies, Lewes, UK) and coated with platinum under an argon gasatmosphere for 60 s. Subsequently, the platinum-coated sam-ples on the stubs were subjected to Field Emissions ScanningElectron microscopy (Hitachi S-4700 II; Hitachi, Krefeld, Ger-many). The digital SEM images of the 40 species were used fordescription of leaf cuticle characters. The cuticle is basically atwo-layered sheet of lipids, wax and cutin and hydroxyl fattyacids. In addition, the cuticle contains small amounts of othersubstances, such as phenolic compounds. We classified epicu-ticular waxes and cuticle characteristics following Ditsch &Barthlott (1997). Cuticle characteristics were recorded on bothsides of the leaf, recording type of ornamentation of the outersurface of the cuticle (cuticular folding) and presence orabsence of papillae, using the classification of Wilkinson (1979;
see Table S8). Trichomes were classified as simple, stellate orbifurcate hairs.
Statistics
All numerical leaf traits were tested for differences betweendeciduous and evergreen leaf habit using ANOVA. To revealtrait interrelationships, the 17 binary, numeric or ordinalleaf traits listed in Table S8 were subjected to a principalcoordinate analysis (PCoA). We calculated Gower’s distanceto simultaneously handle traits of different scales using theade4 package of R (Dray & Dufour 2007; Pavoine et al.2009). The correlations between traits and PCoA axes wereobtained by post-hoc correlation using the envfit functionin the vegan package (Oksanen et al. 2013). Particularlyrelevant relationships were confirmed with bivariate linearregressions and Pearson correlations. Additional analyseswere carried out for relationships to the four selected keyecophysiological traits: CONMAXFITA, VPDMAXFIT,HYDCOND and PSI50. Differences in these four ecophysi-ological traits between the four categorical cuticle charac-teristics (cuticular folding and presence or absence ofpapillae, both on upper and lower leaf surface) were testedusing separate one-factorial ANOVA for each ecophysiologicalvariable. To test for relationships between the four keyecophysiological traits to morphological traits we usedlinear regression model selection based on information the-ory. In a first step, the best linear combination of maineffects for the 14 non-nominal traits in Table S8 wereidentified using step-wise forward selection, according tothe Akaike Information Criterion (AIC) in different mod-els, each predicting one of the four ecophysiological traits.These analyses revealed that a maximum of three predictorvariables was included in the best models. In a secondstep, we calculated all models with all possible combina-tions of these 13 traits, allowing models with up to threepredictor terms. As we were particularly interested in therole of leaf habit, we also included all possible twofoldinteractions with leaf habit as possible model terms. Thebest model was identified using the dredge routine of theMuMIn package (Barton 2014). All statistical analyses andplots were conducted with the R software version 3.1.0 (RCore Team 2014).
RESULTS
Morphology and anatomy of leaves
Leaf thickness ranged from 105 lm (Sapindus saponaria; Fig.S1E) to 367 lm (Manglietia yuyuanensis; Fig. S1D), with amean of 180 lm (Table 1). While the deciduous species hadthe lower range in leaf thickness (105–218 lm), the evergreentrees ranged from 137 lm to 367 lm. All leaves studied weredorsiventral. Differences between evergreen and deciduous spe-cies were especially evident in the number of layers of palisadeparenchyma. More than half of evergreen species had leaveswith multi-layered palisade parenchyma (e.g. Daphniphyllumoldhamii; Fig. S1A; Castanopsis sclerophylla; Fig. S1C), whileonly one deciduous species (Koelreuteria bipinnata) had two-to three-layered palisade parenchyma. For further details of themean values of the numerical leaf traits and their distribution,
Plant Biology © 2014 German Botanical Society and The Royal Botanical Society of the Netherlands4
Tree leaf morphology and functional trait relationships Kr€ober, Heklau & Bruelheide

81
see Table 1. The complete raw data trait set for all study speciescan be found in Table S5. Most deciduous species (76%) hadleaves with mono-layered palisade parenchyma, which wasoften very extensive, especially in Rhus chinensis (Fig. S1F).Among the evergreen species, only Phoebe bournei and Schimasuperba had mono-layered palisade parenchyma. Phoebe bour-nei (Lauraceae) was also the species with the lowest leaf thick-ness among all evergreen species. The deciduous speciesMeliosma flexuosa and Celtis biondii displayed the smallest logratio of thickness of palisade to spongy parenchyma, with !0.2and !0.21, respectively. However, the species with highestratios, Ailanthus altissima (0.27) and Rhus chinensis (0.41),were also deciduous.Overall, leaf habit was a good predictor of leaf anatomical
characteristics; we found the following traits were signifi-cantly higher in evergreen than in deciduous leaves: leafthickness (F = 14.15, P = 0.0006; Fig. 1A), palisade mesophyllthickness (F = 7.94, P = 0.0075; Fig. 1B) and spongy meso-phyll thickness (F = 13.33, P = 0.0008; Fig. 1C). Furthermore,SLA was significantly higher in deciduous than in evergreenspecies (F = 11.82, P = 0.0014; Fig. 1D). The two leaf habitsdid not differ in the log ratio of thickness of palisade andspongy mesophyll and thickness of the upper epidermis(Table 1).Ornamentation of the outer surface of the cuticle largely
consisted of striae or ridges, which are folds of the cuticle. Asan example for cuticular folding with striae of random orienta-tion on the adaxial leaf side, see Ailanthus altissima (Fig. S2E).This cuticular folding represented an important character indeciduous leaves in the set of analysed species, but was muchless pronounced in evergreen leaves. Epicuticular waxes weremostly present as smooth or fine-warty films, especially on thelower (abaxial) side of the leaf in most species studied (e.g. Fig.S2A). There were only three evergreen species with epicuticularwax plates on the abaxial side of the leaf (Manglietia yuyunan-ensis, Phoebe bournei and Quercus phillyraeoides; Fig. S2B),while deciduous species showed a large variation in epicuticu-lar waxes on the abaxial leaf side (e.g. Acer davidii and Quercusserrata; Fig. S2A, F). On the upper (adaxial) leaf side, evergreenspecies showed a wider variety of epicuticular waxes thandeciduous species, in the form of smooth or fine-warty films(Cinnamomum camphora; Figs S1B, S2C, D), heaps of grains orfilaments, plates (Lithocarpus glaber, Quercus phillyraeoides; Fig.S2B) or scales (Cyclobalanopsis glauca).
Papillae as projections of the epidermis cell wall wereencountered on the abaxial leaf side of three deciduous speciesin the form of striate papillae (Idesia polycarpa; Fig. S3A; Rhuschinensis; Fig. S3D; Triadica sebiferum) and on the abaxial sideof three evergreen species in the form of simple papillae(Cyclobalanopsis myrsinifolia, Daphniphyllum oldhamii andLithocarpus glaber; Fig. S3B, F). The deciduous species Rhuschinensis showed both striate papillae and simple trichomes onthe abaxial side, and additionally, trichomes on the adaxial side(Fig. S3C, D). ANOVAs on the effect of the presence of papillaeon the four ecophysiological parameters did not reveal anysignificant relationship.Trichomes occurred as simple, stellate or bifurcate hairs
(Fig. S3E, F). In eight deciduous species, trichomes were pres-ent both on the adaxial and abaxial side, whereas trichomes didnot occur in leaves of any of the evergreen species, In the stud-
Table 1. Mean values of numerical leaf traits and their minima, maxima and SD. In addition, mean values are shown separately for deciduous and evergreen
leaf habit, including the P-values from an ANOVA testing differences in trait values between leaf habits.
trait [unit] mean max min SD mean deciduous mean evergreen P
CONMAXFITA [mmol"m!2"s!1] 904.30 1915.99 336.07 315.35 953.81 846.53 0.30
VPDMAXFIT [hPa] 22.97 73.81 6.17 10.35 22.34 23.70 0.68
HYDCOND [kg"m!1"s!2"MPa!1] 2.44 17.52 0.04 3.36 3.55 1.13 0.023
PSI50 [MPa] !3.78 !1.09 !6.60 1.51 !3.05 !4.64 <0.001UPPEREPI [lm] 13.41 24.83 5.50 4.40 13.83 12.94 0.53
PALIS [lm] 73.51 129.42 32.43 21.06 65.27 82.62 0.008
SPONGY [lm] 74.91 175.25 31.58 28.88 61.08 90.19 <0.001LOG10RATIO [lm"lm!1] 0.03 0.42 !0.22 0.13 0.056 0.011 0.27
LEAFTHICK [lm] 180.97 366.57 105.23 51.50 155.77 208.82 <0.001SLA [m2"kg!1] 12.28 19.64 7.84 2.80 13.56 10.86 0.001
A B
C D
Fig. 1. Anatomical and morphological variables that significantly differ
between evergreen and deciduous leaf habit. (A) leaf thickness, (B) leaf pali-
sade mesophyll thickness, (C) leaf spongy mesophyll thickness, (D) specific
leaf area (SLA). For statistics, see Table 1.
Plant Biology © 2014 German Botanical Society and The Royal Botanical Society of the Netherlands 5
Kr€ober, Heklau & Bruelheide Tree leaf morphology and functional trait relationships

82
ied evergreen species, adaxial trichomes were mainly a featureof Fagaceae and Lauraceae. Stellate hairs were mainly found inthe Fagaceae but also in Alniphyllum fortunei (Styracaceae; Fig.S3E).
Interrelationships between morphological and anatomical leaftraits
The results of the principal coordinate analysis (PCoA) ofthe 14 leaf traits characteristic of the leaf anatomy areshown in Fig. 2A and 2B for axis 1 versus 2 and 1 versus 3,respectively. For more detailed information see Table S6with all correlations of the 14 traits with the three PCoAaxes, and Table S7 for coordinates of all species. The strong-est significant positive correlations with the first PCoA axiswere observed for number of palisade layers, leaf habit,thickness of the palisade mesophyll layer, leaf thickness andthickness of the spongy mesophyll layer, in order of decreas-ing importance. SLA and cover of trichomes on the adaxialside of the leaf (COVTRIUP) were significantly negativelycorrelated with the first axis. The second PCoA axis was, toa large extent, characterised by a significant positive relation-ship to cover of trichomes on the abaxial side of the leaf(COVTRILO), type of trichomes (TRICHOM) and thepresence of excretory glands (EXCRET), as well as by a sig-nificant negative relationship to epidermal cell size (EPICLL-SIZ) and presence of a column of sclerenchyma cellsthrough the leaf (COLSCLER).Leaf thickness was the variable with the most significant
relationships to other anatomical and morphological leaftraits and increased with the number of layers of palisademesophyll cells (r = 0.55, P = 0.0002), palisade parenchymathickness (r = 0.80, P < 0.0001) and spongy parenchymathickness (r = 0.90, P < 0.0001; Fig. 3A). Thickness of bothmesophyll types was positively related to one another(Fig. 3C; r = 0.63, P < 0.0001). Both thickness of the
palisade mesophyll layer and log ratio of palisade tospongy parenchyma thickness decreased with increasingSLA (Fig. 3B; r = !0.46, P = 0.0027; Fig. 3D; r = !0.32,P = 0.0427).
Relationships between morphological/anatomical andecophysiological traits
Analysis of the relationships between the four ecophysiologicalkey traits and cuticle characteristics did not reveal any signifi-cant relationships. However, ANOVA analyses revealed margin-ally significant differences in fitted absolute maximum gs(CONMAXFITA) for different patterns of the upper epicuticu-lar wax layer (EPIWAXUP; P = 0.0787).
The best multi-predictor models with at most three termswere able to explain a proportion of the variation in the fourecophysiological parameters of gs and xylem cavitation vulnera-bility among species (r2 between 0.30 and 0.39), except formaximum specific xylem hydraulic conductivity (HYDC-OND), for which the coefficient of determination was only0.18 (Table 2). Three of the four ecophysiological characteris-tics contained leaf habit and interaction with leaf habit(Table 2, Fig. 4). Absolute maximum of fitted gs (CONMAXF-ITA) significantly increased with the log10 ratio of thickness ofpalisade to spongy parenchyma (LOG10RATIO; P = 0.006),with steeper slopes for deciduous than evergreen species(P < 0.001), but identical intercepts (P = 0.84; Fig. 4A). Thevpd at the maximum of modelled gs–vpd relationship (VPD-MAXFIT) showed an increase with LOG10RATIO only in thepresence of papillae (PAPILL; P = 0.002), while neitherLOG10RATIO (P = 0.71) nor PAPILL (P = 0.94) alone had asignificant effect (Fig. 4B). Both parameters of stem xylemhydraulics depended on the same leaf traits, which were leafhabit (LEAFHABIT) and density of the spongy parenchyma(DENSINTCEL). Maximum specific xylem hydraulic conduc-tivity (HYDCOND) was lower in evergreen than deciduous
Fig. 2. Principal coordinate analysis (PCoA) biplots of the species mean values of the 14 binary, ordinal and numeric morphological leaf traits. (A) PCoA axes 1
and 2, (B) PCoA axes 1 and 3. See Table S8 for coding of trait names. Eigenvalues: axis 1 = 1.18, axis 2 = 0.582, axis 3 = 0.387, with cumulative proportion of
explained variance 30.3%, 45.4% and 55.4%, respectively. Species abbreviations refer to genus and species epitheton. See Table S4 for full species names.
Plant Biology © 2014 German Botanical Society and The Royal Botanical Society of the Netherlands6
Tree leaf morphology and functional trait relationships Kr€ober, Heklau & Bruelheide

83
species (P = 0.023) and showed a tendency to decrease withincreasing DENSINTCEL (P = 0.15). Xylem pressure at which50% loss of maximum specific hydraulic conductivity occurred(PSI50) was higher in deciduous than evergreen species(P < 0.001), and increased with DENSINTCEL (P = 0.02;Fig. 4D).
DISCUSSION
Our study demonstrated that key ecophysiological traits ofstomatal control and wood hydraulics were reflected in struc-tural leaf traits. Interestingly, whether a leaf was evergreen ordeciduous did explain a large proportion of the variation inmorphological and anatomical leaf traits investigated. Inaddition, leaf habit was also among the best predictors forthree of the four key hydrological traits. This justifies the useof leaf habit in ecophysiological models for woody species, as
is the current practice in dynamic global vegetation models(DGVM; e.g. Woodward & Cramer 1996; Sitch et al. 2003).Just as leaf habit was related to leaf thickness, all leaf traitsrelated to thickness of different layers also differed stronglybetween the two leaf habits. These interrelated traits alsoformed the first axis in the PCA analysis. Our findings con-firm those in cross-species comparisons for different regionsdescribed in the literature. For example, in two studies witha comparable set of deciduous and evergreen study species,Roth et al. (1995) and Arambarri et al. (2006, 2008)described similar patterns in leaf structure for a montane for-est in Venezuela and tree species from the lowest level of anAndine mountain forest of Tucum!an (Argentina), respec-tively. For a set of 23 tree species native to seasonally drytropical forest, Pringle et al. (2011) found differences inwater availability were reflected in specific trait syndromesassociated with evergreen and deciduous leaf habit.
A
CD
B
Fig. 3. Results of the strongest interrelationships among
numerical anatomical leaf traits. For statistics, see text.
Table 2. Results of the best model with at most three predictors selected using information theory, separately for the four ecophysiological traits: CONMAX-
FIT, absolute maxima of fitted stomatal conductance; VPDMAXFIT, vpd at maximum of modelled stomatal conductance–vpd relationship; HYDCCOND, maxi-
mum specific xylem hydraulic conductivity; PSI50, pressure at 50% loss of maximum specific xylem hydraulic conductance. For plots of models, see Fig. 4. For
significances of parameter estimates, see text.
response start AIC final AIC model of predictors r2 F-value df P
CONMAXFITA 449.78 441.88 CONMAXFITA ~ LOG10RATIO + LEAFHABIT + LOG10RATIO: LEAFHABIT 0.30 4.991 3; 35 0.0055
VPDMAXFIT 183.31 170.49 VPDMAXFIT ~ LOG10RATIO + PAPILL + LOG10RATIO: PAPILL 0.3827 7.234 3; 35 0.00067
HYDCOND 95.47 91.60 HYDCOND ~ LEAFHABIT + DENSINTCEL 0.1827 4.024 2; 36 0.02647
PSI50 32.91 17.90 PSI50 ~ LEAFHABIT + DENSINTCEL 0.3858 11.3 2; 36 0.00015
Plant Biology © 2014 German Botanical Society and The Royal Botanical Society of the Netherlands 7
Kr€ober, Heklau & Bruelheide Tree leaf morphology and functional trait relationships

84
Our first PCoA axis was related to the leaf economics spec-trum and includes several morphological and anatomical traits.In a set of laboratory-grown seedlings of 52 European woodyspecies Castro-D!ıez et al. (2000) showed that evergreen anddeciduous species significantly differed in leaf thickness andthickness of mesophyll and spongy parenchyma, which we havenow confirmed. Burrows (2001) examined leaves of 39 specieson the east coast of sub-humid New South Wales, Australia(35° S); however, the relationships between, for example,mesophyll distribution and the ecological habitat of the specieswere weak.Species with traits that implied an adaptation to dry habitats
often co-occurred with mesophyllous species and vice versa(Medina et al. 1990; Gibson 1996). One reason for this mightbe that not all leaf traits related to ecophysiology are alsorelated to the leaf economics spectrum (LES). This is reflectedin our findings that not all variation in traits was captured bythe first PCoA axis, as a further 25.1% of the variation wasexplained with axes two and three. In our study, we foundcover and type of trichomes, presence of excretory glands, epi-dermal cell size and presence of a column of sclerenchyma cellsthrough the leaf were unrelated to the LES. Similarly, stomatalsize and density have been demonstrated to be independent ofthe LES, and thus of leaf thickness and leaf habit (Beerling &Kelly 1996; Kr€ober et al. 2012). Along this line, Brodribb &Holbrook (2005) concluded that leaf habit and the specificphysiological solutions are not inevitably connected. Althoughleaf habit was a strong predictor in our analyses, as it sets cer-tain boundaries for leaf physiology, within evergreen anddeciduous leaves there is still a wide range of further differenti-
ation (Kikuzawa 1991; Aerts 1995). One trait that wasunrelated to the LES but was the best predictor for gs parame-ters was log10 ratio of palisade to spongy mesophyll layer thick-ness. This trait had already been suggested by Wylie (1946) asrelevant for leaf hydraulics, and was confirmed to be also rele-vant to leaf hydraulic conductance (Sack & Frole 2006). Themechanistic explanation might be that with increasing log10ratio, the amount of intercellular spaces decreases (Castro-D!ıezet al. 2000), which requires increased gas exchange, which inturn is reflected in higher maximum gs and stomata thatremain open at higher vpd. Another function of a high log10ratio might be related to resistance to air pollutants. Dineva(2004) suggested that wide intercellular spaces at low palisade/mesophyll ratios allow faster penetration and absorption oftoxicants into photosynthetically active tissues.Our study also revealed a relationship between leaf traits
and xylem hydraulics. This contradicts the results of Baralotoet al. (2010), who found the main dimensions of leaf and stemfunctional traits were unrelated across a wide range of rainforest tree species. However, in contrast to Ψ50, maximumspecific xylem hydraulic conductivity was only poorlyexplained by leaf traits and mainly depended on leaf habit,which confirms the results of Kr€ober et al. (2014). Theseauthors found maximum hydraulic conductance and Ψ50 weremainly connected to leaf carbon to nitrogen ratio, which inturn was related to leaf habit. In their study, traits of xylemhydraulics were not related to traits of stomatal regulation,which is congruent with the findings of the present paper. Incontrast, our observation that the Ψ50 increased with increas-ing density of the spongy parenchyma layer, was independent
A B
C D
Fig. 4. The interrelationships between anatomical leaf
traits and the four ecophysiological traits. (A) Absolute
maxima of fitted stomatal conductance (CONMAXFITA)
as a function of the log10 ratio of thickness of palisade to
spongy parenchyma (LOG10RATIO) and LEAFHABIT and
their interaction; (B) vpd at maximum of the modelled gs–
vpd relationship (VPDMAXFIT) as a function of LOG10RA-
TIO and the presence of papillae (PAPILL) and their inter-
action (P = 0.002); (C) maximum specific xylem hydraulic
conductivity (HYDCOND) as a function of leaf habit and
density of spongy parenchyma (DENSINTCEL); (D) xylem
pressureΨ50, at which 50% loss of the maximum specific
hydraulic conductivity occurs (PSI50) as a function of leaf
habit and DENSINTCEL. Regression lines were obtained
from parameter estimates of the best multi-predictor
models in Table 2. For significances of parameter esti-
mates, see text. In plots (A), (C) and (D) white circles and
dashed lines represent deciduous species and filled black
points and solid lines represent evergreen species. In plot
(B), crosses and dotted line represent species without
papillae, whereas filled black diamonds and broken line
represent species with papillae.
Plant Biology © 2014 German Botanical Society and The Royal Botanical Society of the Netherlands8
Tree leaf morphology and functional trait relationships Kr€ober, Heklau & Bruelheide
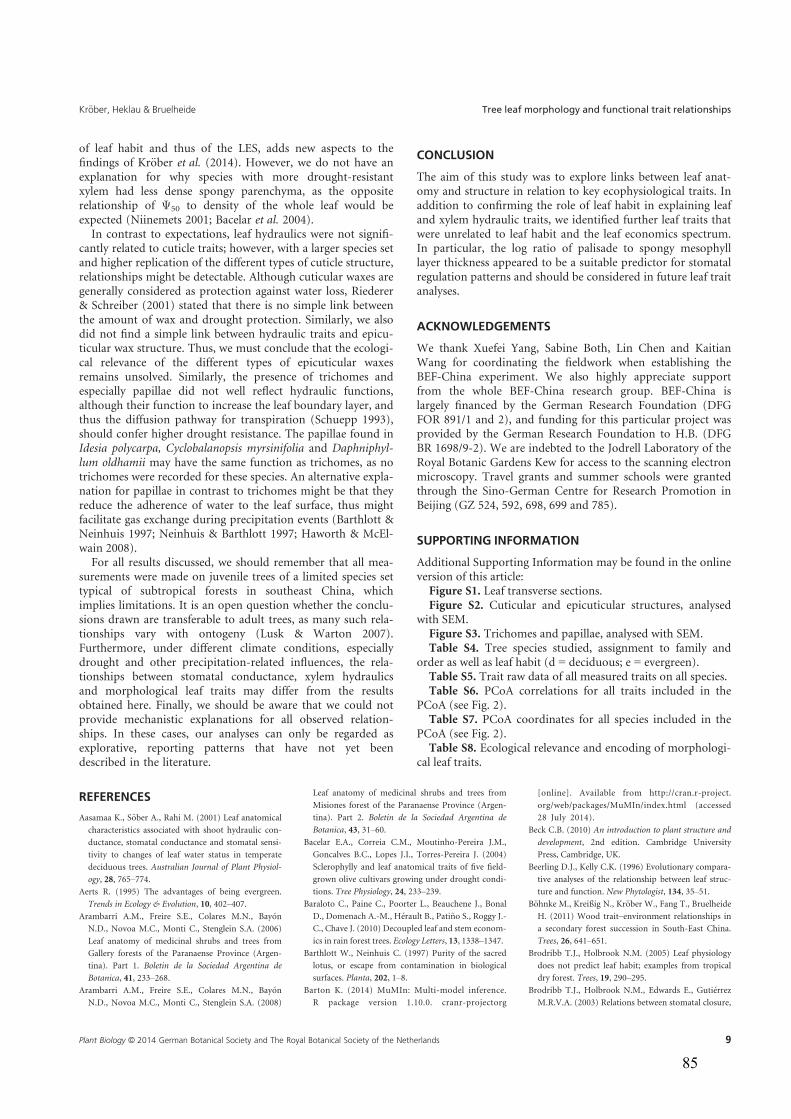
85
of leaf habit and thus of the LES, adds new aspects to thefindings of Kr€ober et al. (2014). However, we do not have anexplanation for why species with more drought-resistantxylem had less dense spongy parenchyma, as the oppositerelationship of Ψ50 to density of the whole leaf would beexpected (Niinemets 2001; Bacelar et al. 2004).In contrast to expectations, leaf hydraulics were not signifi-
cantly related to cuticle traits; however, with a larger species setand higher replication of the different types of cuticle structure,relationships might be detectable. Although cuticular waxes aregenerally considered as protection against water loss, Riederer& Schreiber (2001) stated that there is no simple link betweenthe amount of wax and drought protection. Similarly, we alsodid not find a simple link between hydraulic traits and epicu-ticular wax structure. Thus, we must conclude that the ecologi-cal relevance of the different types of epicuticular waxesremains unsolved. Similarly, the presence of trichomes andespecially papillae did not well reflect hydraulic functions,although their function to increase the leaf boundary layer, andthus the diffusion pathway for transpiration (Schuepp 1993),should confer higher drought resistance. The papillae found inIdesia polycarpa, Cyclobalanopsis myrsinifolia and Daphniphyl-lum oldhamii may have the same function as trichomes, as notrichomes were recorded for these species. An alternative expla-nation for papillae in contrast to trichomes might be that theyreduce the adherence of water to the leaf surface, thus mightfacilitate gas exchange during precipitation events (Barthlott &Neinhuis 1997; Neinhuis & Barthlott 1997; Haworth & McEl-wain 2008).For all results discussed, we should remember that all mea-
surements were made on juvenile trees of a limited species settypical of subtropical forests in southeast China, whichimplies limitations. It is an open question whether the conclu-sions drawn are transferable to adult trees, as many such rela-tionships vary with ontogeny (Lusk & Warton 2007).Furthermore, under different climate conditions, especiallydrought and other precipitation-related influences, the rela-tionships between stomatal conductance, xylem hydraulicsand morphological leaf traits may differ from the resultsobtained here. Finally, we should be aware that we could notprovide mechanistic explanations for all observed relation-ships. In these cases, our analyses can only be regarded asexplorative, reporting patterns that have not yet beendescribed in the literature.
CONCLUSION
The aim of this study was to explore links between leaf anat-omy and structure in relation to key ecophysiological traits. Inaddition to confirming the role of leaf habit in explaining leafand xylem hydraulic traits, we identified further leaf traits thatwere unrelated to leaf habit and the leaf economics spectrum.In particular, the log ratio of palisade to spongy mesophylllayer thickness appeared to be a suitable predictor for stomatalregulation patterns and should be considered in future leaf traitanalyses.
ACKNOWLEDGEMENTS
We thank Xuefei Yang, Sabine Both, Lin Chen and KaitianWang for coordinating the fieldwork when establishing theBEF-China experiment. We also highly appreciate supportfrom the whole BEF-China research group. BEF-China islargely financed by the German Research Foundation (DFGFOR 891/1 and 2), and funding for this particular project wasprovided by the German Research Foundation to H.B. (DFGBR 1698/9-2). We are indebted to the Jodrell Laboratory of theRoyal Botanic Gardens Kew for access to the scanning electronmicroscopy. Travel grants and summer schools were grantedthrough the Sino-German Centre for Research Promotion inBeijing (GZ 524, 592, 698, 699 and 785).
SUPPORTING INFORMATION
Additional Supporting Information may be found in the onlineversion of this article:Figure S1. Leaf transverse sections.Figure S2. Cuticular and epicuticular structures, analysed
with SEM.Figure S3. Trichomes and papillae, analysed with SEM.Table S4. Tree species studied, assignment to family and
order as well as leaf habit (d = deciduous; e = evergreen).Table S5. Trait raw data of all measured traits on all species.Table S6. PCoA correlations for all traits included in the
PCoA (see Fig. 2).Table S7. PCoA coordinates for all species included in the
PCoA (see Fig. 2).Table S8. Ecological relevance and encoding of morphologi-
cal leaf traits.
REFERENCES
Aasamaa K., S~ober A., Rahi M. (2001) Leaf anatomical
characteristics associated with shoot hydraulic con-
ductance, stomatal conductance and stomatal sensi-
tivity to changes of leaf water status in temperate
deciduous trees. Australian Journal of Plant Physiol-
ogy, 28, 765–774.Aerts R. (1995) The advantages of being evergreen.
Trends in Ecology & Evolution, 10, 402–407.Arambarri A.M., Freire S.E., Colares M.N., Bay"on
N.D., Novoa M.C., Monti C., Stenglein S.A. (2006)
Leaf anatomy of medicinal shrubs and trees from
Gallery forests of the Paranaense Province (Argen-
tina). Part 1. Boletin de la Sociedad Argentina de
Botanica, 41, 233–268.Arambarri A.M., Freire S.E., Colares M.N., Bay"on
N.D., Novoa M.C., Monti C., Stenglein S.A. (2008)
Leaf anatomy of medicinal shrubs and trees from
Misiones forest of the Paranaense Province (Argen-
tina). Part 2. Boletin de la Sociedad Argentina de
Botanica, 43, 31–60.Bacelar E.A., Correia C.M., Moutinho-Pereira J.M.,
Goncalves B.C., Lopes J.I., Torres-Pereira J. (2004)
Sclerophylly and leaf anatomical traits of five field-
grown olive cultivars growing under drought condi-
tions. Tree Physiology, 24, 233–239.Baraloto C., Paine C., Poorter L., Beauchene J., Bonal
D., Domenach A.-M., H"erault B., Pati~no S., Roggy J.-
C., Chave J. (2010) Decoupled leaf and stem econom-
ics in rain forest trees. Ecology Letters, 13, 1338–1347.Barthlott W., Neinhuis C. (1997) Purity of the sacred
lotus, or escape from contamination in biological
surfaces. Planta, 202, 1–8.Barton K. (2014) MuMIn: Multi-model inference.
R package version 1.10.0. cranr-projectorg
[online]. Available from http://cran.r-project.
org/web/packages/MuMIn/index.html (accessed
28 July 2014).
Beck C.B. (2010) An introduction to plant structure and
development, 2nd edition. Cambridge University
Press, Cambridge, UK.
Beerling D.J., Kelly C.K. (1996) Evolutionary compara-
tive analyses of the relationship between leaf struc-
ture and function. New Phytologist, 134, 35–51.B€ohnke M., Kreißig N., Kr€ober W., Fang T., Bruelheide
H. (2011) Wood trait–environment relationships in
a secondary forest succession in South-East China.
Trees, 26, 641–651.Brodribb T.J., Holbrook N.M. (2005) Leaf physiology
does not predict leaf habit; examples from tropical
dry forest. Trees, 19, 290–295.Brodribb T.J., Holbrook N.M., Edwards E., Guti"errez
M.R.V.A. (2003) Relations between stomatal closure,
Plant Biology © 2014 German Botanical Society and The Royal Botanical Society of the Netherlands 9
Kr€ober, Heklau & Bruelheide Tree leaf morphology and functional trait relationships

86
leaf turgor and xylem vulnerability in eight tropical
dry forest trees. Plant, Cell & Environment, 26, 443–450.
Bruelheide H., B€ohnke M., Both S., Fang T., Assmann
T., Baruffol M., Bauhus J., Buscot F., Chen X.-Y., Ding
B.-Y., Durka W., Erfmeier A., Fischer M., Geißler C.,
Guo D., Guo L.-D., H€ardtle W., He J.-S., Hector A.,
Kr€ober W., K€uhn P., Lang A.C., Nadrowski K., Pei K.,
Scherer-Lorenzen M., Shi X., Scholten T., Schuldt A.,
Trogisch S., von Oheimb G., Welk E., Wirth C., Wu
Y.-T., Yang X., Zeng X., Zhang S., Zhou H., Ma K.,
Schmid B. (2011) Community assembly during sec-
ondary forest succession in a Chinese subtropical for-
est. Ecological Monographs, 81, 25–41.Bruelheide H., Nadrowski K., Assmann T., Bauhus J.,
Both S., Buscot F., Chen X.-Y., Ding B., Durka W.,
Erfmeier A., Gutknecht J.L.M., Guo D., Guo L.-D.,
H€ardtle W., He J.-S., Klein A.-M., K€uhn P., Liang Y.,
Liu X., Michalski S., Niklaus P.A., Pei K., Scherer-
Lorenzen M., Scholten T., Schuldt A., Seidler G.,
Trogisch S., von Oheimb G., Welk E., Wirth C.,
Wubet T., Yang X., Yu M., Zhang S., Zhou H., Fi-
scher M., Ma K., Schmid B. (2014) Designing forest
biodiversity experiments: general considerations
illustrated by a new large experiment in subtropical
China. Methods in Ecology and Evolution, 5, 74–89.Burrows G.E. (2001) Comparative anatomy of the pho-
tosynthetic organs of 39 xeromorphic species from
subhumid New South Wales, Australia. International
Journal of Plant Sciences, 162, 411–430.Bussoti F. (2008) Functional leaf traits, plant commu-
nities and acclimation processes in relation to oxida-
tive stress in trees: a critical overview. Global Change
Biology, 14, 2727–2739.Cao X., Jia J.B., Li H., Li M.C., Luo J., Liang Z.S., Liu
T.X., Liu W.G., Peng C.H., Luo Z.B. (2012) Photo-
synthesis, water use efficiency and stable carbon iso-
tope composition are associated with anatomical
properties of leaf and xylem in six poplar species.
Plant Biology, 14, 612–620.Castro-D"ıez P., Puyravaud J.P., Cornelissen J.H.C.
(2000) Leaf structure and anatomy as related to leaf
mass per area variation in seedlings of a wide range
of woody plant species and types. Oecologia, 124,
476–486.Cornelissen J.H.C., Lavorel S., Garnier E., D"ıaz S., Buch-
mann N., Gurvich D., Reich P.B., Steege H., Morgan
J.A., van der Heijden M., Pausas J., Poorter H. (2003)
A handbook of protocols for standardised and easy
measurement of plant functional traits worldwide.
Australian Journal of Botany, 51, 335–380.Cornelissen J.H.C., Wright I.J., Reich P.B., Falster D.S.,
Garnier E., Hikosaka K., Lamont B.B., Lee W., Olek-
syn J., Osada N., Poorter H., Villar R., Warton D.I.,
Westoby M. (2005) Assessing the generality of global
leaf trait relationships. New Phytologist, 166,
485–496.Curtis P.S., Ackerly D.D. (2008) Introduction to a
Virtual Special Issue on plant ecological strategy
axes in leaf and wood traits. New Phytologist,
179, 901–903.D"ıaz S., Lavorel S., de Bello F., Quetier F., Grigulis K.,
Robson T.M. (2007) Incorporating plant functional
diversity effects in ecosystem service assessments.
Proceedings of the National Academy of Sciences of the
United States of America, 104, 20684–20689.Diemer M. (1998) Life span and dynamics of leaves of
herbaceous perennials in high-elevation environ-
ments: “News from the Elephant’s Leg”. Functional
Ecology, 12, 413–425.
Dineva S.B. (2004) Comparative studies of the leaf
morphology and structure of white ash Fraxinus
americana L. and London plane tree Platanus aceri-
folia Willd growing in polluted area. Dendrobiology,
52, 3–8.Ditsch F., Barthlott W. (1997) Mikromorphologie der
epicuticularwachse und das system der dilleniidae und
rosidae. Akademie der Wissenschaften und der Liter-
atur Mainz, Stuttgart, Germany.
Dray S., Dufour A.-B. (2007) The ade4 package: imple-
menting the duality diagram for ecologists. Journal
of Statistical Software, 22, 1–20.Garnier E., Cortez J., Bill#es G., Navas M.-L., Roumet
C., Debussche M., Laurent G., Blanchard A., Aubry
D., Bellmann A., Neill C., Toussaint J.-P. (2004)
Plant functional markers capture ecosystem proper-
ties during secondary succession. Ecology, 85, 2630–2637.
Gates D.M. (2003) Biophysical ecology. Courier Dover,
New York, USA.
Gerlach D. (1984) Botanische Mikrotechnik. Thieme,
Stuttgart, Germany.
Gerosa G., Marzuoli R., Bussotti F., Pancrazi M. (2003)
Ozone sensitivity of Fagus sylvatica and Fraxinus
excelsior young trees in relation to leaf structure and
foliar ozone uptake. Environmental Pollution, 125,
91–98.Gibson A.C. (1996) Structure-function relations of warm
desert plants. Springer, Berlin, Germany.
Gutschick V.P. (1999) Biotic and abiotic consequences
of differences in leaf structure. New Phytologist, 143,
3–18.Haworth M., McElwain J. (2008) Hot, dry, wet,
cold or toxic? Revisiting the ecological signifi-
cance of leaf and cuticular micromorphology.
Palaeogeography, Palaeoclimatology, Palaeoecology,
262, 79–90.Kenzo T., Ichie T., Yoneda R., Kitahashi Y., Watanabe
Y., Ninomiya I., Koike T. (2004) Interspecific varia-
tion of photosynthesis and leaf characteristics in
canopy trees of five species of Dipterocarpaceae in a
tropical rain forest. Tree Physiology, 24, 1187–1192.Kerstiens G. (1997) In vivo manipulation of cuticular
water permeance and its effect on stomatal response
to air humidity. New Phytologist, 137, 473–480.Kerstiens G. (2006) Water transport in plant cuticles:
an update. Journal of Experimental Botany, 57, 2493–2499.
Kikuzawa K. (1991) A cost–benefit analysis of leaf habitand leaf longevity of trees and their geographical
pattern. The American Naturalist, 138, 1250–1263.Kr€ober W., Bruelheide H. (2014) Transpiration and
stomatal control: a cross-species study of leaf traits
in 39 evergreen and deciduous broadleaved subtrop-
ical tree species. Trees, 28, 901–914.Kr€ober W., B€ohnke M., Welk E., Wirth C., Bruelheide
H. (2012) Leaf trait–environment relationships in a
subtropical broadleaved forest in south-east China.
PLoS ONE, 7, 1–11.Kr€ober W., Zhang S., Ehmig M., Bruelheide H. (2014)
Xylem hydraulic structure and the Leaf Economics
Spectrum – A cross-species study of 39 evergreen
and deciduous broadleaved subtropical tree species.
PLoS ONE, in press.
Lambers H., Chapin F. III, Pons T. (2008) Plant physio-
logical ecology, 2nd edition. Springer, Berlin, Ger-
many, pp 1-623.
Li W.-D., Biswas D.K., Xu H., Xu C.-Q., Wang X.-Z.,
Liu J.-K., Jiang G.-M. (2009) Photosynthetic
responses to chromosome doubling in relation to
leaf anatomy in Lonicera japonica subjected to water
stress. Functional Plant Biology, 36, 783–792.Lusk C.H., Warton D.I. (2007) Global meta-analysis
shows that relationships of leaf mass per area with
species shade tolerance depend on leaf habit and
ontogeny. New Phytologist, 176, 764–774.Mediavilla S., Escudero A., Heilmeier H. (2001) Inter-
nal leaf anatomy and photosynthetic resource-use
efficiency: interspecific and intraspecific compari-
sons. Tree Physiology, 21, 251–259.Medina E. (1984) Nutrient balance and physiological
processes at the leaf level. In: Medina E., Mooney
H.A., V"azquez-Y"anes C. (Eds), Physiological ecology
of plants of the wet tropics. Springer, Dordrecht, The
Netherlands, pp 139–154.Medina E., Garcia V., Cuevas E. (1990) Sclerophylly
and oligotrophic environments – relationships
between leaf structure, mineral nutrient content, and
drought resistance in tropical rain forests of the
upper Rio-Negro region. Biotropica, 22, 51–64.Mulkey S., Kitajima K., Wright S. (1995) Photosyn-
thetic capacity and leaf longevity in the canopy of a
dry tropical forest. Selbyana, 16, 169–173.Neinhuis C., Barthlott W. (1997) Characterization and
distribution of water-repellent, self-cleaning plant
surfaces. Annals of Botany, 79, 667–677.Niinemets €U. (2001) Global-scale climatic controls of
leaf dry mass per area, density, and thickness in trees
and shrubs. Ecology, 82, 453–469.Oksanen M., Blanchet F.G., Kindt R., Legendre P.,
Minchin P.R., O’Hara R.B., Simpson G.A., Solymos
P., Stevens M., Wagner H. (2013) Vegan: commu-
nity ecology package. R package version 2.0-10.
cranr-projectorg [online]. Available from http://
cran.r-project.org/web/packages/vegan/index.html
(accessed 28 July 2014).
Orians G.H., Solbrig O.T. (1977) A cost–income model
of leaves and roots with special reference to arid and
semiarid areas. The American Naturalist, 111, 677–690.
Pavoine S., Vallet J., Dufour A.-B., Gachet S., Daniel
H. (2009) On the challenge of treating various
types of variables: application for improving the
measurement of functional diversity. Oikos, 118,
391–402.Perez-Harguindeguy N., D"ıaz S., Garnier E., Lavorel S.,
Poorter H., Jaureguiberry P., Bret-Harte M.S., Corn-
well W.K., Craine J.M., Gurvich D.E., Urcelay C.,
Veneklaas E.J., Reich P.B., Poorter L., Wright I.J.,
Ray P., Enrico L., Pausas J.G., de Vos A.C.,
Buchmann N., Funes G., Quetier F., Hodgson J.G.,
Thompson K., Morgan H.D., ter Steege H., van der
Heijden M.G.A., Sack L., Blonder B., Poschlod P.,
Vaieretti M.V., Conti G., Staver A.C., Aquino S.,
Cornelissen J.H.C. (2013) New handbook for stan-
dardised measurement of plant functional traits
worldwide. Australian Journal of Botany, 61, 167–234.
Popma J., Bongers F., Werger M.J.A. (1992)
Gap-dependence and leaf characteristics of trees in a
tropical lowland rain forest in Mexico. Oikos, 63,
207–214.Press M.C. (1999) The functional significance of leaf
structure: a search for generalizations. New Phytolo-
gist, 143, 213–219.Pringle E.G., Adams R.I., Broadbent E., Busby P.E.,
Donatti C.I., Kurten E.L., Renton K., Dirzo R.
(2011) Distinct leaf-trait syndromes of evergreen
and deciduous trees in a seasonally dry tropical for-
est. Biotropica, 43, 299–308.
Plant Biology © 2014 German Botanical Society and The Royal Botanical Society of the Netherlands10
Tree leaf morphology and functional trait relationships Kr€ober, Heklau & Bruelheide

87
Pruem B., Seidel R., Bohn H.F., Speck T. (2012) Plant
surfaces with cuticular folds are slippery for beetles.
Journal of the Royal Society Interface, 9, 127–135.R Core Team (2014) R: a language and environment
for statistical computing. r-projectorg [online],
Available from http://www.r-project.org/ (accessed
10 April 2014).
Reich P., Walters M., Ellsworth D. (1997) From tropics
to tundra: global convergence in plant functioning.
Proceedings of the National Academy of Sciences of the
United States of America, 94, 13730–13734.Riederer M., M€uller C. (eds) (2006) Introduction: biol-
ogy of the plant cuticle. Annual Plant Reviews, 23,
1–10.Riederer M., Schreiber L. (2001) Protecting against
water loss: analysis of the barrier properties of plant
cuticles. Journal of Experimental Botany, 52, 2023–2032.
Roth I., Linsbauer K., Tischler G., Pascher A. (1995)
Handbuch der Pflanzenanatomie: spezieller Teil/Band
XIV. Gebr€uder Borntraeger, Berlin, Germany.
Sack L., Frole K. (2006) Leaf structural diversity is
related to hydraulic capacity in tropical rain forest
trees. Ecology, 87, 483–491.Sack L., Holbrook N.M. (2006) Leaf hydraulics. Annual
Review of Plant Biology, 57, 361–381.Sack L., Cowan P.D., Jaikumar N., Holbrook N.M.
(2003) The “hydrology” of leaves: co-ordination of
structure and function in temperate woody species.
Plant, Cell & Environment, 26, 1343–1356.Schuepp P.H. (1993) Tansley Review No. 59 Leaf
boundary layers. New Phytologist, 125, 477–507.Shipley B., Lechowicz M.J., Wright I., Reich P.B.
(2006) Fundamental trade-offs generating the
worldwide leaf economics spectrum. Ecology, 87,
535–541.Sis"o S., Camarero J.J., Gil-Pelegrin E. (2001) Relation-
ship between hydraulic resistance and leaf morphol-
ogy in broadleaf Quercus species: a new
interpretation of leaf lobation. Trees-Structure and
Function, 15, 341–345.Sitch S., Smith B., Prentice I.C., Arneth A., Bondeau
A., Cramer W., Kaplan J.O., Levis S., Lucht W.,
Sykes M.T., Thonicke K., Venevsky S. (2003) Evalua-
tion of ecosystem dynamics, plant geography and
terrestrial carbon cycling in the LPJ dynamic global
vegetation model. Global Change Biology, 9, 161–185.
Smith W.K., Hughes N.M. (2009) Progress in coupling
plant form and photosynthetic function. Castanea,
74, 1–26.Sobrado M.A. (1986) Aspects of tissue water rela-
tions and seasonal-changes of leaf water potential
components of evergreen and deciduous species
coexisting in tropical dry forests. Oecologia, 68,
413–416.Sperry J., Donelly J., Tyree M.T. (1988) A method for
measuring hydraulic conductivity and embolism in
xylem. Plant, Cell and Environment, 11, 35–40.Sterck F.J., Poorter L., Schieving F. (2006) Leaf traits
determine the growth–survival trade-off across rainforest tree species. The American Naturalist, 167,
758–765.Van Wittenberghe S., Adriaenssens S., Staelens J.,
Verheyen K., Samson R. (2012) Variability of stoma-
tal conductance, leaf anatomy, and seasonal leaf wet-
tability of young and adult European beech leaves
along a vertical canopy gradient. Trees, 26, 1427–1438.
Vogelmann T.C., Bornman J.F., Yates D.J. (1996a)
Focusing of light by leaf epidermal cells. Physiologia
Plantarum, 98, 43–56.Vogelmann T.C., Nishio J.N., Smith W.K. (1996b)
Leaves and light capture: light propagation and gra-
dients of carbon fixation within leaves. Trends in
Plant Science, 1, 65–70.
Wilkinson H.P. (1979) The plant surface (mainly leaf).
In: Metcalfe C.R., Chalk L. (Eds), Anatomy of the
dicotyledons. Clarendon Press, Oxford, UK, pp
124–131.Woodward F.I., Cramer W. (1996) Plant functional
types and climatic changes: introduction. Journal of
Vegetation Science, 7, 306–308.Wright I.J., Reich P.B., Westoby M., Ackerly D.D., Bar-
uch Z., Bongers F., Cavender-Bares J., Chapin T.,
Cornelissen J.H.C., Diemer M., Flexas J., Garnier E.,
Groom P.K., Gulias J., Hikosaka K., Lamont B.B.,
Lee T., Lee W., Lusk C., Midgley J.J., Navas M.-L.,
Niinemets €U., Oleksyn J., Osada N., Poorter H.,
Poot P., Prior L., Pyankov V.I., Roumet C., Thomas
S.C., Tjoelker M.G., Veneklaas E.J., Villar R. (2004)
The worldwide leaf economics spectrum. Nature,
428, 821–827.Wylie R.B. (1946) Relations between tissue organiza-
tion and vascularization in leaves of certain tropical
and subtropical dicotyledons. American Journal of
Botany, 33, 721–726.Yang X., Bauhus J., Both S., Fang T., H€ardtle W.,
Kr€ober W., Ma K., Nadrowski K., Pei K.,
Scherer-Lorenzen M., Scholten T., Seidler G.,
Schmid B., Oheimb G., Bruelheide H. (2013)
Establishment success in a forest biodiversity and
ecosystem functioning experiment in subtropical
China (BEF-China). European Journal of Forest
Research, 132, 593–606.Zanne A.E., Westoby M., Falster D.S., Ackerly D.D.,
Loarie S.R., Arnold S.E.J., Coomes D.A. (2010)
Angiosperm wood structure: global patterns in vessel
anatomy and their relation to wood density and
potential conductivity. American Journal of Botany,
97, 207–215.Zhang J.-L., Poorter L., Cao K.-F. (2012) Productive
leaf functional traits of Chinese savanna species.
Plant Ecology, 213, 1449–1460.
Plant Biology © 2014 German Botanical Society and The Royal Botanical Society of the Netherlands 11
Kr€ober, Heklau & Bruelheide Tree leaf morphology and functional trait relationships

88

89
Chapter 5
EARLY SUBTROPICAL FOREST GROWTH IS DRIVEN BY COMMUNITY
MEAN TRAITS VALUES AND FUNCTIONAL DIVERSITY RATHER THAN
THE ABIOTIC ENVIRONMENT
Wenzel Kröber, Ying Li, Werner Härdtle, Keping Ma, Bernhard Schmid, Karsten Schmidt,
Thomas Scholten, Gunnar Seidler, Goddert von Oheimb, Erik Welk,
Christian Wirth & Helge Bruelheide
Journal of Ecology, submitted October 24, 2014; currently under review

90

91
Early subtropical forest growth is driven by community mean trait values and
functional diversity rather than the abiotic environment.
Summary
1. Functional diversity (FD) has been shown to be positively related to many ecosystem
functions, including biomass production, but might have much lower effects than abiotic
environmental factors or species-specific properties. Leaf and wood traits can be considered
particularly relevant for tree growth, as they reflect the trade-off in invested resources into
growth and persistence. We asked to which degree early forest growth in a large-scale tree
diversity experiment (BEF-China) is driven by FD, ecoscape (11 environmental variables
characterizing abiotic habitat conditions) and community weighted mean (CWM) values of
species traits.
2. Crown diameter growth rates of trees were aggregated across 231 plots varying in richness
between one and 23 tree species and related them to ecoscape as well as to FD and CWM, the
latter two based on 41 plant functional traits. The effects of each of the three predictor groups
were analysed separately by mixed model optimization and jointly by variance partitioning.
3. Numerous single traits predicted plot-level tree growth, both in the models based on CWMs
and FD, but none of the selected ecoscape variables. In the best models, ecoscape and FD
explained only 4% and 31% of variation in crown growth rates, respectively, while CWM
trait values explained 42%. In total, the best models accounted for 51% of crown growth.
4. Synthesis. The marginal role of the selected ecoscape variables was unexpected, given the
high topographic heterogeneity and large size of the experiment, as was the significant impact
of FD, demonstrating that positive diversity effects do already occur in early stages of tree
plantations.
Introduction
One of the most important aims in functional biodiversity research is to predict the
importance of different facets of biodiversity for ecosystem functions (EF). It has been shown
that many different EFs are positively related to producer diversity (Loreau et al. 2001;
Hooper et al. 2005; Balvanera et al. 2014). A meta-analysis (Cardinale et al. 2011) revealed
that 414 out of 574 independent experimental manipulations of species richness had a positive
effect on producer biomass. This also applies to forests, which are the most important
ecosystems globally, because of their wide geographical cover and the unique ecosystem

92
goods they provide (Quijas et al. 2012). A review of worldwide inventories on forest growth
and standing biomass demonstrated positive relationships with tree species richness in the
majority of published studies (Scherer-Lorenzen 2013). For example, it was shown that
biomass production in Swedish forests increased with tree species richness (Gamfeldt et al.
2013).
This biodiversity-focused research has often tried to minimize environmental variation and
thus may have underestimated other major determinants of tree growth such as climate and
soil conditions. The analysis of the pan-European tree-ring network showed that forest
productivity is driven by temperature in high-elevation and high-latitude areas and by
moisture at low elevation in central and southern Europe (Babst et al. 2013). Climate also
determines tree growth at the microsite scale brought about by differences in slope, aspect,
and inclination (Chen et al. 1999; Geiger, Aron & Todhunter 2003). In the northern
hemisphere, south-facing slopes receive more solar irradiation than north-facing slopes
(Warren 2010), resulting in positive effects on individual tree growth (Fralish 1994; Li et al.
2014). In consequence, each single variable such as slope aspect, slope inclination or altitude
has the potential to significantly affect tree growth (Saremi et al. 2014). In addition, soil
conditions have a strong impact on forest productivity (Grier et al. 1989), rendering soil type
a key predictor in forest growth models (Landsberg & Waring 1997; Pinjuv, Mason & Watt
2006). This strong dependence of forest productivity on climate and soil conditions shows
that any attempt to detect biodiversity signals on tree growth needs to be separated from
effects of the abiotic environmental setting. The term 'ecoscape' has been suggested to
summarize all local topographic, microclimatic and edaphic environmental factors
(Bruelheide et al. 2014), which are potential co-drivers of biodiversity effects. In functional
biodiversity research the ecoscape can be considered a type of null model against which
additional biodiversity effects have to be compared (Díaz et al. 2007). In the current paper,
we have analysed a large forest biodiversity experiment in this way, assuming the biodiversity
treatments were only creating a large variation in functional diversities of tree communities
across a heterogeneous landscape and beyond that simply ignoring all design aspects of the
experiment. We believe that this novel approach of analysing a designed experiment as if it
was a sample survey of plots across the landscape (Snedecor & Cochran 1989) is justified to
give the null model of the ecoscape influencing tree growth the maximum chance to reveal
itself. The selected set of ecoscape variables were related to topography, such as slope, aspect
and elevation, and soil, such as pH value, carbon and nitrogen content in the topsoil, which
may be considered relevant for tree growth at the time of establishing the experiment. At this

93
early stage of the experiment we can assume that the ecoscape variables where themselves not
yet or only minimally affected by the experimental biodiversity treatments. Obviously, in the
longer term this may not hold and in particular microclimate and soil conditions might
respond to biodiversity in feed-back loops, whereby, depending on plot productivity and tree
richness, organisms modify their environment (Bruelheide et al. 2014).
Further key determinants of forest production are the tree species themselves. It is well known
that tree growth varies by one order of magnitude among different tree species (Lieberman et
al. 1985; Lambers & Poorter 1992). The impact of species identity has been found to be
strong in relation to effects of tree species richness per se (Nadrowski, Wirth & Scherer-
Lorenzen 2010; Lang et al. 2012a). One approach to better understand such species identity
effects is to relate species-specific differences in growth to the species' functional traits (Díaz
et al. 2007). It has been shown that a few key traits that describe the leaf economics spectrum
(LES) (Wright et al. 2004), such as specific leaf area (SLA) and leaf nitrogen content can
successfully predict tree growth of 53 rainforest species in Bolivia (Poorter & Bongers 2006).
At the plot scale, productivity should depend on the mixture of species in the community.
According to the mass-ratio hypothesis (Grime 1998) the most abundant or dominant species
are expected to exert the highest impact on EF. This hypothesis provides the basis for using
community weighted means (CWM) of trait values, obtained from averaging traits at the
community level by weighting the species' traits by the species' relative abundance in that
community (Ackerly et al. 2002). In grasslands, this approach has been successfully
employed for predicting EF from CWM trait values (Garnier et al. 2004; Roscher et al. 2012).
Thus, tree growth as one important EF might be predictable from CWM of a single key trait
or from a combination of CWMs of different uncorrelated traits.
Representing overall plot means, CWM do not account for trait variation within plots. Thus,
they do not capture the effect of functional diversity (FD), including both selection and
complementarity effects (Loreau & Hector 2001). In particular, functional diversity may
increase resource complementarity and facilitation among species in species-rich plots and
thus increase forest productivity (Spasojevic & Suding 2012; Dias et al. 2013). For example,
in southern New Zealand, nutrient-rich forest sites were not only characterized by species
with high relative growth rates, but also had a higher variation in growth rates, which was
related to a high variation in species-specific shade tolerances and resulted in a larger
complementarity of light use (Coomes et al. 2009). Hence, within defined forest age classes,
FD has been found to be positively related to aboveground biomass (Bu, Zang & Ding 2014).
Similarly, in the Cedar Creek experiment, functional complementarity of grassland species

94
resulted in higher C and N accumulation in soils (Fornara & Tilman 2007). Complementarity
in resource use is expected to emerge in trait space, seen in a higher variation and dispersion
of values of relevant traits (Lavorel et al. 2008). In principle, a trait can contribute to
complementarity of a particular EF in the community either spatially via above- or
belowground resource partitioning (Felten et al. 2009; Bessler et al. 2009) or temporally via
differential resource use in different seasons (Dedeyn & Vanderputten 2005). Trait value
distribution in the community can mathematically be expressed by FD measures, one of
which is the regularity of the distribution of trait abundances (Villéger, Mason & Mouillot
2008), as designated by Rao’s quadratic entropy (FDQ) (Rao 1982). It should be noted that in
communities FD of a trait is not independent of CWM of the same trait, since trait variation is
constrained by the mean (Dias et al. 2013). In consequence, both, FD and CWM of a single
trait, explain some degree of variation in EF. Thus, separating FD from CWM poses a similar
problem as separating ecoscape from biodiversity effects.
In summary, variation in productivity as important ecosystem function in forests, may be
largely explained variation by ecoscape, variation in community weighted mean trait values
(CWM) and functional diversity (FD). The contribution of each of these components on a
certain EF can be visualized as a triangle where ecoscape, CWM and FD are the corners. The
location of a particular plant community in this triangular space will depend on the relative
impact of the abiotic environment, species-specific properties and biotic interactions. For
example, aboveground net primary production (ANPP) in alpine grasslands was found to be
dependent on both nutrient supply (quantified by a nitrogen nutrition index) and FD in
vegetative height, which reflected light acquisition complementarity, but not by CWM of any
trait (Díaz et al. 2007). Taking together all predictors, 44% of the total variation in ANPP was
explained by abiotic conditions alone, and inclusion of FD did not improve the model's
explanatory power. However, to our knowledge no attempt has been made to quantify the
contribution of ecoscape, CWM and FD in forest communities. One important caveat that
must be considered in the above context is that not all of the three explanatory corners in the
mentioned triangle will usually have the same range of variation in any particular study and
thus they will not have the same chance to influence variation in the dependent variable. In
the present study, variation was particularly high in CWM and FD, because the plots came
from a biodiversity experiment, which ensured a large range of species richness levels, and as
a consequence, resulted in a large variation in CWM and FD. Nevertheless, the very large
topographic and hydrological variation at the experimental site also ensured a high variation
of ecoscape variables.

95
It might be argued that partitioning the effect of ecoscape, CWM and FD is only necessary in
natural communities but not in designed experiments, as in those biodiversity is manipulated
and environmental variation should be controlled for. To control environmental variation,
experimental plots are often established in homogeneous environments, such as a flat piece of
land with uniform land use history and soil properties. However, even comparatively low
environmental heterogeneity can strongly affect EF as was demonstrated in the Sardinilla
forest experiment in Panama (Healy, Gotelli & Potvin 2008). In presence of environmental
heterogeneity, fully randomized experiments cannot exclude that certain plots are located in
exceptional site conditions. For example, in the Sardinilla experiment, all six-species diversity
plots were located at low water drainage conditions (Healy et al. 2008). With increasing size
of the experiments, homogeneity will decrease. For that reason, many experiments have
employed blocking, for example with respect to distance from the river in the Jena-
Experiment (Roscher et al. 2004). However, blocking is only useful if there are few and clear
gradients across the experimental site (Bruelheide et al. 2014). In heterogeneous
environments, blocking is not feasible. Typically forests occur in such topographically
heterogeneous environments, as in many regions of the world, forests have withdrawn from
flat land, which often is more fertile than sloped land, and thus, is used for agriculture (Sandel
& Svenning 2013). This means that in realistic forest biodiversity-EF experiments, ecoscape
effects are often confounded with biodiversity and have to be accounted for in the same way
as in natural communities.
The aim of our study was to partition the effects of 11 environmental variables characterizing
the ecoscape and CWM and FD variables calculated from 41 species traits on one key
ecosystem function in the early stage of a large forest biodiversity experiment (Bruelheide et
al. 2014). Located in subtropical China, a set of 40 broadleaved tree species, native to the
natural vegetation was planted in richness levels of 1, 2, 4, 8, 16 and 24 tree species. We used
the results from one of two sites, which was planted in 2009 with 1 year-old saplings (Yang et
al. 2013; Bruelheide et al. 2014). As measure of the trees’ productivity we chose mean annual
crown width growth between 2011 and 2012 as the variable that best reflected tree growth in
this early stage of the experiment (Li et al. 2014). We expected that forest growth at this early
stage was mainly dominated by abiotic conditions, which was based on the finding of Li et al.
(2014) that growth of individual trees was related to aspect and soil nitrogen content but not
to Shannon diversity of the local tree neighbourhood. In the present study, we used the crown
width growth rate data of Li et al. (2014), but aggregated the data at the plot level. We then
subjected the plot mean values to the analysis framework of Díaz et al. (2007). To disentangle

96
the effects of the three groups of predictor variables mentioned above, a stepwise approach as
suggested by these authors (Díaz et al. 2007) was used, sequentially fitting the influence of
different predictors of the environment, CWM and FD. The objective of our study was to
identify those single ecoscape-, CWM- and FD- predictors that best predicted plot-level tree
growth. In particular, we hypothesized 1) that there are single variables from the three
predictor groups (ecoscape, CWM and FD) that significantly explain tree growth, and 2) that,
comparing the best predictors from the three groups, the ecoscape variables have the highest
explanatory power for tree growth rate at the early stage of the experiment.
To our knowledge, our study is the first to disentangle the effect of ecoscape, CWM and FD
in a biodiversity functioning experiment with trees. Our results are the first ones on trait-EF
relationships from all forest diversity experiments worldwide.
Materials and Methods
STUDY SITE
We conducted our study in a field experiment (BEF-China) in South-East Subtropical China
(29.08–29.11 N, 117.90–117.93 E). BEF-China is a large-scale biodiversity and ecosystem
functioning experiment with tree species (Yang et al. 2013; Bruelheide et al. 2014). Prior to
the experiment the sites were covered with conifer plantations of Pinus massoniana and
Cunninghamia lanceolata, harvested at about 20-year intervals. After clear-cutting the conifer
plantations, the aboveground plant biomass was removed from the experimental site (Yang et
al. 2013). Using a pool of 40 species native to the regional broadleaved forest, the experiment
was set up in 2008/2009, covering an area of 38 ha. The diversity gradient comprises
monocultures and plots with 2, 4, 8, 16 and 24 species. Here we present the results of one of
the two experimental sites (Site A). We evaluated data on tree growth measurements from 231
plots and 23 species planted at this site. As response variable we here analysed annual rates of
crown width growth, calculated from two monitoring sessions in 2011 and 2012 (Li et al.
2014). We used crown diameter increment data of 23 species, of which 14 and 9 species were
deciduous and evergreen, respectively, for which also an extensive list of functional traits was
measured on the sites. All growth data were aggregated at the plot level by taking the
arithmetic mean of absolute crown diameter increment across all individuals measured in a
plot.

97
ASSESSMENT OF ECOSCAPE VARIABLES
A 5 m digital elevation model (DEM) was established based differential GPS measurements
carried out in 2009. The DEM was used to derive plot mean values for elevation, aspect, mean
slope, solar insolation, profile curvature and plan curvature as description of the
environmental condition (Evans 1979; Zevenbergen & Thorne 1987; Dietrich & Montgomery
1998; Shary, Sharaya & Mitusov 2002). Sine and cosine transformations of the aspect were
used to express eastness and northness, respectively (Roberts 1986). All calculations were
made using ArcGIS 9.0 (ESRI Corp., Redlands, California, USA).
Soil variables were based on nine soil samples per plot, collected in 2010 by taking soil cores
at a depth of 0-5 cm. The nine soil samples per plot were thoroughly mixed and one bulk
sample per plot was analysed for total carbon (C) and total nitrogen (N) content. Prior to the
chemical analyses, soil samples were air-dried and sieved (< 2 mm). For the C and N
analyses, dry soil samples were ground with a ball mill and subjected to total C/N analysis
based on gas chromatography (Vario EL, Elementar, Hanau, Germany). Minimum,
maximum, mean values and standard deviation of all ecoscape variables is shown in
Supplementary Information Table S1.
ASSESSMENT OF LEAF TRAITS
All traits were used to calculate community weighted means (CWMs) and functional diversity
(FD) as predictive variables. These included a) traits connected to the leaf economics
spectrum such as specific leaf area (SLA) and leaf nitrogen content (LNC), b) traits related to
stomatal conductance such as maximum and mean stomatal conductance, c) traits related to
xylem properties, such as specific hydraulic conductivity of the xylem (KS) and the xylem
pressure at which 50% loss of the maximum specific hydraulic conductivity (Ψ50) and d) leaf
microscopic traits such as stomata density and the thickness of the palisade parenchyma.
These trait datasets and the specific measurement protocols were published in three recent
papers (Kröber & Bruelheide 2014; Kröber et al. 2014a; b).
STATISTICS
CWM value of traits was calculated according to (Garnier et al. 2004) and FDQ (Rao's
quadratic entropy) according to (Botta Dukát 2005). Both CWM and FDQ were weighted by
the frequency of the tree species in a plot. According to the design of the BEF-China

98
experiment, all tree species in a plot were represented by the same number of trees. However,
due to mortality, the number of trees per species on which growth rates were measured varied
to some degree from equal proportions. Thus, we made sure that the same proportions of trees
that were used in calculating plot means of crown diameter growth rates were also used for
calculating CWM and FD. All predictor variables were scaled by mean and standard
deviation, which allowed for an interpretation of the effect sizes with regard to their
importance on crown width growth rate. In an initial analysis we tested each single predictor
with single linear models for their impact on crown growth. We then tested the trait
complexes in combination according to (Díaz et al. 2007) for their explanatory power in
predicting crown growth. Since many different trait combinations can equally explain plant
growth (Marks & Lechowicz 2006a; b), we tested all possible combinations of the predictor
variables and then selected the best model that had a maximum of five predictor variables
based on Akaike's Information Criterion corrected for small-sample-sizes (cAIC), using the
MuMIn package in R (Barton 2014). The independent effect of each predictor variable in the
final model on crown growth was assessed by plotting the residuals of crown width growth
rates against every predictor variable. Finally, to test the impact of the three variable
complexes ecoscape, CWM and FD, we applied variance partitioning with all the significant
predictors, using the vegan package in R (Oksanen et al. 2013). For all statistical analyses, we
used the software R version 3.1.0 (R Core Team 2014).
Results
Contrary to our expectations, environmental factors had no significant effects on plot means
of annual crown width growth rates (Table 1). The best out of the selected ecoscape predictors
was slope inclination (SLOPE), which however, had only a marginally significant effect on
crown width (CW) growth rates (p=0.091). Testing for combinations of all ecoscape variables
in all possible multi-predictor models, the minimal model only retained altitude and eastness,
both of which with a negative impact on tree growth (Table 3). This means that plot mean of
tree crown diameter growth at the plot level was larger at low elevations (valleys and foot
slopes) and on slopes facing westwards than eastwards (Fig. 1). However, the minimal
ecoscape model only explained 3.8% of the total variation in crown width growth rates (Table
3).

99
Table 1
Impact of ecoscape on crown growth. The effect of ecoscape predictors for crown width growth rate, assessed as plot mean values between 2011 and 2010. All environmental variables are scaled by mean and standard deviation, thus the estimates show the direction and magnitude of impact on CW growth rates. DEM: digital elevation model
Abbreviation Predictor Source Estimate r2 p
ALT altitude DEM -0.05 0.01 0.11 SLO slope DEM -0.38 0.01 0.09 SOLAR solar radiation DEM 0.00 0.00 0.31 CURV X profile curvature DEM 0.02 0.00 0.50 CURV Y plan curvature DEM 0.00 0.00 0.94 NORTH aspect northness DEM, cosine of slope -0.47 0.00 0.81 EAST aspect eastness DEM, sine of slope -3.62 0.01 0.11 PH soil pH (KCl) Soil sampling, pH electrode 0.80 0.00 0.92 N soil nitrogen content Soil sampling, total CN analyzer 13.99 0.00 0.71 C soil carbon content Soil sampling, total CN analyzer -0.28 0.00 0.88 CN soil carbon nitrogen ratio Soil sampling, total CN analyzer -0.31 0.00 0.62
Figure 1
Mean annual crown width growth rate as predicted by the ecoscape multi-predictor model. The residuals from all other terms in the model are plotted against A) slope aspect (East) and B) altitude. Every dot represents one plot. All predictor variables are scaled by mean and standard deviation, thus the slope of the regression shows the direction and magnitude of impact on CW growth rates. The panels have been arranged in the sequence of decreasing order of effect sizes. For statistical details see Table 3.

100
Figure 2
Mean annual crown width growth rate as predicted by the CWM multi-predictor model. The residuals from all other terms in the model are plotted against A) leaf toughness, B) water potential, C) leaf magnesium content, D) stomata size and E) wood density. Every dot represents one plot. All predictor variables are scaled by mean and standard deviation, thus the slope of the regression shows the direction and magnitude of impact on CW growth rates. The panels have been arranged in the sequence of decreasing order of effect sizes. For statistical details see Table 3.

101
Figure 3
Mean annual crown width growth rate as predicted by the FD multi-predictor model. The residuals from all other terms in the model are plotted against A) water potential, B) stomata index, C) leaf vein length, D) number of palisade parenchyma layers and E). presence of extrafloral nectaries. Every dot represents one plot. All predictor variables are scaled by mean and standard deviation, thus the slope of the regression shows the direction and magnitude of impact on CW growth rates. The panels have been arranged in the sequence of decreasing order of effect sizes. For statistical details see Table 3.

102
In contrast, numerous variables of CWM and FD showed significant effects, also evident in
the inclusion of many CWM and FD predictors in the minimal multiple regression models
(Table 3). In total, 25 and 15 out of 41 variables produced significant single predictor models
for CMW and FD, respectively (Table 2). The best single CWM predictor for CW growth
rates was number of palisade parenchyma layers (PALSTR, r2=0.24), while the best FD
predictor was the presence of extrafloral nectaries (EXTRAFLORAL, r2=0.10), a trait only
encountered in four of the 23 species (i.e. Diospyros japonica, Melia azedarach, Triadica
cochinchinensis and T. sebifera, Supplementary Information Table S2). Many significant
CWM predictors were typical traits of the LES, such as specific leaf area (SLA), leaf
nitrogen, potassium and magnesium content (LNC, K, MG) and the leaf carbon to nitrogen
ratio (CN). However, except for magnesium these variables had lower estimates compared to
morphological and anatomical variables such as leaf toughness, leaf dry matter content
(LDMC), leaf thickness, presence of a subepidermis, number of palisade parenchyma layers
and presence of a column of sclerenchyma cells through the leaf (Table 2). In the minimal
multi-predictor model (Table 3), some of these variables such as water potential (WPOT),
stomata size (STOMSIZE) and wood density (WOODDENS) had positive effects on crown
width growth rates, while leaf toughness (LEAFT) and leaf magnesium content (MG) had
negative effects (Fig. 2).
Significant FD variables were essentially a subset of the significant CWM variables, except
for wood density, leaf area (LA), leaf calcium content (CA), the ratio of palisade to mesophyll
layer thickness (LOG10RATIO) and presence of extrafloral nectaries (EXTRAFLORAL), for
which only FD but not CWM had a significant effect on CW growth rate. In addition, there
were two variables, hydraulic conductance (KS) and vein length (VEINLENGTH), for which
FD had a higher explanatory power than CWM.
Interestingly, the minimal multi-predictor model for the FD-growth relationship included
variables with both positive (WPOT, VEINLENGTH, EXTRAFLORAL) and negative effect
sizes, such as stomata index (STOIND) and number of palisade layers (PALSTR, Fig. 3).

103
Figure 4
Plot of the partitioned variance explained by the three different variable complexes, green = environment, purple = CWM, light blue = FD, values below 0.01 not shown. For statistical details see Table 3.
In combination, the three best multi-predictor models of ecoscape, CWM and FD explained
51% of variation of plot-level crown width growth rates (Fig. 4). CWM explained most
variation, both in terms of exclusive impact on tree growth that was not captured by ecoscape
or FD and in terms of shared variance with ecoscape and FD. For example, out of the 31%
variance in growth explained by FD, two thirds (i.e. 22%) were also shared by CWM
predictors. There was almost no variation left that was exclusively explained by
ecoscape (1%).

104
Table 2
Impact of CWM and FD on crown growth. The effect of community weighted means (CWM) and functional diversity (FD) of single traits for crown width (CW) growth rate, assessed as plot mean values between 2011 and 2010. All variables are scaled by mean and standard deviation, thus the estimates show the direction and magnitude of impact on CW growth rates.
Abbreviation Predictor Source CWM FD Estimate r2 p Estimate r2 p
PSI50 loss of 50% initial flowrate scholander pressure bomb 0.84 0.00 0.50 -0.40 0.00 0.75 KS maximum flowrate lab measurements 2.46 0.02 0.05 5.19 0.08 0.00 B Parameter b (Sigmoid Regression) scholander pressure bomb -6.20 0.11 0.00 -3.44 0.03 0.01 CONMEAN average stomatal conductance steady state porometer 5.27 0.08 0.00 2.66 0.02 0.03 CONMAX maximum stomatal conductance steady state porometer 3.99 0.05 0.00 1.21 0.00 0.33 VPDMAX vpd at CONMAX steady state porometer -0.82 0.44 0.51 -0.32 0.00 0.80 CONMAXFIT relative fitted max. stomatal conductance steady state porometer 2.32 3.57 0.06 1.62 0.01 0.19 CONMAXFITA absolute fitted max. stomatal conductance steady state porometer 5.00 0.07 0.00 2.73 0.02 0.03 VPDMAXFIT vpd at CONMAXFIT steady state porometer 1.73 0.01 0.16 0.25 0.00 0.84 VPDPOI vpd at point of inflection of fitted stomatal conductance steady state porometer 0.50 0.00 0.69 0.29 0.00 0.81 WOODDENS wood density lab measurements 0.42 0.00 0.74 4.42 0.06 0.00 WPOT water potential scholander pressure bomb 7.74 0.17 0.00 4.68 0.06 0.00 LA leaf area lab measurements 1.10 0.00 0.38 4.55 0.06 0.00 LDMC leaf dry matter content lab measurements -7.24 0.15 0.00 2.09 0.01 0.09 SLA specific leaf area lab measurements 4.05 0.05 0.00 0.66 0.00 0.59 LEAFT leaf toughness leaf toughness device -7.65 0.17 0.00 -0.40 0.00 0.75 STOMDENS stomata density microscope -3.40 0.03 0.01 1.80 0.01 0.15 STOIND stomata index microscope -2.95 0.02 0.02 1.82 0.01 0.14 LNC leaf nitrogen content CN analyzer 2.88 0.02 0.02 -1.99 0.01 0.11 LCC leaf carbon content CN analyzer 0.62 0.00 0.62 0.73 0.00 0.56 CN leaf carbon nitrogen ratio CN analyzer -3.48 0.03 0.00 -0.80 0.00 0.52 CA leaf calcium content atom absorption spectrometer -1.55 0.01 0.21 3.35 0.03 0.01

105
K leaf potassium content atom absorption spectrometer 4.30 0.05 0.00 -0.19 0.00 0.88 MG leaf magnesium content atom absorption spectrometer 6.78 0.13 0.00 1.27 0.00 0.31 DIAMVEIN1 diameter veins 1st order microscope 2.41 0.02 0.05 0.79 0.00 0.53 DIAMVEIN2 diameter veins 2nd order microscope 3.88 0.04 0.00 2.75 0.02 0.03 UPPEREPI upper epidermis thickness microscope -1.28 0.00 0.30 0.78 0.00 0.53 PALIS palisade parenchyma thickness microscope -3.73 0.04 0.00 2.70 0.02 0.03 SPONGY spongy parenchyma thickness microscope -3.88 0.04 0.00 1.42 0.01 0.25 LOG10RATIO log ratio of the palisade to spongy parenchyma thickness microscope 0.28 0.00 0.82 2.81 0.02 0.02 LEAFTHICK leaf thickness microscope -5.33 0.08 0.00 1.57 0.01 0.21 SUBEPID presence of a subepidermis microscope -5.32 0.08 0.00 -3.96 0.04 0.00 EPICELLSIZ ratio of the cell size of upper and lower epidermis microscope 4.58 0.06 0.00 -2.37 0.02 0.05 PALSTR number of palisade parenchyma layers microscope -9.10 0.24 0.00 -1.01 0.00 0.41 EXCRET presence of excretory glands electron microscope -0.11 0.00 0.93 0.05 0.00 0.97 DENSINTCEL density of spongy parenchyma microscope 1.33 0.01 0.28 2.35 0.02 0.06 COLSCLER presence of a column of sclerenchyma cells through the leaf microscope -5.30 0.08 0.00 -3.93 0.04 0.00 PAPILL presence of papillae electron microscope -3.06 0.03 0.01 0.36 0.00 0.77 EXTRAFLORAL presence of extrafloral nectaries observation 1.85 0.01 0.13 5.96 0.10 0.00

106
Table 3
Multi-predictor model coefficients for ecoscape, CWM and FD. Results of the minimum multi-predictor models for ecoscape, community weighted means (CWM) and functional diversity (FD) and the overall model combining these three multipredictor models. All variables are scaled by mean and standard deviation, thus the estimates show the direction and magnitude of impact on CW growth rates.
Model r2 Significant predictors Abbreviation Estimate p
ecoscape 0.04 altitude + aspect (east)
ALT EAST
-0.08 -6.03
0.0129 0.0125
CWM 0.44
leaf toughness + leaf magnesium content + stomata size + wood density + water potential
LEAFT MG STOMSIZE WOODDENS WPOT
-14.5 -11.1 7.2 2.9 13.0
<0.001 <0.001 <0.001 0.0103 <0.001
FD 0.31
extrafloral nectaries + number of palisade layers + stomata index + veinlength + water potential
EXTRAFLORAL PALSTR STOIND VEINLENGTH WPOT
3.93 -8.41 -11.46 9.27 12.14
0.0011 <0.001 <0.001 <0.001 <0.001
combined 0.51 altitude + aspect (east) + leaf toughness + leaf magnesium content + stomata size + wood density + water potential + extrafloral nectaries + number of palisade layers + stomata index + veinlength + water potential

107
Discussion
Using the combined information of selected ecoscape variables, community weighted means
and functional diversity, we could account for 51% variability of crown width growth rates.
Against expectation, no single variable did explain crown diameter growth to a sufficient
degree. The largest proportion of variance explained by a single variable was 24% (number of
palisade parenchyma layers). Nevertheless, our first hypothesis was confirmed by identifying
some single key variables for tree growth, of which however, the most powerful ones were all
based on community mean trait values. In contrast, ecoscape variables turned out to be weak
predictors for crown growth and explained less than 4%, while functional diversity explained
up to 31% and community weighted means up to 42% of crown growth. Thus, we have to
reject our second hypothesis of a dominant impact of ecoscape on tree growth at this early
stage of the experiment.
The low importance of ecoscape was unexpected, given the high topographic heterogeneity
and large size of the experiment. Altitude had a negative impact on tree growth, which was
opposite to the findings on initial tree survival at the same site (Yang et al. 2013). Similarly,
altitude affected productivity in the Sardinilla experiment (Healy et al. 2008). In Sardinilla,
the single environmental variable with the highest impact on productivity was slope
inclination, followed by water drainage quality. Total variance of productivity explained by
ecoscape in Sardinilla was 35%. However, the Sardinilla plots only differed 8 m in altitude,
while our site A varied by 170 m, with a total experiment size of 26.7 ha vs. 8 ha in Sardinilla
(Bruelheide et al. 2014). Interestingly, many ecoscape variables with reported effects in the
literature did not have any significant impact on plot mean crown diameter growth in the
BEF-China experiment, such as pH. Soil pH is well-known to limit nutrient availability
(Lambers, Chapin & Pons 2008) and was found to limit tree growth in primeval forests in the
Changbai Shan in Northeastern China (Yang, Hu & Bu 2009). Increasing soil pH, in addition
to increasing elevation, showed negative effects on above ground biomass increment in
tropical Andean forests (Unger, Homeier & Leuschner 2012).
The negative effect of higher elevation might be explained by a temperature gradient, with
lower temperatures at higher elevation being in particular disadvantageous in winter and
spring, but also by downslope growth locations being more sheltered from wind. However,
we have no hint that elevation has indirect effects via differing soil conditions, as all these did
not result in significant models. The fact that higher crown width growth rates were observed
in plots on westward-facing slopes might result from the fact that on slopes with that compass
108
direction morning dew lasted longer and vpd was lower in the morning, thus allowing the
trees to have a prolonged period of gas exchange, and in consequence, higher rates of carbon
assimilation, before stomata closure occurs at increasing vpd values.
With respect to community weighted means (CWM), we found traits of the leaf economics
spectrum (LES) to affect tree growth, with a positive effect of specific leaf area (SLA) and
leaf magnesium content (MG). Nonetheless, morphological and anatomical traits such as leaf
toughness and thickness, number of palisade parenchyma layers as well as presence of a
subepidermal layer had a higher explanatory power than typical LES traits. The number of
palisade parenchyma layers had already been identified as a good proxy for maximum
stomatal conductance (CONMAX) (Kröber, Heklau & Bruelheide 2014a), and thus increasing
tree growth would have been expected with increasing number of palisade parenchyma layers.
The best 5-predictor model for CWM variables comprised two traits of leaf morphology (leaf
toughness and stomata size) and one of plant hydraulics (water potential), while only MG was
included as a typical LES trait and wood density as a key trait of the wood economics
spectrum (Freschet et al. 2010; Baraloto et al. 2010; Martínez-Cabrera et al. 2011). This
complex of morphological, anatomical and physiological traits supports the idea that
integrating more and novel functional traits might increase the predictability of ecosystem
functioning, and thus, also the reliability of products relying on these relationships, such as
dynamic vegetation models (Scheiter, Langan & Higgins 2013). As the different variables in
the multi-predictor model explained additional variation in crown width growth rates, they
were not fully collinear to each other, showing that the leaf and wood economics spectrum did
not perfectly match (Baraloto et al. 2010). Interestingly, both wood density and magnesium
content were related to tree growth, as crown width growth rates increased with decreasing
Mg contents and increasing wood density. The comparably low explanatory power of LES
traits on tree growth in the single predictor models and their contrasting role in the multi-
predictor model challenges the assumption of a universal positive growth-LES effect on tree
growth. Trees might behave differently than herbaceous plants, where strong positive growth-
LES relationships have been described (Grime & Hunt 1975; Poorter & van der Werf 1998).
The low predictive power for tree growth has been recently demonstrated in a meta-analysis
that estimated size-standardized relative growth rates for 278 tree species from 27 sites around
the world and found no significant relationship to SLA and wood density (Paine et al. 2014).
Another variable in the best multi-predictor model was stomata size, which enables species to
attain maximum stomatal conductance at low vpd values (Kröber & Bruelheide 2014).
Furthermore, tree crown growth was positively related to xylem water potential measured in

109
the field, showing that species grew the better, the more they were able to keep their water
status at moderate levels. This was also reflected in leaf toughness, which had the highest
explanatory power in the multi-predictor model and can be interpreted as a key defence trait
against herbivores (Kursar & Coley 2003). In our model, species grew the better, the less they
invested in physical defence.
We found several FD traits to explain variance in crown growth additional to the CWM
effects. The significance of FD at this early stage shows that effects of complementarity in
resource use already have emerged. In principle, the traits with significant FD effects on tree
growth can be thought to operate through spatial complementarity, such as wood density and
leaf area. The joint occurrence of species with low- and high-investment in wood allows a
community to quickly build up tall canopies with fast-growing species and at the same time to
form a second layer of more slowly growing, durable-wood species. In Iberian forests, canopy
trees with denser wood had lower maximum height and wider crown widths (Poorter et al.
2012b). Since wood density and physiological strategies of trees are closely related (Santiago
et al. 2004), a wide range of wood density in a plot might increase the total amount of
resources captured in this plot. Leaf area plays a central role in leaf trait relationships because
the mass-normalized traits in the leaf economics spectrum are proportional to leaf area (Osnas
et al. 2013). Thus, leaf area might represent a sum variable that captures variance of various
other variables in the LES, but also of morphological traits such as palisade parenchyma
thickness (PALIS) and the palisade to mesophyll ratio (LOG10RATIO). Particularly, in
young plantations, large-leaved species can quickly increase the stand's leaf area index, while
species with small leaves follow a more invariable investment strategy. Studies on crown
filling in the BEF-China experiment are still on-going, but results from natural forests
revealed that diverse plots have a higher crown overlap than species-poor plots (Lang et al.
2012b). Species with small leaves also tend to be evergreen (Kröber et al. 2014a), and thus
might also be complementary to large-leaved deciduous species in time. Traits that potentially
contribute to temporal complementarity were all related to plant water relations, such as
specific hydraulic conductance of the xylem (KS), xylem water potential, leaf vein -length and
-diameter and leaf stomatal conductance. FD in these water flux-related traits can increase
growth rates if some species display high carbon assimilation rates under optimal humid
conditions, while others continue with carbon sequestration in dry spells, which frequently
occur in summer at the experimental site (Zhou et al. 2011; 2013). Interestingly, FD of some
traits also had negative effects on crown width growth rates, such as slope of the xylem
vulnerability curve (B), the presence of a subepidermis and the presence of columns of

110
sclerenchyma cells in the leaf. In principle, negative estimates of FD can only be interpreted
as corroborating the CWM signal of these traits, which was also negative in all these cases.
These traits promote growth when their values are near to the possible minimum, where
CWM and FD show a strong covariation (Dias et al. 2013). In addition, some traits might act
through facilitation, i.e. enhancing the growth of other species’ individuals through their
presence in a certain species. Such a trait probably was the presence of extrafloral nectaries,
which was the FD trait in the single predictor models with the highest impact on crown width
growth. Interestingly, the presence of one of the four species with such nectaries in a plot
increased overall plot mean crown growth rates. Extrafloral nectaries have previously been
shown to have large effects on plant performance through ant-plant mutualism as ants
attracted by extrafloral nectaries have been found to reduce infestation levels of herbivores
(Oliveira 1997). However, the presence of extrafloral nectaries must not be beneficial for the
target plant itself (Kersch-Becker, Buss & Fonseca 2013; Pereira & Trigo 2013), but might
have positive effects at the community level (Koptur 1992). The multi-predictor model for the
FD-growth relationship included presence of extrafloral nectaries as a variable representing
facilitation and variables with positive and negative slope pointing to temporal
complementarity, while most variables pointing at spatial complementarity did not enter the
model.
Combining ecoscape, CWM and FD in the overall model confirms that ecoscape does only
contribute a surprisingly small fraction to explain tree growth. This forms a contrast to the
analyses at the single tree level carried out on the same site and using the same crown width
growth data used by us (Li et al. 2014). This indicates that individual trees respond much
stronger to topography and soil as does plot mean growth. However, the overall contribution
of soil variables such as C and N content on individual tree growth was also low at the single
tree level (Ying Li, unpublished data). A further reason for the discrepancy to the single tree-
level data was that species were considered a random factor, thus assigning all trait
differences between species to random variation (Li et al. 2014), while we accounted for these
differences in CWM functional traits. Similarly, also FD was only partially represented in the
single-tree models of Li et al. (2014) by including Shannon diversity of the local
neighbourhood, which however was found not to contribute to explaining crown growth.
Thus, FD might have captured more unexplained variation than Shannon diversity. In
addition, FD effects might only play out if scales larger than the immediate neighbourhood
are involved, i.e. whole plots with 400 tree individuals each.

111
We also have to consider that the ecoscape variables included in our study did not sufficiently
reflect resource supply. On the one hand, many variables showed only a very low amount of
variation among plots, such as soil pH. On the other hand, soil variables such as nitrogen
content and carbon to nitrogen ratio might reflect the pre-planting conditions of the conifer
plantations of Pinus massoniana and Cunninghamia lanceolata, which might have levelled
out differences among plots. Finally, not all key ecoscape variables have been included, such
as e.g. phosphorus supply.
Although our overall model explained 51% of variation in plot-level crown growth, a
substantial amount of variation in the growth-trait relationship remained unexplained, which
is typical of tree growth studies (Steege 2003; Poorter et al. 2008; Martínez-Vilalta et al.
2010; Wright et al. 2010; Rüger et al. 2012). Possible causes for unexplained variation might
be negative biotic interactions such as pathogens and herbivores that reduced potential growth
rates. Thus, field studies probably arrive at different conclusions than greenhouse trials, which
assess potential growth rates under exclusion of biotic interactions and show strong
relationships to functional leaf traits (Böhnke & Bruelheide 2013). Moreover, juvenile trees
may allocate resources to the expansion of their root system for several years without
substantial aboveground growth, especially in dry or nutrient-poor forests (Poorter et al.
2012a).
Conclusion
We have to be aware of the early stage of our experiment and that the system is neither stable
nor in equilibrium, as the trees continue to grow and tree-tree interactions become
increasingly intense. At present, forests growth is still dominated by CWM effects, but an
increasing impact of FD at the expense of CWM effects can be expected. In contrast, the role
of the ecoscape is unforeseen. A distinction can be made between ecoscape variables that are
temporally invariable (such as slope, aspect, elevation) or dynamic (such as microclimate,
content of soil organic matter and nutrients, soil reaction, etc.). On the one hand, invariable
abiotic site conditions are not important at present. On the other hand, the dynamic ecoscape
variables will be increasingly affected by tree growth. Thus, we expect that tree growth feeds
back on this aspect of the ecoscape. In particular with respect to biodiversity, the dynamic
ecoscape can have the form of a positive feed-back loop, whereby a higher variation of
organisms that depend on higher tree richness modify the abiotic environment to their own
favour. Therefore, it might be that diversity creates conditions that are amenable to more

112
diversity. In this respect, the process might be similar to niche construction models for of
single species (Odling-Smee, Laland & Feldman 2003). If biodiversity acts through
modifying the ecoscape, an increase in importance of the dynamic ecoscape components can
be expected. Thus, following the experiment over the next years will be very exciting!
Acknowledgements
We would like to thank Xuefei Yang, Sabine Both, Lin Chen and Xiaojuan Liu for the help in
coordinating the fieldwork for the BEF-China experiment. We are also very grateful for the
general support of the whole BEF-China research group. BEF-China is largely financed by
the German Research Foundation (DFG FOR 891/1 and 2), and funding for this particular
project was provided by the German Research Foundation to H.B. (DFG BR 1698/9-2).
Travel grants and summer schools were granted through the Sino-German Centre for
Research Promotion in Beijing (GZ 524, 592, 698, 699 and 785).
References Ackerly, D.D., Knight, C., Weiss, S., Barton, K. & Starmer, K. (2002) Leaf size, specific leaf
area and microhabitat distribution of chaparral woody plants: contrasting patterns in species level and community level analyses. Oecologia, 130, 449–457.
Babst, F., Poulter, B., Trouet, V., Tan, K., Neuwirth, B., Wilson, R., Carrer, M., Grabner, M., Tegel, W., Levanic, T., Panayotov, M., Urbinati, C., Bouriaud, O., Ciais, P. & Frank, D. (2013) Site- and species-specific responses of forest growth to climate across the European continent. Global Ecology and Biogeography, 22, 706–717.
Balvanera, P., Siddique, I., Dee, L., Paquette, A., Isbell, F., Gonzalez, A., Byrnes, J., O’Connor, M.I., Hungate, B.A. & Griffin, J.N. (2014) Linking biodiversity and ecosystem services: current uncertainties and the necessary next steps. Bioscience, 64, 49–57.
Baraloto, C., Paine, C., Poorter, L., Beauchene, J., Bonal, D., Domenach, A.-M., Hérault, B., Patiño, S., Roggy, J.-C. & Chave, J. (2010) Decoupled leaf and stem economics in rain forest trees. Ecology Letters, 13, 1338–1347.
Barton, K. (2014) MuMIn: Multi-model inference. R package version 1.10.0. URL http://CRAN.R-project.org/package=MuMIn [accessed 23 June 2014]
Bessler, H., Temperton, V.M., Roscher, C., Buchmann, N., Schmid, B., Schulze, E.-D., Weisser, W.W. & Engels, C. (2009) Aboveground overyielding in grassland mixtures is associated with reduced biomass partitioning to belowground organs, Ecology 90, 1520–1530.
Botta Dukát, Z. (2005) Rao's quadratic entropy as a measure of functional diversity based on multiple traits. Journal of Vegetation Science, 16, 533–540.
Böhnke, M. & Bruelheide, H. (2013) How do evergreen and deciduous species respond to shade? - Tolerance and plasticity of subtropical tree and shrub species of South-East China. Environmental and Experimental Botany, 87, 179–190.
Bruelheide, H., Nadrowski, K., Assmann, T., Bauhus, J., Both, S., Buscot, F., Chen, X.-Y., Ding, B., Durka, W., Erfmeier, A., Gutknecht, J.L.M., Guo, D., Guo, L.-D., Härdtle, W.,

113
He, J.-S., Klein, A.-M., Kühn, P., Liang, Y., Liu, X., Michalski, S., Niklaus, P.A., Pei, K., Scherer-Lorenzen, M., Scholten, T., Schuldt, A., Seidler, G., Trogisch, S., Oheimb, von, G., Welk, E., Wirth, C., Wubet, T., Yang, X., Yu, M., Zhang, S., Zhou, H., Fischer, M., Ma, K. & Schmid, B. (2014) Designing forest biodiversity experiments: general considerations illustrated by a new large experiment in subtropical China. Methods in Ecology and Evolution, 5, 74–89.
Bu, W., Zang, R. & Ding, Y. (2014) Field observed relationships between biodiversity and ecosystem functioning during secondary succession in a tropical lowland rainforest. Acta Oecologica, 55, 1–7.
Cardinale, B.J., Matulich, K.L., Hooper, D.U., Byrnes, J.E., Duffy, E., Gamfeldt, L., Balvanera, P., O’Connor, M.I. & Gonzalez, A. (2011) The functional role of producer diversity in ecosystems. American Journal of Botany, 98, 572–592.
Chen, J., Saunders, S.C., Crow, T.R., Naiman, R.J., Brosofske, K.D., Mroz, G.D., Brookshire, B.L. & Franklin, J.F. (1999) Microclimate in forest ecosystem and landscape ecology. Bioscience, 49, 288–297.
Coomes, D.A., Kunstler, G., Canham, C.D. & Wright, E. (2009) A greater range of shade-tolerance niches in nutrient-rich forests: an explanation for positive richness-productivity relationships?, Journal of Ecology 97, 705–717.
Dedeyn, G. & Vanderputten, W. (2005) A temporal approach to linking aboveground and belowground ecology. Trends in Ecology & Evolution, 20, 625–633.
Dias, A.T.C., Berg, M.P., Bello, F., Oosten, A.R., Bílá, K. & Moretti, M. (2013) An experimental framework to identify community functional components driving ecosystem processes and services delivery. Journal of Ecology, 101, 29–37.
Dietrich, W.E. & Montgomery, D.R. (1998) SHALSTAB: a Digital Terrain Model for Mapping Shallow Landslide Potential. NCASI Technical Report
Díaz, S., Lavorel, S., de Bello, F., Quetier, F., Grigulis, K. & Robson, T.M. (2007) Incorporating plant functional diversity effects in ecosystem service assessments. Proceedings of the National Academy of Sciences of the United States of America, 104, 20684–20689.
Evans, I.S. (1980) An integrated system of terrain analysis and slope mapping. Zeitschrift für Geomorphologie, 36, 274-295
Felten, von, S., Hector, A., Buchmann, N., Niklaus, P.A., Schmid, B. & Scherer-Lorenzen, M. (2009) Belowground nitrogen partitioning in experimental grassland plant communities of varying species richness. Ecology, 90, 1389–1399.
Fornara, D.A. & Tilman, D. (2007) Plant functional composition influences rates of soil carbon and nitrogen accumulation. Journal of Ecology, 96, 314–322.
Fralish, J.S. (1994) The effect of site environment on forest productivity in the Illinois Shawnee Hills. Ecological Applications, 4, 134.
Freschet, G.T., Cornelissen, J.H.C., van Logtestijn, R.S.P. & Aerts, R. (2010) Evidence of the “plant economics spectrum” in a subarctic flora. Journal of Ecology, 98, 362–373.
Gamfeldt, L., Snäll, T., Bagchi, R., Jonsson, M., Gustafsson, L., Kjellander, P., Ruiz-Jaen, M.C., Fröberg, M., Stendahl, J., Philipson, C.D., Mikusiński, G., Andersson, E., Westerlund, B., Andrén, H., Moberg, F., Moen, J. & Bengtsson, J. (2013) Higher levels of multiple ecosystem services are found in forests with more tree species. Nature Communications, 4, 1–8.
Garnier, E., Cortez, J., Billès, G., Navas, M.-L., Roumet, C., Debussche, M., Laurent, G., Blanchard, A., Aubry, D., Bellmann, A., Neill, C. & Toussaint, J.-P. (2004) Plant functional markers capture ecosystem properties during secondary succession. 85, 2630–2637.
Geiger, R., Aron, R.H. & Todhunter, P. (2003) The Climate Near the Ground, 6 ed. Rowman & Littlefield, Lanham.

114
Grier, C.C., Lee, K.M., Nadkarni, N.M., Klock, G.O. & Edgerton, P.J. (1989) Productivity of forests of the United States and its relation to soil and site factors and management practices: a review. U.S. Department of Agriculture, Forest Service, Pacific Northwest Research Station., 1–51.
Grime, J.P. (1998) Benefits of plant diversity to ecosystems: immediate, filter and founder effects. Journal of Ecology, 86, 902–910.
Grime, J.P. & Hunt, R. (1975) Relative growth-rate: Its range and adaptive significance in a local flora. The Journal of Ecology, 63, 393.
Healy, C., Gotelli, N.J. & Potvin, C. (2008) Partitioning the effects of biodiversity and environmental heterogeneity for productivity and mortality in a tropical tree plantation. Journal of Ecology, 96, 903–913.
Hooper, D., Chapin, F., Ewel, J., Hector, A., Inchausti, P., Lavorel, S., Lawton, J., Lodge, D., Loreau, M., Naeem, S., Schmid, B., Setälä, H., Symstad, A., Vandermeer, J. & Wardle, D. (2005) Effects of biodiversity on ecosystem functioning: A consensus of current knowledge. Ecological Monographs, 75, 3–35.
Kersch-Becker, M.F., Buss, S.R. & Fonseca, C.R. (2013) Conservation of an ant–plant mutualism in native forests and ecologically‐managed tree monocultures. Biotropica, 45, 520–527.
Koptur, S. (1992) Extrafloral nectary-mediated interactions beetwen insects and plants. CRC series on Insect/Plant Interactions. pp. 85–132. CRC Press, Boca Raton.
Kröber, W. & Bruelheide, H. (2014) Transpiration and stomatal control: A cross-species study of leaf traits in 39 evergreen and deciduous broadleaved subtropical tree species. Trees, 28, 901–914.
Kröber, W., Heklau, H. & Bruelheide, H. (2014a) Leaf morphology of 40 evergreen and deciduous broadleaved subtropical tree species and relationships to functional ecophysiological traits. Plant Biology. IN PRESS
Kröber, W., Zhang, S., Ehmig, M. & Bruelheide, H. (2014b) Xylem hydraulic structure and the Leaf Economics Spectrum - A cross-species study of 39 evergreen and deciduous broadleaved subtropical tree species. PLOS ONE. IN PRESS
Kursar, T.A. & Coley, P.D. (2003) Convergence in defence syndromes of young leaves in tropical rainforests. Biochemical Systematics and Ecology, 31, 21–21.
Lambers, H. & Poorter, H. (1992) Inherent variation in growth-rate between higher-plants - a search for physiological causes and ecological consequences. Advances in Ecological Research, 23, 187–261.
Lambers, H., Chapin, F., III & Pons, T. (2008) Plant Physiological Ecology, 2nd ed. Springer. Landsberg, J.J. & Waring, R.H. (1997) A generalised model of forest productivity using
simplified concepts of radiation-use efficiency, carbon balance and partitioning. Forest Ecology and Management, 95, 209–228.
Lang, A.C., Härdtle, W., Baruffol, M., Böhnke, M., Bruelheide, H., Schmid, B., Wehrden, H. & Oheimb, G. (2012a) Mechanisms promoting tree species co‐existence: Experimental evidence with saplings of subtropical forest ecosystems of China. Journal of Vegetation Science, 23, 837–846.
Lang, A.C., Härdtle, W., Bruelheide, H., Kröber, W., Schröter, M., Wehrden, von, H. & Oheimb, von, G. (2012b) Horizontal, but not vertical canopy structure is related to stand functional diversity in a subtropical slope forest. Ecological Research, 27, 181–189.
Lavorel, S., Grigulis, K., McIntyre, S., Williams, N.S.G., Garden, D., Dorrough, J., Berman, S., Quétier, F., Thébault, A. & Bonis, A. (2008) Assessing functional diversity in the field – methodology matters! Functional Ecology, 22, 134–147.
Li, Y., Härdtle, W., Bruelheide, H., Nadrowski, K., Scholten, T., Wehrden, von, H. & Oheimb, von, G. (2014) Site and neighbourhood effects on growth of tree saplings in subtropical plantations (China). Forest Ecology and Management, 327, 118–127.

115
Lieberman, D., Lieberman, M., Hartshorn, G. & Peralta, R. (1985) Growth rates and age-size relationships of tropical wet forest trees in Costa Rica. Journal of Tropical Ecology, 1, 97–109.
Loreau, M. & Hector, A. (2001) Partitioning selection and complementarity in biodiversity experiments. Nature, 412, 72–76.
Loreau, M., Naeem, S., Inchausti, P., Bengtsson, J., Grime, J.P., Hector, A., Hooper, D.U., Huston, M.A., Raffaelli, D., Schmid, B., Tilman, D. & Wardle, D.A. (2001) Biodiversity and ecosystem functioning: current knowledge and future challenges. Science, 294, 804–808.
Marks, C.O. & Lechowicz, M.J. (2006a) A holistic tree seedling model for the investigation of functional trait diversity. Ecological Modelling, 193, 141–181.
Marks, C.O. & Lechowicz, M.J. (2006b) Alternative designs and the evolution of functional diversity. The American Naturalist, 167, 55–66.
Martínez-Cabrera, H.I., Schenk, H.J., Cevallos-Ferriz, S.R.S. & Jones, C.S. (2011) Integration of vessel traits, wood density, and height in Angiosperm shrubs and trees. American Journal of Botany, 98, 915–922.
Martínez-Vilalta, J., Mencuccini, M., Vayreda, J. & Retana, J. (2010) Interspecific variation in functional traits, not climatic differences among species ranges, determines demographic rates across 44 temperate and Mediterranean tree species. Journal of Ecology, 98, 1462–1475.
Nadrowski, K., Wirth, C. & Scherer-Lorenzen, M. (2010) Is forest diversity driving ecosystem function and service? Current Opinion in Environmental Sustainability, 2, 75–79.
Odling-Smee, F.J., Laland, K.N. & Feldman, M.W. (2003) Niche Construction. Princeton University Press, Princeton.
Oksanen, M., Blanchet, F.G., Kindt, R., Legendre, P., Minchin, P.R., O'Hara, R.B., Simpson, G.A., Solymos, P., Stevens, M. & Wagner, H. (2013) Vegan: Community Ecology Package. R package version 2.0-10. URL http://cran.r-project.org/web/packages/vegan/index.html [accessed 28 July 2014]
Oliveira, P.S. (1997) The ecological function of extrafloral nectaries: herbivore deterrence by visiting ants and reproductive output in Caryocar brasiliense (Caryocaraceae). Functional Ecology, 11, 323–330.
Osnas, J.L.D., Lichstein, J.W., Reich, P.B. & Pacala, S.W. (2013) Global leaf trait relationships: mass, area, and the leaf economics spectrum. Science, 340, 741–744.
Paine, C., Amissah, L., Auge, H., Baraloto, C., Baruffol, M., Bourland, N., Bruelheide, H., Daînou, K., Doucet, J.L., Doust, S.F., Fortunel, C., Haase, J., Holl, K., Jactel, H., Li, X., Kitajima, K., Koricheva, J., Martínez-Garza, C., Messier, C., Paquette, A., Piotto, D., Poorter, L., Posada, J., Potvin, C., Raino, K., Russo, S.E., Ruiz-Jaen, M.C., Scherer-Lorenzen, M., Webb, C.T., Wright, S., Zahawi, R. & Hector, A. (2014) Globally, functional traits are poor predictors of juvenile tree growth. Ecology Letters.
Pereira, M.F. & Trigo, J.R. (2013) Ants have a negative rather than a positive effect on extrafloral nectaried Crotalaria pallida performance. Acta Oecologica, 51, 49–53.
Pinjuv, G., Mason, E.G. & Watt, M. (2006) Quantitative validation and comparison of a range of forest growth model types. Forest Ecology and Management, 236, 37–46.
Poorter, H. & van der Werf, A. (1998) Is inherent variation in RGR determined by LAR at low irradiance and by NAR at high irradiance? A review of herbaceous species. Inherent variation in plant growth: Physiological mechanisms and ecological consequences. (eds H. Lambers, H. Poorter & M. VanVuuren pp. 309–336. Backhuys Publishers, Leiden.
Poorter, H., Niklas, K.J., Reich, P.B., Oleksyn, J., Poot, P. & Mommer, L. (2012a) Biomass allocation to leaves, stems and roots: meta‐analyses of interspecific variation and environmental control. New Phytologist, 193, 30–50.

116
Poorter, L. & Bongers, F. (2006) Leaf traits are good predictors of plant performance across 53 rain forest species. 87, 1733–1743.
Poorter, L., Lianes, E., Moreno-de las Heras, M. & Zavala, M.A. (2012b) Architecture of Iberian canopy tree species in relation to wood density, shade tolerance and climate. Plant Ecology, 213, 707–722.
Poorter, L., Wright, S.J., Paz, H., Ackerly, D.D., Condit, R., Ibarra-Manríquez, G., Harms, K.E., Licona, J.C., Martínez-Ramos, M., Mazer, S.J., Muller-Landau, H.C., Peña-Claros, M., Webb, C.O. & Wright, I.J. (2008) Are functional traits good predictors of demographic rates? Evidence from five Neotropical forests. 89, 1908–1920.
Quijas, S., Jackson, L.E., Maass, M., Schmid, B., Raffaelli, D. & Balvanera, P. (2012) Plant diversity and generation of ecosystem services at the landscape scale: expert knowledge assessment. Journal of Applied Ecology, 49, 929–940.
R Core Team. (2014) R: a language and environment for statistical computing. Vienna, Austria. URL http://www.r-project.org/ [accessed 10 April 2014]
Rao, C. (1982) Diversity and dissimilarity coefficients: a unified approach. Theoretical Population Biology, 21, 24–43.
Roberts, D.W. (1986) Ordination on the basis of fuzzy set theory. Vegetatio, 66, 123–131. Roscher, C., Schumacher, J., Baade, J., Wilcke, W., Gleixner, G., Weisser, W.W., Schmid, B.
& Schulze, E.-D. (2004) The role of biodiversity for element cycling and trophic interactions: an experimental approach in a grassland community. Basic and Applied Ecology, 5, 107–121.
Roscher, C., Schumacher, J., Gubsch, M., Lipowsky, A., Weigelt, A., Buchmann, N., Schmid, B. & Schulze, E.-D. (2012) Using plant functional traits to explain diversity-productivity relationships. PLOS ONE, 7, e36760.
Rüger, N., Wirth, C., Wright, S.J. & Condit, R. (2012) Functional traits explain light and size response of growth rates in tropical tree species. Ecology, 93, 2626–2636.
Sandel, B. & Svenning, J.-C. (2013) Human impacts drive a global topographic signature in tree cover. Nature Communications, 4.
Santiago, L.S., Goldstein, G., Meinzer, F.C., Fisher, J.B., Machado, K., Woodruff, D. & Jones, T. (2004) Leaf photosynthetic traits scale with hydraulic conductivity and wood density in Panamanian forest canopy trees. Oecologia, 140.
Saremi, H., Kumar, L., Turner, R. & Stone, C. (2014) Airborne LiDAR derived canopy height model reveals a significant difference in radiata pine (Pinus radiata D. Don) heights based on slope and aspect of sites. Trees-Structure and Function, 28, 733–744.
Scheiter, S., Langan, L. & Higgins, S.I. (2013) Next-generation dynamic global vegetation models: learning from community ecology. New Phytologist, 198, 957–969.
Scherer-Lorenzen, M. (2013) The functional role of biodiversity in the context of global change. Forests and global change (eds D.A. Coomes, D. Burslem & W.D. Simonson) pp. 195–238. Cambrige University Press.
Shary, P.A., Sharaya, L.S. & Mitusov, A.V. (2002) Fundamental quantitative methods of land surface analysis. Geoderma, 107, 1–32.
Snedecor, G.W. & Cochran, W.G. (1989) Statistical Methods. Iowa State University Press, Ames, Iowa.
Spasojevic, M.J. & Suding, K.N. (2012) Inferring community assembly mechanisms from functional diversity patterns: the importance of multiple assembly processes. Journal of Ecology, 100, 652–661.
Steege, ter, H. (2003) Long-Term Changes in Tropical Tree Diversity. Studies From the Guiana Shield, Africa, Borneo and Melanesia. Tropenbos International, Wageningen.

117
Unger, M., Homeier, J. & Leuschner, C. (2012) Effects of soil chemistry on tropical forest biomass and productivity at different elevations in the equatorial Andes. Oecologia, 170, 263–274.
Villéger, S., Mason, N.W.H. & Mouillot, D. (2008) New multidimensional functional diversity indices for a multifaceted framework in functional ecology. Ecology, 89, 2290–2301.
Warren, R.J., II. (2010) An experimental test of well‐described vegetation patterns across slope aspects using woodland herb transplants and manipulated abiotic drivers. New Phytologist, 185, 1038–1049.
Wright, I.J., Reich, P.B., Westoby, M., Ackerly, D.D., Baruch, Z., Bongers, F., Cavender-Bares, J., Chapin, T., Cornelissen, J.H.C., Diemer, M., Flexas, J., Garnier, E., Groom, P.K., Gulias, J., Hikosaka, K., Lamont, B.B., Lee, T., Lee, W., Lusk, C., Midgley, J.J., Navas, M.-L., Niinemets, Ü., Oleksyn, J., Osada, N., Poorter, H., Poot, P., Prior, L., Pyankov, V.I., Roumet, C., Thomas, S.C., Tjoelker, M.G., Veneklaas, E.J. & Villar, R. (2004) The worldwide leaf economics spectrum. Nature, 428, 821–827.
Wright, S.J., Kitajima, K., Kraft, N.J.B., Reich, P.B., Wright, I.J., Bunker, D.E., Condit, R., Dalling, J.W., Davies, S.J., Díaz, S., Engelbrecht, B.M.J., Harms, K.E., Hubbell, S.P., Marks, C.O., Ruiz-Jaen, M.C., Salvador, C.M. & Zanne, A.E. (2010) Functional traits and the growth-mortality trade-off in tropical trees. Ecology, 91, 3664–3674.
Yang, J., Hu, Y. & Bu, R. (2009) Relationship between Soil Productivity and Tree Volume in Primeval Forest Ecosystems in Northeastern China. Forest Science, 55, 335–342.
Yang, X., Bauhus, J., Both, S., Fang, T., Härdtle, W., Kröber, W., Ma, K., Nadrowski, K., Pei, K., Scherer-Lorenzen, M., Scholten, T., Seidler, G., Schmid, B., Oheimb, G. & Bruelheide, H. (2013) Establishment success in a forest biodiversity and ecosystem functioning experiment in subtropical China (BEF-China). European Journal of Forest Research, 132, 593–606.
Zevenbergen, L.W. & Thorne, C.R. (1987) Quantitative analysis of land surface topography. Earth Surface Processes and Landforms, 12, 47–56.
Zhou, G., Peng, C., Li, Y., Liu, S., Zhang, Q., Tang, X., Liu, J., Yan, J., Zhang, D. & Chu, G. (2013) A climate change-induced threat to the ecological resilience of a subtropical monsoon evergreen broad-leaved forest in Southern China. Global Change Biology, 19, 1197–1210.
Zhou, G., Wei, X., Wu, Y., Liu, S., Huang, Y., Yan, J., Zhang, D., Zhang, Q., Liu, J., Meng, Z., Wang, C., Chu, G., Liu, S., Tang, X. & Liu, X. (2011) Quantifying the hydrological responses to climate change in an intact forested small watershed in Southern China. Global Change Biology, 17, 3736–3746.

118

119
Chapter 6
6.1 Discussion
In a nutshell, the four research papers that make up this thesis introduced new parameters for
stomatal control, increased the knowledge on xylem vulnerability and revealed new
morphological proxies for physiological leaf traits. In addition, it successfully employed a
framework to predict tree growth from plant functional traits at the plot level.
The new findings resulting from this thesis are added to the conceptual view of Figure 1 in the
Introduction forming Figure 2.
Figure 2
Recapitulation of the conceptual framework in the Introduction. The main results of the four papers are added to specify the hypothesized relationships.
1 Some but not all parameters of stomatal control were affected by the LES.
2 Xylem hydraulics are linked to the LES but not to stomatal control.
3 Leaf microscopy traits predict leaf physiology, however leaf habit had the strongest impact.
4 CWM and FD of plant functional traits have much higher influence on productivity than environment.

120
6.1.1 Stomatal conductance regulation
The method of incorporating several daily courses of stomatal conductance (gS)
measurements into one analysis by plotting gS versus vapour pressure deficit (vpd) has proved
to be a feasible approach. The systematic setting of the experiment and a standardized
measurement protocol allowed to control for a large amount of confounding influences on gS.
Referring to the first hypothesis proposed in section 1.5.2 of the Introduction, this thesis could
partly confirm the assumption that parameters of gS are linked to traits described by the leaf
economics spectrum (LES) (Wright et al. 2004). Mean gS increased with leaf nitrogen
concentration and decreased with the leaf nitrogen-to-carbon ratio whereas vapour pressure
deficit (vpd) at the maximum modelled stomatal conductance decreased with SLA. However,
maximum gS and vpd at maximum gS were not related to any leaf traits.
Interestingly, traits not represented in the LES were significantly linked to parameters of gS,
too. Specifically stomata size decreased with vpd at the maximum modelled conductance,
whereas stomata density decreased with the vpd at the point of inflection of the gS – vpd curve
and vein density increased with the maximum of modelled gS. Mechanistically it should be
expected that stomatal traits are related to parameters of stomatal control; however, different
authors report different directions of impact. Most publications describe a positive link
between maximum gS and stomata size and stomata density (Hetherington and Woodward
2003; Juhrbandt et al. 2004; Franks and Casson 2014). Conversely, recent research suggests a
negative relationship of maximum gS to stomata size or stomata density (Drake et al. 2013;
Raven 2014). In general, larger stomata size trades off with lower stomata densities, which in
consequence leads to delayed increase in gS under non-optimal conditions (Aasamaa et al.
2001; Lawson et al. 2010). All these studies outline the critical role of the temporal dimension
(Drake et al. 2013). The complexity of the regulatory influences at different points in time and
their scale-dependency may explain the inconclusive outcome of studies that attempt to assess
stomatal regulation from different perspectives (Franks et al. 2009; Lawson and Blatt 2014).

121
Against expectation, there was no difference in parameters of gS between leaf habits, although
the results from the principal component analysis indicated divergent strategies in gS
regulation. The reason behind might be that in the BEF-China experiment each species set in
both groups of leaf habit type used a wide range of physiological strategies that were largely
overlapping with regard to gS regulation. This assumption is supported by the fact that the
total range of maximum gS values across all species was the tenfold of the numerical
difference between the mean of maximum gS values within each type of leaf habit, illustrating
the clear overlap in maximum gS values.
6.1.2 Xylem hydraulics
Specific xylem hydraulic conductivity and cavitation sensitivity were positively related to leaf
nitrogen concentration and leaf area and, in turn, negatively related to the leaf carbon-to-
nitrogen ratio, all traits representing the LES. Therefore, leaf area, leaf nitrogen concentration
and leaf carbon-to-nitrogen ratio may serve as a proxy for xylem hydraulics in screening
studies across a large set of species. The next step should now be to validate the encountered
relationships between leaf traits and physiology over large geographic scales by using
worldwide trait databases. In a comparable approach of relating leaf physiology to leaf traits
globally, the first study using data from the TRY database (Kattge et al. 2011) found the
maximum rate of carboxylation to be positively related to leaf nitrogen content (Kattge et al.
2011).
As expected, species with evergreen leaf habit displayed lower values of specific xylem
hydraulic conductivity and lower Ψ50 values compared to species of deciduous leaf habit.
These results are in contrast to those obtained by many preceding studies that did not find any
evidence of lower cavitation sensitivities in evergreen species, although these studies had
postulated such a relationship (Nardini and Salleo 2000; Brodribb et al. 2003; Markesteijn et
al. 2011). Similarly, in a global meta-analysis, Maherali et al. (2004) could not find any
differences in cavitation sensitivities between leaf habit types. One reason for this outcome,
which is in contrast to the results of this study, was that the species set was not balanced with
regard to leaf habit and climate type since Maherali et al. (2004) compared evergreen species
from the tropics with temperate summergreen species. Maherali et al. (2004) concluded that
future studies should compare tree species differing in leaf habit but originating from the
same climate type. The results of this thesis fulfil this goal.

122
In contrast to traits captured by the LES, no parameter of gS was linked to specific xylem
hydraulic conductivity or to cavitation sensitivity. Referring back to the second hypothesis,
stating that xylem hydraulics is related to traits described by the LES, on the one hand, and to
parameters of gS, on the other hand, the results confirmed only the former hypothesis (see
Figure 2). In consequence, the initial assumption that high sensitivity to cavitation may be
related to fast and precise gS regulation had to be rejected.
This outcome is unexpected since mechanistically trees have to down-regulate gS in order to
prevent xylem cavitation (Jones and Sutherland 1991). In addition, some authors report on
possible feedback-mechanisms of xylem hydraulics that constrain maximum gS. These
mechanisms are reflected in the way stomata sense and then prevent xylem cavitation under
extreme conditions and thus under high cavitation risk (Nardini and Salleo 2000).
Regarding the specific set of tree species in the BEF-China experiment, it might be assumed
that gS regulation and xylem hydraulics have evolved under selection pressures acting at
different time scales: gS regulation being mainly affected by diurnal characteristics (Vialet-
Chabrand et al. 2013) whereas xylem hydraulics being mainly affected by seasonal droughts
(Markesteijn et al. 2011; Choat et al. 2012; Blackman et al. 2014).
Shedding more light on the diurnal characteristics of the link between xylem hydraulics and
gS regulation may be achieved by considering specific hydraulic conductance, i.e. hydraulic
conductance to sustained leaf area (Bond and Kavanagh 1999; Sack et al. 2002; Pivovaroff et
al. 2014). Additional sap flow measurements (Cermák et al. 2004; Clausnitzer et al. 2011;
Reyes Acosta and Lubczynski 2014) and acoustic detection of xylem cavitation events
(Jackson and Grace 1996; Johnson et al. 2012; Ponomarenko et al. 2014) may detect hidden
features in seasonal characteristics of the link between xylem hydraulics and gS regulation,
since these techniques enable data collection over an extended period of time. The idea to
incorporate further trait complexes into a general plant functional trait framework has resulted
in a world-wide “fast-slow plant economics spectrum” (Reich 2014). Peter Reich suggests
expanding the concept of economic traits such as the LES into two additional dimensions:
first - from leaves over to stems and roots, and second - from nutrient use over to carbon and
water use. The present thesis has undergone the first steps within this framework by
incorporating water relation traits such as gS regulation and by incorporating stem traits such
as specific xylem hydraulic conductivity and cavitation sensitivity.

123
6.1.3 Leaf microscopy traits
The cell density of the spongy parenchyma and the ratio of palisade to spongy mesophyll
thickness were the most important microscopy leaf traits that predicted physiological
parameters of xylem hydraulics and gS regulation. Accordingly, the thesis fully confirmed the
third hypothesis that microscopy leaf traits are connected to gS regulation and xylem
hydraulics (see Figure 2).
Leaf thickness and all other structurally thickness-related traits differed between leaf habits.
Strong differences between evergreen and deciduous leaf habits may be due to the longevity
and the nutrient use strategy: leaf longevity is believed to be shorter when initial resource
investment per leaf is low and the decrease in the initial net photosynthesis rate is high
(Kikuzawa 1991). The fact that even leaf microscopy traits were strongly differentiated by
leaf habit underlines the dominant influence of leaf duration strategy on several aspects of leaf
physiology (Larcher 2003; Lambers et al. 2008). However, literature analysing physiological
functionality of internal leaf structure in cross-species studies is scarce, and not all
relationships have been understood so far (Grossoni et al. 1998; Oguchi et al. 2005; Niinemets
et al. 2006). Accordingly, not for all microscopy leaf traits and physiological parameters a
simple mechanistic explanation could have been found. For example, the link between fitted
absolute maximum gS and the structures of the epicuticular waxes on the adaxial side of the
leaves was only weak.
Since the leaf layer-related parameters predicted leaf physiology well, further research on
these structures may be rewarding. Nobel (1980) introduced the ratio of mesophyll surface
area per unit leaf area (AMES/A) as an informative anatomical parameter and proposed to
investigate the changes in water use efficiency which are expected to vary with this ratio. The
author discusses the challenges and expected relationships between internal leaf anatomy and
leaf physiology and concludes that trade-offs determine the final leaf structure. These trade-
offs will include maximizing internal mesophyll surface in order to optimize gas exchange per
unit leaf area (Smith and Nobel 1977) versus maximizing cell density and layer number in
order to optimize photosynthesis reaction output per unit leaf mass (Mediavilla et al. 2001). A
further study with more focus on internal leaf anatomical details such as the parameter
AMES/A via an in-depth analysis of scanning electron microscope images like those produced
for the third paper, is therefore suggested of this thesis.
In order to further investigate the link between leaf internal structure and water related leaf
physiology (Warren and Adams 2006), cross-species studies should analyse specific details of
124
the venation architecture such as the mean luminal area of the largest xylem vessels, the area
of the midrib xylem cross section or the area of lateral ribs per unit length of leaf cross section
(Aasamaa et al. 2005) and relate these to leaf hydraulic conductance (Flexas et al. 2013b) and
leaf water potential (Nardini et al. 2012).
6.1.4 Biodiversity, traits & ecosystem functioning
Following the framework proposed by Diaz et al. (2007) to predict ecosystem functioning,
trait values aggregated in community weighted mean (CWM) values explained most of the
variation in tree growth of the forest plots; functional diversity (FD) scored medium impact
whereas environment, in contrast to expectation, had only very limited impact. With 4% of
explained variance in tree crown diameter increment, environment had only minor influence
on tree growth. In turn, CWM and FD explained 42% and 31% respectively, with a share of
21% of jointly explained variance.
With respect to the fourth hypothesis, the first part of the hypothesis stating that single
variables out of environment, CWM and FD explain tree growth was confirmed. However,
the second part of the hypothesis claiming that environmental factors exert dominant
influence compared to CWM and FD has to be rejected (See Figure 2).
At present, most of the current BEF research has been done on sets of known traits in
grassland experiments (Zavaleta et al. 2010; Petersen et al. 2012; Roscher et al. 2014). This
thesis could show that further traits describing gS regulation, xylem hydraulics and leaf
anatomy increase the statistical power in predicting ecosystem functioning from community
features. So far, the impact of environment, of CWM and of FD have not been analysed in
combination in tree BEF experiments (Healy et al. 2008; Hector et al. 2011). This thesis is a
first attempt of closing this gap. The results point out plant functional traits of particular
importance in the BEF research and, in general, underline the indispensable role of
biodiversity for ecosystem functioning.
The CWM trait with the highest impact on tree growth in the BEF-China experiment was leaf
toughness. The tenderer the leaves were, the higher was the mean crown increment growth
per year and per plot. This phenomenon may be due to various reasons: for example,
evergreen tree species tend to have tougher leaves and grow more slowly than deciduous tree
species (Aerts 1995). However, independently from leaf habit, the more resources a plant
invests in leaf toughness, the less resources are available for overall plant growth. A species
that is able to grow fast without sacrificing too many resources on leaf toughness may
increase the resource use efficiency of a community. According to the Production Ecology

125
Equation (Monteith and Moss 1977; Binkley et al. 2004; Richards et al. 2010) introduced in
section 1.4.3
where p is biomass production, r is resource supply, f is fraction of resources captured and e is
the efficiency of resource use (p & r being area normalized), this will lead to an increase in e.
A high value in FD may describe an increased ability of a plant community to capture
resources. The presence of extrafloral nectaries and the number of palisade layers were the
traits where FD had the highest predictive power for tree crown diameter increment on the
experimental plots. Thus, combining species with and without extrafloral nectaries in a
community might decrease the degree of herbivory. Similarly, combining species with
different number of palisade layers might increase the amount of light captured per unit area
in the community. In consequence, the total amount of captured resources will be higher,
which in turn will result in an increased factor f in the Production Ecology Equation.
CWM and FD could explain 32% and 41% variation in tree crown growth. This is a hint that
CWM and FD indeed contribute to a significant amount to f & e in the BEF-China
experimental plots (Bruelheide et al. 2014). This is particularly true since further effects
acting on f & e such as stem density, canopy layer structure and successional stage stayed
constant in all the experimental plots in the BEF-China experiment.
The remaining factor r describes the environmental settings a community has to cope with.
Eventually, biotic effects in the experiment will also lead to a variation in r in a way that plant
communities will alter their own environment such as soil conditions or microclimate. The
future development of the environmental conditions on the experimental plots of BEF-China
will show whether the plant species assemblages are able to change their abiotic environment
and how they do it.
High productivity in forests can be the result of optimum resource supply (Herbert and
Fownes 1999; Unger et al. 2012). In addition, high productivity may result from communities
containing either highly productive species or highly diverse species (Morin et al. 2011;
Zhang et al. 2012). To detect the impact of the latter statistically, communities have to be
compared that both vary in CWM and FD values (Binkley et al. 2004). However, a clear
segregation of effects resulting from CWM versus effects resulting from FD should be done
with care since CWM and FD are mathematically linked (Dias et al. 2013).
p = r ∗ f ∗e

126
The abiotic environment has been thought to be a main driver of ecosystem functioning;
however, recent research has shown that the impact of functional diversity may reach similar
magnitude of impact compared to species-specific properties and environment (Tilman et al.
2012). The results of the fourth study imply that functional diversity has higher predictive
power than abiotic environment, and it is expected that this relation will increase with time
and eventually may even surpass effects of species-specific properties.
The regression framework (Díaz et al. 2007) applied in the fourth paper turned out to be a
reliable method for predicting tree growth, even though it related trait values, environment
and mean crown growth increment only by model selection algorithms. In contrast, relating
these parameters through a mechanistic approach, for example, by choosing specific traits
which are known to be related to specific ecosystem functions, may offer an alternative
approach that may lead from correlative to causal relationships of biodiversity and ecosystem
functioning (Grace et al. 2014).
6.1.5 Conclusion
Figure 2 sums up the results of the four manuscripts of this thesis. Paper 1 introduced a
method to calculate new parameters of gS regulation and revealed links between the LES and
gS regulation. Paper 2 extended the functional perspective from gS regulation to xylem
physiology and reported links between xylem hydraulics and the LES but not to gS regulation.
Paper 3 added several leaf internal structural traits to the analysis and showed relationships
between these and gS regulation and xylem hydraulics, respectively. And finally, Paper 4
merged all traits in CWM and FD plot values together with environmental parameters and
successfully predicted tree crown increment.
Limitations of the results
One limitation of this work is that all trait measurements were done on juvenile tree
individuals. Thus, the transfer of the findings to mature systems should be made with care
keeping in mind that some trait relations may be altered in adult individuals. However, many
traits are known not to change between juvenile and adult phases dramatically but remain
conservative over the main life cycle episodes of a plant (Díaz et al. 2004; Perez-
Harguindeguy et al. 2013).

127
All trait values have been analysed from an interspecific perspective, ignoring intraspecific
trait variation which can reach considerable extent and can alter ecophysiological
relationships (Ackerly et al. 2000; Chown et al. 2004; Albert et al. 2010b; Albert et al. 2010a;
Bolnick et al. 2011; Baudis et al. 2014). In the future, the easy access, the established
infrastructure and the unique planting design of the BEF-China experiment may allow for
efficient investment of the high amounts of time and work necessary to generate the large
sample size and to assess intraspecific trait variability of its 40 broadleaved experimental tree
species.
Regarding the relationship between biodiversity and ecosystem functioning, only one property
of one function – tree crown growth as an aspect of productivity – was analysed. It is
expected that further ecosystem functions such as decomposition (Gessner et al. 2010),
nutrient cycling (Nielsen et al. 2011) and water cycling (Mace et al. 2012) may be related to
trait complexes different from those identified in this thesis as relevant for productivity. Many
further ecosystem functions are worth being analysed from a functional perspective: the
complete gas exchange process - by including CO2 physiology (Tomas et al. 2013; Flexas et
al. 2013a); photosynthetic capacity and regulation (Bauerle et al. 2012; Lawson and Blatt
2014; Flexas et al. 2014) and plant defence strategies against herbivores and pathogens
(Mithöfer and Boland 2012; Scala et al. 2013).
Outlook on future research
In future BEF studies, specific emphasis should be put on the selection of traits for the
assessment in order to optimize sampling efficiency and to avoid unwanted data redundancy.
The results from this thesis emphasize the importance of the LES traits; but suggest to test in
addition traits such as the palisade to spongy mesophyll thickness ratio, xylem cavitation
sensitivity and vpd at the maximum modelled stomatal conductance. The encountered
interrelationships between physiological trait complexes of gS regulation and xylem
hydraulics should be extended to further species from different biomes and ecosystems.
Additional traits such as the traits related to stomata regulation analysed in this thesis should
be incorporated into future functional diversity assessments.
Building on the knowledge gained in this work, future studies that will focus on the analysis
of ecosystem functioning will have an advantage: they will be able to choose relevant traits
basing on the mechanistic relationships to the target function rather than simply use
correlative regression frameworks with unwanted data redundancy. Concerning the study

128
presented in the fourth publication, functional diversity can be expected to have an increasing
impact on ecosystem productivity through time at the expense of influences from specific
species and environmental effects in the BEF-China experiment. Tilman et al. (2012) reported
results of eleven grassland experiments and showed that biodiversity loss entailed a decrease
in productivity of a magnitude comparable to changes in relevant non-diversity related
aspects. This thesis suggests that similar findings may be expected in the future from the
BEF-China experiment and other forest BEF experiments. To confirm these expectations, the
analyses conducted in the thesis should be repeated over time.

129
6.2 References
Aasamaa K, Niinemets U, Sober A (2005) Leaf hydraulic conductance in relation to anatomical and functional traits during Populus tremula leaf ontogeny. Tree Physiol 25:1409–1418.
Aasamaa K, Sõber A, Rahi M (2001) Leaf anatomical characteristics associated with shoot hydraulic conductance, stomatal conductance and stomatal sensitivity to changes of leaf water status in temperate deciduous trees. Aust J Plant Physiol 28:765–774.
Ackerly DD, Dudley SA, Sultan SE et al. (2000) The evolution of plant ecophysiological traits: recent advances and future directions. Bioscience 50:979–995.
Aerts R (1995) The advantages of being evergreen. Trends Ecol Evol 10:402–407. Albert CH, Thuiller W, Yoccoz NG et al. (2010a) A multi-trait approach reveals the structure
and the relative importance of intra- vs. interspecific variability in plant traits. Funct Ecol 24:1192–1201.
Albert CH, Thuiller W, Yoccoz NG et al. (2010b) Intraspecific functional variability: extent, structure and sources of variation. J Ecol 98:604–613.
Baudis M, Ellerbrock RH, Felsmann K et al. (2014) Intraspecific differences in responses to rainshelter-induced drought and competition of Fagus sylvatica L. across Germany. Forest Ecol Manag 330:283–293.
Bauerle WL, Oren R, Way DA et al. (2012) Photoperiodic regulation of the seasonal pattern of photosynthetic capacity and the implications for carbon cycling. PNAS 109:8612–8617.
Binkley D, Stape JL, Ryan MG (2004) Thinking about efficiency of resource use in forests. Forest Ecol Manag 193:5–16.
Blackman CJ, Gleason SM, Chang Y et al. (2014) Leaf hydraulic vulnerability to drought is linked to site water availability across a broad range of species and climates. Ann Bot-London 114:435–440.
Bolnick DI, Amarasekare P, Araújo MS et al. (2011) Why intraspecific trait variation matters in community ecology. Trends Ecol Evol 26:183–192.
Bond BJ, Kavanagh KL (1999) Stomatal behavior of four woody species in relation to leaf-specific hydraulic conductance and threshold water potential. Tree Physiol 19:503–510.
Brodribb TJ, Holbrook NM, Edwards E, Gutiérrez MRVA (2003) Relations between stomatal closure, leaf turgor and xylem vulnerability in eight tropical dry forest trees. Plant Cell Environ 26:443–450.
Bruelheide H, Nadrowski K, Assmann T et al. (2014) Designing forest biodiversity experiments: general considerations illustrated by a new large experiment in subtropical China. Methods Ecol Evol 5:74–89.
Cermák J, Kucera J, Nadezhdina N (2004) Sap flow measurements with some thermodynamic methods, flow integration within trees and scaling up from sample trees to entire forest stands. Trees 18:529–546.
Choat B, Jansen S, Brodribb TJ et al. (2012) Global convergence in the vulnerability of forests to drought. Nature 491:752–755.
Chown SL, Gaston KJ, Robinson D (2004) Macrophysiology: large-scale patterns in physiological traits and their ecological implications. Funct Ecol 18:159–167.
Clausnitzer F, Köstner B, Schwärzel K, Bernhofer C (2011) Relationships between canopy transpiration, atmospheric conditions and soil water availability—Analyses of long-term sap-flow measurements in an old Norway spruce forest at the Ore Mountains/Germany. Agr Forest Meteorol 151:1023–1034.

130
Dias ATC, Berg MP, Bello F et al. (2013) An experimental framework to identify community functional components driving ecosystem processes and services delivery. J Ecol 101:29–37.
Díaz S, Hodgson JG, Thompson K et al. (2004) The plant traits that drive ecosystems: evidence from three continents. J Veg Sci 15:295–304.
Díaz S, Lavorel S, de Bello F et al. (2007) Incorporating plant functional diversity effects in ecosystem service assessments. PNAS 104:20684–20689.
Drake PL, Froend RH, Franks PJ (2013) Smaller, faster stomata: scaling of stomatal size, rate of response, and stomatal conductance. J Exp Bot 64:495–505.
Flexas J, Carriqui M, Coopman RE et al. (2014) Stomatal and mesophyll conductances to CO2 in different plant groups: underrated factors for predicting leaf photosynthesis responses to climate change? Plant Sci 226:41–48.
Flexas J, Niinemets Ü, Gallé A et al. (2013a) Diffusional conductances to CO2 as a target for increasing photosynthesis and photosynthetic water-use efficiency. Photosyn Res 117:45–59.
Flexas J, Scoffoni C, Gago J, Sack L (2013b) Leaf mesophyll conductance and leaf hydraulic conductance: an introduction to their measurement and coordination. J Exp Bot 64:3965–3981.
Franks PJ, Casson S (2014) Connecting stomatal development and physiology. New Phytol 201:1079–1082.
Franks PJ, Drake PL, Beerling DJ (2009) Plasticity in maximum stomatal conductance constrained by negative correlation between stomatal size and density: an analysis using Eucalyptus globulus. Plant Cell Environ 32:1737–1748.
Gessner MO, Swan CM, Dang CK et al. (2010) Diversity meets decomposition. Trends Ecol Evol 25:372–380.
Grace JB, Adler PB, Stanley Harpole W et al. (2014) Causal networks clarify productivity–richness interrelations, bivariate plots do not. Funct Ecol 28:787–798.
Grossoni P, Bussotti F, Tani C et al. (1998) Morpho-anatomical alterations in leaves of Gagus vatica L. and Quercus ilex L. in different environmental stress condition. Chemosphere 36:919–924.
Healy C, Gotelli NJ, Potvin C (2008) Partitioning the effects of biodiversity and environmental heterogeneity for productivity and mortality in a tropical tree plantation. J Ecol 96:903–913.
Hector A, Philipson C, Saner P et al. (2011) The Sabah Biodiversity Experiment: a long-term test of the role of tree diversity in restoring tropical forest structure and functioning. Philos T Roy Soc B 366:3303–3315.
Herbert DA, Fownes JH (1999) Forest productivity and efficiency of resource use across a chronosequence of tropical montane soils. Ecosystems 2:242–254.
Hetherington A, Woodward F (2003) The role of stomata in sensing and driving environmental change. Nature 424:901–908.
Jackson GE, Grace J (1996) Field measurements of xylem cavitation: are acoustic emissions useful? J Exp Bot 47:1643–1650.
Johnson DM, McCulloh KA, Woodruff DR, Meinzer FC (2012) Evidence for xylem embolism as a primary factor in dehydration-induced declines in leaf hydraulic conductance. Plant Cell Environ 35:760–769.
Jones HG, Sutherland RA (1991) Stomatal control of xylem embolism. Plant Cell Environ 14:607–612.
Juhrbandt J, Leuschner C, Hölscher D (2004) The relationship between maximal stomatal conductance and leaf traits in eight Southeast Asian early successional tree species. Forest Ecol Manag 202:245–256.

131
Kattge J, Díaz S, Lavorel S et al. (2011) TRY – a global database of plant traits. Global Change Biol 17:2905–2935.
Kikuzawa K (1991) A cost-benefit analysis of leaf habit and leaf longevity of trees and their geographical pattern. Am Nat 138:1250–1263.
Lambers H, Chapin FS III, Pons T (2008) Plant physiological ecology. Springer, New York, Dordrecht, Heidelberg, London. 623 p.
Larcher W (2003) Physiological plant ecology. Springer, Berlin, Heidelberg. 453 p. Lawson T, Blatt MR (2014) Stomatal size, speed, and responsiveness impact on
photosynthesis and water use efficiency. Plant Physiol 164:1556–1570. Lawson T, Caemmerer S, Baroli I (2010) Photosynthesis and stomatal Behaviour. In: Lüttge
U et al. (Ed) Progress in botany, Springer, Berlin, Heidelberg. pp 265-289. Mace GM, Norris K, Fitter AH (2012) Biodiversity and ecosystem services: a multilayered
relationship. Trends Ecol Evol 27:19–26. Maherali H, Pockman WT, Jackson RB (2004) Adaptive variation in the vulnerability of
woody plants to xylem cavitation. Ecology 85:2184–2199. Markesteijn L, Poorter L, Paz H et al. (2011) Ecological differentiation in xylem cavitation
resistance is associated with stem and leaf structural traits. Plant Cell Environ 34:137–148.
Mediavilla S, Escudero A, Heilmeier H (2001) Internal leaf anatomy and photosynthetic resource-use efficiency: interspecific and intraspecific comparisons. Tree Physiol 21:251–259.
Mithöfer A, Boland W (2012) Plant defense against herbivores: chemical aspects. Annu Rev Plant Biol 63:431–450.
Monteith JL, Moss CJ (1977) Climate and the efficiency of crop production in Britain. Philos T Roy Soc B 281:277–294.
Morin X, Fahse L, Scherer-Lorenzen M, Bugmann H (2011) Tree species richness promotes productivity in temperate forests through strong complementarity between species. Ecol Letters 14:1211–1219.
Nardini A, Pedà G, Rocca NL (2012) Trade-offs between leaf hydraulic capacity and drought vulnerability: morpho-anatomical bases, carbon costs and ecological consequences. New Phytol 196:788–798.
Nardini A, Salleo S (2000) Limitation of stomatal conductance by hydraulic traits: sensing or preventing xylem cavitation? Trees 15:14–24.
Nielsen UN, Ayres E, Wall DH, Bardgett RD (2011) Soil biodiversity and carbon cycling: a review and synthesis of studies examining diversity–function relationships. Eur J Soil Sci 62:105–116.
Niinemets ÜL, Cescatti A, Rodeghiero M, Tosens T (2006) Complex adjustments of photosynthetic potentials and internal diffusion conductance to current and previous light availabilities and leaf age in Mediterranean evergreen species Quercus ilex. Plant Cell Environ 29:1159–1178.
Nobel PS (1980) Leaf anatomy and water use efficiency. In: Turner NC, Kramer PJ (Ed) Adaptation of plants to water and high temperature stress. Wiley, Michigan. pp 43–55.
Oguchi R, Hikosaka K, Hirose T (2005) Leaf anatomy as a constraint for photosynthetic acclimation: differential responses in leaf anatomy to increasing growth irradiance among three deciduous trees. Plant Cell Environ 28:916–927.
Perez-Harguindeguy N, Díaz S, Garnier E et al. (2013) New handbook for standardised measurement of plant functional traits worldwide. Aust J Bot 61:167–234.

132
Petersen U, Wrage N, Köhler L et al. (2012) Manipulating the species composition of permanent grasslands—A new approach to biodiversity experiments. Basic Appl Ecol 13:1–9.
Pivovaroff AL, Sack L, Santiago LS (2014) Coordination of stem and leaf hydraulic conductance in Southern California shrubs: a test of the hydraulic segmentation hypothesis. New Phytol 203:842–850.
Ponomarenko A, Vincent O, Pietriga A et al. (2014) Ultrasonic emissions reveal individual cavitation bubbles in water-stressed wood. J R Soc Interface in Press
Raven JA (2014) Speedy small stomata? J Exp Bot in Press Reich PB (2014) The world-wide “fast–slow” plant economics spectrum: a traits manifesto. J
Ecol 102:275–301. Reyes Acosta JL, Lubczynski MW (2014) Optimization of dry-season sap flow measurements
in an oak semi-arid open woodland in Spain. Ecohydrol 7:258–277. Richards AE, Forrester DI, Bauhus J, Scherer-Lorenzen M (2010) The influence of mixed tree
plantations on the nutrition of individual species: a review. Tree Physiol 30:1192–1208. Roscher C, Gerighausen U, Schmid B, Schulze E-D (2014) Plant diversity and community
history shift colonization success from early- to mid-successional species. J Plant Ecol in Press
Sack L, Melcher PJ, Zwieniecki MA, Holbrook NM (2002) The hydraulic conductance of the angiosperm leaf lamina: a comparison of three measurement methods. J Exp Bot 53:2177–2184.
Scala A, Allmann S, Mirabella R et al. (2013) Green leaf volatiles: a plant’s multifunctional weapon against herbivores and pathogens. Int J Mol Sci 14:17781–17811.
Smith WK, Nobel PS (1977) Influences of seasonal changes in leaf morphology on water-use efficiency for three desert broadleaf shrubs. Ecology 58:1033.
Tilman D, Reich PB, Isbell F (2012) Biodiversity impacts ecosystem productivity as much as resources, disturbance, or herbivory. PNAS 109:10394–10397.
Tomas M, Flexas J, Copolovici L, Puller P et al. (2013) Importance of leaf anatomy in determining mesophyll diffusion conductance to CO2 across species: quantitative limitations and scaling up by models. J Exp Bot 64:2269–2281.
Unger M, Homeier J, Leuschner C (2012) Effects of soil chemistry on tropical forest biomass and productivity at different elevations in the equatorial Andes. Oecologia 170:263–274.
Vialet-Chabrand S, Dreyer E, Brendel O (2013) Performance of a new dynamic model for predicting diurnal time courses of stomatal conductance at the leaf level. Plant Cell Environ 36:1529–1546.
Warren CR, Adams MA (2006) Internal conductance does not scale with photosynthetic capacity: implications for carbon isotope discrimination and the economics of water and nitrogen use in photosynthesis. Plant Cell Environ 29:192–201.
Wright IJ, Reich PB, Westoby M et al. (2004) The worldwide leaf economics spectrum. Nature 428:821–827.
Zavaleta ES, Pasari JR, Hulvey KB, Tilman GD (2010) Sustaining multiple ecosystem functions in grassland communities requires higher biodiversity. PNAS 107:1443–1446.
Zhang Y, Chen HYH, Reich PB (2012) Forest productivity increases with evenness, species richness and trait variation: a global meta-analysis. J Ecol 100:742–749.

133

134


144
Explanations to the illustration pages
1 Species names of the 40 broadleaved tree species of BEF-China
2 Leaf photographs taken for measurements of specific leaf area
3 Stained leaf scans taken for vein trait analyses
4 Stomatal conductance-vapor pressure deficit curves
5 Xylem sensitivity to cavitation curves
6 Images of wood cross sections, taken for the assessment of wood microscopy traits
7 Microscope images of leaf surfaces, taken for the assessment of stomatal traits
8 Scanning electron microscope images, taken for the analysis of leaf surface microstructures
9 Leaf cross sections, taken to investigate leaf anatomy

145
6.3 Thanks
Nicht nur für die Betreuung der vorliegenden Arbeit möchte ich Helge Bruelheide danken. Er
war auch ein großartiger Mentor, der mich fit gemacht hat für alles was die Wissenschaft
ausmacht. Großen Anteil haben aber auch alle, die mich bei meinen umfangreichen Feld- und
Laborarbeiten unterstützt haben: Heike Heklau, Merten Ehmig, Isa Plath, Katja Grotius und
alle Mitdoktoranden im BEF-China Projekt. Alle meine Koautoren haben mich produktiv bei
den Manuskripten unterstützt, Danke dafür.
Dem gesamten Fachbereich Geobotanik danke ich für die positive und motivierende
Arbeitsatmosphäre am Institut. Für das Korrekturlesen der Arbeit und für chinesische
Übersetzungshilfe bedanke ich mich bei Lydia Hantsch, Lotte Korell, Sylvia Haider und
Xiaojuan Liu.
Das Kinderzimmer hat mich in ganz besonderer Weise motiviert und unterstützt! Danke an
Maria Hofmann, Lydia Hantsch, Eva Breitschwerdt, Mathias Baudis und David Eichenberg!
Vielen lieben Dank auch an alle meine Freunde die mich auf meinem Weg zur Promotion
begleitet haben. Meine Familie und insbesondere meine Eltern und meine Geschwister haben
mir erst die Freiheit gegeben mich so ausführlich mit dieser Arbeit zu beschäftigen. Johanne,
wie schön dass wir das Projekt Promotion nun gemeinsam abschließen können.

146
6.4 Appendix
6.4.1 Curriculum vitae
Wenzel Kröber geb. 30.10.1982 in Halle (Saale)
PROMOTION
03/2010 – heute Martin-Luther-Universität Halle-Wittenberg, Halle (Saale) Doktorand im internationalen Biodiversity and Ecosystem Functioning BEF-China Projekt am Institut für Biologie, Fachbereich Geobotanik, Thema „Trait relations in subtropical tree species“
AUSBILDUNG
10/2004–02/2010 Martin-Luther-Universität Halle-Wittenberg, Halle (Saale) Diplomstudium der Biologie und Psychologie, Abschlussnote 1,1, Thema der Diplomarbeit: „Functional leaf trait diversity in subtropical Chinese forests“ Prüfungsfächer: Geobotanik, mol. Ökologie, Naturschutz, Psychologie
08/1995–04/2003 Elisabeth-Gymnasium, Halle (Saale), Abiturnote 1,5
BERUFLICHE ERFAHRUNG
04/2010–04/2014 Wissenschaftlicher Mitarbeiter, Martin-Luther-Universität Halle- Wittenberg,
! Lehrveranstaltungen (Seminare, Vorlesungen, Praktika) ! Betreuung mehrerer Bachelorarbeiten ! Entwicklung und Erprobung von Software zur Drohnensteuerung ! Einsatz von Drohnen zur Baumvermessung ! Umgang mit verschiedener Messtechnik zur Vermessung und ökologischer
Datenaufnahme: Differentielles GPS, Klimastationen, PAR- und Photosynthese Messungen, Porometrie etc.
08/2006–03/2010 Wissenschaftliche Hilfskraft, Martin-Luther-Universität Halle- Wittenberg
! Gründung und Leitung des Diplomandenseminars Geobotanik ! Biodiversitätsforschung ! Forschungsreisen nach China, Südafrika und in die Mongolei ! Molekularbiologische Arbeit im Labor: DNA-Extraktion, DNA-Sequenzierung,
Proteinanalyse
AUSZEICHNUNGEN UND STIPENDIEN
11/2010 Kurt-Mothes-Preisträger 2010, Martin-Luther-Universität Halle-Wittenberg, Halle (Saale) Forschungspreis des Halle Institute of Science and Technology für die beste Abschlussarbeit der Naturwissenschaftlichen Fakultät I
01/2008–06/2008 Stipendiat „Special student“, University of Stellenbosch, Stellenbosch, South Africa 06/1996 Preisträger Jugend Forscht, Magdeburg
Erster Preis Wettbewerb Sachsen-Anhalt, Projekthema “Entwicklung des hallischen Binnenhafen”

147
AUSLAND
China: Forschungsaufenthalte, Shanghai, Beijing, Xingangshan, Gutianshan 08/2012 – 11/2012, 04/2012, 08/2011 – 11/2011, 03/2011 – 05/2011, 08/2010 – 11/2010, 04/2010 – 05/2010, 02/2009 – 03/2009, 06/2008 – 09/2008, 08/2007 –09/2007, 06/2006 – 07/2006 Grönland Forschungskooperation Eberhard-Karls-Universität Tübingen, Illulisat 06/2011 – 07/2011 Mongolei Exkursion Georg-August-Universität Göttingen, Ulan Bator 06/2007 – 07/2007 Südafrika Exkursion University of Pretoria, Pretoria, Johannesburg 04/2007 – 05/2007 University of Stellenbosch, Stellenbosch, Cape Town, South Africa
Auslandssemester, Kurs Ökologie erfolgreich teilgenommen 01/2008 – 07/2008
Frankreich Lycée René Cassin, Mâcon, France Schüleraustausch, Première Scientifique (11. Klasse, naturwissenschaftlicher Zweig, inklusive Abiturprüfungen), erfolgreich absolviert 08/1999 – 07/2000
SPRACHEN
Deutsch: Muttersprache Englisch: verhandlungssicher Französisch: verhandlungssicher Chinesisch: Grundkenntnisse WEITERBILDUNGEN
2014 „Grundlagen der Personalführung“, Martin-Luther-Universität Halle- Wittenberg 2013 „Mikroökonomie für Fortgeschrittene“, Martin-Luther-Universität Halle-Wittenberg 2013 „Externes Rechnungswesen II“, Martin-Luther-Universität Halle- Wittenberg 2013 „Umweltökonomik“ , Martin-Luther-Universität Halle-Wittenberg 2013 „Unternehmerische Kompetenz“, Martin-Luther-Universität Halle- Wittenberg 2011 „Rhetorik für Lehrende“, Martin-Luther-Universität Halle-Wittenberg ENGAGEMENT UND INTERESSEN
04/2003–06/2004 Zivildienst (anschließend Anstellung) Nationalparkranger auf Föhr, Schutzstation Wattenmeer, Nationalpark Schleswig-Holsteinisches Wattenmeer
2002–2006 Wahlhelfer Europawahl 06/2004, Landtagswahl Sachsen-Anhalt 04/2002 und 03/2006 in Halle
Halle (Saale), den 5.12.2014
Wenzel Kröber

148
6.4.2 List of publications
Kröber W, Plath I, Heklau H, Bruelheide H (2014) Relating stomatal conductance to leaf functional traits. JOVE under review
Nadrowski K, Pietsch K, Baruffol M, Both S, Gutknecht J, Bruelheide H, Heklau H, Kahl A, Kahl T, Niklaus P, Kröber W, Liu XJ, Mi XC, Michalski S, von Oheimb G, Purschke O, Schmid B, Teng F, Welk E, Wirth C (2014): Tree species traits but not diversity mitigate stem breakage in a subtropical forest following a rare and extreme ice storm. PLOS ONE 9:e96022
Schuldt A, Assmann T, Bruelheide H, Durka W, Eichenberg D, Härdtle W, Kröber W, Michaliski S, Purschke O (2014) Functional and phylogenetic diversity of woody plants drive herbivory in a highly diverse forest. New Phytol 202:864–873
Eichenberg D, Ristok C, Kröber W, Bruelheide H. (2014) Plant polyphenols – implications of different sampling, storage and sample processing in biodiversity-ecosystem functioning experiments. Chem Ecol 30:676–692
Böhnke M, Kröber W, Welk E, Wirth C, Bruelheide H (2013) Maintenance of constant functional diversity during secondary succession of a subtropical forest in China. J Veg Sci 25:891–911
Yang X, Bauhus J, Both S, Fang T, Härdtle W, Kröber W, Ma K, Nadrowski K, Pei K, Scherer-Lorenzen M, Scholten T, Seidler G, Schmid B, von Oheimb G, Bruelheide H (2013) Establishment success in a forest biodiversity and ecosystem functioning experiment in subtropical China (BEF-China) Eur J Forest Res 132:593–606
Kröber W, Böhnke M, Welk E, Wirth C, Bruelheide H (2012). Leaf trait-environment relationships in a subtropical broadleaved forest in South-East China. PLOS ONE 7:e35742
Schuldt A, Bruelheide H, Durka W, Eichenberg D, Fischer M, Kröber W, Härdtle W, Ma K, Michalski S, Palm W-U, Schmid B, Welk E, Zhou HZ, Assmann T (2012) Plant traits affecting herbivory on tree recruits in highly diverse subtropical forests Ecol Letters 15: 732–739
Böhnke M, Kreißig N, Kröber W, Fang T, Bruelheide H (2012) Wood trait-environment relationships in a secondary forest succession in South-East China Trees 26:641–651
Lang AC, Härdtle W, Bruelheide H, Kröber W, Schröter M, von Wehrden H, von Oheimb G (2012) Horizontal, but not vertical canopy structure is related to stand functional diversity in a subtropical slope forest Ecol Res 27:181–189
Bruelheide H, Böhnke M, Both S, Fang T, Assmann T, Baruffol M, Bauhus J, Buscot F, Chen XY, Ding B-Y, Durka W, Erfmeier A, Fischer M, Geißler C, Guo D, Guo L-D, Härdtle W, He J-S, Hector A, Kröber W, Kühn P, Lang AC, Nadrowski K, Pei K, Scherer-Lorenzen M, Shi XZ, Scholten T, Schuldt A, Trogisch S, von Oheimb G, Welk E, Wirth C, Wu Y-T, Yang X, Zeng X, Zhang S, Zhou HZ, Ma K, Schmid B (2011) Community assembly during secondary forest succession in a Chinese subtropical forest Ecol Monogr 81:25–41

149
6.4.3 Eigenständigkeitserklärung
Hiermit erkläre ich, dass die Arbeit mit dem Titel „Stomatal control, xylem hydraulics and
leaf morphology in the 40 BEF-China tree species: Trait interrelationships, functional
diversity and tree growth prediction“ bisher weder bei der Naturwissenschaftlichen Fakultät I
Biowissenschaften der Martin-Luther-Universität Halle-Wittenberg noch einer anderen
wissenschaftlichen Einrichtung zum Zweck der Promotion vorgelegt wurde.
Ferner erkläre ich, dass ich die vorliegende Arbeit selbstständig und ohne fremde Hilfe
verfasst sowie keine anderen als die angegebenen Quellen und Hilfsmittel benutzt habe. Die
den Werken wörtlich oder inhaltlich entnommenen Stellen wurden als solche von mir
kenntlich gemacht.
Ich erkläre weiterhin, dass ich mich bisher noch nie um einen Doktorgrad beworben habe.
Halle (Saale), den 5.12.2014
Wenzel Kröber

“Poets and moralists, judging from our English trees and fruits, have thought that there existed
an inverse proportion between the size of the one and the other, so that their fall should be harmless to
man. Two of the most formidable fruits known, however, the Brazil Nut (Bertholletia) and the Durian,
grow on lofty trees, from which they both fall as soon as they are ripe, and often wound or kill those
who seek to obtain them. From this we may learn two things: first, not to draw conclusions from a
very partial view of nature; and secondly, that trees and fruits and all the varied productions of the
animal and vegetable kingdoms, have not been created solely for the use and convenience of man.”
A. R. Wallace (1856). From a letter to Sir William Jackson Hooker; printed in Volume 8 of Hooker's
Journal of Botany, 1856.