stockholm world water week session: hydroeconomic modeling in basins: practice, challenges and...
TRANSCRIPT

Stockholm World Water Week
Session: Hydroeconomic Modeling in Basins: Practice, Challenges and Rewards
August 22, 2011 1530 - 1845
Watershed Policy Analysis in the Rio Grande:Insights from Hydroeconomic Modeling
Frank A. WardNew Mexico State University USA
Ongoing Challenges in Many Basins
• Adaptation to droughts, floods, climate change
• Search for resilient water institutions where there are complex watershed processes and constraints
– Agronomic
– Hydrologic
– Meteorologic
– Economic
– Political
• Search for Just, Flexible, Open Water Sharing Agreements
• Science-informed policy that’s understandable
Road Map
• Describe Potential Benefits of HM• Graphics• Describe history of one river basin sharing debate
(Rio Grande Compact), resulting agreement• Describe principles for framing water sharing
debates. • Show how HEM’s can inform water sharing debates• Brief look at one HEM (Rio Grande)• Illustrate the use of HEM for policy analysis• Conclusions

A Role for Hydroeconomic Models?
• HM can provide data to inform debates on:– Adaptation to floods, drought, climate change
– Ways to share transboundary waters
– Irrigation water conservation subsidies
– New knowledge or method (e.g., evaporation, ET)
– Socially just, economically efficient, politically acceptable water infrastructure
– Effective development planning
– Cost effective Payment for Environmental Services
Search for Simple Graphics to inform complex watershed policy debates
• Watersheds are scientifically complex• Policy debates add complexity• Few simple graphics can show the choices
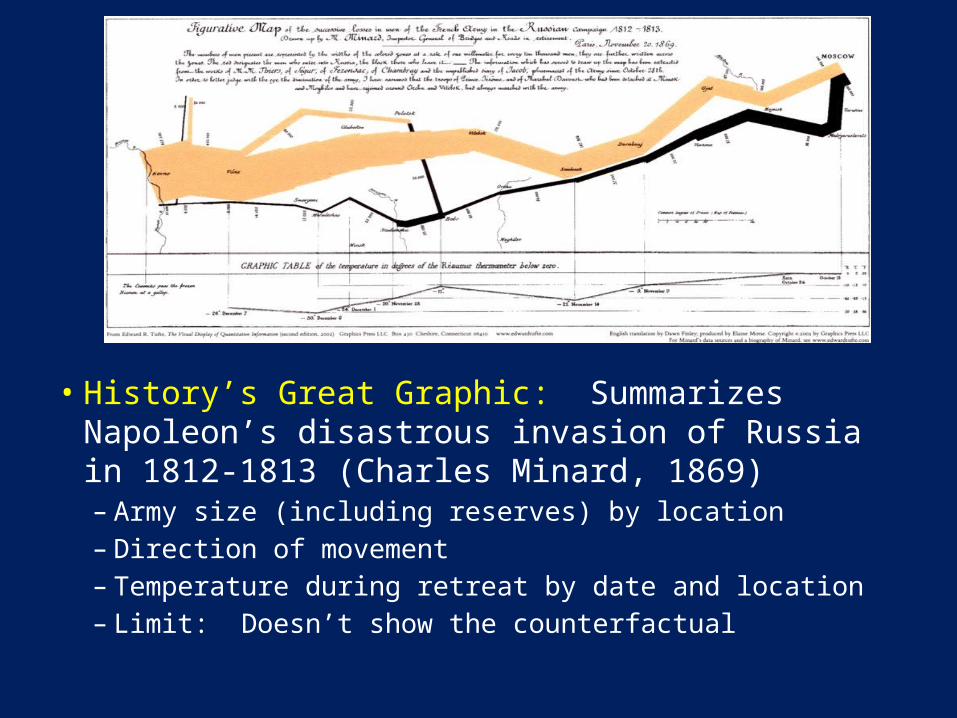
• History’s Great Graphic: Summarizes Napoleon’s disastrous invasion of Russia in 1812-1813 (Charles Minard, 1869)– Army size (including reserves) by location– Direction of movement– Temperature during retreat by date and location– Limit: Doesn’t show the counterfactual
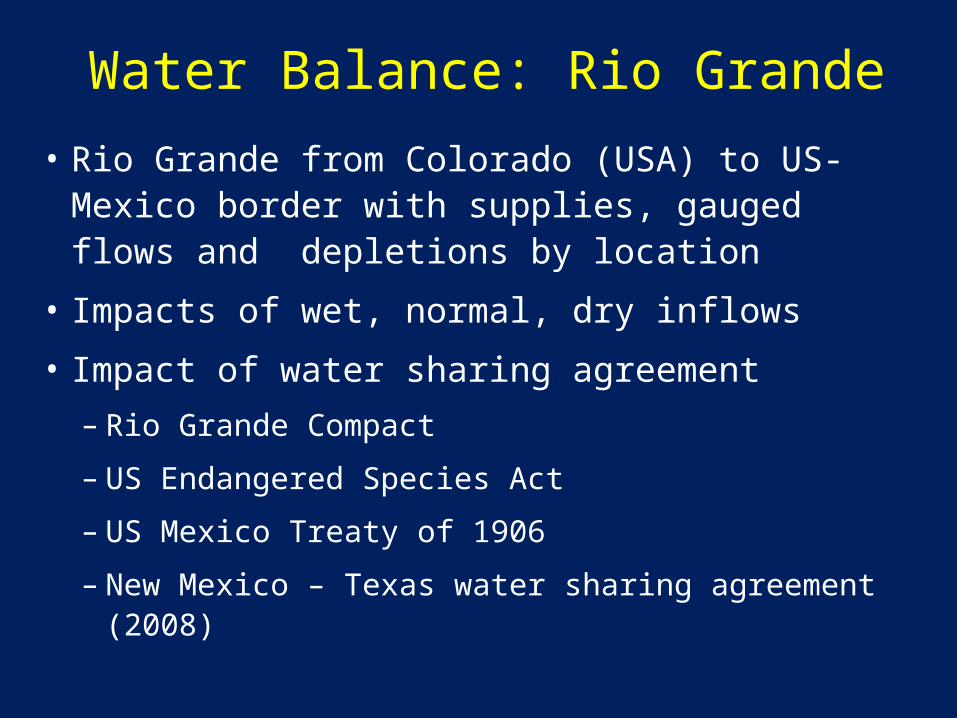
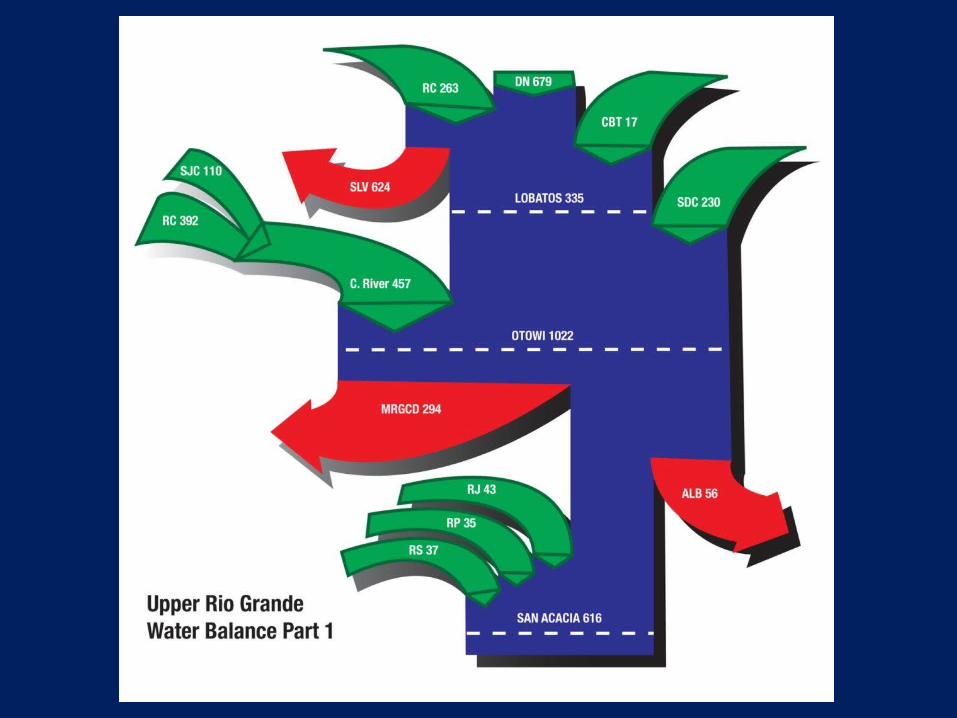
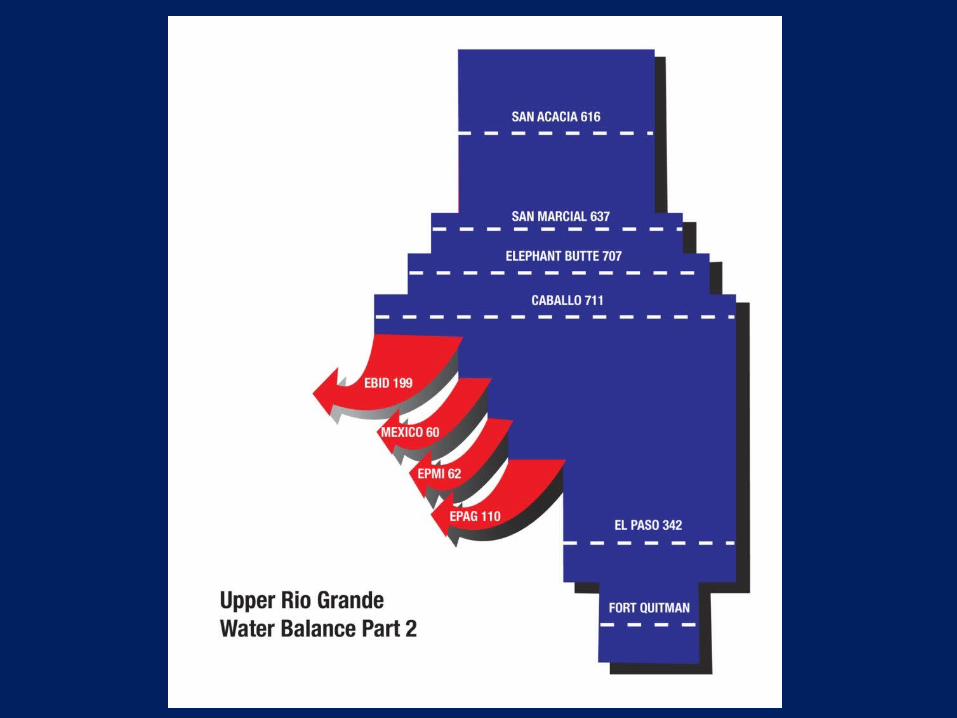
Water Balance: Rio Grande
• Rio Grande from Colorado (USA) to US-Mexico border with supplies, gauged flows and depletions by location
• Impacts of wet, normal, dry inflows
• Impact of water sharing agreement – Rio Grande Compact
– US Endangered Species Act
– US Mexico Treaty of 1906
– New Mexico – Texas water sharing agreement (2008)
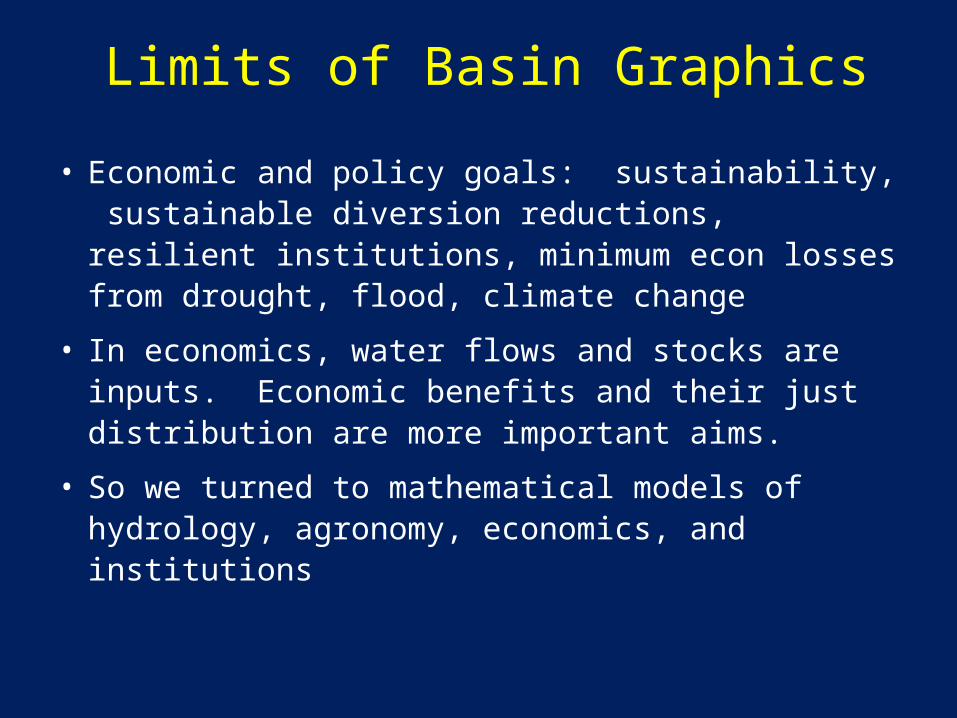
Limits of Basin Graphics
• Economic and policy goals: sustainability, sustainable diversion reductions, resilient institutions, minimum econ losses from drought, flood, climate change
• In economics, water flows and stocks are inputs. Economic benefits and their just distribution are more important aims.
• So we turned to mathematical models of hydrology, agronomy, economics, and institutions

Water Sharing in River Basins: History of Rio Grande Compact
• Settlement in southern Colorado USA, late 1800s
• Southern NM, El Paso, TX and Ciudad Juarez, MX reduced flows
• US-MX Treaty of 1906: 60,000 AF/yr to MX
• US Built Elephant Butte Dam (1916) for treaty flows
• Lawsuits in the early 1900s over growing demands for shrinking supplies. Increasing any use reduced another supply.
• CO-NM-TX: mutual mistrust.
• 1920: recognized need for 3 state flow sharing agreement
• 1929: draft agreement reached.
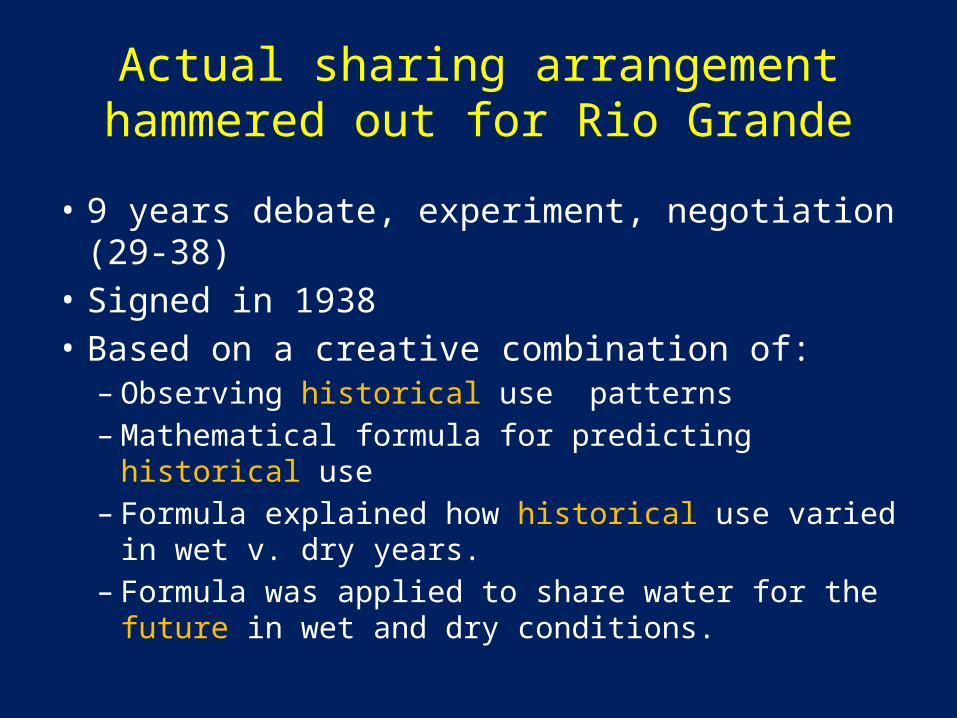
Actual sharing arrangement hammered out for Rio Grande
• 9 years debate, experiment, negotiation (29-38)• Signed in 1938• Based on a creative combination of:– Observing historical use patterns– Mathematical formula for predicting historical use– Formula explained how historical use varied in wet
v. dry years.– Formula was applied to share water for the future
in wet and dry conditions.

Rio Grande Compact Water Sharing Formula
• CO deliveries to NM
• NM deliveries to TX
Lobatos Conejos DelNorte
Conejos DelNorte2 2
10 0.27* 0.11*
.00005* 0.0003*
>- + +
+ +
20.56* .00001*Elephant Butte Otowi Otowi>+ +

Historical Flows into Iraq: Tigris-Euphrates, BCM/yr
(1933-2009)
• Euphrates = 27.7 – 9.7 * year_after_1992
• Tigris = 21.3 – 6.25 * year_after_1997
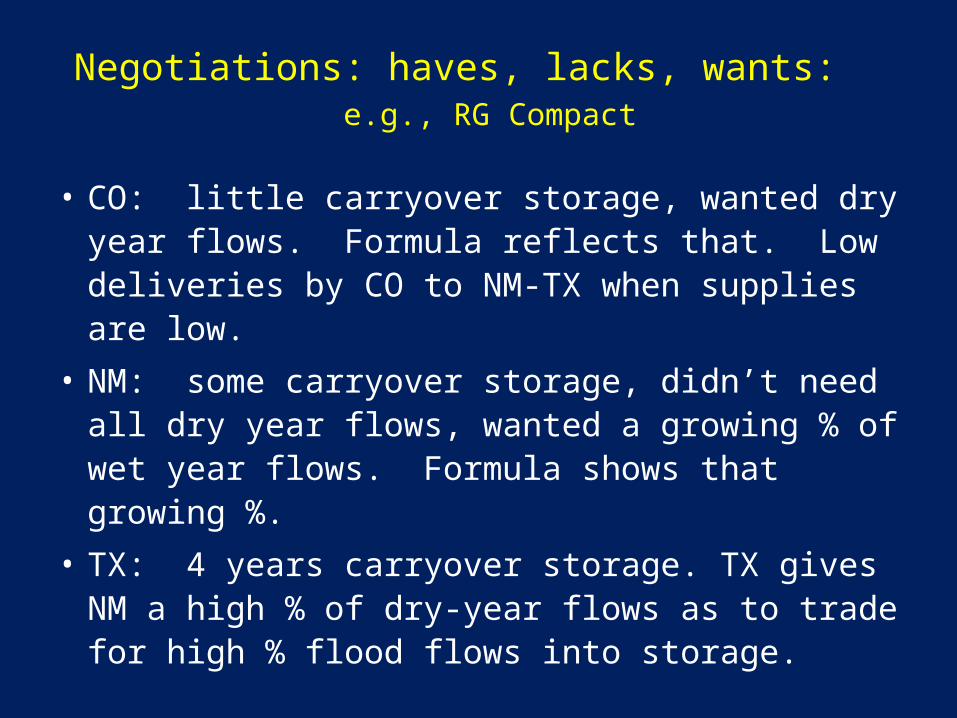
Negotiations: haves, lacks, wants: e.g., RG Compact
• CO: little carryover storage, wanted dry year flows. Formula reflects that. Low deliveries by CO to NM-TX when supplies are low.
• NM: some carryover storage, didn’t need all dry year flows, wanted a growing % of wet year flows. Formula shows that growing %.
• TX: 4 years carryover storage. TX gives NM a high % of dry-year flows as to trade for high % flood flows into storage.
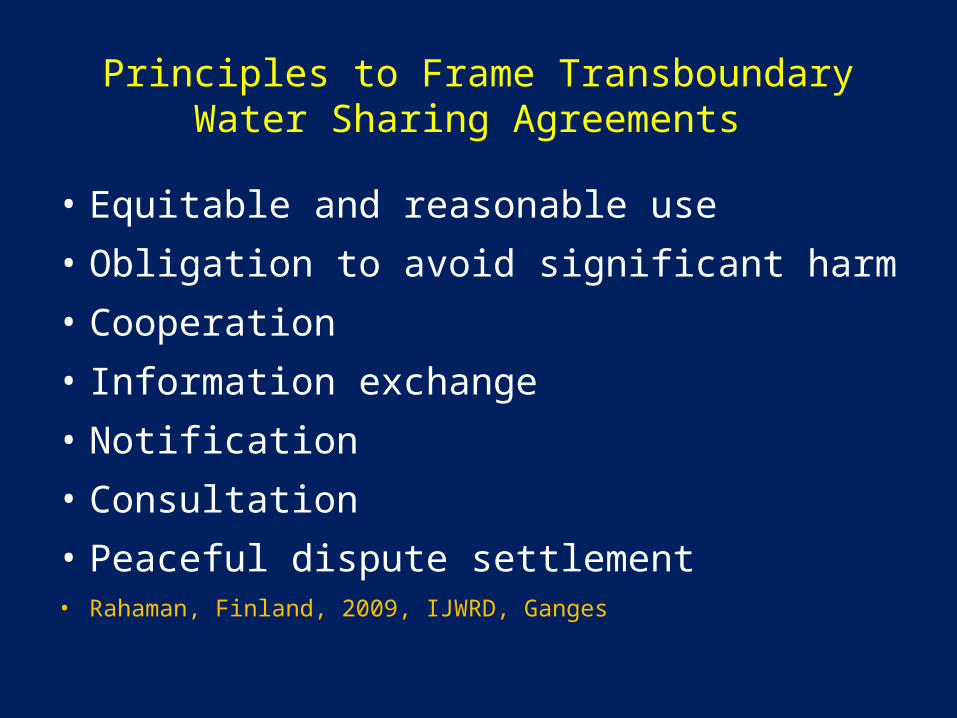
Principles to Frame Transboundary Water Sharing Agreements
• Equitable and reasonable use• Obligation to avoid significant harm • Cooperation• Information exchange • Notification• Consultation• Peaceful dispute settlement • Rahaman, Finland, 2009, IJWRD, Ganges
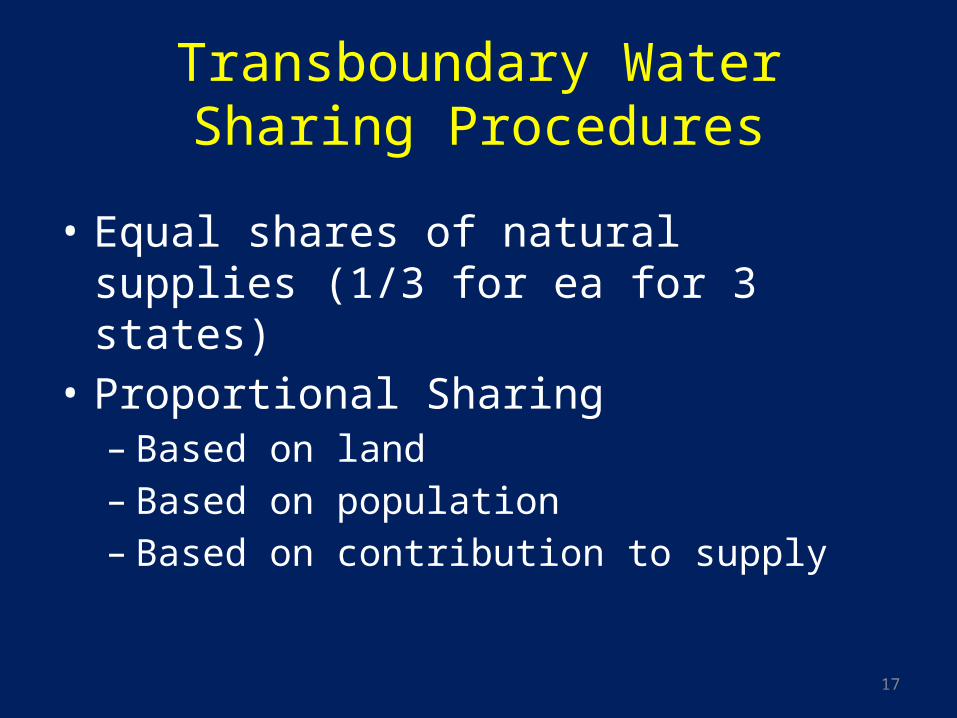
Transboundary Water Sharing Procedures
• Equal shares of natural supplies (1/3 for ea for 3 states)
• Proportional Sharing – Based on land– Based on population– Based on contribution to supply
17
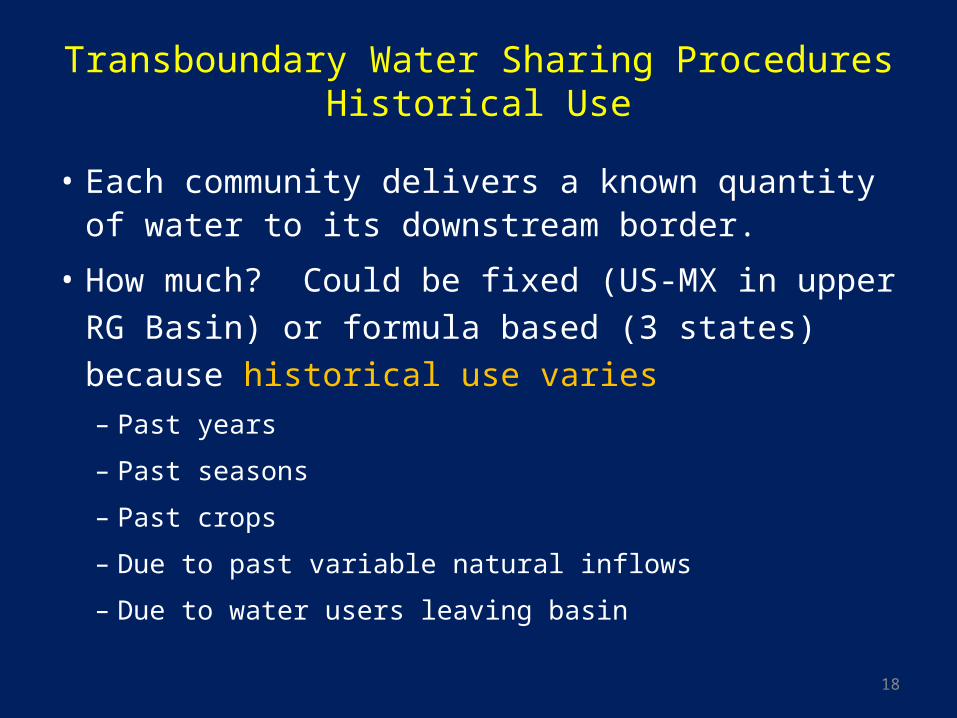
Transboundary Water Sharing ProceduresHistorical Use
• Each community delivers a known quantity of water to its downstream border.
• How much? Could be fixed (US-MX in upper RG Basin) or formula based (3 states) because historical use varies– Past years
– Past seasons
– Past crops
– Due to past variable natural inflows
– Due to water users leaving basin
18
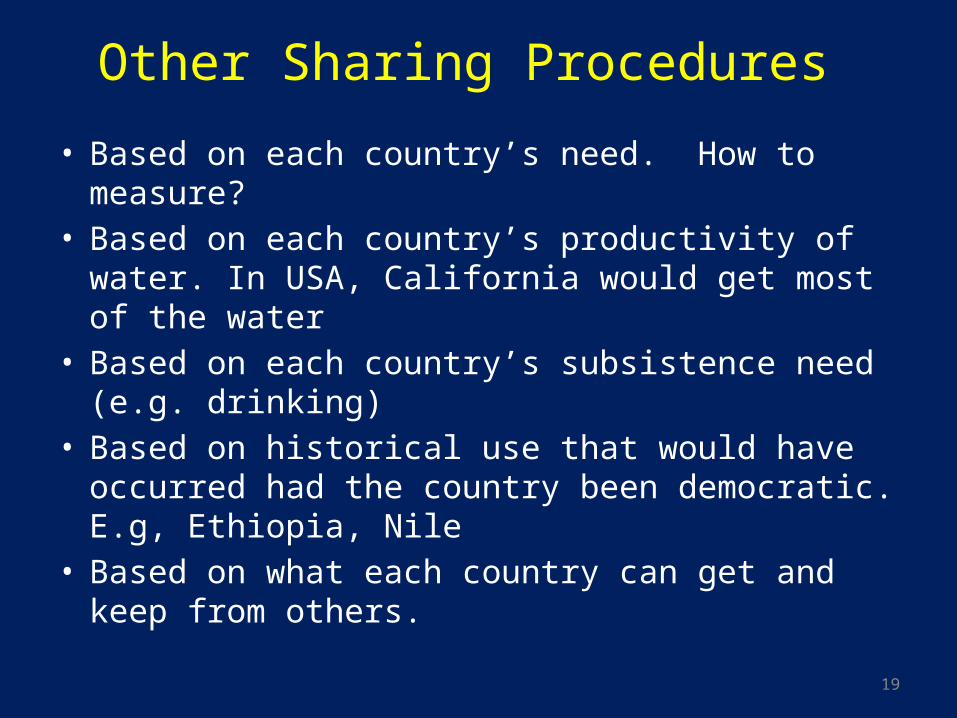
Other Sharing Procedures
• Based on each country’s need. How to measure?• Based on each country’s productivity of water. In
USA, California would get most of the water• Based on each country’s subsistence need (e.g.
drinking)• Based on historical use that would have occurred had
the country been democratic. E.g, Ethiopia, Nile • Based on what each country can get and keep from
others.
19
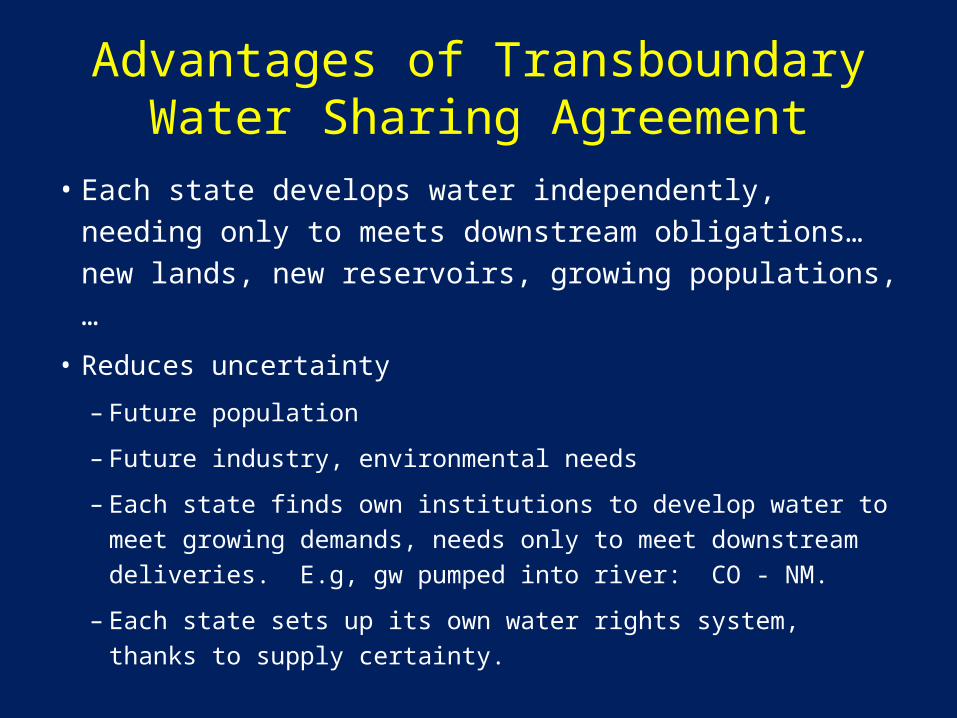
Advantages of Transboundary Water Sharing Agreement
• Each state develops water independently, needing only to meets downstream obligations…new lands, new reservoirs, growing populations,…
• Reduces uncertainty
– Future population
– Future industry, environmental needs
– Each state finds own institutions to develop water to meet growing demands, needs only to meet downstream deliveries. E.g, gw pumped into river: CO - NM.
– Each state sets up its own water rights system, thanks to supply certainty.

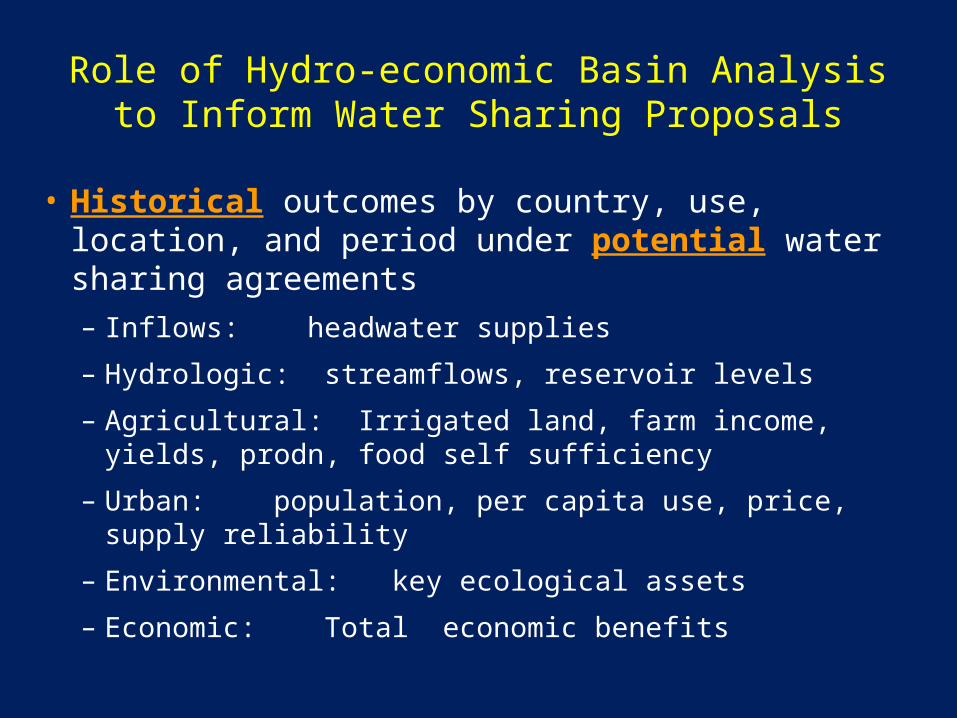
Role of Hydro-economic Basin Analysis to Inform Water Sharing Proposals
• Historical outcomes by country, use, location, and period under actual water sharing agreements– Inflows: headwater supplies
– Hydrologic: streamflows, reservoir levels
– Agricultural: Irrigated land, farm income, yields, prodn, food self sufficiency
– Urban: population, per capita use, price, supply reliability
– Environmental: key ecological assets
– Economic: Total economic benefits
Role of Hydro-economic Basin Analysis to Inform Water Sharing Proposals
• Historical outcomes by country, use, location, and period under potential water sharing agreements – Inflows: headwater supplies
– Hydrologic: streamflows, reservoir levels
– Agricultural: Irrigated land, farm income, yields, prodn, food self sufficiency
– Urban: population, per capita use, price, supply reliability
– Environmental: key ecological assets
– Economic: Total economic benefits
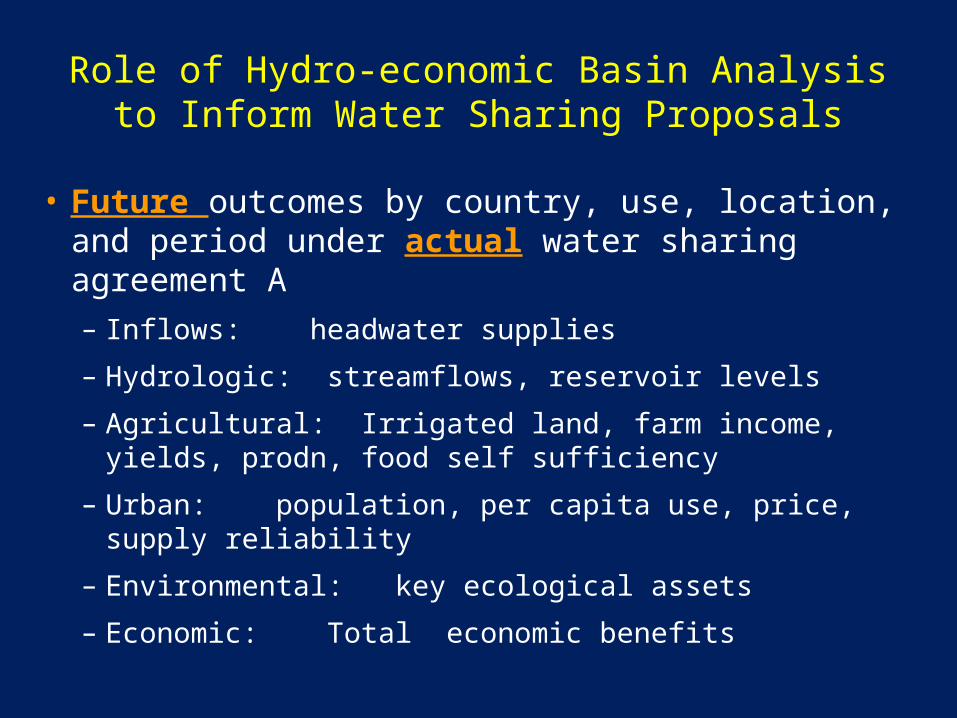
Role of Hydro-economic Basin Analysis to Inform Water Sharing Proposals
• Future outcomes by country, use, location, and period under actual water sharing agreement A – Inflows: headwater supplies
– Hydrologic: streamflows, reservoir levels
– Agricultural: Irrigated land, farm income, yields, prodn, food self sufficiency
– Urban: population, per capita use, price, supply reliability
– Environmental: key ecological assets
– Economic: Total economic benefits
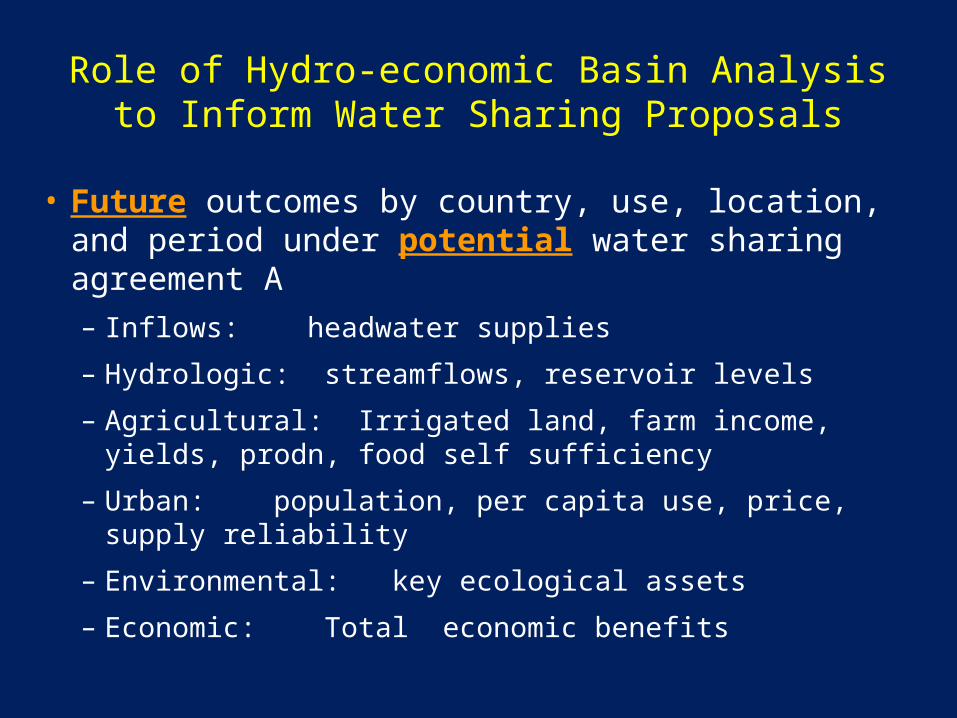
Role of Hydro-economic Basin Analysis to Inform Water Sharing Proposals
• Future outcomes by country, use, location, and period under potential water sharing agreement A– Inflows: headwater supplies
– Hydrologic: streamflows, reservoir levels
– Agricultural: Irrigated land, farm income, yields, prodn, food self sufficiency
– Urban: population, per capita use, price, supply reliability
– Environmental: key ecological assets
– Economic: Total economic benefits
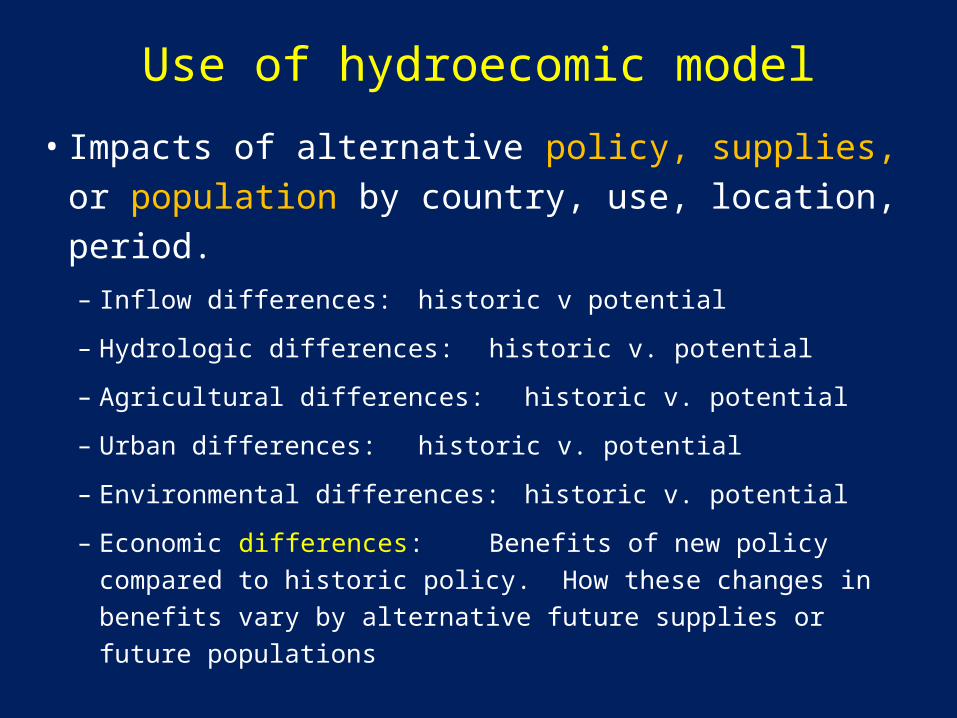
Use of hydroecomic model
• Impacts of alternative policy, supplies, or population by country, use, location, period.– Inflow differences: historic v potential
– Hydrologic differences: historic v. potential
– Agricultural differences: historic v. potential
– Urban differences: historic v. potential
– Environmental differences: historic v. potential
– Economic differences: Benefits of new policy compared to historic policy. How these changes in benefits vary by alternative future supplies or future populations
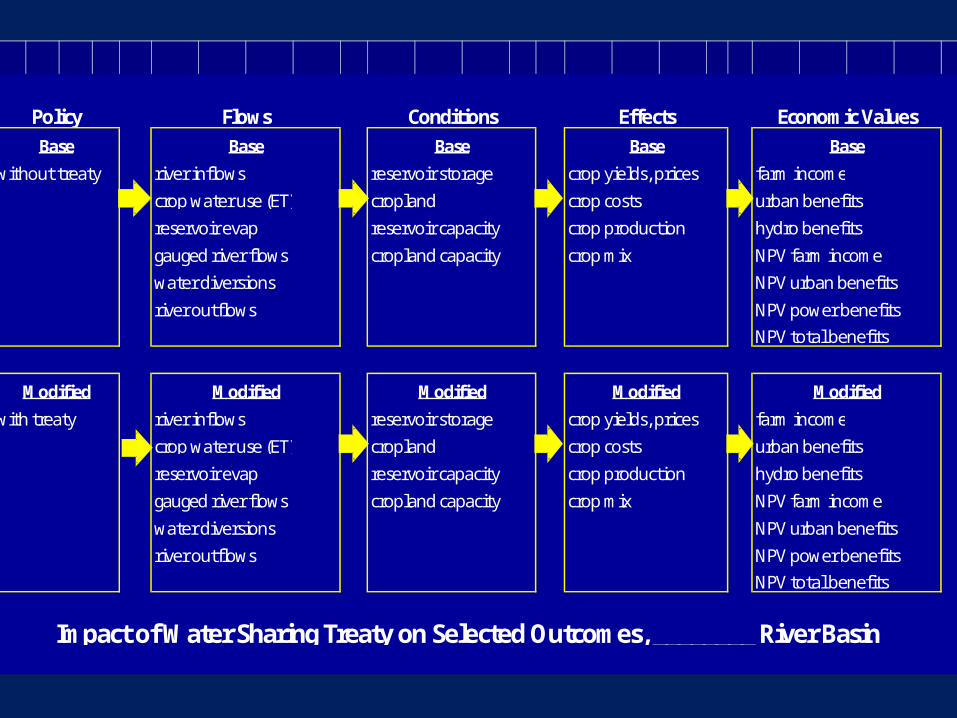
without treaty river inflows reservoir storage crop yields, prices farm income
crop water use (ET) cropland crop costs urban benefits
reservoir evap reservoir capacity crop production hydro benefits
gauged river flows cropland capacity crop mix NPV farm income
water diversions NPV urban benefits
river outflows NPV power benefitsNPV total benefits
with treaty river inflows reservoir storage crop yields, prices farm income
crop water use (ET) cropland crop costs urban benefits
reservoir evap reservoir capacity crop production hydro benefits
gauged river flows cropland capacity crop mix NPV farm income
water diversions NPV urban benefits
river outflows NPV power benefitsNPV total benefits
Impact of Water Sharing Treaty on Selected Outcomes, ________ River Basin
Policy Flows Conditions Effects Economic ValuesBase Base Base Base Base
Modified Modified Modified Modified Modified
Example Structure of Hydroeconomic River Basin Analysis: Upper Rio Grande

28
Objective
(1 ) (1 )ut ett t
u t e tu e
NBu NBeMax NPV
r r
[ ]uckt ct uckt uckt ucktNBA P Yield Cost L
(1 )uckt
tu c k t u
NBANPV Ag
r
( . , ), ( . ., )ut etNB e g urban NB e g wetlands

• Irrigable land, Headwater supplies• Sustain key ecological assets• Hydrologic balance• Reservoir starting levels (sw, gw)• Reservoir sustainability constraints (sw,
gw)• Institutional– Endangered Species Act
– Rio Grande Compact (CO-NM; NM-TX)
– US Mexico Treaty of 1906
– Rio Grande Project water sharing history (NM/TX)
29
Constraints
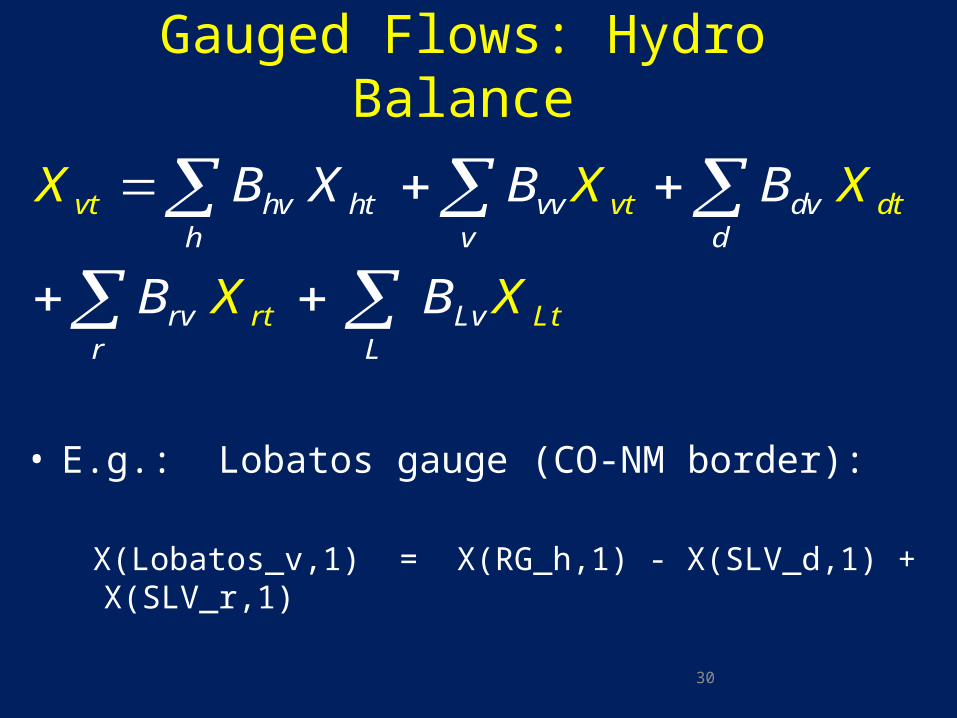
• E.g.: Lobatos gauge (CO-NM border): X(Lobatos_v,1) = X(RG_h,1) - X(SLV_d,1) + X(SLV_r,1)
30
hv ht vv dvh v d
vt vt dt
rt LLr L
trv v
B X B BX X X
XB B X
Gauged Flows: Hydro Balance
31
( , , ,...)
ut uck ucktc k
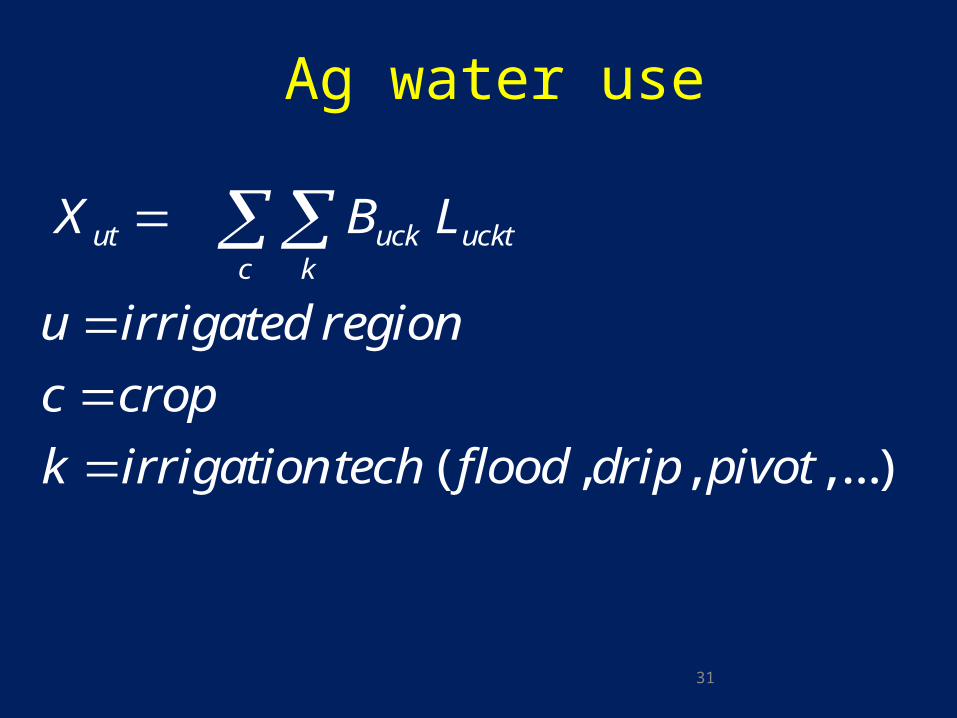
X B L
u irrigated region
c crop
k irrigationtech flood drip pivot
Ag water use
32
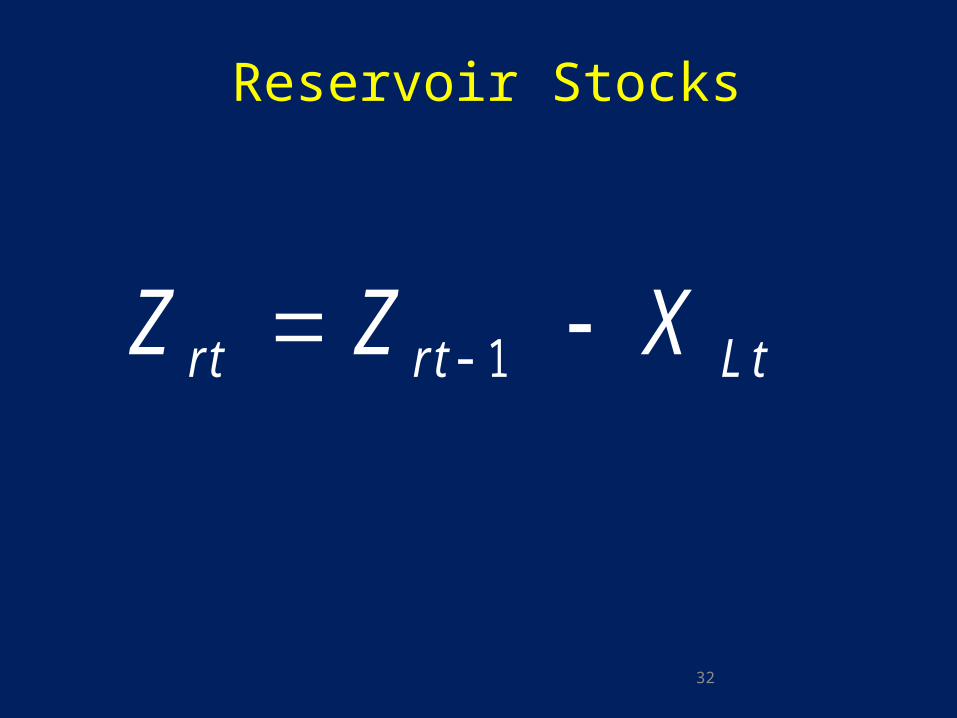
Z Z Xrt rt L t 1
Reservoir Stocks

33
LobatosvtX Colorado runoff
SA Lobatosvt vtX X NM runoff
Institutions: e.g. Rio Grande Compact
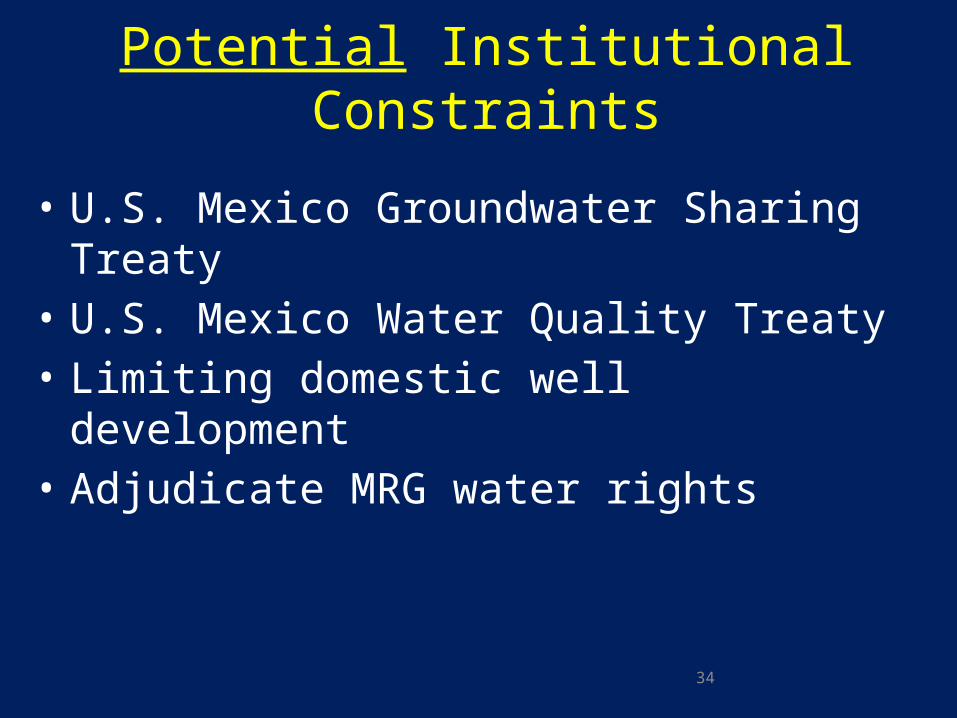
• U.S. Mexico Groundwater Sharing Treaty• U.S. Mexico Water Quality Treaty• Limiting domestic well development• Adjudicate MRG water rights
34
Potential Institutional Constraints

Example Results: Rio Grande Basin
• Policy: Subsidize drip irrigation with an upper bound on existing depletions to meet downstream delivery obligations with changing policy
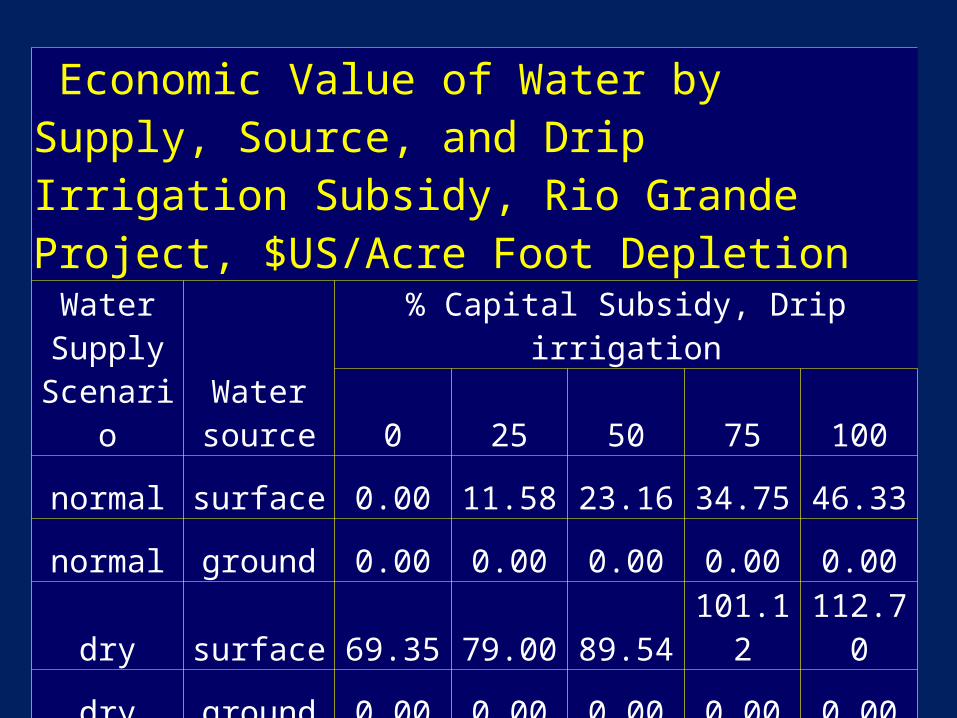
Economic Value of Water by Supply, Source, and Drip Irrigation Subsidy, Rio Grande Project, $US/Acre Foot Depletion
Water Supply
ScenarioWater source
% Capital Subsidy, Drip irrigation
0 25 50 75 100
normal surface 0.00 11.58 23.16 34.75 46.33
normal ground 0.00 0.00 0.00 0.00 0.00
dry surface 69.35 79.00 89.54 101.12 112.70
dry ground 0.00 0.00 0.00 0.00 0.00

Conclusions and Future Directions
• Hydroeconomic Model Advances– Theory– Model design– Computational technique/speed
• Needs: Optimization on water development (gw, reservoirs, purification plants, recycling)
• Needs: Optimization of water institutions (trans-boundary water sharing, water rights, adjudication, groundwater treaties)