stock article weekly review quote?? · stock article quote?? continued on page 2 … research...
TRANSCRIPT
S T O C K A R T I C L E
Quote??
Continued on page 2 …
R E S E A R C H
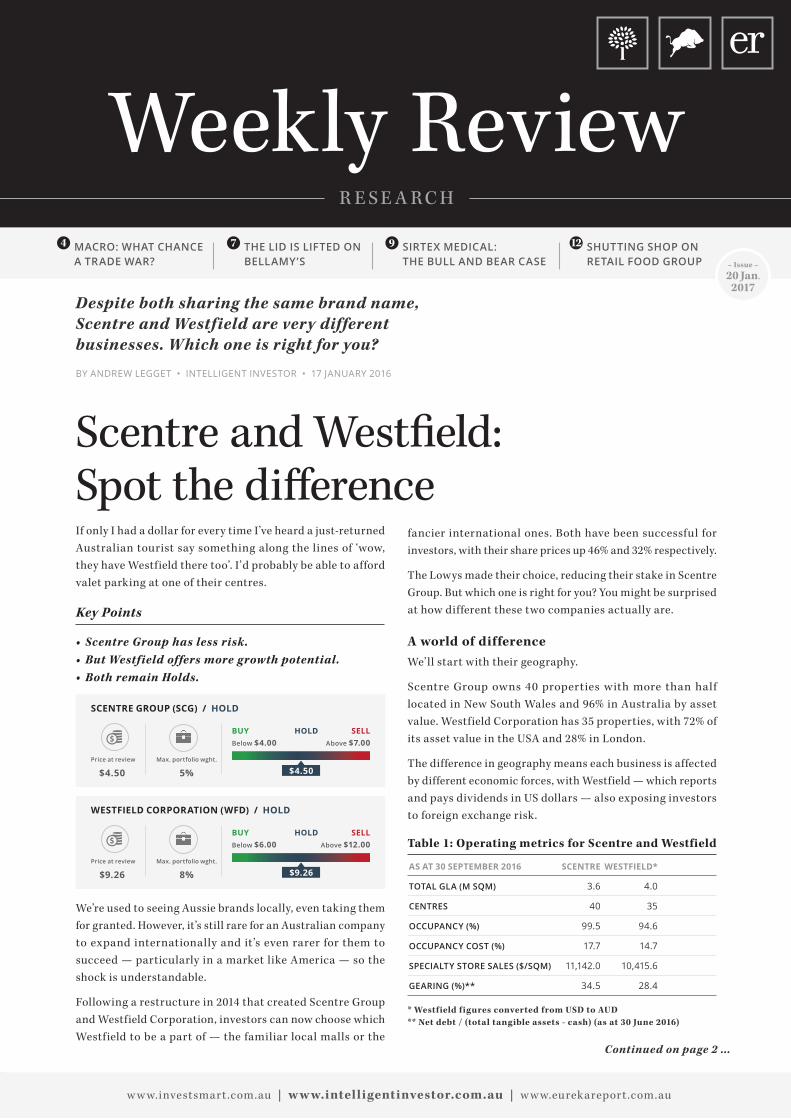
MACRO: WHAT CHANCE A TRADE WAR?
4 THE LID IS LIFTED ON BELLAMY’S
7 SIRTEX MEDICAL: THE BULL AND BEAR CASE
9 SHUTTING SHOP ON RETAIL FOOD GROUP
12
If only I had a dollar for every time I’ve heard a just-returned Australian tourist say something along the lines of ‘wow, they have Westfield there too’. I’d probably be able to afford valet parking at one of their centres.
Key Points
• Scentre Group has less risk.• But Westfield offers more growth potential.• Both remain Holds.
SCENTRE GROUP (SCG) / HOLD
BUY HOLD SELL Below $4.00 Above $7.00 Price at review Max. portfolio wght.
$4.50 5% $4.50
WESTFIELD CORPORATION (WFD) / HOLD
BUY HOLD SELL Below $6.00 Above $12.00 Price at review Max. portfolio wght.
$9.26 8% $9.26
We’re used to seeing Aussie brands locally, even taking them for granted. However, it’s still rare for an Australian company to expand internationally and it’s even rarer for them to succeed — particularly in a market like America — so the shock is understandable.
Following a restructure in 2014 that created Scentre Group and Westfield Corporation, investors can now choose which Westfield to be a part of — the familiar local malls or the
Scentre and Westfield: Spot the difference
Despite both sharing the same brand name, Scentre and Westfield are very different businesses. Which one is right for you?
BY ANDREW LEGGET • INTELLIGENT INVESTOR • 17 JANUARY 2016
fancier international ones. Both have been successful for investors, with their share prices up 46% and 32% respectively.
The Lowys made their choice, reducing their stake in Scentre Group. But which one is right for you? You might be surprised at how different these two companies actually are.
A world of differenceWe’ll start with their geography.
Scentre Group owns 40 properties with more than half located in New South Wales and 96% in Australia by asset value. Westfield Corporation has 35 properties, with 72% of its asset value in the USA and 28% in London.
The difference in geography means each business is affected by different economic forces, with Westfield — which reports and pays dividends in US dollars — also exposing investors to foreign exchange risk.
Table 1: Operating metrics for Scentre and Westfield
AS AT 30 SEPTEMBER 2016 SCENTRE WESTFIELD*
TOTAL GLA (M SQM) 3.6 4.0
CENTRES 40 35
OCCUPANCY (%) 99.5 94.6
OCCUPANCY COST (%) 17.7 14.7
SPECIALTY STORE SALES ($/SQM) 11,142.0 10,415.6
GEARING (%)** 34.5 28.4
* Westfield figures converted from USD to AUD** Net debt / (total tangible assets - cash) (as at 30 June 2016)
– Issue –20 Jan.
2017
w w w.investsmart .com.au | w w w.intelligentinvestor.com.au | w w w.eurekareport .com.au
Weekly Review

2
S T O C K A R T I C L E
Intro??
Unlike Australia, where Scentre dominates the super/major regional mall category, Westfield has to compete with other American giants. Add in higher online shopping penetration in the US and UK and the international shopping centre market is a lot more competitive. It’s also a reason why Westfield has lower levels of occupancy than Scentre (see Table 1) and its tenants have lower occupancy costs (see Shoptalk).
Shoptalk: Occupancy cost
Although rent is the main expense when leasing a store in a shopping centre, it is not the only one. Occupancy cost measures how much of a store’s sales are taken up by all occupancy expenses, such as rent, insurance and taxes. All things remaining equal, a store with lower occupancy costs is more profitable than one with higher occupancy costs.
AnchoringThere are also some major differences in how each company operates. Although the UK is very similar to Australia, a quirk of the American shopping centre industry is that anchor tenants typically own their stores rather than lease them and contribute to the malls’ operating costs rather than pay rent.
No company takes up more space inside a Westf ield Corporation mall than Macy’s (19% of lettable area as at 31 December 2015) — which has recently announced an intention to close up to 100 stores across the USA.
Shoptalk: Anchor tenant
Anchor tenants are major retailers who take up the largest stores in a shopping centre. Anchors provide the foot traffic which benefits the specialty retailers. In Australia, anchor leases are long term (25–30 years) and include lower rent, which increases with inflation.
Although the quality and location of Westfield Corporation’s properties — being f lagship properties in major tourism and trading districts — mean the company is less likely to be a
victim of store closures by the major retailers, it does limit f lexibility as Westfield may be required to purchase the store before trying to find a new tenant.
Business of fashionThe lack of rent from American anchor tenants also means the success of specialty retailers becomes a lot more important.
Specialty retailers for both companies sign up to leases with terms of typically 5–10 years and rental increases at rates higher than inf lation (inf lation plus 2% in the case of most of Scentre’s portfolio).
Specialty retailers generate higher income growth for landlords but are also on shorter leases. These can be more volatile as terms are renegotiated more frequently and they could be at lower rents than previously (known as negative leasing spreads) or lead to higher vacancies.
Around 95% of Westf ield ’s rental income comes from specialties even though they only take up half of total f loor space. That’s a lot higher than Scentre Group, where specialty stores contribute 83% of rental income and 46% of the space to rent.
Table 2: Top 10 specialty tenants as at 31 Dec 2015
RANK WESTFIELD SCENTRE GROUP
1 Forever 21 Super Retail Group
2 The Gap Inc Cotton On Group
3 H&M JB Hi Fi
4 L Brands The Just Group
5 Foot Locker Best & Less
6 Abercrombie & Fitch Dick Smith*
7 Ascena Retail Group Country Road Group
8 Inditex Specialty Fashion Group
9 Express, Inc Australian Pharm. Industries
10 Dicks Sporting Goods BB Retail
*Information refers to period before Dick Smith administration.
Continued from page 1 …
I M P O R TA N T I N F O
DISCLAIMER This publication is general in nature
and does not take your personal situation into
consideration. You should seek financial advice
specific to your situation before making any financial
decision. Past performance is not a reliable indicator
of future performance. We encourage you to think of
investing as a long-term pursuit.
COPYRIGHT© InvestSMART Publishing Pty Ltd 2017.
Intelligent Investor and associated websites and
publications are published by InvestSMART Publishing
Pty Ltd ABN 12 108 915 233 (AFSL No. 282288).
DISCLOSURE Staff own many of the securities
mentioned within this publication.
F E AT U R E A R T I C L E S PAGE
Macro: What chance a trade war? 4
S T O C K A R T I C L E S RECO. PAGE
Bellamy’s Australia Avoid 7Carsales.com Hold 13Retail Food Group Sell 12Scentre Group Hold 1Sirtex Medical Hold 9Westfield Corporation Hold 1
S T O C K A L E R T S RECO. PAGE
CSL Hold 16Nanosonics Hold 16
E X T R A S
Why Purplebricks isn’t the best way to sell your house 14
Q&A 17
R E CO. C H A N G E S FROM TO
Retail Food Group (RFG) Hold Sell
CONTENTS

3
S T O C K A R T I C L E
With the world at its fingertips, Westfield Corporation has the most room to grow.
A look at the top specialty tenants for each company shows that Westfield Corporation has some of the world’s top fashion brands taking up most of its specialty space (see Table 2). Although popular, customer spending habits in this market can change quickly.
Scentre, on the other hand, is dominated by local Australian retailers, including less-discretionary retailers, such as pharmacies and those selling discount clothing, which are less likely to see customers move online and are less likely to leave when the lease is up.
DevelopmentWith the world at its fingertips, Westfield Corporation has the most room to grow.
Indeed, as at 30 September 2016, Westfield Corporation had a development pipeline of more than US$9bn, including a second building at the site of the World Trade Centre in New York and a new property in London as well as beginning pre-development work on a property in Milan.
In fact , as at 30 June 2016, Westf ield Corporation’s development pipeline made up around half of the company’s total assets. The company is also exploring residential opportunities in London and growing the amount of revenue coming from other non-retail activities such as events and digital advertising. Westfield Corporation’s developments are expected to yield between 7% and 8%.
On the other hand, Scentre’s development pipeline was around $3b (12% of assets) and is more focused on expanding and improving its existing portfolio rather than buying or building new centres. Scentre’s development pipeline also has a slightly lower anticipated yield of between 7% and 7.5%.
Similar size, different fitWith different geographic markets, different lease terms, different tenants and different development opportunities, Scentre and Westfield are two very different companies with different levels of risk.
Scentre Group has less money tied up in future development and gets more of its rent from anchor tenants on long-term leases. That makes it less risky, but also means it has lower growth potential. Westfield, on the other hand, promises less income but more growth as well as some international diversification into America and the United Kingdom.
We’ll provide updates on both companies’ results for the 2016 financial year next month (they both have financial years that end on 31 December). In the meantime, Scentre has guided towards a distributable profit of around 23 cents per share of which it will pay out 92%, equating to about 21 cents per share and putting the stock on an unfranked distribution yield of around 4.7%.
Westfield has guided towards a distributable profit of about 34 US cents per share and will pay out about 74%, equating to around 25 US cents per share. Converting to Australian dollars, that puts Westfield on an unfranked distribution yield of 3.6%.
Factoring in our estimations of long-term growth of around 4–5% for Scentre and 4–6% for Westfield, we don’t see enough value to warrant buying either stock at the moment, but recommend existing shareholders continue to HOLD both.
Staff members may own securities mentioned in this article.
4
F E A T U R E A R T I C L E
Since Trump’s election victory the S&P 500 index has risen almost 5% and the ASX 200 nearly 10%. This isn’t all Trump’s doing of course, commodity price rises have much to do with local fillip. But the expectation of infrastructure spending, bank deregulation (which worked so well last time) and massive tax cuts has certainly helped.
But there’s one issue that isn’t getting much attention. Throughout his campaign, Trump added China to an ever-expanding list of bogeymen on which the disaffected were encouraged to focus. ‘We can’t continue to allow China to rape our country,’ Trump said at one stump speech. ‘That’s what they’re doing. It’s the greatest theft in the history of the world.’
How does this ‘theft’ occur? Trump again: ‘China goes down to 7 per cent [growth], and then what they do is devalue their currency and they take more of our business and they start to go up again.’
Let’s not challenge that statement and instead focus on what he plans to do about it.
The aim is to stop China’s ‘outrageous theft of intellectual property, along with their illegal product dumping, and their devastating currency manipulation’ by imposing a 45% import tax on Chinese goods. Trump is somewhat constrained by Congress in his ambitions but if there is a trade war, this is where it will start. Before examining that prospect, let’s define our terms.
What is a trade war?A trade war is fought between two or more states with rules and regulations rather than deadly weapons. Let’s say, for example, you’re a US President under pressure from a union over cheap Chinese tyre imports. In response, you impose a tariff on imported Chinese tyres. Unimpressed, they retaliate by slugging US chicken imports with an even bigger tariff, which they raise again two weeks later. If this sounds improbable, consider that it occurred in 2009/10 and is still being fought out before the World Trade Organisation (WTO). And don’t get me started on the paper clip wars.
Trade war armoury also includes quotas, which restrict the number of items that can be imported, and ostensibly reasonable regulations that have the real objective of propping up domestic production, like the great Trans-Tasman 90-year apple war.
Macro: What chance a trade war?
BY JOHN ADDIS • INTELLIGENT INVESTOR • 20 JANUARY 2017
Do tariffs and quotas work?For a small number of people, yes, at everyone else’s expense. The Peterson Institute for International Economics, a think tank that examined the chicken-tyre stoush claimed the move saved about 1,200 manufacturing jobs but cost 2,500 retail jobs. The US tyre industry has continued to decline and cheap Chinese tyre imports were quickly substituted for cheap non-Chinese imports. Some jobs were saved at great expense but a good deal more were lost.
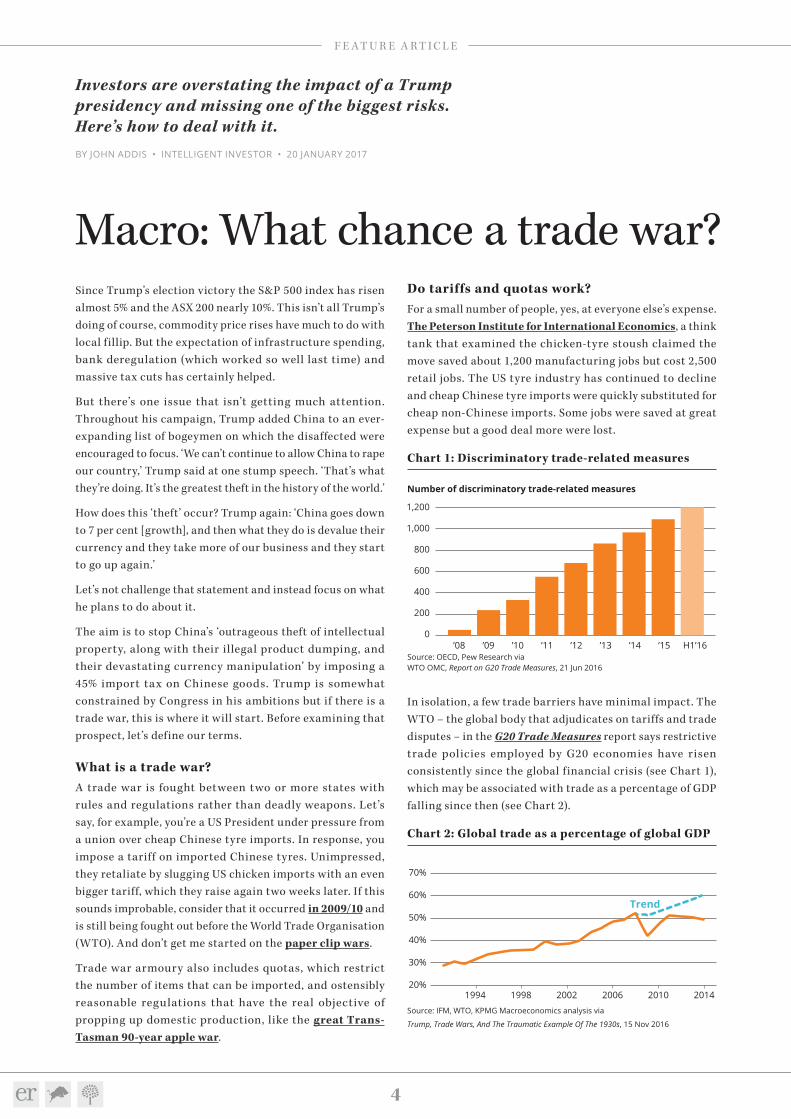
Chart 1: Discriminatory trade-related measuresChart 1: Discriminatory trade-related measures
Source: OECD, Pew Research via WTO OMC, Report on G20 Trade Measures, 21 Jun 2016
’08 ’09 ’10 ’11 ’12 ’13 ’14 ’15 H1’16
1,200
Number of discriminatory trade-related measures
1,000
800
600
400
200
0
In isolation, a few trade barriers have minimal impact. The WTO – the global body that adjudicates on tariffs and trade disputes – in the G20 Trade Measures report says restrictive trade policies employed by G20 economies have risen consistently since the global financial crisis (see Chart 1), which may be associated with trade as a percentage of GDP falling since then (see Chart 2).
Chart 2: Global trade as a percentage of global GDP
Source: IFM, WTO, KPMG Macroeconomics analysis via
Trump, Trade Wars, And The Traumatic Example Of The 1930s, 15 Nov 2016
199420%
30%
40%
50%
60%
70%
1998 2002 2006 2010 2014
Trend
Investors are overstating the impact of a Trump presidency and missing one of the biggest risks. Here’s how to deal with it.

5
F E A T U R E A R T I C L E
If a trade war did eventuate Australia would be stuck in the middle.
on its doorstep that will soon dwarf the entire US population, China doesn’t need the US as much as the US needs it.
Much of China’s high-tech output is in service to US-based businesses. You can’t hurt China without hurting the likes of Apple and Boeing. As Winter Nie of IMD Business School told Fortune: ‘Trump’s abandonment of existing US trade agreements would accelerate China’s displacement of America as the world’s leading economic power.’
Arrangements similar to those struck in the 1980s with Japanese car manufacturers to establish US plants are more likely, allowing Trump to avoid a trade war and still say he’s saved manufacturing by getting Apple to make iPhones in Utah.
Chart 3: Down the plughole, world trade 1929–33 ($bn) Chart 3: Down the plughole, world trade 1929–33 ($bn)
Source: League of Nations’ World Economic Survey 1932–33 viaThe Economist, The battle of Smoot-Hawley, 18 Dec 2008
1929 1930 1931 1932 1933
Janu
ary July
Augu
st
September
April
May
June
October
November
December
Febr
uary
March
5.3
4.9
3.3
2.1
1.8
A storm in a tea cup then? Not quite. If a trade war did eventuate Australia would be stuck in the middle. Declining economic performance in two of our top three trading partners could easily provoke a local recession.
How should I prepare my portfolio?As ever, the aim is to prepare rather than predict. The first thing is to not go to cash in fear of the prospect of a trade
But an across-the-board 45% tariff on the importation of all goods from the world’s second-largest economy into the world’s largest would have a huge impact, to say nothing of the retaliation it might provoke. Daiwa Capital Markets estimated that such a tariff could provoke an 87% decline in China’s exports to the US and that even a 15% tariff would lead to a 1.8% loss in Chinese GDP.
So trade barriers are generally bad for us all?Yes. Free trade has lifted hundreds of millions out of poverty in developing nations and allowed more people the world over to buy goods and services they could not previously afford. Fidelity International said in August last year that, ‘Trade barriers kill more jobs than they preserve, squander taxpayer money, strain government finances, hamper productivity growth and suppress living standards.’
What would be the consequences of a trade war?Whilst the winners from tariffs are few, the losers are many. The impact of the infamous Smoot-Hawley Tariff Act (save the name for your next dinner party) shows how.
Passed in 1930, it imposed far higher US import duties on over 900 goods. Retaliation was swift. Within two years the volume of US imports had fallen 41% and US exports by almost the same amount (see this NBER paper). The effect on global trade was stupendous. Between 1929 and 1933 it went ‘down the plughole’ according to The Economist (see Chart 3), from $5.3bn in 1929 to $1.8bn four years later.
How much of this fall can be blamed on Smoot-Hawley remains a matter of debate. Damaging monetary policy, balanced budgets and the gold standard played a part in the conditions that lead to The Great Depression. But even the US State Department said the Act ‘quickly became a symbol of the “beggar thy neighbor” policies of the 1930s’.
Will a trade war actually happen?Maybe not. The 1930s showed how mutually destructive trade wars can be. Leaders would have to be mad (in the Cold War sense) to embark on one.
Yes, I know what you’re thinking, so try this: China can win a trade war with the US, which is why the US won’t provoke one. China is less reliant on the US than it was 20 years ago while the opposite is true for the US. With an emerging middle class
6
F E A T U R E A R T I C L E
Macquarie Group, it’s quite possible your holdings breach our portfolio limits. If so, we recommend taking some profits and investing the proceeds with the help of our Buy List.
4. Spread the risk – We’re big believers in international diversification and the threat of a trade war reinforces that view. You might want to avoid China-dependent stocks like the aforementioned Apple and Boeing, to say nothing of Bellamy’s, but the larger point remains - with Australia in the firing line it makes sense to diversify that risk, especially with the local dollar likely to fall if that risk eventuates.
Note: The Intelligent Investor Growth and Equity Income portfolios own shares in South32, Ansell , Trade Me and Macquarie Group. You can find out about investing directly in Intelligent Investor and InvestSMART portfolios by clicking here.
Discslosure: The author owns shares in South32.
Staff members may own securities mentioned in this article.
Too many investors are overexposed to a property market contraction through their big bank shareholdings.
war, which would be, in effect, to predict a trade war and time its arrival. Instead, we suggest the following:
1. Limit your exposure to resources – With commodity prices rebounding the sector is enjoying a renewed bout of enthusiasm. We’d suggest you don’t get carried away anyway, but the threat of a trade war and its deleterious impact on the resources sector only strengthens that position. Tread carefully.
2. Same goes for the banks – This is a perennial warning because it’s a perennial problem. Too many investors are overexposed to a property market contraction through their big bank shareholdings. With a trade war likely to push up interest rates, the impact on bank loan books could be nasty. Contain your exposure to the sector to no more than 20% and more like half that for conservative investors.
3. Stick to our portfolio limits and check out our Buy List – The past few years have been kind to our performance. With hefty price rises in stocks like South32, Ansell, Trade Me and
7
S T O C K A R T I C L E
After a four-week suspension from trading, Bellamy’s has updated the market with details of falling profits and an onerous supply agreement with Fonterra. The stock fell 20% on the day trading restarted on 11 January and has fallen another 23% since.
Key Points
• Revenue f lat• Crippling supply agreements• Value hard to find
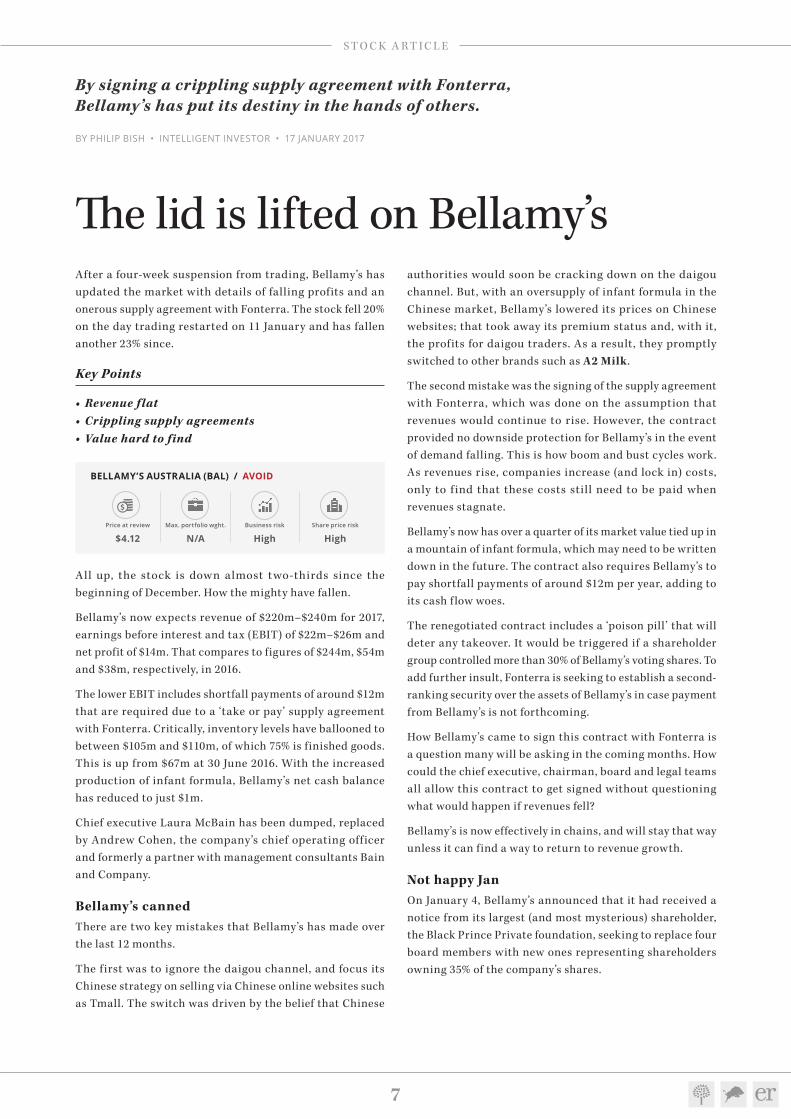
BELLAMY’S AUSTRALIA (BAL) / AVOID
Price at review Max. portfolio wght. Business risk Share price risk
$4.12 N/A High High
All up, the stock is down almost two-thirds since the beginning of December. How the mighty have fallen.
Bellamy’s now expects revenue of $220m–$240m for 2017, earnings before interest and tax (EBIT) of $22m–$26m and net profit of $14m. That compares to figures of $244m, $54m and $38m, respectively, in 2016.
The lower EBIT includes shortfall payments of around $12m that are required due to a ‘take or pay’ supply agreement with Fonterra. Critically, inventory levels have ballooned to between $105m and $110m, of which 75% is finished goods. This is up from $67m at 30 June 2016. With the increased production of infant formula, Bellamy’s net cash balance has reduced to just $1m.
Chief executive Laura McBain has been dumped, replaced by Andrew Cohen, the company’s chief operating officer and formerly a partner with management consultants Bain and Company.
Bellamy’s cannedThere are two key mistakes that Bellamy’s has made over the last 12 months.
The first was to ignore the daigou channel, and focus its Chinese strategy on selling via Chinese online websites such as Tmall. The switch was driven by the belief that Chinese
The lid is lifted on Bellamy’s
BY PHILIP BISH • INTELLIGENT INVESTOR • 17 JANUARY 2017
authorities would soon be cracking down on the daigou channel. But, with an oversupply of infant formula in the Chinese market, Bellamy’s lowered its prices on Chinese websites; that took away its premium status and, with it, the profits for daigou traders. As a result, they promptly switched to other brands such as A2 Milk .
The second mistake was the signing of the supply agreement with Fonterra, which was done on the assumption that revenues would continue to rise. However, the contract provided no downside protection for Bellamy’s in the event of demand falling. This is how boom and bust cycles work. As revenues rise, companies increase (and lock in) costs, only to f ind that these costs still need to be paid when revenues stagnate.
Bellamy’s now has over a quarter of its market value tied up in a mountain of infant formula, which may need to be written down in the future. The contract also requires Bellamy’s to pay shortfall payments of around $12m per year, adding to its cash f low woes.
The renegotiated contract includes a ‘poison pill ’ that will deter any takeover. It would be triggered if a shareholder group controlled more than 30% of Bellamy’s voting shares. To add further insult, Fonterra is seeking to establish a second-ranking security over the assets of Bellamy’s in case payment from Bellamy’s is not forthcoming.
How Bellamy’s came to sign this contract with Fonterra is a question many will be asking in the coming months. How could the chief executive, chairman, board and legal teams all allow this contract to get signed without questioning what would happen if revenues fell?
Bellamy’s is now effectively in chains, and will stay that way unless it can find a way to return to revenue growth.
Not happy JanOn January 4, Bellamy’s announced that it had received a notice from its largest (and most mysterious) shareholder, the Black Prince Private foundation, seeking to replace four board members with new ones representing shareholders owning 35% of the company’s shares.
By signing a crippling supply agreement with Fonterra, Bellamy’s has put its destiny in the hands of others.

8
S T O C K A R T I C L E
The signing of the Fonterra contract showed that management was expecting revenue growth to continue.
more cash in the bank. This would reduce the likelihood of a writedown and eventually lead to lower shortfall payments.
However, there’s also the risk of revenue falling, which would magnify the negative cash f low, increase the risk of a writedown, and potentially force the company to raise capital.
In Bellamy’s favor, the ‘demand’ side of the equation is still there. With the growth of the Chinese middle class, and a lack of confidence in Chinese infant formula products, Chinese parents still prefer imported formula from safe countries such as Australia. There are, however, many companies wanting a piece of this pie.
Despite Bellamy’s having the great qualities of being Australian and organic, management has kicked some own goals and the company is not positioned well for the challenges ahead.
Given the poor levels of disclosure so far, it’s possible that current guidance may be optimistic, or there may be further issues yet to be disclosed.
There is also the issue of the Chinese government’s tough new food safety laws, which take effect in January 2018. The new laws will require suppliers to obtain a registration and limit them to selling only three brands in China. The changes are expected to significantly reduce the number of brands in China. While this is currently causing some of the oversupply in the market, it may eventually restrict competition – so long as Bellamy’s is successful in getting its registration, of course.
Putting it all together, the company still faces considerable risks and it’s hard to have much confidence in a valuation. As a result, despite the price fall, it’s also hard to pin down a price at which we’d be interested in the stock. AVOID.
Disclosure: The author owns shares in Bellamy’s.
The group of unhappy shareholders includes Jan Cameron (co-founder of Kathmandu), who believes the board has largely dodged responsibility for the company’s predicament. It will be interesting to see if shareholders are willing to align themselves with the mysterious Black Prince foundation that is domiciled in the Caribbean island of Curacao.
The company faces further head winds with the likelihood of class actions being served. It wasn’t until 2 December that Bellamy’s first alerted the market that something was wrong, and that revenue would be f lat. This was despite supermarket data showing that Bellamy’s market share had been reducing throughout the year.
Chart 1 – BAL share price: How are the mighty fallen
Source: S&P Capital IQ
$0
$5
$10
$15
$20
I
Jan 17I
Jul 16I
Jan 16I
Jul 15I
Jan 15
The sig ning of the Fonter ra contract showed that management was expecting revenue growth to continue. When they noticed that revenue wasn’t growing, they should have been aware of the havoc the ‘take or pay’ contract would cause to the company’s financials. Despite this, management remained tight lipped at the 19 October annual meeting and said nothing.
Greener pastures?Can Bellamy’s trade its way out of these difficulties? Yes, it’s possible, but the company needs to increase revenues, which would mean re-engaging with the army of daigou shoppers. Growing revenue would reduce inventories, resulting in
9
S T O C K A R T I C L E
Radiotherapy maker Sirtex Medical’s share price has fallen roughly 45% since early December. We’ve spent the last month pulling on informational threads, adjusting forecasts and throwing out old theories – trying to work out whether the price fall is an opportunity to buy, or an accurate ref lection of the company’s changing prospects.
Key Points
• Large potential market• New competitor no threat• Management actions shake trust
SIRTEX MEDICAL (SRX) / HOLD
Price at review Max. portfolio wght. Business risk Share price risk
$15.73 3% Very High Very High
If Pascal’s Wager teaches us anything, it’s that you shouldn’t only consider the alluring probabilities of being right – you need to weigh that against the consequences of being wrong. With this in mind, let’s examine both Sirtex’s bull and bear cases.
What’s going rightSirtex isn’t your ordinary biotech rabble. Most biotechs on the ASX are still in the research phase of development, whereas Sirtex already has regulatory approval in the US, Europe and Australia.
Better yet, SIR-Spheres – the company’s lone product – has relatively good reimbursement coverage. While doctors are making the clinical decisions, governments and insurers are generally the ones holding the purse strings. Most biotechs – particularly those with an expensive therapy – have trouble getting payers on board, but Sirtex is already out of the woods. Medicare and private insurers cover SIR-Spheres in the US and Australia, and the National Health Service reimburses patients in the UK if they meet certain criteria (the rest of Europe is patchy).
Investors aren’t taking a punt on whether a new therapy could one day bring home the bacon: SIR-Spheres are already
Sirtex Medical: The bull and bear case
BY GRAHAM WITCOMB • INTELLIGENT INVESTOR • 18 JANUARY 2017
generating around $230m in revenue each year (see Is Sirtex’s $20,000 teaspoon enough?). And even if that revenue suddenly evaporated (we’ll get into some of the reasons that might happen in a moment), the company has net cash of $107m, providing a nice cushion. The stock could drop materially from here, but it won’t go to zero.
Big marketWhat’s more, Sirtex is currently serving just a fraction of its potential customers. Let’s do the maths.
Each year, roughly 1.1 million people are diagnosed with liver cancer in Sirtex’s main markets (either primary liver cancer or where it has spread from another organ). Surgery is the favoured treatment, but it’s only suitable for 25% of patients. Other options in the ‘treatment ladder’ include chemotherapy and other drugs (see Chart 1).
A bit under half of those patients diagnosed with liver cancer might benefit from SIR-Spheres, but most patients never receive it. SIR-Spheres are a last resort treatment because they generally only add months to a patient’s life and because they carry a high risk of complications. Sirtex is fighting against time because, sadly, most patients die while taking other therapies. Liver cancer has a 5-year survival rate of just 15%.
But here lies the opportunity. Sirtex sold 11,931 doses in 2016, yet the total potential market is around 488,000. If the company can convince doctors to use SIR-Spheres earlier in the treatment ladder, there’s potential for blockbuster sales growth. The company is currently spending tens of millions on clinical trials to demonstrate that SIR-Spheres are a valuable first-line treatment, and if those trials are successful, the stock could be worth multiples of the current share price.
New competitionIronically, to finish explaining the bull case, we need to touch on why the stock was pummeled by investors in December when the company announced dose sales would grow a lacklustre 4–6% in the first half of the 2017 financial year.
Sirtex investors have been getting whiplash in recent months. Graham Witcomb considers some possible futures for the company.

10
S T O C K A R T I C L E
What is new is the risk of poor management. Management has downgraded growth forecasts twice in eight months, which suggests it has an inclination towards overoptimism.
pool of patients, and that means that small improvements to survival rates higher in the ladder can have a big impact on the number of patients reaching the bottom of the ladder.
It’s also possible that someone develops another direct competitor to SIR-Spheres or that Theraspheres are shown to be more effective. Phase III clinical trials are in progress to examine the effectiveness of Theraspheres when paired with other therapies. If these trials are successful, while Sirtex’s own trials fail, it could mean doctors shift their allegiance to Theraspheres.
That risk, however, is nothing new. What is new is the risk of poor management. Management has downgraded growth forecasts twice in eight months, which suggests it has an inclination towards overoptimism.
Then, last week, the board fired chief executive Gilman Wong after suspicious share trading activity. Wong sold roughly a fifth of his holding in the company last October, just two days after he confirmed prior forecasts for double-digit growth in sales. By avoiding the share price crash that occurred when guidance was revised downwards in December, Wong saved himself around $1m. That doesn’t look good.
Whereas previously we held management in high esteem, our faith has been shaken and that makes us wonder if Lonsurf really is the main cause of slowing sales. Without more thorough prescribing and survival data, we can’t distinguish at this point between slowing growth due to the introduction of Lonsurf or slowing growth due to the company reaching a ceiling in doctor acceptance for SIR-Spheres (which may not improve without the ongoing clinical trials being successful). To some extent, we have to take management’s word.
What’s more, Wong led Sirtex for more than a decade and gradually built his stake in the company. Why sell now? Sirtex has missed sales targets before with accompanying share price falls, so it seems unlikely he would abandon ship over temporary factors. Wong says it was to pay a large tax bill, but we have to wonder whether he sees a long-term change in the company’s fortunes.
Sirtex said the result was due to increasing competition from a new drug. But, here’s the thing: the drug in question, Lonsurf, isn’t a direct competitor to SIR-Spheres in the sense that it’s an oral medication, rather than a microsphere radiotherapy.
Sirtex does have one direct competitor, Theraspheres, but research shows SIR-Spheres to be more effective, so we aren’t too concerned.
Chart 1: Treatment ladder and market size
Source: Sirtex presentation 2012
1,099,000 total liver cancer patients
257,000 patients eligible for surgery
611,000 patients receving palliative treatments e.g chemotherapy,
biologics and Lonsurf
488,000 patients eligible for SIR-Spheres
12,000 doses sold
Lonsurf is also inferior to SIR-Spheres, in that it adds an average of two months to patients’ lives compared to around nine months for SIR-Spheres. What Lonsurf does have going for it, though, is that it’s a convenient oral medication with little risk of complication – and that means it sits higher in the treatment ladder. When Lonsurf hit the market last year, what essentially happened is that the treatment ladder was extended by a rung.
That delay has caused this year’s dose sales to ‘skip a beat’, but – at least in theory – sales should normalise next year.
The Bear CaseThough our current view is that the release of Lonsurf won’t impact Sirtex’s long-term growth potential, it is a reminder of the big risk: new cancer therapies showing up higher in the ladder that are more effective than SIR-Spheres. As a last resort therapy, SIR-Spheres are reserved for a very small

11
S T O C K A R T I C L E
Any investment in Sirtex has a wide range of possible outcomes.
slowing growth is due to a ceiling in acceptance among doctors, rather than the introduction of Lonsurf.
Management expects earnings before interest , ta x , depreciation and amortisation (EBITDA) to be $30m–32m for the six months to December 2016, with consensus estimates for earnings per share of 84 cents in the year to June 2017, putting the stock on a forward price-earnings ratio of around 18.
Although our bull and base case haven’t changed, the potential for a bad outcome has increased and that drags down our overall valuation – not quite as much as the share price fall, but the margin of safety still isn’t there to warrant an upgrade.
With an approved product, $107m of net cash to fund its clinical trial program, and still decent sales growth in the mid-single digits, we’re sticking with HOLD.
Staff members may own securities mentioned in this article.
Though it seems unlikely, we also must factor in the possibility that the chief executive’s departure damages Sirtex’s reputation with clinicians and insurers. There may be operational fallout. The recent share trading f iasco aside, Wong was undoubtedly a master at marketing, and at negotiating with governments and insurers. A sudden management change always adds risk, and Wong’s is quite the skill set to live up to.
Bottom lineSo where does that leave us? Any investment in Sirtex has a wide range of possible outcomes. The bull case scenario – rapid expansion of the market for SIR-Spheres following positive clinical trial data – hasn’t changed much. Indeed, even our base case – reasonable growth prospects, but with SIR-Spheres remaining a last resort therapy – hasn’t been affected by the uptake of Lonsurf.
However, the chances of a severely negative outcome have increased thanks to the possible fallout from the departure of Gilman Wong, the difficulty the board will have finding an equally qualified replacement, and the possibility that
12
S T O C K A R T I C L E
Retail Food Group has been kind to long-term shareholders. Those that bought in the IPO in 2006 have earned 21% a year, before dividends. With an impressive track record, it may come as a surprise that we’re downgrading the stock to Sell. Why the change of heart?
Key Points
• Roll-up risks intensifying• Founding CEO retires• Downgrading to SELL
RETAIL FOOD GROUP (RFG) / SELL
Price at review Max. portfolio wght. Business risk Share price risk
$6.93 3% Medium Medium
BUY HOLD SELL Below $5.00 Above $6.90
$6.93
Retail Food Group has built a $1.22bn business through a ‘roll-up’ strategy, buying in the same industry to increase the market share and earnings of the acquiring entity. Thus far, it’s been successful. Fifteen acquisitions have been made to date without a sniff of a setback.
Added scale has brought other opportunities too, allowing an additional earnings stream supplying roasted coffee beans to its growing list of cafe and bakery franchises. But history suggests roll-ups often end badly. Think ABC Learning and Slater and Gordon. That’s not to say RFG will go the way of these duds, but the risks are increasing.
In the early years, roll-ups work but there’s a finite supply of high-quality businesses to purchase. Inevitably, the number of sensible targets diminishes and the focus turns to bigger acquisitions, with higher risks. This is where Retail Food Group finds itself today.
With operating earnings (before depreciation & amortisation) of $132m, to move the needle the company must make a purchase of upwards of $100m. RFG’s 2014 purchase of Gloria Jeans for $180m and last year’s acquisition of Hudson Pacific for $88m are two cases in point.
Shutting shop on Retail Food Group
BY ALEX HUGHES • INTELLIGENT INVESTOR • 17 JANUARY 2017
But it’s not just about size. A good business and a sensible price are the important prerequisites for a successful acquisition, and the two don’t often align. As the pace of acquisitions increase, the pool of high-quality opportunities diminishes and the price at which they’re available goes up. In the face of pressure to keep growing, it takes managerial skill to not overpay.
Skin in the gameTony Alford, who founded Retail Food Group in 1989 and has been chief executive ever since, stood down in July last year. This is a significant change. The risk in a roll-up strategy run by a major shareholder is far lower than one run by a hired gun on a performance rights package.
New chief executive Andre Nell has been with Retail Food Group since 2007, so he probably understands the culture and businesses well. We have no reason to believe he isn’t a great manager. But it’s hard to replace the level of care that comes with a big shareholding. We all wash our own cars, but no one washes a rental.
There are also several other factors that concern us. The company’s fortune depends on the success of the underlying franchisees. No surprises here. But the reliance on franchisees is compounded by the company’s large wholesale division – the one that sells beans to Gloria Jeans for example. Instead of adding diversification, it magnifies the operating results of the franchisees. Good results for the franchisees mean both divisions fare well but in poor years the double-up dynamic quickly reverses.
Right now, headline results indicate the franchise business is stable. But Retail Food Group continues to increase the amount of loan support to franchisees, and more than half the company’s receivables are past 90 days due. That’s a big red f lag.
There is also the ‘marketing’ fund, discussed in Retail Food Group: Result 2016 and which is used for a lot more than marketing. Last time we checked, cushioning franchisees from a supplier failure isn’t marketing.
These facts don’t sit well with us and, with 19 other businesses on our Buy List, we prefer to stick to those we are comfortable with. SELL .
Changes at Retail Food Group have led to uncomfortable risks.
13
S T O C K A R T I C L E
Shutting shop on Retail Food GroupNormally we don’t place too much emphasis on senior management changes, especially at high-quality businesses. That remains the case at Carsales.com, which we continue to think is the sort of business you should have in your portfolio. We recommended the stock most recently in November in Carsales’ core business motoring (Buy – $9.93) although, with the price up 11% since then, we’ve returned it to Hold.
Key Points
• Co-founder Greg Roebuck retiring• Smooth transition to existing COO• Risks higher over next 18 months
CARSALES.COM (CAR) / HOLD
Price at review Max. portfolio wght. Business risk Share price risk
$11.01 6% Medium Med–High
BUY HOLD SELL Below $10.00 Above $15.00
$11.01
And yet, today’s announcement of the departure of managing director Greg Roebuck in March is still cause for comment. Roebuck co-founded Carsales in 1997 (although his 4.9m shares in the company is a relatively small 2% stake). He’s been managing director since 2002 so his retirement is definitely a loss to the company.
If we were suspicious – and as an analyst it pays to be – we’d think the timing curious. While Carsales’ core business is indeed motoring, it’s unlikely to be the strong growth company it once was. Even this year we suspect consensus 2017 earnings per share forecasts of 50-odd cents are too high.
As mentioned in Carsales’ Stratton splutters, we have another couple of niggles. Sites like Gumtree are more of a threat for Carsales than for other online classifieds businesses. A cyclical downturn – Carsales sells advertising, after all – is also possible at some point.
The company has already announced it will write down its investment in iCar Asia by about $7m, although we suspect Stratton has been more damaged by the ASIC investigation into a lender on its panel than the company has yet admitted. Stratton could be the next writedown.
Carsales changes driversBY JAMES GREENHALGH • INTELLIGENT INVESTOR • 19 JANUARY 2017
Tears after fears?None of these are new fears – we’ve been talking about them for months now. And, to be completely clear, they are fears – perhaps we’re being unduly pessimistic. Carsales is an excellent business and still deserves a place in most portfolios (at the right price, and depending on your other exposure to advertising-related businesses, of course).
But Roebuck’s departure must be considered a red flag. While he will be retained by the company as a consultant, he won’t join the board (many consider former chief executives immediately becoming directors a corporate governance no-no, although not necessarily us). He will be completely free to sell some or all of his shares if he foresees problems on the horizon.
On the bright side, Cameron McIntyre looks like a good choice to take over. He joined the company as chief financial officer in 2007 and became chief operating officer in 2014. McIntyre announced on the conference call that the strategy was unlikely to change significantly so it should be a smooth transition. McIntyre’s appointment should help maintain Carsales’ culture.
Never certainOf course, if you were worried about every corporate change or problem, you’d never buy any stock (and you’d certainly never find a bargain). There’s always a reason to worry and shareholders never have complete information.
We can, however, f lag that the risks of bad news for Carsales over the next 18 months have probably risen. It will be interesting to see McIntyre’s attitude to shareholder communication; it wasn’t really a strong point of Roebuck’s, but then again the company’s strong record spoke for itself. Roebuck isn’t leaving until March, so the 8 February interim results will be his to present.
The market obviously shares some of our concerns, with the stock falling 2% today in a stronger market. We suggest you stick strictly to our 6% suggested maximum portfolio weighting but the stock remains a HOLD.
Note: The Intelligent Investor Growth and Equity Income portfolios own shares in Carsales. You can find out about investing directly in Intelligent Investor and InvestSMART portfolios by clicking here.
Staff members may own securities mentioned in this article.
Co-founder Greg Roebuck is stepping down as managing director, to be replaced by chief operating officer Cameron McIntyre. Is it time to worry?

14
I N S I G H T S
I’m no fan of real estate agents. Having sold two homes and bought two in Sydney over the past four years, I’ve seen the best and worst of the industry. And let’s just say the industry is weighted to the ‘worst’.
The industry’s problem is that the incentives are all wrong. When you appoint an agent based on a f lat commission – the usual arrangement – his or her incentive is to sell your property as quickly as possible.
For example, a $1m house in Sydney, at a 2% commission, would earn a real estate agent $20,000 on settlement. Not bad for opening the door, taking down 50 or so names, and calling them back to gauge interest.
Let’s say a buyer is willing to pay $1.02m for that house. But the extra $20,000 of value (or rather, price) would only earn the agent an additional $400 in commission. It’s barely worth their time to push that buyer to pay more.
Yet many vendors labour under the illusion that their agent will try to get them the best possible price. The vendors of the house we just bought would be shocked to know what our limit was: significantly more than we actually paid. Despite giving the vendor’s agent more information about our budget than was probably prudent, he was clearly only interested in executing the transaction rather than maximising the price.
It’s no wonder a lot of people don’t trust the real estate industry. You might think the solution would be to use a real estate agency discounter, a relatively new phenomenon in Australia.
Purplebricks’ patchUK company Purplebricks has just announced it is setting up shop here, its f irst international market. For an all-inclusive private treaty price of $5,500 in Sydney – including advertising on www.realestate.com.au and www.domain.com.au – a Purplebricks agent will sell your house.
You cou ld a lso do it you rsel f using a website l i ke www.propertynow.com.au or www.buymyplace.com.au
Why Purplebricks isn’t the best way to sell your house
BY JAMES GREENHALGH • INTELLIGENT INVESTOR • 17 JANUARY 2017
(listed on the ASX under the code BMP). With many real estate agents making obscene amounts of money for not doing much, it seems the industry is ripe for disruption with discounters like Purplebricks or do-it-yourself sites.
I’m not so sure, at least not if you want to maximise your sale price. If you’re just interested in selling quickly, or have a standard property, then maybe one of these options might be right for you.
But I won’t be using them if I need to sell again (which, hopefully, I won’t). Instead, I’ ll make sure the incentives work for me rather than against me. How so?
Well, for both sales over the past four years, I negotiated an incentive commission structure with my agent (in fact, asking an agent whether they will accept an incentive commission at the interview is a good way to weed out the poor salespeople).
It will only work if you make it worth the real estate agent’s while. The agent won’t accept a structure where they’re unlikely to make more than their f lat commission on the transaction. The key is to incentivise them to negotiate a higher price.
Be realisticTake the $1m house and 2% f lat commission mentioned earlier. Let’s say you think $1.05m is achievable (you need to do your research and be realistic; you’re not going to get $1.2m if three agents have valued it at around $1m).
The key is to make it very profitable for the agent to negotiate that additional $50,000. So you could propose an incentive commission of, say, 1% for a price of $900,000, then 10% of any amount achieved above that.
At $1m, they’ll make about the same amount as a f lat 2% commission (actually slightly less – $19,000). But if the agent gets $1.05m for you, they get significantly more - $24,000). A good salesperson will jump at this chance if they think the price is achievable.
Understanding the incentives in the real estate industry will help you get a better price for your house. Using a discounter won’t.

15
S T O C K A R T I C L E
In my case, I proposed a 15% commission above my floor price. In both sales I achieved a significantly higher price than expected.
While I don’t relish the idea of making rich real estate agents richer, I think selling your house is one area where it might be false economy to save a few (thousand) dollars.
With a good negotiator on your side – and the right incentives in place – you might be surprised at the final price. And when it comes to Sydney property, that can be quite some difference.
It can end up being extremely lucrative for both vendor and agent. In my case, I proposed a 15% commission above my f loor price. In both sales I achieved a significantly higher price than expected. And the agent’s total commission was around 50% higher than a f lat rate would have been. My agent loves me, you won’t be surprised to know.
Unfortunately, if you use Purplebricks or some other discounter, you probably forgo this potential upside.
To use this method, you’ll need to have a good idea of the value of your house, and you’ll also need an agent who is a good negotiator. Your house probably needs some ‘wow factor’ (we hired a house stylist), and I’m sure Sydney’s bull market also helped in our case.
16
S T O C K A L E R T S
CSL upgrades profit guidanceBY GRAHAM WITCOMB • INTELLIGENT INVESTOR • 19 JAN 2017
CSL (CSL) / HOLD
BUY HOLD SELL Below $80.00 Above $150.00 Price at review Max. portfolio wght.
$109.18 6% $109.18
CSL has increased its forecast for net profit in the 2017 financial year. Management previously expected net profit to rise by 11% in the year to June 2017 but now expects it to rise by 18–20%. The company said strong sales in antibody and specialty products is the main reason, with net profit of US$800m now expected for the six months to December 2016 (the company reports its interim result on 15 February). The stock is up about 10% today and about the same since our last update in November. The stock sports a forward price-earnings ratio of 25 and, with plenty of competitive advantages and a clean balance sheet, we’re sticking with HOLD.
Staff members may own securities mentioned in this article.
Nanosonics posts strong salesBY GRAHAM WITCOMB • INTELLIGENT INVESTOR • 16 JAN 2016
NANOSONICS (NAN) / HOLD
BUY HOLD SELL Price at review Max. portfolio wght.
$3.10 2%
Nanosonics has announced a strong quarterly sales result with revenue of $18.3m for the three months to 31 December. That brings total sales for the first half of the financial year to $36.1m, up 131% compared to the prior corresponding period and 32% compared to the second half of the 2016 financial year. Management, which has a knack for marketing, likes to f lip-f lop between referencing the prior corresponding period and the directly preceding period depending on what’s more favorable, so you can guess which figure was mentioned in the ASX announcement.
Either way, it was a great result, and especially pleasing that the sales growth was accompanied by roughly $2.8m in free cash f low. The company said the result was driven by strong sales in North America, where the installed base of Trophon units increased 60% to 10,700. The total worldwide base now sits at around 12,300 units.
The Nanosonics story remains on track and the company’s cash balance of $57m means it has plenty of funding for its immediate growth plans. The stock has nearly quadrupled since we first upgraded it in Nanosonics builds a better mousetrap on 9 Mar 14 (Speculative Buy – $0.785).
We continue to recommend taking profits as the share price increases and note our maximum portfolio weighting of 2%. HOLD.
Note: Our model Growth Portfolio owns shares in Nanosonics.
Disclosure: The author owns shares in Nanosonics.
17
Q & A
Stocks to protect from inflationI a m e x p e c t i n g i n c r e a s e d inf lation this year. It will likely be accompanied by, but not dependent on , a fall in the AUD. I would appreciate your ideas on which ASX shares will provide the best protection/prof it from a general rise in the level of inf lation.
20 Jan 2017 – James Carlisle: You haven’t said you’re doing this, but for others reading, it’s worth starting by saying that I’d be careful not to invest on the basis of a single short-term theme. It’s long-term value that matters, and that’s inf luenced by a whole host of factors, inf lation being just one of them.
That said, the sort of companies that are well protected against inf lation are the sort that demonstrate pricing power – which can increase the price of their product at least as fast as any increases in their cost, without disr upting demand. Retai lers, for ex a mple , m i g ht st r u g g le i n t h is environment, but companies like CSL, Computershare, Ramsay Health Care, ASX , Transurban, Sydney A irport , ResMed, Sonic Healthcare, Cochlear, Rea Group, Seek, Trade Me, Carsales, I’d expect to do OK, to name a few.
The trouble is that with rising inflation comes rising interest rates, which might take the shine off stocks that are mainly bought for yield - eg ASX, Transurban, Sydney Airport - since as long-term rates rise, so will the yields of those stocks (thereby reducing their price). (As I mentioned before, it’s important not to focus too much on individual themes.) Some companies, though, can benefit directly from rising interest rates, such as Computershare, which earns interest on its (substantial) balances of client funds.
The other point you mention is a weaker Australian dollar, and to protect against that you’d want to invest in companies with large contributions of overseas sales and, better still, large contributions of local costs. From the above list ,
companies that stand out in this respect would be CSL, Computershare, Ramsay, ResMed and Cochlear (Trade Me too, but it’s exposed to the NZ$, which might move alongside the A$).
The final point, though, is to note that all this is know to the market, which is generally much better at pricing in short-term factors than long-term. So you have to bring the price of the stock into the equation – which is what value investing is all about. That thins down the list to the point that there’s nothing left. We have Buy recommendations on ASX, Sydney Airport and Trade Me, but they fall down on one or other of your specific points. Again, I’d reiterate the key point that it’s always a balance of all factors against the price you’re paying. A stock can carry a lot of warts if you’re not paying a lot for it; but at the other end of the scale a very expensive stock may offer little margin of safety no matter it’s prospects.
II vs InvestSMART portfolio performanceWhy do the Intelligent investor m o d e l p o r t fo l i o s o u t p e r fo r m th e Inve st sm a r t por t fol i os s o dramatically? ( IInv 13.91 and 14.33 v Ismart growth 6.37 and income 3.61)?
18 Jan 2017 – James Carlisle: I think the first point to make is that your question should read ‘why have ...’ not ‘why do ...’. Just because the Intelligent Investor (II) portfolios have outperformed so far does not mean they will continue to do so.
The fact is that there are big differences between the II and the InvestSMART (IS) diversified portfolios, so there’s likely to be a big difference in their performance from time to time (but not necessarily positive). For starters, the II portfolios are (but for a few per cent in cash) entirely invested in equities, whereas the IS portfolios are exposed to other asset classes, such as fixed interest and cash – and in the past 18 months the sharemarket has done relatively well.
What’s more, the II portfolios have a slight bias away from the largest stocks (they don’t hold much of the big banks for example), and that end of the market has done particularly well (although the big end of the market has been making a comeback recently). Finally, of course, the II portfolios are actively managed, and the stocks we’ve picked for them have done pretty well overall.
Of course there will be times when shares do relatively poorly, particularly out side t he bi g ge st st o ck s , a nd particularly for our selections – and at these times the IS portfolios will no doubt do better. But to use a well-worn phrase it’s a marathon not a sprint and we’re confident that the II selections will do well over the long term (they’ve done pretty well over the last 15 years) – but they’ll do so with more volatility than the IS portfolios.
Price guides on LICsWhy no Buy, Hold, Sell prices on LIC’s like Argo etc?
19 Jan 2017 – Mitchell Sneddon: We don’t put price guides on listed investment companies (LICs) because whether the LIC is a Buy, Hold or Sell at a particular t ime depends on the d iscount or premium to which the LIC’s share price is trading compared to the value of its underlying portfolio (or NTA per share). The latter is updated monthly (and sometimes weekly and even daily) and reported to the ASX.
As the share price and NTA per share of each LIC move around frequently, we would be constantly adjusting the price guide if we did include one for each LIC. As such, our view is that it is better to know which LICs you like and monitor their share prices compared to their NTA per share.
Being value investors, we of course want to buy something for less than what it’s worth and, in the case of LICs, also require a discount to compensate us for the fees charged by the underlying manager (which mean your returns will be less than those of the underlying portfolio).

w w w.investsmart .com.au | w w w.intelligentinvestor.com.au | w w w.eurekareport .com.au