sterile neutrinos as wdm and the 3.5 kev x-ray line
TRANSCRIPT

Sterile neutrinos as WDM and the 3.5 keV x-rayline
Alexey Boyarsky
Neutrino 2016. July 8

Evidence for Dark Matter
Stellar Disk
Dark Halo
Observed
Gas
M33 rotation curve
Expected: v(R) ∝ 1√R
Observed: v(R) ≈ const
Expected:masscluster =P
massgalaxies
Observed: 102 timesmore mass confiningionized gas
Lensing signal (directmass measurement)confirms otherobservations
Jeans instabilityturned tiny densityfluctuations into allvisible structures

Cosmological evidence for dark matter
I We see the structures in the Universe whenit was only 380 000 years old (encoded inthe anisotropies of the temperature of thecosmic microwave background)
I All the today’s structures are producedfrom tiny density fluctuations due togravitational Jeans instability
At CMB δρ/ρ ∼ 10−5, then grow δρ/ρ ∼ a (matter domination)atoday
adec= 1 + zdec ∼ 103 Not enough!
Some matter-like substance decoupled from photon gas should have beenpresent in the Universe at the time of decoupling

Is this neutrino Dark Matter?
I S. Tremaine and J. Gunn Phys. Rev. Lett. ( 1979)I The smaller is DM particle mass, the more particles is needed for a
given galaxy.I Fermions: phase-space number density should be smaller than that
of degenerate Fermi gas
⇒ If dark matter is made of fermions – its mass is bounded from below:
Mgal
4π
3R3
gal
14π
3v3∞
≤ 2mDM4
(2π~)3
I Objects with highest phase-space density – dwarf spheroidal galaxies– lead to the lower bound on the fermionic DM mass
mDM & 300− 400 eV

Neutrino dark matter
I However, if you compute contribution to DM density from massiveactive neutrinos (mν . MeV ), you get
Ων DMh2 =∑
mν
∫d3k
(2π)3
1
ekT + 1
=
∑mν [eV ]
94eV
I Using minimal mass of 300eV you get ΩDMh2 ∼ 3 (wrong byabout a factor of 30!)
I Sum of masses to have the correct abundance∑
mν ≈ 11eV
Massive Standard Model neutrinos cannot be simultaneously “as-trophysical” and “cosmological” dark matter: to account for themissing mass in galaxies and to contribute to the cosmological ex-pansion
Today this is confirmed by CMB, LSS and neutrino experimental data

Two generalizations of neutrino DM
Dark matter cannot be both light and weakly interacting at thesame time
Two classes of alternatives:
Light yet super-weakly inter-acting
I Can be light (down to
Tremaine-Gunn bound)
I Can be warm (born relativistic
and cool down later)
I Can be decaying (stability is not
required)
Heavy and therefore weaklyinteracting — WIMP
I shall not speak about it

Example: sterile neutrino dark matter
I For the early Universe, sterile neutrino is similar to the SM neutrino,but has en effective coupling constant ϑGF .
I Sterile neutrino is unstable (N → ννν)
I Subdominant (Br ∼ 1123 ) decay channel: N → ν + γ
νNs
e± ν
W∓
γW∓
ΓN→νγ =9αG 2
F
256π4ϑ2M5
N
Eγ =1
2MN
I Expect a signal from any large concentration of dark matter (galaxy,galaxy group, galaxy cluster)

Resonant enhancement
0.0 0.5 1.0 1.5 2.0 2.5 3.00.0
0.5
1.0
1.5
2.0
2.5
3.0
Momentum pM
EnergyE
HpLM
Resonant case
Shi & Fuller [astro-ph/9810076]
I In the presence of largelepton asymmetry theMSW resonance cantake place andproduction of sterileneutrinos becomes muchmore effective
10-5
10-4
10-3
10-2
0 1 2 3 4 5 6 7q
2 f
(q)
q = p/Tν
Non-resonantcomponent
Resonantcomponent
L6 = 16Ms = 3 keV
Laine & Shaposhnikov [0804.4543]
I The condition for resonance occursonly for specific values of momentum pand during limited period of time.

Warm dark matter (WDM)
I Particles are born relativistic⇒ they do not cluster
I Relativistic particles freestream out of overdenseregions and smooth primordialinhomogeneities
Overdensity
– Free-streaming scale:
λcoFS =
∫ t
0
v(t ′)dt ′
a(t ′)= 1 Mpc
(keV
Msterile
)
Particle velocities means that warm dark matter has effective pres-sure that prevents small structure from collapsing
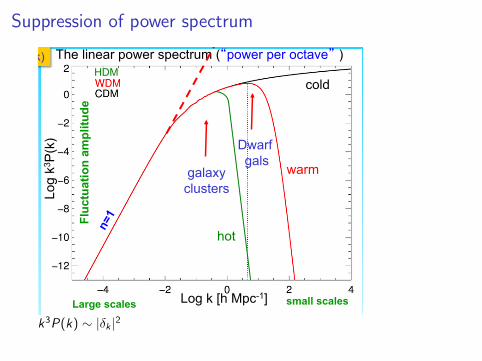
Suppression of power spectrumUniversity of Durham
Institute for Computational Cosmology
The dark matter power spectrum
Free streaming à
λcut α mx-1
for thermal relic
mCDM ~ 100GeV susy; Mcut ~ 10-6 Mo
mWDM ~ few keV sterile ν; Mcut~109 Mo
mHDM ~ few eV light ν; Mcut~1015 Mo
The linear power spectrum (“power per octave” )
warm
cold
Dwarf gals
galaxy clusters
hot
k3 P(k) HDM
Large scales small scales
Fluc
tuat
ion
ampl
itude
Log k [h Mpc-1]
Log
k3P
(k)
1
k3P(k) ∼ |δk |2
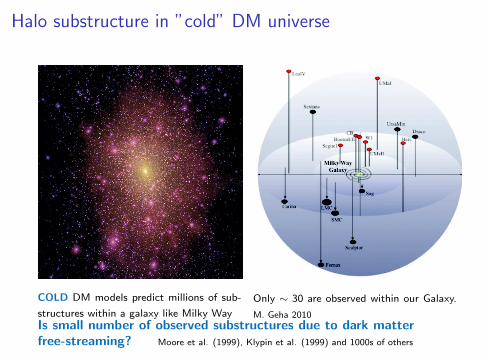
Halo substructure in ”cold” DM universe
COLD DM models predict millions of sub-
structures within a galaxy like Milky Way
Only ∼ 30 are observed within our Galaxy.
M. Geha 2010Is small number of observed substructures due to dark matterfree-streaming? Moore et al. (1999), Klypin et al. (1999) and 1000s of others

Halo substructure in ”warm” DM universe
Simulated HNL dark matter halo is compatible with the Lyman-αforest data but provides a structure of Milky way-size halo differentfrom CDM
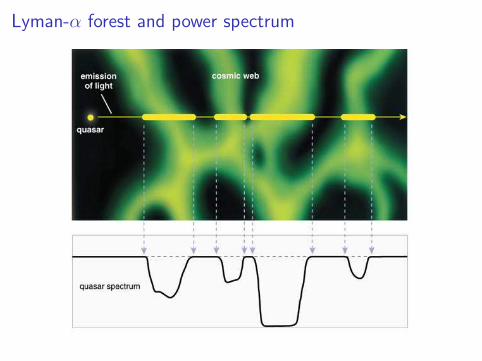
Lyman-α forest and power spectrum

Lyman-α forest data
0 1000 2000 3000 4000 5000vel (km/s)
0.0
0.2
0.4
0.6
0.8
1.0
flu
x
ΛCDMWDM 2 keVWDM 1 keV
10-4
10-3
10-2
10-1
100
101
102
103
104
10-4 10-3 10-2 10-1 100 101
P(k
) [(
Mp
c/h
)3 ]
k [h/Mpc]
CDM
WDM ⇒
0.001 0.010 0.100 k (s/km)
0.01
0.10
1.00
∆2
F(k
)z=2.2
z=2.4
z=2.6
z=2.8
z=3
z=3.2
z=3.4z=3.6z=3.8
z=4.0
z=4.2
z=4.6
z=5
z=5.4
cosmic time: 1.1-3.1 Gyr
cosmic scales: 0.5/h-50/h com. Mpc
SDSS
MIKE&HIRES
best fit ΛCDM
WDM 2.5 keV
Warm dark matter predicts suppression (cut-off) in the flux powerspectrum derived from the Lyman-α forest data

Suppression in the flux power spectrum
0.001 0.010 0.100 k (s/km)
0.01
0.10
1.00
∆2F(k
)
z=2.2
z=2.4
z=2.6
z=2.8
z=3
z=3.2
z=3.4z=3.6z=3.8
z=4.0
z=4.2
z=4.6
z=5
z=5.4
cosmic time: 1.1-3.1 Gyr
cosmic scales: 0.5/h-50/h com. Mpc
SDSS
MIKE&HIRES
best fit ΛCDM
WDM 2.5 keV
Suppression in the flux powerspectrum may be due to
I Pressure (Jeansbroadening) – preventsclustering
I Temperature (Doppler
broadening√
2kTmp
) –
increases hydrogenabsorption line width
I Warm dark matter
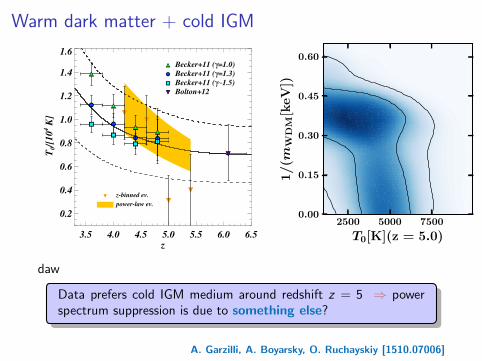
Warm dark matter + cold IGM
3.5 4.0 4.5 5.0 5.5 6.0 6.5z
0.2
0.4
0.6
0.8
1.0
1.2
1.4
1.6 T
0/[
10
4 K
]
power-law ev.
z-binned ev.
Becker+11 (γ=1.0)
Becker+11 (γ=1.3)
Becker+11 (γ∼1.5)
Bolton+12
7500 10000 12500
T0[K](z = 4.2)
0.00
0.15
0.30
0.45
0.60
1/(m
WD
M[k
eV
])
7500 10000 12500
T0[K](z = 4.6)
0.00
0.15
0.30
0.45
0.60
1/(m
WD
M[k
eV
])
2500 5000 7500
T0[K](z = 5.0)
0.00
0.15
0.30
0.45
0.60
1/(m
WD
M[k
eV
])
5000 10000 15000 20000
T0[K](z = 5.4)
0.00
0.15
0.30
0.45
0.60
1/(m
WD
M[k
eV
])
daw
Data prefers cold IGM medium around redshift z = 5 ⇒ powerspectrum suppression is due to something else?
A. Garzilli, A. Boyarsky, O. Ruchayskiy [1510.07006]

Alternative way to measure temperature
Antonella Garzilli - Leiden University
r2kBT
mH
H(z)F
IGM temperature from line broadening
Garzilli, Theuns, Schaye MNRAS 450, 2 (2015)

Decaying dark matter
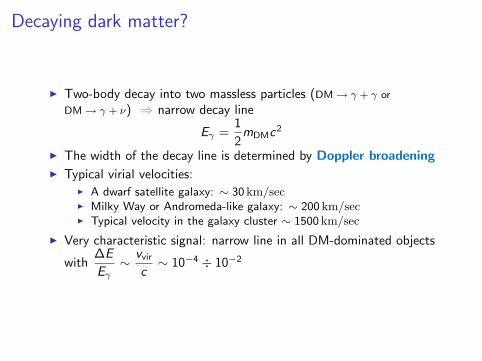
Decaying dark matter?
I Two-body decay into two massless particles (DM→ γ + γ or
DM→ γ + ν) ⇒ narrow decay line
Eγ =1
2mDMc2
I The width of the decay line is determined by Doppler broadeningI Typical virial velocities:
I A dwarf satellite galaxy: ∼ 30 km/secI Milky Way or Andromeda-like galaxy: ∼ 200 km/secI Typical velocity in the galaxy cluster ∼ 1500 km/sec
I Very characteristic signal: narrow line in all DM-dominated objects
with∆E
Eγ∼ vvir
c∼ 10−4 ÷ 10−2

Search for decaying dark matter
DM decay signal from a galaxy DM annihilation signal from a galaxy

Restrictions on life-time of decaying DMSee A White Paper on keV Sterile Neutrino Dark Matter [1602.04816]
Life
-tim
e τ
[sec
]
MDM [keV]
1025
1026
1027
1028
1029
10-1 100 101 102 103 104
XMM, HEAO-1 SPI
τ = Universe life-time x 108
Chandra
PSD
exc
eeds
deg
ener
ate
Fer
mi g
as
0.01 0.1 1 10 102
103
104
1026
1027
1028
mΦ @MeVDΤ
@sec
D
Φ®ΓΓ
HEAO-1
INTEGRAL
COMPTEL
EGRET
FERMI
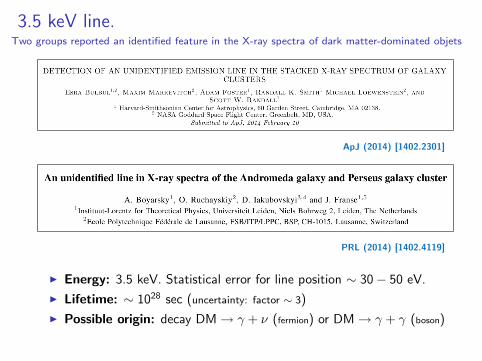
3.5 keV line.Two groups reported an identified feature in the X-ray spectra of dark matter-dominated objets
ApJ (2014) [1402.2301]
PRL (2014) [1402.4119]
I Energy: 3.5 keV. Statistical error for line position ∼ 30− 50 eV.
I Lifetime: ∼ 1028 sec (uncertainty: factor ∼ 3)
I Possible origin: decay DM→ γ + ν (fermion) or DM→ γ + γ (boson)

Subsequent worksFor overview see e.g. [1602.04816] “A White Paper on keV Sterile Neutrino Dark Matter”
I Subsequent works confirmed the presenceof the 3.5 keV line in some of the objectsBoyarsky et al., Iakubovskyi et al.; Franse et al.;
Bulbul et al.; Urban et al.; Jeltema & Profumo
I challenged it existence in other objectsMalyshev et al.; Anderson et al.; Tamura et al.;
Sekiya et al.
I argued astrophysical origin of the lineGu et al.; Carlson et al.; Jeltema & Profumo;
Riemer-Sørensen; Phillips et al.
A common explanation for every detectionand non-detection?
I When comparing bounds from different objects one should be careful –
uncertainty in the dark matter content in each of them results in large

Dark matter is universal
Dark matter is a universal substance, present in everygalaxy (spiral, elliptical, dwarf spheroidal) and everygalaxy clusterFrom the point of view of astrophysical processes these objects are verydistinct!

Analysis of Draco dSph[1512.07217]
I The line is detected in thespectrum of Draco dSph withlow (2σ) significance
I Line flux/position are consistentwith previous observations
I There is a shift in position(∼ 1σ) between twoXMM-Newton detectors (which
happens for weak lines)
I The data is consistent with DMinterpretation for lifetimeτ > (7−9)× 1027 sec
I Compared to [1512.01239] we do
data processing differently and use a
more sophisticated background
model.
Flux [cts/sec/cm2]
Line position [keV]
0.0x100
5.0x10⁻⁷
1.0x10⁻⁶
1.5x10⁻⁶
2.0x10⁻⁶
2.5x10⁻⁶
3.0x10⁻⁶
3.5x10⁻⁶
4.0x10⁻⁶
4.5x10⁻⁶
3.48 3.5 3.52 3.54 3.56 3.58 3.6
M31
GC
Distant clusters (MOS)
Distant clusters(PN)
All clusters(MOS)
Best-fit Draco PN
PN camera flux [cts/sec/cm2]
Line position [keV]
∆χ2 = 1
∆χ2 = 4
∆χ2 = 9
0.0x100
5.0x10⁻⁷
1.0x10⁻⁶
1.5x10⁻⁶
2.0x10⁻⁶
2.5x10⁻⁶
3.0x10⁻⁶
3.5x10⁻⁶
3.46 3.48 3.5 3.52 3.54 3.56 3.58 3.6 3.62 3.64
M31
GC
Distant clusters
Distant clusters(PN)
All clusters(MOS)
Best-fit Draco MOS1+MOS2+PN

Next step for 3.5 keV line: Astro-H
I Astro-H – new generation X-rayspectrometer with a superb spectralresolution
I Launched 17 February 2016
I Calibration phase – about 1 year
I First observational/calibration target –Perseus galaxy cluster, where strong3.5 keV line has been detected
I Expected to be able to confirm thepresence of the 3.5 keV line in Perseusand distinguish it from atomic elementlines (Potassium, Chlorium, etc.)
0
1
2
3
4
5
6
7
8
9
10
400 450 500 550 600 650 700
Cou
nt r
ate,
arb
. uni
ts
Energy [eV]
XMM spectrumResolved spectrum
3 3.2 3.4 3.6 3.85×10
−410
−31.
5×10
−3
Flux
(ph
cm-2s
-1keV
-1)
Energy (keV)
Astro-H SXSPerseus, 1 MseckT = 6.5 keV, 0.6 solarz=0.0178v(baryons) = 300 km/sv(line) = 1300 km/s
3.55 keV Line
Ar XVII
Ar XVIII
Ca XIX3.62 keVAr XVII DR

HOWEVER

Status of Astro-H/Hitomi4.1 PresumedMechanism(Summary)(From“Normalsituation”tothe“AttitudeanomalyEvent”,and“Objectsseparation”)
29(*)Unloading䠖Operation to decrease the momentum kept in RW within the range of designed range.
凚凣凛 㻻㼚 㻹㼍㼞㼏㼔 㻞㻢㼠㼔㻘 㼍㼠㼠㼕㼠㼡㼐㼑 㼙㼍㼚㼑㼡㼢㼑㼞 㼠㼛 㼛㼞㼕㼑㼚㼠 㼠㼛㼣㼍㼞㼐 㼍㼚 㼍㼏㼠㼕㼢㼑 㼓㼍㼘㼍㼏㼠㼕㼏 㼚㼡㼏㼘㼑㼡㼟 㼣㼍㼟 㼏㼛㼙㼜㼘㼑㼠㼑㼐 㼍㼟㼜㼘㼍㼚㼚㼑㼐㻚
凚凤凛㻭㼒㼠㼑㼞 㼠㼔㼑 㼙㼍㼚㼑㼡㼢㼑㼞㻘 㼡㼚㼑㼤㼜㼑㼏㼠㼑㼐 㼎㼑㼔㼍㼢㼕㼛㼞 㼛㼒 㼠㼔㼑 㼍㼠㼠㼕㼠㼡㼐㼑 㼏㼛㼚㼠㼞㼛㼘 㼟㼥㼟㼠㼑㼙 㻔㻭㻯㻿㻕 㼏㼍㼡㼟㼑㼐 㼕㼚㼏㼛㼞㼞㼑㼏㼠㼐㼑㼠㼑㼞㼙㼕㼚㼍㼠㼕㼛㼚 㼛㼒 㼕㼠㼟 㼍㼠㼠㼕㼠㼡㼐㼑 㼍㼟 㼞㼛㼠㼍㼠㼕㼚㼓㻘 㼍㼘㼠㼔㼛㼡㼓㼔 㼠㼔㼑 㼟㼍㼠㼑㼘㼘㼕㼠㼑 㼣㼍㼟 㼚㼛㼠 㼞㼛㼠㼍㼠㼕㼚㼓 㼍㼏㼠㼡㼍㼘㼘㼥㻚 㻵㼚 㼠㼔㼑 㼞㼑㼟㼡㼘㼠㻘㼠㼔㼑 㻾㼑㼍㼏㼠㼕㼛㼚 㼃㼔㼑㼑㼘 㻔㻾㼃㻕 㼠㼛 㼟㼠㼛㼜 㼠㼔㼑 㼞㼛㼠㼍㼠㼕㼛㼚 㼣㼍㼟 㼍㼏㼠㼕㼢㼍㼠㼑㼐 㼍㼚㼐 㼘㼑㼍㼐 㼠㼛 㼠㼔㼑 㼞㼛㼠㼍㼠㼕㼛㼚 㼛㼒 㼟㼍㼠㼑㼘㼘㼕㼠㼑㻚傜㻼㼞㼑㼟㼡㼙㼑㼐 㻹㼑㼏㼔㼍㼚㼕㼟㼙 㻝傝
凚凥凛㻵㼚 㼍㼐㼐㼕㼠㼕㼛㼚㻘 㼡㼚㼘㼛㼍㼐㼕㼚㼓㻔㻖㻕 㼛㼒 㼍㼚㼓㼡㼘㼍㼞 㼢㼑㼘㼛㼏㼕㼠㼥 㼎㼥 㻹㼍㼓㼚㼑㼠㼕㼏 㼀㼛㼞㼝㼡㼑㼞 㼛㼜㼑㼞㼍㼠㼑㼐 㼎㼥 㻭㻯㻿 㼐㼕㼐 㼚㼛㼠 㼣㼛㼞㼗㼜㼞㼛㼜㼑㼞㼘㼥 㼎㼑㼏㼍㼡㼟㼑 㼛㼒 㼠㼔㼑 㼍㼠㼠㼕㼠㼡㼐㼑 㼍㼚㼛㼙㼍㼘㼥㻚 㼀㼔㼑 㼍㼚㼓㼡㼘㼍㼞 㼙㼛㼙㼑㼚㼠㼡㼙 㼗㼑㼜㼠 㼍㼏㼏㼡㼙㼡㼘㼍㼠㼕㼚㼓 㼕㼚 㻾㼃㻚傜 㻼㼞㼑㼟㼡㼙㼑㼐 㻹㼑㼏㼔㼍㼚㼕㼟㼙 㻞傝
䠄䠐䠅㻶㼡㼐㼓㼕㼚㼓 㼠㼔㼑 㼟㼍㼠㼑㼘㼘㼕㼠㼑 㼕㼟 㼕㼚 㼠㼔㼑 㼏㼞㼕㼠㼕㼏㼍㼘 㼟㼕㼠㼡㼍㼠㼕㼛㼚㻘 㻭㻯㻿 㼟㼣㼕㼠㼏㼔㼑㼐 㼠㼛 㻿㼍㼒㼑 㻴㼛㼘㼐 㼙㼛㼐㼑 㻔㻿㻴㻕㻘 㼍㼚㼐 㼠㼔㼑㼠㼔㼞㼡㼟㼠㼑㼞㼟 㼣㼑㼞㼑 㼡㼟㼑㼐㻚 㻭㼠 㼠㼔㼕㼟 㼠㼕㼙㼑 㻭㻯㻿 㼜㼞㼛㼢㼕㼐㼑㼐 㼍㼠㼥㼜㼕㼏㼍㼘 㼏㼛㼙㼙㼍㼚㼐 㼠㼛 㼠㼔㼑 㼠㼔㼞㼡㼟㼠㼑㼞㼟 㼎㼥 㼠㼔㼑㼕㼚㼍㼜㼜㼞㼛㼜㼞㼕㼍㼠㼑 㼠㼔㼞㼡㼟㼠㼑㼞 㼏㼛㼚㼠㼞㼛㼘 㼜㼍㼞㼍㼙㼑㼠㼑㼞㼟㻚 㻭㼟 㼍 㼞㼑㼟㼡㼘㼠㻘 㼕㼠 㼠㼔㼞㼡㼟㼠㼑㼐 㼕㼚 㼍㼚 㼡㼚㼑㼤㼜㼑㼏㼠㼑㼐 㼙㼍㼚㼚㼑㼞㻘 㼍㼚㼐 㼕㼠 㼕㼟㼑㼟㼠㼕㼙㼍㼠㼑㼐 㼠㼔㼍㼠 㼠㼔㼑 㼟㼍㼠㼑㼘㼘㼕㼠㼑 㼞㼛㼠㼍㼠㼕㼛㼚 㼣㼍㼟 㼍㼏㼏㼑㼘㼑㼞㼍㼠㼑㼐㻚 䛆 㻼㼞㼑㼟㼡㼙㼑㼐 㻹㼑㼏㼔㼍㼚㼕㼟㼙 㻟䛇
凚凧凛㻿㼕㼚㼏㼑 㼠㼔㼑 㼞㼛㼠㼍㼠㼕㼛㼚 㼟㼜㼑㼑㼐 㼛㼒 㼠㼔㼑 㼟㼍㼠㼑㼘㼘㼕㼠㼑 㼑㼤㼏㼑㼑㼐㼑㼐 㼠㼔㼑 㼐㼑㼟㼕㼓㼚㼑㼐 㼟㼜㼑㼑㼐㻘 㼜㼍㼞㼠㼟 㼛㼒 㼠㼔㼑 㼟㼍㼠㼑㼘㼘㼕㼠㼑 㼠㼔㼍㼠 㼍㼞㼑㼢㼡㼘㼚㼑㼞㼍㼎㼘㼑 㼠㼛 㼠㼔㼑 㼞㼛㼠㼍㼠㼕㼛㼚 㼟㼡㼏㼔 㼍㼟 㼟㼛㼘㼍㼞 㼍㼞㼞㼍㼥 㼜㼍㼐㼐㼘㼑㼟 㻔㻿㻭㻼㼟㻕㻘 㻱㼤㼠㼑㼚㼟㼕㼎㼘㼑 㻻㼜㼠㼕㼏㼍㼘 㻮㼑㼚㼏㼔 㻔㻱㻻㻮㻕 㼍㼚㼐㼛㼠㼔㼑㼞㼟 㼟㼑㼜㼍㼞㼍㼠㼑㼐 㼛㼒㼒 㼒㼞㼛㼙 㼠㼔㼑 㼟㼍㼠㼑㼘㼘㼕㼠㼑㻚 㼀㼔㼑㼞㼑 㼕㼟 㼔㼕㼓㼔 㼜㼛㼟㼟㼕㼎㼕㼘㼕㼠㼥 㼠㼔㼍㼠 㼠㼔㼑 㼎㼛㼠㼔 㻿㻭㻼㼟 㼔㼍㼐 㼎㼞㼛㼗㼑㼚 㼛㼒㼒 㼍㼠㼠㼔㼑㼕㼞 㼎㼍㼟㼑㼟 㼍㼚㼐 㼣㼑㼞㼑 㼟㼑㼜㼍㼞㼍㼠㼑㼐㻚 傜 㻼㼞㼑㼟㼡㼙㼑㼐 㻹㼑㼏㼔㼍㼚㼕㼟㼙 㻠傝
Considering the information above, JAXA concluded that the satellitesfunctionality could not be restored and ceased recovery activities. (April28)

Before its failure Astro-H/Hitomi had started itsobservational programme
I There are observations of the center of Perseus galaxy clusterFirst results appeared two days ago in Nature Letters
Astro-H vs. Suzaku spectrum. Nature (2016)

3.5 keV line with Astro-H/Hitomi
I The center of Perseus galaxy cluster exhibits one of the strongestsignals at 3.5 keV with the flux F ∼ 2× 10⁻⁵ cts/sec/cm2
(confirmed by several groups and observed with 3 instruments)
I Exposure of the published data – 230 ksec
I The data at energies below 5.5 keV has not been revealed by thecollaboration
I It is difficult to make any estimates because the calibration phase “. . . includes a beryllium window that absorbs most X-rays belowabout 3keV”
I We hope that it will be possible to confirm the presence of the3.5 keV line in Perseus and distinguish it from atomic element lines(Potassium, Chlorium, etc.)

Future
Microcalorimeter on sounding rocket (2017)
I Instrument with largefield-of-view and very highspectral resolution
I Very useful to resolve narrowlines from diffuse sources
I Fly time ∼ 102 seconds pointingto some area in the sky ⇒ canonly explore a signal fromGalactic dark matter halo
[keV]S
m1 10
θ2
2sin
12−10
11−10
10−10
9−10
8−10
7−10
6−10
5−10
4−10
(1)
(2,3)
6.5 6.6 6.7 6.8 6.9 7 7.1 7.2 7.3 7.4 7.511−10
10−10
9−10
(1)
(2,3)
Athena+
I Large ESA X-ray mission (2028)
I X-ray spectrometer (X-IFU) – unprecedented spectralresolution
I Lifetime: 5–10 years
I Very large collecting area (10× that of XMM)

Thank you for your attention

Draco dSph 2015 observations[1512.07217]
2 3 4 5 6 7 8 9 10
0.1
0.05
0.2
norm
aliz
ed c
ount
s s−
1 ke
V−
1
Energy (keV)
Draco spectra binned by 65 eV, mos1 (black), mos2 (red), pn (green)
Raw/Cleaned FoV[Msec] [arcmin2]
MOS1 1.43 / 0.97 318.9MOS2 1.44 / 1.02 573.5PN 1.29 / 0.65 543.9
0
0.1
0.2
norm
aliz
ed c
ount
s s−
1 ke
V−
1
PN 65 eV
3 3.5 4 4.5 5 5.5 6 6.5
−5×10⁻³
0
5×10⁻³
norm
aliz
ed c
ount
s s−
1 ke
V−
1
Energy (keV)

Draco dSph in 2009 vs. 2015
2 4 6 8 10
0.1
0.0
5
no
rma
lize
d c
ou
nts
s−
1 k
eV
−1
Energy (keV)
Draco MOS spectra binned by 65 eV, 2009 year (black), 2015 year (red)
2 4 6 8 10
10
.20
.52
no
rma
lize
d c
ou
nts
s−
1 k
eV
−1
Energy (keV)
Draco PN spectra binned by 65 eV, 2009 year (black), 2015 year (red)

Jeltema & Profumo (2015)- I
I Independent analysis of the 2009+2015 Draco observations wasdone in [1512.01239]
I No line detected even in PN camera
I Much stronger upper limits on flux
Black cross: detection of Ruchayskiy et al.[1512.07217]
Black down arrow: 2σ upper limit fromRuchayskiy et al. [1512.07217]
I JP15 [1512.07217] is a very succinct paper. No details of dataanalysis. Trying to reproduce the results we made a number ofmodifications of our procedure
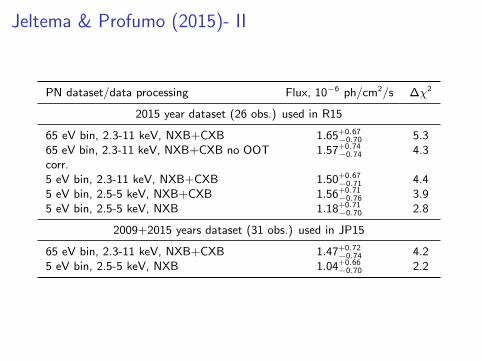
Jeltema & Profumo (2015)- II
PN dataset/data processing Flux, 10−6 ph/cm2/s ∆χ2
2015 year dataset (26 obs.) used in R15
65 eV bin, 2.3-11 keV, NXB+CXB 1.65+0.67−0.70 5.3
65 eV bin, 2.3-11 keV, NXB+CXB no OOTcorr.
1.57+0.74−0.74 4.3
5 eV bin, 2.3-11 keV, NXB+CXB 1.50+0.67−0.71 4.4
5 eV bin, 2.5-5 keV, NXB+CXB 1.56+0.71−0.76 3.9
5 eV bin, 2.5-5 keV, NXB 1.18+0.71−0.70 2.8
2009+2015 years dataset (31 obs.) used in JP15
65 eV bin, 2.3-11 keV, NXB+CXB 1.47+0.72−0.74 4.2
5 eV bin, 2.5-5 keV, NXB 1.04+0.66−0.70 2.2