step into a green - captainpolyplast.com
TRANSCRIPT

CAPTAIN POLYPLAST LTDLEADER IN MICRO IRRIGATION SOLUTIONS
INVESTOR PRESENTATIONAUGUST 2019
Step into a GREEN future
1

Incorporated in 1997, Captain Polyplast Limited (CPL) has established itself as one of the leading brands inthe micro irrigation industry within a short time frame with its excellent quality products and innovativeideas.
An ISO 9001:2015 certified company, it is one of the fastest growing players in the micro irrigationindustry in India and has also exhibited its position as a reputed brand in the domestic and internationalmarkets.
CPL was listed on BSE SME platform in 2013 and migrated to the main platform in 2016.
Market capitalisation of the company is INR 1,294.7 Mn as on 30th June, 2019.
2
Executive Summary
FY19 Financial Performance Highlights:
Business Segments:
Micro Irrigation System Water Soluble Fertilizers Solar Systems Polymer Division
OPERATIONAL INCOME
INR 1,492 Mn5 Year CAGR
12.87%
EBITDA
INR 179 Mn5 Year CAGR
15.46%
PAT
INR 72 Mn5 Year CAGR
27.97%
About the Company:

TheOpportunity
3

4
Micro Irrigation Benefits
Less electricity is used due to less need ofwater for micro irrigation.
Cost of farming reduces as energy andlabour requirement decreases.
Usage of water soluble fertilizers deceasesunnecessary wastage.
Water fed directly to roots avoidsevaporation losses.
Appropriate soil moisture level helpsproper crop growth.
More land can be irrigated from sameamount of water available.
Other benefits include early sowing/fruiting, time saving, new crop production.
Source: NMMI survey of 6,000 famers across 13 states
60%
47%
42%
31%
30%
28%
0% 20% 40% 60% 80%
Water Use Efficiency
Crop Yield Improvement
Farmer Income Rise
Reduced Irrigation
Energy Saving
Fertilizer Saving
Benefits of Micro Irrigation (%)

5
Myths Reality
Drip irrigation requires more water,which increases water utility bill.
Although it might seem to run longer than the traditional hose or sprinkler, drip has aslower rate of water release, and directly delivers water to the root system for betterabsorption.
Since drip irrigation is underground, itis difficult to tell if its working or not.
Moisture level in the ground can be measured by adjusting the drip system accordinglyif it’s too wet or dry.
Micro irrigation is considered to beexpensive.
The net benefits or costs to the farmer for investing in a given irrigation system act asan investment by: 1) reducing consumptive use of water while maintaining orincreasing agricultural output, 2) decreasing the sediments, salts and chemicals thatcan pollute downstream supplies and 3) reducing erosion helps protect the farms longterm productivity as long as salts do not accumulate in the root zone.
Micro irrigation is best suited for aniche segment.
Micro irrigation is also done for larger areas, such as farming, landscaping,greenhouses, and nurseries.
Traditional irrigation is the onlyessential way of irrigation.
Micro irrigation reduces water consumption, is advanced, time-saving and an efficientmeans of irrigation compared to traditional irrigation.
Drip Irrigation system can easily beruined due to root intrusions.
New drip irrigation system is equipped with state of the art physical and chemicalbarriers to prevent root intrusion and protect the system from damage.
Myths vs. Reality of Micro Irrigation

AboutCaptain Polyplast
Limited (CPL)
6

7
Company Overview
Captain Polyplast Limited (CPL) is a micro irrigation systemsolutions provider founded by Mr. Ramesh Khichadia,Chairman and Managing Director, who is a B. Tech(Agriculture Engineering) from Gujarat Agriculture Universityand has more than 23 years of experience in the Irrigationbusiness.
CPL is one of the leading Micro Irrigation System Solutionprovider.
The company manufacturers Drip Irrigation Systems,Sprinkler Irrigation Systems, Water Soluble Fertilizers, SolarPumps and also trades in PP and PE granules.
Its manufacturing unit is located at Rajkot, Gujarat andKurnool, Andhra Pradesh.
The company’s products and solutions are highly acclaimednot only in the domestic market across the country but alsoin the international markets.
1,350
1,1481,246
1,492
372
11.50%
13.65%
11.81% 12.00%
14.52%
0%
2%
4%
6%
8%
10%
12%
14%
16%
0
200
400
600
800
1,000
1,200
1,400
1,600
FY16 FY17* FY18* FY19* Q1-FY20
Revenue (INR Mn) EBITDA Margin(%)
Consolidated Revenue (INR Mn)
*As per IND AS

8
Key Milestones
Company was incorporated.
Commencement of Production.
1997
Registered with Gujarat Green
Revolution Company Ltd for Supply of
Irrigation System.
2006
Special Recognition Award for
Manufacturing of quality
Plastic Extruded Products by
GOI.
2008
Commenced production of round drip line
using US technology.
2011
IPO and listing on BSE SME
platform.
2013Awarded
"SME Business Excellence
award" by Dun & Bradstreet in
the field of mfg. of Plastic
Products.
2015
Clocked INR 1,000 Mn revenue
milestone.
Shifted to BSE main board.
2016Commenced
with Greenhouse
and solar pumps
installations Strategic tie up
with IOCL.
2017Commissioned production at
the new manufacturing
facility in Kurnool, Andhra Pradesh
2019
Commenced production of flat drip line using Israeli technology.
2012

9
Facilities and Distribution Network
CPL has it’s manufacturing units located at Rajkot, Gujarat and Kurnool, Andhra Pradesh.
The company has 13 Sales Offices typically concentrated in Western & Northern parts of India.
6 Stock depots and sales offices catering to 500+ dealers.
Company’s products are exported to Gulf, African and Latin American countries.Manufacturing Plants 13 Sales Offices 6 Stock depots and sales
offices
Rajkot, GUJARAT
Kurnool, ANDHRA PRADESH

10
Manufacturing Facility
Drip line (Rajkot) 158.50 million meters / year
HDPE Pipes (Rajkot) 4,000 MT / year
CPL has set up their modern plant at National High-Way 27 atShapar (Veraval) near Rajkot, Gujarat and Kurnool, Andhra Pradesh.
Working along with the growing market demand, it is fully equippedwith hi-tech machinery and tools, with Dripline machinery fromIsrael and USA, that are must for quality production.
The company is a client centric organization and strives to meet theexact requirements of their clients. This is why, they also customdesign their range as per the specifications of their clients.
They have been able to garner a huge client base in the globalmarket due to their quality range and their ability to provide bulkrequirements for their valued clients.
The company uses 1MW of captive wind turbine.
Drip line, HDPE Pipes and PVC Pipes (Kurnool)
9,000 MT / year

Key Strengths
11
Increasing Geographical Presence.
Providing customized Value Added Services.
Optimal utilization of resources.
Experienced Management Team.
Robust and Scalable Business Model.
Strong Marketing and Distribution network.
Diversified Product Portfolio.
KeyStrengths
Appointed as Del Credere Associates cum Consignment Stockists (DCA cum CS) by Indian Oil Corporation for marketing of polymer products in Gujarat.

12
Future Growth Strategy
Intends to increase exports exposure targeting decent contribution from FY18 onwards.
Network expansion within and outside the country.
Appointment as DCA cum CS of IOCL will diversify the revenue.
Expecting better utilization of the capacity, thereby improving the bottom line.
2
4
1
3

Business Segments
13

Business Segments
14
• Emitting Pipe• Lateral Pipe• Emitters• Header Assembly
• Brass Sprinklers• Mini Sprinkler• Sprinkler Pipe
Drip Irrigation Systems
Sprinkler Systems
• Solar Pumps• Solar Power Projects• Solar Water Heater
Solar Systems
• Polypropylene(PP Granules)• Polyethylene
(PE Granules)
Polymer Products

Micro Irrigation System
15

Micro Irrigation Subsidy Model
16
Farmer approaches micro irrigation company
Field survey with GPS
Design layout and cost estimation given by
the companyCollection of application
for subsidy
Verification of design and cost and subsidy estimation given by
regulators
Release of work order by Government
Supply and Installation of system as per
design
Trial run and verification by Government
appointed agenciesInvoice is prepared
Disbursal of payment
Farmer share collection &
signing agreement

Drip Irrigation System
Drip irrigation is a form of micro irrigation that saves waterand fertilizer by allowing water to trickle down drop by dropto the roots of the plants, either onto the soil surface ordirectly into the root zone.
It is done in a regulated predetermined time according to therequirements of crops through a network of valves, pipes,tubing, and emitters.
Therefore, it saves water and is suitable for horticulture,vegetables, oilseeds and ornamental plants.
It is chosen instead of surface irrigation for various reasons,often including concern about minimizing evaporation.
Advantages of Drip Irrigation: Moisture within the root zone can be maintained at field
capacity. Minimized soil erosion. Highly uniform distribution of water i.e. controlled by output at
each nozzle. Lower labour cost since the process is automated. Fertigation can easily be included with minimal waste of
fertilizers. Usually operated at lower pressure than other types of
pressurized irrigation, reducing energy costs.
17
Product Application
EmittingPipes
For Drip Irrigation Systems for closespacing crops.
Lateral Pipes For Drip and Mini Sprinkler System.
Emitters For Online Drip Irrigation System inHorticulture crops.
HeaderAssembly
To assemble the filtration unit for dripand mini sprinkler irrigation system.

Sprinkler Pipes & Mini Sprinklers
CPL offers superior sprinkler irrigation system that is designedconsidering the crops grown, availability of water and itscomposition, type of soil, elevation, temperature, humidityand wind velocity in order to get the best possible results.
Mini sprinklers earned a reputation as the most reliable anddurable sprinklers available with their outstanding distributionuniformity and large water passages.
Mini sprinklers simplicity and modular design allows for easyaccessory options making them adaptable to almost anyapplication and crop.
Advantages of Sprinkler Pipes & Mini Sprinklers:
Sprinkler irrigation does not require surface shaping orlevelling.
Low pumping costs, operating at the same pressure as dripirrigation.
Larger wetted zone thus plants are less likely to suffer fromwater stress if there would be any delay in irrigation.
18
Product Application
Metal Sprinkler Nozzle
Sprinkler Irrigation System.
Plastic Sprinkler Nozzle
Sprinkler Irrigation System.
Sprinkler Pipes Sprinkler and Drip Irrigation System for main and sub main line.

Solar Water Pumping Systems
19
Designed by CPL, Solar water pumps are considered simple and clean alternative to fuel burningengines as well as generators of domestic water, irrigation and livestock requirements.
The company offers best solar pumps in three variants that primarily include Captain AC SolarSurface pump, Solar Submersible and Submersible Solar Water Pumps without battery.
Solar Pumping systems generates electricity from sunlight by directly utilizing the current from thearray efficiently.
The flow rate of the solar photovoltaic (SPV) water pumping systems is determined by the intensityof sun as photovoltaic panels power them.
These equipment's require low maintenance and works without any demand for fuel.
Captain Solar Pumping systems are easy to install and can function effectively even in places with noor limited grid power.
The company is well placed to cross-sell these equipment’s and provide these services to thefarmers they have built relationship with.
Available in ‘On Grid’ and ‘Off Grid’.
Advantages :
• No Conventional grid electricity required
• Long operating life
• Highly reliable
• Eco-friendly
• No Fuel cost-uses abundantly available solar energy
• Easy to operate and maintain
Application:
• Agriculture – Irrigation & Sprinklers
• Livestock watering
• Canal water supply to farm
• Household and municipal application
• Fountains, ponds and gardens
• Salt production and fish production

Strategic Tie Up with Indian Oil Corporation Ltd (IOCL)
CPL was appointed as Del Credere Associate (DCA) and Consignment Stockiest (CS) of Indian Oil Corporation Ltd(IOCL) on February, 2017.
The agreement entitles CPL to market the entire portfolio of IOCL’s polymer products (raw material for plasticprocessors) in Gujarat.
One of the main raw materials for CPL is polyethylene, and this strategic tie up with IOCL would marginallyreduce the cost of raw materials and improve the EBITDA margins for the company.
CPL would also receive commission income on the product sales facilitated through them to other polymercustomers.
The DCA business has done tremendously well in the first year itself. We have been awarded “Star PerformerAward” from lndian Oil Corporation Ltd. for achieving highest sales of Polymer during the FY18 among newlyappointed DCAs. Going forward, we expect polymer sales to show healthy growth as plastic manufacturinggrows to cater to the demand of plastic goods.
This business is projected to grow rapidly as India’s per capita plastic consumption is expected to continue togrow in the coming years and more plastic industries are getting set up in Gujarat.
20

Greenhouse Irrigation System CPL has a dedicated team of engineers for complete execution of Greenhouse system right from
design stage to complete implementation of the project.
The Company has seen a remarkable growth in the Greenhouse segment in the first year ofoperations where combined projects over 80,000 sq. meters in Gujarat and Rajasthan wereimplemented.
Advantages of Captain Polyplast’s Greenhouse Technology
Round the year production of most desired crops and higher production per unit area with higherquality crops.
Infestation of pests and diseases are eliminated.
Why CPL Greenhouse yields more?
UV film does not allow harmful UV rays to enter the greenhouse thus, keeping the insideenvironment under control and protecting the crop.
Carbon dioxide released by the plants during the night is consumed by plants itself in the day. Thusthe plants get more food compared to open field.
Inside temperature is raised because of greenhouse effect. Long wave radiations are absorbed andretained for longer time inside the greenhouse.
Specialities of CPL Green House
Dedicated net from preventing entrance of insects into the greenhouse with minimum effect onventilation which minimizes the consumption of pesticides thus reducing costs and negative effectsof chemicals.
Installation of in-house manufactured irrigation, fertigation and sprinkling systems.
Installation of fully integrated sensor based control system for temperature and irrigation. 21

Solar Power Plants Solar power plants are very efficient for providing electricity as they make use of the energy of the
sun. As solar energy is used in abundance for various purposes, constant efforts are being made toimprovise the efficiency of solar panels, solar power plants and other systems.
For measuring the efficiency of a solar power plant you first need to measure the density. Also asolar power plant should be efficient enough to supply power when there is no electricity.
Solar power pants supply or generate more amount of electricity when earth receives maximumdensity of sunlight.
The power plants however also make use of fossil fuels the conventional power plants burn thefossil fuels for the production of steam, which then drives the turbines for generating electricity. Assolar power plant‘s main aim is to supply good amount of power when a person needs it the most.
Also solar power plants are installed as back up of electricity. In spite of certain drawbacks, the solarpower plants make the right use of the sun’s energy and have till date been successful in supplyingelectricity all over the world.
Benefits
Reliable source of electricity
Way to store energy and use it in future
Low maintenance with longer life
Cheaper source of energy
Keeps the environment pollution free
The company offers Photovoltaic solar energy plants, Thermal solar energy plants and concentratingsolar power plant. 22

Micro Irrigation Industry
23
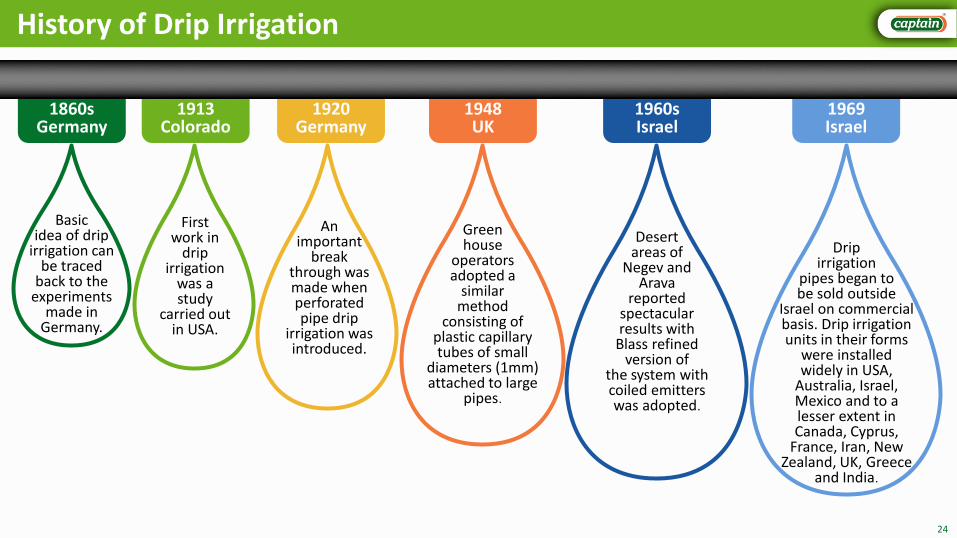
History of Drip Irrigation
24
Drip irrigation
pipes began to be sold outside
Israel on commercial basis. Drip irrigation units in their forms
were installed widely in USA,
Australia, Israel, Mexico and to a lesser extent in Canada, Cyprus,
France, Iran, New Zealand, UK, Greece
and India.
Desert areas of
Negev and Arava
reported spectacular results with
Blass refined version of
the system with coiled emitters was adopted.
Green house
operators adopted a
similar method
consisting of plastic capillary tubes of small
diameters (1mm) attached to large
pipes.
An important
break through was made when perforated pipe drip
irrigation was introduced.
First work in
drip irrigation
was a study
carried out in USA.
Basic idea of drip
irrigation can be traced
back to the experiments
made in Germany.
1860sGermany
1913Colorado
1920Germany
1948UK
1960sIsrael
1969Israel

Global Potential for Micro Irrigation Industry
According to a report by Transparency Market Research (TMR), the global opportunity in micro irrigation systems,which stood at USD 3.1 Bn in 2017.
The growth in the global market looks undying in the near future with opportunity rising at a CAGR of 15.10%between 2015 to 2023 and attaining a value of USD 9.1 Bn by the end of 2023.
The increasing need to maintain turf grass, fields, sports grounds, and stadiums is likely to boost the demand forsprinklers in the near future. As a result, this segment is expected to retain its lead, reporting a CAGR of 14.50%between 2015 and 2023. Traditional sprinklers, lateral move sprinklers, and centre pivot sprinklers are some of themost-applied sprinklers across the world.
Asia Pacific, however, is likely to emerge as the new market leader on account of various government initiatives,promoting rapid adoption of micro irrigation systems among farmers and agriculturists. Additionally, South Korea,Japan, India, China, and Australia are likely to report significant contributions in the increasing demand for theseirrigation systems over the next few years in this region.
The micro sprinkler segment is the fastest growing type of micro irrigation system due to their increasingprotected farming practices. With the development of micro sprinklers, irrigation on low value field crops hasincreased. Therefore, in agrarian economies such as India and China, there is a growing market for micro sprinklers.
Source: Grant Thornton – Micro Irrigation Report (2016), Report by Transparency Market Research (2017)
25

Source: Grant Thornton – Micro Irrigation Report (2016)26
Micro Irrigation – Journey so far in India
2015 Pradhan Mantri Krishi Sinchayee Yojna
1992
1995
Centrally Sponsored Scheme on Use of
Plastic in Agriculture
Rural Infrastructure Development
Fund
Accelerated Irrigation Benefit Programme (AIBP)
Integrated Scheme of Oilseeds, Pulses, Oil-Palm
and Maize (ISOPOM)National Horticulture Mission (NHM)
1996
2004
2005
2007
2010
2014
National Mission on Sustainable Agriculture
Rashtriya Krishi Vikas Yojna (RKVY) National Food Security Mission
National Mission
on Micro irrigation
Centrally Sponsored Scheme on Micro irrigation
2006

Progressive States:- Andhra Pradesh, Gujarat, Karnataka, Madhya Pradesh, Maharashtra, Rajasthan, Tamil Nadu,Telangana.
Under performing States:- Punjab, Jharkhand, Bihar, Chhattisgarh, Goa.
States where MI is yet to pick up:- Arunachal Pradesh, Manipur, Meghalaya, Nagaland and West Bengal.
Key measures to promote Micro Irrigation
Promoting better process management - Having a dedicated team whose priority would be promoting microirrigation at the state level.
Ensuring smoother and long term guidelines - Guidelines that remain in place to ensure steady implementation ofthe schemes.
Moderating subsidy levels in state - Where penetration of micro irrigation is already above the national average andre-routing that subsidy to states with very low penetration, where the technology still needs to be promoted.
Financial inclusion - Providing priority sector lending status to the industry.
Providing crop focus solutions - Making use of micro-irrigation mandatory for water consuming crops.
Providing infrastructure status to the micro irrigation industry - To reduce some of the operating costs formanufacturers.
State wise Micro Irrigation Industry
27

Development of Micro Irrigation in India
In India Drip Irrigation was introduced in the early seventies at the agricultural universities and other researchinstitutes.
Significant development took place only in the eighties and further gained momentum in the early nineties. India’s population stands at 1.27 Bn and is estimated to rise at a steady pace to reach 1.6 Bn by the year 2050
(According to the World Bank estimates). Water scarcity, with the need to increase food grain production in orderto meet the growing demand, central and state governments have realized the need for a prudent and efficient useof land and water resources through smart irrigation methods.
28
YearNet Area Sown
MhaIntensity of Cropping %
Gross Area SownMha
Gross Irrigated Area Mha
% of Gross Irrigated to
Gross Sown Area
1970 140.4 118 165.1 38.5 23.0
1989 141.7 127 180.1 59.3 32.9
2000 150.0 133 200.0 84.0 42.0
2025 155.0 136 210.0 110.0 52.0
Cropped Area, Intensity of Cropping and irrigated Area:
Source: Report of National Commission on Agriculture (1976), Agricultural Statics at a Glance by Ministry of Agriculture (1992)
Source: Grant Thornton – Micro Irrigation Report (2016)

Growth Drivers for Micro Irrigation Industry
29
Domestic Market Export Market
PM Krushi Sinchay Yojna has proposed an investment of INR 50,000 croresfor the next 5 years integrating micro irrigation in the flagship scheme asan integral component..
South America and Africa have not yet explored MI, hencethere is huge potential for export market.
India has 140 Mha, out of this 70 Mha has availability of water forirrigation, only 11 Mha is covered by drip irrigation systems that is only12% of the available market.
Most African countries (especially Kenya, Zambia, Zimbabwe& South Africa) have potential for thin wall drip line due toGovernments’ impetus for agriculture growth.
Extensive awareness campaigns and subsidy provided by Governmentthrough Special Purpose Vehicles like GGRC, Andhra Pradesh MicroIrrigation Project (APMIP).
Sales for export is coordinated through local channelpartners in respective countries that has extensive dealernetworks under them.
Increased fund allocation towards micro irrigation in states like Gujarat,Andhra Pradesh, Telangana, Tamil Nadu, Karnataka, Maharashtra,Rajasthan and Haryana. The government also approved a dedicatedRs5,000 Cr fund under NABARD, which will provide this amount to stateson concessional rate of interest to promote micro-irrigation
USA has 55% penetration of their total available area forMicro Irrigation, due to less labour required and high cropyield improvement.

Financials
30

Q1-FY20 Consolidated Financial Highlights (IND AS)
Income Statement (INR Mn) FY17 FY18 FY19 Q1-FY20
Operational Income 1,148 1,246 1,492 372
Total Expenses 991 1,099 1,313 318
EBITDA 157 147 179 54
EBITDA Margins (%) 13.68% 11.80% 12.00% 14.52%
Depreciation 21 20 18 10
Interest 64 59 73 24
PBT before exceptional items 72 68 88 20
Extraordinary Items - - - -
Other Income 4 16 11 7
PBT 76 84 99 27
Tax 26 29 27 8
Profit After Tax 50 55 72 19
PAT Margins (%) 4.36% 4.41% 4.83% 5.11%
Other Comprehensive Income (1) (7) 1 1
Total Comprehensive Income 49 48 73 20
Diluted EPS (INR) 4.84 4.73 1.44 0.39
31
Note – For Q4-FY19 and FY19 equity shares of face value INR 10 each has been sub divided into five share of face value INR 2 each resulting into outstanding shares equal to 50,378,790 shares

Consolidated Balance Sheet (IND-AS)Assets (INR Mn) FY18 FY19 Liabilities (INR Mn) FY18 FY19
Assets Equity and Liabilities
1. Non-Current Assets: 1. Equity
(a) Property, Plant and Equipments 107 108 Equity Share Capital 101 101
(b) Capital Work in Progress - 72 Other Equity
(c ) Investments accounted for using Equity Method 10 10 (a) Reserves and Surplus 235 305
Financial Assets (b) Other Reserves - -
(a) Investments 37 38 Total Equity 336 406
(b) Loans - - 2. Liabilities
(c ) Other Financial Assets - - Non-Current Liabilities
Deferred Tax Assets - 1 (a) Borrowings 28 70
Other Non-Current Assets (b) Deferred Tax Liabilities (Net) 1 -
(a) Long-Term Loans and Advances 46 50 (c) Government Grants 2 2
(b) Other Non-Current Assets - - (d) Other Non-Current Liabilities - -
Total Non-Current Assets 200 279 Total Non-Current Liabilities 31 72
3. Current Liabilities
2. Current Assets Financial Liabilities
Inventories 209 290 (a) Short-Term Borrowings 306 490
Financial Assets (b) Trade Payables 280 453
(a) Trade Receivables 518 903 (c) Other Financial Liabilities 11 70
(b) Cash and Cash Equivalents 1 1 Provisions 1 1
(c ) Bank Balance other then Cash and Cash Equivalents 12 16 Employee Benefit Obligations 6 6
Other Current Assets Government Grants - -
(a) Short-Term Loans and Advances 149 290 Current Tax Liabilities 29 28
(b) Other Current Assets 2 2 Other Current Liabilities 92 255
Total Current Assets 892 1,502 Total Current Liabilities 725 1,303
Total Assets 1,092 1,781 Total Equity and Liabilities 1,092 1,781

Financial Performance – (Consolidated)
33
1,350 1,148 1,246 1,492
FY16 FY17* FY18* FY19*
02004006008001,0001,2001,4001,600
Revenue (INR Mn)
155 157 147 179
11.48%
13.68%
11.80% 12.00%
10.00%
11.00%
12.00%
13.00%
14.00%
0
50
100
150
200
FY16 FY17* FY18* FY19*
EBITDA (INR Mn) and EBITDA Margins (%)
EBITDA (INR Mn) EBITDA Margin (%)
38 50 55 72
2.81%
4.36% 4.41% 4.83%
0.00%
2.00%
4.00%
6.00%
0
20
40
60
80
FY16 FY17* FY18* FY19*
PAT (INR Mn) and PAT Margins (%)
PAT (INR Mn) PAT Margin (%)
244 290 336 406
42.71%
43.85%
41.22%40.76%
39.00%
40.00%
41.00%
42.00%
43.00%
44.00%
45.00%
0
100
200
300
400
500
FY16 FY17* FY18* FY19*
Net Worth (INR Mn) and ROCE (%)
Net Worth (INR Mn) ROCE (%)
*As per IND AS

Capital Market Data
74.51%
25.49%
Promoter Public
Shareholding Pattern (As on 30th June, 2019)
34
Price Data (As on 30th June, 2019)
Face Value (INR) 2.0
Market Price (INR) 25.7
52 Week H/L (INR) 39.58/21.40
Market Cap (INR Mn) 1294.7
Equity Shares Outstanding (Mn) 50.4
1 Year Avg. Trading Volume (‘000) 34.8
Share Price Performance (As on 30th June, 2019)
-40%
-30%
-20%
-10%
0%
10%
20%
30%
Jul-18 Aug-18 Sep-18 Oct-18 Nov-18 Dec-18 Jan-19 Feb-19 Mar-19 Apr-19 May-19 Jun-19
Captain Sensex

For further details, please feel free to contact our Investor Relations Representatives:
Mr. Anuj SonpalValorem AdvisorsTel: +91-22-49039500Email: [email protected] Kit Link: www.valoremadvisors.com/captain
Disclaimer
Captain Polyplast LimitedNo representation or warranty, express or implied, is made as to, and no reliance should be placed on, the fairness, accuracy, completeness or correctness of the information or opinions contained in thispresentation. Such information and opinions are in all events not current after the date of this presentation. Certain statements made in this presentation may not be based on historical information or facts and maybe "forward looking statements" based on the currently held beliefs and assumptions of the management of Captain Polyplast Limited, which are expressed in good faith and in their opinion reasonable, includingthose relating to the Company’s general business plans and strategy, its future financial condition and growth prospects and future developments in its industry and its competitive and regulatory environment.
Forward-looking statements involve known and unknown risks, uncertainties and other factors, which may cause the actual results, financial condition, performance or achievements of the Company or industryresults to differ materially from the results, financial condition, performance or achievements expressed or implied by such forward-looking statements, including future changes or developments in the Company’sbusiness, its competitive environment and political, economic, legal and social conditions. Further, past performance is not necessarily indicative of future results. Given these risks, uncertainties and other factors,viewers of this presentation are cautioned not to place undue reliance on these forward-looking statements. The Company disclaims any obligation to update these forward-looking statements to reflect futureevents or developments.
This presentation is for general information purposes only, without regard to any specific objectives, financial situations or informational needs of any particular person. This presentation does not constitute an offeror invitation to purchase or subscribe for any securities in any jurisdiction, including the United States. No part of it should form the basis of or be relied upon in connection with any investment decision or anycontract or commitment to purchase or subscribe for any securities. None of our securities may be offered or sold in the United States, without registration under the U.S. Securities Act of 1933, as amended, orpursuant to an exemption from registration there from.
This presentation is confidential and may not be copied or disseminated, in whole or in part, and in any manner.
Valorem Advisors Disclaimer:
Valorem Advisors is an Independent Investor Relations Management Service company. This Presentation has been prepared by Valorem Advisors based on information and data which the Company considersreliable, but Valorem Advisors and the Company makes no representation or warranty, express or implied, whatsoever, and no reliance shall be placed on, the truth, accuracy, completeness, fairness andreasonableness of the contents of this Presentation. This Presentation may not be all inclusive and may not contain all of the information that you may consider material. Any liability in respect of the contents of, orany omission from, this Presentation is expressly excluded. Valorem Advisors also hereby certifies that the directors or employees of Valorem Advisors do not own any stock in personal or company capacity of theCompany under review.
35

Thank You
36