stemming the tide: strategies to reduce the growth and cut the
TRANSCRIPT

Stemming the Tide:
Julie Samuels Nancy La Vigne Samuel Taxy
November 2013
Strategies to Reduce the Growth and Cut the Cost of the Federal Prison System


Stemming the Tide:
Strategies to Reduce the
Growth and Cut the Cost of
the Federal Prison System
Julie Samuels Nancy La Vigne Samuel Taxy
November 2013
Copyright © November 2013. The Urban Institute. All rights reserved. Except for short quotes, no
part of this report may be reproduced or used in any form or by any means, electronic or
mechanical, including photocopying, recording, or by information storage or retrieval system,
without written permission from the Urban Institute.
The Urban Institute is a nonprofit, nonpartisan policy research and educational organization that
examines the social, economic, and governance problems facing the nation. The views expressed are
those of the authors and should not be attributed to the Urban Institute, its trustees, or its funders.

Contents
Executive Summary 1
Federal Prison Population Growth 1
Dangerously Overcrowded Facilities 1
Evaluating Options for Reform 2
Conclusion 6
Introduction: The Impact of Federal Prison Growth 7
Understanding the Federal Prison Population and Drivers of Growth 9
Main Drivers: Who Goes to Prison and for How Long? 9
Policy Options to Ease Growth and Reduce Costs 17
Front-end Changes 18
Back-end Changes 31
Conclusion 43
Methodology 44
Notes 45
References 49
Appendix A 52
Acknowledgments 1
About the Authors 1


Stemming the Tide: Strategies to Reduce the Growth and Cut the Cost of the Federal Prison System 1
Executive Summary
The federal prison population has escalated from under 25,000 inmates in 1980 to over 219,000 today.1 This growth has come at great expense to taxpayers and other important fiscal priorities. As policymakers consider the array of options to stem the tide of inmates, our research concludes that a combination of strategies is the best way to make a real impact. In this report, we evaluate various policy options for cutting the size and costs of the burgeoning federal prison system.
Federal Prison Population Growth
The short explanation for the rapid prison population growth is that more people are sentenced to prison and for longer terms. In fiscal year (FY) 2011, more than 90 percent of convicted federal offenders were sentenced to prison, while about 10 percent got probation. By comparison, in 1986, only 50 percent received a prison sentence, over 37 percent received probation, and most of the remainder received a fine.2
Though the number of inmates sentenced for immigration crimes has also risen, long drug sentences are the main driver of the population’s unsustainable growth.3 In 2011, drug trafficking sentences averaged 74 months, though they have been falling since 2008.4 Mandatory minimums have kept even nonviolent drug offenders behind bars for a long time.
The average federal prison sentence in 2011 was 52 months,5 generally higher than prison sentences at the state level for similar crime types.6 This difference is magnified by the fact that, at the federal level, all offenders must serve at least 87 percent of their sentences, while, at the state level, most serve a lower percentage and nonviolent offenders often serve less than 50 percent of their time.7
Dangerously Overcrowded Facilities
Federal prisons are currently operating at between 35 and 40 percent above their rated capacity; this overcrowding is greater in high-security facilities, which, in FY 2012, were operating at 51 percent over capacity, and medium-security facilities, which were operating at 47 percent over capacity. In both medium- and high-security facilities, most inmates have histories of violence.8 This crowding is projected to continue to grow, with the federal prison system over capacity by at least 50,000 inmates each year through 2020.9 Absent any new policy changes (including bringing new prisons online), we estimate overcrowding to rise to 55 percent by 2023.
Prison staffing has not kept up with population growth. The ratio of inmates to staff has grown from four to one in FY 2000 to a projected five to one in FY 2014.10 The US Bureau of Prisons (BOP) has found that high inmate-to-staff ratios are closely connected to increases in

Stemming the Tide: Strategies to Reduce the Growth and Cut the Cost of the Federal Prison System 2
serious assaults.11 Overcrowding makes it hard to provide programs designed to keep inmates from re-offending, and it strains essential prison infrastructure, such as plumbing, through overuse.
Further, the average cost of keeping an inmate behind bars is $29,000 a year.12 Most of these costs are fixed, so one inmate more (or less) is a difference of $10,363.13 The federal prison system’s budget request for FY 2014 is $6.9 billion, which is more than a quarter of the Department of Justice’s (DOJ’s) budget. That share is projected to grow, taking resources away from other public safety priorities.
Evaluating Options for Reform
Options for reform include changes that reduce the number of people entering the BOP and their sentence length (front-end options) and changes that can lead to early release or transfer to community corrections for people already in BOP custody (back-end options). The estimated impact of each of the options described below is detailed in tables ES.1 and ES.2. The underlying assumptions and methodology for the estimates are summarized in the Methodology section at the end of this report and presented in more detail in Appendix B (available online: http://www.urban.org/publications/412932.html). The cost estimates for dollars saved are based on the average marginal cost of imprisoning one inmate for one year; they do not reflect cost savings that could accrue from averted prison construction or prison closures, including staffing changes or other structural changes within the BOP.
Modify Federal Drug Prosecution and Sentencing
Before the Sentencing Reform Act of 1984 and mandatory minimums for drug offenses, a quarter of all federal drug offenders were fined or sentenced to probation, not prison. Today 95 percent are sentenced to a term of imprisonment.14 The average time served before 1984 was 38.5 months, almost half of what it is now.15
Reducing the number of drug offenders is the quickest way to yield an impact on both population and cost (table ES.1). This can be done by only accepting certain types of drug cases, diverting cases to states, and reducing drug prosecutions in other ways. Another approach is reducing drug sentences either by instructing prosecutors to modify charging practices to reduce mandatory minimum sentences (as DOJ has done) or amending statutory penalties. A previous reduction of crack sentences did not harm public safety or increase recidivism.16 Reducing the number of drug offenders entering the BOP by just 10 percent would save $644 million over 10 years. Cutting drug sentences by 10 percent would save $538 million over 10 years.
Reducing mandatory minimum penalties for drug offenses has support from policymakers on both sides of the aisle who view these penalties as unfair, ineffective, and an unwelcome intrusion on judicial discretion and state-level drug enforcement. Every year, 15,000 offenders are
Stemming the Tide: Strategies to Reduce the Growth and Cut the Cost of the Federal Prison System 3
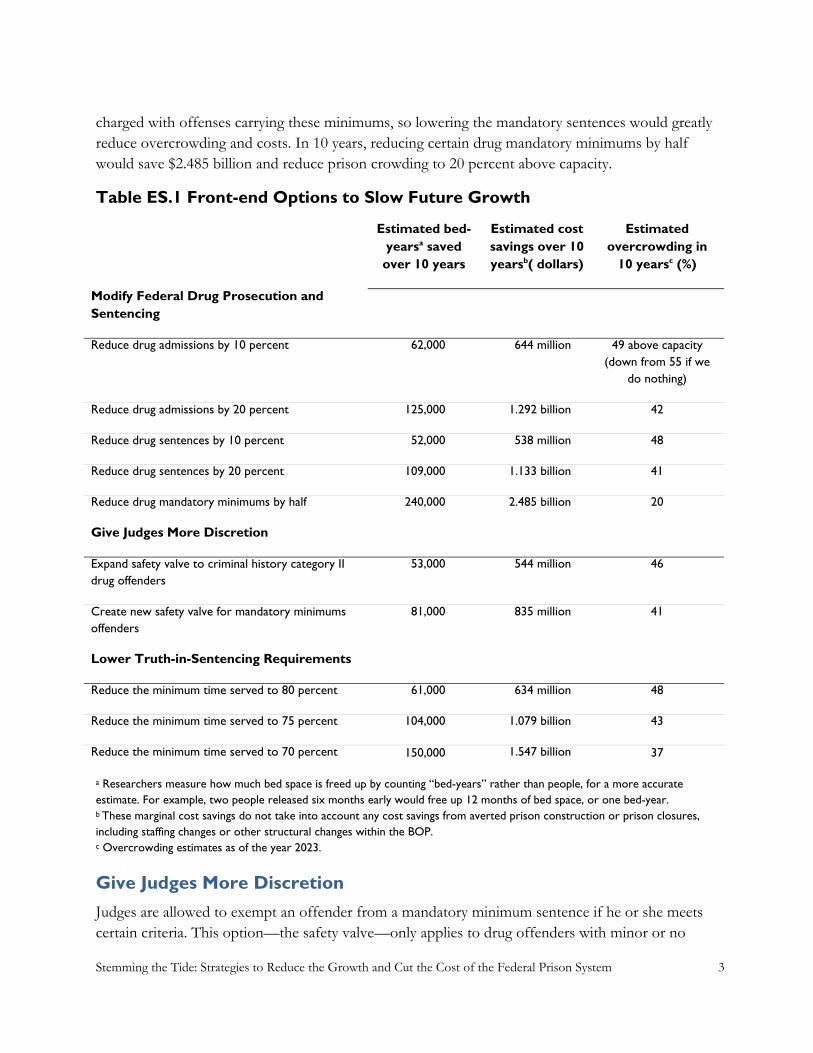
charged with offenses carrying these minimums, so lowering the mandatory sentences would greatly reduce overcrowding and costs. In 10 years, reducing certain drug mandatory minimums by half would save $2.485 billion and reduce prison crowding to 20 percent above capacity.
Table ES.1 Front-end Options to Slow Future Growth
Estimated bed-yearsa saved over 10 years
Estimated cost savings over 10 yearsb( dollars)
Estimated overcrowding in
10 yearsc (%)
Modify Federal Drug Prosecution and Sentencing
Reduce drug admissions by 10 percent 62,000 644 million 49 above capacity (down from 55 if we
do nothing)
Reduce drug admissions by 20 percent 125,000 1.292 billion 42
Reduce drug sentences by 10 percent 52,000 538 million 48
Reduce drug sentences by 20 percent 109,000 1.133 billion 41
Reduce drug mandatory minimums by half 240,000 2.485 billion 20
Give Judges More Discretion
Expand safety valve to criminal history category II drug offenders
53,000 544 million 46
Create new safety valve for mandatory minimums offenders
81,000 835 million 41
Lower Truth-in-Sentencing Requirements
Reduce the minimum time served to 80 percent 61,000 634 million 48
Reduce the minimum time served to 75 percent 104,000 1.079 billion 43
Reduce the minimum time served to 70 percent 150,000 1.547 billion 37
a Researchers measure how much bed space is freed up by counting “bed-years” rather than people, for a more accurate estimate. For example, two people released six months early would free up 12 months of bed space, or one bed-year. b These marginal cost savings do not take into account any cost savings from averted prison construction or prison closures, including staffing changes or other structural changes within the BOP. c Overcrowding estimates as of the year 2023.
Give Judges More Discretion
Judges are allowed to exempt an offender from a mandatory minimum sentence if he or she meets certain criteria. This option—the safety valve—only applies to drug offenders with minor or no

Stemming the Tide: Strategies to Reduce the Growth and Cut the Cost of the Federal Prison System 4
criminal history. That same discretion could be expanded to include drug offenders with slightly greater criminal histories who pose little threat to public safety.
Alternatively, a new safety valve could be applied to all offenders facing federal mandatory minimums, including drug offenders with more extensive criminal histories and offenders subject to mandatory minimum penalties for non-drug offenses. Creating a safety valve for any offender subject to a mandatory minimum sentence could save as much as $835 million in 10 years.
Lower Truth-in-Sentencing Requirements
Under truth-in-sentencing laws, inmates must serve their entire sentence, except what is subtracted for good conduct. Lowering the minimum amount of time served to 80, 75, or 70 percent could go a long way toward easing overcrowding—without losing the “certainty and severity of punishment” that truth-in-sentencing laws were designed to guarantee. For example, reducing the minimum amount of time served to 75 percent would save $1.079 billion in 10 years.
Apply the Fair Sentencing Act to Past Cases
One option that would benefit prisoners already in BOP custody (potentially affecting over 3,000 inmates) applies to the Fair Sentencing Act of 2010. The Act increased the quantity of crack cocaine needed to trigger a mandatory minimum sentence, but these statutory changes only applied to cases prospectively. Applying these changes retroactively would reduce sentences for many crack cocaine offenders (table ES.2), and would conservatively lead to savings of $229 million over 10 years.
Extend Earned and Good Time Credits
Federal prisoners can receive reduced sentences for good conduct (except for those with life sentences or with less than a year to serve) and participation in an intensive drug treatment program. Expanding such opportunities could free up bed space through the early release of those who participate in programs proven to cut down on recidivism. Research indicates that the early release of inmates for program participation has no significant impact on recidivism rates.17 Earned time for intensive, evidence-based program participation could save $45 million. An option that would provide similar quantities of credits for both intensive and broader programming could save $224 million.
Another option is giving early release credits for a broader set of programs and productive activities and rewarding inmates based on their risk level. The goal here is to incentivize inmates to engage in conduct and activities that lower their risk levels during the course of incarceration. Low-risk inmates, for example, would earn more credits and would be released early to serve the remainder of their prison terms on home confinement. This would help overcrowding, though mostly in low-security prisons. Under current contracting mechanisms, however, home confinement is more costly than prison; that might change as the BOP renegotiates its contracts for a lower price. A more competitive rate of reimbursement for home confinement is roughly half that which the

Stemming the Tide: Strategies to Reduce the Growth and Cut the Cost of the Federal Prison System 5
BOP currently pays through its contractors. Using competitive market rates for home confinement, transferring low-risk prisoners could save up to $112 million, though it could cost the BOP $79 million if no contract changes are made.
Table ES.2. Back-End Options to Shrink the Current Federal Prison Population
Estimated bed-years saved over 10 years
Estimated cost savings over 10 yearsa (dollars)
Estimated immediate early releases
Apply Fair Sentencing Act Changes Retroactively
22,000 229 million 2,700 immediate releases
Extend Earned and Good Time Credits
Offer earned time credits for participating in intensive recidivism reduction programs
4,300 45 million 0b
Offer earned time credits for participating in broader set of programs
22,000 224 million 0
Offer risk-based earned time credit for participating in broader set of programs
25,000c -79 to +112 million 0
Give drug treatment program graduates the full 12 months off their sentences
880 9.1 million 0
Give full 85 percent good time creditd 4,000 41 million 4,000
Early Release and Home Confinement for Special Populations
Expand early release for the nonviolent elderly 750 7.8 million 700
Expand compassionate release for sick inmates 24 250 thousand 24
Double the number of international transfers 670 6.9 million 0
a These marginal cost savings do not take into account any cost savings from averted prison construction or prison closures, including staffing changes or other structural changes within the BOP. b Some policies, though targeting the current stock population, would take time to have an impact, for example because of the lead time necessary to implement the new program or policy. Though there may be an effect for these policies, it would not be immediate. c This program would not lead to any early releases from BOP custody, but would transfer inmates out of overcrowded BOP facilities into community corrections programs. Thus, the total BOP population would remain unchanged. d Savings are presented for the first year only.
Two additional earned time policies include expanding upon those already in place. Federal inmates can get up to 12 months off their sentences for successfully completing the Residential Drug Abuse Program (RDAP), but most receive much less than that. Giving graduates the full 12

Stemming the Tide: Strategies to Reduce the Growth and Cut the Cost of the Federal Prison System 6
months of credit would save money and encourage inmates to participate in a program proven to decrease post-release drug use and re-arrest rates.18
Similarly, current inmates could receive the full good conduct credit they earn. Federal law allows inmates up to 54 days of good time credit, but because of the way the BOP calculates time off, inmates actually only receive up to 47 days off.
Release More Elderly and Terminally Ill Inmates Early
Prisons already have early release programs for terminally ill inmates and the elderly, but few inmates are offered this option. These inmates are good candidates for early release because they are less likely to re-offend19 and their medical care is costly.20 The BOP could greatly expand the eligibility criteria for elderly inmates who have served a vast majority of their sentences. The BOP is already expanding and reforming compassionate release for sick and elderly inmates; doubling the number of inmates released early through this program would yield even more savings.
Finally, the federal prison system could increase the number of transfers of foreign national inmates to their home countries. About a quarter of the federal prison population is not US citizens, but less than 1 percent of foreign nationals are transferred through the International Prisoner Transfer Program. Together, expanding elderly and compassionate release and doubling international transfers could save almost $15 million.
Conclusion
Each of these options alone will reduce the federal prison population to some degree. However, to yield a meaningful impact on population and costs, a mix of reforms to sentencing, prosecution, and early release policies are required. The most effective way to reduce overcrowding is to lower mandatory minimums for drugs, which, alone, would reduce overcrowding to the lowest it has been in decades.21 Add two more options—retroactively applying the Fair Sentencing Act to crack offenders already in BOP custody and providing a broader earned time credit for program participation—and the BOP could save $3 billion. Updating the formula for good time credits and providing early release for certain nonviolent older inmates would lead to an additional 5,000 immediate releases, while lowering the truth-in-sentencing requirement for new BOP admissions who exhibit exemplary behavior while in custody would further reduce the future prison population. Even with a mix of reforms, federal prisons may continue to be overcrowded. But a smart combination of policies will save taxpayers billions, make prisons less dangerous, and improve the quality and reach of programs designed to keep inmates from offending again.

Stemming the Tide: Strategies to Reduce the Growth and Cut the Cost of the Federal Prison System 7
Introduction: The Impact of Federal Prison Growth
Over the past several decades, the federal prison population has been growing dramatically; its current population exceeds 219,000,22 with projections of continued growth for the foreseeable future. The BOP has experienced an almost tenfold increase in its population since 1980. This continuous growth has substantial costs. With each passing year, the federal government has been forced to allocate more resources to the federal prison system. The requested BOP budget for FY 2014 accounts for about 25 percent of the DOJ budget.23 In contrast, as recently as FY 2000, spending on the BOP accounted for less than 20 percent of all DOJ expenditures; since then, the rate of growth in the BOP budget is almost twice the rate of growth of the rest of the DOJ.24
A wide array of actors, including Members of Congress, the Attorney General, other administration officials, bipartisan policy advocates, and researchers, has concluded that this growth and its associated costs are unsustainable. The basis for this conclusion varies:
Fiscal impact. Resources spent on the BOP eclipse other budget priorities. Overcrowding risks. Overcrowded facilities can jeopardize the safety of inmates and staff
and limit opportunities for effective programming that can reduce recidivism. Fairness and equity concerns. High levels of incarceration may have disproportionate
impacts on certain subpopulations and communities. Inefficient resource allocation. Current research and recent evidence-based policy changes
implemented in states raise questions about the cost-effectiveness of existing federal sentencing and corrections policies.
The focus on this burgeoning population provides an opportunity to examine the drivers of population growth and costs and to consider options for stemming future growth in the federal system that are consistent with public safety goals. Although some aspects of the federal system differ from the states, states across the country have also experienced increasing criminal justice populations and costs. Many lessons can be learned from the legislative and administrative measures states have implemented to control growth and increase the effectiveness of public safety efforts.
This report examines various policy options at the federal level and projects the expected impact of these changes on federal corrections populations and costs. It begins with a review of the factors driving growth of the federal prison system over the past two decades and what trends suggest is the likely continued growth of the system absent any meaningful changes in policy. We then detail a number of front- and back-end policy changes, including those currently under consideration, from sentencing reform to expanded earned time credits to early release for the terminally ill, and project the estimated impacts of such changes. We conclude by reviewing the most feasible and promising policy options and considering what combination of them could
Stemming the Tide: Strategies to Reduce the Growth and Cut the Cost of the Federal Prison System 8
achieve a reduction in the prison population to reduce overcrowding so that federal prisons are within, or at least closer to, design capacity. This information is meant to inform the ongoing deliberations about the most effective ways to address the overcrowding in federal prisons.

Stemming the Tide: Strategies to Reduce the Growth and Cut the Cost of the Federal Prison System 9
Understanding the Federal Prison Population and Drivers of Growth
The growth in the federal prison population has resulted in overcrowding that threatens the safety of inmates and staff members alike. Currently, over 219,000 inmates are housed in the 119 BOP-operated facilities, 15 contracted secure facilities, and other contract facilities, such as community corrections.25 The expansion in the population is mirrored by dramatic increases in prison expenditures. If the prison population continues to grow as projected, the BOP will need additional funds (see figure 1). These costs will be passed on to the taxpayers and will crowd out other funding priorities.26 The first step in any prison population reduction initiative is to identify the drivers of this growth and overcrowding.
Figure 1. Inmates in BOP Custody Projected to Continue Rising over Coming Decade
Source: James (2013); GAO (2012a).
Main Drivers: Who Goes to Prison and for How Long?
More than 90 percent of BOP inmates are sentenced offenders, mostly for federal crimes.27 The number and composition of offenders committed to federal prison result from the investigations pursued by law enforcement, cases accepted and charged by prosecutors, the dispositions of those cases, the proportion of convicted offenders that receive a term of imprisonment, and the imposed sentence.
0
50,000
100,000
150,000
200,000
250,000
300,000
Inm
ate
po
pu
lati
on
BOP actual
BOP Projection

Stemming the Tide: Strategies to Reduce the Growth and Cut the Cost of the Federal Prison System 10
The BOP does not play a role in these decisions: it is the combination of the volume of admissions and sentence length that drives the inmate population. The length of stay is largely determined by the sentence imposed (informed by the relevant statutory penalties and federal sentencing guidelines)28 and any subsequent sentence reductions that release inmates early. Currently few options for early release exist, and most federal offenders sentenced to prison serve at least 87.5 percent of their term of imprisonment, generally followed by a separate term of supervised release. Unlike parole, supervised release does not replace a portion of the sentence of imprisonment but is in addition to the time spent in prison.
Overview of Federally Sentenced Offenders
As shown in figure 2, from 2000 to 2010, the total number of offenders sentenced under the Sentencing Reform Act (felonies and class A misdemeanors) increased from 59,846 to 83,946 (about 40 percent).29
Figure 2. Offenders Sentenced for Felony and Class A Misdemeanors
Source: US Bureau of Justice Statistics (BJS) Federal Justice Statistics Program (FJSP); US Sentencing Commission (USSC) data, as standardized by FJSP.
0
10,000
20,000
30,000
40,000
50,000
60,000
70,000
80,000
90,000
2000 2001 2002 2003 2004 2005 2006 2007 2008 2009 2010
Violent
Property offenses
Public-order
Weapon
Immigration
Drug

Stemming the Tide: Strategies to Reduce the Growth and Cut the Cost of the Federal Prison System 11
In FY 2011, almost 90 percent of these offenders received a sentence of imprisonment, with about 10 percent receiving probation. By contrast, as recently as 1986, only 50 percent of federally sentenced offenders received a sentence of imprisonment, with over 37 percent receiving probation and most of the rest receiving a fine.30
The average sentence for all federal offenders with a term of imprisonment in FY 2011 was 52 months. Sentence lengths vary significantly depending on the offense, averaging, for example, 88 months for weapons offenders and 74 months for drug offenders.31 These are generally longer than sentences meted out at the state level, where weapons and drug offenders received average sentences of 55 and 57 months, respectively. In many states, there are minimal truth-in-sentencing requirements for non-violent offenders, so the expected time served for each of those offenses is less than half the sentence; at the federal level almost all offenders must serve at least 87 percent of their sentence.32
More than half the federal drug trafficking offenders sentenced in FY 2011 were in the lowest criminal history category (Criminal History Category I).33 Eighty-four percent of the sentenced drug offenders had no weapon involvement.34
Drug trafficking offenders overall had an average sentence of 74 months in FY 2011. Average drug sentences, which have been falling since 2008, dropped even further in FY 2012.35 The reduction in sentence length is driven by lower average crack cocaine sentences and fewer crack prosecutions. Figure 3 displays the average sentence by drug type.
Drug Offenders in the BOP Population
The distribution of offenses varies across the BOP admissions, release, and stock (end-of-year) cohorts. As shown in figure 4, the mix of offenses for admissions and releases are fairly similar to one another, with drugs and immigration each accounting for about one-third of the cohort. However, drug offenders make up about half of the end-of-year population. The length of sentences—particularly for drug offenders, many of whom are subject to mandatory minimum sentences—is an important determinant of the stock population and driver of population growth.
Our 2012 study of the growth in the BOP population from 1998 to 2010 confirmed that time served in prison, particularly for drug offenses, was the largest determinant of the growth in the population.36 Changes in sentencing laws (particularly mandatory minimums) and practices, prison release policies, or both could directly decrease the time served, and thereby moderate prison population growth.

Stemming the Tide: Strategies to Reduce the Growth and Cut the Cost of the Federal Prison System 12
Figure 3. Average Prison Sentence for Each Drug Type (months)
Source: USSC (2013). Note: The data for these sentences are from FY 2012.
BOP Projects Continued Prison Growth and Overcrowding
BOP facilities are currently operating at between 35 and 40 percent above their rated capacity; this overcrowding is greater in high-security facilities, which in FY 2012 were operating at 51 percent over capacity, with medium-security facilities 47 percent above capacity.37 The capacity of BOP facilities in 2012 was 128,359, but BOP-operated facilities housed 177,556 inmates in 2012.38 Since FY 2000, the inmate-to-staff ratio will have increased from about four to one to a projected five to one in FY 2014.39
This untenable status quo will be the norm for the coming decade: BOP projects that, through 2020, federal prisons will be overcrowded by at least 33 percent, with the population exceeding system capacity by at least 50,000 people each year.40 The BOP anticipates adding over 25,000 beds by 2020, but most of these projects have not yet been approved, and would not substantially reduce overcrowding (see figure 5).41
83
97
73
36
92
59
Powder Cocaine(n=5,847)
Crack Cocaine(n=3,388)
Heroin(n=2,082)
Marijuana(n=6,484)
Methamphetamine(n=4,834)
Other(n=1,341)

Stemming the Tide: Strategies to Reduce the Growth and Cut the Cost of the Federal Prison System 13
Figure 4. BOP FY 2011 Offense Distribution
Source: BOP FY 2011 data, as analyzed by the Urban Institute. Note: Stock population is the prison population as of September 30, 2011.
Prison Is Expensive
The average cost of housing an inmate in a BOP facility in FY 2012 was over $29,000 annually. Annual costs per inmate are $21,694 for minimum security, $27,166 for low security, $26,686 for medium security, and $34,046 for high security.42 According to the BOP, much of these average costs of housing an inmate are fixed, as they go toward maintaining and staffing facilities (which are unlikely to close as a result of a shrinking prison population). Thus, the average marginal cost of increasing or decreasing the population by one inmate is $10,363.43
Average annual cost per inmate housed in a Residential Reentry Center (RRC, also known as a half-way house) for the BOP is $27,003.44 The BOP also has custody over offenders on home confinement, for which it pays contractors a flat fee for each offender. As documented by the GAO, the reimbursement rate to contractors for each inmate in home confinement that the BOP pays is pegged to half the overall per diem rate of an RRC, or over $13,500 annually.45 Any policy change that transfers an inmate from a BOP facility to home confinement would, under current contracting arrangements, cost more than keeping the inmate in a BOP facility ($13,500 versus $10,363, respectively). The annual cost of supervision by probation officers, however, is about $3,347 per
0%
10%
20%
30%
40%
50%
60%
70%
80%
90%
100%
Admissions Stock Population Releases
Violent
Property
Public-Order
Weapon
Immigration
Drug

Stemming the Tide: Strategies to Reduce the Growth and Cut the Cost of the Federal Prison System 14
offender.46 We estimate that augmenting this traditional probation with electronic monitoring to verify home confinement would cost a total of $5,890 annually,47 less than half what the BOP currently pays contractors.
Figure 5. BOP Projected Overcrowding Compared with Current Capacity and New Beds
Source: GAO (2012a).
Currently, 56 percent of the current federal inmate population is housed in minimum- or low-security facilities. Almost 30 percent are housed in medium-security facilities and about 11 percent are housed in high-security facilities.48
The President’s FY 2014 budget request for BOP totals $6.9 billion, reflecting an increase of $310 million (4.7 percent) from the FY 2012 enacted budget. These additional funds will backfill currently open positions, enabling recently completed prisons to operate and, to a limited degree, expand inmate programming.49 However, these changes will not have any substantial or sustainable impact on the overcrowding or inmate-to-staff ratio trends.
The requested BOP budget for FY 2014 accounts for over 25 percent of the total DOJ budget request.50 As indicated in Figure 6, if present trends continue, the BOP will continue to consume more of the DOJ budget, approaching 30 percent in 2020. In these fiscally lean times, funding the expanding BOP population crowds out other priorities, including federal investigators, federal prosecutors, and support for state and local governments.51 This situation is projected to continue into the future, but it is unclear to what extent budget sequestration may exacerbate or decelerate these trends.
0
50,000
100,000
150,000
200,000
250,000
2012 2013 2014 2015 2016 2017 2018 2019 2020
Current capacity
New beds
Projected overcrowding

Stemming the Tide: Strategies to Reduce the Growth and Cut the Cost of the Federal Prison System 15
Figure 6. BOP Budget as a Portion of Total DOJ Budget FY 2000–2012 and Projected through 2020
Source: Department of Justice Summary of Budget Authority by Appropriation FY 2000–2013.
Safety Ramifications of Prison Overcrowding
Beyond the fiscal problems associated with maintaining such a large federal prison population, overcrowding threatens the safety of inmates and prison staff and undermines the ability to provide effective programming.52
Expanded use of double and triple bunking inmates and more inmates per corrections officer o Overcrowding is most concentrated in high-security facilities, where over 90 percent of
inmates have a history of violence. Overcrowding is currently above 50 percent in high-security facilities.53
o The BOP has found that high inmate to corrections officer ratios are correlated with increases in the incidence of serious assault.54
o In February 2013, a BOP officer was killed for the first time in 5 years, while working alone in a unit housing 130 inmates.55
Difficulty providing services designed to reduce recidivism due to lack of space, inadequate staff, and, thus, long waiting lists for educational, treatment, vocational, and other reentry programming.56
$-
$5
$10
$15
$20
$25
$30
$35
(Bill
ion
s)
Total DOJdiscretionary budget(non-BOP)
BOP Enacted Budget,Actual Dollars
29% of DOJ budget
Stemming the Tide: Strategies to Reduce the Growth and Cut the Cost of the Federal Prison System 16
Increased health and safety hazards from over-used infrastructure, such as toilets, showers, and food service equipment.57
Given the wide-ranging policies and factors associated with the historical and projected future growth of the federal corrections system and the detrimental impact of that growth on prison conditions, inmate and staff safety, and the ability to provide recidivism-reducing programming and treatment, it is critical that options be explored that thwart future growth. We now turn to a description of various policy options under consideration, along with their projected population and cost impacts.

Stemming the Tide: Strategies to Reduce the Growth and Cut the Cost of the Federal Prison System 17
Policy Options to Ease Growth and Reduce Costs
Options to address the current overcrowding problem and stem the tide of federal prison growth include changes that reduce the number of people entering the BOP and their sentence length (front-end options) and changes that can lead to early release or transfer to community corrections for people already in BOP custody (back-end options). Only a combination of both front- and back-end policies will be effective at reducing overcrowding and spending in both the short and long term.
Front-end options include adjusting prosecution priorities and modifying sentencing laws and guidelines to reduce the incidence of imprisonment and shorten sentences for some or all offense types; reducing the severity and incidence of mandatory minimum sentences; providing judges with greater discretion; and adjusting good time and truth-in-sentencing requirements. These measures can reduce spending and overcrowding substantially in both the short and long term by reducing the number of people entering BOP custody, and by leading to earlier releases.
Back-end options include greater use of early release and home confinement for special populations, including older offenders and those with extreme medical needs, and expanded earned time and good time credits for inmates. These options, which are typically circumscribed with respect to eligibility, are needed to reduce overcrowding and spending in the near term.
The remainder of this report is structured to follow the flow of decision points through the criminal justice system. First, we discuss the decision to bring a case in federal court and how offenders are sentenced, followed by options to effect early release of offenders already in the BOP custody. For each of these policy options, policymakers must carefully weigh the benefits of reduced overcrowding and BOP spending in the context of public safety and risk of recidivism. Many of these types of options have been piloted at the state level or have research bases that support their public safety benefits or neutrality.
Our population and cost estimates for all policy options presented below rely on similar methodology and assumptions, outlined in the Methodology at the end of this report and are more fully detailed in Appendix B. In all instances, we have made conservative assumptions in developing our estimates. The cost estimates for dollars saved are based on the average marginal cost of imprisoning one inmate for one year—these do not take into account the cost savings that could accrue from averted prison construction or prison closures, including staffing changes or other structural changes within the BOP. Some front-end policy options are large enough that they could avert spending on prison construction or purchases of new facilities; such savings are not incorporated into our estimates of operational costs saved.

Stemming the Tide: Strategies to Reduce the Growth and Cut the Cost of the Federal Prison System 18
Front-end Changes
Decreasing the number of offenders committed to prison and reducing their sentence lengths, particularly for drug offenders, would be the most direct way to slow the projected growth of the BOP population or even reduce the population. The BOP does not control either of these drivers, but US Attorneys could modify their priorities and charging practices, for example as recently directed by the Attorney General.58 Similarly, legislative changes could reduce the length of statutory mandatory minimum sentences or the minimum percentage of time served for incoming cohorts. As the number of drug offenders and their lengthy sentences are the primary drivers of prison population growth, many of these changes are targeted toward drug offenders or those subject to mandatory minimum sentences.
The estimates presented below are generated for each incoming cohort of BOP admissions for the next 10 years. For estimates of the future overcrowding, we rely on the BOP’s long-term year-over-year projections of population growth, assuming that no new prisons are purchased, constructed, or brought online during this time.59 Without any policy changes, we assume that overcrowding will rise to 55 percent within 10 years.
Drug Offender Options
Our previous research has shown that the single largest factor in the growth of the federal prison population is the length of drug sentences. Any policy change that seeks to address the root causes of the prison population growth, then, must address either the length of time served by drug offenders or the number of drug offenders entering the federal system. The increasing drug sentence trends date back to the mid-1980s, when Congress passed major changes to the federal criminal justice system. First, the Sentencing Reform Act of 1984 (SRA) instituted determinate sentencing guidelines, abolished parole, and established a truth-in-sentencing threshold of 85 percent. The SRA addressed widespread concerns about sentencing disparities, uncertainty on the part of both victims of crime and policy planners, and a “luck of the draw” system whereby offenders with similar offenses and histories could ultimately receive very different sentences. The SRA was designed to make it more likely that offenders convicted of similar crimes would be treated similarly, but the law has had numerous critics, some of whom allege that the new system led to judges sentencing lower level offenders to prison as opposed to exhausting non-incarceration options.60 Though federal sentences were becoming more reliant on incarceration as opposed to probation, the SRA ensconced the default toward incarceration and away from alternatives such as probation and community based treatment.61
In 1986, Congress enacted the Anti-Drug Abuse Act, which established federal mandatory minimum penalties for certain drug offenses, most notably those that involve trafficking certain amounts of various drug types. Taken in conjunction with the truth-in-sentencing reforms enacted
Stemming the Tide: Strategies to Reduce the Growth and Cut the Cost of the Federal Prison System 19
by the SRA, these changes virtually guaranteed that drug offenders would serve substantially longer federal prison terms.
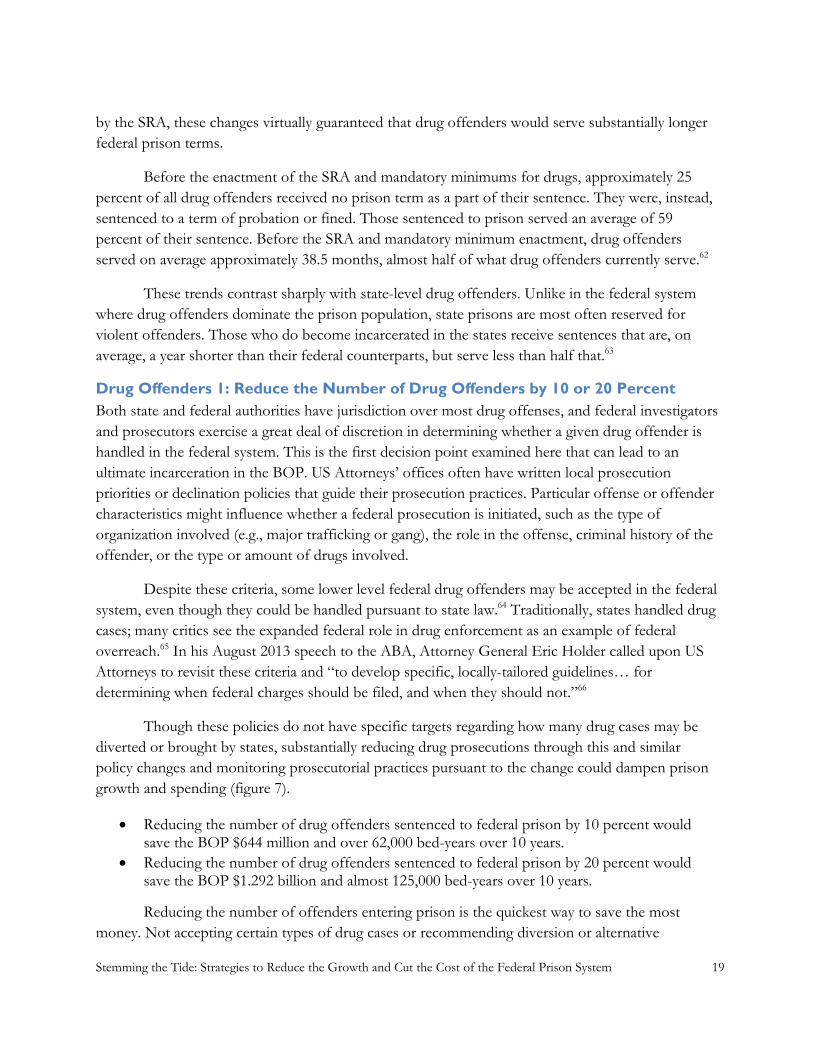
Before the enactment of the SRA and mandatory minimums for drugs, approximately 25 percent of all drug offenders received no prison term as a part of their sentence. They were, instead, sentenced to a term of probation or fined. Those sentenced to prison served an average of 59 percent of their sentence. Before the SRA and mandatory minimum enactment, drug offenders served on average approximately 38.5 months, almost half of what drug offenders currently serve.62
These trends contrast sharply with state-level drug offenders. Unlike in the federal system where drug offenders dominate the prison population, state prisons are most often reserved for violent offenders. Those who do become incarcerated in the states receive sentences that are, on average, a year shorter than their federal counterparts, but serve less than half that.63
Drug Offenders 1: Reduce the Number of Drug Offenders by 10 or 20 Percent Both state and federal authorities have jurisdiction over most drug offenses, and federal investigators and prosecutors exercise a great deal of discretion in determining whether a given drug offender is handled in the federal system. This is the first decision point examined here that can lead to an ultimate incarceration in the BOP. US Attorneys’ offices often have written local prosecution priorities or declination policies that guide their prosecution practices. Particular offense or offender characteristics might influence whether a federal prosecution is initiated, such as the type of organization involved (e.g., major trafficking or gang), the role in the offense, criminal history of the offender, or the type or amount of drugs involved.
Despite these criteria, some lower level federal drug offenders may be accepted in the federal system, even though they could be handled pursuant to state law.64 Traditionally, states handled drug cases; many critics see the expanded federal role in drug enforcement as an example of federal overreach.65 In his August 2013 speech to the ABA, Attorney General Eric Holder called upon US Attorneys to revisit these criteria and “to develop specific, locally-tailored guidelines… for determining when federal charges should be filed, and when they should not.”66
Though these policies do not have specific targets regarding how many drug cases may be diverted or brought by states, substantially reducing drug prosecutions through this and similar policy changes and monitoring prosecutorial practices pursuant to the change could dampen prison growth and spending (figure 7).
Reducing the number of drug offenders sentenced to federal prison by 10 percent would save the BOP $644 million and over 62,000 bed-years over 10 years.
Reducing the number of drug offenders sentenced to federal prison by 20 percent would save the BOP $1.292 billion and almost 125,000 bed-years over 10 years.
Reducing the number of offenders entering prison is the quickest way to save the most money. Not accepting certain types of drug cases or recommending diversion or alternative

Stemming the Tide: Strategies to Reduce the Growth and Cut the Cost of the Federal Prison System 20
sentences for drug offenders would reduce the number of drug offenders entering the BOP immediately. With fewer people entering federal prison, savings and reductions in overcrowding would also begin immediately.
Figure 7. Annual Savings from Reduction in Drug Offenders Entering the BOP
Source: Urban Institute analysis of FY 2011 BOP data.
Though reducing the number of offenders incarcerated in federal prison for drug offenses would generate real savings for the BOP over 10 years, this change alone would not stabilize the projected growth of overcrowding. Reducing the number of drug offenders entering federal prison by 10 percent would reduce projected overcrowding from 55 percent to 49 percent, and reducing the number of drug offenders by 20 percent would reduce projected overcrowding from 55 percent to 42 percent (figure 8).
Drug Offenders 2: Reduce Drug Sentences by 10 or 20 Percent Another option to reduce the number of drug offenders in federal prison is to reduce sentences. This reduction could be initiated by policy changes at either the case level of prosecutorial discretion (what charges a prosecutor chooses to bring) or broader sentencing policy (as determined by legislation or the sentencing guidelines). Thus, the ultimate sentence is first a function of what charges prosecutors choose to bring and, following conviction, a function of what the corresponding sentences to those charges are, as dictated by the statutory penalties or advised by sentencing guidelines.
On the individual case level, prosecutors have discretion over what charges to bring against offenders. Prosecutors must weigh defendant- and case-specific characteristics with the local and
0
20
40
60
80
100
120
140
160
180
200
2014 2015 2016 2017 2018 2019 2020 2021 2022 2023
Mill
ion
s o
f d
olla
rs
10%reduction
20%reduction

Stemming the Tide: Strategies to Reduce the Growth and Cut the Cost of the Federal Prison System 21
federal contexts.67 Until recently, some lower-level, nonviolent drug offenders were subject to mandatory minimum penalties regardless of their role in the organization.68 As mandatory minimum penalties were originally intended to target “serious” and “major” offenders,69 these terms of imprisonment may be unnecessarily lengthy with no added benefit to public safety. Attorney General Holder’s 2013 Department Policy Memo70 directs prosecutors to refrain from charging lower-level, nonviolent drug offenders with drug quantities that would trigger a mandatory minimum sentence. This would reduce the sentence length for this subpopulation.
Figure 8. Projected percent overcapacity in BOP facilities with reduction in drug offenders entering the BOP
Source: Urban Institute analysis of FY 2011 BOP data; GAO (2012a); and BOP 2014 Budget Hearing.
Some argue that all drug trafficking sentences are, across the board, too lengthy. A change at the sentencing level is to reduce the base offense level for drug offenses, effectively an across the board reduction for those whose sentences are not already at the statutory minimum. A reduction of two offense levels would roughly correspond to a 20 percent reduction for those not directly at the statutory minimum. A previous reduction of the same magnitude targeting only crack offenders was shown to have no effect on recidivism and public safety—those with shortened sentences were no greater risk to public safety than those with longer sentences.71
Changes in policy and practice as described above could have diverse or divergent impacts on sentence length as imposed on drug offenders; here, we examine the results of reducing drug sentences across the board by 10 percent or 20 percent. These changes would not be targeted specifically at certain drug types or sentence lengths, but would rather affect the entire distribution of offenders.
An across the board 10 percent reduction in the length of drug sentences would save the BOP almost $538 million in 10 years, the equivalent of almost 52,000 bed-years.
0%
10%
20%
30%
40%
50%
60%
2014 2015 2016 2017 2018 2019 2020 2021 2022 2023
Status quo
10% reduction
20% reduction

Stemming the Tide: Strategies to Reduce the Growth and Cut the Cost of the Federal Prison System 22
An across the board 20 percent reduction in the length of drug sentences would save the BOP over $1.133 billion in 10 years, the equivalent of over 109,000 bed-years.
The annual savings that result from implementing either of these changes, illustrated in figure 9, would approach $100 million annually for a 10 percent reduction and $200 million annually for a 20 percent reduction by the end of the 10-year window. Because drug sentences tend to be extremely long, most of these savings accrue at the end of the 10-year window. Compared with a reduction in the number of prosecutions in general, this generates fewer savings over the 10-year window, because reducing the number of offenders entering the system generates savings more immediately for each annual incoming cohort.
Figure 9. Annual Savings from Reduction in Drug Sentences
Source: Urban Institute analysis of FY 2011 BOP data.
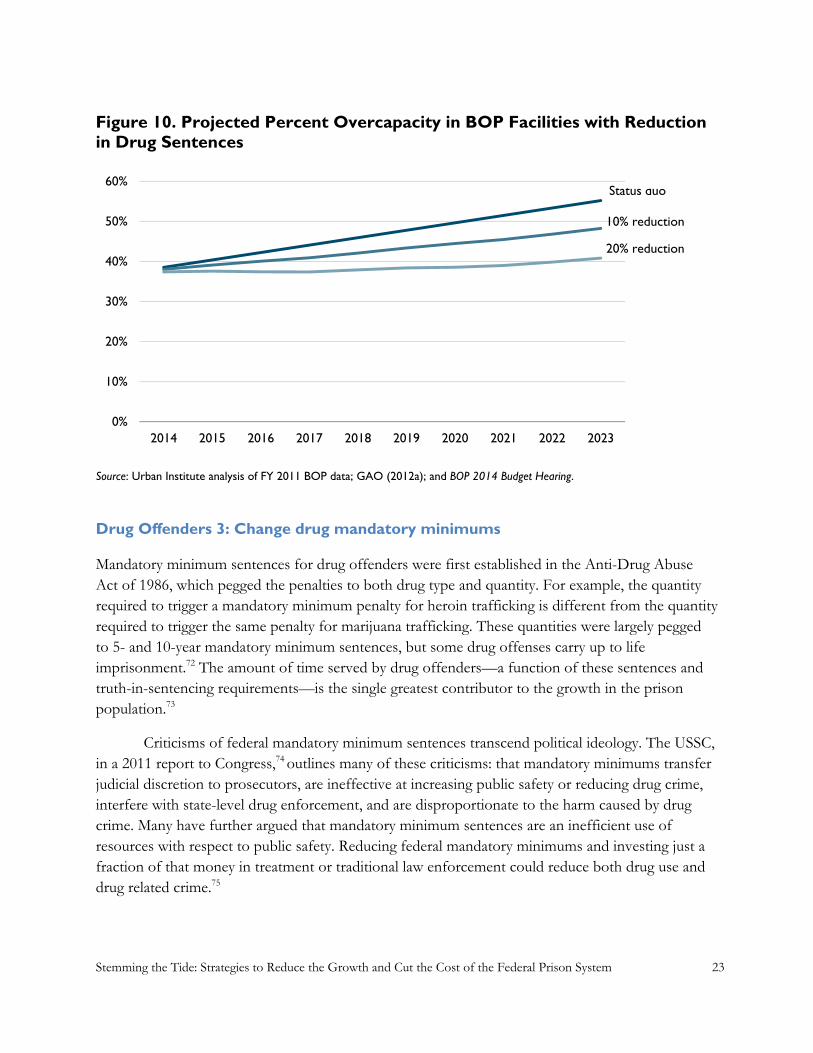
These policies may be effective at slowing, but not halting, the projected increase in overcrowding. An across the board 10 percent reduction would reduce the projected level of overcrowding in 10 years from 55 percent to 48 percent. An across the board 20 percent reduction would keep overcrowding below 41 percent in each year prior to and including 2023. Neither of these changes stabilizes or reduces future overcrowding, as shown in figure 10.
0
50
100
150
200
250
2014 2015 2016 2017 2018 2019 2020 2021 2022 2023
Mill
ion
s o
f d
olla
rs
10% reduction
20% reduction
Stemming the Tide: Strategies to Reduce the Growth and Cut the Cost of the Federal Prison System 23
Figure 10. Projected Percent Overcapacity in BOP Facilities with Reduction in Drug Sentences
Source: Urban Institute analysis of FY 2011 BOP data; GAO (2012a); and BOP 2014 Budget Hearing.
Drug Offenders 3: Change drug mandatory minimums
Mandatory minimum sentences for drug offenders were first established in the Anti-Drug Abuse Act of 1986, which pegged the penalties to both drug type and quantity. For example, the quantity required to trigger a mandatory minimum penalty for heroin trafficking is different from the quantity required to trigger the same penalty for marijuana trafficking. These quantities were largely pegged to 5- and 10-year mandatory minimum sentences, but some drug offenses carry up to life imprisonment.72 The amount of time served by drug offenders—a function of these sentences and truth-in-sentencing requirements—is the single greatest contributor to the growth in the prison population.73
Criticisms of federal mandatory minimum sentences transcend political ideology. The USSC, in a 2011 report to Congress,74 outlines many of these criticisms: that mandatory minimums transfer judicial discretion to prosecutors, are ineffective at increasing public safety or reducing drug crime, interfere with state-level drug enforcement, and are disproportionate to the harm caused by drug crime. Many have further argued that mandatory minimum sentences are an inefficient use of resources with respect to public safety. Reducing federal mandatory minimums and investing just a fraction of that money in treatment or traditional law enforcement could reduce both drug use and drug related crime.75
0%
10%
20%
30%
40%
50%
60%
2014 2015 2016 2017 2018 2019 2020 2021 2022 2023
Status quo
10% reduction
20% reduction

Stemming the Tide: Strategies to Reduce the Growth and Cut the Cost of the Federal Prison System 24
Given these comprehensive and multifaceted objections, many are calling for Congressional action to reduce drug mandatory minimum penalties. One proposal would reduce certain 5-year minimums to 2, 10-year minimums to 5, and 20-year minimums to 10.76 Annually, 15,000 offenders are convicted of drug offenses that carry the mandatory minimum penalty (though some are subject to relief through the safety valve or substantial assistance); this legislative change would therefore have a substantial impact on both the overcrowding of federal prisons and the BOP’s fiscal situation because each new cohort of sentenced drug offenders could receive a greatly reduced sentence.
Reducing mandatory minimum sentences for certain drug offenders by half or more would have a monumental effect on the prison system: though a substantial effect would not be evident for 2 years (the minimum), the program would cumulatively save $2.485 billion over 10 years. By the end of the 10-year time frame, the BOP would save over $460 million annually.
These changes would dramatically reduce overcrowding in BOP facilities in the coming years. As illustrated in figure 11, overcrowding is expected to drop below current levels to 20 percent by 2023. Over 10 years, it would save almost 240,000 bed-years total.
Figure 11. Projected Percent Overcapacity in BOP Facilities with Reduction in Mandatory Minimum Drug Sentences
Source: Urban Institute analysis of FY 2010 and FY 2012 USSC data; GAO (2012a); and BOP 2014 Budget Hearing.
0%
10%
20%
30%
40%
50%
60%
2014 2015 2016 2017 2018 2019 2020 2021 2022 2023
Status quo
With policy change

Stemming the Tide: Strategies to Reduce the Growth and Cut the Cost of the Federal Prison System 25
Expanded Safety Valve and Judicial Discretion for Mandatory Minimum Sentences
Currently, one way for offenders subject to a mandatory minimum penalty to get relief from the required punishment is through judicial application of the safety valve. The safety valve77 allows judges to exempt certain drug offenders from a mandatory minimum sentence if the offenders meet certain criteria, one of which is having a minimal criminal history. Judges may only grant a safety valve reduction to drug offenders in Criminal History Category I (out of six)—those with no or very minor previous criminal history. In order to qualify for the safety valve, offenders must also have not used weapons or violence in the offense, had a leadership role, or withheld information from the government. Judges, therefore, have little discretion in deviating below a mandatory minimum penalty for drug offenders with more extensive criminal histories, or for non-drug offenders subject to mandatory minimum penalties. In FY 2012, 5,843 low-criminal history drug offenders received a safety valve reduction from their sentence.78
Safety Valve 1: Expand Safety Valve to Criminal History Category II One option to increase the discretion of judges to reduce offenders’ penalties below a mandatory minimum is to expand the extant safety valve to nonviolent drug offenders in Criminal History Category II. They can also be considered as having minor criminal histories and as being of little threat to public safety. Under this proposal, the other criteria of safety valve eligibility—for example, not having a leadership role in the offense— continue to apply. Though estimates of who exactly may become eligible differ, the USSC determined that, annually, over two thousand offenders in Criminal History Category II would qualify for a sentence reduction if the safety valve were extended.79
Extending the safety valve to those offenders identified by the USSC would save the BOP over $544 million over 10 years, the equivalent of almost 53,000 bed-years.
On its own, the safety valve extension would not have a considerable impact on reducing overcrowding: overcrowding would continue to rise to 46 percent.
Most of the savings from extending the safety valve for drug offenders accrue after several years, as shown in figure 12 and 13. Though the safety valve substantially reduces sentences, many offenders still have to serve at least two or three years at a minimum before release from prison. By the end of the 10-year time frame, the BOP would average almost $120 million in savings annually, the equivalent of saving over 11,000 bed-years.

Stemming the Tide: Strategies to Reduce the Growth and Cut the Cost of the Federal Prison System 26
Figure 12. Cumulative Savings of Expanding Safety Valve to Criminal History Category II
Source: Urban Institute analysis of USSC (2011) and Saris 2013 testimony.
Figure 13. Projected Percent Overcapacity in BOP Facilities with Expansion of Safety Valve to Criminal History Category II
Source: Urban Institute analysis of USSC (2011); Saris 2013 testimony; GAO (2012a); and BOP 2014 Budget Hearing.
0
100
200
300
400
500
600
2014 2015 2016 2017 2018 2019 2020 2021 2022 2023
Mill
ion
s o
f d
olla
rs
0%
10%
20%
30%
40%
50%
60%
2014 2015 2016 2017 2018 2019 2020 2021 2022 2023
Status quo
With policy change

Stemming the Tide: Strategies to Reduce the Growth and Cut the Cost of the Federal Prison System 27
Safety Valve 2: Create New Safety Valve for Mandatory Minimum Offenders Another proposed option to provide more discretion in waiving mandatory minimum sentences is the creation of a new safety valve that could apply to any offender charged with an offense carrying a mandatory minimum sentence. The proposed safety valve would not have the same criteria as the current one that is targeted toward drug offenders; rather it would apply to all federal mandatory minimum sentences and permit judges to sentence below the mandatory minimum term.80 This would extend judicial discretion in reducing mandatory minimum sentences beyond drug offenders with minimal criminal histories to drug offenders with more extensive criminal histories, some weapons offenders, armed career criminals, sex abuse offenders, child pornography offenders, and identity theft offenders.
Because judges would decide whether to apply this new safety valve on a case-by-case basis, there is little way to predict how it will be applied across crime categories and offenders.
For the purpose of these projections, we assume that judges will only extend their authority to a subset of weapons offenders (those not charged with brandishing or firing a weapon), some drug offenders, and child pornography offenders (those not charged with production, transportation, or distribution).
We project that expanding safety valve eligibility to all offenders subject to a mandatory minimum sentence would save $835 million over 10 years. This is the equivalent of almost 81,000 bed-years.
Figure 14. Cumulative Savings of Creating New Safety Valve
Source: Urban Institute analysis of USSC (2011) and Saris 2013 testimony.
0
100
200
300
400
500
600
700
800
900
2014 2015 2016 2017 2018 2019 2020 2021 2022 2023
Mill
ion
s o
f d
olla
rs
Stemming the Tide: Strategies to Reduce the Growth and Cut the Cost of the Federal Prison System 28
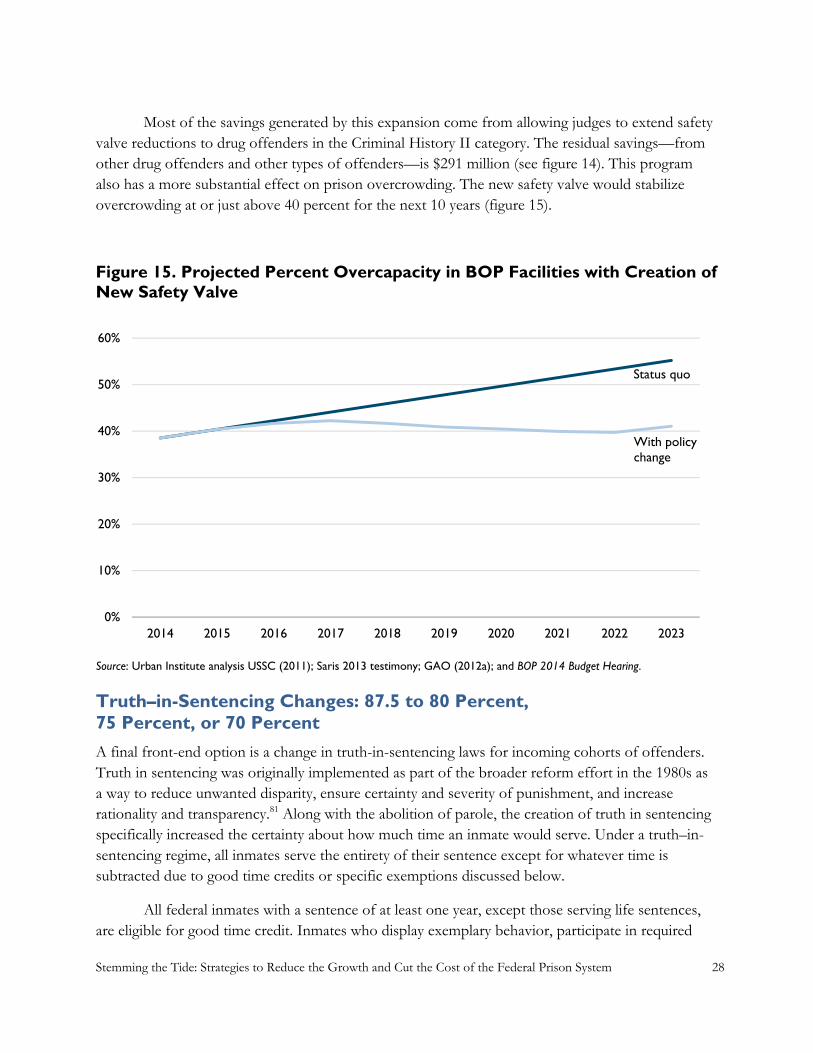
Most of the savings generated by this expansion come from allowing judges to extend safety valve reductions to drug offenders in the Criminal History II category. The residual savings—from other drug offenders and other types of offenders—is $291 million (see figure 14). This program also has a more substantial effect on prison overcrowding. The new safety valve would stabilize overcrowding at or just above 40 percent for the next 10 years (figure 15).
Figure 15. Projected Percent Overcapacity in BOP Facilities with Creation of New Safety Valve
Source: Urban Institute analysis USSC (2011); Saris 2013 testimony; GAO (2012a); and BOP 2014 Budget Hearing.
Truth–in-Sentencing Changes: 87.5 to 80 Percent, 75 Percent, or 70 Percent
A final front-end option is a change in truth-in-sentencing laws for incoming cohorts of offenders. Truth in sentencing was originally implemented as part of the broader reform effort in the 1980s as a way to reduce unwanted disparity, ensure certainty and severity of punishment, and increase rationality and transparency.81 Along with the abolition of parole, the creation of truth in sentencing specifically increased the certainty about how much time an inmate would serve. Under a truth–in-sentencing regime, all inmates serve the entirety of their sentence except for whatever time is subtracted due to good time credits or specific exemptions discussed below.
All federal inmates with a sentence of at least one year, except those serving life sentences, are eligible for good time credit. Inmates who display exemplary behavior, participate in required
0%
10%
20%
30%
40%
50%
60%
2014 2015 2016 2017 2018 2019 2020 2021 2022 2023
Status quo
With policy change

Stemming the Tide: Strategies to Reduce the Growth and Cut the Cost of the Federal Prison System 29
prison programming, and make satisfactory progress toward obtaining a GED or high school diploma may receive up to 54 days off (or 15 percent) of each year of their prison term. Because of the way the BOP calculates good time, inmates do not receive the full 54 days per year, and consequently typically served 87 percent and not 85 percent of their sentences.
Many states also experimented with truth-in-sentencing laws, often requiring an 85 percent threshold for violent offenders and some lower threshold for nonviolent offenders. The Violent Offender Incarceration and Truth-in-Sentencing Incentive (VOI/TIS) Grant Program, authorized by the Violent Crime Control and Law Enforcement Act of 1994, further incentivized states to adopt truth in sentencing with funding to build or expand prisons and jails.82 Faced with high prison populations and shrinking budgets, however, many states recently revised their truth-in-sentencing provisions to allow for earlier release. Mississippi, for example, passed a law significantly reducing the TIS threshold from 85 percent to 25 percent for many offenders; this policy both reduced the prison population and saved the state money, without compromising public safety.83 These states have recognized that certainty, as a crucial attribute in the sentencing process (especially for victims and victims’ advocates),84 is not compromised by lowering time served thresholds as long as the change is well publicized.
Here, we consider the possibility of granting greater good time credits for all incoming BOP cohorts: the minimum amount of time served could be reduced to 80 percent, 75 percent, or 70 percent, such that all offenders, regardless of time off, still serve a vast majority of their sentence. If each future cohort of BOP admissions is eligible for these truth-in-sentencing changes, there would be substantial fiscal savings and reduced overcrowding.
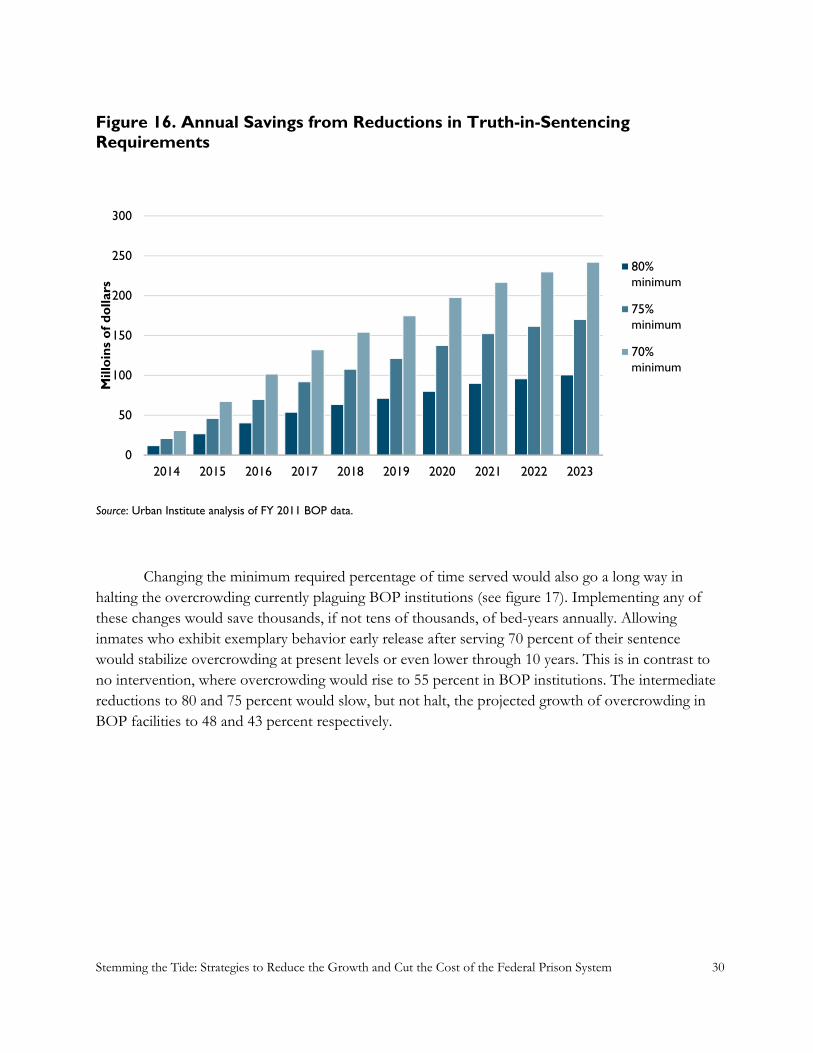
Reducing the minimum sentence served to 80 percent would save $634 million within 10 years. This is the equivalent of over 61,000 bed-years.
Reducing the minimum to 75 percent would save $1.079 billion within 10 years. This is the equivalent of over 104,000 bed-years
Reducing the minimum to 70 percent would save $1.547 billion within 10 years. This is the equivalent of over 149,000 bed-years—almost the size of the current BOP stock population in BOP facilities.
As shown in figure 16, as more cohorts enter the BOP system, more potential savings are accrued. Thus, most of these potential savings accrue in the latter half of the decade, as multiple cohorts are released from BOP custody simultaneously.
Stemming the Tide: Strategies to Reduce the Growth and Cut the Cost of the Federal Prison System 30
Figure 16. Annual Savings from Reductions in Truth-in-Sentencing Requirements
Source: Urban Institute analysis of FY 2011 BOP data.
Changing the minimum required percentage of time served would also go a long way in halting the overcrowding currently plaguing BOP institutions (see figure 17). Implementing any of these changes would save thousands, if not tens of thousands, of bed-years annually. Allowing inmates who exhibit exemplary behavior early release after serving 70 percent of their sentence would stabilize overcrowding at present levels or even lower through 10 years. This is in contrast to no intervention, where overcrowding would rise to 55 percent in BOP institutions. The intermediate reductions to 80 and 75 percent would slow, but not halt, the projected growth of overcrowding in BOP facilities to 48 and 43 percent respectively.
0
50
100
150
200
250
300
2014 2015 2016 2017 2018 2019 2020 2021 2022 2023
Mill
oin
s o
f d
olla
rs
80%minimum
75%minimum
70%minimum

Stemming the Tide: Strategies to Reduce the Growth and Cut the Cost of the Federal Prison System 31
Figure 17. Projected Percent Overcapacity with Truth-in-Sentencing Reductions
Source: Urban Institute analysis of FY 2011 BOP data, GAO (2012a); and BOP 2014 Budget Hearing.
Back-end Changes
Although the main drivers of the BOP population are the number of offenders admitted and sentence length, reductions in time served on the back end can also ease crowding and slow the population growth trend. While the BOP plays a lead implementation role in most back-end sentence reductions, current authorities are limited by statute and, in some cases, budgetary constraints. The options described below focus on inmates currently housed in federal prison and often target special populations that already qualify for BOP early release programs or are at a low risk for recidivism. The cost and population estimates presented in this section are limited to the current BOP population and do not incorporate future incoming cohorts of inmates.
Some of these options draw a distinction between early transfer to home confinement as part of the term of imprisonment and early release to a term of supervised release; this distinction has significant implications both with respect to the remainder of time offenders serve and the cost implications of the policy change. Most BOP inmates must serve a term of court-mandated supervised release, administered by Federal Office of Probation and Pretrial Services (OPPS), following their release from BOP custody. Thus, any early release into supervised release effectively ends the term of BOP custody. In contrast, inmates released into home confinement are still in the custody of the BOP until they serve out the remainder of their prison sentence; at the end of home
0%
10%
20%
30%
40%
50%
60%
2014 2015 2016 2017 2018 2019 2020 2021 2022 2023
Status quo
80% reduction
75% reduction
70% reduction

Stemming the Tide: Strategies to Reduce the Growth and Cut the Cost of the Federal Prison System 32
confinement, they become subject to the court-mandated term of supervised release. Thus, transfer from a BOP facility to home confinement results in greater time served and is more costly to the BOP than release directly to supervised release. Also, as previously mentioned, due to current BOP contracting practices, transferring an inmate to home confinement from a BOP facility is more expensive than keeping the inmate in a BOP facility.
Retroactively Apply Statutory Changes Made by the Fair Sentencing Act
As discussed in the Drug Offenders 3 section, all drug mandatory minimum sentences are pegged to both drug type and quantity such that similar quantities of different drugs trigger different penalties. The Fair Sentencing Act (FSA) of 2010 increased the quantity of crack cocaine required to trigger a mandatory minimum sentence. Instead of requiring 5 grams for a mandatory minimum sentence of 5 years, and 50 grams for a mandatory minimum sentence of 10 years, the FSA set the quantity thresholds at 28 grams and 280 grams respectively, while abolishing a mandatory minimum for simple possession (without a trafficking offense). Before the FSA, the crack thresholds were substantially lower than many other drugs; for example, the quantity of powder cocaine required to be involved in a trafficking offense to trigger a mandatory minimum sentence was 100 times higher than the quantity of crack.
Although the corresponding sentencing guidelines amendments were made retroactive, resulting in reduced sentences for some crack cocaine offenders serving time in the BOP, Congress did not explicitly make the statutory changes retroactive. Congress has already deemed these changes prudent for future offenders’ sentences and applying these standards retroactively would relieve overcrowding immediately.85 Further, previous research has shown that applying a sentencing change retroactively for crack offenders does not increase their risk for recidivism.86 Under this proposal, inmates would not be automatically eligible for sentence reductions, as judges would make case-by-case determinations.
An unpublished USSC estimate concludes that applying these statutory changes retroactively would result in 3,695 releases in the first year; a vast majority of the early released prisoners (3,013) have more than one year remaining on their sentences prior to release.
This would also generate substantial cost savings from averted incarceration costs in 10 years. We conservatively estimate that almost $229 million, or over 22,000 bed-years, would be saved from these early releases.
Earned Time and Good Time Credits
As correctional populations in federal prisons continue to rise, expanding the earned and good time credit programs could have a meaningful impact on reducing the BOP population. Beyond helping to lessen prison growth and overcrowding, these policies have the added benefit of providing inmates with programming that can help strengthen their skills and reduce their risk of recidivating.
Stemming the Tide: Strategies to Reduce the Growth and Cut the Cost of the Federal Prison System 33
As discussed above, all federal inmates with a sentence of at least one year, except those serving life sentences, are eligible for good time credit of up to 12.5 percent off of their sentence. Eligible federal inmates may also receive earned time credit by successfully completing the RDAP, which is offered in many federal facilities87 to inmates with documented histories of substance abuse.88 Under RDAP, inmates can earn up to one year off their terms of imprisonment.
Faced with similar correctional growth and overcrowding problems, legislators in states across the country have expanded early release programs for offenders who comply with prison regulations and programming requirements. At least 31 states offer inmates the opportunity to earn sentence reduction credits through participation in education, vocational training, substance abuse treatment and rehabilitation, and work programs;89 education and work programs are the most common. These programs vary by programmatic requirements, extent of the credit, and eligibility. Many states factor inmates’ compliance with prison rules and regulations into earned time credit calculations.90
Studies show that early release resulting from earned and/or good time credits can be a cost effective method for reducing prison populations at minimal risk to public safety. A review of early release programs and public safety measures found no significant differences between the recidivism rates of inmates released early and those who served their full sentences.91 These programs have also been found to produce significant cost savings.92 States’ experiences can guide efforts to expand and strengthen the BOP’s early release programs. Just as in the states, the options vary by programmatic requirements, extent and type of credit offered, and eligibility.
Expand and Incentivize Programming 1: Credits for Intensive Recidivism Reduction Programming Some have proposed93 a sentence reduction credit for participation in a variety of programs aimed at reducing risk of recidivism, including Federal Prison Industries, education, and occupational and vocational training programs. Only programs that have been proven to reduce recidivism, are validated for the BOP population, and are intensive will count toward credits off of a sentence. Credits of 60 days are awarded for each year that an inmate spends at least half time in intensive programming. Under this proposal, all inmates except a narrow, specified category (namely, sex offenders and those who do not exhibit exemplary behavior while in BOP custody) could earn additional time off their prison terms.
We estimate that within 10 years, 33 percent of those eligible for credits would receive at least 60 days off of their sentence. In the first year alone, there will be almost 1,500 inmates eligible for early release. Over 36,000 inmates will become eligible for early release over 10 years, a majority of which are for the minimum of 60 days.
Over the course of 10 years, this will save the BOP over $45 million total. Though only $1 million are saved in the first year, a majority of the savings are realized in the first five years, as prisoners complete their term of imprisonment.

Stemming the Tide: Strategies to Reduce the Growth and Cut the Cost of the Federal Prison System 34
Despite saving money in the short and medium term, this policy would not have a substantial effect on reducing overcrowding resulting from the current stock population. It would save a total of 4,300 bed-years over 10 years, as illustrated by Figure 18.
Figure 18. Cumulative Bed-years Saved by Intensive Programming Credit
Source: Urban Institute analysis of FY 2011 BOP data.
These analyses are limited to the BOP stock population; new cohorts of BOP admissions will qualify for the credit as well.
Expand and Incentivize Programming 2: Credits for Broader Programming Another option would be to create a similar sentence reduction credit that applied to a broader base of programming. This credit would apply to intensive programming as well as less intensive productive programming, such as general classes, or programs that have not been validated for the BOP population specifically. Inmates could earn up to 60 days off of each year, with the amount of credit being prorated to the amount of time the inmate spent in programming in that year. Though almost all inmates will be eligible to earn credits, only those exhibiting exemplary behavior while in BOP custody will be able to cash in their credits for early release.
We estimate that such a policy would save 22,000 bed-years (see figure 19) and $224 million dollars over 10 years.
In the first year alone, over 12,000 people will be eligible for early release through programming credits.
0
500
1000
1500
2000
2500
3000
3500
4000
4500
5000
2014 2015 2016 2017 2018 2019 2020 2021 2022 2023

Stemming the Tide: Strategies to Reduce the Growth and Cut the Cost of the Federal Prison System 35
These analyses are limited to the BOP stock population; new cohorts of BOP admissions will qualify for the credit as well.
Figure 19. Cumulative Bed-years Saved by Broader Programming Credit
Source: Urban Institute analysis of FY 2011 BOP data.
Expand and Incentivize Programming 3: Risk-based Earned Time Credit Another option for expanding and incentivizing programming is to provide credit for a broader set of programs and productive activities an eligible inmate participates in while in BOP custody. This includes not only intensive programming validated to reduce recidivism, but also most types of educational or other programming offered at the BOP. These credits are to be awarded inversely proportional to the inmate’s risk level, such that low risk inmates are able to earn a day’s credit for every day that they are in programming, whereas higher risk inmates would earn less.94
Most inmates sentenced for serious crimes (as specified in the methodology) are ineligible for credits under this scheme. This option further stipulates that only inmates who are able to reduce their risk level to low may apply their credits and be transferred to home confinement; inmates who are not able to reduce their risk level below high or moderate will not be awarded an early transfer.
Finally, low-risk inmates who are transferred out of BOP-run facilities will spend the remainder of their prison terms term in home confinement. As previously discussed, there are significant cost implications to this requirement, because the cost the BOP pays for home confinement is higher than the average marginal benefit of transferring an inmate out of the BOP. The cost savings of this program are therefore highly reliant on the BOP’s ability to renegotiate these contracts under more favorable conditions.
0
5,000
10,000
15,000
20,000
25,000
2014 2015 2016 2017 2018 2019 2020 2021 2022 2023

Stemming the Tide: Strategies to Reduce the Growth and Cut the Cost of the Federal Prison System 36
We estimate that 34,000 inmates will achieve a transfer to home confinement within 10 years.
A majority of those who earn credits towards their sentence are projected to earn at least half a year off. The average is substantially higher (275 days) because a small proportion of inmates will earn a substantial amount of credits.
Because a risk-assessment tool must be developed, validated, and implemented prior to the awarding of credits, there are no credits awarded in the first two years following enactment. If the risk-assessment tool is further delayed, then the savings will be delayed as well.
This program and the projected early releases have an uncertain effect on BOP finances in the 10-year time frame, especially given current contracting practices.
The fiscal impact of this option is reliant on the contracted price of home confinement, which may change as contracts expire. Should the BOP renegotiate this price or work out an agreement with OPPS to provide this supervision at a reduced cost, these options could have a positive fiscal impact on the BOP. If the amount the BOP pays for home confinement remains high, then this option could have a negative fiscal impact.
If contracts are not renegotiated and the BOP continues to pay a high price for home confinement, it stands to lose $79 million over 10 years. But, if the BOP renegotiates its contracts such that it pays a price similar to the cost of OPPS with the addition of electronic monitoring, it could save up to $112 million in 10 years.
Regardless of cost savings, implementing this option would relieve overcrowding in BOP facilities. This plan will afford many BOP inmates the opportunity for transfer to home confinement. While we do not anticipate that any credits will be awarded in the first year following enactment, we estimate that this program would save 1,300 bed-years in the third year, by transferring of thousands of inmates out of BOP facilities (see figure 20). Over 10 years, this program would save 25,000 bed-years in BOP facilities. Those currently in minimum- and low-risk facilities are projected to accrue greater credits, despite having less time (on average) left on their sentences (and thereby more time to accrue credits). This is a function of the programmatic restrictions applied to those in higher risk categories.
These reductions in the prison population, though, are highly concentrated in low-security facilities, where there is less overcrowding. Currently, both medium- and high-security facilities are operating at over 40 percent over capacity and are expected to be the worst hit by future prison population growth.95 These analyses are limited to the BOP stock population; new cohorts of BOP admissions will qualify for the credit as well.

Stemming the Tide: Strategies to Reduce the Growth and Cut the Cost of the Federal Prison System 37
Figure 20. Cumulative Bed-years Saved by Risk-based Credit
Source: Urban Institute analysis of FY 2011 BOP data.
Expand and Incentivize Programming 4: Maximize Use of RDAP Credit Though many who complete the in-prison component of RDAP are eligible for a full year of credit off of their sentences, many receive much less than that. In FY 2012, the last year for which there is complete data, the average credit that 4,776 inmates received was only 9.4 months.96 Assuming that the maximum average credit is 12.0 months, the BOP could be releasing thousands of inmates months earlier.
If RDAP had extended the maximum possible credit to all completers in FY 2012, it would have saved the BOP $10.4 million, the equivalent of releasing 1,035 federal prisoners a full year earlier.
In FY 2013, 5,291 inmates are expected to complete RDAP to become eligible for a reduced sentence; they are projected to receive, on average, 10 months in credit. Had RDAP been expanded to provide the full credit to eligible inmates, this would save $9.1 million, the equivalent of releasing 880 prisoners a full year early.
These early releases will also partially offset the cost of bringing the RDAP program to scale, which the BOP anticipates to be $15 million.97 RDAP has been proven to decrease both post-release drug use and re-arrest rates for program participants.98 Further, expanding it to scale would both
0
5,000
10,000
15,000
20,000
25,000
30,000
2014 2015 2016 2017 2018 2019 2020 2021 2022 2023

Stemming the Tide: Strategies to Reduce the Growth and Cut the Cost of the Federal Prison System 38
reduce wait-lists for participation in this proven program and begin to ameliorate the pressing overcrowding present at so many BOP facilities.
Expand Good Time: 85 Percent Means 85 Percent Many have also proposed legislation to strengthen good-time incentives for current federal inmates. Though federal law allows inmates to receive up to a 54-day good-time credit annually, the BOP’s method of calculating good-time credits only yields a 47-day credit. This proposal would change the BOP’s method of calculation for good time to allow inmates to receive the full 54 days of good time credits per year of prison sentence. This proposal only focuses on applying this change retroactively to people currently in BOP custody. This policy is projected to reduce the BOP population by 4,000 inmates in the first year and produce $41 million in cost savings.99
Early Release and Home Confinement for Special Populations
A final approach for addressing the substantial overcrowding of the federal prison system is the release or transfer of some offenders who may be at a low risk of recidivism, are especially costly to incarcerate, or are not US citizens.
Programs are already in place to provide compassionate release for terminally ill inmates and early release to elderly, nonviolent inmates who have served a significant portion of their sentence. The current reach of these programs, however, is minimal. Given that older inmates are less likely to recidivate upon release,100 and maintaining an older prison population is costly, especially when that population requires extensive and expensive medical care, many are calling for an expansion of these respective programs.101
Another option may be expanding the use of the program to transfer international inmates back to their country of origin. Though the transferred inmates have low recidivism rates, the current reach of this program is likewise not extensive. Expanding it may relieve the tension of overcrowded prisons with minimal public safety risk.
At the end of FY 2011, the BOP housed 17,398 prisoners over the age of 55, and 3,859 prisoners over the age of 65 sentenced for federal crimes.
Of the over-55 population, 56 percent, or 9,764 inmates, are potentially promising candidates for early release; their most serious offenses do not include violence, sexual abuse, weapons, national security, or immigration violations and they are not housed in high-risk facilities or in the community.
It is not possible to use the BOP data to identify the pool of promising candidates for the international transfer and compassionate release programs; releases under both programs are determined on a case-by-case basis after lengthy review.

Stemming the Tide: Strategies to Reduce the Growth and Cut the Cost of the Federal Prison System 39
Early Release for Nonviolent Elderly Offenders
Under the Second Chance Act of 2007, the BOP conducted a two-year pilot program, the Elderly and Family Reunification program, to determine the effectiveness of placing eligible elderly prisoners on home detention for an extended period of time at the end of their prison terms. Due to the eligibility requirements for participation—specifically, the required minimum age (65), years served (10), and percent of time served (75 percent)—the number of inmates that qualified for the program was low. The BOP’s evaluation of the pilot revealed that transfer to home confinement had a limited budgetary impact, since home detention was as costly as prison under existing contracts.102
The BOP recently expanded its compassionate release program (see below) so that it now includes the same selection criteria as the earlier pilot program. Since few elderly inmates qualified for the pilot, it is unlikely that this expansion will have a considerable impact on the BOP population or BOP finances. We thus consider modifications to the elderly pilot program that could expand the number of nonviolent inmates eligible and generate cost savings. Table 1 shows how many releases different policy options could yield, assuming the elimination of the 10-year minimum for time served. We estimated the population and cost impact for one of these options.
Table 1. Number of Potentially Eligible Inmates in BOP Facilities over the Age of 55
Percent of Sentence Served Age
55+ 60+ 65+
1–25 2,023 1,043 413 26–50 3,266 1,617 680 51–75 3,460 1,808 794 > 75 1,015 571 269 Totala 9,764 5,039 2,156 Source: BOP FY 2011 data, as analyzed by the Urban Institute. a Total excludes inmates with either a missing sentence or amount of time served, or both.
Early Release for Elderly Inmates. Modify the Elderly Pilot to include offenders inmates 55 years and older who have served 75 percent of their prison terms and release them to required post-incarceration supervision rather than home confinement.
1,015 federal prisoners have a nonviolent most serious offense, are at least 55 years old, and have served at least 75 percent of their sentence.
This policy change could save the BOP 750 bed-years and up to $7.8 million in the first three years after implementation (excluding anyone who may age into the program).
This estimate only includes those currently in BOP custody—savings in subsequent years are expected to be lower as fewer people will become eligible following the initial releases.

Stemming the Tide: Strategies to Reduce the Growth and Cut the Cost of the Federal Prison System 40
Other modifications to the early release program for elderly inmates may vary the eligibility criteria (percent of time served or age) or method of release (directly onto post-release supervision or onto a term of home confinement preceding post-release supervision). Expanding the eligibility criteria will increase savings and the number of early releases, whereas making them more restrictive will have the opposite effect. As previously mentioned, under current contracting conditions, the only way that an early release program for elderly inmates will certainly reduce BOP spending is if inmates are released from BOP custody onto supervised release. If the program transfers inmates from a BOP facility to home confinement—as is currently the case—there will potentially be a small negative fiscal impact, though the shift could relieve overcrowding somewhat in BOP facilities. If the BOP renegotiates its contracts to a lower cost, then the program will both relieve overcrowding and reduce BOP spending.
Compassionate Release Program
The federal compassionate release program provides the BOP with a tool for reducing the federal prison population for inmates in unique circumstances, typically involving extreme medical needs. Under the program, a federal sentencing court may reduce the sentence of a federal inmate for “extraordinary and compelling circumstances which could not reasonably have been foreseen by the court at the time of sentencing.”103 Courts are also advised by the USSC’s policy statements regarding the compassionate release program.104
The DOJ’s Office of the Inspector General (OIG) recently reviewed the BOP’s compassionate release program.105 The OIG determined that although the program has great potential, it is unorganized, burdensome, and underutilized. After reviewing all of the compassionate release requests that the BOP either approved or denied from 2006 through 2011, the OIG found that no non-medical requests were granted in the period under consideration. During the timeframe of review, the program was relatively small, averaging 24 early releases annually.
In its review of the program, the OIG determined that a properly managed compassionate release program could produce cost savings. However, the OIG was unable to produce cost savings estimates for expanding the program because the BOP does not track the costs associated with caring for inmates who are released under the program.
In April 2013, the BOP expanded eligibility for the compassionate release program. Inmates with terminal diseases with life expectancies of up to 18 months (rather than12 months or less under the previous policy), those with incurable illnesses, and inmates with incapacitating injuries may receive compassionate release. Further, the BOP extended compassionate release to inmates with compelling non-medical reasons for release, and a subset of inmates above the age of 65 who have either served three-quarters of a lengthy sentence or have served half their sentence and have an incurable illness.106 The BOP also vowed to make the compassionate release review process more efficient.107 There is evidence to suggest that the compassionate release program could be expanded

Stemming the Tide: Strategies to Reduce the Growth and Cut the Cost of the Federal Prison System 41
at minimal threat to public safety. Of the inmates released under the compassionate release program in the six years under review by the OIG, only 3.5 percent were rearrested within three years.108
Compassionate Release Option. Implement the new compassionate release policy to improve prisoners’ access to the compassionate release program.
We assume that adopting these reforms will double the size of the program from the 2006–2011 average of 24 early releases per year to 48 early releases annually.
We project that doubling the size of the compassionate release program will result in about $250,000 in savings for the BOP for the first exiting cohort.
These savings will likely be passed on to state governments, local hospitals, or other federal agencies. Many of those to be released through compassionate release will need medical care outside of prison; though the BOP no longer has to pay for these costs, they will likely be incurred elsewhere. At the same time, there are still benefits to reducing overcrowding and clearing waitlists for medical facilities.
International Prisoner Transfer Program
Foreign national inmates are a considerable and growing portion of the BOP population and will likely continue be for the foreseeable future—approximately one quarter of the BOP population are not US citizens. Through the International Prisoner Transfer Program, the federal government may allow convicted offenders to serve their sentences in their country of citizenship, enhancing the likelihood of rehabilitation and easing the burden on prison facilities in the sentencing country. After establishing its first formal prisoner transfer agreement with Mexico in 1977, the United States has subsequently entered into similar agreements with 77 other nations and territories (“treaty nations”).
Although these agreements are in place, few foreign national inmates apply for and are transferred from BOP facilities to their home countries each year through the prisoner transfer program. Less than 1 percent of the nearly 40,000 foreign national inmates from treaty nations were transferred in FY 2010. In a recent evaluation of the program, the OIG reported that, although Mexican nationals account for the largest share of foreign nationals in BOP custody, conditions in the treaty with Mexico have precluded the transfer of many of these inmates.109
An expanded prisoner transfer program could produce cost savings and, according to the recent OIG report, an expansion of this program would likely not pose a threat to individuals and communities. Of those foreign national inmates who were transferred (under the OIG’s six-year period of review), only 3 percent returned to the United States and were rearrested.

Stemming the Tide: Strategies to Reduce the Growth and Cut the Cost of the Federal Prison System 42
Prisoner Transfer Program Option. Adopt OIG recommendations, such as providing better information about the program and more vigilant case review.
We assume that adopting these recommendations will allow the BOP to double the number of international transfers out of the BOP, from the 2005–2010 average of 241 to 482.
Doubling the reach of the prisoner transfer program will lead to 241 additional early releases in the first year, saving the BOP $6.9 million, but only after the two years of processing time. This is the equivalent of savings 670 bed-years total.

Stemming the Tide: Strategies to Reduce the Growth and Cut the Cost of the Federal Prison System 43
Conclusion
Ultimately, controlling the growth of the BOP population will require the cooperation and support of numerous players across all branches of the federal system; as confirmed by a recent GAO report110 on the effects of inmate crowding, the BOP cannot do this on its own.
Each of the options discussed above will reduce the growth of the federal prison population to some degree. However, to yield a meaningful impact on population and costs, a mix of reforms to sentencing, prosecution, and early release policies are required. A combination of front-end and back-end options will be necessary to address the problem in a meaningful way. While reductions from front-end reforms to sentencing, prosecution, and law enforcement practices can have the largest impact in the long term, back-end reforms, which could release current inmates earlier, will likely be necessary to alleviate dangerous prison conditions in the near term.
The most effective way to reduce overcrowding is to lower mandatory minimums for drugs, which alone would reduce overcrowding to the lowest it has been in decades.111 Including two more options targeting inmates already in BOP custody—retroactively applying the Fair Sentencing Act to crack offenders already in BOP custody and providing a broader earned time credit for program participation—could save taxpayers $3 billion while alleviating overcrowding in both the short and long term. Updating the formula for good time credits and providing early release for certain nonviolent older inmates would lead to an additional 5,000 immediate releases, while lowering the truth-in-sentencing requirement for new BOP admissions who exhibit exemplary behavior while in custody would further reduce the future prison population.
Given the decades-long buildup in the prison population and its concomitant costs, the ultimate goal of any federal prison reform effort would be not just the maintenance of or reduction in overcrowding, but also sufficient reductions to eliminate overcrowding, warrant facility closures, and generate more substantial cost savings. Though we assume that no single policy option presented in this report would reduce the BOP population to the point where it could close facilities, many of these changes in combination would do more than stem the tide of prison growth. They could actually reduce the size of the prison population. For example, implementing any combination of policies described in this report that reduces drug mandatory minimums by half or the truth–in-sentencing threshold to 70 percent would reduce the number of prisoners in BOP facilities. This would save taxpayers billions of dollars, improve the safety of both prison staff and inmates, and improve the quality and reach of recidivism reduction programming. The projected estimates of these options are summarized in Appendix A.

Stemming the Tide: Strategies to Reduce the Growth and Cut the Cost of the Federal Prison System 44
Methodology
The population and cost estimates in this report are based on our interpretation of the proposed changes and our best understanding or assumptions about how each change will work in practice. When making assumptions regarding program eligibility or impact, we err on the conservative side. In general, we make the following assumptions and methodological decisions:
Our estimates generally rely on Fiscal Year 2011 data from the BOP regarding federally sentenced offenders only (thus excluding pretrial, DC, state or other miscellaneous offenders), including admissions, releases, and the stock population (as of September 30, 2011). Elsewhere, we use published summary information in the FY 2012 USSC Sourcebook,112 FY 2011 USSC Mandatory Minimum Report,113 and other USSC, GAO, and BOP annual or special reports.
Assumptions regarding program eligibility err on the side of exclusion. In general, we assume that only so-called “new-law” offenders (offenders sentenced pursuant to the Sentencing Reform Act of 1984, who are not eligible for parole) with valid data who are not currently (as of FY2011) housed in Residential Reentry Centers will be eligible for any programming or policy change. 171,975 such inmates are identified in the BOP stock population.
All cost estimates use the average marginal cost ($10,363) of increasing or decreasing the prison population as reported by the BOP, as opposed to the average annual cost of incarcerating an inmate (over $29,000). The average marginal cost only includes items that vary at the person level, such as medical care and food. The average cost adds the general costs of running the BOP, such as constructing, maintaining, and staffing facilities. We conservatively do not account for any averted prison construction or prison closures, including staffing changes or structural changes within the BOP as a result of slowed prison population growth (or decline). These latter changes are highly uncertain and difficult to quantify as they are functions of both BOP overcrowding and the appropriations process—insofar as any of these options avert prison construction or cause facility closures, there will also be significant cost savings. These estimates, then, likely underestimate the fiscal impact of front end options that significantly slow the growth of the federal prison population.
Several policy options call for placing some offenders on home confinement for a portion of the remainder of their prison sentence. We assume that the per-person cost of home confinement as paid by the BOP is half the average cost of placement in a Residential Reentry Center, per the existing BOP contract; the assumed annual cost of home confinement is therefore greater than the average marginal cost of decreasing the prison population, at $13,500 per person. We also calculate an alternative per-person cost based on the cost of federal probation supervision plus an estimate of the cost of electronic monitoring to be $5,890.
We do not discount future savings, because medium term real interest rates are zero. The policy options are generally not additive, since there are potentially overlapping impacts
among the targeted populations.
A more detailed methodology for each policy option is available on the Urban Institute website at http://www.urban.org/publications/412932.html.

Stemming the Tide: Strategies to Reduce the Growth and Cut the Cost of the Federal Prison System 45
Notes
1 James (2013); BOP (2013b). 2 BJS (1987). 3 Mallik-Kane, Parthasarathy, Adams (2012). 4 USSC (2012). 5 Id. 6 BJS (2011a). 7 Id. 8 US DOJ (2013c). 9 GAO (2012a). 10 US DOJ (2013c). 11 BOP (2005). 12 James (2013). 13 Samuels (2012). 14 USSC (2013). 15 BJS (1987). 16 Hunt (2011). 17 Guzman, Krisberg, and Tsukida (2008). 18 Pelissier et al. (2000). 19 USSC (2004); Chiu (2010). 20 Chiu (2010). 21 James (2013). 22 BOP (2013b). 23 When pretrial detention is included, the total FY 2014 prisons and detention budget request exceeds 30 percent of the DOJ budget request (US DOJ 2013a). 24 US DOJ, Summary of Budget Authority by Appropriation. Budget summaries for fiscal years 2000–2013. See, e.g., http://www.justice.gov/archive/jmd/2k-summary/2kbudget.pdf (2000); http://www.justice.gov/jmd/2013summary/pdf/budget-authority-appropriation.pdf (2013). 25 US DOJ (2013b). 26 La Vigne and Samuels (2012); James (2013). 27 BOP also houses sentenced D.C. felony offenders (since 1997), and some pretrial or pre-sentencing offenders for the U.S. Marshals Service and for Immigration and Customs Enforcement (BOP 2013a). 28 Recent legislative and policy changes to this domain may have the combined effect of reducing sentence length: for example, the shift from mandatory to advisory sentencing guidelines and enactment of the Fair Sentencing Act could have a moderating effect on sentence lengths. 29 From Bureau of Justice Statistics (BJS) Federal Justice Statistics Program (FJSP), at http://bjs.ojp.usdoj.gov/fjsrc/. BOP data, as standardized by FJSP. Immigration cases captured by the US Sentencing Commission do not include petty offenses that do not fall under the guidelines. 30 The remainder of sentenced offenders received fines or another sentence that did not include a term of incarceration (BJS 1987). 31 USSC (2012, table 14). 32 BJS (2011, table 9).

Stemming the Tide: Strategies to Reduce the Growth and Cut the Cost of the Federal Prison System 46
33 USSC (2012, table 37). 345 USSC (2012, table 39). 35 USSC (2013, fig. E, table 14). 36 Mallik-Kane, Parthasarathy, and Adams (2012). 37 US DOJ (2013c); Hearing on the Oversight of the Federal Bureau of Prisons Subcommittee on Crime, Terrorism, Homeland Security, and Investigations (2013) [hereinafter BOP 2014 Budget Hearing] (statement of Charles E. Samuels, Jr., Director, Federal Bureau of Prisons). http://docs.house.gov/meetings/JU/JU08/20130919/101318/HHRG-113-JU08-Wstate-SamuelsC-20130919.pdf. 38 US DOJ (2013c). This represents the prison populations and capacity for 2012. The population ebbs and flows throughout the year as prisoners are released and new offenders are admitted. As of September 2013, overcrowding had dropped to 36 percent in BOP facilities, but was expected to climb again. 39 Id. 40 GAO (2012a). 41 GAO (2012a). See table 7, based on BOP’s 2020 Capacity Plan, January 2012. These projections assume that 17,500 new beds will be constructed and staffed starting in FY 2016—these new facilities will require increases in appropriations to BOP that have not yet received congressional approval. 42 James (2013); Annual Determination of Average Cost of Incarceration, 78 Fed. Reg. 52 (March 18, 2013). 43 Samuels (2012). 44 Annual Determination of Average Cost of Incarceration, 78 Fed. Reg. at 52. 45 US GAO (2013b). BOP reimburses the residential reentry centers half the overall per diem rate for each inmate in home detention, but did not have information on the actual cost of the home detention. 46 United States Courts (2013). 47 Bales et al. (2010). 48 BOP (2013a). 49 US DOJ (2013c). 50 US DOJ (2013d). When pretrial detention is included, the total FY 2013 prisons and detention budget request exceeds 30 percent of the DOJ budget request. 51 Hearing on Federal Sentencing Options after Booker: Current State of Federal Sentencing (2012) (statement of Matthew Axelrod, Associate Deputy Attorney General). http://www.ussc.gov/Legislative_and_Public_Affairs/Public_Hearings_and_Meetings/20120215-16/Testimony_16_Axelrod.pdf. 52 GAO (2012a). 53 US DOJ (2013c). 54 BOP (2005). 55 Kalinowski and Halpin (2013). 56 GAO (2012a). 57 Id. 58 Holder (2013b, 2013c). 59 GAO (2012a). 60 Stith and Koh (1993). 61 Hofer and Semisch (1999); Stith and Koh (1993). 62 BJS (1987). 63 NCRP (2011, table 9). 64 Holder (2013a). 65 USSC (2011). 66 Holder (2013a).

Stemming the Tide: Strategies to Reduce the Growth and Cut the Cost of the Federal Prison System 47
67 Holder (2013b). 68 Holder (2013a, 2013b). 79 USSC (2011). 70 Holder (2013b). 71 Hunt (2011). 732 USSC (2011). 73 Mallik-Kane, Parthasarathy, and Adams (2012). 74 USSC (2011). 75 Caulkins et al. (1997). 76 A policy change along these lines has been proposed in the Smarter Sentencing Act, S. 1410, 113th Congress (2013). 77 18 U.S.C. § 3553(f) (2012). 78 USSC (2013). 79 Hearing on Reevaluating the Effectiveness of Federal Mandatory Minimum Sentences (2013) (statement of Judge Patti B. Saris, Chair, United States Sentencing Commission). http://www.judiciary.senate.gov/resources/documents/113thCongressDocuments/upload/091813RecordSub-Leahy.pdf. A policy change along these lines has been proposed in as the Smarter Sentencing Act, S. 1410, 113th Cong. (2013). This policy change may apply to even more offenders than those highlighted by the USSC by allowing judges to override the calculated criminal history score of offenders subject to the mandatory minimum. 80 A policy change along these lines has been proposed as the Justice Safety Valve Act, S. 619, 113th Cong. (2013). 81 Hofer et al. (2004). 82 Sabol et al. (2002); Ditton and Wilson (1999). 83 Justice Policy Institute (2011); Gray (2011). 84 Stith and Koh (1993). 85 A policy change along these lines has been proposed in the Smarter Sentencing Act, S. 1410, 113th Cong. (2013). The USSC has also developed impact estimates of the proposed legislation (see: Saris 2013 Testimony) using a different methodology that does not incorporate a ten-year window. 86 Hunt (2011). 87 http://www.bop.gov/inmate_programs/RDAP_locations.pdf 88 Inmates with Immigration and Customs Enforcement (ICE) convictions, pretrial inmates, and “contractual boarders” (state or military inmates, for example), as well as those convicted for violent and certain felony offenses, are not eligible for RDAP participation. For a full list of excluded participants, see the early release procedures under 18 U.S.C. § 3621(e) (2011), http://www.bop.gov/policy/progstat/5331_002.pdf. 89 Some states also offer additional opportunities for earning earned time credits, such as participation in “special programs,” disaster relief or conservation efforts, or by conducting extraordinary meritorious service in prison (see Lawrence 2009). 90 Lawrence (2009). 91 Guzman et al. (2008). 92 Drake, Barnoski, and Aos (2009). 93 A policy change along these lines has been proposed in the Second Chance Reauthorization Act, S. 1231, 112th Cong. (2011). 94 A policy change along these lines has been proposed in the Public Safety Enhancement Act, H.R. 2656, 113th Cong. (2013). 95 GAO (2012a). 96 US DOJ (2013c). 97 Id. 98 Pelissier et al. (2000).
Stemming the Tide: Strategies to Reduce the Growth and Cut the Cost of the Federal Prison System 48
99 Federal Bureau of Prisons FY 2014 Budget Request: Hearing before the H. Committee on Appropriations Subcommittee on Commerce, Justice, Science and Related Agencies (2013) (statement of Charles E. Samuels, Jr., Director, Federal Bureau of Prisons). http://appropriations.house.gov/uploadedfiles/hhrg-113-ap19-wstate-samuelsc-20130417.pdf. 100 There is ample evidence that offenders are less likely to recidivate as they grow older. A study released in 2004 by USSC documented the two-year post-release recidivism rates of federal inmates, and found that the average recidivism rate for individuals over the age of 50 was 9.5 percent, lower than all younger age groups. Other studies have similarly found that age is a strong predictor of future criminal behavior, and that individuals are much less likely to engage in criminal activity as they grow older (see USSC 2004; Chiu 2010). 101 Chiu (2010) described the medical needs of, and costs associated with, housing older inmates. Older inmates are more likely to suffer from mental illnesses, chronic conditions, physical ailments, and other disruptions to basic functions. As Chiu reports, medical costs are, on average, much higher for older inmates. For example, a study of North Carolina’s inmate population found that inmates over the age of fifty had medical costs that are four times higher than the rest of the population (Price 2007). 102 GAO (2013c). 103 18 U.S.C. § 3582/4205, http://www.bop.gov/policy/progstat/5050_048.pdf. 104 18 U.S.C. § 3582. 105 OIG (2013). 106 Federal Bureau of Prisons. Compassionate Release/Reduction in Sentence Program Statement, 2013. http://www.bop.gov/policy/progstat/5050_049.pdf 107 Faulk, Kent. “‘Compassionate Release’ Program for Federal Prisoners Expanded.” Alabama Media Group, June 4, 2013. http://blog.al.com/spotnews/2013/06/new_federal_prison_compassiona.html. 108 OIG (2013). 109 OIG (2011). 110 GAO (2012a). 111 James (2013). 112 USSC (2013). 113 USSC (2011).

Stemming the Tide: Strategies to Reduce the Growth and Cut the Cost of the Federal Prison System 49
References
Bales, William, Karen Mann, Thomas Blomberg, Gerry Gaes, Kelle Barrick, Karla Dhungana, and Brian McManus. 2010. “A Quantitative and Qualitative Assessment of Electronic Monitoring.” Tallahassee, FL: Florida State University. http://www.criminologycenter.fsu.edu/p/pdf/EM%20Evaluation%20Final%20Report%20for%20NIJ.pdf
BJS (US Bureau of Justice Statistics). 1987. “Federal Offenses and Offenders: Sentencing and Time Served.” Washington, DC: US Department of Justice. https://www.ncjrs.gov/pdffiles1/Digitization/101043NCJRS.pdf.
——––. 2011a. “National Corrections Reporting Program, 2009—Statistical Tables (Update).” Washington, DC: US Department of Justice. http://www.bjs.gov/index.cfm?ty=pbdetail&iid=2174
——––. 2011b. “National Corrections Reporting Program: Sentence Length of State Prisoners, By Offense, Admission Type, Sex, And Race.” Washington, DC: US Department of Justice. http://www.bjs.gov/index.cfm?ty=pbdetail&iid=2056.
BOP (Federal Bureau of Prisons). 2005. “The Effects of Changing Crowding and Staffing Levels in Federal Prisons on Inmate Violence Rates.” Washington, DC: BOP.
——––. 2013a. “Quick Facts about the Bureau of Prisons.” Accessed September 23. http://www.bop.gov/about/facts.jsp.
———. 2013b. “Weekly Population Report.” Accessed September 19. http://www.bop.gov/locations/weekly_report.jsp.
Caulkins, Jonathan P., C. Peter Rydell, William L. Schwabe, and James Chiesa. 1997. Mandatory Minimum Drug Sentences: Throwing Away the Key or the Taxpayers’ Money? Santa Monica, CA: Rand.
Chiu, Tina. 2010. “It’s About Time: Aging Prisoners, Increasing Costs, and Geriatric Release.” New York: Vera Institute of Justice.
Ditton, Paula M., and Doris James Wilson. 1999. Truth in Sentencing in State Prisons. Washington, DC: US Department of Justice.
Drake, Elizabeth, Robert Barnoski, and Steve Aos. 2009. “Increased Earned Release from Prison: Impacts of a 2003 Law on Recidivism and Crime Costs.” Revised. Olympia, WA: Washington State Institute for Public Policy. http://www.wsipp.wa.gov/pub.asp?docid=09-04-1201.
Ellis, Alan, and J. Michael Henderson. 2005. “Getting Out Early: BOP Drug Program.” Criminal Justice 20 (2): 68–70. http://sentencing.typepad.com/sentencing_law_and_policy/files/ellis_bop_rdap.pdf.
GAO (US Government Accountability Office). 2012a. “Bureau of Prisons: Growing Inmate Crowding Negatively Affects Inmates, Staff, and Infrastructure.” GAO-12-743. Washington, DC: GAO. http://www.gao.gov/assets/650/648123.pdf.
———. 2012b. “Bureau of Prisons: Eligibility and Capacity Impact Use of Flexibilities to Reduce Inmates’ Time in Prison.” GAO-12-320. Washington, DC: GAO. http://www.gao.gov/assets/590/588284.pdf.
——–. 2012c. “Bureau of Prisons: Methods of Estimating Incarceration and Community Corrections Costs and Results of the Elderly Offender Pilot.” GAO-12-807R. Washington, DC: GAO. http://www.gao.gov/assets/600/593089.pdf.

Stemming the Tide: Strategies to Reduce the Growth and Cut the Cost of the Federal Prison System 50
Gray, Steven. 2011. “Why Mississippi Is Reversing Its Prison Policy.” Time, June 10, http://content.time.com/time/nation/article/0,8599,2077089-1,00.html.
Guzman, Carolina, Barry Krisberg, and Chris Tsukida. 2008. “Accelerated Release: A Literature Review.” Focus, Oakland, CA: National Council on Crime and Delinquency. http://www.nccdglobal.org/sites/default/files/publication_pdf/focus-literature-review.pdf.
Hofer, Paul J., Charles Loeffler, Kevin Blackwell, and Patricia Valentino. 2004. “Fifteen Years of Guidelines Sentencing: An Assessment of How Well the Federal Criminal Justice System is Achieving the Goals of Sentencing Reform.” Washington, DC: US Sentencing Commission.
Hofer, Paul J., and Courtney Semisch. 1999. “Examining Changes in Federal Sentence Severity: 1980–1998.” Federal Sentencing Reporter 12 (1): 12–19.
Holder, Eric, 2013a. “Attorney General Eric Holder Delivers Remarks at the Annual Meeting of the American Bar Association’s House of Delegates.” San Francisco, August 12. http://www.justice.gov/iso/opa/ag/speeches/2013/ag-speech-130812.html.
——––. 2013b. “Department Policy on Charging Mandatory Minimum Sentences and Recidivist Enhancements in Certain Drug Cases.” Memorandum to the US Attorneys and Assistant Attorney General for the Criminal Division. Washington, DC: US Department of Justice. http://www.popehat.com/wp-content/uploads/2013/08/holder-mandatory-drug-minimums-memo.pdf.
———. 2013c. “Retroactive Application of Department Policy on Charging Mandatory Minimum Sentences and Recidivist Enhancements in Certain Drug Cases.” Memorandum to the US Attorneys and Assistant Attorney General for the Criminal Division. Washington, DC: US Department of Justice. http://famm.org/wp-content/uploads/2013/09/DOJ-Retro-MM-Policy-9.19.13.pdf.
Hunt, Kim Steven. 2011. “Recidivism Among Offenders with Sentence Modifications Made Pursuant to Retroactive Application of 2007 Crack Cocaine Amendment.” Memorandum to Chair Saris, Commissioners, and Judith Sheon. Washington, DC: US Sentencing Commission.
James, Nathan. 2013. “The Federal Prison Population Buildup: Overview, Policy Changes, Issues, and Options.” Washington, DC: Congressional Research Service. http://www.fas.org/sgp/crs/misc/R42937.pdf.
Justice Policy Institute. 2011. “Due South: Mississippi: Rolling Back ‘Truth-in-Sentencing’ Laws.” Washington, DC: Justice Policy Institute. http://www.justicepolicy.org/uploads/justicepolicy/documents/due_south_-_mississippi.pdf.
Kalinowski, Bob, and James Halpin. 2013. “Corrections Officer Killed at Federal Prison in Wayne County.” The Scranton Times-Tribune, February 27. http://thetimes-tribune.com/news/corrections-officer-killed-at-federal-prison-in-wayne-county-1.1450710.
La Vigne, Nancy, and Julie Samuels. 2012. “The Growth and Increasing Cost of the Federal Prison System: Drivers and Potential Solutions.” Washington, DC: Urban Institute. http://www.urban.org/UploadedPDF/412693-The-Growth-and-Increasing-Cost-of-the-Federal-Prison-System.pdf.
Lawrence, Alison. 2009. “Cutting Corrections Costs: Earned Time Policies for State Prisoners.” Washington, DC: National Conference of State Legislatures. http://www.ncsl.org/documents/cj/earned_time_report.pdf.
Mallik-Kane, Kamala, Barbara Parthasarathy, and William Adams. 2012. “Examining Growth in the Federal Prison Population, 1998 to 2010.” Washington, DC: US Department of Justice. https://www.ncjrs.gov/pdffiles1/bjs/grants/239785.pdf.

Stemming the Tide: Strategies to Reduce the Growth and Cut the Cost of the Federal Prison System 51
OIG (US Department of Justice, Office of the Inspector General). 2011. “The Department of Justice’s International Prisoner Transfer Program.” Washington, DC: US Department of Justice. http://www.justice.gov/oig/reports/2011/e1202.pdf.
———. 2013. “The Federal Bureau of Prisons’ Compassionate Release Program.” Washington, DC: US Department of Justice. http://www.justice.gov/oig/reports/2013/e1306.pdf.
Pelissier, Bernadette, William Rhodes, William Saylor, Gerry Gaes, Scott D. Camp, Suzy D. Vanyur, and Sue Wallace. 2000. “TRIAD Drug Treatment Evaluation Project Final Report of Three-Year Outcomes: Part 1.” Washington, DC: Federal Bureau of Prisons. http://www.bop.gov/news/PDFs/TRIAD/TRIAD_pref.pdf.
Price, Charlotte A., 2007. “Aging Inmate Population: 2007 Addendum Report.” Raleigh, NC: North Carolina Division of Prisons. http://www.heart-intl.org/pris/113010/NCAging2007.pdf.
Sabol, William J., Katherine Rosich, Kamala Mallik-Kane, David P. Kirk, and Glenn Dubin. 2002. The Influences of Truth-in-Sentencing Reforms on Changes States’ Sentencing Practices and Prison Populations. Washington, DC: The Urban Institute.
Samuels, Charles. 2012. Utilization of Community Corrections Facilities Report to Congress. Washington, DC: US Department of Justice.
Stith, Kate, and Steve Y. Koh. 1993. “Politics of Sentencing Reform: The Legislative History of the Federal Sentencing Guidelines.” Federal Scholarship Series 1273, Yale Law School, New Haven, CT. http://digitalcommons.law.yale.edu/cgi/viewcontent.cgi?article=2276&context=fss_papers.
United States Courts. 2013. “Supervision Costs Significantly Less than Incarceration in Federal System.” http://news.uscourts.gov/supervision-costs-significantly-less-incarceration-federal-system.
US DOJ (Department of Justice). 2013a. FY 2014 Budget Request at a Glance. Washington, DC: US DOJ. http://www.justice.gov/jmd/2014summary/pdf/bop.pdf.
———. 2013b. FY 2014 Congressional Budget: Buildings and Facilities. Washington, DC: US DOJ. http://www.justice.gov/jmd/2014justification/pdf/bop-bf-justification.pdf.
———. 2013c. “FY 2014 Performance Budget Congressional Submission: Federal Prison System Salaries and Expenses” Washington, DC: US DOJ. http://www.justice.gov/jmd/2014justification/pdf/bop-se-justification.pdf
—–––. 2013d. “U.S. Department of Justice Overview: FY 2014 Budget Summary.” http://www.justice.gov/jmd/2014summary/pdf/fy14-bud-sum.pdf#bs.
USSC (US Sentencing Commission). 2004. “Measuring Recidivisim: The Criminal History Computation of the Federal Sentencing Guidelines.” Washington, DC: USSC.
———. 2011. Report to the Congress: Mandatory Minimum Penalties in the Federal Criminal Justice System. Washington, DC: USSC.
———. 2012. 2011 Sourcebook of Federal Sentencing Statistics. Washington, DC: USSC.
———. 2013. 2012 Sourcebook of Federal Sentencing Statistics. Washington, DC: USSC.

Stemming the Tide: Strategies to Reduce the Growth and Cut the Cost of the Federal Prison System 52
Appendix A
Table A.1 Front-end Changesa
Program nameb Description Total bed-years saved
Total dollars savedc
Overcrowding in 10 yearsd (%)
Drug offenders
Reduce drug admissions by 10 percent 62,000 644 million 49
Reduce drug admissions by 20 percent 125,000 1.292 billion 42
Reduce drug sentences by 10 percent 52,000 538 million 48
Reduce drug sentences by 20 percent 109,000 1.133 billion 41
Reduce mandatory minimums 240,000 2.485 billion 20
Safety valve changes
Safety valve expansion to criminal history category II
53,000 544 million 46
New safety valve for all mandatory minimums
81,000 835 million 41
Truth-in-sentencing
Reduce minimum to 80% 61,000 634 million 48
Reduce minimum to 75% 104,000 1.079 billion 43
Reduce minimum to 70% 150,000 1.547 billion 37 a For the purpose of these analyses, only future incoming cohorts of prisoners are considered. These projections do not apply to current inmates. Unless otherwise noted, all estimates are for a 10-year window. b Some of these policies may not have additive effects. For example, if fewer people enter the BOP on drug charges and a reduction in drug mandatory minimums is implemented, the total saved will be less than the sum, but greater than either on its own. c These marginal cost savings do not take into account any cost savings from averted prison construction or prison closures, including staffing changes or other structural changes within the BOP. d Overcrowding estimates as of the year 2023. We project that, without any policy changes or prison construction, BOP facilities will be operating 55 percent over capacity by 2023.

Stemming the Tide: Strategies to Reduce the Growth and Cut the Cost of the Federal Prison System 53
Table A.2 Back-end Changesa
Program nameb Description Total bed-years saved
Total dollars savedc
Immediate releases
Crack retroactivity
Apply FSA Statutory changes retroactively
22,000 229 million 2,700
Earned credit and good time
Credits for intensive recidivism reduction programming
4,300 45 million 0d
Broader programming credit
22,000 224 million 0
Risk-based earned-time credit
25,000e -79 million to +$112 millionf
0
Maximize RDAP credit 880 9.1 million 0
85percent means 85 percentg
4,000 41 million 4,000
Elderly release Extend to inmates age 55 and older and served 75 percent of their sentence
750 7.8 million 700
Compassionate release
Implement expanded policy
24 250,000 24
International transfer program
Adopt OIG recommendations
670 6.9 million 0
a For the purpose of these analyses, only the current stock population is considered. These projections do not apply to future inmates who enter BOP custody. Unless otherwise noted, all estimates are for a 10-year window. b Some of these policies may not have additive effects. For example, some people may qualify for both a retroactively reduced sentence for a crack offense and an expanded compassionate release program. Thus, the total saved may be less than the sum, but greater than either on its own. c These marginal cost savings do not take into account any cost savings from averted prison construction or prison closures, including staffing changes or other structural changes within the BOP. d Some policies, though targeting the current stock population, would take time to have an impact, for example, there may be lead time necessary to implement the new program or policy. Though there may be an effect for these policies, it would not be immediate. e This program would not lead to any early releases from BOP custody, but would transfer inmates out of overcrowded BOP facilities into community corrections programs. Thus, the total BOP population would remain unchanged. f The expected fiscal impact of this program is uncertain because it transfers inmate onto home confinement. The cost of home confinement is currently higher than the savings from reducing the prison population (hence the low end estimate), but those costs may be renegotiated downward (hence the high end estimate). g Savings for this policy option are presented for the first year following implementation only.


Stemming the Tide: Strategies to Reduce the Growth and Cut the Cost of the Federal Prison System 55
Acknowledgments
Though not all who assisted in preparing this report can be recognized individually, we wish to thank Laura Pacifici and Aaron Horvath for their research on federal corrections policy, Bill Adams for his review of the report and methodology, and Barbara Parthasarathy for her analytic work on an early draft. We are particularly indebted to Kamala Mallik-Kane, Bill Adams, and Barbara Parthasarathy for their authorship of Examining Growth in the Federal Prison Population, 1998 to 2010. We also extend appreciation to the many experts who generously provided critical input on the nuances of the federal sentencing and corrections system. In addition, the authors appreciate the support of the Public Welfare Foundation and the Open Society Foundations.
About the Authors
Julie Samuels is a senior fellow with the Urban Institute’s Justice Policy Center, where she leads projects addressing federal justice statistics, federal corrections system, and offender DNA collection.
Nancy La Vigne is director of the Urban Institute’s Justice Policy Center, where she leads a staff of over 35 researchers and oversees a research portfolio of more than four dozen active projects spanning a wide array of crime, justice, and public safety topics.
Samuel Taxy is a research assistant at the Urban Institute’s Justice Policy Center.


2100 M Street NW Washington, DC 20037
Phone: 202.833.7200 Fax: 202.467.5775 www.urban.org